Embed Size (px)
Citation preview
Strategic Business Analysis Don Guild, Synchronous Management
Page 1 of 16 www.synchronousmanagement.com P: 203-877-1287 – C: 203-671-8533
BACKGROUND
The XYZ Corporation is a $50,000,000 per year New England producer of metal cutting equipment for industrial and consumer use. The company was founded in 1957, entrepreneurial led at first and then acquired by a holding company in 1978. XYZ has enjoyed years of profitable performance in a market with relatively little competition, and was most recently acquired by a second holding company.
XYZ Corporation has about half of the cutting equipment market and the remaining 50% is split evenly between one major domestic competitor and a number of smaller companies. The business is about 35 - 40% replacement parts versus new complete units, and less than 100 of these parts is 75 - 80% of the replacement parts volume. The market is becoming more service and price sensitive (with a major Italian competitor exploiting the low end), and customers increasingly demand short delivery cycles.
Distributors are cutting back on their inventories, putting an even greater emphasis upon the need to ship quickly from XYZ's plant. The company's sales people work primarily with about 300 distributors, with the distributors setting up the sales calls in most cases. Sales and Marketing recently relocated to St. Louis. The Product Managers, a Technical Support Group, Customer Service and Order Entry and all manufacturing operations remain in New England.
Equipment configuration varies according to voltage, lead length, angle of the torch, hand or machine torch, and power supply. About 2,000 different combinations of equipment are offered, with up to a thirteen level bill of materials. Production processes in the 300-man shop are quite diverse, including screw machine and NC lathe turning, sheet metal stamping and painting, injection molding, and transformer winding. Assembly processes include printed circuit board and electro-mechanical assembly and system test.
Very little work is subcontracted. Some smaller transformers and electrical components are purchased, and about 30-40% of the PCB assembly is sub-contracted. Generally speaking, there is a two shift operation in the machine shop, one to one and a half shifts in operation in the transformer and sheet metal areas, and one shift running in the assembly and inspection areas. Management has suggested that although the capacity bottlenecks seem to wander through the plant, the most consistent overloads are probably in the powdered paint section and the inspection areas.
KEY BUSINESS ISSUES
As suggested by BACKGROUND ISSUES, there is a keen interest upon customer interface demands and market requirements. A clear definition of customer service requirements is lacking, and generally there is a lack of knowledge concerning the relationship between improved delivery performance and increased sales, market share, etc. However, there is an interest in improving performance on spare parts shipments. Out of a total of about 130 orders received per day, about 75% are for service parts. There are a total of about 20,000 part numbers, with about 50% of them currently active, and the desire internally is to provide the field with replacement parts for virtually every product ever built. Senior management estimates that total sales would increase by at least 5% if 95% plus service levels are obtained.
Strategic Business Analysis Don Guild, Synchronous Management
Page 2 of 16 www.synchronousmanagement.com P: 203-877-1287 – C: 203-671-8533
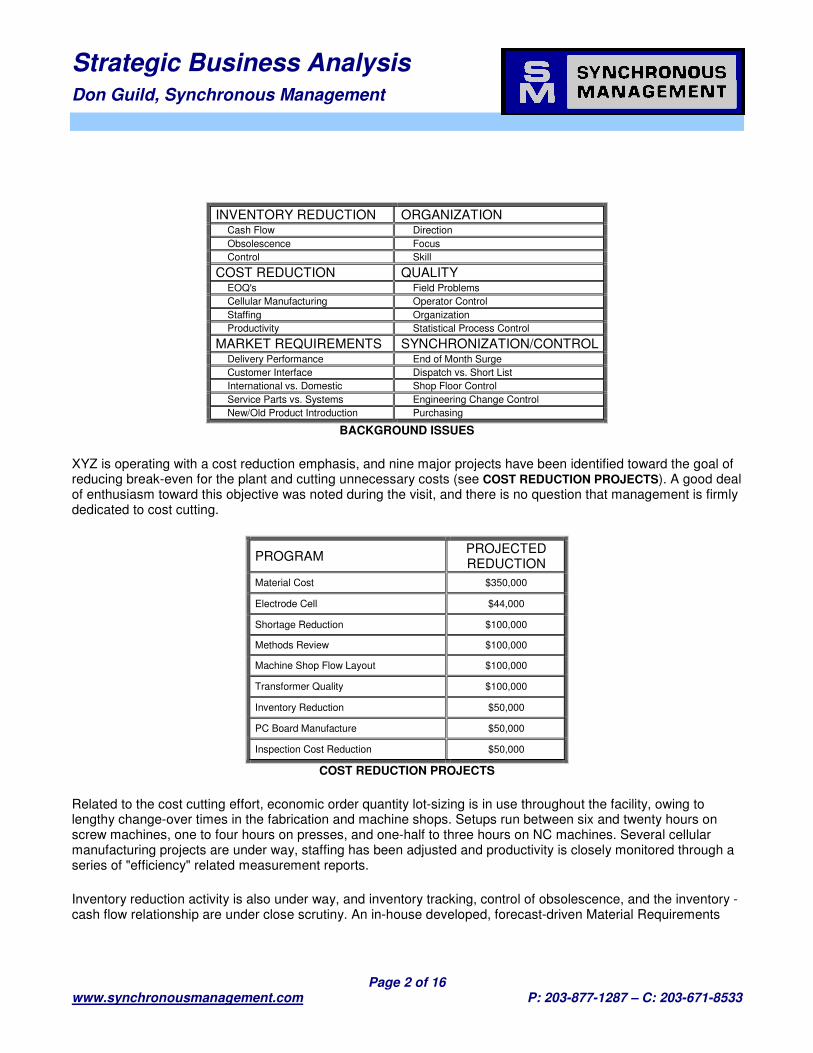
INVENTORY REDUCTION ORGANIZATION Cash Flow Direction Obsolescence Focus Control Skill
COST REDUCTION QUALITY EOQ's Field Problems Cellular Manufacturing Operator Control Staffing Organization Productivity Statistical Process Control
MARKET REQUIREMENTS SYNCHRONIZATION/CONTROL Delivery Performance End of Month Surge Customer Interface Dispatch vs. Short List International vs. Domestic Shop Floor Control Service Parts vs. Systems Engineering Change Control New/Old Product Introduction Purchasing
BACKGROUND ISSUES
XYZ is operating with a cost reduction emphasis, and nine major projects have been identified toward the goal of reducing break-even for the plant and cutting unnecessary costs (see COST REDUCTION PROJECTS). A good deal of enthusiasm toward this objective was noted during the visit, and there is no question that management is firmly dedicated to cost cutting.
PROGRAM PROJECTED REDUCTION
Material Cost $350,000
Electrode Cell $44,000
Shortage Reduction $100,000
Methods Review $100,000
Machine Shop Flow Layout $100,000
Transformer Quality $100,000
Inventory Reduction $50,000
PC Board Manufacture $50,000
Inspection Cost Reduction $50,000
COST REDUCTION PROJECTS
Related to the cost cutting effort, economic order quantity lot-sizing is in use throughout the facility, owing to lengthy change-over times in the fabrication and machine shops. Setups run between six and twenty hours on screw machines, one to four hours on presses, and one-half to three hours on NC machines. Several cellular manufacturing projects are under way, staffing has been adjusted and productivity is closely monitored through a series of "efficiency" related measurement reports.
Inventory reduction activity is also under way, and inventory tracking, control of obsolescence, and the inventory - cash flow relationship are under close scrutiny. An in-house developed, forecast-driven Material Requirements
Strategic Business Analysis Don Guild, Synchronous Management
Page 3 of 16 www.synchronousmanagement.com P: 203-877-1287 – C: 203-671-8533
Planning system is in use, and is vigorously maintained. Shop Floor Control system accuracy has been cited as a problem, aggravated by the large number of job lots in work in process at any point in time. This is believed to be at least partially due to the length of the manufacturing cycle and the need to start "plain vanilla" systems ahead of anticipated orders in order to meet customer required shipping times ARO. Likewise, there is an increasing reliance upon a number of very sophisticated techniques such as statistical forecasting and planning bills of material in an attempt to gain greater control of "plain vanilla" systems scheduling and to try to make sure that the right products are available when the orders arrive.
The end of the month "surge" is evident in XYZ's operations, where shipments and activity peak at the end of the accounting period. At the middle of each month, the forecast-driven planning system is corrected to order-driven reality, and schedules are forcefully adjusted to agree with customer requirements in order to maximize shipments. In the beginning of the next period, production reverts to the dispatch list and economic lot sizes, only to be supplanted by shortage lists and detail expediting at the end of that period.
Purchasing is order-based, with little activity occurring relative to a specific requirement until the actual requisition is in the hands of the Purchasing agent. XYZ's vendors would like to know more about the company's long term requirements, and Purchasing personnel would like additional forecast data, but so far little use has been made of such cost and lead-time slashing devices as blanket purchase order (BPO) agreements and letters of intent. In summary, the Purchasing interface is "traditional", with vendors responding to XYZ demands on an order-by-order basis. Correspondingly, supplier lead-times are excessive and in many cases range into the four month period. Management's experience is that lead-times could easily be cut significantly through negotiated blanket purchase orders and similar agreements at little risk to XYZ. An example of what has been achieved here is a recent BPO agreement with one vendor which cut lead-times from twelve weeks to two weeks with only a modest investment in raw material stock by the vendor.
Another area of concern related to us was in XYZ's inspection-based Quality effort. Scrap and rework costs run about 3% of sales; reject rates are in the single digits, and there is presently no trend analysis of defects, formal feedback on trends to the source of the defect, or closely tracked corrective action. Clear direction for the management team has been formulated by the plant executives and the current task is to provide even greater focus for the improvement efforts. The necessary skills for this effort would benefit through improvement, with opportunities in the areas of:
1) operator skill, to be achieved through closer training, direction and an emphasis upon operator quality control versus inspector-based quality
2) technical competence in the customer service area
3) a clear need for greater direction and technical support in the Manufacturing Engineering area.
Both of the latter areas are presently being addressed by the XYZ management.
Strategic Business Analysis Don Guild, Synchronous Management
Page 4 of 16 www.synchronousmanagement.com P: 203-877-1287 – C: 203-671-8533
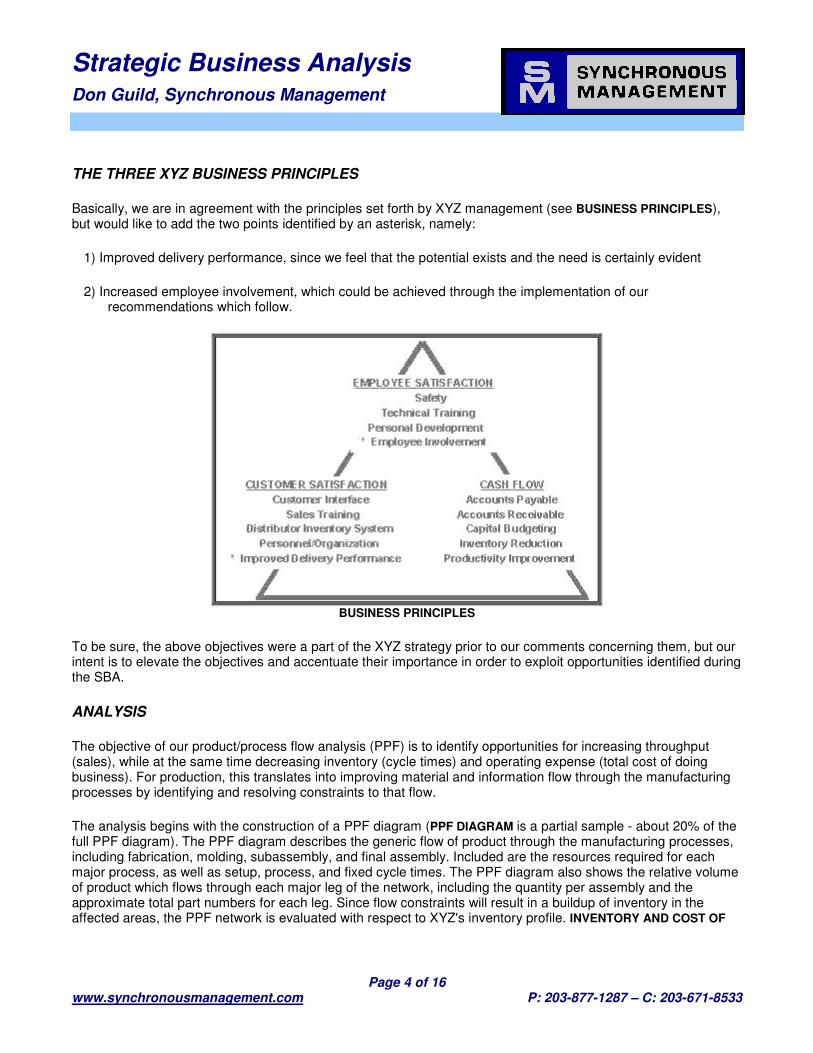
THE THREE XYZ BUSINESS PRINCIPLES
Basically, we are in agreement with the principles set forth by XYZ management (see BUSINESS PRINCIPLES), but would like to add the two points identified by an asterisk, namely:
1) Improved delivery performance, since we feel that the potential exists and the need is certainly evident
2) Increased employee involvement, which could be achieved through the implementation of our recommendations which follow.
BUSINESS PRINCIPLES
To be sure, the above objectives were a part of the XYZ strategy prior to our comments concerning them, but our intent is to elevate the objectives and accentuate their importance in order to exploit opportunities identified during the SBA.
ANALYSIS
The objective of our product/process flow analysis (PPF) is to identify opportunities for increasing throughput (sales), while at the same time decreasing inventory (cycle times) and operating expense (total cost of doing business). For production, this translates into improving material and information flow through the manufacturing processes by identifying and resolving constraints to that flow.
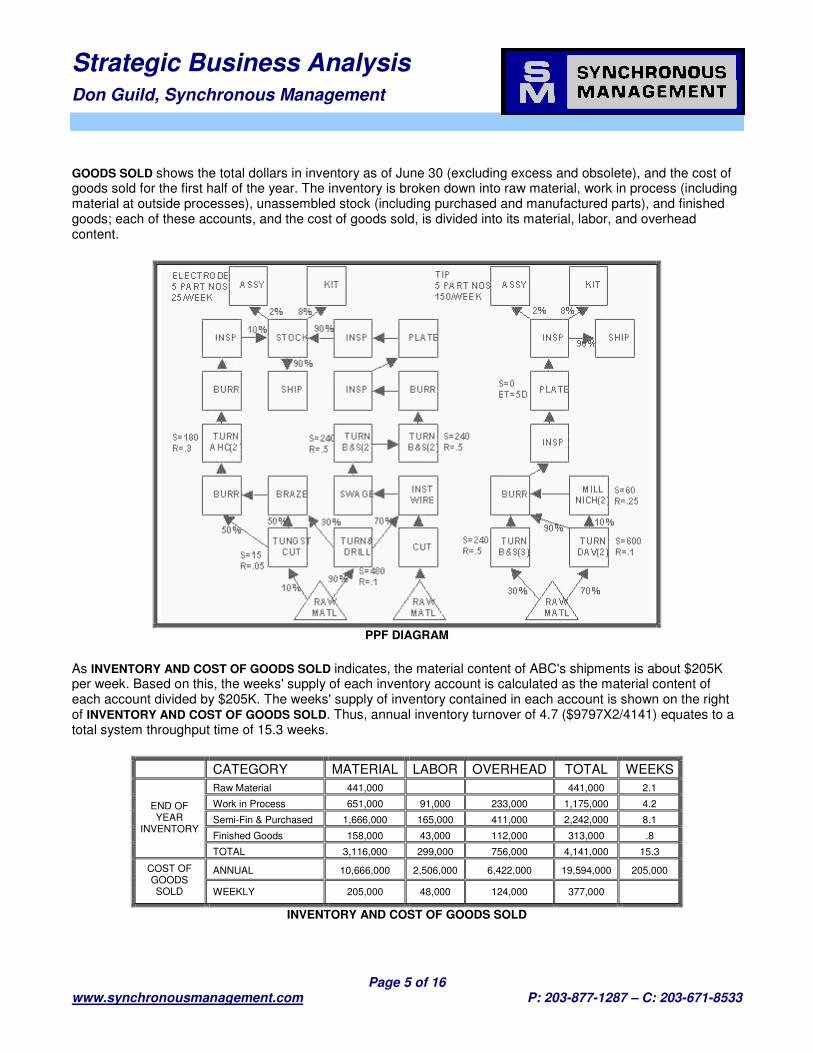
The analysis begins with the construction of a PPF diagram (PPF DIAGRAM is a partial sample - about 20% of the full PPF diagram). The PPF diagram describes the generic flow of product through the manufacturing processes, including fabrication, molding, subassembly, and final assembly. Included are the resources required for each major process, as well as setup, process, and fixed cycle times. The PPF diagram also shows the relative volume of product which flows through each major leg of the network, including the quantity per assembly and the approximate total part numbers for each leg. Since flow constraints will result in a buildup of inventory in the affected areas, the PPF network is evaluated with respect to XYZ's inventory profile. INVENTORY AND COST OF
Strategic Business Analysis Don Guild, Synchronous Management
Page 5 of 16 www.synchronousmanagement.com P: 203-877-1287 – C: 203-671-8533
GOODS SOLD shows the total dollars in inventory as of June 30 (excluding excess and obsolete), and the cost of goods sold for the first half of the year. The inventory is broken down into raw material, work in process (including material at outside processes), unassembled stock (including purchased and manufactured parts), and finished goods; each of these accounts, and the cost of goods sold, is divided into its material, labor, and overhead content.
PPF DIAGRAM
As INVENTORY AND COST OF GOODS SOLD indicates, the material content of ABC's shipments is about $205K per week. Based on this, the weeks' supply of each inventory account is calculated as the material content of each account divided by $205K. The weeks' supply of inventory contained in each account is shown on the right of INVENTORY AND COST OF GOODS SOLD. Thus, annual inventory turnover of 4.7 ($9797X2/4141) equates to a total system throughput time of 15.3 weeks.
CATEGORY MATERIAL LABOR OVERHEAD TOTAL WEEKS
Raw Material 441,000 441,000 2.1 Work in Process 651,000 91,000 233,000 1,175,000 4.2 Semi-Fin & Purchased 1,666,000 165,000 411,000 2,242,000 8.1 Finished Goods 158,000 43,000 112,000 313,000 .8
END OF YEAR
INVENTORY
TOTAL 3,116,000 299,000 756,000 4,141,000 15.3
ANNUAL 10,666,000 2,506,000 6,422,000 19,594,000 205,000 COST OF GOODS SOLD WEEKLY 205,000 48,000 124,000 377,000
INVENTORY AND COST OF GOODS SOLD
Strategic Business Analysis Don Guild, Synchronous Management
Page 6 of 16 www.synchronousmanagement.com P: 203-877-1287 – C: 203-671-8533
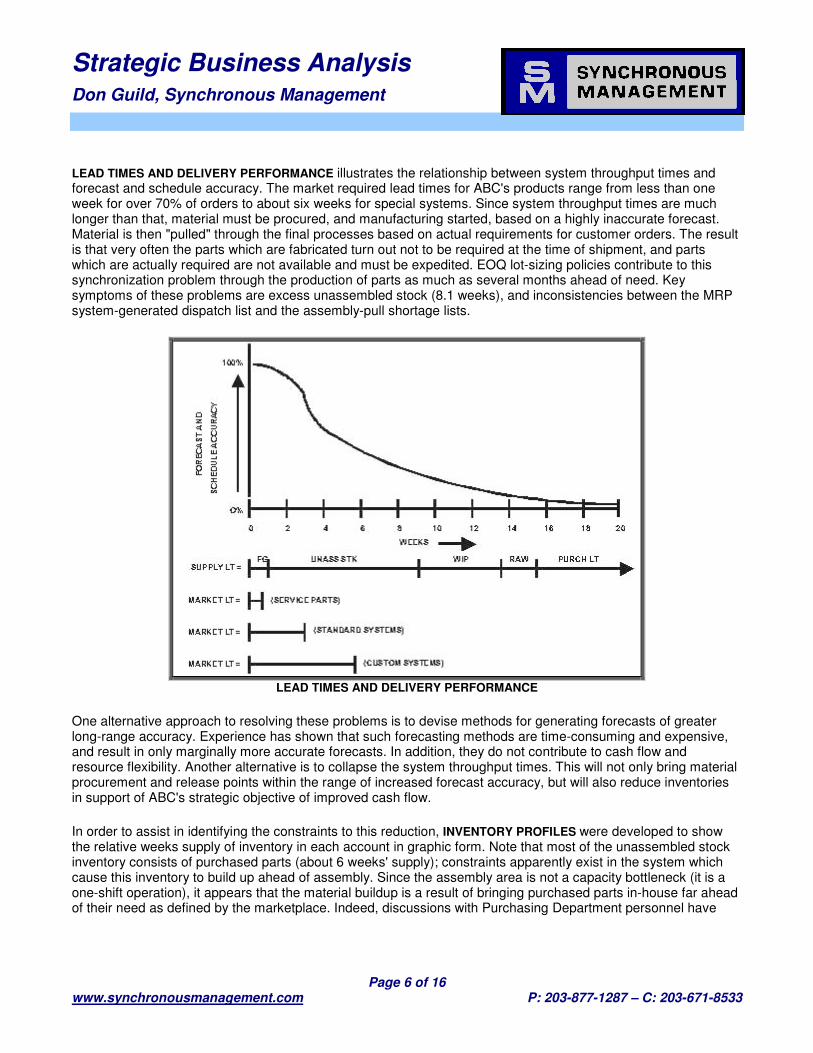
LEAD TIMES AND DELIVERY PERFORMANCE illustrates the relationship between system throughput times and forecast and schedule accuracy. The market required lead times for ABC's products range from less than one week for over 70% of orders to about six weeks for special systems. Since system throughput times are much longer than that, material must be procured, and manufacturing started, based on a highly inaccurate forecast. Material is then "pulled" through the final processes based on actual requirements for customer orders. The result is that very often the parts which are fabricated turn out not to be required at the time of shipment, and parts which are actually required are not available and must be expedited. EOQ lot-sizing policies contribute to this synchronization problem through the production of parts as much as several months ahead of need. Key symptoms of these problems are excess unassembled stock (8.1 weeks), and inconsistencies between the MRP system-generated dispatch list and the assembly-pull shortage lists.
LEAD TIMES AND DELIVERY PERFORMANCE
One alternative approach to resolving these problems is to devise methods for generating forecasts of greater long-range accuracy. Experience has shown that such forecasting methods are time-consuming and expensive, and result in only marginally more accurate forecasts. In addition, they do not contribute to cash flow and resource flexibility. Another alternative is to collapse the system throughput times. This will not only bring material procurement and release points within the range of increased forecast accuracy, but will also reduce inventories in support of ABC's strategic objective of improved cash flow.
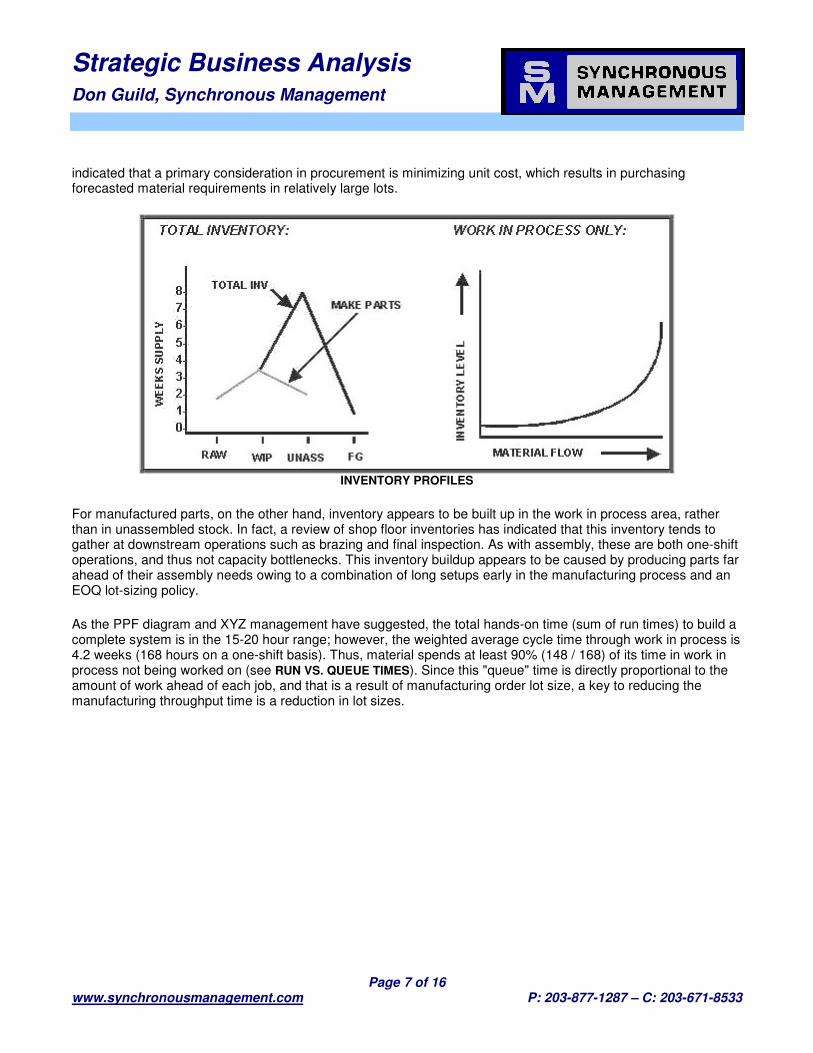
In order to assist in identifying the constraints to this reduction, INVENTORY PROFILES were developed to show the relative weeks supply of inventory in each account in graphic form. Note that most of the unassembled stock inventory consists of purchased parts (about 6 weeks' supply); constraints apparently exist in the system which cause this inventory to build up ahead of assembly. Since the assembly area is not a capacity bottleneck (it is a one-shift operation), it appears that the material buildup is a result of bringing purchased parts in-house far ahead of their need as defined by the marketplace. Indeed, discussions with Purchasing Department personnel have
Strategic Business Analysis Don Guild, Synchronous Management
Page 7 of 16 www.synchronousmanagement.com P: 203-877-1287 – C: 203-671-8533
indicated that a primary consideration in procurement is minimizing unit cost, which results in purchasing forecasted material requirements in relatively large lots.
INVENTORY PROFILES
For manufactured parts, on the other hand, inventory appears to be built up in the work in process area, rather than in unassembled stock. In fact, a review of shop floor inventories has indicated that this inventory tends to gather at downstream operations such as brazing and final inspection. As with assembly, these are both one-shift operations, and thus not capacity bottlenecks. This inventory buildup appears to be caused by producing parts far ahead of their assembly needs owing to a combination of long setups early in the manufacturing process and an EOQ lot-sizing policy.
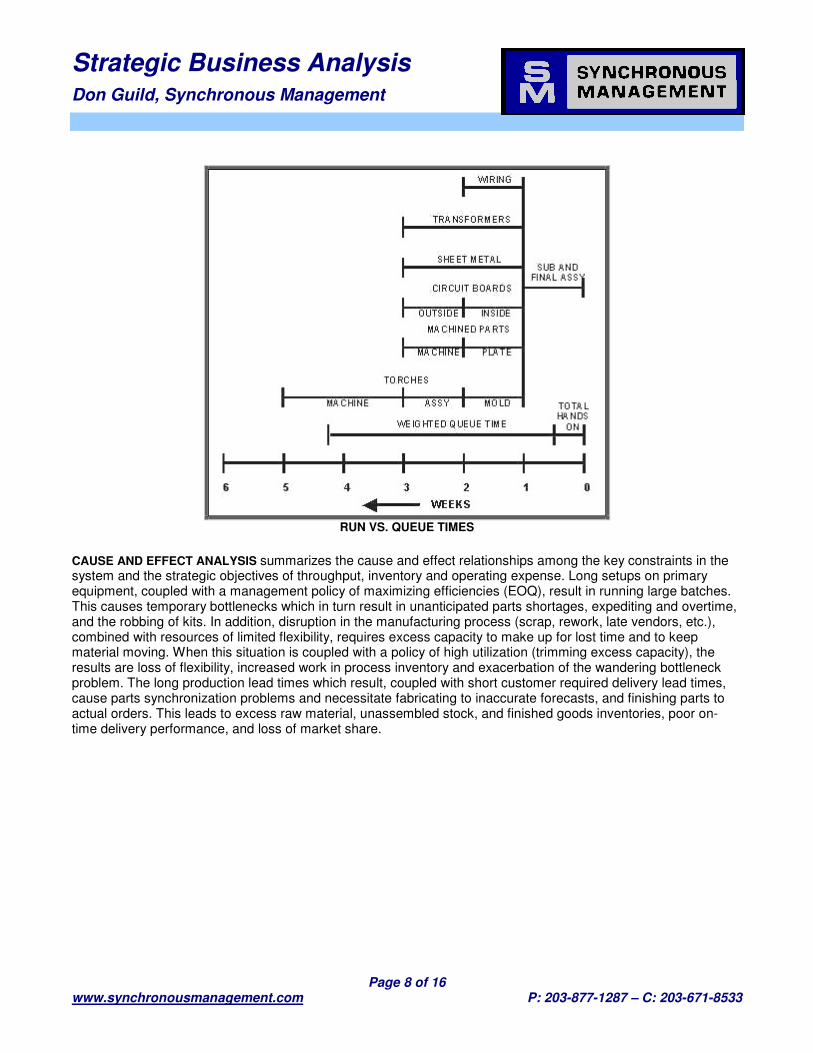
As the PPF diagram and XYZ management have suggested, the total hands-on time (sum of run times) to build a complete system is in the 15-20 hour range; however, the weighted average cycle time through work in process is 4.2 weeks (168 hours on a one-shift basis). Thus, material spends at least 90% (148 / 168) of its time in work in process not being worked on (see RUN VS. QUEUE TIMES). Since this "queue" time is directly proportional to the amount of work ahead of each job, and that is a result of manufacturing order lot size, a key to reducing the manufacturing throughput time is a reduction in lot sizes.
Strategic Business Analysis Don Guild, Synchronous Management
Page 8 of 16 www.synchronousmanagement.com P: 203-877-1287 – C: 203-671-8533
RUN VS. QUEUE TIMES
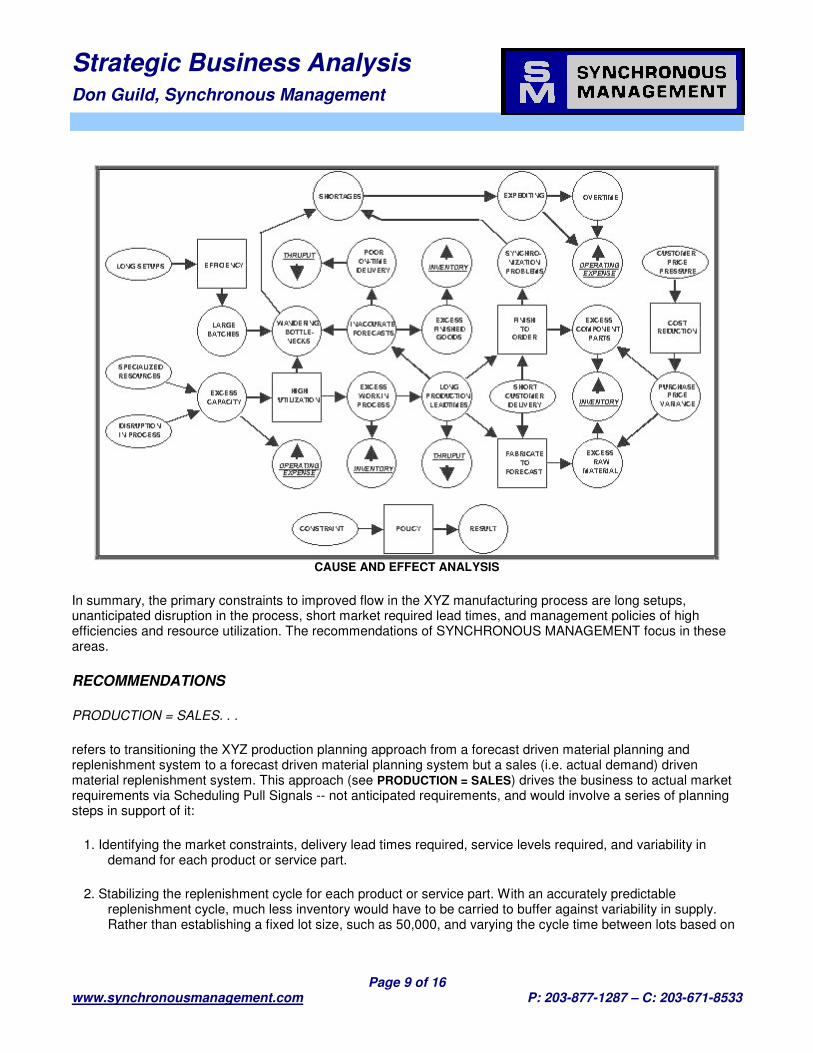
CAUSE AND EFFECT ANALYSIS summarizes the cause and effect relationships among the key constraints in the system and the strategic objectives of throughput, inventory and operating expense. Long setups on primary equipment, coupled with a management policy of maximizing efficiencies (EOQ), result in running large batches. This causes temporary bottlenecks which in turn result in unanticipated parts shortages, expediting and overtime, and the robbing of kits. In addition, disruption in the manufacturing process (scrap, rework, late vendors, etc.), combined with resources of limited flexibility, requires excess capacity to make up for lost time and to keep material moving. When this situation is coupled with a policy of high utilization (trimming excess capacity), the results are loss of flexibility, increased work in process inventory and exacerbation of the wandering bottleneck problem. The long production lead times which result, coupled with short customer required delivery lead times, cause parts synchronization problems and necessitate fabricating to inaccurate forecasts, and finishing parts to actual orders. This leads to excess raw material, unassembled stock, and finished goods inventories, poor on-time delivery performance, and loss of market share.
Strategic Business Analysis Don Guild, Synchronous Management
Page 9 of 16 www.synchronousmanagement.com P: 203-877-1287 – C: 203-671-8533
CAUSE AND EFFECT ANALYSIS
In summary, the primary constraints to improved flow in the XYZ manufacturing process are long setups, unanticipated disruption in the process, short market required lead times, and management policies of high efficiencies and resource utilization. The recommendations of SYNCHRONOUS MANAGEMENT focus in these areas.
RECOMMENDATIONS
PRODUCTION = SALES. . .
refers to transitioning the XYZ production planning approach from a forecast driven material planning and replenishment system to a forecast driven material planning system but a sales (i.e. actual demand) driven material replenishment system. This approach (see PRODUCTION = SALES) drives the business to actual market requirements via Scheduling Pull Signals -- not anticipated requirements, and would involve a series of planning steps in support of it:
1. Identifying the market constraints, delivery lead times required, service levels required, and variability in demand for each product or service part.
2. Stabilizing the replenishment cycle for each product or service part. With an accurately predictable replenishment cycle, much less inventory would have to be carried to buffer against variability in supply. Rather than establishing a fixed lot size, such as 50,000, and varying the cycle time between lots based on
Strategic Business Analysis Don Guild, Synchronous Management
Page 10 of 16 www.synchronousmanagement.com P: 203-877-1287 – C: 203-671-8533
anticipated usage, we would recommend fixing the replenishment cycle and varying the lot size based on actual usage. The cycle for each part would be established based on actual market requirements and assembly capacity availability. This approach allows full exploitation of any "dependent setup time" opportunities.
3. Establishing finished goods inventory levels based on market lead times and services levels required, as well as variability in market demand.
4. Produce product or service parts to actual sales, not anticipated usage or stock authorization levels.
5. Link the purchase of raw materials and the fabrication of components to the assembly schedule and actual incoming demand through the use of scheduling pull signals.
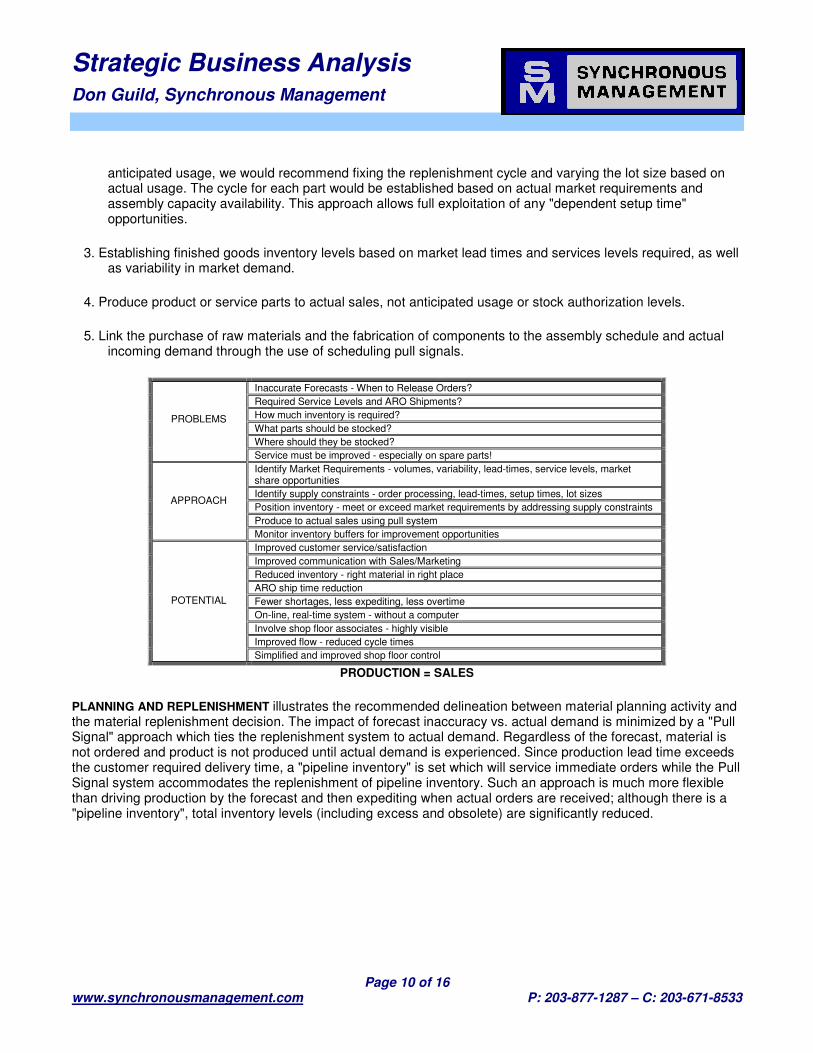
Inaccurate Forecasts - When to Release Orders? Required Service Levels and ARO Shipments? How much inventory is required? What parts should be stocked? Where should they be stocked?
PROBLEMS
Service must be improved - especially on spare parts! Identify Market Requirements - volumes, variability, lead-times, service levels, market share opportunities Identify supply constraints - order processing, lead-times, setup times, lot sizes Position inventory - meet or exceed market requirements by addressing supply constraints Produce to actual sales using pull system
APPROACH
Monitor inventory buffers for improvement opportunities Improved customer service/satisfaction Improved communication with Sales/Marketing Reduced inventory - right material in right place ARO ship time reduction Fewer shortages, less expediting, less overtime On-line, real-time system - without a computer Involve shop floor associates - highly visible Improved flow - reduced cycle times
POTENTIAL
Simplified and improved shop floor control
PRODUCTION = SALES
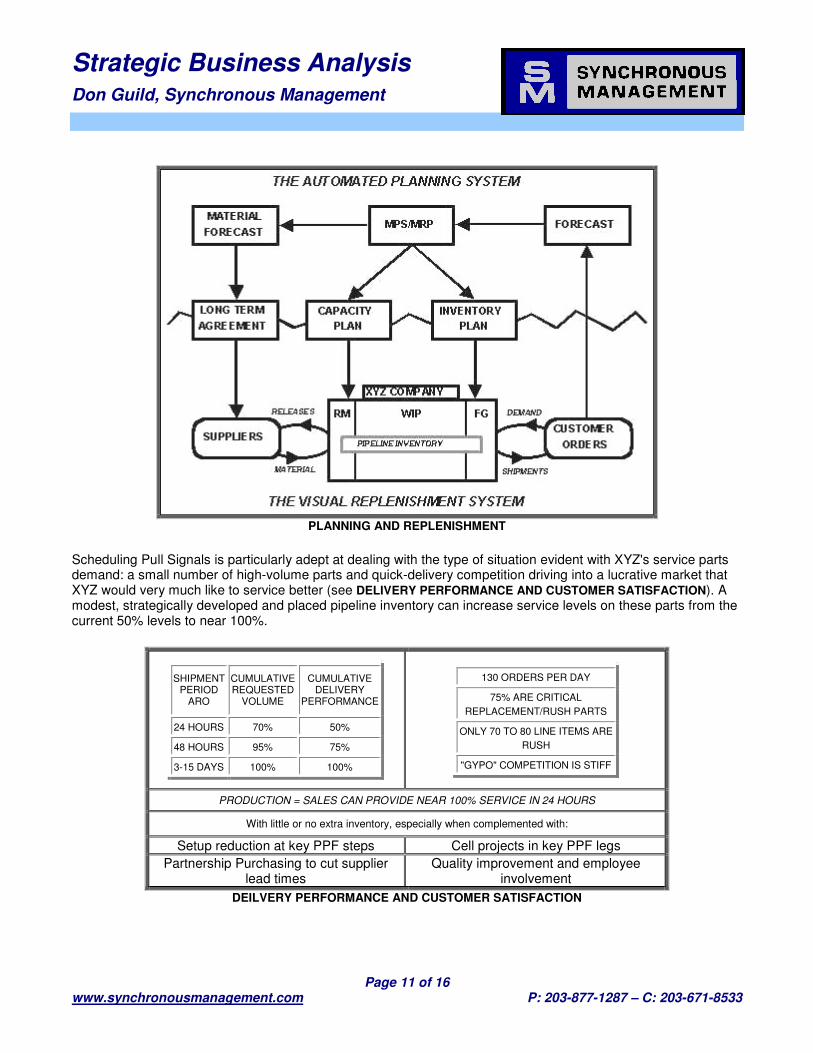
PLANNING AND REPLENISHMENT illustrates the recommended delineation between material planning activity and the material replenishment decision. The impact of forecast inaccuracy vs. actual demand is minimized by a "Pull Signal" approach which ties the replenishment system to actual demand. Regardless of the forecast, material is not ordered and product is not produced until actual demand is experienced. Since production lead time exceeds the customer required delivery time, a "pipeline inventory" is set which will service immediate orders while the Pull Signal system accommodates the replenishment of pipeline inventory. Such an approach is much more flexible than driving production by the forecast and then expediting when actual orders are received; although there is a "pipeline inventory", total inventory levels (including excess and obsolete) are significantly reduced.
Strategic Business Analysis Don Guild, Synchronous Management
Page 11 of 16 www.synchronousmanagement.com P: 203-877-1287 – C: 203-671-8533
PLANNING AND REPLENISHMENT
Scheduling Pull Signals is particularly adept at dealing with the type of situation evident with XYZ's service parts demand: a small number of high-volume parts and quick-delivery competition driving into a lucrative market that XYZ would very much like to service better (see DELIVERY PERFORMANCE AND CUSTOMER SATISFACTION). A modest, strategically developed and placed pipeline inventory can increase service levels on these parts from the current 50% levels to near 100%.
SHIPMENT PERIOD
ARO CUMULATIVE REQUESTED
VOLUME CUMULATIVE
DELIVERY PERFORMANCE
24 HOURS 70% 50% 48 HOURS 95% 75% 3-15 DAYS 100% 100%
130 ORDERS PER DAY 75% ARE CRITICAL
REPLACEMENT/RUSH PARTS ONLY 70 TO 80 LINE ITEMS ARE
RUSH "GYPO" COMPETITION IS STIFF
PRODUCTION = SALES CAN PROVIDE NEAR 100% SERVICE IN 24 HOURS
With little or no extra inventory, especially when complemented with:
Setup reduction at key PPF steps Cell projects in key PPF legs
Partnership Purchasing to cut supplier lead times
Quality improvement and employee involvement
DEILVERY PERFORMANCE AND CUSTOMER SATISFACTION
Strategic Business Analysis Don Guild, Synchronous Management
Page 12 of 16 www.synchronousmanagement.com P: 203-877-1287 – C: 203-671-8533
In the plant, we believe the potential is for Scheduling Pull Signals to reduce average WIP cycle time from four weeks to one week or less. Likewise, the average eight weeks of unassembled stock and two weeks of raw material can be considerably reduced through the application of "Partnership Purchasing" in conjunction with the in-house pull signals.
PARTNERSHIP PURCHASING. . .
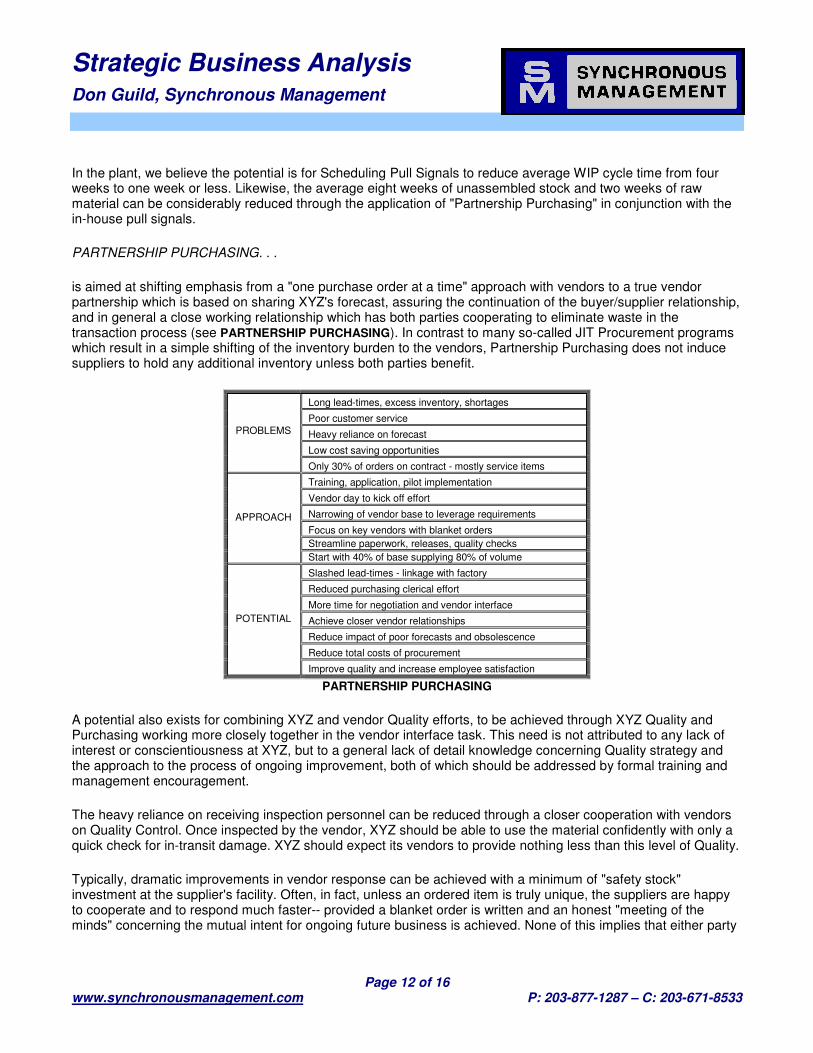
is aimed at shifting emphasis from a "one purchase order at a time" approach with vendors to a true vendor partnership which is based on sharing XYZ's forecast, assuring the continuation of the buyer/supplier relationship, and in general a close working relationship which has both parties cooperating to eliminate waste in the transaction process (see PARTNERSHIP PURCHASING). In contrast to many so-called JIT Procurement programs which result in a simple shifting of the inventory burden to the vendors, Partnership Purchasing does not induce suppliers to hold any additional inventory unless both parties benefit.
Long lead-times, excess inventory, shortages Poor customer service Heavy reliance on forecast Low cost saving opportunities
PROBLEMS
Only 30% of orders on contract - mostly service items Training, application, pilot implementation Vendor day to kick off effort Narrowing of vendor base to leverage requirements Focus on key vendors with blanket orders Streamline paperwork, releases, quality checks
APPROACH
Start with 40% of base supplying 80% of volume Slashed lead-times - linkage with factory Reduced purchasing clerical effort More time for negotiation and vendor interface Achieve closer vendor relationships Reduce impact of poor forecasts and obsolescence Reduce total costs of procurement
POTENTIAL
Improve quality and increase employee satisfaction
PARTNERSHIP PURCHASING
A potential also exists for combining XYZ and vendor Quality efforts, to be achieved through XYZ Quality and Purchasing working more closely together in the vendor interface task. This need is not attributed to any lack of interest or conscientiousness at XYZ, but to a general lack of detail knowledge concerning Quality strategy and the approach to the process of ongoing improvement, both of which should be addressed by formal training and management encouragement.
The heavy reliance on receiving inspection personnel can be reduced through a closer cooperation with vendors on Quality Control. Once inspected by the vendor, XYZ should be able to use the material confidently with only a quick check for in-transit damage. XYZ should expect its vendors to provide nothing less than this level of Quality.
Typically, dramatic improvements in vendor response can be achieved with a minimum of "safety stock" investment at the supplier's facility. Often, in fact, unless an ordered item is truly unique, the suppliers are happy to cooperate and to respond much faster-- provided a blanket order is written and an honest "meeting of the minds" concerning the mutual intent for ongoing future business is achieved. None of this implies that either party
Strategic Business Analysis Don Guild, Synchronous Management
Page 13 of 16 www.synchronousmanagement.com P: 203-877-1287 – C: 203-671-8533
can abuse the relationship, and once XYZ's Purchasing is freed from the clerical effort of generating individual Purchase Orders, they can use the time to negotiate blanket agreements and to assure that vendor charges remain in line with expectations.
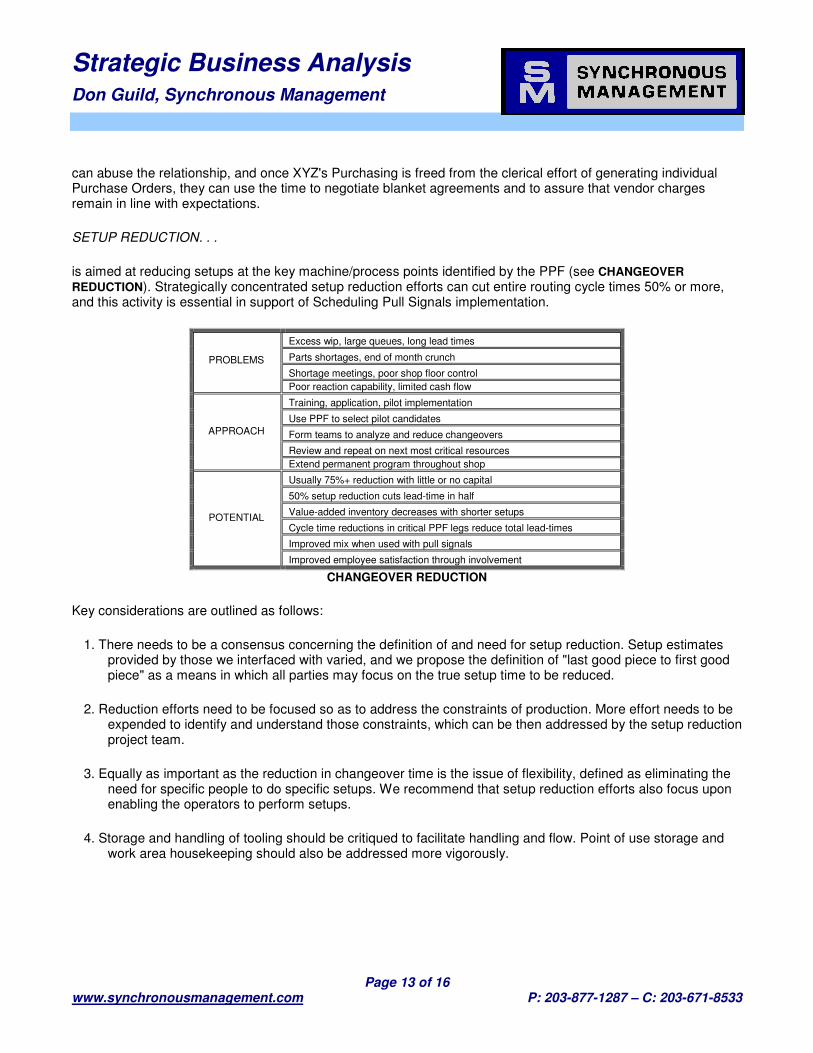
SETUP REDUCTION. . .
is aimed at reducing setups at the key machine/process points identified by the PPF (see CHANGEOVER REDUCTION). Strategically concentrated setup reduction efforts can cut entire routing cycle times 50% or more, and this activity is essential in support of Scheduling Pull Signals implementation.
Excess wip, large queues, long lead times Parts shortages, end of month crunch Shortage meetings, poor shop floor control
PROBLEMS
Poor reaction capability, limited cash flow Training, application, pilot implementation Use PPF to select pilot candidates Form teams to analyze and reduce changeovers Review and repeat on next most critical resources
APPROACH
Extend permanent program throughout shop Usually 75%+ reduction with little or no capital 50% setup reduction cuts lead-time in half Value-added inventory decreases with shorter setups Cycle time reductions in critical PPF legs reduce total lead-times Improved mix when used with pull signals
POTENTIAL
Improved employee satisfaction through involvement
CHANGEOVER REDUCTION
Key considerations are outlined as follows:
1. There needs to be a consensus concerning the definition of and need for setup reduction. Setup estimates provided by those we interfaced with varied, and we propose the definition of "last good piece to first good piece" as a means in which all parties may focus on the true setup time to be reduced.
2. Reduction efforts need to be focused so as to address the constraints of production. More effort needs to be expended to identify and understand those constraints, which can be then addressed by the setup reduction project team.
3. Equally as important as the reduction in changeover time is the issue of flexibility, defined as eliminating the need for specific people to do specific setups. We recommend that setup reduction efforts also focus upon enabling the operators to perform setups.
4. Storage and handling of tooling should be critiqued to facilitate handling and flow. Point of use storage and work area housekeeping should also be addressed more vigorously.
Strategic Business Analysis Don Guild, Synchronous Management
Page 14 of 16 www.synchronousmanagement.com P: 203-877-1287 – C: 203-671-8533
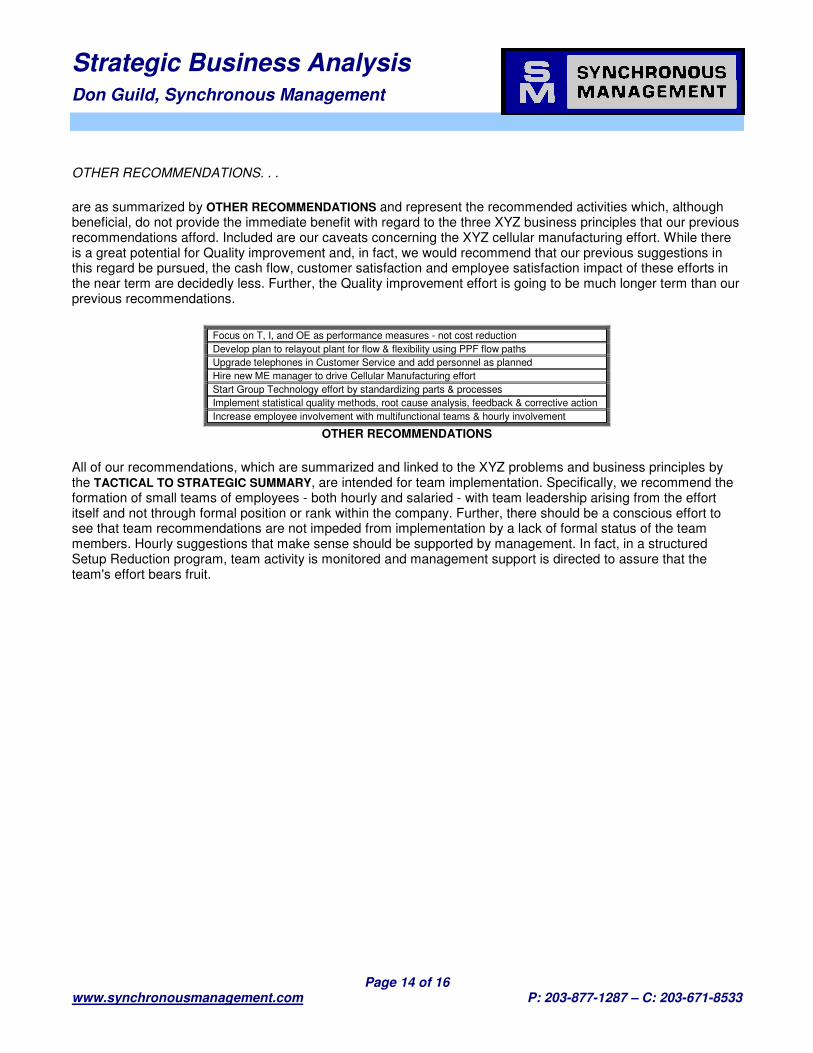
OTHER RECOMMENDATIONS. . .
are as summarized by OTHER RECOMMENDATIONS and represent the recommended activities which, although beneficial, do not provide the immediate benefit with regard to the three XYZ business principles that our previous recommendations afford. Included are our caveats concerning the XYZ cellular manufacturing effort. While there is a great potential for Quality improvement and, in fact, we would recommend that our previous suggestions in this regard be pursued, the cash flow, customer satisfaction and employee satisfaction impact of these efforts in the near term are decidedly less. Further, the Quality improvement effort is going to be much longer term than our previous recommendations.
Focus on T, I, and OE as performance measures - not cost reduction Develop plan to relayout plant for flow & flexibility using PPF flow paths Upgrade telephones in Customer Service and add personnel as planned Hire new ME manager to drive Cellular Manufacturing effort Start Group Technology effort by standardizing parts & processes Implement statistical quality methods, root cause analysis, feedback & corrective action Increase employee involvement with multifunctional teams & hourly involvement
OTHER RECOMMENDATIONS
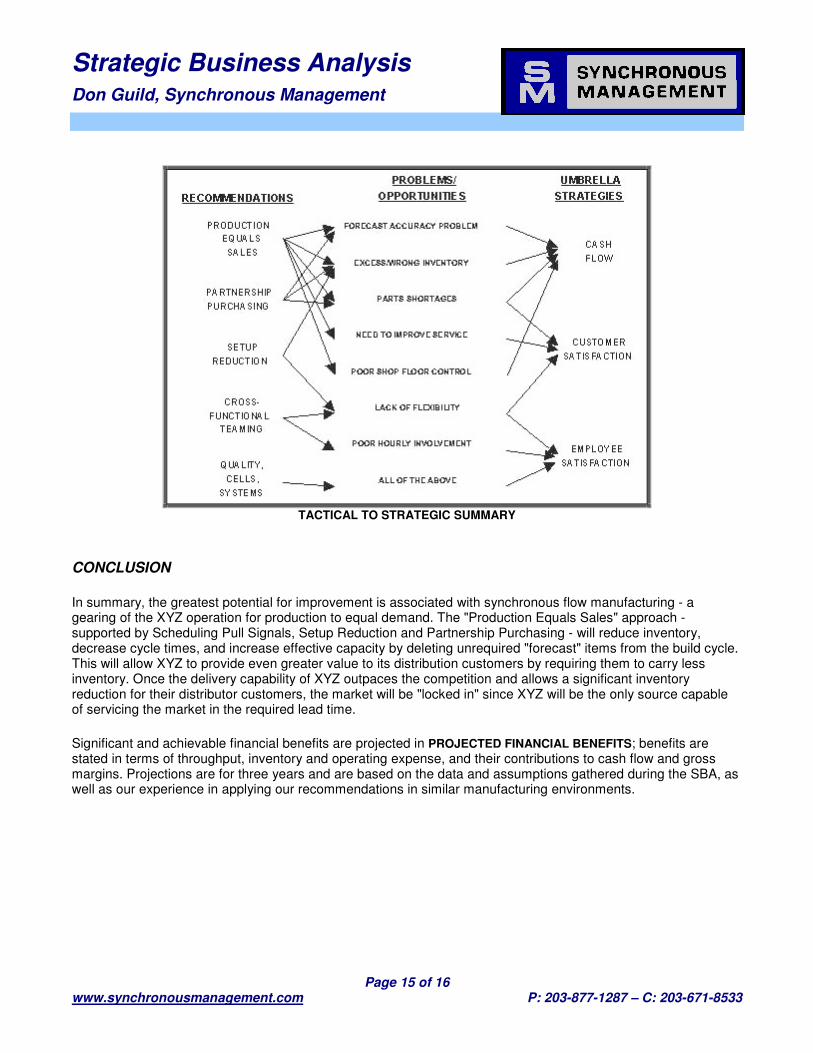
All of our recommendations, which are summarized and linked to the XYZ problems and business principles by the TACTICAL TO STRATEGIC SUMMARY, are intended for team implementation. Specifically, we recommend the formation of small teams of employees - both hourly and salaried - with team leadership arising from the effort itself and not through formal position or rank within the company. Further, there should be a conscious effort to see that team recommendations are not impeded from implementation by a lack of formal status of the team members. Hourly suggestions that make sense should be supported by management. In fact, in a structured Setup Reduction program, team activity is monitored and management support is directed to assure that the team's effort bears fruit.
Strategic Business Analysis Don Guild, Synchronous Management
Page 15 of 16 www.synchronousmanagement.com P: 203-877-1287 – C: 203-671-8533
TACTICAL TO STRATEGIC SUMMARY
CONCLUSION
In summary, the greatest potential for improvement is associated with synchronous flow manufacturing - a gearing of the XYZ operation for production to equal demand. The "Production Equals Sales" approach - supported by Scheduling Pull Signals, Setup Reduction and Partnership Purchasing - will reduce inventory, decrease cycle times, and increase effective capacity by deleting unrequired "forecast" items from the build cycle. This will allow XYZ to provide even greater value to its distribution customers by requiring them to carry less inventory. Once the delivery capability of XYZ outpaces the competition and allows a significant inventory reduction for their distributor customers, the market will be "locked in" since XYZ will be the only source capable of servicing the market in the required lead time.
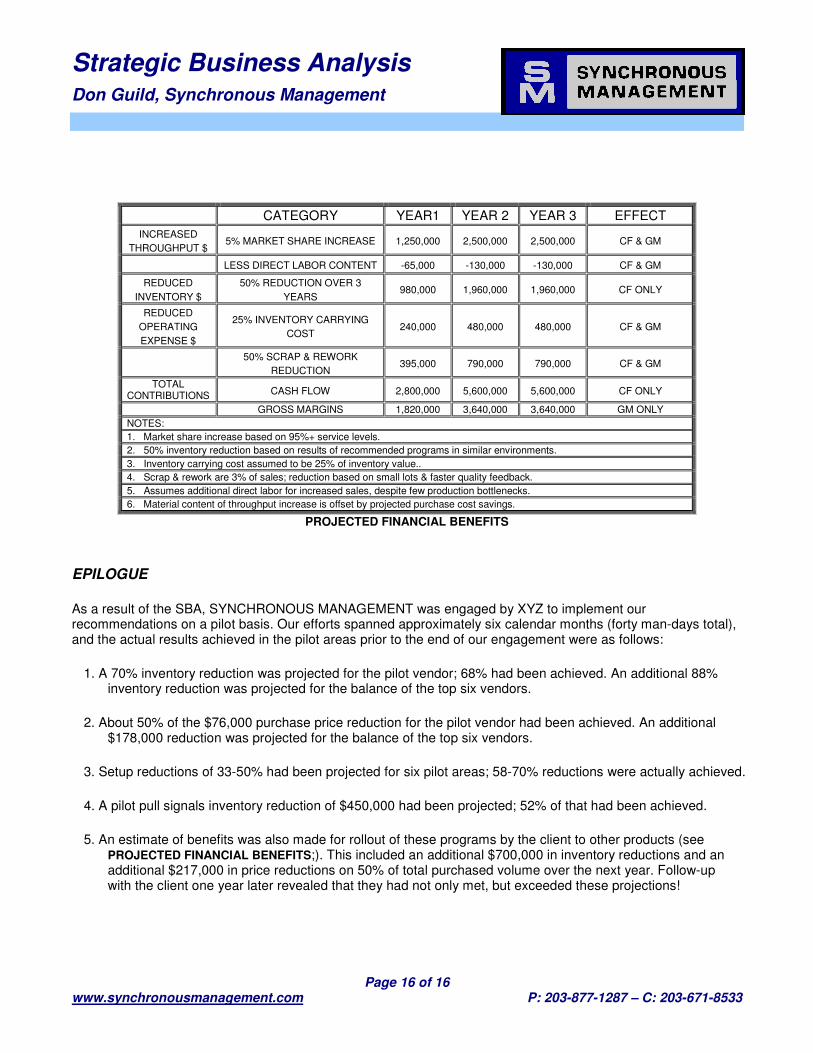
Significant and achievable financial benefits are projected in PROJECTED FINANCIAL BENEFITS; benefits are stated in terms of throughput, inventory and operating expense, and their contributions to cash flow and gross margins. Projections are for three years and are based on the data and assumptions gathered during the SBA, as well as our experience in applying our recommendations in similar manufacturing environments.
Strategic Business Analysis Don Guild, Synchronous Management
Page 16 of 16 www.synchronousmanagement.com P: 203-877-1287 – C: 203-671-8533
CATEGORY YEAR1 YEAR 2 YEAR 3 EFFECT
INCREASED THROUGHPUT $
5% MARKET SHARE INCREASE 1,250,000 2,500,000 2,500,000 CF & GM
LESS DIRECT LABOR CONTENT -65,000 -130,000 -130,000 CF & GM
REDUCED INVENTORY $
50% REDUCTION OVER 3 YEARS
980,000 1,960,000 1,960,000 CF ONLY
REDUCED OPERATING EXPENSE $
25% INVENTORY CARRYING COST
240,000 480,000 480,000 CF & GM
50% SCRAP & REWORK REDUCTION
395,000 790,000 790,000 CF & GM
TOTAL CONTRIBUTIONS CASH FLOW 2,800,000 5,600,000 5,600,000 CF ONLY
GROSS MARGINS 1,820,000 3,640,000 3,640,000 GM ONLY NOTES: 1. Market share increase based on 95%+ service levels. 2. 50% inventory reduction based on results of recommended programs in similar environments. 3. Inventory carrying cost assumed to be 25% of inventory value.. 4. Scrap & rework are 3% of sales; reduction based on small lots & faster quality feedback. 5. Assumes additional direct labor for increased sales, despite few production bottlenecks. 6. Material content of throughput increase is offset by projected purchase cost savings.
PROJECTED FINANCIAL BENEFITS
EPILOGUE
As a result of the SBA, SYNCHRONOUS MANAGEMENT was engaged by XYZ to implement our recommendations on a pilot basis. Our efforts spanned approximately six calendar months (forty man-days total), and the actual results achieved in the pilot areas prior to the end of our engagement were as follows:
1. A 70% inventory reduction was projected for the pilot vendor; 68% had been achieved. An additional 88% inventory reduction was projected for the balance of the top six vendors.
2. About 50% of the $76,000 purchase price reduction for the pilot vendor had been achieved. An additional $178,000 reduction was projected for the balance of the top six vendors.
3. Setup reductions of 33-50% had been projected for six pilot areas; 58-70% reductions were actually achieved.
4. A pilot pull signals inventory reduction of $450,000 had been projected; 52% of that had been achieved.
5. An estimate of benefits was also made for rollout of these programs by the client to other products (see PROJECTED FINANCIAL BENEFITS;). This included an additional $700,000 in inventory reductions and an additional $217,000 in price reductions on 50% of total purchased volume over the next year. Follow-up with the client one year later revealed that they had not only met, but exceeded these projections!