Embed Size (px)
Citation preview

Strategic Management International Journal of Strategic Management and
Decision Support Systems in Strategic Management
www.ef.uns.ac.rs/sm Publisher University of Novi Sad, Faculty of Economics in Subotica Segedinski put 9-11, 24000 Subotica, Serbia Tel: +381 24 628 000 Fax: +381 546 486 http://www.ef.uns.ac.rs For Publisher Aleksandar Grubor, University of Novi Sad, Faculty of Economics in Subotica, Serbia Editor-in-Chief Jelica Trninić, University of Novi Sad, Faculty of Economics in Subotica, Serbia National Editorial Board Esad Ahmetagić, University of Novi Sad, Faculty of Economics in Subotica, Serbia Jelena Birovljev, University of Novi Sad, Faculty of Economics in Subotica, Serbia Jovica Đurković, University of Novi Sad, Faculty of Economics in Subotica, Serbia Nebojša Janićijević, University of Belgrade, Faculty of Economics Belgrade, Serbia Tibor Kiš, University of Novi Sad, Faculty of Economics in Subotica, Serbia Božidar Leković, University of Novi Sad, Faculty of Economics in Subotica, Serbia Vesna Milićević, University of Belgrade, Faculty of Organizational Sciences, Serbia Aleksandar Živković, University of Belgrade, Faculty of Economics, Serbia International Editorial Board Ilona Bažantova, Charles University in Prague, Faculty of Law, Czech Republic André Boyer, University of Nice Sophia-Antipolis, France Ivan Brezina, University of Economics in Bratislava, Faculty of Economic Informatics, Bratislava, Slovakia Ferenc Farkas, University of Pécs, Faculty of Business and Economy, Hungary Agnes Hofmeister, Corvinus University of Budapest, Faculty of Business Administration, Hungary Pedro Isaias, Open University Lisbon, Portugal Novak Kondić, University of Banja Luka, Faculty of Economics, Banja Luka, Bosnia and Herzegovina Mensura Kudumović, University of Sarajevo, Faculty of Medicine, Bosnia and Herzegovina Vujica Lazović, University of Montenegro, Faculty of Economics, Podgorica, Montenegro Martin Lipičnik, University of Maribor, Faculty of Logistics Celje-Krško, Slovenia Pawel Lula, Cracow University of Economics, Poland Emilija Novak, West University of Timisoara, Timisoara, Romania Elias Pimenidis, University of East London, England Vladimir Polovinko, Omsk State University, Russia Ludovic Ragni, University of Nice Sophia-Antipolis, France Kosta Sotiroski, University „ST Kliment Ohridski“ Bitol, Faculty of Economics Prilep, Macedonia Ioan Talpos, West University of Timisoara, Faculty of Economics, Romania Assistant Editors Marton Sakal, University of Novi Sad, Faculty of Economics in Subotica, Serbia Vuk Vuković, University of Novi Sad, Faculty of Economics in Subotica, Serbia Lazar Raković, University of Novi Sad, Faculty of Economics in Subotica, Serbia English translation Željko Buljovčić Zora Trninić Proofreading Institut za strane jezike ad Beograd Prepress Milivoje Grahovac
Print Pressia d.o.o., Belgrade, Serbia Circulation 200 The Journal is published quarterly.
Strategic Management International Journal of Strategic Management and
Decision Support Systems in Strategic Management ISSN 1821-3448, UDC 005.21 Strategic Management is a quarterly journal addressing issues concerned with all aspects of strategic man-agement. It is devoted to the improvement and further development of the theory and practice of strategic management and it is designed to appeal to both practicing managers and academics. Specially, Journal pub-lishes original refereed material in decision support systems in strategic management.
Thematic Fields Mission and Philosophy of the Organization
Culture and Climate of the Organization
Effectiveness and Efficiency of the Organization
Structure and Form of the Organization
Strategic Analysis
Aims and Strategies
Process of Strategic Management
Characteristics of Strategic Management in the New Economy
Contemporary Ontological, Epistemological and Axiological Suppositions on the Organization and its Environment
Analysis of the Organization and its Interaction with the Environment
Structure and Dynamics of the Organizational Environment
Uncertainty and Indistinctiveness of the Organizational Environment
Synchronic and Diachronic Analysis of the Organizational Environment
Analysis Techniques of the Organization
Business Processes, Learning and Development within the Context of Strategic Management
Evaluation and Measuring of the Potential and Realization of the Organization within the Context of Strategic Management
Strategic Control in Contemporary Management
Information Technologies in Strategic Management
Business Intelligence and Strategic Management
Decision Support Systems and Artificial Intelligence in Strategic Management
All scientific articles submitted for publication in Journal are double-blind reviewed by at least two academics appointed by the Editor's Board: one from the Editorial Board and one independent scientist of the language of origin - English. Reviewers stay anonymous. Authors will timely receive written notification of acceptance, re-marks, comments and evaluation of their articles.
Strategic Management International Journal of Strategic Management and
Decision Support Systems in Strategic Management www.ef.uns.ac.rs/sm ISSN 1821-3448 UDC 005.21 2017, Vol. 22, No. 2
Contents Tomislav Hernaus, Maja Tadić Vujčić, Ana AleksićChanging Work Engagement: The Longitudinal Effect of a Job Redesign Intervention Among Public Sector Employees 3-08 Tatiana Stuken, Olga BurtsevaInternal Training of Personnel in Russia and Belarus: The Content and Effectiveness 09-17 Radojko Lukic, Dragana Vojteski Kljenak Analysis of Intangible Assets in Retail Trade 18-26 Monika Angeloska-Dichovska, Tatjana Petkovska MirchevskaChallenges of the Company in the New Economy and Development of E-business Strategy 27-35 Kristina Mijić, Dejan JakšićIndebtedness of Enterprises and Profitability Improvement 36-40 Alexander Miller Study of the Problems of Technologizing of Industrial Complex of Russia 41-47
STRATEGIC MANAGEMENT, Vol. 22 (2017), No. 2, pp. 003-008 UDC 005.96 331.105:005
Received: April 13, 2017 Accepted: May 17, 2017
Changing Work Engagement: The Longitudinal Effect of a Job Redesign Intervention Among Public Sector Employees
Tomislav Hernaus Faculty of Economics and Business, University of Zagreb, Croatia
Maja Tadić Vujčić Ivo Pilar Institute of Social Sciences, Zagreb, Croatia
Ana Aleksić Faculty of Economics and Business, University of Zagreb, Croatia
Abstract Work or employee engagement might be increased through job re-design interventions such as top-down managerial interventions, bottom-up job crafting or bipolar ideals. However, there is a lack of specific under-standing how public-sector employees react on specific top-down interventions aimed for increasing their vigor, dedication and absorption. In order to gain more insight into how a top-down (managerial) job re-design intervention could foster work engagement, we conducted a four-wave longitudinal diary study on the sample of white-collar employees and their respective supervisors from two public-sector organizations. Specifically, we explored the effect of the managerial job redesign intervention on public-sector employee work engage-ment between baseline (T1) and post-intervention (T4). We tested a multiple mediator-single outcome model in which a job design intervention influences work engagement by changing multiple job characteristics. Fi-nally, we also checked for the extent to which change in work engagement can be explained by specificchanges in certain job characteristics. Our results showed that work engagement of public-sector employees may also be enhanced by redesigning their jobs through a managerial job re-design intervention. Additional insights regarding work engagement and job re-design of public sector employees are given. Keywords Work engagement, job design, job interventions, public-sector employees.
Introduction Work or employee engagement is a desired, ful-filling affective-cognitive state of mind that is closely associated with employee well-being and performance (e.g. Christian, Garza, & Slaughter, 2011). According to the job demands-resources (JD-R) model (e.g. Demerouti, Bakker, Nachreiner, & Schaufeli, 2001), work engagement is driven by the motivating potential of jobs (Schaufeli, Salanova, González-Romá, & Bakker, 2002) and might be increased through job re-design interventions such as top-down managerial interventions, bottom-up job crafting or bipolar
ideals. These planned change initiatives aim to change job characteristics as a means of enhanc-ing employee outcomes (Parker & Wall, 1998). While proactive and employee-led approaches to changing jobs are currently under the spotlight, we have somewhat neglected the original, top-down (managerial) perspective of job design in organizations through which supervisors formally shape work environment for their subordinates by setting targets, describing job tasks, and providing resources (e.g. Bakker & Demerouti, 2016).
Organizations still predominantly empower supervisors (managers) to plan, organize and con-trol the work of their direct reports (employees).
4 Tomislav Hernaus et al. Changing Work Engagement: The Longitudinal Effect of a Job Redesign Intervention Among Public Sector ...
STRATEGIC MANAGEMENT, Vol. 22 (2017), No. 2, pp. 003-008
This might be particularly true for public-sector organizations which use less advanced human resource management (HRM) practices than pri-vate companies (e.g. Vanhala & Stavrou, 2013). While we have certain knowledge about manage-rial job/task design change efforts (e.g. Griffin, 1991; Hackman, Pearce, & Wolfe, 1978; Mor-geson & Campion, 2002; Nielsen, 2013), there is a lack of specific understanding how public sector employees – who possess a greater desire for in-trinsic nonmonetary opportunities than their pri-vate counterparts (Giaque, Anderfuhren-Biget, & Varone, 2013) – react to specific top-down inter-ventions aimed for increasing their vigor, dedica-tion and absorption.
The recent, pioneering meta-analysis of the ef-fectiveness of work engagement interventions (Knight, Patterson, & Dawson, 2016) witnessed the steady emergence of this research stream and revealed a small, positive, but reliable effect of work engagement interventions on work engage-ment. However, the sustainability of these effects is unclear, sample size was low, and different in-tervention types were examined together thus not allowing making conclusions about type-specific effects. Nevertheless, their meta-analytical review highlighted the need for conducting and examin-ing more work engagement interventions. What we currently need is a broader array of both theo-retically- and empirically-driven research into how to better engage public sector employees by making necessary job-related changes. Moreover, the possibility that employees change their behav-ior in response to the content and demands of their jobs, suggests the need for dynamic versus static models of job design (e.g. Clegg & Spencer, 2007).
1. Theoretical framework and hypothesis development Managerial job re-design is a strategy that manag-ers might use on a regular basis making adjust-ments and alterations to jobs to fit business re-quirements with employees’ needs and skills (Oldham & Fried, 2016). An implementation of a job re-design intervention in public sector organi-zations could positively affect job characteristics and employees’ work engagement. Bearing in mind that higher levels of work engagement can be positively associated with work performance (e.g. Bakker & Bal, 2010), putting effort into evaluating, fostering, and sustaining work en-gagement should be of special interest to public sector organizations.
In order to gain more insight into how a top-down (managerial) job re-design intervention could foster work engagement, we conducted a four-wave longitudinal diary study on the sample of white-collar employees and their respective supervisors from two public-sector organizations. Specifically, we explored the effect of the mana-gerial job re-design intervention on public sector employee work engagement between baseline (T1) and post-intervention (T4). In addition, we tested a multiple mediator-single outcome model in which a job design intervention influences one type of employee outcome (i.e. work engagement) by changing multiple job characteristics (see Holman, Axtell, Sprigg, Totterdell, & Wall, 2010). Finally, we also checked for the extent to which change in work engagement can be ex-plained by specific changes in certain (enacted) job characteristics.
The managerial job re-design intervention was implemented as combination of a job resource building and leadership training interventions (Knight et al., 2016). It aimed to enable managers to transfer specific knowledge and skills to their employees, and to foster job and personal re-sources building among them. In this way, this intervention assisted and empowered managers and employees to modify a particular set of job characteristics (dominantly the enacted ones) and better align them with their job requirements, in-terests, and skills. Stated in a more formal way, we formulate our first hypothesis:
H1: Managerial job re-design intervention modifies (enacted) job characteristics of public sector employees.
Furthermore, previous studies revealed that
managerial job re-design interventions can foster work engagement, particularly in group settings (Knight et al., 2016). When employees in public sector organizations experience appropriate sup-port and acknowledgement from their managers, this can not only modify some of their job charac-teristics, but also positively affect the levels of their work engagement (Giauque et al., 2013). Specifically, managerial job re-design activities can modify job characteristics (Schaufeli & Bak-ker, 2004) to better suit their employees’ capabili-ties and aspirations, which, in turn, can stimulate and energize employees and make their work more meaningful. We present these notions in our second and third hypothesis:
Tomislav Hernaus et al. Changing Work Engagement: The Longitudinal Effect of a Job Redesign Intervention Among Public Sector ... 5
STRATEGIC MANAGEMENT, Vol. 22 (2017), No. 2, pp. 003-008
H2: Managerial job re-design intervention in-creases public sector employee work engagement
H3: Change in job characteristics is positively
associated with change in public-sector employee work engagement.
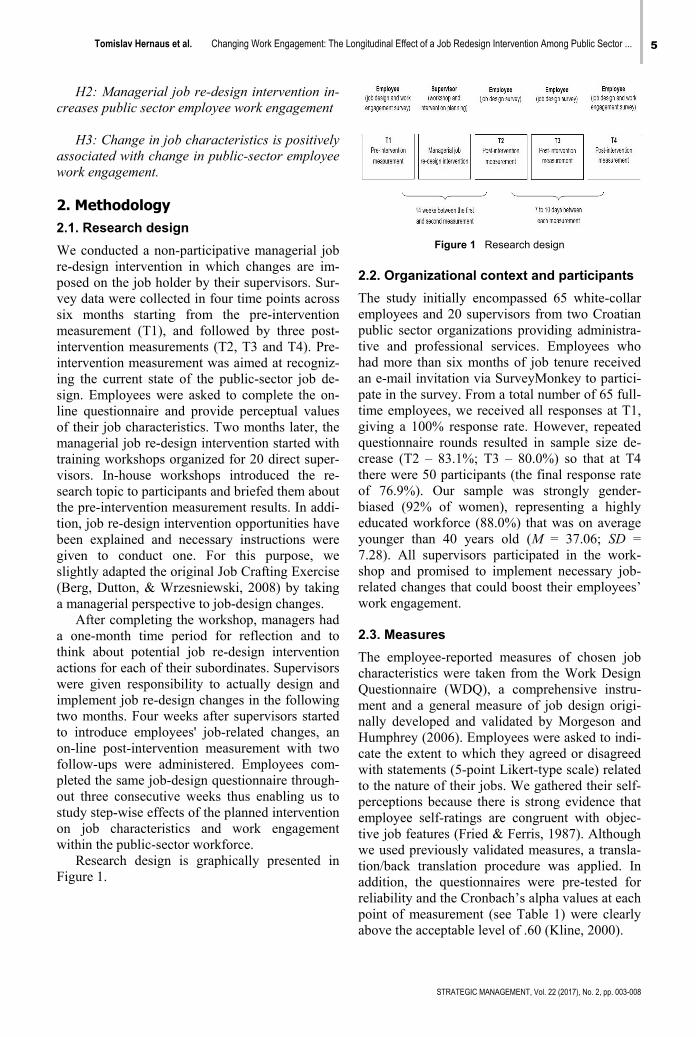
2. Methodology 2.1. Research design We conducted a non-participative managerial job re-design intervention in which changes are im-posed on the job holder by their supervisors. Sur-vey data were collected in four time points across six months starting from the pre-intervention measurement (T1), and followed by three post-intervention measurements (T2, T3 and T4). Pre-intervention measurement was aimed at recogniz-ing the current state of the public-sector job de-sign. Employees were asked to complete the on-line questionnaire and provide perceptual values of their job characteristics. Two months later, the managerial job re-design intervention started with training workshops organized for 20 direct super-visors. In-house workshops introduced the re-search topic to participants and briefed them about the pre-intervention measurement results. In addi-tion, job re-design intervention opportunities have been explained and necessary instructions were given to conduct one. For this purpose, we slightly adapted the original Job Crafting Exercise (Berg, Dutton, & Wrzesniewski, 2008) by taking a managerial perspective to job-design changes.
After completing the workshop, managers had a one-month time period for reflection and to think about potential job re-design intervention actions for each of their subordinates. Supervisors were given responsibility to actually design and implement job re-design changes in the following two months. Four weeks after supervisors started to introduce employees' job-related changes, an on-line post-intervention measurement with two follow-ups were administered. Employees com-pleted the same job-design questionnaire through-out three consecutive weeks thus enabling us to study step-wise effects of the planned intervention on job characteristics and work engagement within the public-sector workforce.
Research design is graphically presented in Figure 1.
Figure 1 Research design
2.2. Organizational context and participants The study initially encompassed 65 white-collar employees and 20 supervisors from two Croatian public sector organizations providing administra-tive and professional services. Employees who had more than six months of job tenure received an e-mail invitation via SurveyMonkey to partici-pate in the survey. From a total number of 65 full-time employees, we received all responses at T1, giving a 100% response rate. However, repeated questionnaire rounds resulted in sample size de-crease (T2 – 83.1%; T3 – 80.0%) so that at T4 there were 50 participants (the final response rate of 76.9%). Our sample was strongly gender-biased (92% of women), representing a highly educated workforce (88.0%) that was on average younger than 40 years old (M = 37.06; SD = 7.28). All supervisors participated in the work-shop and promised to implement necessary job-related changes that could boost their employees’ work engagement.
2.3. Measures The employee-reported measures of chosen job characteristics were taken from the Work Design Questionnaire (WDQ), a comprehensive instru-ment and a general measure of job design origi-nally developed and validated by Morgeson and Humphrey (2006). Employees were asked to indi-cate the extent to which they agreed or disagreed with statements (5-point Likert-type scale) related to the nature of their jobs. We gathered their self-perceptions because there is strong evidence that employee self-ratings are congruent with objec-tive job features (Fried & Ferris, 1987). Although we used previously validated measures, a transla-tion/back translation procedure was applied. In addition, the questionnaires were pre-tested for reliability and the Cronbach’s alpha values at each point of measurement (see Table 1) were clearly above the acceptable level of .60 (Kline, 2000).
6 Tomislav Hernaus et al. Changing Work Engagement: The Longitudinal Effect of a Job Redesign Intervention Among Public Sector ...
STRATEGIC MANAGEMENT, Vol. 22 (2017), No. 2, pp. 003-008
Work engagement was measured with the Utrecht Work Engagement Scale (UWES) devel-oped by Schaufeli et al. (2002). We also con-trolled for employee gender, employee age, su-pervisor gender, and supervisor age. All depend-ent and independent measures were based on em-ployee self-perceptions.
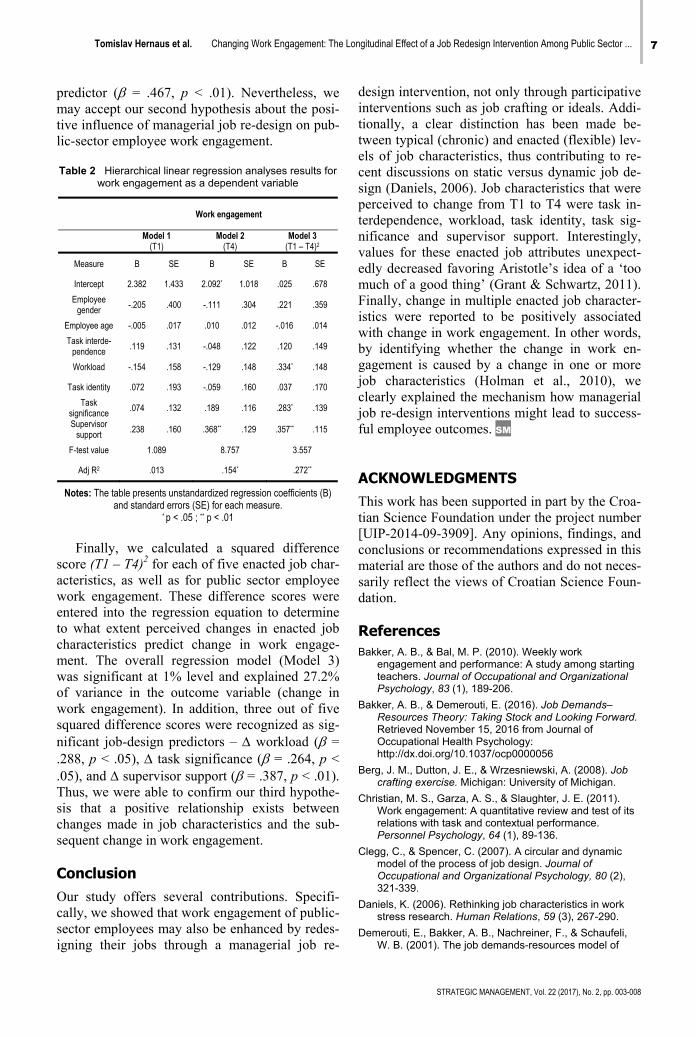
3. Results Table 1 shows descriptive results (means and standard deviations) for perceived job characteris-tics at four different time points (T1-T4), and for work engagement as a dependent variable at the starting and ending point. In addition, the statisti-cally significant results of the paired sample t-tests (T1-T2, T1-T3 and T1-T4) are marked with asterisk(s). Whereas the majority of job character-istics examined had a negative or constant time trend (except of work autonomy), findings re-flected no significant mean change in job com-plexity, information processing, role ambiguity and task variety, thus confirming their stability.
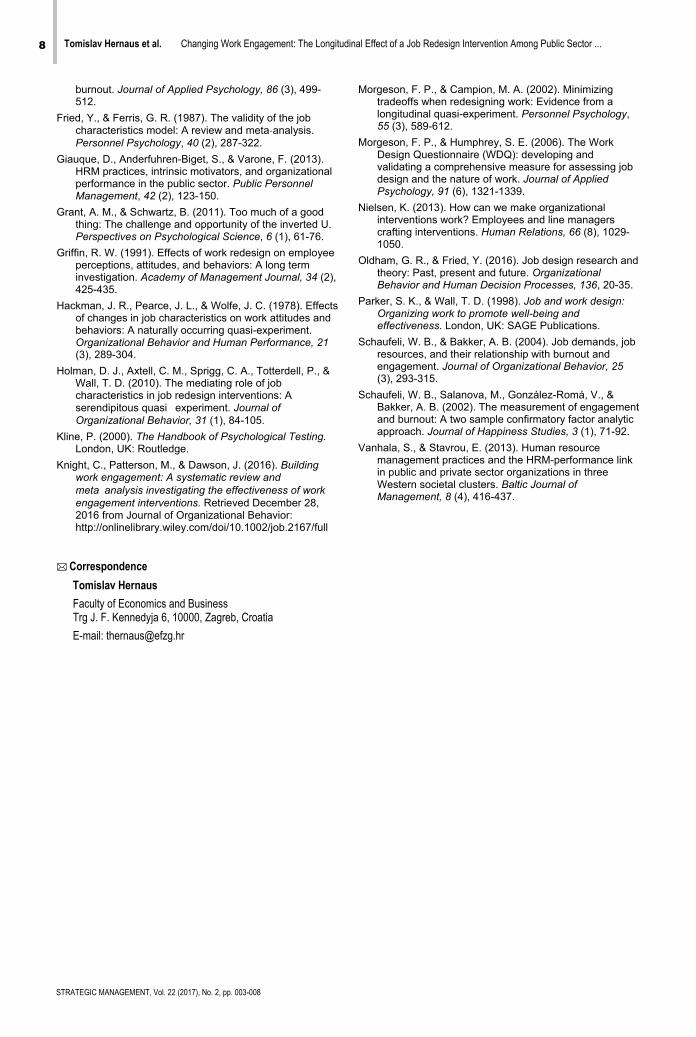
Next, we conducted hierarchical linear regression analyses (see Table 2) to determine whether a managerial job re-design intervention increases work engagement of public-sector employees. At T1 neither overall multiple regression model (Model 1) or some regression coefficients were
On the other hand, the largest absolute mean change (MT1 – MT4) was -.25 for both task identity and supervisor support. Other significant mean changes from T1 to T4 were -.20 for task signifi-cance and workload, and -.18 for task interde-pendence. Obviously, employees have acknowl-edged the job re-design intervention delivered by their supervisors, which eventually led to certain changes in one’s perception of their job character-istics. These changes were step-wise in nature and did not happen simultaneously for different (en-acted) job characteristics. Specifically, in step 1 (T1 T2) significant downward change was re-ported for task interdependence and workload; step 2 (T2 T3) was labeled with considerable decrease in task identity; and step 3 (T3 T4) was completed by noticeable decline in task sig-nificance and supervisor support. These episodic findings confirmed our first hypothesis that a managerial job re-design leads to significant changes in employee (enacted) job characteristics.
significant at 5% level. However, after the mana-gerial job re-design intervention was completed, at T4, the overall regression model (Model 2) be-came significant at 1% level and explained 15.4% of variance in work engagement, although only supervisor support was a significant job-design
Table 1 Descriptive statistics and scale reliability measures at each time point (T1-T4)
Tomislav Hernaus et al. Changing Work Engagement: The Longitudinal Effect of a Job Redesign Intervention Among Public Sector ... 7
STRATEGIC MANAGEMENT, Vol. 22 (2017), No. 2, pp. 003-008
predictor ( = .467, p < .01). Nevertheless, we may accept our second hypothesis about the posi-tive influence of managerial job re-design on pub-lic-sector employee work engagement.
Table 2 Hierarchical linear regression analyses results for
work engagement as a dependent variable
Work engagement
Model 1 (T1)
Model 2 (T4)
Model 3 (T1 – T4)2
Measure B SE B SE B SE
Intercept 2.382 1.433 2.092* 1.018 .025 .678
Employee gender -.205 .400 -.111 .304 .221 .359
Employee age -.005 .017 .010 .012 -.016 .014
Task interde-pendence .119 .131 -.048 .122 .120 .149
Workload -.154 .158 -.129 .148 .334* .148
Task identity .072 .193 -.059 .160 .037 .170
Task significance .074 .132 .189 .116 .283* .139
Supervisor support .238 .160 .368** .129 .357** .115
F-test value 1.089 8.757 3.557
Adj R2 .013 .154* .272**
Notes: The table presents unstandardized regression coefficients (B) and standard errors (SE) for each measure.
* p < .05 ; ** p < .01
Finally, we calculated a squared difference
score (T1 – T4)2 for each of five enacted job char-acteristics, as well as for public sector employee work engagement. These difference scores were entered into the regression equation to determine to what extent perceived changes in enacted job characteristics predict change in work engage-ment. The overall regression model (Model 3) was significant at 1% level and explained 27.2% of variance in the outcome variable (change in work engagement). In addition, three out of five squared difference scores were recognized as sig-nificant job-design predictors – workload ( = .288, p < .05), task significance ( = .264, p < .05), and supervisor support ( = .387, p < .01). Thus, we were able to confirm our third hypothe-sis that a positive relationship exists between changes made in job characteristics and the sub-sequent change in work engagement.
Conclusion Our study offers several contributions. Specifi-cally, we showed that work engagement of public-sector employees may also be enhanced by redes-igning their jobs through a managerial job re-
design intervention, not only through participative interventions such as job crafting or ideals. Addi-tionally, a clear distinction has been made be-tween typical (chronic) and enacted (flexible) lev-els of job characteristics, thus contributing to re-cent discussions on static versus dynamic job de-sign (Daniels, 2006). Job characteristics that were perceived to change from T1 to T4 were task in-terdependence, workload, task identity, task sig-nificance and supervisor support. Interestingly, values for these enacted job attributes unexpect-edly decreased favoring Aristotle’s idea of a ‘too much of a good thing’ (Grant & Schwartz, 2011). Finally, change in multiple enacted job character-istics were reported to be positively associated with change in work engagement. In other words, by identifying whether the change in work en-gagement is caused by a change in one or more job characteristics (Holman et al., 2010), we clearly explained the mechanism how managerial job re-design interventions might lead to success-ful employee outcomes. SM ACKNOWLEDGMENTS This work has been supported in part by the Croa-tian Science Foundation under the project number [UIP-2014-09-3909]. Any opinions, findings, and conclusions or recommendations expressed in this material are those of the authors and do not neces-sarily reflect the views of Croatian Science Foun-dation.
References Bakker, A. B., & Bal, M. P. (2010). Weekly work
engagement and performance: A study among starting teachers. Journal of Occupational and Organizational Psychology, 83 (1), 189-206.
Bakker, A. B., & Demerouti, E. (2016). Job Demands–Resources Theory: Taking Stock and Looking Forward. Retrieved November 15, 2016 from Journal of Occupational Health Psychology: http://dx.doi.org/10.1037/ocp0000056
Berg, J. M., Dutton, J. E., & Wrzesniewski, A. (2008). Job crafting exercise. Michigan: University of Michigan.
Christian, M. S., Garza, A. S., & Slaughter, J. E. (2011). Work engagement: A quantitative review and test of its relations with task and contextual performance. Personnel Psychology, 64 (1), 89-136.
Clegg, C., & Spencer, C. (2007). A circular and dynamic model of the process of job design. Journal of Occupational and Organizational Psychology, 80 (2), 321-339.
Daniels, K. (2006). Rethinking job characteristics in work stress research. Human Relations, 59 (3), 267-290.
Demerouti, E., Bakker, A. B., Nachreiner, F., & Schaufeli, W. B. (2001). The job demands-resources model of
8 Tomislav Hernaus et al. Changing Work Engagement: The Longitudinal Effect of a Job Redesign Intervention Among Public Sector ...
STRATEGIC MANAGEMENT, Vol. 22 (2017), No. 2, pp. 003-008
burnout. Journal of Applied Psychology, 86 (3), 499-512.
Fried, Y., & Ferris, G. R. (1987). The validity of the job characteristics model: A review and meta-analysis. Personnel Psychology, 40 (2), 287-322.
Giauque, D., Anderfuhren-Biget, S., & Varone, F. (2013). HRM practices, intrinsic motivators, and organizational performance in the public sector. Public Personnel Management, 42 (2), 123-150.
Grant, A. M., & Schwartz, B. (2011). Too much of a good thing: The challenge and opportunity of the inverted U. Perspectives on Psychological Science, 6 (1), 61-76.
Griffin, R. W. (1991). Effects of work redesign on employee perceptions, attitudes, and behaviors: A long term investigation. Academy of Management Journal, 34 (2), 425-435.
Hackman, J. R., Pearce, J. L., & Wolfe, J. C. (1978). Effects of changes in job characteristics on work attitudes and behaviors: A naturally occurring quasi-experiment. Organizational Behavior and Human Performance, 21 (3), 289-304.
Holman, D. J., Axtell, C. M., Sprigg, C. A., Totterdell, P., & Wall, T. D. (2010). The mediating role of job characteristics in job redesign interventions: A serendipitous quasi�experiment. Journal of Organizational Behavior, 31 (1), 84-105.
Kline, P. (2000). The Handbook of Psychological Testing. London, UK: Routledge.
Knight, C., Patterson, M., & Dawson, J. (2016). Building work engagement: A systematic review and meta�analysis investigating the effectiveness of work engagement interventions. Retrieved December 28, 2016 from Journal of Organizational Behavior: http://onlinelibrary.wiley.com/doi/10.1002/job.2167/full
Morgeson, F. P., & Campion, M. A. (2002). Minimizing tradeoffs when redesigning work: Evidence from a longitudinal quasi-experiment. Personnel Psychology, 55 (3), 589-612.
Morgeson, F. P., & Humphrey, S. E. (2006). The Work Design Questionnaire (WDQ): developing and validating a comprehensive measure for assessing job design and the nature of work. Journal of Applied Psychology, 91 (6), 1321-1339.
Nielsen, K. (2013). How can we make organizational interventions work? Employees and line managers crafting interventions. Human Relations, 66 (8), 1029-1050.
Oldham, G. R., & Fried, Y. (2016). Job design research and theory: Past, present and future. Organizational Behavior and Human Decision Processes, 136, 20-35.
Parker, S. K., & Wall, T. D. (1998). Job and work design: Organizing work to promote well-being and effectiveness. London, UK: SAGE Publications.
Schaufeli, W. B., & Bakker, A. B. (2004). Job demands, job resources, and their relationship with burnout and engagement. Journal of Organizational Behavior, 25 (3), 293-315.
Schaufeli, W. B., Salanova, M., González-Romá, V., & Bakker, A. B. (2002). The measurement of engagement and burnout: A two sample confirmatory factor analytic approach. Journal of Happiness Studies, 3 (1), 71-92.
Vanhala, S., & Stavrou, E. (2013). Human resource management practices and the HRM-performance link in public and private sector organizations in three Western societal clusters. Baltic Journal of Management, 8 (4), 416-437.
Correspondence
Tomislav Hernaus
Faculty of Economics and Business Trg J. F. Kennedyja 6, 10000, Zagreb, Croatia
E-mail: [email protected]
STRATEGIC MANAGEMENT, Vol. 22 (2017), No. 2, pp. 009-017 UDC 005.963(470+571) 005.963(476)
Received: April 10, 2016 Accepted: May 16, 2017
Internal Training of Personnel in Russia and Belarus: The Content and Effectiveness1
Tatiana Stuken Dostoevsky Omsk State University, Omsk, Russia
Olga Burtseva Dostoevsky Omsk State University, Omsk, Russia
Abstract The report presents the results of internal training analysis, conducted in 2015 and based on materials of thesurvey of executives and employees of industrial enterprises in Russian Federation and the Republic of Bela-rus. The main results of the study:
1. The characteristics of the internal training organization on the contents of the formed skills and the de-gree of their specificity for different groups of employees were obtained. In both countries the trainingprograms are primarily focused on the formation of professional skills. Much less attention is paid to development of cognitive and social competencies, which are relevant for executives and specialists.Most of the formed skills are universal. The degree of specificity of skills is maximum for workers andminimal for executives, while the prevalence of specific programs in Belarus is generally higher.
2. The motives for participation of personnel in internal training were identified. The main motives of Rus-sian workers are increase of competitiveness and development, while Belarusian workers are more fo-cused on continued employment. Continued employment is more typical for employees receiving spe-cific training. The prevalence of the motive of increasing the competitiveness in the labor market in-creases considerably with the growth of universality of the obtained competences.
3. The effectiveness of internal training through the use of subjective evaluations of employees and em-ployers was evaluated. The efficiency of competences formation depends on the size of the organiza-tion, its stage of life cycle, focusing on the achievement of strategic goals in the learning process andthe decision makers about the employee training.
4. Belarusian employers more often note the non-obvious effect of training and dismissal of the trained employees as a risk of investments in human capital.
Keywords Human capital, Internal training of personnel. 1 The research is carried out with the financial support of Russian Foundation for Humanities, №14-22-01008
Introduction The scale and speed of changes in modern econ-omy place high demands on internal training, the content and the impact of which largely affects the success of the organization. In this case, inter-nal training of personnel in different countries has a distinctive national identity.
The focus of the present study is a comparative analysis of the characteristics of internal training in two countries – Russia and Belarus. They have
common historical and cultural roots, but they use different principles and approaches in economic and social policy over the past two decades. Ob-viously, this situation should be reflected in policy of additional training, because the differences in state regulation of the economy and in the educa-tional sphere form the different structure of the demand of employers for personnel competences and methods of their formation.
The relevance of the study on the example of Russian and Belarusian companies is due to the
10 Tatiana Stuken et al. Internal Training of Personnel in Russia and Belarus: The Content and Effectiveness
STRATEGIC MANAGEMENT, Vol. 22 (2017), No. 2, pp. 009-017
fact that most often this problem is deeply inves-tigated at the level of one of these countries. The comparison will allow not only to assess the over-all condition and dynamics of changes in the processes of internal training, but also to under-stand which characteristics of training are specific to post-Soviet economies, and which characteris-tics are the reflections of differences in public policy.
In addition, in both countries, the volume of internal training is at a relatively low level. For example, according to the BEEPS survey, the share of small and medium enterprises, training staff in Russia varies from 4.8% (unskilled work-ers) to 15.7% (non-production staff) and 25.0% (skilled workers). Similar estimates for Belarus are slightly higher: employers provide training to 9.2% of unskilled workers, 11.7% of non-productive staff and 41.2% of skilled workers (Gimpelson & Kapelyushnikov, 2011). This is comparable with rates in the countries of Eastern Europe, but it is much lower than in developed countries.
The aim of this work is the comparative evaluation of internal training of personnel in Russia and Belarus from the standpoint of the content of generated knowledge and skills, as well as the effectiveness of programs.
1. Literature review Problems of internal training recently attracted the attention of researchers in various fields of scien-tific knowledge: economists, sociologists, man-agement professionals. Considering the analysis of studies on internal training of personnel, we can distinguish two independent directions of re-search.
The first of them, quality direction, is devoted to the study of the functioning of systems of inter-nal training in organizations and their impact on the quality of the workforce of the organization. Here the focus is placed on the analysis of the structures involved in the internal training, tech-niques and technologies to determine the need for training, its organization, providing feedback dur-ing and after the training. Often such research focuses on the search for effective methods of functioning of the internal training systems and development of guidance for companies to organ-ize personnel training. Approaches to assessing the impact of learning generally rely on the as-sessment of the degree of achievement of goals and use simplified performance evaluation of teaching, which, however, are quite intuitive and
easy to use, although they do not always allow to obtain the accurate and correct assessment of the economic result.
The second direction of research examines the quantitative aspects of the effectiveness of inter-nal training. The basis for these is the human capi-tal theory of G. Becker. Such studies are based on econometric methods and are aimed at assessing the impact of training (usually on the basis of the equation of wages of J. Mincer), as well as the evaluation of the probability of promotion of an employee, dismissal, etc. The use of modern econometric methods allows obtaining a more accurate assessment of the impact of learning, but it does not always involve developing a detailed practical recommendations.
Analyzing the existing literature on the effec-tiveness of internal training in Russia and in Bela-rus, it should be noted that most of the publica-tions are focused in the plane of analysis of the qualitative characteristics of education and a sub-stantially smaller part is devoted to quantitative assessments of the impact of training. Quantitative calculations were performed exclusively on the Russian data. This article discusses the main find-ings obtained by the researchers according to the analysis of internal training of personnel and its impact in Russia and in Belarus.
Researchers from both countries recorded a number of problems associated with the shortage of workers with the skills demanded by employ-ers. According to cross-country studies, in Belarus among the main obstacles to doing business in the country personnel qualification was put in the second place (and for firms employing from 20 to 99 people – the first place) (The World Bank, 2014a), while Russian employers put this issue to the sixth place (businesses with more than 20 people – the third place) (The World Bank, 2014b).
The authors of the report “Developing skills for innovative growth in the Russian Federation” mention the existence of imbalance between the skills generated by the national education system and skills required in the labor market. Employers attribute the shortage not only with the quality of the actual personnel training, but also with cogni-tive and social skills. For employees in manage-rial positions such skills are the ability to make decisions (including nonstandard decisions), lead-ership, ability to work with people, knowledge of foreign languages, openness to new ideas. For specialists such skills are the ability to make deci-sions, the ability to work both independently and
Tatiana Stuken et al. Internal Training of Personnel in Russia and Belarus: The Content and Effectiveness 11
STRATEGIC MANAGEMENT, Vol. 22 (2017), No. 2, pp. 009-017
in a team. The lack of skills among workers is related to professional skills, lack of good faith, the ability to solve problems (Vasiliev, et al., 2013). It is important that the deficit of skills ob-served by employers, is not related to the unfavor-able financial situation of the organizations and, consequently, uncompetitive wages.
The researchers of the Belarusian labor market also suggest a shortage of workers with the re-quired competencies. According to the survey of employers in the private sector of the country, one in two believes that his subordinates are lacking of professional skills, every third captures the lack of self-organization, and every fourth notes that his subordinates have the problems of communi-cation (Soroka, 2004).
Thus, both the Russian and Belarusian em-ployers noted the need for the formation not only professional competences, but also the need for general skills.
A number of studies have undertaken an analysis of the demand of the Russian and Belaru-sian organizations on the content of internal train-ing. Most employers train their employees on general programs that are also in demand at other enterprises. Only a quarter of employers form specific human capital in internal training pro-grams (Lazareva, Denisova, & Tsukhlo, 2006). There are two groups of problems in the analysis of the content of the training.
Firstly, despite the declared deficit of cogni-tive and social competencies, employers prefer to train personnel on the programs of professional skills development. The authors of the previously mentioned report noted: “the training is focused mainly on the development of specific profes-sional (technical) skills”. This task is devoted to more than 60% of the programs for specialists and workers. Much less attention is paid to training aimed at developing behavioral and social skills. Thus, less than 20% of the programs for managers and less than 30% of the programs for specialists are dedicated to the development of communica-tion skills (ability to work with people).Even less attention is paid to the development of cognitive skills of a high order for managers and specialists. Meanwhile, less than 25% of training programs are aimed at the development of scarce skill for specialists – ability to solve problems (Vasiliev, et al., 2013). According to Soroka (2004), Belaru-sian employers also train mostly professional competencies. More than a half (58%) of business leaders in the private sector believe that the train-ing should be focused on a particular practical
tasks in the specialty and a quarter of them think that highly specialized training in the workplace is the most effective.
Secondly, there is the issue of cooperation with educational organizations that are not inter-ested in providing training programs adapted to specific organizations. Often attempts to interact with educational institutions on this subject do not lead to success. This fact forces the actively de-veloping organization to solve the problem of the maintenance of internal training on their own, as well as to create their own training centers, corpo-rate universities and other structures (Vasiliev, et al., 2013).When answering the question about the effectiveness of different forms of employee train-ing, employers give obvious preference to the learning in the workplace (mentoring), and courses organized at the enterprise (Lazareva, Denisova, & Tsukhlo, 2006).
According to Russian authors, despite the de-velopment of internal training, the gap between the supply of skills and the required skills for middle career workers is even higher than for workers at the beginning of their career, which indicates low effectiveness of continuing educa-tion programs and internal development of per-sonnel (Vasiliev, et al., 2013).
A number of studies in Russia provide a quan-titative assessment of the effectiveness of training programs. Acting rationally, the employer will invest in internal training of personnel, providing that the benefits from training will be higher than the cost of it. Higher productivity of the worker after training can be the basis for salary increase and career advancement. However, the economic impact of investments in internal training of per-sonnel is not so clear. The training aimed at the formation of general skills increases the competi-tiveness of the employee and makes his transition to another organization more likely. On the other hand, the acquisition (as the result of learning) of specific skills that are in demand only for that employer restricts wage growth and inter-firm mobility of trained workers.
Most works on the measurement of the train-ing effectiveness analyze the impact of learning through the increase of the employee’s salary on the basis of the equation of J. Mincer. Significant differentiation of estimates for Russia is not only due to different time periods and samples, but it is also due to differences in the specifications of econometric models (Berger, Earle, & Sabirianova, 2001; Lazareva O., 2006; Tan, Savchenko, Gimpelson, Kapelyushnikov, &
12 Tatiana Stuken et al. Internal Training of Personnel in Russia and Belarus: The Content and Effectiveness
STRATEGIC MANAGEMENT, Vol. 22 (2017), No. 2, pp. 009-017
Lukyanova, 2007). One of the most accurate as-sessments of the impact of internal training in Russia was presented by Travkin (2014), who estimates that wages of the Russian worker after training increase by 8.3%.
In the work of Alexandrova (2014) an attempt was made to evaluate the impact of internal train-ing on the basis of one of Russian industrial en-terprises. Having high precision data on training, wages, characteristics of workers, the author was able to compare the impact of different types of training – apprenticeship, courses, advanced train-ing and professional retraining.
The effects of internal training from the view-point of the mobility of personnel were identified by Berger, Earl and Sabirianova (2001).
Despite the attention paid to the analysis of in-ternal training of personnel and its effectiveness in both countries, a number of important issues re-quire further study. In addition, the analysis shows that the most part of research into the effective-ness of internal training was performed on Rus-sian data, while the assessment of effectiveness of internal training in Belarus requires further study.
2. Research methodology The empirical base of the research was the survey materials of the Russian and Belarusian experts. From the Belarusian side the team of Mogilev State A. Kuleshov University under the guidance of Professor N. Makovskaya participated in the expert survey.
The experts were the heads of departments of personnel management and experts whose func-tional responsibilities include organization of in-ternal training. The authors surveyed 159 experts representing Russian and Belarusian industrial enterprises, located in fourteen regions (Moscow, St. Petersburg, Krasnoyarsk and Altai territory, Ivanovo, Kaluga, Kemerovo, Omsk, Sverdlovsk, Tomsk, Tyumen, Chelyabinsk, Yaroslavl and Mogilev regions).The training content was ana-lyzed in the following areas: causes of learning; formed skills; the degree of specificity of skills; the duration of programs, allowing estimating the scope and depth of the formed skills.
In preparing the survey instrument, the authors took the list of generated skills as a basis (Vasiliev, et al., 2013).
The effectiveness of training was evaluated by the achievement of its objectives. In addition, ex-perts were asked questions related to problems in the field of internal training of employees.
Processing of the results was carried out using the methods of descriptive statistics and regres-sion analysis.
3. The results of the research 3.1. Analysis of the programs content The experts' answers to the question about the significance of the factors determining the need for training are presented in table 1. The signifi-cance of each factor was assessed on a five-point system from 1 (absolutely unimportant) to 5 (very important).
Table 1 Average values of importance of reasons
determining the need for training of personnel
Factor
The average value
(standard deviation)
ANOVA
Russia Belarus F Significance Implementation of requirements of supervisory authorities
3.063 (1.595)
3.589 (1.289)
5.056 0.026
The alignment of workers’ knowledge and changes in legislation
3.619 (1.361)
3.802 (1.240)
0.749 0.388
The alignment of workers’ knowledge and requirements of engineering and technology
3.810 (1.105)
4.043 (1.128)
1.635 0.203
Training the employees to perform other functional du-ties
3.730 (1.066)
3.352 (1.393)
3.307 0.071
Implementation of programs determined by the development strategy of the organization
3.857 (1.390)
3.276 (1.403)
6.321 0.013
Source: the authors
The average values of all factors are located in
a fairly narrow range – from 3.063 to 4.043 points. However, the priorities of the Russian and Belarusian employers are a little different. Ac-cording to Russian data the leading factors are associated with the strategic development of com-panies and change of engineering and technolo-gies. In Belarus, along with the change of engi-
neerfor in lewhiwaspertof vthe tionmenthorstratthe sia.
TtrainFigu
Figdurin
tio
T
the of pgivecorrtioncienprocattenconn
Afesstimetentatedingnployaimity t
K
W
A
A
A
In
C
ring and technalignment of wegislation. Thech Russian em
s the least sigts. When compvariance, statisestimates of th
ns of the five: ntation the rerities for Belategy of organiemployees to
The overall dning in the coure 1.
gure 1 The freqng internal traininon of the number
The structure process of int
personnel. Whe priority to presponds to thned report, thant in this groucess of educatntion to overcnected with thA large percensional competee, only half oftion to the ford with communess to changyers use inte
med at the formto work in a te
0
Knowledge of …
Leadership
Willingness to …
Ability to solve …
Ability to plan …
Ability to work …
ndependence
Communicatio…
Professional …
Tatiana
nology, the pworkers’ knowe factor of stramployers put gnificant for tparing differenstically signifihe factors are the higher im
equirements oarus, the highization developerform new
distribution ofontext of the
quency of the comng for groups of pr of Russian and
Source: the author
of the compternal traininghen training wprofessional c
he output of that these skills up of personnetion there is ncome the lack
he ability to sontage of organences of execuf the companirmation of counications, lea
ge. Also less ternal programmation of indepeam.
0 0.5
a Stuken et al. I
priority is the wledge and chaategic developm
in the first pthe Belarusiannces using anaicant differencfixed at three
mportance of imof supervisoryher importanc
opment and trafunctions for
f focus of intskills is show
mpetencies formapersonnel (as a pBelarusian expe
rs
petences formeg differs for grworkers, emplcompetence, whe previously are the most
el. However, inot given suffik of competenlve problems. nizations formutives. At the ies and less pampetencies asadership, and than a half of
ms for speciapendence and
workers
speciali
executiv
nternal Training of P
need anges ment, place, n ex-alysis ces in posi-
mple-y au-ce of aining
Rus-
ternal wn on
ation propor-erts)
ed in roups oyers
which men-defi-
in the ficient ncies,
m pro-same
ay at-ssoci-will-
f em-alists,
d abil-
Trest dfor m
Tab
The
coIn thisonlyIn orgsimilaIn anTotal
Th
to thhas cpersomoreorgancompdegrenotedtimestives)signifferensuch
▪
▪
s
ists
ves
Personnel in Russia a
STRATE
raining progradegree of specmanagers have
ble 2 Specificityprocess
e ability to use acquired
ompetences s organization
ganizations of ar profile y organization
his structure oe nature of thcross-country onnel the Bele possibilities tnization, and, petences are uee of specificitd more often (s for specialis). In all casesficant at the le
ntiation may bas:
greater concproduction iterprises, wcompetition with certain a feature ocountries. UBelarus hascludes not onotice of restwo weeks),untary resigncontract waperiod (articRepublic ofment contraemployees Republic oTherefore, inthe external solescence provides adployer, who
and Belarus: The Co
EGIC MANAGEMENT, Vo
ams for workecificity, and tthe least degre
y of the competens of internal train
Group o
workers spec
24.1 14
48.1 47
27.8 38100 10
of educationalhe formed comdifferences. F
larusian emplto use compet
consequentlyuniversal. For ty of knowled(in 3.0 times fosts and in 2.8 s, the Chi-squaevel p<0.01. Pbe caused by
centration andin Belarus, lar
which leads toin the labor mcompetencies
of the labor lUnlike Russia, s additional ronly a longer psignation (one, but also the pnations only i
as concluded cle 40 of the Lf Belarus). Fixact does not of
(The Laborf Belarus Non the case of henvironment
of knowledgedditional proteo receives mo
ontent and Effectiven
ol. 22 (2017), No. 2, pp. 0
ers have the grtraining progree of specificit
nces formed in thing, %
of personnel
cialists executiv
4.2 12.6
7.3 22.4
8.5 65.000 100
Source: the au
l programs is mpetencies, buFor all groupoyers note mtences only iny, much less
example, a hdge in Belarus for workers, in
times for exeare is statisticProbably, this
various reas
d centralizationrger industrialo a lessening
market for works, legislation of the resignatio
restrictions. It period of a wrie month insteapossibility of f the employmfor an indefi
Labor code ofxed-term empffer this optior Code of o. 296-z, 19high variabilitand the rapid
e, this restricection of the ore guarantees
ness 13
009-017
reat-rams ty.
he
ves
6
4
0
uthors
due ut it s of
much n the
the high was
n 4.4 ecu-cally dif-ons,
n of l en-g of kers
the on in in-itten
ad of vol-
ment inite f the ploy-n to the
999). ty of ob-
ction em-s of
14 Tat
STRAT
T
its donlyskilof founevalunamsubsskilindiganon t
Ta
Du
Up siveFroFroOveTot
A
beenup Belaallothe not fesswelTakfactprishigh
TgramAccallosiona sicourprofRusalthwor
iana Stuken et al.
TEGIC MANAGEMENT, V
the use of ganization.
The content oduration. Indey give narrowls, but it also the problemsndation. At thluate trainingmbiguously postitution of tls with the thirect relationshization. The dthe groups of p
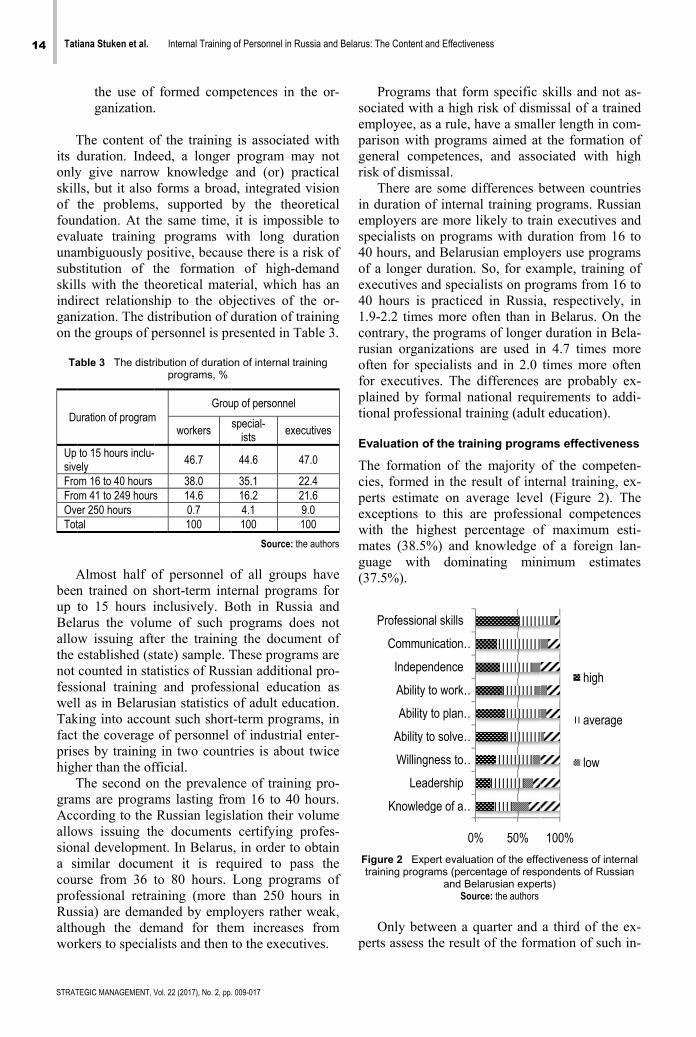
able 3 The distr
uration of program
to 15 hours inclu-ely
om 16 to 40 hours om 41 to 249 hourser 250 hours tal
Almost half on trained on sto 15 hours iarus the voluw issuing aftestablished (stcounted in sta
sional trainingl as in Belarus
king into accout the coverage es by trainingher than the ofThe second onms are progracording to the ws issuing th
nal developmeimilar documrse from 36 tfessional retrassia) are demahough the demrkers to specia
Internal Training
Vol. 22 (2017), No. 2, pp.
f formed comp.
of the trainingeed, a longer w knowledge
forms a broads, supported bhe same time, g programs wositive, becauthe formation
heoretical matehip to the objistribution of dpersonnel is pr
ribution of duratioprograms, %
m Grou
workers s
46.7
38.0s 14.6
0.7100
of personnel oshort-term inteinclusively. B
ume of such per the trainingtate) sample. Tatistics of Russg and professsian statistics unt such shortof personnel
g in two countfficial. n the prevalenms lasting froRussian legis
he documents ent. In Belarus
ment it is reqto 80 hours. aining (more anded by emplmand for thelists and then t
of Personnel in Rus
. 009-017
petences in th
is associatedprogram mayand (or) pra
d, integrated vby the theorit is impossib
with long durse there is a ri
n of high-demerial, which h
bjectives of thduration of traresented in Tab
on of internal train
up of personnel
special-ists
execu
44.6 47
35.1 2216.2 214.1 9.100 10
Source: the
of all groups ernal program
Both in Russiaprograms doeg the documeThese programsian additionalional educatioof adult educa
t-term programof industrial etries is about
nce of trainingom 16 to 40 hlation their vo
certifying prs, in order to oquired to pasLong programthan 250 houloyers rather wem increases to the executiv
ssia and Belarus: The
he or-
d with y not
actical vision retical ble to ration isk of mand
has an he or-aining ble 3.
ning
utives
7.0
2.4 .6 0
00
authors
have ms for a and s not
ent of ms are l pro-on as ation.
ms, in enter-twice
g pro-hours. olume rofes-obtain s the ms of urs in weak, from
ves.
Prsociaemplparisogenerrisk o
Thin duemplspeci40 hoof a execu40 ho1.9-2contrrusianoftenfor eplaintiona
Evalu
The cies, perts excepwith matesguage(37.5
Figurtrain
O
perts
Pr
e Content and Effect
rograms that fated with a higoyee, as a ruleon with progrral competencof dismissal. here are some
uration of interoyers are morialists on progours, and Belalonger duratioutives and speours is practi
2.2 times morerary, the progrn organization
n for specialistexecutives. Thed by formal
al professional
uation of the tr
formation of formed in theestimate on
ptions to this the highest
s (38.5%) ande with dom
5%).
re 2 Expert evaling programs (pe
and S
Only between aassess the res
Knowledge of a
Leadership
Willingness to
Ability to solve
Ability to plan
Ability to work
Independence
Communication
rofessional skills
tiveness
form specific gh risk of disme, have a smalrams aimed atces, and asso
e differences brnal training pre likely to tragrams with duarusian employon. So, for exaecialists on proced in Russiae often than inrams of longerns are used ints and in 2.0
he differences national requtraining (adul
raining progra
the majority e result of inteaverage levelare professio
percentage ofd knowledge
minating min
luation of the effeercentage of respBelarusian expe
Source: the authors
a quarter and sult of the form
0% 50%
…
…
…
…
…
…
skills and notmissal of a trailer length in ct the formationociated with h
between countprograms. Rusain executives uration from 1yers use programple, traininograms from 1a, respectivelyn Belarus. Onr duration in Bn 4.7 times mtimes more oare probably
uirements to at education).
ams effectiven
of the compeernal training,l (Figure 2). onal competenf maximum eof a foreign
nimum estim
ectiveness of intepondents of Russrts)
a third of themation of such
100%
high
average
low
t as-ined
com-n of high
tries ssian
and 6 to
rams g of 6 to
y, in n the Bela-more often
ex-addi-
ness
eten- ex-The nces esti-lan-
mates
ernal sian
ex-h in-
e
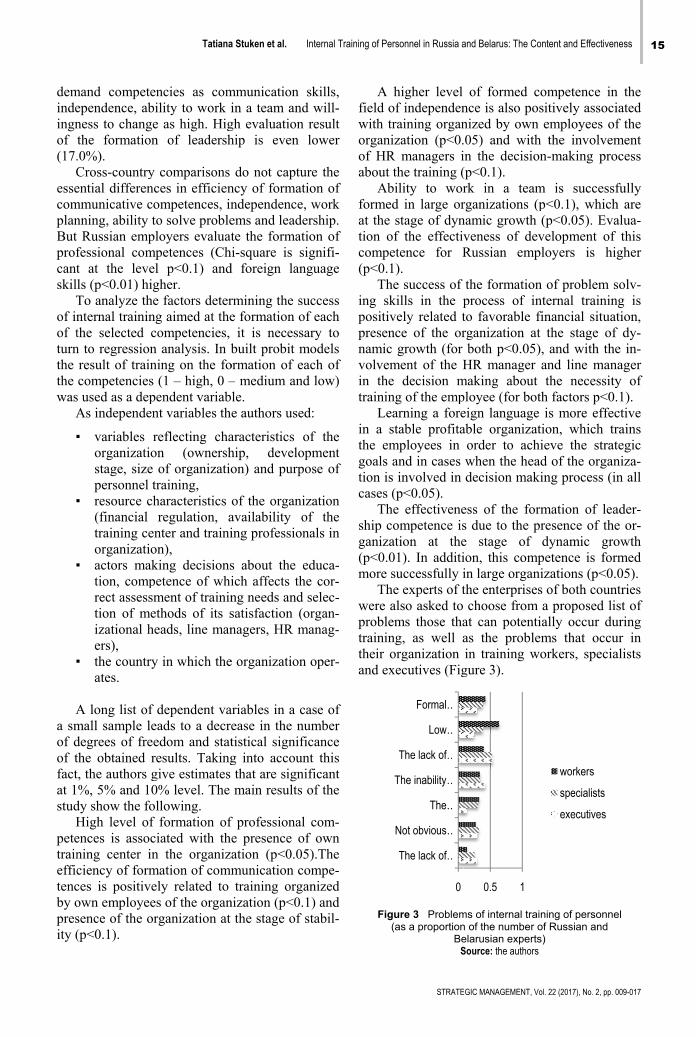
demindeingnof (17.
CessecomplanBut profcantskil
Tof inof tturnthe the was
A
▪
▪
▪
▪
A
a smof dof tfactat 1stud
Hpetetraineffictencby opresity (
mand competeependence, abness to changethe formation.0%). Cross-countryential differenc
mmunicative conning, ability t
Russian empfessional comt at the levels (p<0.01) higTo analyze thenternal traininthe selected cn to regressionresult of traincompetencies
s used as a depAs independen
▪ variables rorganizatiostage, size personnel t
▪ resource ch(financial training cenorganizatio
▪ actors maktion, comprect assessmtion of meizational heers),
▪ the countryates.
A long list of mall sample ledegrees of freethe obtained rt, the authors g%, 5% and 10
dy show the foHigh level of ences is assocning center inciency of formces is positiveown employeesence of the or(p<0.1).
Tatiana
encies as comility to work ie as high. Hign of leadersh
y comparisons ces in efficienompetences, into solve probleloyers evaluat
mpetences (Chl p<0.1) andgher. e factors deter
ng aimed at thecompetencies, n analysis. In bning on the fo
(1 – high, 0 –pendent variabnt variables the
reflecting chaon (ownersh
of organizatiotraining, haracteristics oregulation, a
nter and trainion), king decisionspetence of whiment of traininethods of its seads, line man
y in which the
dependent vaeads to a decreedom and statresults. Takinggive estimates 0% level. The ollowing. f formation of ciated with then the organizamation of commely related to es of the organrganization at
a Stuken et al. I
mmunication sin a team and
gh evaluation rhip is even l
do not capturncy of formatindependence, ems and leaderte the formatii-square is sig
d foreign lang
rmining the sue formation of
it is necessabuilt probit m
ormation of ea– medium andle. e authors used
aracteristics ohip, developon) and purpo
of the organizavailability ofing profession
s about the edich affects theng needs and ssatisfaction (onagers, HR ma
e organization
ariables in a caease in the nutistical significg into accounthat are signifmain results o
f professional e presence ofation (p<0.05munication cotraining orga
nization (p<0.1the stage of s
nternal Training of P
skills, will-
result lower
re the on of work rship. on of gnifi-guage
uccess f each ary to
models ach of d low)
d:
of the pment ose of
zation f the
nals in
duca-e cor-selec-
organ-anag-
oper-
ase of umber cance
nt this ficant of the
com-f own ).The
ompe-anized 1) and stabil-
Afield with organof HRabout
Aformeat thetion comp(p<0.
Thing spositipresenamivolvein thtraini
Lin a the egoalstion icases
Thship ganiz(p<0.more
Thwere probltrainitheir and e
Fi
Personnel in Russia a
STRATE
A higher level of independentraining organ
nization (p<0.R managers it the training (
Ability to wored in large ore stage of dynof the effectiv
petence for R.1). he success of skills in the pively related t
ence of the orc growth (for ement of the Hhe decision ming of the empearning a forestable profita
employees in s and in cases is involved in s (p<0.05). he effectivenecompetence is
zation at the.01). In additi
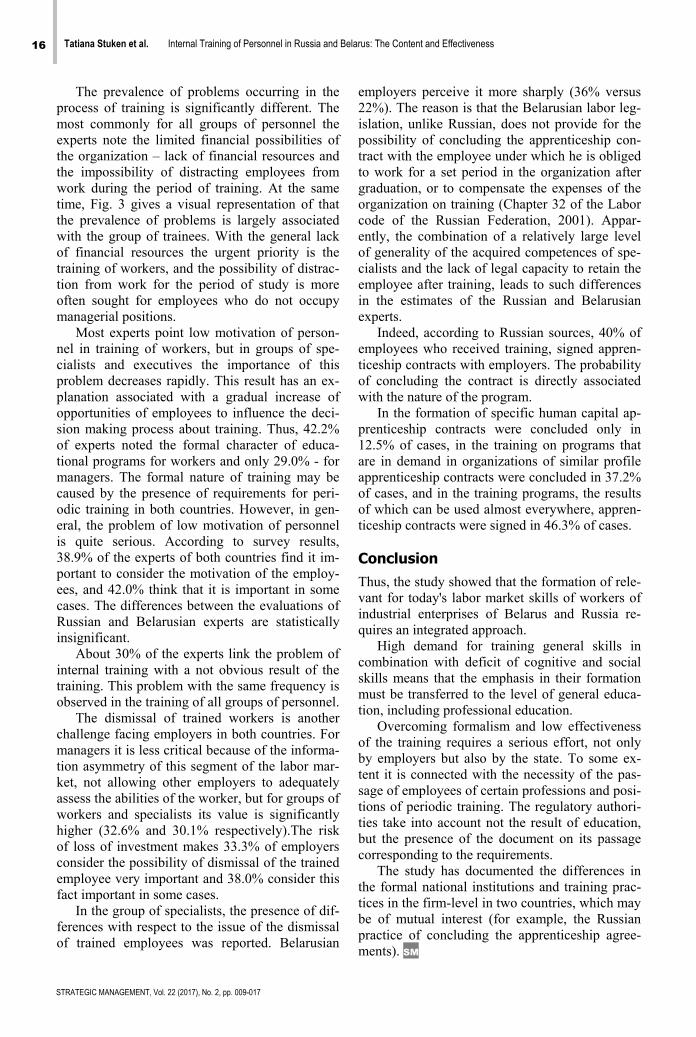
e successfully ihe experts of talso asked to
lems those thaing, as well aorganization
executives (Fig
gure 3 Problem(as a proportion
BeS
0
The lack of …
Not obvious …
The …
The inability …
The lack of …
Low …
Formal …
and Belarus: The Co
EGIC MANAGEMENT, Vo
of formed conce is also posnized by own .05) and within the decision(p<0.1). rk in a teamrganizations (pnamic growth veness of devRussian emp
the formationprocess of into favorable firganization at both p<0.05)
HR manager making about ployee (for boteign language able organizat
order to achiwhen the headdecision maki
ess of the forms due to the pre stage of ion, this compin large organithe enterpriseschoose from
at can potentias the problein training wo
gure 3).
ms of internal train of the number oelarusian expertsSource: the authors
0.5 1
ontent and Effectiven
ol. 22 (2017), No. 2, pp. 0
ompetence in sitively associemployees of
h the involvemn-making pro
m is successfp<0.1), which(p<0.05). Evavelopment of loyers is hig
n of problem snternal trainingfinancial situat
the stage of , and with theand line manathe necessity
th factors p<0.is more effec
tion, which trieve the stratd of the organing process (in
mation of learesence of thedynamic gro
petence is formizations (p<0.0s of both counta proposed lis
ially occur dums that occuorkers, specia
ning of personneof Russian and s)
workers
specialists
executives
ness 15
009-017
the ated f the ment cess
fully h are alua-
this gher
solv-g is tion, dy-
e in-ager y of 1).
ctive rains egic
niza-n all
ader-e or-owth med 05). tries st of
uring ur in alists
el
16 Tatiana Stuken et al. Internal Training of Personnel in Russia and Belarus: The Content and Effectiveness
STRATEGIC MANAGEMENT, Vol. 22 (2017), No. 2, pp. 009-017
The prevalence of problems occurring in the process of training is significantly different. The most commonly for all groups of personnel the experts note the limited financial possibilities of the organization – lack of financial resources and the impossibility of distracting employees from work during the period of training. At the same time, Fig. 3 gives a visual representation of that the prevalence of problems is largely associated with the group of trainees. With the general lack of financial resources the urgent priority is the training of workers, and the possibility of distrac-tion from work for the period of study is more often sought for employees who do not occupy managerial positions.
Most experts point low motivation of person-nel in training of workers, but in groups of spe-cialists and executives the importance of this problem decreases rapidly. This result has an ex-planation associated with a gradual increase of opportunities of employees to influence the deci-sion making process about training. Thus, 42.2% of experts noted the formal character of educa-tional programs for workers and only 29.0% - for managers. The formal nature of training may be caused by the presence of requirements for peri-odic training in both countries. However, in gen-eral, the problem of low motivation of personnel is quite serious. According to survey results, 38.9% of the experts of both countries find it im-portant to consider the motivation of the employ-ees, and 42.0% think that it is important in some cases. The differences between the evaluations of Russian and Belarusian experts are statistically insignificant.
About 30% of the experts link the problem of internal training with a not obvious result of the training. This problem with the same frequency is observed in the training of all groups of personnel.
The dismissal of trained workers is another challenge facing employers in both countries. For managers it is less critical because of the informa-tion asymmetry of this segment of the labor mar-ket, not allowing other employers to adequately assess the abilities of the worker, but for groups of workers and specialists its value is significantly higher (32.6% and 30.1% respectively).The risk of loss of investment makes 33.3% of employers consider the possibility of dismissal of the trained employee very important and 38.0% consider this fact important in some cases.
In the group of specialists, the presence of dif-ferences with respect to the issue of the dismissal of trained employees was reported. Belarusian
employers perceive it more sharply (36% versus 22%). The reason is that the Belarusian labor leg-islation, unlike Russian, does not provide for the possibility of concluding the apprenticeship con-tract with the employee under which he is obliged to work for a set period in the organization after graduation, or to compensate the expenses of the organization on training (Chapter 32 of the Labor code of the Russian Federation, 2001). Appar-ently, the combination of a relatively large level of generality of the acquired competences of spe-cialists and the lack of legal capacity to retain the employee after training, leads to such differences in the estimates of the Russian and Belarusian experts.
Indeed, according to Russian sources, 40% of employees who received training, signed appren-ticeship contracts with employers. The probability of concluding the contract is directly associated with the nature of the program.
In the formation of specific human capital ap-prenticeship contracts were concluded only in 12.5% of cases, in the training on programs that are in demand in organizations of similar profile apprenticeship contracts were concluded in 37.2% of cases, and in the training programs, the results of which can be used almost everywhere, appren-ticeship contracts were signed in 46.3% of cases.
Conclusion Thus, the study showed that the formation of rele-vant for today's labor market skills of workers of industrial enterprises of Belarus and Russia re-quires an integrated approach.
High demand for training general skills in combination with deficit of cognitive and social skills means that the emphasis in their formation must be transferred to the level of general educa-tion, including professional education.
Overcoming formalism and low effectiveness of the training requires a serious effort, not only by employers but also by the state. To some ex-tent it is connected with the necessity of the pas-sage of employees of certain professions and posi-tions of periodic training. The regulatory authori-ties take into account not the result of education, but the presence of the document on its passage corresponding to the requirements.
The study has documented the differences in the formal national institutions and training prac-tices in the firm-level in two countries, which may be of mutual interest (for example, the Russian practice of concluding the apprenticeship agree-ments). SM
Tatiana Stuken et al. Internal Training of Personnel in Russia and Belarus: The Content and Effectiveness 17
STRATEGIC MANAGEMENT, Vol. 22 (2017), No. 2, pp. 009-017
References Alexandrova, E. A. (2014). The effectiveness of the system
of additional professional training of employees. Unpublished doctoral dissertation, CITY: PUBLISHER.
Berger, M. C., Earle, J. S., & Sabirianova, K. Z. (2001). Worker Training in a Restructuring Economy: Evidence from the Russian Transition. In Worker Wellbeing in a Changing Labor Market (Vol. 20) (pp. 159-190). New York: JAI Press.
Gimpelson, V. E., & Kapelyushnikov, R. I. (2011). Russian worker. Education. Profession. Qualification. Moscow: HSE.
Lazareva, O. V. (2006). The job training in Russia: determinants and impact. Moscow: EERC.
Lazareva, O., Denisova, I., & Tsukhlo, S. (2006). Hiring and Retraining: The Experience of Russian Enterprises. Moscow: State University – Higher School of Economics.
Soroka, V. (2004). Regular internal training. Retrieved April 6, 2015 from Otdel kadrov: http://otdelkadrov.by/
Tan, H., Savchenko, Y., Gimpelson, V., Kapelyushnikov, R., & Lukyanova, A. (2007). Skills Shortages and Training in Russian Enterprises. Retrieved September 15, 2015 from IZA: http://ftp.iza.org/dp2751.pdf
The Labor Code of the Republic of Belarus No. 296-z. (1999, July 26). Retrieved Septebmer 15, 2015 from CIS Legislation: http://cis-legislation.com/document.fwx?rgn=2562
The Labor Code of the Russian Federation: the Federal law of the Russian Federation No. 197-FZ. (2001). Retrieved September 15, 2015 from International Labour Organization: http://www.ilo.org/dyn/natlex/docs/WEBTEXT/60535/65252/E01RUS01.htm
The World Bank. (2014a). Belarus Country Profile 2013. Retrieved September 15, 2015 from The Enterprise Surveys: http://www.enterprisesurveys.org/~/media/GIAWB/EnterpriseSurveys/Documents/Profiles/English/Belarus-2013.pdf
The World Bank. (2014b). Russian Federation Country Profile 2012. Retrieved September 15, 2015 from The Enterprise Surveys: http://www.enterprisesurveys.org/~/media/GIAWB/EnterpriseSurveys/Documents/Profiles/English/Russia-2012.pdf
Travkin, P. (2014). The Returns to Training in Russia: A Difference-in-Differences Analysis. Moskva: NRU Higher School of Economics.
Vasiliev, K., Lukiyanova, A., Chugunov, D., Maltseva, I., Shulga, I., Rutkowski, J., et al. (2013). Developing skills for innovative growth in the Russian Federation. Retrieved September 15, 2015 from The World Bank: http://documents.worldbank.org/curated/en/2013/06/18004192/developing-skills-innovative-growth-russian-federation
Correspondence
Tatiana Stuken
Dostoevsky Omsk State University Prospect Mira 55a, 644077, Omsk, Russia
E-mail: [email protected]
STRATEGIC MANAGEMENT, Vol. 22 (2017), No. 2, pp. 018-026 UDC 366.5:659.1 005
Received: May 3, 2017
Accepted: June 5, 2017
Analysis of Intangible Assets in Retail Trade
Radojko Lukic Faculty of Economics, Belgrade, University of Belgrade, Serbia
Dragana Vojteski Kljenak Faculty of Business Economics and Entrepreneurship, Serbia
Abstract There is a growing importance of econometric analysis of the impact of intangible assets on the performance of companies, which seems apprehensive concerning the innovations, new technologies, brand, knowledgeand other components of intangible assets for improving the companies’ performance. To our knowledge,there are few papers dedicated to the research of specifics of intangible assets impact on the performance oftrading and retailing companies, respectively. We find one of the reasons for this in the lack of adequate data,especially for econometric analysis, because many companies do not enclose full data on intangible assets intheir financial reports, or do it partially. Taking all this into account, we intend to elaborate the specifics andimpact of intangible assets on the performance of global retailers, with particular emphasis on Serbia. We ground our research on theoretical and methodological knowledge and reliable empirical data. (Jel classifica-tion: L810, M420, Q320). Keywords Innovation, customers, brand, technology, knowledge.
Introduction Intangible assets have profound influence on a company’s value, work productivity (Marrocu, 2011) and performance in trading companies (in-cluding retailing). Due to that, detailed analysis of the impact of intangible assets on the performance of companies is given a considerable importance. Starting with the significance of the issue, this paper lays emphasis to specifics and the impact of intangible assets on the performance of trading, especially retailing companies. We aim to point that managers can exert its influence in improving the desired profits of trading companies (Chris-tine, 2015).
Innovations, human resources, intellectual cap-ital, information, goodwill etc. are regarded as crucial factors of creating companies’ value and sustainable growth (Sorescu, Frambach, Singh, Rangaswamy, & Bridges, 2011; Greuning, 2011; Vidracsu, 2015; Lev, 2004; Villalonga, 2004; Aci-to, 2007; Marrocu, 2011; Lukic, Lalic & Vojteski Kljenak, 2016). In its character, they are nothing
else but the elements of non-material investment (intangible assets), and inasmuch as of this, care-ful research attention is devoted to them in theory and practice. We will draw our attention to the specifics of their impact on the performance in retail globally, and particularly in Serbia. The aim of the analysis is to point to the significance of managing intangible assets so as to accomplish targeted profit of retail companies.
The aim of the research is to thoroughly elabo-rate on theoretical and practical issues of non-material assets in retail. The knowledge of signi-ficance and the structure of non-material assets is fundamental prerequisite for its efficient man-agement so as to meet the desired profit in con-crete retail company. As far as we know, there are no fully written papers dedicated to the analysis of intangible assets in retail, especially in Serbia, in which we find our contribution to the treated problems.
There is growing contemporary literature writ-ten on the general analysis of intangible assets of
Radojko Lukic et al. Analysis of Intangible Assets in Retail Trade 19
STRATEGIC MANAGEMENT, Vol. 22 (2017), No. 2, pp. 018-026
companies, both from the accounting point of view, and from its influence on performance. Nevertheless, as far as we know, there are no fully written papers dedicated to the analysis of specif-ics of size and structure of intangible asset in re-tail. We strive to research the issue, especially on the examples of global, and retailers in Serbia, in which we find scientific and professional contri-bution of this paper.
In the context of the analyzed problem in this study (the case of Serbia) we tested the hypothesis that between certain variables there is a connec-tion (positive or negative), or the variable corre-lated with each other, and for which it is used as a correlation method.
In order to gain a better idea about the impor-tance of intangible assets in the retail trade, Serbia was compared with other countries, primarily with developed market economy.
For the sake of implementation of econometric analysis in the future it is necessary to develop a unique enclosure system of intangible assets in financial reports of retails companies, especially in Serbia. It will contribute to better analysis of non-material assets in retail.
The primary restriction of research in this work is reflected in the notion that reliable empir-ical data are not fully comparable since retail companies enclose data in financial reports diffe-rently. Partially, it was due to frequent normative change of International Financial Reporting Stan-dards and others. Nevertheless, we consider that research results in this work can serve as basis for further theoretical, methodological and empirical analysis of the given issue, and especially to man-agers in retail to efficiently manage the non-material assets so as to make desired profit. In that we also find scientific and professional contribu-tion of this paper.
Relevant data for the research in this work were collected from different sources, such as: literature, studies, papers, and annual financial reports of analysed retail companies. Web sites also served as sources. We collected data on trade and analysed retail companies in Serbia from the Business Registers Agency of the Republic of Serbia.
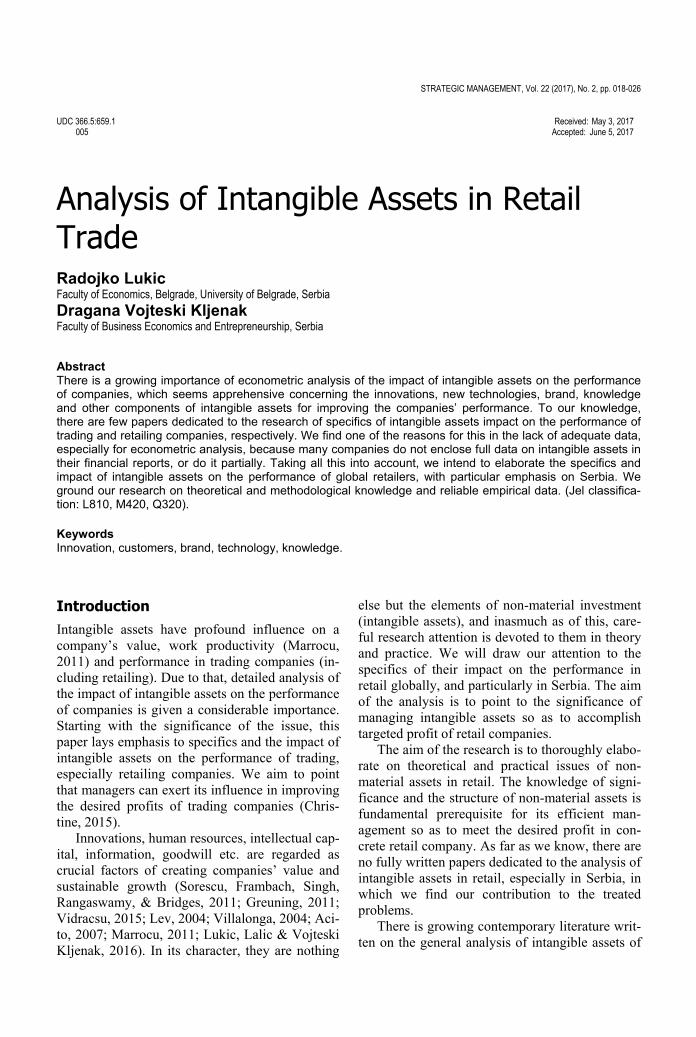
1. System of indicators of non-material value in retail The structure of assets in retail is specific com-pared to other economy sectors, and so is the structure of intangible assets. This is due to the nature of its business – bulk purchasing and sell-
ing in small quantities of goods, primarily to end customers. Figure 1 shows the hierarchy of retail assets.
Figure 1 The retail asset hierarchy
Source: Acito, 2007
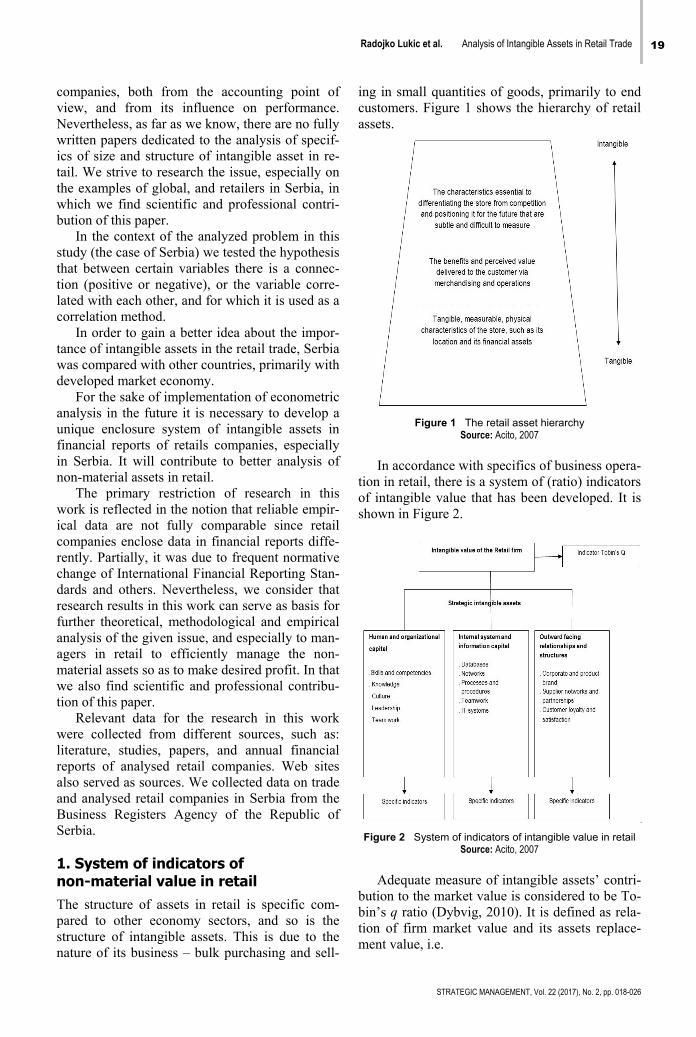
In accordance with specifics of business opera-
tion in retail, there is a system of (ratio) indicators of intangible value that has been developed. It is shown in Figure 2.
Figure 2 System of indicators of intangible value in retail Source: Acito, 2007
Adequate measure of intangible assets’ contri-
bution to the market value is considered to be To-bin’s q ratio (Dybvig, 2010). It is defined as rela-tion of firm market value and its assets replace-ment value, i.e.
20 Radojko Lukic et al. Analysis of Intangible Assets in Retail Trade
STRATEGIC MANAGEMENT, Vol. 22 (2017), No. 2, pp. 018-026
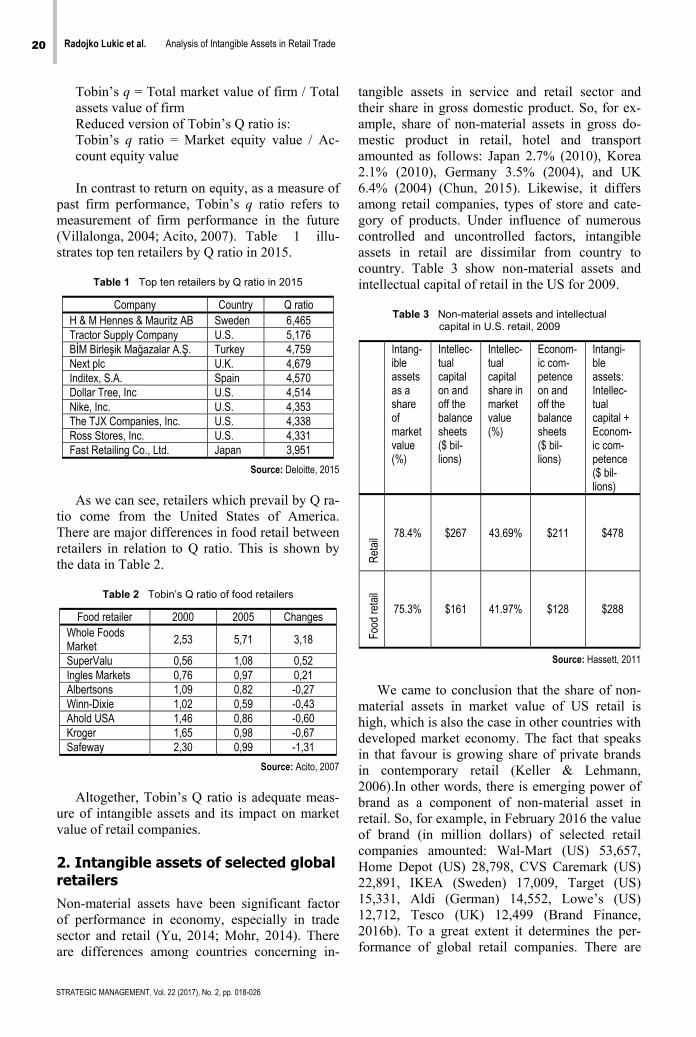
Tobin’s q = Total market value of firm / Total assets value of firm Reduced version of Tobin’s Q ratio is: Tobin’s q ratio = Market equity value / Ac-count equity value In contrast to return on equity, as a measure of
past firm performance, Tobin’s q ratio refers to measurement of firm performance in the future (Villalonga, 2004; Acito, 2007). Table 1 illu-strates top ten retailers by Q ratio in 2015.
Table 1 Top ten retailers by Q ratio in 2015
Company Country Q ratio H & M Hennes & Mauritz AB Sweden 6,465 Tractor Supply Company U.S. 5,176 BİM Birleşik Mağazalar A.Ş. Turkey 4,759 Next plc U.K. 4,679 Inditex, S.A. Spain 4,570 Dollar Tree, Inc U.S. 4,514 Nike, Inc. U.S. 4,353 The TJX Companies, Inc. U.S. 4,338 Ross Stores, Inc. U.S. 4,331 Fast Retailing Co., Ltd. Japan 3,951
Source: Deloitte, 2015
As we can see, retailers which prevail by Q ra-
tio come from the United States of America. There are major differences in food retail between retailers in relation to Q ratio. This is shown by the data in Table 2.
Table 2 Tobin’s Q ratio of food retailers
Food retailer 2000 2005 Changes Whole Foods Market
2,53 5,71 3,18
SuperValu 0,56 1,08 0,52 Ingles Markets 0,76 0,97 0,21 Albertsons 1,09 0,82 -0,27 Winn-Dixie 1,02 0,59 -0,43 Ahold USA 1,46 0,86 -0,60 Kroger 1,65 0,98 -0,67 Safeway 2,30 0,99 -1,31
Source: Acito, 2007
Altogether, Tobin’s Q ratio is adequate meas-
ure of intangible assets and its impact on market value of retail companies.
2. Intangible assets of selected global retailers Non-material assets have been significant factor of performance in economy, especially in trade sector and retail (Yu, 2014; Mohr, 2014). There are differences among countries concerning in-
tangible assets in service and retail sector and their share in gross domestic product. So, for ex-ample, share of non-material assets in gross do-mestic product in retail, hotel and transport amounted as follows: Japan 2.7% (2010), Korea 2.1% (2010), Germany 3.5% (2004), and UK 6.4% (2004) (Chun, 2015). Likewise, it differs among retail companies, types of store and cate-gory of products. Under influence of numerous controlled and uncontrolled factors, intangible assets in retail are dissimilar from country to country. Table 3 show non-material assets and intellectual capital of retail in the US for 2009.
Table 3 Non-material assets and intellectual
capital in U.S. retail, 2009
Intang-ible assets as a share of market value (%)
Intellec-tual capital on and off the balance sheets ($ bil-lions)
Intellec-tual capital share in market value (%)
Econom-ic com-petence on and off the balance sheets ($ bil-lions)
Intangi-ble assets: Intellec-tual capital + Econom-ic com-petence ($ bil-lions)
Ret
ail 78.4% $267 43.69% $211 $478
Food
reta
il
75.3% $161 41.97% $128 $288
Source: Hassett, 2011
We came to conclusion that the share of non-
material assets in market value of US retail is high, which is also the case in other countries with developed market economy. The fact that speaks in that favour is growing share of private brands in contemporary retail (Keller & Lehmann, 2006).In other words, there is emerging power of brand as a component of non-material asset in retail. So, for example, in February 2016 the value of brand (in million dollars) of selected retail companies amounted: Wal-Mart (US) 53,657, Home Depot (US) 28,798, CVS Caremark (US) 22,891, IKEA (Sweden) 17,009, Target (US) 15,331, Aldi (German) 14,552, Lowe’s (US) 12,712, Tesco (UK) 12,499 (Brand Finance, 2016b). To a great extent it determines the per-formance of global retail companies. There are
Radojko Lukic et al. Analysis of Intangible Assets in Retail Trade 21
STRATEGIC MANAGEMENT, Vol. 22 (2017), No. 2, pp. 018-026
also significant investments in development of new information and communication technologies and knowledge advancement (competences) of the employed in retail. Share of intangible assets in market value is also high in all companies (Vi-drascu, 2015), including retailing. Table 4 shows the non-material value (assets) of selected retail-ers.
Table 4 The estimate of intangible assets of selected retail
companies, (September 22), 2016 (in billion dollars)
Com
pany
Mar
ket v
alue
Acco
untin
g va
lue
Non
-mat
eria
l va
lue
Shar
e of
non
-m
ater
ial
valu
e in
m
arke
t val
ue
WalMart 222.62 83.61 139.01 62.44% Home Depot
156.71 6.32 149.68 9.51%
Target 39.45 12.96 26.49 67.14 Tesco 18.38 8.62 9.76 53.10% Kroger 36.88 6.80 30.08 81.56
Note: Calculation performed by the author based on the data: Market Watch: Stock Market News - Financial News;
We mark market value of firm with MV and accounting value with A, we came up with: Non-material assets = (MV – A).
Source: Market Watch, 2016
The data in the given table show high share of
non-material value (assets) in market value of presented retailing companies. Therefore, it be-longs to important factors of business success of the observed companies. The similar trend is with the other companies that operate on the global level. In order to thoroughly envisage the impor-tance of non-material assets in retail, Table 5 shows the share of non-material assets in total assets of selected retailing companies for the pe-riod 2011 – 2015.
Table 5 Share of non-material assets in total assets of
selected retail companies (%), 2012 – 2015
Company 2012 2013 2014 2015
Wal-Mart 10.67% 10.09% 9,52% 9.09% Home Depot 2.76% 2.84% 3.18% 3.39%Costco - 23.14% 23,22% 23,03%
Target 0.25% 0.22% 0.74% 0.72%
Tesco 9.09% 8.69% 7.57% 8.52%
Marks & Spencer 8.03% 9.13% 10.22% 10.46%
Note: Calculation performed by the author based on annual reports Source: Market Watch, 2016
Data in the given table show a high share of
non-material assets in total assets in retail compa-nies Wal-Mart, Tesco and Marks & Spencer, in
which we recognize the fact that those companies have major investments in innovation, as crucial factor of business success. In order to deeply con-template the importance of intangible assets in retail we will analyse data from Fast Retailing company. Table 6 shows the data on intangible assets of Fast Retailing company for the period 2013 – 2015.
Table 6 Share of intangible assets in total assets of the
Fast Retailing company (%), 2013 – 2015
2013 2014 2015 Goodwill 4.10% 2.69% 2.33% Other intangible assets 5.86% 4.73% 3.52%
Note: Calculation performed by the author Source: Fast Retailing, 2016
The data derived from this table indicate that
the share of intangible assets (Goodwill and other intangible assets) in total assets of the Fast Retail-ing company is less compared to Wal-Mart and Mark & Spencer. Unlike the trade sector, infor-mation and communication (IT) sector is unique to intangible assets influence on performance. As illustration, we will analyse the world wide known company Apple, which has very high level of intangible assets share in its economic value. Data in the Table 7 indicate this.
Table 7 Components of enterprise value in company Apple on 28th April 2016 ($ billions)
Ente
rpris
e va
lue
Com
pone
nts
of e
nter
pris
e va
lue
Dis
clos
ed
inta
ngib
les
com
pone
nts
Type
s of
in
tang
ible
as
sets
Bran
d va
lue
$536 Tangible assets $274
Disclosed intangibles $9
Goodwill $13 (5%)
Brand value $121
Intangible assets $261
Assets breakdown $252
Contract $13 (5%)
Consumer $26 (10%)
Technology $79 (30%)
Marketing $131 (50%)
Source: Brand Finance, 2016a
Data in the table show that in Apple company
intangible assets participate in total value with 49%, which is very significant from the impact on total performance point of view. What is peculiar is that only 3.4% of intangible assets are dis-closed. As crucial factors of business perfor-
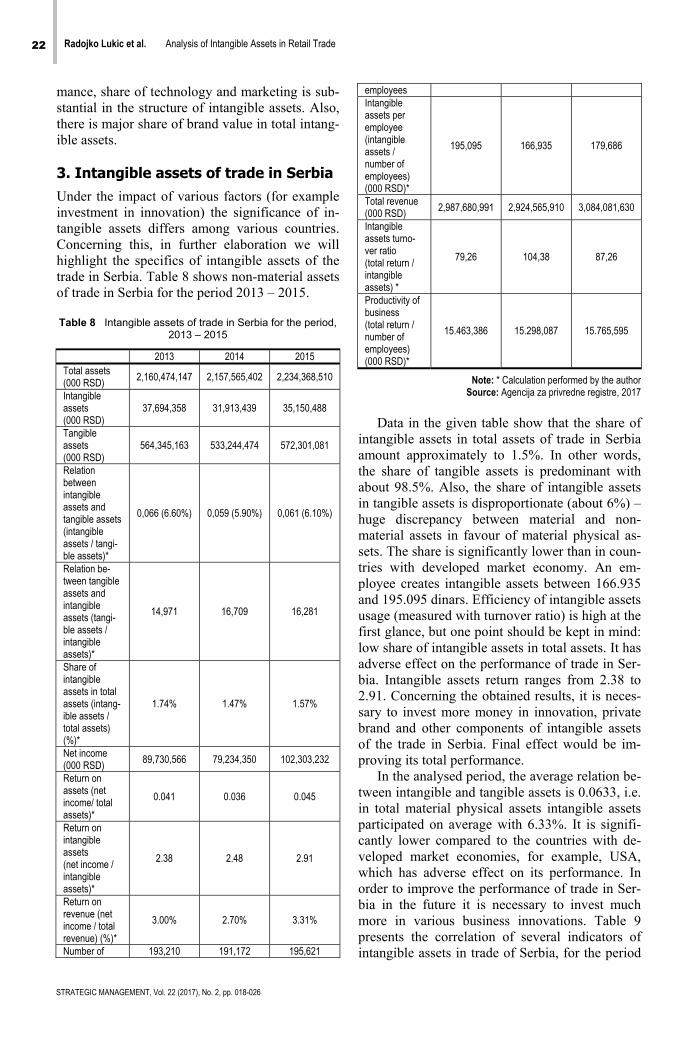
22 Radojko Lukic et al. Analysis of Intangible Assets in Retail Trade
STRATEGIC MANAGEMENT, Vol. 22 (2017), No. 2, pp. 018-026
mance, share of technology and marketing is sub-stantial in the structure of intangible assets. Also, there is major share of brand value in total intang-ible assets.
3. Intangible assets of trade in Serbia Under the impact of various factors (for example investment in innovation) the significance of in-tangible assets differs among various countries. Concerning this, in further elaboration we will highlight the specifics of intangible assets of the trade in Serbia. Table 8 shows non-material assets of trade in Serbia for the period 2013 – 2015.
Table 8 Intangible assets of trade in Serbia for the period,
2013 – 2015
2013 2014 2015 Total assets (000 RSD) 2,160,474,147 2,157,565,402 2,234,368,510
Intangible assets (000 RSD)
37,694,358 31,913,439 35,150,488
Tangible assets (000 RSD)
564,345,163 533,244,474 572,301,081
Relation between intangible assets and tangible assets (intangible assets / tangi-ble assets)*
0,066 (6.60%) 0,059 (5.90%) 0,061 (6.10%)
Relation be-tween tangible assets and intangible assets (tangi-ble assets / intangible assets)*
14,971 16,709 16,281
Share of intangible assets in total assets (intang-ible assets / total assets) (%)*
1.74% 1.47% 1.57%
Net income (000 RSD) 89,730,566 79,234,350 102,303,232
Return on assets (net income/ total assets)*
0.041 0.036 0.045
Return on intangible assets (net income / intangible assets)*
2.38 2.48 2.91
Return on revenue (net income / total revenue) (%)*
3.00% 2.70% 3.31%
Number of 193,210 191,172 195,621
employeesIntangible assets per employee (intangible assets / number of employees) (000 RSD)*
195,095 166,935 179,686
Total revenue (000 RSD) 2,987,680,991 2,924,565,910 3,084,081,630
Intangible assets turno-ver ratio (total return / intangible assets) *
79,26 104,38 87,26
Productivity of business (total return / number of employees) (000 RSD)*
15.463,386 15.298,087 15.765,595
Note: * Calculation performed by the author Source: Agencija za privredne registre, 2017
Data in the given table show that the share of
intangible assets in total assets of trade in Serbia amount approximately to 1.5%. In other words, the share of tangible assets is predominant with about 98.5%. Also, the share of intangible assets in tangible assets is disproportionate (about 6%) – huge discrepancy between material and non-material assets in favour of material physical as-sets. The share is significantly lower than in coun-tries with developed market economy. An em-ployee creates intangible assets between 166.935 and 195.095 dinars. Efficiency of intangible assets usage (measured with turnover ratio) is high at the first glance, but one point should be kept in mind: low share of intangible assets in total assets. It has adverse effect on the performance of trade in Ser-bia. Intangible assets return ranges from 2.38 to 2.91. Concerning the obtained results, it is neces-sary to invest more money in innovation, private brand and other components of intangible assets of the trade in Serbia. Final effect would be im-proving its total performance.
In the analysed period, the average relation be-tween intangible and tangible assets is 0.0633, i.e. in total material physical assets intangible assets participated on average with 6.33%. It is signifi-cantly lower compared to the countries with de-veloped market economies, for example, USA, which has adverse effect on its performance. In order to improve the performance of trade in Ser-bia in the future it is necessary to invest much more in various business innovations. Table 9 presents the correlation of several indicators of intangible assets in trade of Serbia, for the period
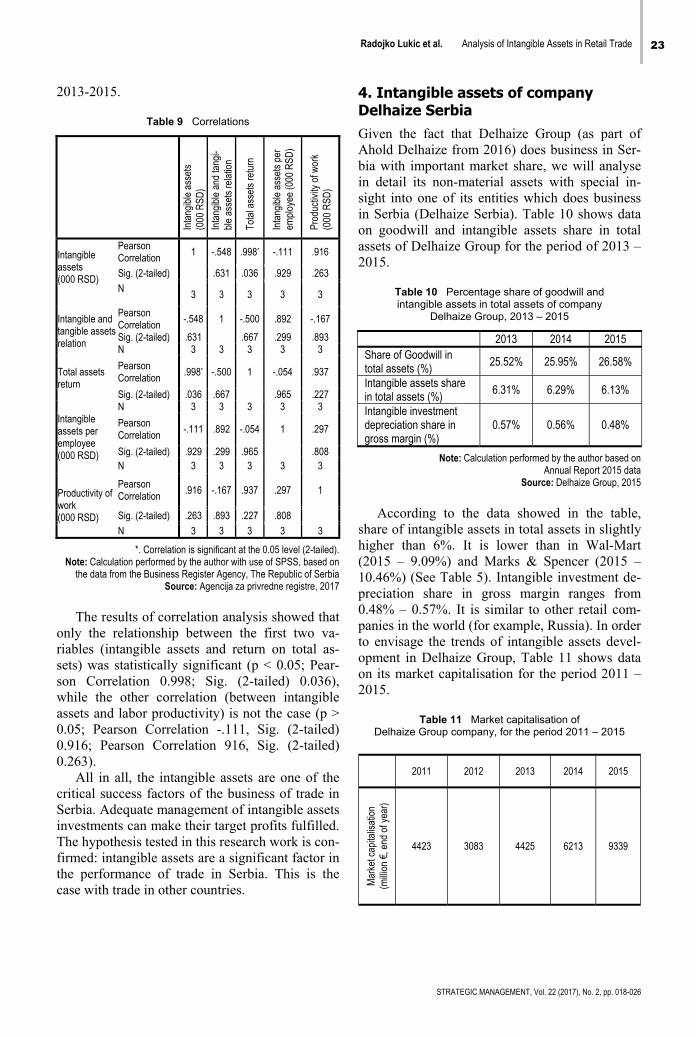
Radojko Lukic et al. Analysis of Intangible Assets in Retail Trade 23
STRATEGIC MANAGEMENT, Vol. 22 (2017), No. 2, pp. 018-026
2013-2015.
Table 9 Correlations
Inta
ngib
le a
sset
s
(000
RSD
)
Inta
ngib
le a
nd ta
ngi-
ble
asse
ts re
latio
n
Tota
l ass
ets
retu
rn
Inta
ngib
le a
sset
s pe
r em
ploy
ee (0
00 R
SD)
Prod
uctiv
ity o
f wor
k (0
00 R
SD)
Intangible assets (000 RSD)
Pearson Correlation 1 -.548 .998* -.111 .916
Sig. (2-tailed) .631 .036 .929 .263N 3 3 3 3 3
Intangible and tangible assets relation
Pearson Correlation -.548 1 -.500 .892 -.167
Sig. (2-tailed) .631 .667 .299 .893N 3 3 3 3 3
Total assets return
Pearson Correlation .998* -.500 1 -.054 .937
Sig. (2-tailed) .036 .667 .965 .227N 3 3 3 3 3
Intangible assets per employee (000 RSD)
Pearson Correlation -.111 .892 -.054 1 .297
Sig. (2-tailed) .929 .299 .965 .808N 3 3 3 3 3
Productivity of work (000 RSD)
Pearson Correlation .916 -.167 .937 .297 1
Sig. (2-tailed) .263 .893 .227 .808
N 3 3 3 3 3
*. Correlation is significant at the 0.05 level (2-tailed).Note: Calculation performed by the author with use of SPSS, based on
the data from the Business Register Agency, The Republic of SerbiaSource: Agencija za privredne registre, 2017
The results of correlation analysis showed that
only the relationship between the first two va-riables (intangible assets and return on total as-sets) was statistically significant (p < 0.05; Pear-son Correlation 0.998; Sig. (2-tailed) 0.036), while the other correlation (between intangible assets and labor productivity) is not the case (p > 0.05; Pearson Correlation -.111, Sig. (2-tailed) 0.916; Pearson Correlation 916, Sig. (2-tailed) 0.263).
All in all, the intangible assets are one of the critical success factors of the business of trade in Serbia. Adequate management of intangible assets investments can make their target profits fulfilled. The hypothesis tested in this research work is con-firmed: intangible assets are a significant factor in the performance of trade in Serbia. This is the case with trade in other countries.
4. Intangible assets of company Delhaize Serbia Given the fact that Delhaize Group (as part of Ahold Delhaize from 2016) does business in Ser-bia with important market share, we will analyse in detail its non-material assets with special in-sight into one of its entities which does business in Serbia (Delhaize Serbia). Table 10 shows data on goodwill and intangible assets share in total assets of Delhaize Group for the period of 2013 – 2015.
Table 10 Percentage share of goodwill and intangible assets in total assets of company
Delhaize Group, 2013 – 2015
2013 2014 2015 Share of Goodwill in total assets (%)
25.52% 25.95% 26.58%
Intangible assets share in total assets (%)
6.31% 6.29% 6.13%
Intangible investment depreciation share in gross margin (%)
0.57% 0.56% 0.48%
Note: Calculation performed by the author based on Annual Report 2015 data
Source: Delhaize Group, 2015
According to the data showed in the table,
share of intangible assets in total assets in slightly higher than 6%. It is lower than in Wal-Mart (2015 – 9.09%) and Marks & Spencer (2015 – 10.46%) (See Table 5). Intangible investment de-preciation share in gross margin ranges from 0.48% – 0.57%. It is similar to other retail com-panies in the world (for example, Russia). In order to envisage the trends of intangible assets devel-opment in Delhaize Group, Table 11 shows data on its market capitalisation for the period 2011 – 2015.
Table 11 Market capitalisation of
Delhaize Group company, for the period 2011 – 2015
2011 2012 2013 2014 2015
Mar
ket c
apita
lisat
ion
(m
illion
€, e
nd o
f yea
r)
4423 3083 4425 6213 9339
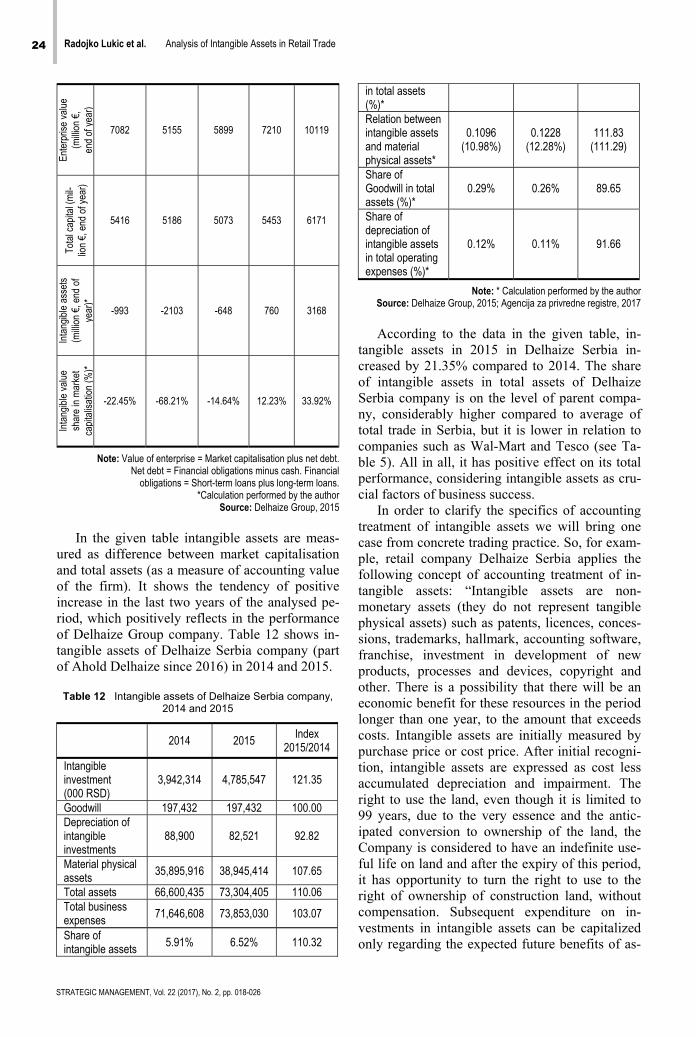
24 Radojko Lukic et al. Analysis of Intangible Assets in Retail Trade
STRATEGIC MANAGEMENT, Vol. 22 (2017), No. 2, pp. 018-026
Ente
rpris
e va
lue
(milli
on €
, en
d of
yea
r)
7082 5155 5899 7210 10119
Tota
l cap
ital (
mil-
lion
€, e
nd o
f yea
r)
5416 5186 5073 5453 6171
Inta
ngib
le a
sset
s (m
illion
€, e
nd o
f ye
ar)*
-993 -2103 -648 760 3168
Inta
ngib
le v
alue
sh
are
in m
arke
t ca
pita
lisat
ion
(%)*
-22.45% -68.21% -14.64% 12.23% 33.92%
Note: Value of enterprise = Market capitalisation plus net debt. Net debt = Financial obligations minus cash. Financial
obligations = Short-term loans plus long-term loans. *Calculation performed by the author
Source: Delhaize Group, 2015
In the given table intangible assets are meas-
ured as difference between market capitalisation and total assets (as a measure of accounting value of the firm). It shows the tendency of positive increase in the last two years of the analysed pe-riod, which positively reflects in the performance of Delhaize Group company. Table 12 shows in-tangible assets of Delhaize Serbia company (part of Ahold Delhaize since 2016) in 2014 and 2015.
Table 12 Intangible assets of Delhaize Serbia company,
2014 and 2015
2014 2015 Index
2015/2014
Intangible investment (000 RSD)
3,942,314 4,785,547 121.35
Goodwill 197,432 197,432 100.00 Depreciation of intangible investments
88,900 82,521 92.82
Material physical assets
35,895,916 38,945,414 107.65
Total assets 66,600,435 73,304,405 110.06 Total business expenses
71,646,608 73,853,030 103.07
Share of intangible assets
5.91% 6.52% 110.32
in total assets (%)* Relation between intangible assets and material physical assets*
0.1096 (10.98%)
0.1228 (12.28%)
111.83 (111.29)
Share of Goodwill in total assets (%)*
0.29% 0.26% 89.65
Share of depreciation of intangible assets in total operating expenses (%)*
0.12% 0.11% 91.66
Note: * Calculation performed by the author Source: Delhaize Group, 2015; Agencija za privredne registre, 2017
According to the data in the given table, in-
tangible assets in 2015 in Delhaize Serbia in-creased by 21.35% compared to 2014. The share of intangible assets in total assets of Delhaize Serbia company is on the level of parent compa-ny, considerably higher compared to average of total trade in Serbia, but it is lower in relation to companies such as Wal-Mart and Tesco (see Ta-ble 5). All in all, it has positive effect on its total performance, considering intangible assets as cru-cial factors of business success.
In order to clarify the specifics of accounting treatment of intangible assets we will bring one case from concrete trading practice. So, for exam-ple, retail company Delhaize Serbia applies the following concept of accounting treatment of in-tangible assets: “Intangible assets are non-monetary assets (they do not represent tangible physical assets) such as patents, licences, conces-sions, trademarks, hallmark, accounting software, franchise, investment in development of new products, processes and devices, copyright and other. There is a possibility that there will be an economic benefit for these resources in the period longer than one year, to the amount that exceeds costs. Intangible assets are initially measured by purchase price or cost price. After initial recogni-tion, intangible assets are expressed as cost less accumulated depreciation and impairment. The right to use the land, even though it is limited to 99 years, due to the very essence and the antic-ipated conversion to ownership of the land, the Company is considered to have an indefinite use-ful life on land and after the expiry of this period, it has opportunity to turn the right to use to the right of ownership of construction land, without compensation. Subsequent expenditure on in-vestments in intangible assets can be capitalized only regarding the expected future benefits of as-
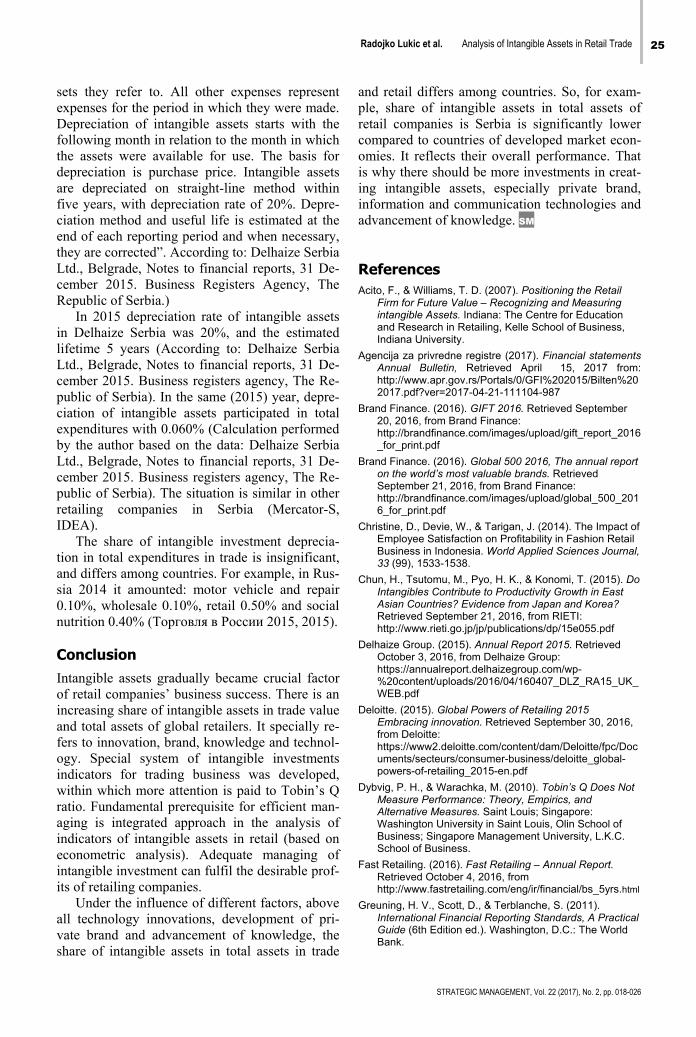
Radojko Lukic et al. Analysis of Intangible Assets in Retail Trade 25
STRATEGIC MANAGEMENT, Vol. 22 (2017), No. 2, pp. 018-026
sets they refer to. All other expenses represent expenses for the period in which they were made. Depreciation of intangible assets starts with the following month in relation to the month in which the assets were available for use. The basis for depreciation is purchase price. Intangible assets are depreciated on straight-line method within five years, with depreciation rate of 20%. Depre-ciation method and useful life is estimated at the end of each reporting period and when necessary, they are corrected”. According to: Delhaize Serbia Ltd., Belgrade, Notes to financial reports, 31 De-cember 2015. Business Registers Agency, The Republic of Serbia.)
In 2015 depreciation rate of intangible assets in Delhaize Serbia was 20%, and the estimated lifetime 5 years (According to: Delhaize Serbia Ltd., Belgrade, Notes to financial reports, 31 De-cember 2015. Business registers agency, The Re-public of Serbia). In the same (2015) year, depre-ciation of intangible assets participated in total expenditures with 0.060% (Calculation performed by the author based on the data: Delhaize Serbia Ltd., Belgrade, Notes to financial reports, 31 De-cember 2015. Business registers agency, The Re-public of Serbia). The situation is similar in other retailing companies in Serbia (Mercator-S, IDEA).
The share of intangible investment deprecia-tion in total expenditures in trade is insignificant, and differs among countries. For example, in Rus-sia 2014 it amounted: motor vehicle and repair 0.10%, wholesale 0.10%, retail 0.50% and social nutrition 0.40% (Торговля в России 2015, 2015).
Conclusion Intangible assets gradually became crucial factor of retail companies’ business success. There is an increasing share of intangible assets in trade value and total assets of global retailers. It specially re-fers to innovation, brand, knowledge and technol-ogy. Special system of intangible investments indicators for trading business was developed, within which more attention is paid to Tobin’s Q ratio. Fundamental prerequisite for efficient man-aging is integrated approach in the analysis of indicators of intangible assets in retail (based on econometric analysis). Adequate managing of intangible investment can fulfil the desirable prof-its of retailing companies.
Under the influence of different factors, above all technology innovations, development of pri-vate brand and advancement of knowledge, the share of intangible assets in total assets in trade
and retail differs among countries. So, for exam-ple, share of intangible assets in total assets of retail companies is Serbia is significantly lower compared to countries of developed market econ-omies. It reflects their overall performance. That is why there should be more investments in creat-ing intangible assets, especially private brand, information and communication technologies and advancement of knowledge. SM
References Acito, F., & Williams, T. D. (2007). Positioning the Retail
Firm for Future Value – Recognizing and Measuring intangible Assets. Indiana: The Centre for Education and Research in Retailing, Kelle School of Business, Indiana University.
Agencija za privredne registre (2017). Financial statements Annual Bulletin, Retrieved April 15, 2017 from: http://www.apr.gov.rs/Portals/0/GFI%202015/Bilten%202017.pdf?ver=2017-04-21-111104-987
Brand Finance. (2016). GIFT 2016. Retrieved September 20, 2016, from Brand Finance: http://brandfinance.com/images/upload/gift_report_2016_for_print.pdf
Brand Finance. (2016). Global 500 2016, The annual report on the world’s most valuable brands. Retrieved September 21, 2016, from Brand Finance: http://brandfinance.com/images/upload/global_500_2016_for_print.pdf
Christine, D., Devie, W., & Tarigan, J. (2014). The Impact of Employee Satisfaction on Profitability in Fashion Retail Business in Indonesia. World Applied Sciences Journal, 33 (99), 1533-1538.
Chun, H., Tsutomu, M., Pyo, H. K., & Konomi, T. (2015). Do Intangibles Contribute to Productivity Growth in East Asian Countries? Evidence from Japan and Korea? Retrieved September 21, 2016, from RIETI: http://www.rieti.go.jp/jp/publications/dp/15e055.pdf
Delhaize Group. (2015). Annual Report 2015. Retrieved October 3, 2016, from Delhaize Group: https://annualreport.delhaizegroup.com/wp-%20content/uploads/2016/04/160407_DLZ_RA15_UK_WEB.pdf
Deloitte. (2015). Global Powers of Retailing 2015 Embracing innovation. Retrieved September 30, 2016, from Deloitte: https://www2.deloitte.com/content/dam/Deloitte/fpc/Documents/secteurs/consumer-business/deloitte_global-powers-of-retailing_2015-en.pdf
Dybvig, P. H., & Warachka, M. (2010). Tobin’s Q Does Not Measure Performance: Theory, Empirics, and Alternative Measures. Saint Louis; Singapore: Washington University in Saint Louis, Olin School of Business; Singapore Management University, L.K.C. School of Business.
Fast Retailing. (2016). Fast Retailing – Annual Report. Retrieved October 4, 2016, from http://www.fastretailing.com/eng/ir/financial/bs_5yrs.html
Greuning, H. V., Scott, D., & Terblanche, S. (2011). International Financial Reporting Standards, A Practical Guide (6th Edition ed.). Washington, D.C.: The World Bank.
26 Radojko Lukic et al. Analysis of Intangible Assets in Retail Trade
STRATEGIC MANAGEMENT, Vol. 22 (2017), No. 2, pp. 018-026
Hassett, K. A., & Shapiro, R. J. (2011). What Ideas Are Worth: The Value of Intellectual Capital And Intangible Assets in the American Economy. Washington D.C.: Sonecon.
Keller, K. L., & Lehmann, D. R. (2006). Brands and Branding: Research Findings and Future Priorities. Marketing Science, 25 (6), 740-759.
Lev, B., & Daum, J. H. (2004). The dominance of intangible assets: consequences for enterprise management and corporate reporting. Measuring Business Excellence, 8 (1), 6-17.
Lukic, R., Lalic, S., & Vojteski Kljenak, D. (2016). Research and Development Costs in Retail Trade. Management and Economics Review, 1 (2), 170-183.
Market Watch. (2016). Retrieved September 23, 2016, from http://www.marketwatch.com/: http://www.marketwatch.com/
Marrocu, E., Paci, R., & Pontis, M. (2011). Intangible capital and firms productivity. Industrial and Corporate Change, 21 (2), 377-402.
Mohr, A., & Batsakis, G. (2014). Firm resources, international speed of retailers. International Marketing Review, 31 (6), 601-620.
Sorescu, A., Frambach, R. T., Singh, J., Rangaswamy, A., & Bridges, C. (2011). Innovations in Retail Business Models. Journal of Retailing, 87, 3-16.
Vidrascu, P. A. (2015). Intangible assets – Sustainable Economic Factors and New Creators of Value. Internal Auditing & Risk Management, 1 (37), 65-75.
Villalonga, B. (2004). Intangible resources, Tobin’s q, and sustainability of performance differences. Journal of Economic Behavior & Organization, 54, 205-230.
Yu, W., Ramanathan, R., & Nath, P. (2014). The impacts of marketing and operations capabilities on financial performance in the UK retail sector: A resource-based perspective. Industrial Marketing Management, 43, 25-31.
(2015). Торговля в России 2015, Статистический сборник. Москва: Федеральная служба государственной статистики (Росстат).
Correspondence
Radojko Lukic
Faculty of Economics Belgrade Kamenička 6, 11000, Belgrade, Serbia
E-mail: [email protected]
STRATEGIC MANAGEMENT, Vol. 22 (2017), No. 2, pp. 027-035 UDC 004.738.5:658
Received: April 23, 2016
Accepted: March 11, 2017
Challenges of the Company in the New Economy and Development of E-business Strategy
Monika Angeloska-Dichovska Faculty of Economics Prilep, St. Clement of Ohrid University Bitola, Republic of Macedonia
Tatjana Petkovska Mirchevska Institute of Economics, Ss. Cyril and Methodius University Skopje, Republic of Macedonia
Abstract The rapid development of technology and the Internet drastically alter both the consumers and companies’environment. The Internet is widely accepted by consumers, which manifestly changes their behavior. The rapid and profound changes in the environment, especially the technological changes, have a huge im-pact on the contemporary transformation of many business entities as well as on the adoption of new businessmodels. The changeable and unstable environment in the new economy urges business entities not only to constantly adjust, but also to accept a strategic approach specific to their e-market performance. The new economy works by a different set of rules from the traditional economy, and brings new challenges for busi-ness. Therefore the need for strategic planning is imposed as an imperative, that is, the strategic access to thee-business environment, if companies want to survive and to develop on the newly created markets. TheInternet and information communication technology provide better opportunities for businesses to establishdistinctive strategic positioning. The purpose of this paper is to point out the procedures to be followed in developing an e-business strategy in the new economy. Developing an e-business strategy depends on the type of enterprise, industry, competi-tion, consumer behavior, nature of application etc. Keywords E-business strategy, new economy, strategic analysis, changing behavior, Internet consumers.
1. Characteristics of the new as opposed to the old economy The digital revolution, expressed through the dy-namic and rapid development of technology and the Internet and their wide application by the population and business entities leads to a new economy, that is, to the transformation of the old into the digital economy. The digital revolution changes people’s way of living, but it also causes fundamental changes in the business activities of the business entities and their customers. These developments lead to changes in the overall econ-omy, more specifically, to the creation of a new economy (digital economy, Internet economy, and web-economy).
According to Turban et al. (2008), “new econ-omy refers to an economy that is based on digital technologies, including digital communication network (the Internet, intranets, extranets), com-puters, software and other related information technologies. In this new economy, digital net-working and communication infrastructure pro-vide a global platform over which people and or-ganizations interact, communicate, collaborate, and search for information” (pp. 14-15).
The new economy is based on a different set of rules from the traditional economy, and man-agers of both traditional and internet based com-panies have had to face the challenge that comes from the digital revolution. Lee outlines (as cited in Combe, 2006, pp. 55-59) the main attributes of
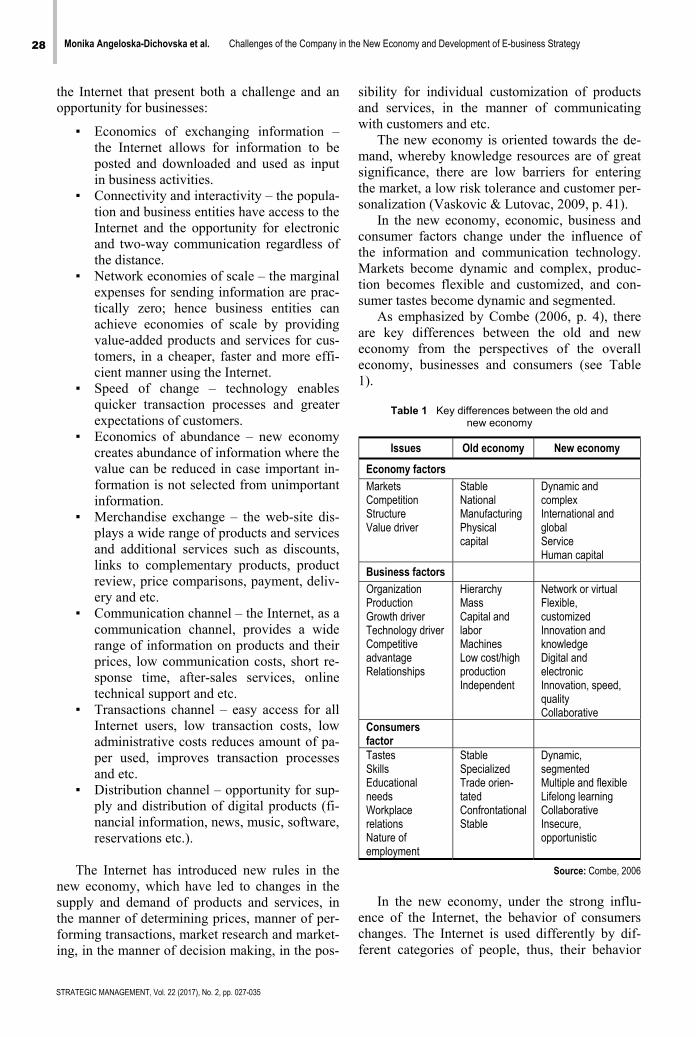
28 Monika Angeloska-Dichovska et al. Challenges of the Company in the New Economy and Development of E-business Strategy
STRATEGIC MANAGEMENT, Vol. 22 (2017), No. 2, pp. 027-035
the Internet that present both a challenge and an opportunity for businesses:
▪ Economics of exchanging information – the Internet allows for information to be posted and downloaded and used as input in business activities.
▪ Connectivity and interactivity – the popula-tion and business entities have access to the Internet and the opportunity for electronic and two-way communication regardless of the distance.
▪ Network economies of scale – the marginal expenses for sending information are prac-tically zero; hence business entities can achieve economies of scale by providing value-added products and services for cus-tomers, in a cheaper, faster and more effi-cient manner using the Internet.
▪ Speed of change – technology enables quicker transaction processes and greater expectations of customers.
▪ Economics of abundance – new economy creates abundance of information where the value can be reduced in case important in-formation is not selected from unimportant information.
▪ Merchandise exchange – the web-site dis-plays a wide range of products and services and additional services such as discounts, links to complementary products, product review, price comparisons, payment, deliv-ery and etc.
▪ Communication channel – the Internet, as a communication channel, provides a wide range of information on products and their prices, low communication costs, short re-sponse time, after-sales services, online technical support and etc.
▪ Transactions channel – easy access for all Internet users, low transaction costs, low administrative costs reduces amount of pa-per used, improves transaction processes and etc.
▪ Distribution channel – opportunity for sup-ply and distribution of digital products (fi-nancial information, news, music, software, reservations etc.).
The Internet has introduced new rules in the
new economy, which have led to changes in the supply and demand of products and services, in the manner of determining prices, manner of per-forming transactions, market research and market-ing, in the manner of decision making, in the pos-
sibility for individual customization of products and services, in the manner of communicating with customers and etc.
The new economy is oriented towards the de-mand, whereby knowledge resources are of great significance, there are low barriers for entering the market, a low risk tolerance and customer per-sonalization (Vaskovic & Lutovac, 2009, p. 41).
In the new economy, economic, business and consumer factors change under the influence of the information and communication technology. Markets become dynamic and complex, produc-tion becomes flexible and customized, and con-sumer tastes become dynamic and segmented.
As emphasized by Combe (2006, p. 4), there are key differences between the old and new economy from the perspectives of the overall economy, businesses and consumers (see Table 1).
Table 1 Key differences between the old and
new economy
Issues Old economy New economy Economy factors MarketsCompetition Structure Value driver
StableNational Manufacturing Physical capital
Dynamic and complex International and global Service Human capital
Business factors OrganizationProduction Growth driver Technology driver Competitive advantage Relationships
HierarchyMass Capital and labor Machines Low cost/high production Independent
Network or virtual Flexible, customized Innovation and knowledge Digital and electronic Innovation, speed, quality Collaborative
Consumers factor
TastesSkills Educational needs Workplace relations Nature of employment
StableSpecialized Trade orien-tated Confrontational Stable
Dynamic, segmented Multiple and flexible Lifelong learning Collaborative Insecure, opportunistic
Source: Combe, 2006
In the new economy, under the strong influ-
ence of the Internet, the behavior of consumers changes. The Internet is used differently by dif-ferent categories of people, thus, their behavior
Monika Angeloska-Dichovska et al. Challenges of the Company in the New Economy and Development of E-business Strategy 29
STRATEGIC MANAGEMENT, Vol. 22 (2017), No. 2, pp. 027-035
changes when using the Internet, namely, there is a specific behavior of Internet users. Lewis and Lewis have identified five different types of Inter-net users (as cited in Chaffey, Chadwick, Mayer & Johnston, 2006, p. 78), more specifically, mod-els of Internet usage:
▪ Those who search for direct information – users who seek information on products, markets or use their free time for searching and usually do not plan to shop online;
▪ Those who search for indirect information – users known as surfers who like to search and browse various links and usually click on various advertising links;
▪ Direct customers – users who buy certain products online; these users find the sites of brokers or cyber-intermediaries that pro-vide comparisons of prices and products to be important locations for visiting;
▪ Bargain hunters – users who want to find available sales promotion offers, such as free samples or competitions;
▪ Those who search for entertainment – users who want to connect to the web for enter-tainment through participation in competi-tions, such as a quiz, puzzle or other inter-active games.
Research (own research, 2014) into consumer
behavior on the Internet in the Republic of Mace-donia confirms that Macedonian consumers on the Internet are “those searching for direct informa-tion” (49.1%), and that only 7.5% are actually “direct buyers” who usually come to the idea of buying or ordering online upon the recommenda-tion of a friend/colleague, relative (48%) and from advertisements on the social media (35.2%), while advertisements on traditional media (newspapers, TV, printed catalogues) become irrelevant for the Internet users, even though for companies (41%) this media is still very relevant.
The functioning of the social media is also significant in the new economy. They are an inte-gral part of the everyday modern life of almost every man. Social media are becoming an increas-ingly more important source of information used by consumers, especially in the search phase in the model of making a decision on buying. Face-book, Twitter and LinkedIn are at the top of the list of social networks that are becoming quite popular among consumers and businesses, and marketers. The number of users of these networks is increasing every day, thus changing the plans of
business enterprises and the approach of these networks.
According to the data of Internet World Stats (26 April, 2015), in the first quarter of 2015, Europe had 24.1% of the total Facebook users worldwide, Asia 28.8%, while the US/Canada had 17.2%. In the Republic of Macedonia (according to Internet World Stats), there are 1,000,000 Facebook users (as of November 15, 2015), more specifically, the percentage of Facebook penetra-tion is 46.5%. On the other hand, the increased use of social networks allows business enterprises to foster brands and influence the process of pur-chasing.
Many business entities adhere to many rules in terms of marketing on the social media. Business entities integrate social media in their marketing strategies by: preparing plans for publication, monitoring comments, using tools for managing announcements, conducting promotions and re-cruiting fans, and having separate teams responsi-ble for social networks. Very often they use the tools of hootsite.com for monitoring comments and managing announcements on the social me-dia, as well as the tools of wildfireapp.com for creating interactive promotions on the social me-dia.
The research of Pitney Bowes Software (pub-lished on eMarketer, 3 December, 2012) con-ducted in the US, Great Britain, France, Germany and Australia shows that marketers need to be careful when choosing a social media, and should synchronize their activities on the social media with the preferences of their customers, as their research confirms that there is a disparity in the presence of consumers on certain social media and the presence of marketers. They emphasize the disparity in the presence on Twitter, Google and other social networks. For example, for Twit-ter 57% of marketers stated they use it compared to 31% of consumers.
The digital boom has led to the development of new activities, but also to the restructuring of existing activities and to the emergence of new trends with a positive and negative impact. Hence, among the positive impacts are the tendency of the Internet to dim the power of the channels for bargaining by providing businesses with new, more direct access from clients, and the possibil-ity for improving the efficiency of the activity in various ways, expanding the total size of the mar-ket by improving its position over the traditional substitutes. Among the negative trends of the Internet are: it provides customers with easier ac-
30 Monika Angeloska-Dichovska et al. Challenges of the Company in the New Economy and Development of E-business Strategy
STRATEGIC MANAGEMENT, Vol. 22 (2017), No. 2, pp. 027-035
cess to information on products and vendors, which strengthens their bargain power; decreases entry barriers; creates new substitutes; intensifies rivalry among competitors, as it is an open sys-tem; it expands the geographical area; it increases fixed costs of business enterprises and etc. (Porter, 2009, pp. 102-104).
The development of the widespread applica-tion of the Internet and the Internet technology have led to significant changes in the manner in which work is performed. With the development of the Internet, all business enterprises (micro, small, medium and large) have equal opportuni-ties to present their production programs on the Internet with small and affordable costs for every-one. The Internet in the business environment has led to significant changes in the following areas: procurement management, inventory manage-ment, distribution management, communication channels management, payment management, mediation etc. (Vaskovic & Lutovac, 2009, pp.44-45).
Social, technological and economic factors create a complex and competitive business envi-ronment, in which the power of the consumer be-comes greater. These factors initiate business pressure on the business enterprises and impose the need for adjusting to the environment (Turban et al., 2008, pp. 11-16).
2. Strategic planning for entering the e-market New developments within the environment of business enterprises create new problems and challenges, but also opportunities for finding solu-tions for them. In order for business enterprises to be more efficient in their functioning, they must respond to changes in the environment, namely, to the changing demands and needs of their custom-ers.
In order for business entities to succeed on the e-market, they need to build strategies with a clear focus, or as Porter stresses (2009, p.130), they need to have the following characteristics:
▪ having a strong Internet technology and be-ing familiar with it,
▪ building distinctive strategies with a clear focus,
▪ an accent and focus on creating value for customers,
▪ distinctive ways of conducting physical ac-tivities and comprising property that is not on the Internet, and
▪ deep knowledge of the industry and creat-ing their own skills, connections and in-formation.
The essence of a strategy lies in choosing ac-
tivities in a different way, or in performing activi-ties in a different way from those of the rivals (Porter, 2009, p. 43). According to Combe (2006, p. 213) a strategy can be viewed as a series of decisions and actions that are taken to achieve stated aims and objectives. According to another definition, a strategy is an integrated and coordi-nated set of obligations and actions in the direc-tion of utilizing the basic competencies of busi-ness enterprises and gaining competitive advan-tages (Michael, Hitt, Duane & Robert, 2008, p. 4).
Nowadays, the modern way of creating a strat-egy integrates the Internet in order to respond ac-cordingly to the dynamic developments in the environment. A strategy that includes elements of the Internet can be called an Internet strategy or e-strategy. According to Turban et al. (2008) “e-strategy, or e-commerce strategy, is the formula-tion and execution of a vision of how a new or existing company intends to do business elec-tronically (p. 640) or, according to Chaffey (2004) “using application of internal and external elec-tronic communication that support corporate strat-egy” (p. 189).
With the purpose of having a picture on the importance of the business environment and the Internet for the development of an e-business strategy in Republic of Macedonia, a survey was conducted in 182 companies from the Republic of Macedonia in regard to strategic thinking, aware-ness of e-business, impact of e-business applica-tions, Internet presence and social media benefits. More than half of the business entities (56%) do not know about the e-business activities of their competitors, and 40% of the total surveyed enti-ties do not have information on the Internet pres-ence of their suppliers. Half of the surveyed enti-ties (51.6%) have incorporated e-business (e-commerce) elements in their mission and vision. About two-thirds of the entities believe that e-business applications, activities and models can improve their operations, while 26% of the sur-veyed entities do not know whether these applica-tions, activities and models can contribute to their more successful functioning. They have under-stood and accepted the social media boom in their strategic thinking, hence, 80% of the entities be-lieve that their presence on social media such as Facebook, Twitter, LinkedIn and others can con-
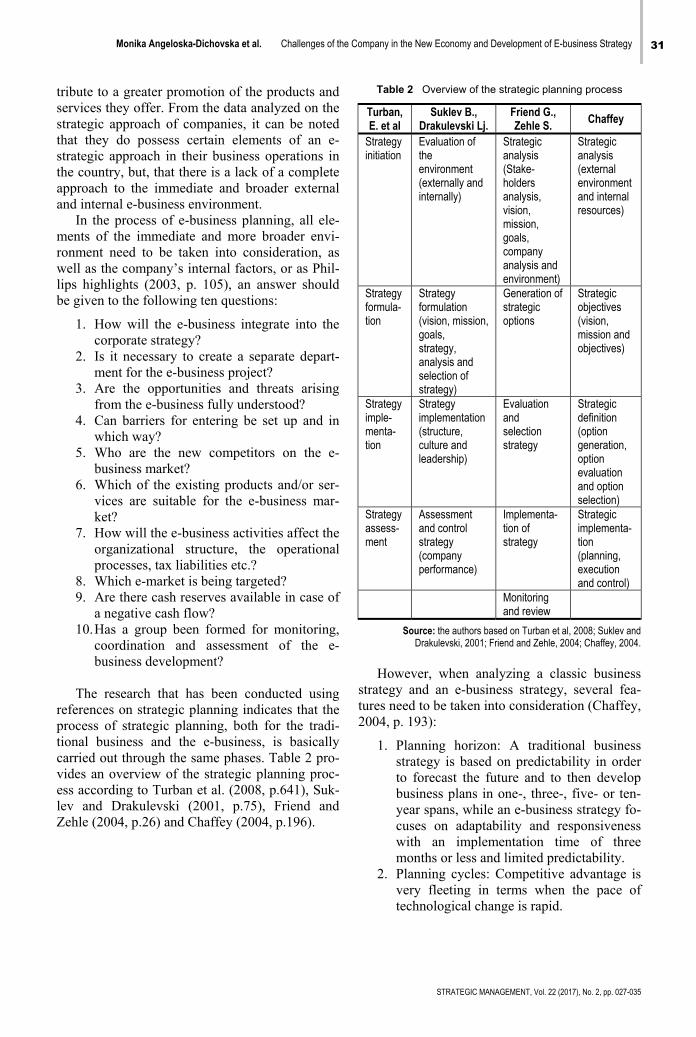
Monika Angeloska-Dichovska et al. Challenges of the Company in the New Economy and Development of E-business Strategy 31
STRATEGIC MANAGEMENT, Vol. 22 (2017), No. 2, pp. 027-035
tribute to a greater promotion of the products and services they offer. From the data analyzed on the strategic approach of companies, it can be noted that they do possess certain elements of an e-strategic approach in their business operations in the country, but, that there is a lack of a complete approach to the immediate and broader external and internal e-business environment.
In the process of e-business planning, all ele-ments of the immediate and more broader envi-ronment need to be taken into consideration, as well as the company’s internal factors, or as Phil-lips highlights (2003, p. 105), an answer should be given to the following ten questions:
1. How will the e-business integrate into the corporate strategy?
2. Is it necessary to create a separate depart-ment for the e-business project?
3. Are the opportunities and threats arising from the e-business fully understood?
4. Can barriers for entering be set up and in which way?
5. Who are the new competitors on the e-business market?
6. Which of the existing products and/or ser-vices are suitable for the e-business mar-ket?
7. How will the e-business activities affect the organizational structure, the operational processes, tax liabilities etc.?
8. Which e-market is being targeted? 9. Are there cash reserves available in case of
a negative cash flow? 10. Has a group been formed for monitoring,
coordination and assessment of the e-business development?
The research that has been conducted using
references on strategic planning indicates that the process of strategic planning, both for the tradi-tional business and the e-business, is basically carried out through the same phases. Table 2 pro-vides an overview of the strategic planning proc-ess according to Turban et al. (2008, p.641), Suk-lev and Drakulevski (2001, p.75), Friend and Zehle (2004, p.26) and Chaffey (2004, p.196).
Table 2 Overview of the strategic planning process
Turban, E. et al
Suklev B., Drakulevski Lj.
Friend G., Zehle S. Chaffey
Strategy initiation
Evaluation of the environment (externally and internally)
Strategic analysis (Stake-holders analysis, vision, mission, goals, company analysis and environment)
Strategic analysis (external environment and internal resources)
Strategy formula-tion
Strategy formulation (vision, mission, goals, strategy, analysis and selection of strategy)
Generation of strategic options
Strategic objectives (vision, mission and objectives)
Strategy imple-menta-tion
Strategy implementation (structure, culture and leadership)
Evaluation and selection strategy
Strategic definition (option generation, option evaluation and option selection)
Strategy assess-ment
Assessment and control strategy (company performance)
Implementa-tion of strategy
Strategic implementa-tion (planning, execution and control)
Monitoring and review
Source: the authors based on Turban et al, 2008; Suklev and Drakulevski, 2001; Friend and Zehle, 2004; Chaffey, 2004.
However, when analyzing a classic business
strategy and an e-business strategy, several fea-tures need to be taken into consideration (Chaffey, 2004, p. 193):
1. Planning horizon: A traditional business strategy is based on predictability in order to forecast the future and to then develop business plans in one-, three-, five- or ten-year spans, while an e-business strategy fo-cuses on adaptability and responsiveness with an implementation time of three months or less and limited predictability.
2. Planning cycles: Competitive advantage is very fleeting in terms when the pace of technological change is rapid.
32 Monika Angeloska-Dichovska et al. Challenges of the Company in the New Economy and Development of E-business Strategy
STRATEGIC MANAGEMENT, Vol. 22 (2017), No. 2, pp. 027-035
3. Power base: On one side is the positional power or strength in the marketplace, while on the other side is the informational power where success is based on access, control and manipulation of critical information.
4. Core focus: From factory and production goods, the focus in e-business strategy is based on the customer.
In the strategic planning process for an e-
business, certain issues need to be taken into ac-count that result from the on-line presence of the business entity, hence, the formulation of the strategy depends on the entity, the industry in which it operates, competition, the nature of the application, etc. Further in this paper, only the second phase of e-strategic planning will be re-viewed, in order to outline the elements that need to be considered when creating an e-business strategy.
3. Developing an e-business strategy in the new economy Once the strategic analysis is completed, a strat-egy is then formulated based on the obtained re-sults (opportunities and threats), or alternatives from the analysis, and in accordance with the goals, mission and vision of the business entity.
The development of the strategy depends greatly on understanding the environment in which the business activities and transactions of the entity are being carried out. Factors related to consumer needs, the way in which services are provided, competition, dealers and suppliers have the greatest influence on the strategy. Local and international economic conditions along with regulations and social circumstances have a broader impact. Ultimately, technological innova-tions are of vital importance in achieving competi-tive advantage and creating a market (Vaskovic & Lutovac, 2009, p. 42).
According to Chen (2005, p. 213), in develop-ing an e-strategy some significant characteristics of e-markets need to be taken into account, such as: some transactions are virtual, the markets are unstable, the markets are fast-moving, companies are highly interconnected and there is high uncer-tainty in the markets.
When developing an e-business strategy it is necessary to follow certain steps (questions), and to apply appropriate analyses that will ease this process. Table 3 provides an overview of the pro-posed steps by Chen (2005, p. 250), Venkatraman (2000, p.16) and Chaffey (2004, pp. 219-230),
who start with an analysis of the current situation and setting of priorities and strategic visions for e-business and continue with the necessary infra-structure and possible benefits along with devel-oping various possible scenarios. In developing an e-business strategy, one set of questions can be accepted or an integrated approach can be made of several groups, with the purpose of developing a competitive, successful and comprehensive strategy.
Table 3 Steps (questions) for developing an
e-business strategy
Stephen Chen N. Venkatraman Chaffey 1. What are the
current state of the industry and the possible
effects of e-business on
the industry? 2. What are the
benefits that e-business can
provide to the customer and to the firm and what new value propositions can e-business
provide? 3. What time is
necessary for e-business
activities and are the market and technology ready?
4. What strategic
posture do we adopt?
5. What are the
possible scenarios for
how the industry will develop?
1. What is your strategic vision for the
e-business activities?
2. How do you
govern e-business
activities? 3. How do you
allocate key resources for
the e-business activities? 4. What is s your
operating infrastructure for e-business activities?
5. Is your management
team aligned for the e-business agenda?
1. What are the e-business priorities?
2. How should
the enterprise restructure in accordance with the
priorities? 3. How can an
overview be made on the opportunities of the new business and on the
revenue models?
4. How can new
technologies be utilized for new markets and for the development of products and
services? 5. How can a
positioning strategy be made?
Source: the authors based on Chen, 2005; Venkatraman, 2000; Chaffey, 2004
Hackbarth and Kettinger (as cited in Philips,
2003,) “suggest that e-business strategy pass through three levels of increasing complexity, which they categorize as experimentation, integra-tion and transformation.” (pp. 106-107). In the first level an e-business strategy does not exist, in
Monika Angeloska-Dichovska et al. Challenges of the Company in the New Economy and Development of E-business Strategy 33
STRATEGIC MANAGEMENT, Vol. 22 (2017), No. 2, pp. 027-035
the second level the e-business strategy supports the existing corporate strategy, and in the third level the e-business strategy is a guide to the cor-porate strategy. The methodology for strategic penetration goes through 4 phases, as follows: initiation (review of project-plans, stakeholders and etc.), diagnosis (industrial analysis and analy-sis of the company), breakout (evaluation and assessments) and transition (transitional e-business strategy).
The basic competitive strategies, or generic strategies that are applied in e-business are as fol-lows: price leadership strategy, differentiation strategy and focus strategy.
In e-business, price leadership can be achieved through several forms, such as: economy of scale, control of all types of costs, reducing promotional activities, imitation products, lower distribution costs, reducing staff, investing in technology that will contribute to the reduction of costs etc.
In formulating the pricing strategy, one should have in consideration that price comparison on the Internet is very simple, very often the prices are set by the buyers, the prices of on-line and off-line products differ (Turban et al., 2008, p. 657).
The differentiation strategy refers to the possi-bilities of business enterprise to differentiate from the competition through certain features of the products and services, by using prestigious tech-nology, innovations, special customer services etc. The promotion that needs to bring closer the differentiated products to the customers also plays a key role in this type of strategy.
Promoting responsibility towards customers, promoting efficiency, promoting innovation and promoting quality are the four specific ways that can lead to reduction of costs and/or to increasing the differentiation, which will result in a com-pany’s competitive advantage (Garet & Jennifer, 2008, pp. 343-344).
The focus strategy is based on the selection of a certain segment of the market, or consumers. By adopting this strategy, business enterprise will have lower costs, as only a certain segment is concerned and not the entire market, as well as the opportunity to develop knowledge and expertise based on the characteristics of the segment, and to use them in improving their future operations (Combe, 2006, p. 236).
In literature there is a debate in regard to the adequacy of the previously mentioned generic strategies in today’s new technological environ-ment. There are proposals for a new framework of generic strategies that would more adequately
reflect the new competition. According to Chen (2005, pp. 238-240), they are as follows: strategy for best product, strategy for customer solutions and strategy for systems lock-in. Today, it is very important for products to be introduced quickly and for them to have a dominant design. With good production options, or with superiority of products and services, enterprises are able to es-tablish good connections with consumers. The second strategic option is directed towards con-sumers, and a little less to the product. Getting to know and doing research on consumers will help the company meet the needs of consumers more easily and faster. The third strategic option (sys-tem lock-in) has the widest possible scope, in this case the company considers all the players in the systems which contribute to the creation of eco-nomic values. In this strategic position, bonding plays its most influential role. The company is particularly concerned with nurturing, attracting and retaining the so-called “complementors” along with the normal industry participants. Table 4 gives the characteristics of the three strategic options.
Table 4 Characteristics of the tree option for strategic
positioning in the e-business environment
1. Best product
2. Customer solutions
3. System lock in
Scop
e
- Low cost- Differentiated
- Bonding - Joint development of product - Outsourcing
- Variety and number of complementors - Open architecture
Scale
Product: market share
Customer: customer share
System: complementor state
Bond
ing
Link to product:- First to market - Dominant design
Link to customer: - Customer lock in - Learning - Customization
Link to system: - Complementor lock-out - proprietary standards
Source: Chen, 2005
With the development of the Internet, enter-
prises have more strategic alternatives (for devel-opment of the market and/or the product, for di-versification, penetration etc.), for entering the electronic market, but the choice for this needs to rely on good alignment of the strategic capabili-ties of the business enterprise and its environment.
34 Monika Angeloska-Dichovska et al. Challenges of the Company in the New Economy and Development of E-business Strategy
STRATEGIC MANAGEMENT, Vol. 22 (2017), No. 2, pp. 027-035
Conclusion The Internet and the widespread use of informa-tion technology have introduced new rules in the new economy, which impose a behavior different from the one today for business entities.
Consumer behavior in the new economy be-comes different with the presence of the Internet and the Internet technology, which strongly im-pact the consumer decision-making process on buying off-line and on-line. Hence, it is necessary for enterprises to get to know consumer behavior on the Internet and create strategies accordingly. The social media are becoming an increasingly more important source of information that is used by consumers, particularly in the search phase in the model of making a decision on purchasing. On the other hand, the increased use of social net-works allows enterprises to foster brands and to impact the process of purchasing. The social me-dia are becoming a significant marketing tool for enterprises. With the rapid technological devel-opment and their widespread adoption and easy application of numerous technologies, enterprises have the opportunity to apply Internet applications and technologies for marketing purposes.
New business models have emerged with the Internet and Internet technologies, which require new knowledge, changed activities and new direc-tions for the success of these models.
The new environment is characterized by in-stability, uncertainty and frequent changes, and is based on the orientation of the enterprises, their customers, suppliers, competitors, as well as of the public sector towards the electronic way of operation.
In the new economy the business enterprises have the opportunity to directly generate a total or a certain part of their income from the Internet, or based on products and services associated with the Internet, or whose products and services enable the use of the Internet for electronic working.
The operating conditions of business enter-prises are becoming more uncertain and dynamic with everyday technological innovations. Hence, the need for strategic planning or strategic acces-sion to the e-business environment becomes an imperative, if enterprises wish to survive and de-velop on the newly created e-markets. Therefore, when entering the e-market, business enterprises need to follow the strategic planning steps: strate-gic analysis (external and internal e-environment), strategic goals (vision, mission, and goals), strat-egy formulation and implementation and control. In order for business enterprises to thrive over
time, they need to constantly follow changes that are happening in the competitive environment, and to harmonize them with their internal re-sources and capacities.
Business enterprises that will not develop a clearly defined e-strategy will are not likely to survive the electronic market. It is not enough for them just to develop a website; it is necessary for them to be able to adapt quickly and often to the conditions in the environment, or to be strategi-cally flexible. In times of a digital revolution, stra-tegic flexibility is characteristic, which enables adaptation to the changing environment. In order for the business enterprise to be able to respond timely to the demands of the environment, it needs to constantly perform monitoring, learning and upgrading.
The Internet technology provides better oppor-tunities for business enterprises to establish dis-tinctive e-strategic positioning. However, the de-velopment of an e-business strategy requires tak-ing notice of the characteristics arising from the Internet and the changes in the environment, thus, a set of steps need to be followed that will facili-tate the formation of this type of strategy. The information technology and the Internet have transformed the basic generic strategies into new e-strategies that are focused more towards prod-ucts with a dominant design, or towards a more detailed analysis of consumer requirements.
The phases of strategic planning in the new economy remain the same as in the traditional; however, the factors that are taken into considera-tion when creating an e-strategy, such as the tech-niques that are applied, are broader and more comprehensive. SM
References Chaffey, D. (2004). E-business and e-commerce
management: Strategy, Implementation and Practice. England: Prentice Hall.
Chaffey, D., Ellis-Chadwick, F., Mayer, R., & Johnston, K. (2006). Internet Marketing – Strategy, Implementation and Practice. Harlow: Pearson Education Limited.
Chen, S. (2005). Strategic Management of e-Business. New Jersey: John Wiley & Sons.
Combe, C. (2006). Introduction to E-business, Management and Strategy. Oxford: Elsevier Ltd.
eMarketer. (2012). Social Media Marketing Can Get Out of Sync with Consumers. Retrieved March 3, 2016 from: http://www.emarketer.com/Article/Social-Media-Marketing-of-Sync-with-Consumers/1009515#MxuGYmdy7o3pDxYD.99
Friend G., & Zehle S. (2004). Guide to Business Planning. London: The Economist.
Garet R. J., & Jennifer M. G. (2008). Contemporary Management. Skopje: Global communications.
Monika Angeloska-Dichovska et al. Challenges of the Company in the New Economy and Development of E-business Strategy 35
STRATEGIC MANAGEMENT, Vol. 22 (2017), No. 2, pp. 027-035
Internet World Stats, (2016). Usage and Population Statistics for Europe. Retrieved March 3, 2016 from: http://www.internetworldstats.com/europa2.htm#mk
Michael A., Hitt, R. Duane I., & Robert E. H. (2008). Strategic Management: Competitiveness & Globalization. Boston: Cengage learning.
Phillips, P. (2003). E-business: strategy. England: McGraw-Hill Education.
Porter, М. Е.(2009). About competition. Skopje: DataPons. Shuklev, B. & Drakulevski L. (2001). Strategic
Management. Skopje: Faculty of Economics.
Turban E., King D., Mckay J., Marshall P., Lee J. & Viehland D. (2008). Electronic Commerce- a managerial perspective. New Jersey: Pearson Education.
Vaskovic, V., Lutovac, М. (2009). Electronic business. Novi Pazar: State University of Novi Pazar.
Venkatraman, N. (2000). Five steps to a dot-com strategy: how to find your footing on the web. Sloan management review 03/2000, 41 (3), 15-27.
Correspondence
Monika Angeloska-Dichovska
Faculty of Economics Prilep Marksova 133, Prilep, Republic of Macedonia
E-mail: [email protected]
STRATEGIC MANAGEMENT, Vol. 22 (2017), No. 2, pp. 036-040 UDC 658.148(497.11)
Received: December 14, 2016
Accepted: March 9, 2017
Indebtedness of Enterprises and Profitability Improvement
Kristina Mijić University of Novi Sad, Faculty of Economics in Subotica, Subotica, Serbia
Dejan Jakšić University of Novi Sad, Faculty of Economics in Subotica, Subotica, Serbia
Abstract This paper presents an analysis of the efficiency of the indebtedness of companies in the Republic of Serbia.In order to investigate whether the companies’ borrowing is accompanied by the efficient investment of re-sources and the achievement of better profitability, the correlation analysis of level of indebtedness and profit-ability was conducted. The research was based on a sample of 42,057 observations of companies that oper-ated in the Republic of Serbia in the period 2009-2013. The research results indicate that the debt is nega-tively correlated with the level of profitability, which shows a weak ability of companies to improve their per-formance through additional debt. Keywords Indebtedness, profitability, economy of Serbia.
Introduction Companies need to provide sources for funding their activities in order to achieve growth and de-velopment on the market. Companies can finance their activities from their own capital or by debt. Financing from owner’s equity is achieved by increasing the capital by the new ownership or the retention of profit. The company’s ability to gen-erate profits is one of the key factors of financing and it affects the company’s ability to attract addi-tional capital investment. On the other hand, com-panies may decide to finance their activities by indebtedness which causes additional expense such as interest rate (Jakšić, & Mijić, 2013). Even then, the profit has an important role when the creditors consider the risk of collection of receiv-ables. Creditors determine whether the company is able to generate cash flows, or indebtedness should be based on one of the collaterals (mort-gages, guarantees, pledges, etc.).
Additional borrowing of companies should be related to the efficient and effective investment in business activities. Performances of the company can be expressed through profitability as a key
indicator of the possibilities of the company to generate profit in relation to the invested re-sources. Companies that gain profit in spite of debt make a positive impact on economic development since they provide the ability to stimulate investment and additional employment. On the other hand, if the companies make a loss they could have serious problems, such as the problem of short-term payment, insolvency, bank-ruptcy, and unemployment.
In order to investigate whether the additional borrowing of companies in the Republic of Serbia is effective and whether it results in higher profit-ability, the analysis of the relation between debt and profitability was carried out. For the study, the data about profitability and debt was used based on the sample of companies from 15 busi-ness sectors in the period 2009-2013. Data were taken from the Amadeus database which contains financial data and other information of public and private companies in Europe (Amadeus, 2015).
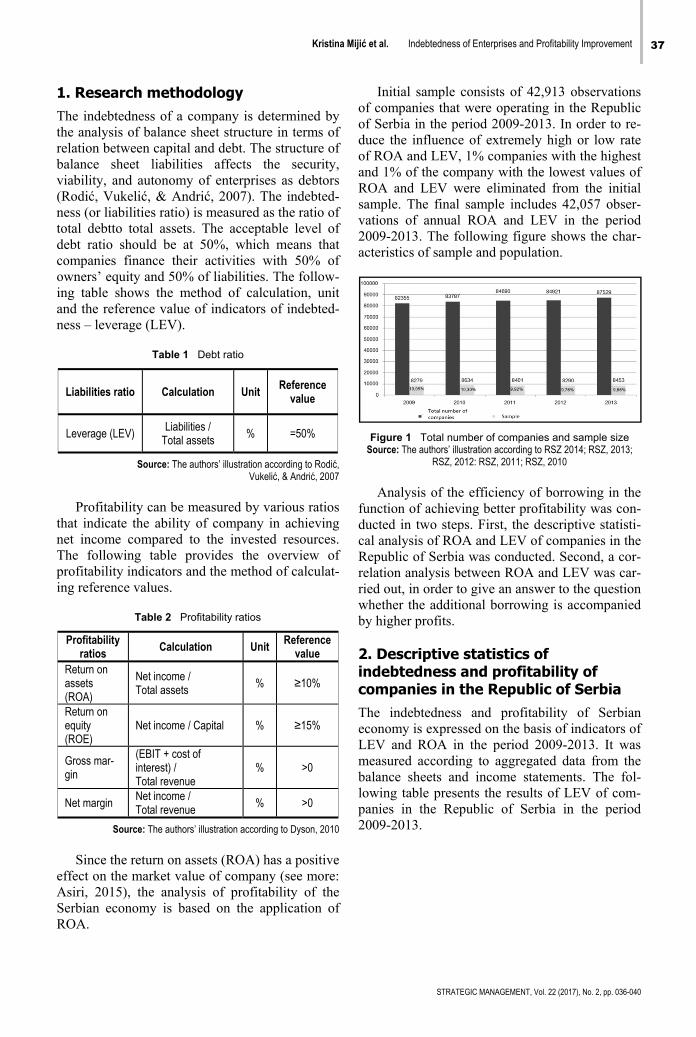
Kristina Mijić et al. Indebtedness of Enterprises and Profitability Improvement 37
STRATEGIC MANAGEMENT, Vol. 22 (2017), No. 2, pp. 036-040
1. Research methodology The indebtedness of a company is determined by the analysis of balance sheet structure in terms of relation between capital and debt. The structure of balance sheet liabilities affects the security, viability, and autonomy of enterprises as debtors (Rodić, Vukelić, & Andrić, 2007). The indebted-ness (or liabilities ratio) is measured as the ratio of total debtto total assets. The acceptable level of debt ratio should be at 50%, which means that companies finance their activities with 50% of owners’ equity and 50% of liabilities. The follow-ing table shows the method of calculation, unit and the reference value of indicators of indebted-ness – leverage (LEV).
Table 1 Debt ratio
Liabilities ratio Calculation Unit Reference value
Leverage (LEV) Liabilities /
Total assets % =50%
Source: The authors’ illustration according to Rodić, Vukelić, & Andrić, 2007
Profitability can be measured by various ratios
that indicate the ability of company in achieving net income compared to the invested resources. The following table provides the overview of profitability indicators and the method of calculat-ing reference values.
Table 2 Profitability ratios
Profitability ratios Calculation Unit Reference
value Return on assets (ROA)
Net income / Total assets
% ≥10%
Return on equity (RОЕ)
Net income / Capital % ≥15%
Gross mar-gin
(EBIT + cost of interest) / Total revenue
% >0
Net margin Net income / Total revenue
% >0
Source: The authors’ illustration according to Dyson, 2010
Since the return on assets (ROA) has a positive
effect on the market value of company (see more: Asiri, 2015), the analysis of profitability of the Serbian economy is based on the application of ROA.
Initial sample consists of 42,913 observations of companies that were operating in the Republic of Serbia in the period 2009-2013. In order to re-duce the influence of extremely high or low rate of ROA and LEV, 1% companies with the highest and 1% of the company with the lowest values of ROA and LEV were eliminated from the initial sample. The final sample includes 42,057 obser-vations of annual ROA and LEV in the period 2009-2013. The following figure shows the char-acteristics of sample and population.
Figure 1 Total number of companies and sample size Source: The authors’ illustration according to RSZ 2014; RSZ, 2013;
RSZ, 2012: RSZ, 2011; RSZ, 2010
Analysis of the efficiency of borrowing in the
function of achieving better profitability was con-ducted in two steps. First, the descriptive statisti-cal analysis of ROA and LEV of companies in the Republic of Serbia was conducted. Second, a cor-relation analysis between ROA and LEV was car-ried out, in order to give an answer to the question whether the additional borrowing is accompanied by higher profits.
2. Descriptive statistics of indebtedness and profitability of companies in the Republic of Serbia The indebtedness and profitability of Serbian economy is expressed on the basis of indicators of LEV and ROA in the period 2009-2013. It was measured according to aggregated data from the balance sheets and income statements. The fol-lowing table presents the results of LEV of com-panies in the Republic of Serbia in the period 2009-2013.
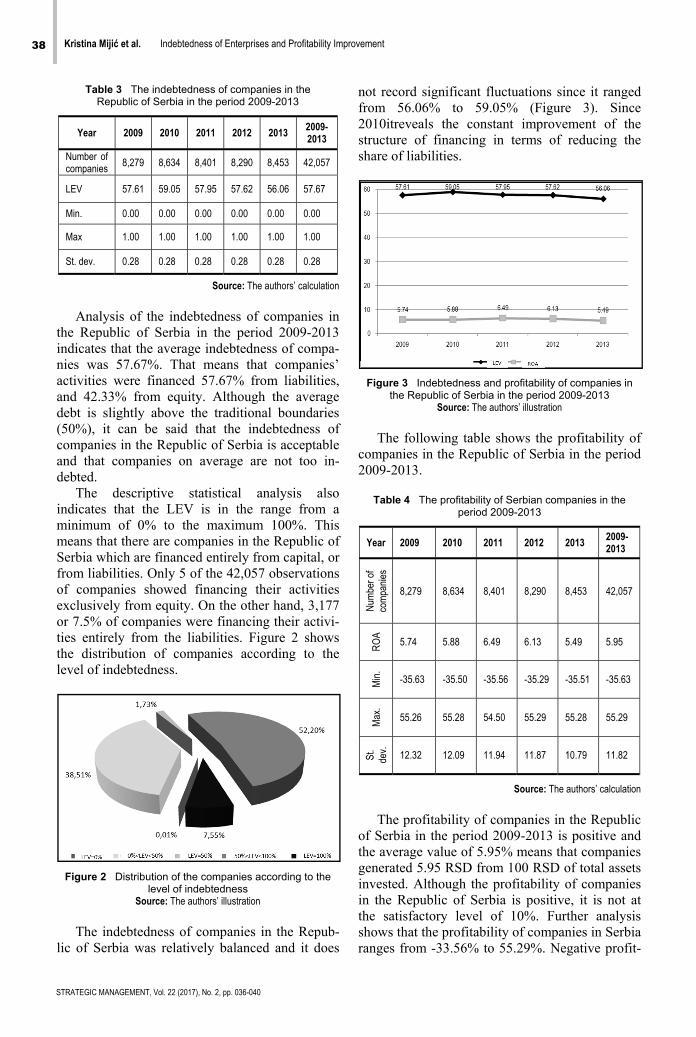
38 Kristina Mijić et al. Indebtedness of Enterprises and Profitability Improvement
STRATEGIC MANAGEMENT, Vol. 22 (2017), No. 2, pp. 036-040
Table 3 The indebtedness of companies in the Republic of Serbia in the period 2009-2013
Year 2009 2010 2011 2012 2013 2009-2013
Number of companies 8,279 8,634 8,401 8,290 8,453 42,057
LEV 57.61 59.05 57.95 57.62 56.06 57.67
Min. 0.00 0.00 0.00 0.00 0.00 0.00
Max 1.00 1.00 1.00 1.00 1.00 1.00
St. dev. 0.28 0.28 0.28 0.28 0.28 0.28
Source: The authors’ calculation Analysis of the indebtedness of companies in
the Republic of Serbia in the period 2009-2013 indicates that the average indebtedness of compa-nies was 57.67%. That means that companies’ activities were financed 57.67% from liabilities, and 42.33% from equity. Although the average debt is slightly above the traditional boundaries (50%), it can be said that the indebtedness of companies in the Republic of Serbia is acceptable and that companies on average are not too in-debted.
The descriptive statistical analysis also indicates that the LEV is in the range from a minimum of 0% to the maximum 100%. This means that there are companies in the Republic of Serbia which are financed entirely from capital, or from liabilities. Only 5 of the 42,057 observations of companies showed financing their activities exclusively from equity. On the other hand, 3,177 or 7.5% of companies were financing their activi-ties entirely from the liabilities. Figure 2 shows the distribution of companies according to the level of indebtedness.
Figure 2 Distribution of the companies according to the level of indebtedness
Source: The authors’ illustration The indebtedness of companies in the Repub-
lic of Serbia was relatively balanced and it does
not record significant fluctuations since it ranged from 56.06% to 59.05% (Figure 3). Since 2010itreveals the constant improvement of the structure of financing in terms of reducing the share of liabilities.
Figure 3 Indebtedness and profitability of companies in the Republic of Serbia in the period 2009-2013
Source: The authors’ illustration The following table shows the profitability of
companies in the Republic of Serbia in the period 2009-2013.
Table 4 The profitability of Serbian companies in the
period 2009-2013
Year 2009 2010 2011 2012 2013 2009-2013
Num
ber o
f co
mpa
nies
8,279 8,634 8,401 8,290 8,453 42,057
RO
A
5.74 5.88 6.49 6.13 5.49 5.95
Min
.
-35.63 -35.50 -35.56 -35.29 -35.51 -35.63
Max
.
55.26 55.28 54.50 55.29 55.28 55.29
St.
dev.
12.32 12.09 11.94 11.87 10.79 11.82
Source: The authors’ calculation
The profitability of companies in the Republic
of Serbia in the period 2009-2013 is positive and the average value of 5.95% means that companies generated 5.95 RSD from 100 RSD of total assets invested. Although the profitability of companies in the Republic of Serbia is positive, it is not at the satisfactory level of 10%. Further analysis shows that the profitability of companies in Serbia ranges from -33.56% to 55.29%. Negative profit-
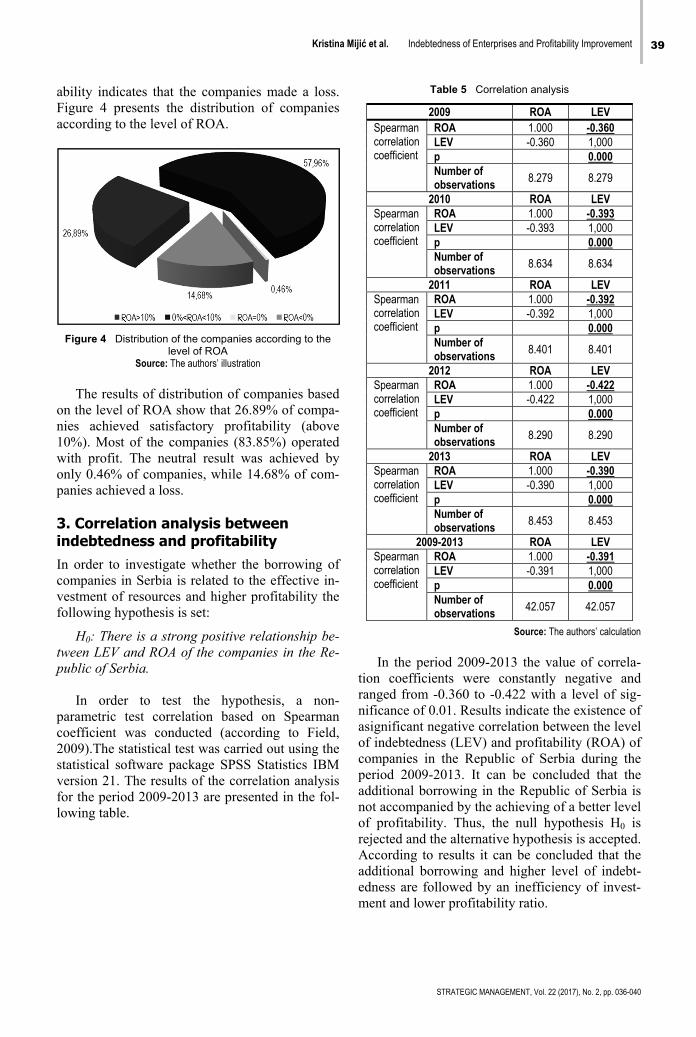
Kristina Mijić et al. Indebtedness of Enterprises and Profitability Improvement 39
STRATEGIC MANAGEMENT, Vol. 22 (2017), No. 2, pp. 036-040
ability indicates that the companies made a loss. Figure 4 presents the distribution of companies according to the level of ROA.
Figure 4 Distribution of the companies according to the level of ROA
Source: The authors’ illustration The results of distribution of companies based
on the level of ROA show that 26.89% of compa-nies achieved satisfactory profitability (above 10%). Most of the companies (83.85%) operated with profit. The neutral result was achieved by only 0.46% of companies, while 14.68% of com-panies achieved a loss.
3. Correlation analysis between indebtedness and profitability In order to investigate whether the borrowing of companies in Serbia is related to the effective in-vestment of resources and higher profitability the following hypothesis is set:
H0: There is a strong positive relationship be-tween LEV and ROA of the companies in the Re-public of Serbia.
In order to test the hypothesis, a non-
parametric test correlation based on Spearman coefficient was conducted (according to Field, 2009).The statistical test was carried out using the statistical software package SPSS Statistics IBM version 21. The results of the correlation analysis for the period 2009-2013 are presented in the fol-lowing table.
Table 5 Correlation analysis
2009 ROA LEV Spearman correlation coefficient
ROA 1.000 -0.360 LEV -0.360 1,000 p 0.000 Number of observations 8.279 8.279
2010 ROA LEV Spearman correlation coefficient
ROA 1.000 -0.393 LEV -0.393 1,000 p 0.000 Number of observations 8.634 8.634
2011 ROA LEV Spearman correlation coefficient
ROA 1.000 -0.392 LEV -0.392 1,000 p 0.000 Number of observations 8.401 8.401
2012 ROA LEV Spearman correlation coefficient
ROA 1.000 -0.422 LEV -0.422 1,000 p 0.000 Number of observations 8.290 8.290
2013 ROA LEV Spearman correlation coefficient
ROA 1.000 -0.390 LEV -0.390 1,000 p 0.000 Number of observations 8.453 8.453
2009-2013 ROA LEV Spearman correlation coefficient
ROA 1.000 -0.391 LEV -0.391 1,000 p 0.000 Number of observations 42.057 42.057
Source: The authors’ calculation In the period 2009-2013 the value of correla-
tion coefficients were constantly negative and ranged from -0.360 to -0.422 with a level of sig-nificance of 0.01. Results indicate the existence of asignificant negative correlation between the level of indebtedness (LEV) and profitability (ROA) of companies in the Republic of Serbia during the period 2009-2013. It can be concluded that the additional borrowing in the Republic of Serbia is not accompanied by the achieving of a better level of profitability. Thus, the null hypothesis H0 is rejected and the alternative hypothesis is accepted. According to results it can be concluded that the additional borrowing and higher level of indebt-edness are followed by an inefficiency of invest-ment and lower profitability ratio.
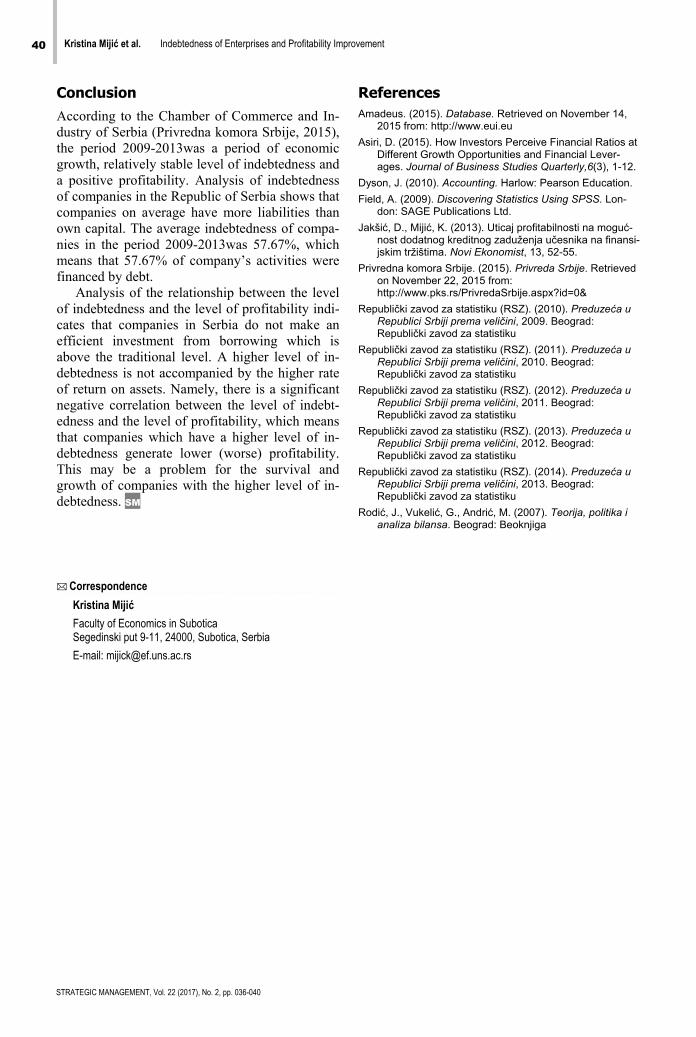
40 Kristina Mijić et al. Indebtedness of Enterprises and Profitability Improvement
STRATEGIC MANAGEMENT, Vol. 22 (2017), No. 2, pp. 036-040
Conclusion According to the Chamber of Commerce and In-dustry of Serbia (Privredna komora Srbije, 2015), the period 2009-2013was a period of economic growth, relatively stable level of indebtedness and a positive profitability. Analysis of indebtedness of companies in the Republic of Serbia shows that companies on average have more liabilities than own capital. The average indebtedness of compa-nies in the period 2009-2013was 57.67%, which means that 57.67% of company’s activities were financed by debt.
Analysis of the relationship between the level of indebtedness and the level of profitability indi-cates that companies in Serbia do not make an efficient investment from borrowing which is above the traditional level. A higher level of in-debtedness is not accompanied by the higher rate of return on assets. Namely, there is a significant negative correlation between the level of indebt-edness and the level of profitability, which means that companies which have a higher level of in-debtedness generate lower (worse) profitability. This may be a problem for the survival and growth of companies with the higher level of in-debtedness. SM
References Amadeus. (2015). Database. Retrieved on November 14,
2015 from: http://www.eui.eu Asiri, D. (2015). How Investors Perceive Financial Ratios at
Different Growth Opportunities and Financial Lever-ages. Journal of Business Studies Quarterly,6(3), 1-12.
Dyson, J. (2010). Accounting. Harlow: Pearson Education. Field, A. (2009). Discovering Statistics Using SPSS. Lon-
don: SAGE Publications Ltd. Jakšić, D., Mijić, K. (2013). Uticaj profitabilnosti na moguć-
nost dodatnog kreditnog zaduženja učesnika na finansi-jskim tržištima. Novi Ekonomist, 13, 52-55.
Privredna komora Srbije. (2015). Privreda Srbije. Retrieved on November 22, 2015 from: http://www.pks.rs/PrivredaSrbije.aspx?id=0&
Republički zavod za statistiku (RSZ). (2010). Preduzeća u Republici Srbiji prema veličini, 2009. Beograd: Republički zavod za statistiku
Republički zavod za statistiku (RSZ). (2011). Preduzeća u Republici Srbiji prema veličini, 2010. Beograd: Republički zavod za statistiku
Republički zavod za statistiku (RSZ). (2012). Preduzeća u Republici Srbiji prema veličini, 2011. Beograd: Republički zavod za statistiku
Republički zavod za statistiku (RSZ). (2013). Preduzeća u Republici Srbiji prema veličini, 2012. Beograd: Republički zavod za statistiku
Republički zavod za statistiku (RSZ). (2014). Preduzeća u Republici Srbiji prema veličini, 2013. Beograd: Republički zavod za statistiku
Rodić, J., Vukelić, G., Andrić, M. (2007). Teorija, politika i analiza bilansa. Beograd: Beoknjiga
Correspondence
Kristina Mijić
Faculty of Economics in Subotica Segedinski put 9-11, 24000, Subotica, Serbia
E-mail: [email protected]
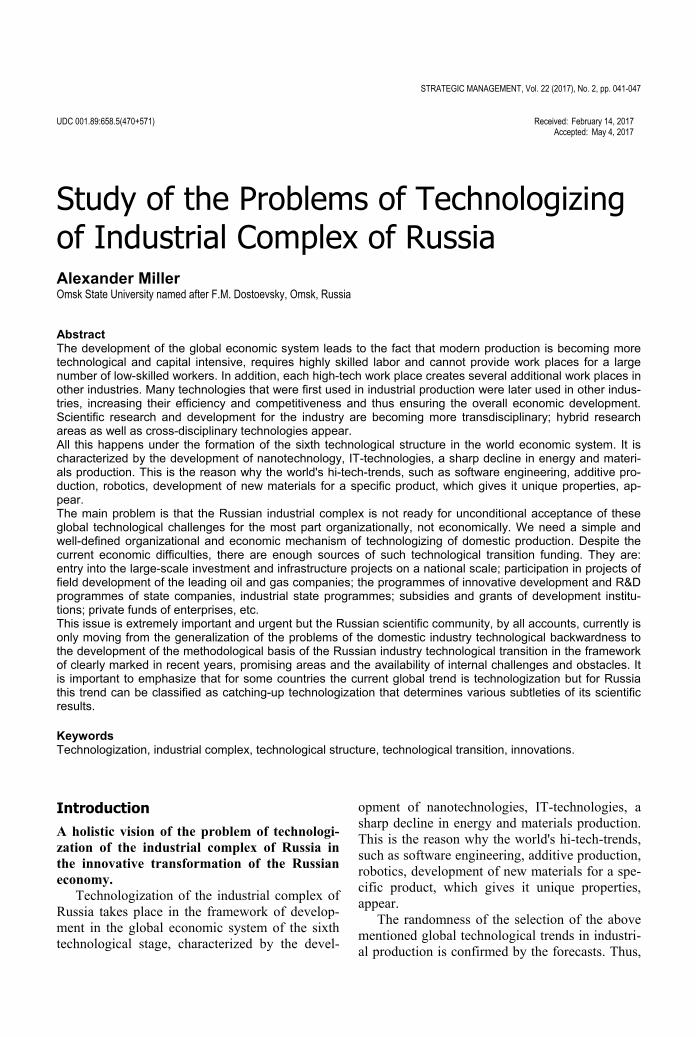
STRATEGIC MANAGEMENT, Vol. 22 (2017), No. 2, pp. 041-047 UDC 001.89:658.5(470+571)
Received: February 14, 2017
Accepted: May 4, 2017
Study of the Problems of Technologizing of Industrial Complex of Russia
Alexander Miller Omsk State University named after F.M. Dostoevsky, Omsk, Russia
Abstract The development of the global economic system leads to the fact that modern production is becoming moretechnological and capital intensive, requires highly skilled labor and cannot provide work places for a largenumber of low-skilled workers. In addition, each high-tech work place creates several additional work places in other industries. Many technologies that were first used in industrial production were later used in other indus-tries, increasing their efficiency and competitiveness and thus ensuring the overall economic development.Scientific research and development for the industry are becoming more transdisciplinary; hybrid research areas as well as cross-disciplinary technologies appear. All this happens under the formation of the sixth technological structure in the world economic system. It ischaracterized by the development of nanotechnology, IT-technologies, a sharp decline in energy and materi-als production. This is the reason why the world's hi-tech-trends, such as software engineering, additive pro-duction, robotics, development of new materials for a specific product, which gives it unique properties, ap-pear. The main problem is that the Russian industrial complex is not ready for unconditional acceptance of theseglobal technological challenges for the most part organizationally, not economically. We need a simple andwell-defined organizational and economic mechanism of technologizing of domestic production. Despite the current economic difficulties, there are enough sources of such technological transition funding. They are:entry into the large-scale investment and infrastructure projects on a national scale; participation in projects of field development of the leading oil and gas companies; the programmes of innovative development and R&Dprogrammes of state companies, industrial state programmes; subsidies and grants of development institu-tions; private funds of enterprises, etc. This issue is extremely important and urgent but the Russian scientific community, by all accounts, currently isonly moving from the generalization of the problems of the domestic industry technological backwardness tothe development of the methodological basis of the Russian industry technological transition in the frameworkof clearly marked in recent years, promising areas and the availability of internal challenges and obstacles. Itis important to emphasize that for some countries the current global trend is technologization but for Russia this trend can be classified as catching-up technologization that determines various subtleties of its scientificresults. Keywords Technologization, industrial complex, technological structure, technological transition, innovations.
Introduction A holistic vision of the problem of technologi-zation of the industrial complex of Russia in the innovative transformation of the Russian economy.
Technologization of the industrial complex of Russia takes place in the framework of develop-ment in the global economic system of the sixth technological stage, characterized by the devel-
opment of nanotechnologies, IT-technologies, a sharp decline in energy and materials production. This is the reason why the world's hi-tech-trends, such as software engineering, additive production, robotics, development of new materials for a spe-cific product, which gives it unique properties, appear.
The randomness of the selection of the above mentioned global technological trends in industri-al production is confirmed by the forecasts. Thus,
42 Alexander Miller Study of the Problems of Technologizing of Industrial Complex of Russia
STRATEGIC MANAGEMENT, Vol. 22 (2017), No. 2, pp. 041-047
the software market for computer engineering, according to experts, will increase by 8.5 % per year; global sales of industrial robots will grow at least 5 % a year; the growth rate of additive man-ufacturing exceeds 25 %. About 80 % of innova-tions in leading industries and sectors of the econ-omy are based on the introduction of new mate-rials and production technologies (Russian Feder-ation in figures, 2015).
Russia is far behind in these areas. Thus, the average global density of industrial robots equals 62 robots to 10 thousand people working in the industrial sector. In comparison, in Russia 2 ro-bots account for the same number of people em-ployed in the industrial sector. Russia’s share in the total number of operating in the world additive manufacturing systems is only 1,4% (Russian Federation in figures, 2015). Scientific and tech-nological achievements are a bit better in comput-er programming and engineering as well as in the creation of new materials; but still the level of Russia in these areas is not comparable with the world one. Moreover, there is no critical necessity for the development of internal need that is un-derstood as the need of national organizations in these developments.
1. Methodology 1.1. Scientific background to the study of technologization of the industrial complex of Russia The foundations of modern understanding of technologization were laid by Th. Schumpeter. In the book "Theory of economic development" he shows its key role in the economic development of society. He believes that technologization should be understood as innovation in production and non-production sphere of technological, orga-nizational and economic nature. According to Schumpeter, there are five cases of implementa-tion of new combinations of production factors: 1. Implementation of a new good which is still un-known to consumers, or the creation of new quali-ty or another good. 2. Introduction of a new (vir-tually unknown in this sphere of activity) method of production which is based on the new scientific discovery and can represent a new method of the relevant goods' usage. 3. Development of a new market where such sphere of activity has not been presented yet, regardless of whether this market has existed before or not. 4. Obtaining a new source of raw materials or semi-finished products, regardless of whether this source has existed be-
fore or it has simply not been taken into account or considered unavailable, or it will be created in the future. 5. Carrying out appropriate restructur-ing, for example, ensuring a monopoly position or undermining the monopoly position of another business entity (Schumpeter, 1982, 452 p).
Th. Schumpeter accordingly gave a detailed description of organizational and technological activities affecting the nature and speed of the economic system development. Organizational and technological activities are aimed at: the crea-tion, organization of production and sales of radi-cally new products or products with new consum-er properties; the creation and application of new (or upgrading of existing) technologies of produc-tion, distribution and use of products; the applica-tion of structural, financial and economic, person-nel, informational and other innovations providing either cost savings, or the growth of production volumes and sales of marketable products in the process of their development, organization of pro-duction, production and distribution.
The theory of "long waves" developed by N. Kondratieff explains the idea of technologization in collaboration with economic downturns and upturns. The essence of this theory, in its most general terms, can be described in the following way: every major technological shift leads to the creation of numerous large and small innovations and opens up new areas of capital application; rapid accumulation of capital in new industries leads to long-term economic growth; increase in production of new products leads to market satu-ration, and the demand for new products falls sharply; the amount of capital involved in new industries during the period of active expansion of production becomes excessive; there begins a long depression, which can be overcome only as a result of the next technological breakthrough.
There exist two approaches which consider a specific mechanism of primary catch-up technolo-gization.
The first approach is presented in the study of G. Mensch and A. Kleinknecht, who believe that the deterioration of the enterprise condition creates incentives for the development of new technolo-gies. On the contrary, when an enterprise prospers there is no need to change anything seriously in already-established production. G. Mensch indi-cates that the end of prosperity of old industries increases the tendency of capital owners to invest in new products and technologies. Despite the fact that the profit in the depression phase is small, the owners see less risk in investment of capital in
Alexander Miller Study of the Problems of Technologizing of Industrial Complex of Russia 43
STRATEGIC MANAGEMENT, Vol. 22 (2017), No. 2, pp. 041-047
changes than in investment of capital in old prod-ucts and technologies or debt obligations (Mensch, 1979, pp.60-74). A. Kleinknecht stresses (Kleink-necht, 1987, 235 p.) that during the prolonged eco-nomic crises the transition of an industrial enterprise from the strategy of profit maximization (which it adheres to in a period of prosperity) to the strategy of minimization, depending on the market condi-tions, takes place. As long as the existing products and technologies bring substantial profit, the ten-dency to the development of new technologies is low, as production activities are always associated with risk. When there comes a prolonged crisis and prospects in traditional industries deteriorate, the risk of the emergence of new technologies stops being an insurmountable obstacle, as any other al-ternatives can be even more risky. The overall con-clusion which can be done on the basis of this scheme is the following: the largest number of emerging basic technologies evolves in the period of heavy and prolonged depression.
The second approach was developed by G. Clark. From his point of view, a prosperous in-dustrial enterprise, which is confident in the prospects of expansion of the market and profit growth, shows increased organizational and technological activities (Clark, 1981, pp. 308-322). In case of difficulties the company is not engaged in technological changes.
Therefore, the bulk of the primary emerging technologies is implemented in the period of long-term improvement of conditions.
The target reference point is the development of theoretical and methodological and practical aspects of technologization of enterprises of the industrial complex of Russia. It actualizes the concept of technologization of enterprises as global and national challenge to the modern inno-vation economy; the spread of elements of the new technological stage in the sectors of the do-mestic manufacturing industry; monitoring of technologization of enterprises of the Russian industrial complex.
The concept of technologization of industrial enterprises of manufacturing industry should be understood as the way of a system organization of production and economic activities of enterprises, based on bringing the used equipment and tech-nologies in line with global technological stage and market conditions. The differences from the periodic replacement of equipment and technolo-gies that companies used to implement and im-plement generally are:
1) A significant tightening of the requirements for technical and technological content of the production process in recent years.
Some time ago or even today there existed (or
still exist) a machinery and equipment for manu-facturing of products through traditional machin-ing; we used (or still use) such automation of pro-duction processes as relays and switches; and the standard materials used in production were (are still) metals and plastic. In the future everything will change greatly: additive production and laser processing will be used for manufacturing of products; industrial robotics and sensor systems will be an integral part of production processes; composite materials will be used widely.
2) In today's Russia such system work has never been performed.
Some private initiatives in this field can not
form a critical mass of different advanced domes-tic production of high technological level, com-plementing each other. The creation of such "high-tech cluster" in the present conditions can be realized only upon the development of organi-zational and economic mechanism at the national level, which will be subdivided into sectoral and regional levels as well the level of enterprises.
The choice of manufacturing industries for priority technologization is explained both by the presence of "chain" of added value in these indus-tries (which increases the competitiveness of the country) and the changes in institutional condi-tions for domestic enterprises in 2014-2015 (which include devaluation of the ruble, sanctions and decline in oil prices). The combination of these factors leads to a quite logical turn towards the manufacturing sector in state priorities of the economic development of Russia.
Now the average age of the equipment in manufacturing industry in Russia is 12 years. De-preciation of fixed assets equals 45%. In a number of strategic industries (machine tools, electronic industry, pharmaceutical, medical industries) the share of imported equipment and products reach 80%, and in some cases it is even 90%. In most cases almost all Russian equipment is old (Indus-try of Russia, 2014).
At the meeting of the Presidium of the Presi-dential Council of the Russian Federation on eco-nomic modernization and innovative development of Russia "On the development of new production technologies" in September 2014 the following perspective (from the point of view of world
44 Alexander Miller Study of the Problems of Technologizing of Industrial Complex of Russia
STRATEGIC MANAGEMENT, Vol. 22 (2017), No. 2, pp. 041-047
trends) technological directions were identified: additive technology, new materials, industrial au-tomation and robotics (The solutions as a result of the meeting of the Presidium of the Council under the President of the Russian Federation on econ-omy modernization and innovation development. About development of new manufacturing tech-nology, 2014). These directions can be considered clear benchmarks for technologization of the manufacturing enterprises of the Russian Federa-tion
1.2. Justification and disclosure of the content of the technical and technological approach to the study of technologization of the industrial complex of Russia The main tasks of technologization of the indus-trial complex include:
1. Disclosure of the technical and technologi-cal approach will allow to obtain funda-mentally new results while studying the processes of technologization of industrial enterprises. The essence of the technical and technological approach is that techno-logization is considered as a non-isolated reproduction process, but a process which is included in the technical and technologi-cal cycle of an industrial enterprise.
This approach has its own unique features:
1) it is based on the reproduction interpretation of technologization which is inextricably interlinked with the development of the industry; 2) target orientation of management on the resource re-quirements of the technologization process, name-ly, quality information and technical support at all its stages aimed at improving the competitiveness of manufacturing industries; 3) taking into ac-count special priorities, principles and functions of management of development of the enterprise technologization; 4) information flexibility which suggests that the processes of technologization are formed, first, on the basis of the specificity and dynamics of the factor influence and, second, from the signals of deviations from the desired reproduction path; 5) versatility in application in relation to enterprises of various branch affilia-tion; 6) predetermination by the conditions of modern technological evolution; 7) the ability to reduce fragmentation and segmentation in the methodology of the subject area of the research.
The approach will allow to: 1) formalize tech-nologization as a key process of technological policy of industrial development in Russia; 2)
identify the specificity of catching up technologi-cal modernization; 3) synthesize the effect of ma-cro- and micro factors; 4) give economic evalua-tion of the integrated result of technologization of manufacturing enterprises.
2. Disclosure of the multifaceted content and expansion of multi-orientation of imple-mentation of technologization in domestic manufacturing industry in the framework of the priorities of the Russian scientific and technological complex development are focused on solving new problems asso-ciated with the development of a new tech-nological stage. In this connection, it is ad-visable to identify institutional constraints to the development of modern production technologies. The first constraint is the strong presence of the state in the industry. A high role of the state in the industry and a huge amount of public order determine the attitude of industrial enterprises to in-novations, the need for production renova-tion and introduction of new technologies. In Russia the state creates innovative de-velopment by means of using the adminis-trative resource, although international ex-perience shows that private companies in-troduce innovations more readily and more efficiently. If an industrial enterprise has a government order it means that this com-pany doesn't actually need new technolo-gies. The situation is different with private enterprises which “serve the market” and, therefore, need new technologies.
In addition, there is a dilemma: on the one
hand, the state recognizes that its objective is to increase the number of jobs in the country; on the other hand, it also stands for an active introduc-tion of innovations, which leads to an increase in production efficiency, increase in the level of au-tomation, and, accordingly, the release of work-ers. The introduction of production technologies leads to the decrease of dependence on a large number of low-skilled labour resources, and in-creases the dependence on a small number of highly qualified employees. It means that it will be necessary to release a significant number of low-skilled workers; and this invariably causes social tensions, which the state is also trying to control.
The second constraint is connected with a high level of monopoly. The use of new production technologies enables an enterprise to gain a com-
Alexander Miller Study of the Problems of Technologizing of Industrial Complex of Russia 45
STRATEGIC MANAGEMENT, Vol. 22 (2017), No. 2, pp. 041-047
petitive advantage by improving manageability, speed and efficiency of production processes. In developed countries, the main investor in research and development is the industry, whose share in the total cost of private business in this area is 60-90%. Such significant amounts of investment in R&D are explained by the desire of companies operating in a competitive environment, to reduce their costs. In Russian conditions, when there are practically no competitors in some industrial sec-tors, it is extremely difficult to motivate entrepre-neurs to innovative behavior.
The third constraint is related to the fact that national proposals of technological innovation for the introduction in the industry are very limited. Currently 62% of Russian enterprises do not see the possibility of using domestic equipment and raw materials instead of imported ones because of the lack of the former. Herewith, 35% of enter-prises have a claim relating to domestic equiva-lents (Russian Federation in figures, 2015). Under these conditions, in some cases it is easier and cheaper for the Russian industrial enterprises to buy foreign scientific and technical production. In addition, one more serious problem is connected with the fact that manufacturers just do not have enough information about domestic develop-ments.
The lack of incentives for the introduction of industrial technologies is the fourth institutional constraint. Inflexible fiscal policy, high social insurance burden, and administrative barriers con-tribute to the reduction of investments of Russian manufactures in innovative technologies. If the burden on manufacturing business is further in-creased, especially the compulsory social insur-ance payments, enterprises will push innovations in the residual financing principles even stronger. In addition, investments in own or purchased in-novations carry certain risks, which also reduces the motivation to free up more funds for them.
The innovation policy which followed sup-ports so-called "garage" innovations, the main consumer of which is small and medium-sized business. In this regard, there is an urgent need to develop a mechanism which will allow to stimu-late large enterprises so that they invest in R&D and introduce innovative technologies.
This leads to the conclusion that for the effec-tive development of innovations in the Russian industry it is necessary: firstly, to create favorable conditions, and secondly, to concentrate efforts and resources on the priority (in terms of global technology trends) directions.
3. The argumentation of the content and the development of directions of realization of organizational and economic mechanism of the technologization of manufacturing en-terprises in the conditions of economic constraints open up new fields of research connected with processes of technologiza-tion of both manufacturing enterprises, and enterprises in various industrial branches.
2. Study results The expected results will be focused on two areas:
The first result is associated both with the ex-pansion of theoretical knowledge and obtaining new data about the processes of technologization of manufacturing enterprises. It is expressed in the development of a new scientific concept of tech-nologization of manufacturing enterprises, which develops the theory of the organization and the general theory of modern management. The in-crement of scientific knowledge is based on the justification of the specific of technologization of manufacturing enterprises, which lies in the trans-formation of traditional subject matter, object, goals, objectives, principles, functions and tech-nologization tools in accordance with the value and target guidelines of the organization of indus-trial production, focused on solving the produc-tion problems of the manufacturing industry. The concept will be based on technical and technolo-gical approach to the formation of modern techno-logization processes, quantification and parame-tric methods that underpin the assessment tools. In aggregate, it can improve the quality of manageri-al decisions in the subject area of the research, allowing to establish a quantitative determination regarding the quality characteristics of technolo-gization of manufacturing enterprises, as well as determine the parametric ratio of technologization parameters and management of manufacturing system of manufacturing enterprises. The devel-oped concept of technologization of enterprises as a global and national challenge for the modern industry will find its application in the theoretical and methodological substantiation of the spread of elements of the new technological stage in the sectors of the domestic manufacturing industry (additive production, digital production, robotics, etc.).
The second result is focused on the theoretical and methodological basis of the principles and mechanisms of regulation of technologization of manufacturing enterprises from the viewpoint of a
46 Alexander Miller Study of the Problems of Technologizing of Industrial Complex of Russia
STRATEGIC MANAGEMENT, Vol. 22 (2017), No. 2, pp. 041-047
dynamic system process. This process includes management actions which are aimed at the or-ganization, analysis, planning, forecasting, regula-tion, control over the formation and direction of the technologization impact on the performance of the manufacturing enterprises; and are designed to provide enterprises with optimal income in the current and future periods. To achieve this result we propose a model of monitoring of technologi-zation of manufacturing enterprises of the Russian Federation in the conditions of economic con-straints. The proposed monitoring will be based on the study carried out by A. Bogdanov on the conditions and factors ensuring the equilibrium of systems. According to his study, the highest form of organization is "the triune organization of things, people and ideas". The violation of equili-brium of the system may lead to its negative or positive change. The first means destruction, the second - means its development. This very fact determines the degree of a stable state of the sys-tem (Bogdanov, 1989, 304 p.). The processes of technologization need to be constantly monitored, assessed and forecast from the perspective of the direction of their development. Monitoring of technologization of manufacturing enterprises based on key economic indicators allows to assess the current state of the enterprise from the posi-tion of, first of all, microeconomic situation by calculating the values of these indicators which were formed during a specific reporting period (Miller, 2013, pp. 105-113). Such monitoring can be called monitoring of the main technologization process. Meanwhile, integrated assessment of technologization also involves tracking future mega- and macro-economic trends, economic, social and political aspects of the enterprise de-velopment. Thus, it is advisable to monitor the preventive process of technologization. Monitor-ing of preventive technologization process should be understood, above all, as monitoring of "the future periods", tracking the most probable direc-tions of the future enterprise development in order to adjust the current development strategy. If monitoring of the main technologization process operates according to the system "current devel-opment - future development", i.e. the results of today's period allow to generate proposals for im-proving the functioning of the enterprise in the future, it means that monitoring of preventive technologization process uses a system of "future development - current development"; in other words, it tracks forecasted potential future options in order to develop preventive measures to pre-
pare the enterprise for both prospective changes in the external business environment, and the forma-tion of technologization processes. The dynamic development of the manufacturing enterprises implies that they should conduct not just monitor-ing of preventive and main processes, but also monitoring of technologization consequences for manufacturing enterprises. It can be noted that performance of modular technologization moni-toring lies primarily in the fact that it gives the opportunity to focus not only on the problems of technologization processes, but also on the ways of their solving, which, in addition, saves costly time for making forward-looking strategic deci-sions regarding the enterprises of the manufactur-ing sector. A characteristic advantage of the pro-posed monitoring tools is the ability to draw con-clusions on the technologization implementation, which allows an industrial enterprise to strengthen its competitive position; increase its attractive-ness; increase efficiency of utilizing its potential and the quality of organizational and administra-tive methods of management; as well as compre-hensively approach to the justification of invest-ment in technologization taking into account risk factors.
Conclusion In order not to fall out of the world "industrial-innovative train" it is vitally important for Russia to move from labor-intensive industries to more innovative industries with high added value. To achieve technological safety and integration of national economy into the world one at leading levels one should stimulate the development of our own innovation-oriented manufacturing in-dustry and develop "cross-cutting" technologies that can be applied in different industries. Within the framework of public-private partnership such factors as support of the development of advanced production technology, training of workers, pro-viding access of manufacturing enterprises to fi-nancing on attractive terms are required.
It is necessary to reverse the situation where expensive loans, inflexible tax burden, the decline in domestic demand lead to the fact that many domestic manufacturing enterprises are on the edge of survival, rather than are competitive; as a result the demand for domestic development is not growing.
Consequently, the main areas of the use of the achieved results will be: updating the content of state programmes towards adding some sub-programmes (sections) on technical re-equipment
Alexander Miller Study of the Problems of Technologizing of Industrial Complex of Russia 47
STRATEGIC MANAGEMENT, Vol. 22 (2017), No. 2, pp. 041-047
in accordance with the aims of the new technolo-gical stage; granting in contests of development institutions some activities aimed at supporting research in the field of digital and additive manu-facturing, robotics and new technologies.
ACKNOWLEDGMENTS The work is carried out with financial support of the Ministry of Education and Science of the Rus-sian Federation, within the state task to HIGHER EDUCATION INSTITUTIONS regarding carry-ing out research works for 2014-2016, the project No. 2378. SM
References Russian Federation in figures. (2015). The Federal state
statistics service. Retrieved October 17, 2015, from:http://www.gks.ru/wps/wcm/connect/rosstat_main/rosstat/ru/statistics/publications/catalog/doc_ 1135075100641
Schumpeter, J. (1982). The theory of economic develop-ment. Moscow: Progress.
Mensch, G. (1979). Stalemate in technology. Cambridge: Mass. Kleinknecht, A. (1987). Innovation patterns in crisis and
prosperity. Schumpeter s long cycle reconsidered. Lon-don: Palgrave Macmillan UK.
Clark, I. (1981). Long waves, inventions, and innovations. Futures, 13 (4), 308-322.
Industry of Russia. (2014). The Federal state statistics ser-vice. Retrieved October 27, 2014, from: http://www.gks.ru/wps/wcm/connect/rosstat_main/rosstat/ru/statistics/publications/catalog/doc_1139918730234
The solutions as a result of the meeting of the Presidium of the Council under the President of the Russian Federa-tion on economy modernization and innovation devel-opment. About development of new manufacturing technology. (2014). The official site of Government of the Russian Federation. Retrieved September 24, 2014, from:.http://government.ru/orders/14911/
Bogdanov, A. (1989). Tektologiya. Moscow: Economy. Miller, A. (2013). Research of alternative options of integra-
tion interactions of production structures, Omsk: Herald of Omsk University.
Correspondence
Alexander Miller
Omsk State University Prospect Mira 55a, 644077, Omsk, Russia
E-mail: [email protected]

54 Jovo T. Tauzović Preliminaries of Modern Systems Management Concepts
STRATEGIC MANAGEMENT, Vol. 19 (2014), No. 1, pp. 042-053

Manuscript Requirements A paper must be written in text processor Microsoft Word. Paper size: A4. Margins: 3.0 cm on top and bot-tom, and 2.5 cm on left and right sides. As a guide, articles should be no more than 5.000 words in length. In case the paper exceeds the normal length, the Editors' consent for its publication is needed. Articles submitted for publication in Journal should include the research aim and tasks, with detailed methodology, presenting literature overview on the research object, substantiation of the achieved results and findings, conclusions and a list of references. Manuscripts should be arranged in the following order of presentation. First page: Title (no more that 10 words), subtitle (if any), autobiographical note (the author's full name, academic affiliation, telephone, fax and e-mail address and full international contact). Respective affiliations and addresses of co-authors should be clearly indicated. Please also include approximately 50 words of bio-graphical information on each author of the submitted paper. Second page: A self-contained abstract/summary/resume of up to 150 words, describing the research objective and
its conclusions Up to ten keywords, which encapsulate the principal subjects covered by the article; and A self-contained summary of up to 200 words, describing the article and its conclusions.
Subsequent pages: Main body of the text with headings, footnotes, a list of references, appendices, tables and illustrations. The paragraph parameters are: Font: Times New Roman, 10 pt, regular Spacing: Before: 0, After: 0 Line Spacing: Single Alignment: Justified Indentation: Left: 0, Right: 0, Special: 0. Style: Normal (not Title, Heading1, Heading2,...,Body Text, etc!) Leave an empty line between paragraphs. Headings: Headings must be short, clearly defined and numbered, except for Introduction and Conclu-sions. Apply at most three levels of headings. Please, leave two empty lines before headings and one empty line after. Font: Times New Roman, bold, 16 pt, centered. Section headings should be in bold with Leading Capitals on Main Words, Times New Roman, 14pt, bold, centered. Sub-section headings should be in italics, with Leading Capitals on Main Words, Times New Roman, 12 pt, bold. All tables, graphs and diagrams are expected to back your research findings. They should be clearly referred to and numbered consecutively in Arabic numerals. They should be placed in the text at the appropriate paragraph (just after its reference). Tables should be centered. All tables must have captions. The title of your table should follow the table number. Tables should not be wider than the margins of the paper. Skip two lines before and after each table. Figures should be centered. All figures must have captions. The title of figures should appear immediately below the figure. The title of the figure should follow the figure number. Figures should not be wider than the margins of the paper. Skip two lines before and after each figure. Figures will not be redrawn by the publisher. Figures should be high-quality grayscale graphics (please, do not use colors): vector drawings (with text converted to curves) or 300 dpi bitmaps. Please do not supply any graphics copied from a web-site, as the resolution will be too low. In all figures taken or adapted from other sources, a brief note to that effect is obligatory, below the figure. One sentence at least referring to the illustration is obligatory. Mathematical expressions should be numbered on the right side, while all variables and parameters must be defined.

Copyright Articles submitted to the Journal should be authentic and original contributions and should have never been published before in full text, nor be under consideration for any other publication at the same time. Authors submitting articles for publication warrant that the work is not an infringement of any existing copyright and will indemnify the publisher against any breach of such warranty. For use of dissemination and to en-sure proper policing of use, papers and contributions become the legal copyright of the publisher unless otherwise agreed.
Proof Authors are responsible for ensuring that all manuscripts (whether original or revised) are accurately typed before final submission. One set of proof will be sent to authors, if requested, before the final publication, which must be returned promptly. Referencing Guide The references should specify the source (such as book, journal article or a web page) in sufficient de-tail to enable the readers to identify and consult it. The references are placed at the end of the work, with sources listed alphabetically (a) by authors’ surnames or (b) by the titles of the sources (if the au-thor is unknown). Multiple entries by the same author(s) must be sequenced chronologically, starting from the earliest, e.g.:
Ljubojević, T.K. (1998). Ljubojević, T.K. (2000a). Ljubojević, T.K. (2000b). Ljubojević, T.K., & Dimitrijević, N.N. (1994).
Here is a list of the most common reference types: A. PERIODICALS Authors must be listed by their last names, followed by initials. Publication year must be written in pa-rentheses, followed by a full stop. Title of the article must be in sentences case: only the first word and proper nouns in the title are capitalized. The periodical title must be in title case, followed by the vol-ume number, which is also italicized:
Author, A. A., Author, B. B., & Author, C. C. (Year). Title of article. Title of Periodical, volume number(issue number), pages.
Journal article, one author, paginated by issue Journals paginated by issue begin with page 1 in every issue, so that the issue number is indicated in parentheses after the volume. The parentheses and issue numbers are not italicized, e.g.
Tanasijević, V. (2007). A PHP project test-driven end to end. Management Information Systems, 5 (1), 26-35.
Journal article, one author, paginated by volume Journals paginated by volume begin with page 1 in issue 1, and continue page numbering in issue 2 where issue 1 ended, e.g.
Perić, O. (2006). Bridging the gap: Complex adaptive knowledge management. Strategic Management, 14, 654-668.
Journal article, two authors, paginated by issue
Strakić, F., & Mirković, D. (2006). The role of the user in the software development life cycle. Management Information Systems, 4 (2), 60-72.
Journal article, two authors, paginated by volume
Ljubojević, K., & Dimitrijević, M. (2007). Choosing your CRM strategy. Strategic Management, 15, 333-349.
Journal article, three to six authors, paginated by issue
Jovanov, N., Boškov, T., & Strakić, F. (2007). Data warehouse architecture. Management Information Systems, 5 (2), 41-49.
Journal article, three to six authors, paginated by volume
Boškov, T., Ljubojević, K., & Tanasijević, V. (2005). A new approach to CRM. Strategic Management, 13, 300-310.
Journal article, more than six authors, paginated by issue
Ljubojević, K., Dimitrijević, M., Mirković, D., Tanasijević, V., Perić, O., Jovanov, N., et al. (2005). Putting the user at the center of software testing activity. Management Information Systems, 3 (1), 99-106.
Journal article, more than six authors, paginated by volume
Strakić, F., Mirković, D., Boškov, T., Ljubojević, K., Tanasijević, V., Dimitrijević, M., et al. (2003). Metadata in data warehouse. Strategic Management, 11, 122-132.
Magazine article
Strakić, F. (2005, October 15). Remembering users with cookies. IT Review, 130, 20-21. Newsletter article with author
Dimitrijević, M. (2009, September). MySql server, writing library files. Computing News, 57, 10-12. Newsletter article without author
VBScript with active server pages. (2009, September). Computing News,57, 21-22. B. BOOKS, BROCHURES, BOOK CHAPTERS, ENCYCLOPEDIA ENTRIES, AND BOOK REVIEWS Basic format for books
Author, A. A. (Year of publication). Title of work: Capital letter also for subtitle. Location: Publisher. Note: “Location" always refers to the town/city, but you should also include the state/country if the town/city could be mistaken for one in another country. Book, one author
Ljubojević, K. (2005). Prototyping the interface design. Subotica: Faculty of Economics.
Book, one author, new edition
Dimitrijević, M. (2007). Customer relationship management (6th ed.). Subotica: Faculty of Economics. Book, two authors
Ljubojević, K., Dimitrijević, M. (2007). The enterprise knowledge portal and its architecture. Subotica: Faculty of Economics.
Book, three to six authors
Ljubojević, K., Dimitrijević, M., Mirković, D., Tanasijević, V., & Perić, O. (2006). Importance of software testing. Subotica: Faculty of Economics.
Book, more than six authors
Mirković, D., Tanasijević, V., Perić, O., Jovanov, N., Boškov, T., Strakić, F., et al. (2007). Supply chain management. Subotica: Faculty of Economics.
Book, no author or editor
Web user interface (10th ed.). (2003). Subotica: Faculty of Economics. Group, corporate, or government author
Statistical office of the Republic of Serbia. (1978). Statistical abstract of the Republic of Serbia. Bel-grade: Ministry of community and social services.
Edited book
Dimitrijević, M., & Tanasijević, V. (Eds.). (2004). Data warehouse architecture. Subotica: Faculty of Economics.
Chapter in an edited book
Boškov, T., & Strakić. F. (2008). Bridging the gap: Complex adaptive knowledge management. In T. Boškov & V. Tanasijević (Eds.), The enterprise knowledge portal and its architecture (pp. 55-89). Subotica: Faculty of Economics.
Encyclopedia entry
Mirković, D. (2006). History and the world of mathematicians. In The new mathematics encyclopedia (Vol. 56, pp. 23-45). Subotica: Faculty of Economics.
C. UNPUBLISHED WORKS Paper presented at a meeting or a conference
Ljubojević, K., Tanasijević, V., Dimitrijević, M. (2003). Designing a web form without tables. Paper presented at the annual meeting of the Serbian computer alliance, Beograd.
Paper or manuscript
Boškov, T., Strakić, F., Ljubojević, K., Dimitrijević, M., & Perić, O. (2007. May). First steps in vis-ual basic for applications. Unpublished paper, Faculty of Economics Subotica, Subotica.
Doctoral dissertation
Strakić, F. (2000). Managing network services: Managing DNS servers. Unpublished doctoral disserta-tion, Faculty of Economics Subotica, Subotica.
Master’s thesis
Dimitrijević, M. (2003). Structural modeling: Class and object diagrams. Unpublished master’s thesis, Faculty of Economics Subotica, Subotica.
D. ELECTRONIC MEDIA The same guidelines apply for online articles as for printed articles. All the information that the online host makes available must be listed, including an issue number in parentheses:
Author, A. A., & Author, B. B. (Publication date). Title of article. Title of Online Periodical, volume number(issue number if available). Retrieved from http://www.anyaddress.com/full/url/
Article in an internet-only journal
Tanasijević, V. (2003, March). Putting the user at the center of software testing activity. Strategic Management, 8 (4). Retrieved October 7, 2004, from www.ef.uns.ac.rs/sm2003
Document from an organization
Faculty of Economics. (2008, March 5). A new approach to CRM. Retrieved July 25, 2008, from http://www.ef.uns.ac.rs/papers/acrm.html
Article from an online periodical with DOI assigned
Jovanov, N., & Boškov, T. A PHP project test-driven end to end. Management Information Systems, 2 (2), 45-54. doi: 10.1108/06070565717821898.
Article from an online periodical without DOI assigned
Online journal articles without a DOI require a URL.
Author, A. A., & Author, B. B. (Publication date). Title of article. Title of Journal, volume number. Retrieved from http://www.anyaddress.com/full/url/
Jovanov, N., & Boškov, T. A PHP project test-driven end to end. Management Information Systems,
2 (2), 45-54. Retrieved from http://www.ef.uns.ac.rs/mis/TestDriven.html. REFERENCE QUOTATIONS IN THE TEXT Quotations If a work is directly quoted from, then the author, year of publication and the page reference (preceded by “p.”) must be included. The quotation is introduced with an introductory phrase including the au-thor’s last name followed by publication date in parentheses.
According to Mirković (2001), “The use of data warehouses may be limited, especially if they contain confidential data” (p. 201).
Mirković (2001), found that “the use of data warehouses may be limited” (p. 201). What unex-pected impact does this have on the range of availability?
If the author is not named in the introductory phrase, the author's last name, publication year, and the page number in parentheses must be placed at the end of the quotation, e.g.
He stated, “The use of data warehouses may be limited,” but he did not fully explain the possi-ble impact (Mirković, 2001, p. 201).
Summary or paraphrase
According to Mirković (1991), limitations on the use of databases can be external and software-based, or temporary and even discretion-based. (p.201)
Limitations on the use of databases can be external and software-based, or temporary and even discretion-based (Mirković, 1991, p. 201).
One author
Boškov (2005) compared the access range…
In an early study of access range (Boškov, 2005), it was found... When there are two authors, both names are always cited:
Another study (Mirković & Boškov, 2006) concluded that… If there are three to five authors, all authors must be cited the first time. For subsequent refer-ences, the first author’s name will cited, followed by “et al.”.
(Jovanov, Boškov, Perić, Boškov, & Strakić, 2004).
In subsequent citations, only the first author’s name is used, followed by “et al.” in the introductory phrase or in parentheses:
According to Jovanov et al. (2004), further occurences of the phenomenon tend to receive a much wider media coverage.
Further occurences of the phenomenon tend to receive a much wider media coverage (Jovanov et al., 2004).
In “et al.", “et” is not followed by a full stop. Six or more authors
The first author’s last name followed by "et al." is used in the introductory phrase or in parentheses:
Yossarian et al. (2004) argued that… … not relevant (Yossarian et al., 2001).
Unknown author
If the work does not have an author, the source is cited by its title in the introductory phrase, or the first 1-2 words are placed in the parentheses. Book and report titles must be italicized or underlined, while titles of articles and chapters are placed in quotation marks:
A similar survey was conducted on a number of organizations employing database managers ("Limiting database access", 2005).
If work (such as a newspaper editorial) has no author, the first few words of the title are cited, fol-lowed by the year:
(“The Objectives of Access Delegation,” 2007)
Note: In the rare cases when the word "Anonymous" is used for the author, it is treated as the au-thor's name (Anonymous, 2008). The name Anonymous must then be used as the author in the refer-ence list.
Organization as an Author
If the author is an organization or a government agency, the organization must be mentioned in the introductory phrase or in the parenthetical citation the first time the source is cited:
According to the Statistical Office of the Republic of Serbia (1978), …
Also, the full name of corporate authors must be listed in the first reference, with an abbreviation in brackets. The abbreviated name will then be used for subsequent references:
The overview is limited to towns with 10,000 inhabitants and up (Statistical Office of the Re-public of Serbia [SORS], 1978). The list does not include schools that were listed as closed down in the previous statistical over-view (SORS, 1978).
When citing more than one reference from the same author:
(Bezjak, 1999, 2002) When several used works by the same author were published in the same year, they must be cited adding a, b, c, and so on, to the publication date:
(Griffith, 2002a, 2002b, 2004) Two or more works in the same parentheses
When two or more works are cited parenthetically, they must be cited in the same order as they appear in the reference list, separated by a semicolon.
(Bezjak, 1999; Griffith, 2004) Two or more works by the same author in the same year
If two or more sources used in the submission were published by the same author in the same year, the entries in the reference list must be ordered using lower-case letters (a, b, c…) with the year. Lower-case letters will also be used with the year in the in-text citation as well:
Survey results published in Theissen (2004a) show that…
To credit an author for discovering a work, when you have not read the original:
Bergson’s research (as cited in Mirković & Boškov, 2006)… Here, Mirković & Boškov (2006) will appear in the reference list, while Bergson will not. When citing more than one author, the authors must be listed alphabetically:
(Britten, 2001; Sturlasson, 2002; Wasserwandt, 1997) When there is no publication date:
(Hessenberg, n.d.) Page numbers must always be given for quotations:
(Mirković & Boškov, 2006, p.12)
Mirković & Boškov (2006, p. 12) propose the approach by which “the initial viewpoint…
Referring to a specific part of a work: (Theissen, 2004a, chap. 3)
(Keaton, 1997, pp. 85-94)
Personal communications, including interviews, letters, memos, e-mails, and telephone conversations, are cited as below. (These are not included in the reference list.)
(K. Ljubojević, personal communication, May 5, 2008).
FOOTNOTES AND ENDNOTES A few footnotes may be necessary when elaborating on an issue raised in the text, adding something that is in indirect connection, or providing supplementary technical information. Footnotes and end-notes are numbered with superscript Arabic numerals at the end of the sentence, like this.1 Endnotes begin on a separate page, after the end of the text. However, Strategic Management journal does not recommend the use of footnotes or endnotes. COPYRIGHT AND USE AGREEMENT Articles submitted to the Journal should be authentic and original contributions and should have never been published before in full text, nor be under consideration for any other publication at the same time. Authors submitting articles for publication warrant that the work is not an infringement of any existing copyright and will indemnify the publisher against any breach of such warranty. For use of dissemination and to ensure proper policing of use, papers and contributions become the legal copy-right of the publisher unless otherwise agreed. All contributors are required to sign the Transfer of Copyright Agreement before the article may be published. The transfer of copyright encompasses the exclusive right to reproduce and circulate the article, including photographic reproductions, reprints or any other similar reproductions and transla-tion. If the copyright exists either for the entire article or any part of it, it is the contributor's responsi-bility to obtain permission to reproduce it from the copyright holder.
CIP - Каталогизација у публикацији Библиотека Матице српске, Нови Сад 005.21 STRATEGIC managament : international journal of strategic managament and decision support systems in strategic managament / editor-in-chief Jelica Trninić. - Vol. 14, no. 1 (2009) - . - Subotica: University of Novi Sad, Faculty of Economics, 2009-. - 30 cm Tromesečno. - Nastavak publikacije: Strategijski menadžment = ISSN 0354-8414 ISSN 1821-3448 COBISS.SR-ID 244849927 Rešenjem Ministarstva za informisanje Republike Srbije, časopis "Strategijski menadžment" upisan je u regis-tar javnog informisanja pod brojem 2213, od 7. avgusta 1996. Rešenjem Ministarstva za nauku i tehnologiju Republike Srbije br. 413-00-435/1/96-01 časopis je oslobođen opšteg poreza na promet proizvoda kao publi-kacija od posebnog interesa za nauku.