Embed Size (px)
Citation preview

i
Strategies for Development of Green Energy
Systems in Mongolia Final Report
Mongolia Country Program
March 2014

ii
Table of Contents
Executive Summary 11
PART I. INTRODUCTION TO MONGOLIA ENERGY SCENARIOS
1 Background 21
2 Mongolia’s Energy System: Overview and Challenges 21
3 Report goals and Objectives 25
PART II. SCENARIO DETAILS AND RESULTS, BY SECTOR
4 Overview of Scenarios and Methodology 26
4.1 Scenarios analyzed 26
4.2 Methodological approach 29
4.3 Energy scenario analysis in the context of green growth 31
5 Power and Heat Supply 32
5.1 Sector Overview 32
5.2 Reference scenario 32
5.3 Recent plans scenario 36
5.4 Expanded green energy scenario 38
5.5 Shift in energy export scenario 43
5.6 Discussion and possible initiatives 47
6 Buildings 50
6.1 Sector Overview 50
6.2 Reference scenario 51
6.3 Recent plans scenario 53
6.4 Expanded green energy scenario 53
6.5 Discussion and possible initiatives 57
7 Transport 58
7.1 Sector Overview 58
7.2 Reference scenario 59
7.3 Recent plans scenario 60
7.4 Expanded green energy scenario 60
7.5 Discussion and possible initiatives 63

iii
8 Industry: Mining and Manufacturing 66
8.1 Sector overview 66
8.2 Reference scenario 67
8.3 Recent plans scenario 71
8.4 Expanded green energy scenario 71
8.5 Shifts in energy export scenario 73
8.6 Discussion and possible initiatives 74
9 Agriculture 75
9.1 Sector overview 75
9.2 Reference scenario 76
9.3 Expanded green energy scenario 78
9.4 Discussion and possible initiatives 78
PART III. OVERALL RESULTS, CONCLUSIONS, AND NEXT STEPS
10 Overall Scenario Results 80
10.1 Electricity generation 81
10.2 Energy demand 81
10.3 Greenhouse gas emissions 85
10.4 Other pollutant emissions 90
10.5 Cost-effectiveness analysis 92
11 Conclusions and Next Steps 95
11.1 Summary of overall findings 95
11.2 Policies for consideration 97
11.3 Potential “next steps” for green energy development: projects, pilots, and further research 98
Data gathering 98
Capacity building 99
Pilot programs 100
Research 100
12 References Cited 104
Appendix A: Listing of the Members of the Project Advisory Committee 110
Appendix B: Approaches to accounting for GHG emissions 111
Appendix C: Possible Green Growth Indicators for Mongolia 118

iv
Appendix D. Ministries and Agencies Responsible for Renewable Energy in Mongolia 122
Appendix E: Listing of LEAP Scenarios in Mongolia Data Set 123
Appendix F: Summary Description of LEAP Software Tool 129

v
List of Tables
Table 2-2. Primary Energy Production in Mongolia, 1990-2010, TJ2 ...................................... 24
Table 4-1. Overview of Four Scenarios .................................................................................. 28
Table 8-1. Key Drivers, Industry Sector ................................................................................... 67
Table 10-2. Electricity output in the reference recent plans, and expanded green energy
scenarios, TWh ................................................................................................................ 81
vi
List of Figures
Figure 2-1. Historical electricity generation, by fuel .............................................................. 22
Figure 5-2. Electricity generation in the reference scenario .................................................. 35
Figure 5-3. District heat demand in the reference scenario .................................................. 35
Figure 5-4. Electricity generation capacity in the recent plans scenario ............................... 37
Figure 5-5. Electricity generation in the recent plans scenario ............................................. 38
Figure 5-6. Electricity capacity in the expanded green energy scenario ............................... 42
Figure 5-7. Electricity generation in the expanded green energy scenario ........................... 42
Figure 5-8. District heat demand in the expanded green energy scenario............................ 43
Figure 5-9. Electricity capacity in the shift in energy export scenario .................................... 46
Figure 5-10. Electricity generation in the shift in energy export scenario .............................. 47
Figure 6-1. Energy demand in the buildings sector in the reference scenario ....................... 52
Figure 6-2. Energy demand in the buildings sector in the recent plans scenario ................... 53
Figure 6-3. Energy demand in the buildings sector in the expanded green energy scenario 55
Figure 7-1. Energy demand in the transport sector in the reference scenario ...................... 60
Figure 7-2. Energy demand by vehicle type in the transport sector in the expanded green
energy scenario ............................................................................................................... 62
Figure 8-1. Energy demand by subsector type in the industrial sector, reference scenario . 70
Figure 8-2. Energy demand by fuel in the Industrial sector, reference scenario .................... 70
Figure 8-3. Energy demand by subsector type in the industrial sector, expanded green
energy scenario ............................................................................................................... 72
Figure 8-4. Energy demand by fuel in the industrial sector, expanded green energy scenario
......................................................................................................................................... 73
Figure 9-2. Energy demand by fuel type in the agriculture sector, reference scenario ........ 77
Figure 10-2. Overall energy demand by fuel group, recent plans scenario ............................ 82
Figure 10-3. Overall energy demand by fuel group, expanded green energy scenario ......... 83
Figure 10-4. Electricity demand by sector, reference scenario .............................................. 84
Figure 10-5. Electricity demand by sector, recent plans scenario .......................................... 84
Figure 10-6. Electricity demand by sector, expanded green energy scenario ....................... 85

vii
Figure 10-7. GHG emissions by sector, reference scenario .................................................... 86
Figure 10-8. GHG emissions by fuel, reference scenario ....................................................... 86
Figure 10-9. GHG emissions by sector, recent plans scenario ................................................ 87
Figure 10-10. GHG emissions by fuel, recent plans scenario ................................................. 87
Figure 10-11. GHG emissions by sector, expanded green energy scenario ........................... 88
Figure 10-12. GHG emissions by fuel, expanded green energy scenario ............................... 88
Figure 10-13. Extraction-based emissions under the shift in energy exports scenario, relative
to the reference scenario ................................................................................................ 90
Figure 10-14. Sulfur Oxide Emissions under Three Scenarios ............................................... 91
Figure 10-15. Nitrogen Oxide Emissions under Three Scenarios ........................................... 91
Figure 10-16. “Cost Curve” showing GHG savings and cost per tonne of CO2e reduced in
2035................................................................................................................................. 94
viii
List of Abbreviations
ADB – Asian Development Bank
CCS – Carbon Capture and Storage
CES – Central Energy System
CHP – Combined Heat and Power
CH4 – Methane
CNG – Compressed Natural Gas
CO2 – Carbon Dioxide
GDP – Gross Domestic Product
GEF – Global Environmental Facility
Gg – Gigagram
GGGI - The Global Green Growth Institute
GHG – Greenhouse Gas
Gcal – Gigacalories (109 calories)
GJ – Gigajoules (109 Joules)
GSHP – Ground-source Heat Pumps
GTI – Greater Tumen Initiative
GW – Kilowatts (billion Watts)
GWh – Gigawatt-hours (109 Watt-hours)
GWP – Global Warming Potential
HOB – Heat-only Boilers
IEA – International Energy Agency
IMF – International Monetary Fund
IPCC – Intergovernmental Panel on Climate Change
kcal – Kilocalories
kg – Kilograms
kW – Kilowatts (thousand Watts)
kWh – Kilowatt-hours (103 Watt-hours)
LPG – Liquefied Petroleum Gas
LEAP – Long Range Energy Alternatives Planning software tool
MEGD – Mongolian Ministry of Environment and Green Development

ix
MOE – Mongolian Ministry of Energy
MW – Megawatts (million Watts)
MWh – Megawatt-hours (106 Watt-hours)
NGO – non-government organization
NOx – Nitrogen Oxides
O&M – Operating and Maintenance
OECD – Organization for Economic Cooperation and Development
PJ – Petajoules (1015 Joules)
pkm – Passenger-kilometers
PM – Particulate Matter
PM2.5 – Particulate Matter under 2.5 micrometers in diameter
PV – Photovoltaic (solar)
SEI-US – Stockholm Environment Institute—US
SOx – Sulfur Oxides
SWH – Solar Water Heating
T&D – Transmission and Distribution
TCE – Tonnes of Coal Equivalent
TCO2e – Tonnes of CO2 Equivalent
TJ – Terajoules (1012 Joules)
tkm – Tonne-kilometers
TWh – Terawatt-hours (1012 Watt-hours)
TOE – Tonnes of Oil Equivalent
UB – Ulaan Baatar
UN – United Nations
UNDP – United Nations Development Programme
UNEP – United Nations Environment Programme
UNESCAP – United Nations Economic and Social Commission for Asia and the Pacific
UNFCCC – United Nations Framework Convention on Climate Change
USGS – US Geological Survey

x
Acknowledgments
Special thanks are due to all the members of the project’s guidance team: Mr. Tovuudorj Purevjav, Mr.
Bekhbat Sodnom, Mr. Angarag Myagmar, Ms. Tsendsuren Batsuuri, Mr. Enebish Namjil, and especially
to Mr. Chimeddorj Demchigjav, who served as the key person at the Ministry of Energy. Special
thanks are also due to the members of the project’s technical team: Mr. Gerelt-od Tsogtbaatar, Ms.
Tegshjargal Bumtsend, Mr. Tumenjargal Makhbal, Mr. Atarjargal Tserendoo, Mr. Purevdash Solikhuu,
Ms. Gerel Jambaa, Ms. Ariunzul Dashjamts, Ms. Javzanpagma N. , Mr. Misheelt Ganbold, Mr. Enkh-
Amgalan Davaa-Ochir, and Mr. Enkhsaihan Tumen-Ulzii. Thanks are also due to other officials of the
Mongolian government who provided support throughout, though we cannot name them all here.
This report was prepared by the Stockholm Environment Institute – U.S. (SEI-US), in partnership with
GGGI and a team of consultants based in Ulaanbaatar. At SEI-US, Dr. David von Hippel was the project
manager and lead author of the report. Mr. Peter Erickson, Mr. Michael Lazarus, and Mr. Kevin
Tempest contributed to the report and the analysis throughout. Dr. Charlie Heaps at SEI-US provided
guidance throughout. The team of local consultants included Dr. Dorjpurev J., Ms. Oyunchimeg Ch.,
and Mr. Sukhbaatar Ts., and their hard work in providing insights to Mongolia’s current and future
energy situation, as well as in working with the Advisory Committee in gathering data for this report
and in providing logistical assistance to the project, has been extremely important to the project’s
success.

11
Executive Summary
Mongolia is a landlocked country in eastern and central Asia, bordered by Russia to the North and
China to the South. With an annual average temperature of -3 degrees Celsius, as well as being one of
the world’s most sparsely populated territories, Mongolia faces considerable challenges to provide
sufficient heat and electricity for its people, especially in rural areas, both in terms of power quantity
and quality. Its capital, Ulaanbaatar City, is the largest municipality of Mongolia, and is home to over
one million people, comprising 45% of the total national population.
Currently, the biggest power plants in the country are aging coal-fired plants providing electricity and,
in most cases, district heat via central networks. Many local areas still rely on coal-based heat-only
boilers for district heat, and a few smaller cities, towns, and villages are still supplied with electricity
from diesel-fuelled units, many of which can provide power for only a few hours per day due to lack
of fuel (or funds to purchase fuel) and other restrictions. Mongolia does, however, have a significant
potential for development of different types of renewable energy, including solar, wind, and some
hydroelectric resources. Solar and wind power, in particular, are widely available across the country.
Mongolia is challenged by its natural environment, its dispersed population, and pollution problems
resulting from its legacy of older infrastructure. However, its natural resources, including both
renewable resources and mineral resources, its capable workforce, and its excellent relations with its
neighbors and the international community render it well-placed to consider and implement
renewable energy development. Its challenges are significant, but relative to those of many nations,
tractable.
Mongolia is playing an increasing role in providing energy, largely in the form of coal, and, to a lesser
extent, crude oil, principally to China. Mongolia’s status as a supplier of energy to northeast Asia may
expand in the future to Korea and Japan, as more of the country’s significant coal and renewable
energy resources are harnessed. How Mongolia chooses to develop these resources may have
impacts not only on the country’s own economy and environment, but also on global climate change.
GGGI’s project, Strategies for Development of Green Energy Systems in Mongolia aims to define and
describe green energy systems that would reduce GHG emissions, improve air quality, and bring other
socio-economic benefits. Launched in 2013, the project has been carried out in conjunction with the
U.S. Centre of the Stockholm Environment Institute (SEI-US). This report presents main findings of the
project by exploring several different “scenarios” of evolution of the country’s energy supply and
demand, including in industry, transport, buildings, and agriculture sectors. It is hoped that the
findings and recommendations illustrated in the report are useful and informative not only to
relevant researchers and development practitioners but also to Mongolian policymakers in their
challenging position to balance between economic growth and environmental sustainability.

12
This study employs a bottom-up techno-economic analysis of energy and GHG-reduction scenarios,
which are assembled in the Long-range Energy Alternatives Planning (LEAP) software developed by
SEI-US. (The LEAP software tool is widely used in energy policy analysis and climate change mitigation
assessment works in more than 190 countries worldwide. A summary description of the LEAP
software tool is provided as Appendix F to this Report.) This type of bottom-up analysis is commonly
used by countries in their energy and climate change mitigation planning, as well as for in reporting to
international bodies such as the United Nations Framework Convention on Climate Change. In a
bottom-up analysis, groups of energy-saving and energy-supply measures are combined into the
broad scenarios.
An energy scenario is an internally consistent “story” of how energy use, power and heat supply, and
the underlying economy, may develop in the future. Scenarios for the project were developed with
the input of, and with data collected by, an Advisory Committee of officials from the Ministry of
Energy and several other organizations in Mongolia, as well as with inputs from a local consultant
team.
This study presents four broad scenarios of how energy supply and demand could evolve in Mongolia
through the year 2035. All four scenarios use the same economic and demographic growth forecasts,
which draw from recent studies, to determine the need for energy services. In doing so, they all
assume rapid growth of Mongolia’s economy, especially in mining and industrial sectors, and with
related effects like increasing demand for freight and personal transportation. (Forecasts for key
drivers will be presented in the chapter for the corresponding sector.) Given the rapid changes in
Mongolia’s economy, the scenarios here are subject to significant uncertainty. The four scenarios
were developed over the course of 2013 with input from a project Advisory Committee and others.
Following is a brief introduction and description of the four scenarios:
The reference scenario reflects a continuation of largely coal-based energy supply in an economy driven largely by mining exports, especially of coal and copper. This scenario assumes relatively few changes in energy supply or the intensity of demand other than gradual improvements in some technologies (e.g., vehicles, appliances) consistent with international trends likely to evolve regardless of changes in Mongolia’s policies.
The recent plans scenario begins to introduce a shift to renewable energy and increased energy efficiency based on recent plans and priorities of the Ministry of Energy and Ministry of Environment and Green Development: namely, large hydropower plants (e.g., Sheuren) and wind turbines, application of more-efficient pulverized coal combustion technologies, and programs to implement efficient lighting and improved insulation of panel apartment buildings.
The expanded green energy scenario describes a future where Mongolia makes an even stronger transition to renewable energy and implements extensive energy efficiency measures across its economy. This scenario also builds from work on renewable energy and energy

13
efficiency potentials conducted in the country, including by the work of the Ministry of Energy, the Ministry of Environment and Green Development.
The shifts in energy export scenario builds from the expanded green energy scenario; in this scenario, Mongolia shifts the types of fuel and energy that it exports: rather than exporting an increasing amount of coal from Tavan Tolgoi and other deposits, the country instead exports renewable (wind and solar) electricity to a regional grid, in partnership with other countries .
This study finds that, in the reference scenario, total energy demand in Mongolia may rise from less
than 150 petajoules (PJ) in 2010 to over 400 PJ in 2035 (Figure ES-1). The reference scenario sees
demand for electricity (especially from industry) and oil products (especially from cars and trucks, as
diesel and gasoline) grow especially fast – both at over 5 times 2010 levels in 2035.
Figure ES-1. Overall energy demand by fuel group, reference scenario
In the recent plans scenario, efforts to retrofit apartment buildings for better energy performance and
to increase the efficiency of lighting in homes and businesses reduce demands for electricity and
especially heat, leading to modest (6%) reduction in energy demand in 2035 relative to the reference
scenario (Figure ES-2).
-
50
100
150
200
250
300
350
400
450
2010 2015 2020 2025 2030 2035
Energy Demand(PJ)
Biomass
Heat
Electricity
Natural Gas
Oil
Coal

14
Figure ES-2. Overall energy demand by fuel group, recent plans scenario
The expanded green energy scenario implements deep energy efficiency strategies in all sectors, from
best-available technologies in industry to highly efficient vehicles (including hybrids and, over time,
electric vehicles) in the transport sector, to highly energy efficient building retrofits, including for gers.
Together, these efforts reduce energy demand by 32% relative to the reference scenario in 2035,
slowing the average rate of growth of energy use from 4.7% to 3.1% between 2010 and 2035. (The
shift in energy export scenario differs from the expanded green energy scenario only in what type of
energy is exported, and so overall domestic energy demand is similar to that in figure ES-3.)
-
50
100
150
200
250
300
350
400
450
2010 2015 2020 2025 2030 2035
Energy Demand(PJ)
Avoided (vs. reference)
Biomass
Heat
Electricity
Natural Gas
Oil
Coal

15
Figure ES-3. Overall energy demand by fuel group, expanded green energy scenario
The recent plans and expanded green energy scenarios also see progressively greater penetration of
renewable electricity on the supply side. In the reference scenario, coal-fired power plants remain
the dominant means of fulfilling new electricity demands, and the fraction of Mongolia’s electricity
generation supplied by renewable energy remains under 5% though 2035 (Figure ES-4).
-
50
100
150
200
250
300
350
400
450
2010 2015 2020 2025 2030 2035
Energy Demand(PJ)
Avoided (vs. reference)
Biomass
Heat
Electricity
Natural Gas
Oil
Coal

16
Figure ES-4. Electricity generation in the reference scenario
In the recent plans scenario, and following trends outlined in Mongolia’s draft Energy Sector
Masterplan, expansion of hydroelectricity (such as the Sheuren plan) and, to a lesser extent, wind
power, raise the fraction of electricity supplied by renewables to about 15% by 2025 (Figure ES-5).
Figure ES-5. Electricity generation in the recent plans scenario
0%
10%
20%
30%
40%
50%
60%
70%
80%
90%
100%
-
5,000
10,000
15,000
20,000
25,000
2010 2015 2020 2025 2030 2035
Fractionrenewable
Electricitygeneration
(GWh)
Electricity imports
Solar
Wind
Hydro
Pumped storage hydro
Oil
Coal - Other new
Coal - Other existing
Coal - Tavan Tolgoi
Coal - CHP5
Coal - CHP4
Fraction renewable
0%
10%
20%
30%
40%
50%
60%
70%
80%
90%
100%
-
5,000
10,000
15,000
20,000
25,000
2010 2015 2020 2025 2030 2035
Fractionrenewable
Electricitygeneration
(GWh)
Avoided (vs. reference)
Electricity imports
Solar
Wind
Hydro
Pumped storage hydro
Oil
Coal - Other new
Coal - Other existing
Coal - Tavan Tolgoi
Coal - CHP5
Coal - CHP4
Fraction renewable

17
The expanded green energy scenario sees all currently proposed hydro (e.g., Sheurn, Elgiin,
Orkhontul), solar PV (Sainshand, Khurmen), and wind (e.g. Govisumber, Umnogovi) power projects
realized. When combined with the reduction in electricity demand resulting from the extensive
energy efficiency measures discussed above, this allows for the avoidance of significant new (and
expanded) coal-fired power plants, and for some of the existing, aging plants to be phased down or
retired. The fraction of electricity provided by renewable energy in this scenario exceeds 40% as early
as 2030. And, though a complete assessment of costs was not possible, this study estimates that the
expanded green energy could cost nearly 400 million dollars less than the reference scenario
cumulatively through 2035 (on a “net present value”, NPV basis) due to the significant fuel savings
associated with energy efficiency.
Figure ES-6. Electricity generation in the expanded green energy scenario
In the fourth, shifts in energy export scenario, Mongolia rapidly builds out solar PV and wind
resources in Gobi region, starting with 30 MW in 2017 and then growing with installations growing at
an annual rate averaging about 60% (higher in early years, lower in later years), an average rate of
renewables expansions that matches China’s over the past two decades. At this level, Mongolia could
install nearly 12 GW of renewables in the South Gobi by 2031, displacing a significant fraction
(potentially even all) of the value of coal exports by that time, depending on the value of exported
electricity and fossil fuels. Exporting this amount of power will require large investments in
transmission and distribution facilities, probably with multiple connections to entry points on the
0%
10%
20%
30%
40%
50%
60%
70%
80%
90%
100%
-
5,000
10,000
15,000
20,000
25,000
2010 2015 2020 2025 2030 2035
Fractionrenewable
Electricitygeneration
(GWh)
Avoided (vs. reference)
Electricity imports
Solar
Wind
Hydro
Pumped storage hydro
Oil
Coal - Other new
Coal - Other existing
Coal - Tavan Tolgoi
Coal - CHP5
Coal - CHP4
Fraction renewable

18
Chinese grid as well as high-voltage direct current (HVDC) lines to other nations, such as Korea and
Japan. Though highly ambitious, the shifts in energy export scenario could give Mongolia a significant
source of “green growth” and, by substituting exports of fossil fuels for exports of renewable
electricity, increase the country’s “low-carbon competitiveness”, should global demand for fossil fuels
begin to decline based on concerns by major economies (including China) regarding climate change.
This study also quantified the potential to reduce greenhouse gas (GHG) emissions in the Mongolia.
Implementing all measures studied, as in the expanded green energy scenario, could reduce GHG
emissions by 28 million tonnes CO2e in 2035, or nearly 50% compared to the reference scenario, and
holding GHG emissions essentially constant after 2020 case (Figure ES-7). (Implementing the
measures in the recent plans scenario would reduce GHG emissions by 7 million tonnes CO2e in 2035,
or 12% compared to the reference scenario.)
Figure ES-7. GHG emissions by sector, expanded green energy scenario
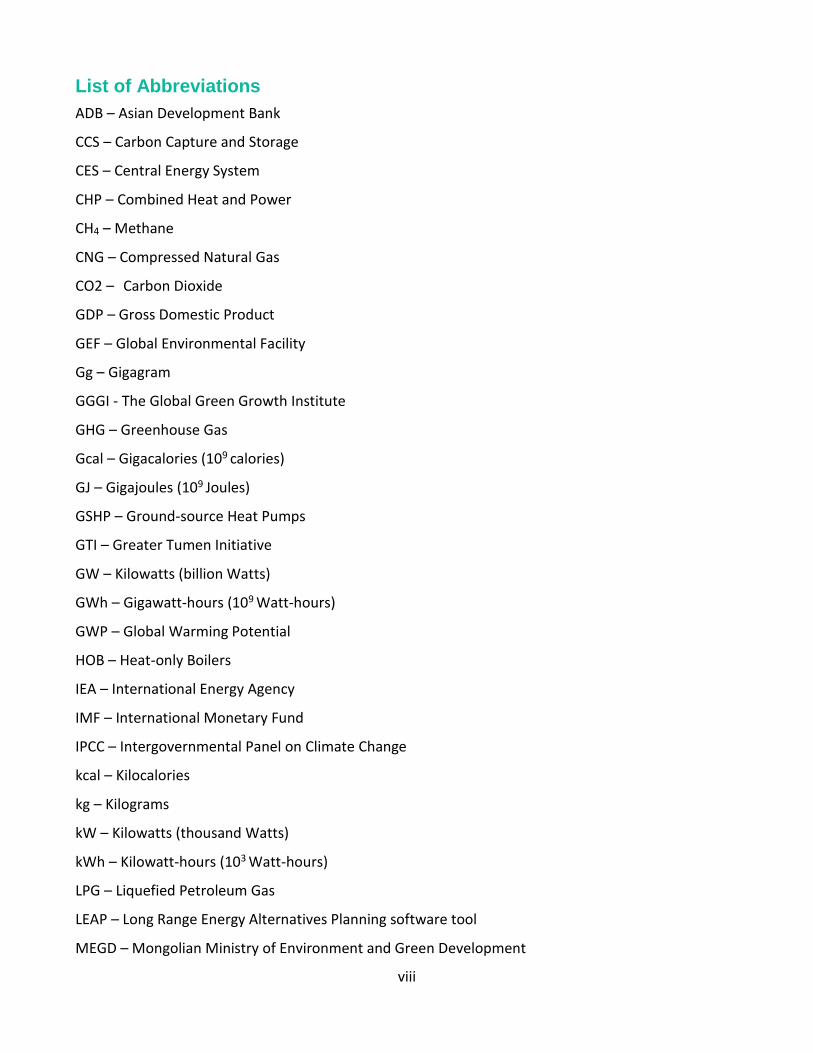
Figure ES-7 displays the GHG emissions abatement potential (relative to the reference scenario)
associated with each of the major measures analyzed in this study. All of the measures shown here
are included in the expanded green energy and shift in energy export scenario. (The recent plans
scenario implements building lighting and energy efficiency measures, as well as more modest
versions of the wind and efficient coal plant measures.)
The five measures with the greatest GHG abatement potential are (from higher to lower potential):
energy efficiency improvement in the mining sector, wind power, hydropower, higher-efficiency new
coal power plants, and transport mode shift to rail. The high potential for these first four measures is
not surprising, given the rapid growth in the mining sector and the dominance of GHG emissions from
power supply. The high GHG abatement potential from mode shift in the transport sector is
-
10
20
30
40
50
60
2010 2015 2020 2025 2030 2035
Million MetricTonnes CO2e
Avoided (vs. reference)
Oil Refining
Coal Production and Processing
HOBs
Electricity Generation
Unspecified Petroleum Product
Agriculture
Industry
Transport
Buildings
19
surprising and interesting, however, and derives in large part from the assumption that transport
demand will grow rapidly in Mongolia (about 5% per year) and that most of that new demand will be
in road transport. If transport activity does not grow that fast, overall energy use, GHG emissions, and
emissions abatement potential may be less in the transport sector than indicated here.
Figure ES-8. “Cost Curve” of GHG emission abatement opportunities and cost-effectiveness of CO2e
reduced in 2035
Reductions in air pollutants such as NOx, SOx, and particulates would also be significant in the
expanded green energy scenario.
Possible policy initiatives
This analysis suggests that several policy initiatives warrant further consideration in Mongolia. Each
of these initiatives is associated with measures (as in the cost curve) that could reduce Mongolia’s
GHG emissions by at least one million tonnes in 2035 relative to the reference case:
Strengthening the 2007 Renewable Energy Law, and developing a new Renewable Energy
Program, based on analysis such as that presented in this report. (Affects the power and heat
sector.)
Reforming subsidies on coal and electricity to minimize support, via tariffs or otherwise, for
inefficient consumption and high-carbon energy sources. (Affects the power and heat sector,
plus building and industrial energy efficiency.)

20
Developing and enforcing more stringent building energy codes and appliance efficiency
standards, continuing initiatives started in recent years. (Affects the buildings sector.)
Expanding building retrofit programs from the existing programs focused on energy retrofits of
existing apartment buildings (Affects the buildings sector.)
Developing guidelines for urban planning and transportation planning, including combined
land use and transportation planning, as well as a national strategy for moving people and
goods, especially including rail. (Affects the transport sector.)
Developing energy or emissions standards for widely used industrial technologies (e.g. those in
the mining sector) or for primary industry sectors that produce particularly energy-intensive
materials. (Affects the industry sector.)
Enhancing vehicle efficiency or emissions standards. (Affects the transport sector.)
In addition, Mongolian ministries may wish to further explore different formulations of national goals
for GHG emissions reduction. In particular, in addition to goals on territorial GHG-intensity (per unit
of GDP) that MEGD has considered, developing a supplemental goal based on extraction-based GHG-
intensity may help Mongolia to more comprehensively track progress towards a green economy and
away from “carbon entanglement”, or the over-reliance on coal for economic growth.
Lastly, it is important to note that neither these scenarios nor this report should be read as an
endorsement of any particular energy or emissions pathway. While this analysis shows what might be
possible with assertive efforts by Mongolia’s government and most other economic actors in the
country, other pathways are also possible, and may bring similar social, economic, and political
benefits. Furthermore, none of the scenarios (even the reference scenario) should be interpreted as
a definitive forecast. Mongolia’s economy is developing rapidly, and the mining, construction, and
other sectors, and their associated energy use, could evolve much differently than assumed here.
Any ambitious effort to greatly expand renewable energy and energy efficiency in Mongolia will
require political leadership and partnerships with the international community, as well as concerted
effort to address a host of factors, from financial to technical to administrative, that have limited
uptake of renewable energy and energy efficiency to date. Each of the policy initiatives discussed
here could likely also benefit from further research, pilot programs, and program development.

21
PART I. INTRODUCTION TO MONGOLIA ENERGY SCENARIOS
1 Background
Mongolia is a landlocked country in eastern and central Asia, bordered by Russia to the North and
China to the South. With an annual average temperature of -3 degrees Celsius, as well as being one of
the world’s most sparsely populated territories, Mongolia faces considerable challenges to provide
sufficient heat and electricity for its people, especially in rural areas, both in terms of power quantity
and quality. Its capital, Ulaanbaatar City, is the largest municipality of Mongolia, and is home to over
one million people, comprising 45% of the total national population.
Currently, the biggest power plants in the country are coal-fired plants providing electricity and, in
most cases, district heat via central networks. Many local areas still rely on coal-based heat-only
boilers for district heat, and a few smaller cities, towns, and villages are still supplied with electricity
from diesel-fuelled units, many of which can provide power for only a few hours per day due to lack
of fuel (or funds to purchase fuel) and other restrictions. Mongolia does, however, have a significant
potential for development of different types of renewable energy, including solar, wind, and some
hydroelectric resources. Solar and wind power, in particular, are widely available across the country,
and in recent years on the order of 20 smaller (60 to 400 kW) renewable energy systems have been
developed to serve isolated communities.
Mongolia is challenged by its natural environment, its dispersed population, and pollution problems
resulting from its legacy of older infrastructure. However, its natural resources, including both
renewable resources and mineral resources, its capable workforce, and its excellent relations with its
neighbors and the international community render it well-placed to consider and implement
renewable energy development. Its challenges are significant, but relative to those of many nations,
tractable.
Mongolia is playing an increasing role in providing energy, largely in the form of coal, and, to a lesser
extent, crude oil, principally to China. Mongolia’s status as a supplier of energy to China, and, possibly,
to Korea and Japan may grow in the future, as more of the country’s significant coal and renewable
energy resources are developed. How Mongolia chooses to develop these resources may have
impacts not only on the country’s own economy and environment for decades to come, but also on
global climate change.
2 Mongolia’s Energy System: Overview and Challenges
Mongolia’s power and heat supply is dominated by coal-fired units. For example, in 2011, 95% of
electricity and more than 99% of district heat was provided by coal (IEA 2011; National Statistical

22
Office of Mongolia 2012). Most (about 90%) of the electricity and heat consumption in Mongolia
occurs in the Central Energy System (CES), one of four relatively small, independent transmission grids.
The current CES is powered largely by five coal-fired CHP plants, three of which are in the national
capital city of Ulaanbaatar, and which average at least 35 years old (Minchener 2013). Installed
power generation capacity totaled just under 1.1 GW in 2010, including the capacity (175 MW) of the
transmission lines through which Mongolia imports electricity from (and exports electricity to) Russia.
The Ministry of Energy has plans to expand the power supply in the coming years, including the
construction of CHP5, a new 450 MW coal-fired CHP plant in or near Ulaanbaatar, as well as a number
of other power plants, including plants generating power from renewable resources. New power
supplies are needed to meet growing electricity demand, reduce reliance on electricity imports, and
improve system reliability. For context, Figure 2-1 displays historical electricity generation in
Mongolia. Electricity generation dipped in the mid-1990s during the transition to democracy
following the breakup of the Soviet Union, but has grown steadily since that time.
Figure 2-1. Historical electricity generation, by fuel
To date, Mongolia’s reliance on coal can be explained, in large part, by its significant coal deposits.
According to the Ministry of Energy, 12 billion tonnes of coal are now economically recoverable
(Baatar 2012; Minchener 2013): about 10 billion tonnes of thermal coal (both hard and brown coal)
and 2 billion tonnes of coking coal, with a total combined energy content of approximately 200,000 PJ.
By contrast, economically recoverable reserves of natural gas are considerably lower – 870 PJ (23
billion cubic meters), as are reserves of oil: 80 PJ (2 million tonnes) (BGR 2013).
0%
10%
20%
30%
40%
50%
60%
70%
80%
90%
100%
-
500
1,000
1,500
2,000
2,500
3,000
3,500
4,000
4,500
5,000
1990 1995 2000 2005 2010
Fractionrenewable
Electricitygeneration
(GWh)
Hydro
Oil
Coal
Fraction renewable
23
Mongolia also has significant potential for other energy resources. Uranium reserves total 41
thousand tonnes (with energy content equivalent to at least 17,000 PJ), with resources possibly as
high as 1.4 million tonnes (BGR 2013), spread across three deposits (Mardai, Dornod, and Gurvan
Bulag). Although there are no plans currently to develop nuclear power in the country (Minchener
2013), the Mongolian state-owned company MonAtom and international technology suppliers
recently established a joint venture agreement on the development of Mongolia’s uranium
resources.1
Based on data from the US National Renewable Energy Laboratory (Elliott et al. 2001) and the
Mongolian National Renewable Energy Center, the IEA has estimated potential renewable power
generation capacity of 2.6 million MW (Minchener 2013). Another study estimated potential capacity
at over 1.7 million MW, with about 0.6 million MW available at a cost of USD 100 per MWh or less
(ECA 2008). Despite the potentials and the stated priority placed on renewable energy in
Government policy, such as the National Renewable Energy Program, several barriers have hindered
renewable energy developments to date, however, including lack of finance, management, and
technical capacity (Lkhagvadorj 2010).The use of these renewable resources for power generation to
meet domestic demand is complicated by the strong connection between power generation and heat
production in Mongolia. Of necessity, and for reasons of efficiency, large power plants in Ulaan
Baatar and other Mongolian cities operate as combined heat and power (CHP) facilities, meeting
power demand in all seasons as well as district heating demands in residential and other building in
September or October through May. As a consequence, an alternative source of heat will be needed
if renewable generation is to substantially replace coal-fired power, and particularly CHP units. This
means that a creative approach must be found to use renewable resources to meet heat demands,
and/or to reduce heat requirements through demand-side measures.
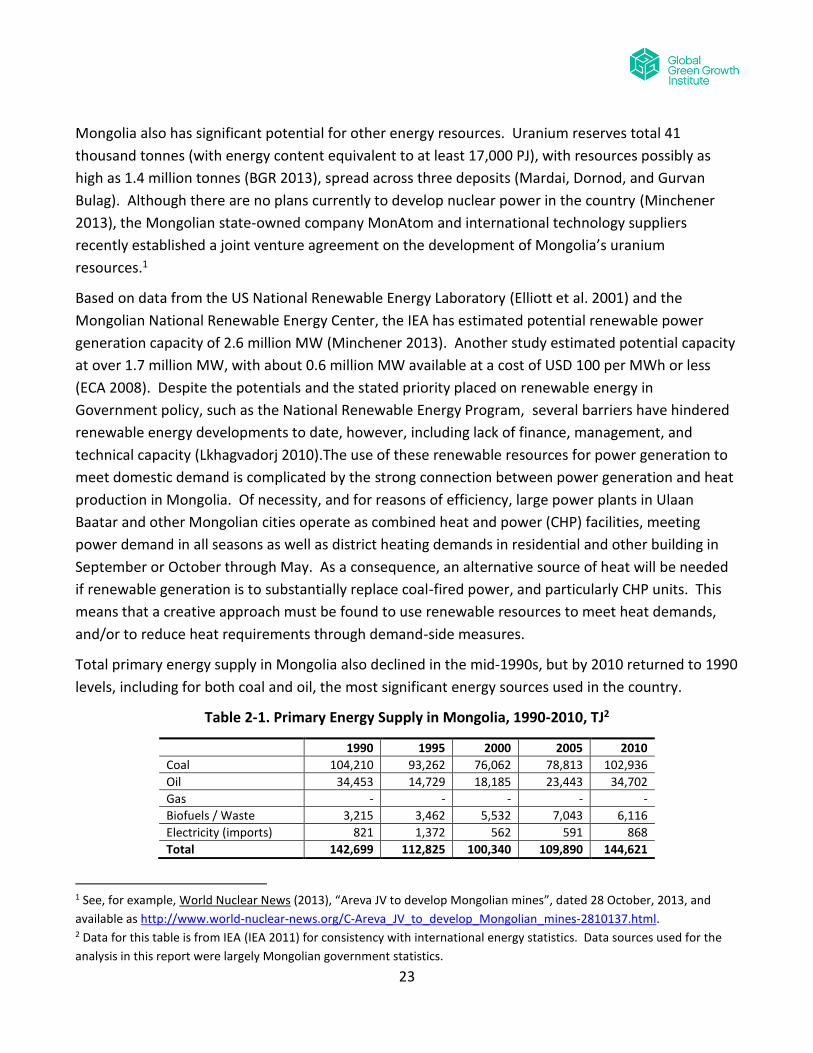
Total primary energy supply in Mongolia also declined in the mid-1990s, but by 2010 returned to 1990
levels, including for both coal and oil, the most significant energy sources used in the country.
Table 2-1. Primary Energy Supply in Mongolia, 1990-2010, TJ2
1990 1995 2000 2005 2010
Coal 104,210 93,262 76,062 78,813 102,936
Oil 34,453 14,729 18,185 23,443 34,702
Gas - - - - -
Biofuels / Waste 3,215 3,462 5,532 7,043 6,116
Electricity (imports) 821 1,372 562 591 868
Total 142,699 112,825 100,340 109,890 144,621
1 See, for example, World Nuclear News (2013), “Areva JV to develop Mongolian mines”, dated 28 October, 2013, and
available as http://www.world-nuclear-news.org/C-Areva_JV_to_develop_Mongolian_mines-2810137.html. 2 Data for this table is from IEA (IEA 2011) for consistency with international energy statistics. Data sources used for the
analysis in this report were largely Mongolian government statistics.
24
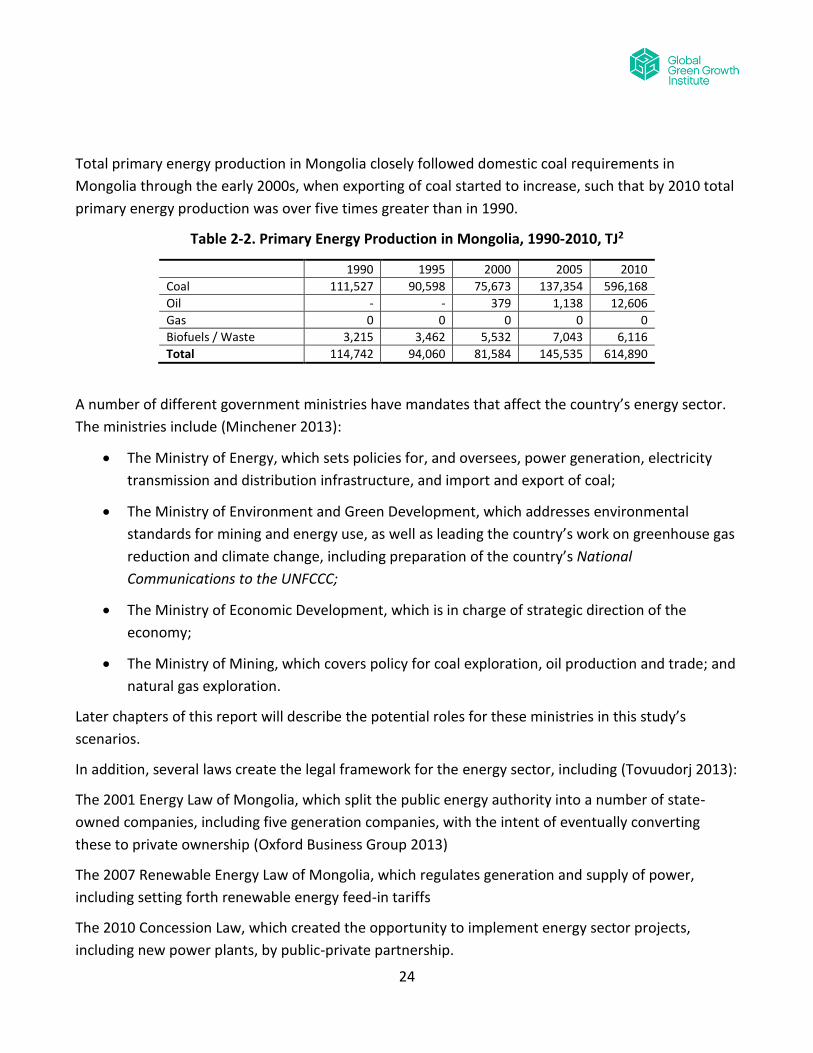
Total primary energy production in Mongolia closely followed domestic coal requirements in
Mongolia through the early 2000s, when exporting of coal started to increase, such that by 2010 total
primary energy production was over five times greater than in 1990.
Table 2-2. Primary Energy Production in Mongolia, 1990-2010, TJ2
1990 1995 2000 2005 2010
Coal 111,527 90,598 75,673 137,354 596,168
Oil - - 379 1,138 12,606
Gas 0 0 0 0 0
Biofuels / Waste 3,215 3,462 5,532 7,043 6,116
Total 114,742 94,060 81,584 145,535 614,890
A number of different government ministries have mandates that affect the country’s energy sector.
The ministries include (Minchener 2013):
The Ministry of Energy, which sets policies for, and oversees, power generation, electricity
transmission and distribution infrastructure, and import and export of coal;
The Ministry of Environment and Green Development, which addresses environmental
standards for mining and energy use, as well as leading the country’s work on greenhouse gas
reduction and climate change, including preparation of the country’s National
Communications to the UNFCCC;
The Ministry of Economic Development, which is in charge of strategic direction of the
economy;
The Ministry of Mining, which covers policy for coal exploration, oil production and trade; and
natural gas exploration.
Later chapters of this report will describe the potential roles for these ministries in this study’s
scenarios.
In addition, several laws create the legal framework for the energy sector, including (Tovuudorj 2013):
The 2001 Energy Law of Mongolia, which split the public energy authority into a number of state-
owned companies, including five generation companies, with the intent of eventually converting
these to private ownership (Oxford Business Group 2013)
The 2007 Renewable Energy Law of Mongolia, which regulates generation and supply of power,
including setting forth renewable energy feed-in tariffs
The 2010 Concession Law, which created the opportunity to implement energy sector projects,
including new power plants, by public-private partnership.

25
In addition to creating and overseeing a number of programs and plans, the Ministry of Energy has
also articulated a number of short and mid-term policy priorities, including the creation of an
independent, safe, reliable, and integrated energy system; developing public-private partnerships to
build new power plants; conserving energy and expand renewable energy; transitioning to a more
market-oriented system of prices and regulation; and exploring the potential for energy exports by
constructing high-voltage transmission capacity to international partners in the region and by building
wind and large-scale solar PV in the Gobi for energy exports (Tovuudorj 2013).
The scenarios explored in this report build on a number of these ideas expressed by the Ministry of
Energy, as well as upon a number of existing studies that analyze the possible future development of
Mongolia’s energy systems. In addition to the Technology Needs Assessment (MEGD 2013b) and draft
Energy Sector Development Plan (egen and MonEnergy Consult 2013), several additional studies bring
important data and analysis to this project. In particular, GHG Mitigation Scenarios in Energy Sector, a
study commissioned by the Mongolian Ministry of Environment and Green Development (Dorjpurev
2013), develops a reference scenario of energy demand and greenhouse gas emissions through 2030
as well as a mitigation scenario based on a limited number of renewable energy and energy efficiency
projects.
In addition, a number of other studies on more specific issues have been (or are currently being
conducted), including analyses of energy efficiency improvements in the grid connected power supply
by GIZ (Ernedal 2013), development of specific CDM projects, and analysis of potential GHG mitigation
measures potentially suitable for the UNFCCC’s proposed new market mechanisms (NMMs)
(Tsendsuren 2013), and an assessment of the economics of climate change in East Asia (Westphal et
al. 2013). A number of reviews of Mongolia’s energy sector also exist, including by the IEA Clean Coal
Centre (Minchener 2013), IIASA (IIASA 2012), and the Oxford Business Group (Oxford Business Group
2013). The unique value of this study is that it is assesses energy-related measures across all major
sectors of Mongolia’s economy and develops four alternative, transparent scenarios of energy
development in Mongolia.
3 Report goals and Objectives
This report is part of a cooperation between GGGI and the Mongolian government focused on the
topic of green growth.3 This report addresses one component of green growth for Mongolia: green
energy systems, i.e., those that minimize carbon, local air pollution, and other environmental impacts.
It focuses on the potential for renewable energy and energy efficiency to reduce fuel use, energy
3 GGGI and the Ministry of Environment and Green Development (MEGD), formerly the Ministry of Nature, Environment
and Tourism (MNET), signed a memorandum of understanding (MOU) in November 2011 to confirm a mutual agreement
on the cooperative pursuit of green growth projects.

26
costs, greenhouse gas emissions, and other pollutant impacts. The focus is on renewable energy and
energy efficiency because of Mongolia’s significant renewable resources and potential for energy
efficiency improvements and because these options already have considerable momentum in the
country. This report does not focus as much on some other sources of energy or GHG reductions:
nuclear, due to less in-country focus on this technology at present; natural gas, due to limited
domestic resources or import capacity, as well as because of limited potential for GHG reductions
(relative to renewables); and carbon capture and storage (CCS) due to high costs and uncertainty
about the efficacy of this technology.
Part I of this report closes with the next chapter, which provides an overview of the four scenarios
analyzed, including a brief discussion of the analytical methods applied. Part II of the report describes
the scenario details and results, sector by sector. The first sector described in detail is Mongolia’s
power and heat sector. Part III of the report closes with a comprehensive overview of major scenario
results and a discussion of possible policy responses and new initiatives.
4 Overview of Scenarios and Methodology
An energy scenario is an internally consistent “story” of how energy use, power and heat supply, and
the underlying economy, will develop in the future. Energy scenario analyses typically start with a
reference case, or “business as usual” scenario, which is a depiction of how the economy (and
associated energy demand) would evolve in the absence of any new policy action. Alternate
scenarios may satisfy specific aims, such as emissions reduction (of GHGs and/or other air pollutants),
and reflect different pathways of economic or social development. Scenario development begins with
a set of overall themes, or “storylines”, such as continuation of past practices, export-oriented
development, or green growth, which are then translated into economic and demographic
assumptions (“scenario drivers”) and strategies for meeting corresponding energy service
requirements (e.g. for home comfort, mobility, or industrial production).
4.1 Scenarios analyzed
This study presents four broad scenarios of how energy supply and demand could evolve in Mongolia
through the year 2035. The four scenarios were developed over the course of 2013 with input from a
project advisory committee comprised largely of government officers in Mongolia:4
4 Scenarios developed for this project were sketched out by the project team (led by SEI-US) and were first discussed with
the project’s advisory committee in June 2013. Scenarios were revised in November 2013 based on feedback from the
advisory committee in Ulaanbaatar in October 2013. For the composition of the project’s advisory committee, see
Appendix A. Quantitative evaluation of the four scenarios was carried out using the LEAP (Long-range Energy Alternatives
Planning) software tool. A summary description of the LEAP software tool is provided as Appendix F to this Report.

27
The reference scenario reflects a continuation of largely coal-based energy supply in an economy driven largely by mining exports, especially of coal and copper. This scenario assumes relatively few changes in energy supply or the intensity of demand other than gradual improvements in some technologies (e.g., vehicles, appliances) consistent with international trends likely to evolve regardless of changes in Mongolia’s policies.
The recent plans scenario begins to introduce a shift to renewable energy and increased energy efficiency based on recent plans and priorities of the Ministry of Energy (egen and MonEnergy Consult 2013) and Ministry of Environment and Green Development (MEGD 2013b).
The expanded green energy scenario describes a future where Mongolia makes an even stronger transition to renewable energy and implements extensive energy efficiency measures across its economy. This scenario also builds from work on renewable energy and energy efficiency potentials conducted in the country, including by the work of the Ministry of Energy, the Ministry of Environment and Green Development.
The shifts in energy export scenario builds from the expanded green energy scenario; in this scenario, starting in 2017, Mongolia shifts the types of fuel and energy that it exports: rather than exporting an increasing amount of coal from Tavan Tolgoi and other deposits, the country instead exports renewable (wind and solar) electricity.
All four scenarios use the same economic and demographic growth forecasts, which draw from recent
studies (UN 2013; Eurasia Capital 2011; IMF 2012), to determine the need for energy services. In
doing so, they all assume rapid growth of Mongolia’s economy, especially in mining and industrial
sectors, and with related effects like increasing demand for freight and personal transportation.
Given the rapid changes in Mongolia’s economy, the scenarios here are subject to significant
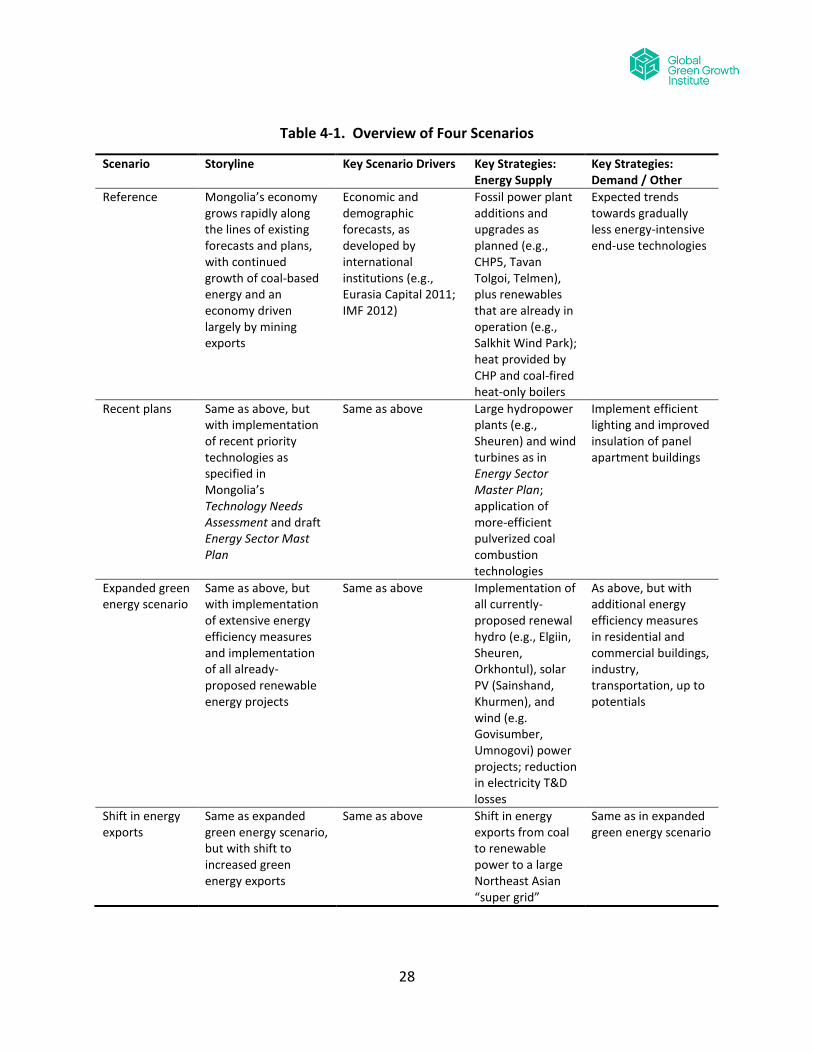
uncertainty. Table 4-1 summarizes the four scenarios. Details, and results, of each scenario will be
presented in subsequent chapters.5
5 The overarching Recent Plans, Expanded Green Energy, and Shift in Energy Exports Scenarios are themselves modeled in
LEAP as composites of individual options or groups of options for addressing GHG emissions. Discussions of how these
overarching scenarios are composed of GHG reduction options at the sector level are provided in chapters 5 through 9 of
this Report. Appendix E to this Report provides a “mapping” of options/option groups to the overarching scenarios.
28
Table 4-1. Overview of Four Scenarios
Scenario Storyline Key Scenario Drivers Key Strategies: Energy Supply
Key Strategies: Demand / Other
Reference Mongolia’s economy grows rapidly along the lines of existing forecasts and plans, with continued growth of coal-based energy and an economy driven largely by mining exports
Economic and demographic forecasts, as developed by international institutions (e.g., Eurasia Capital 2011; IMF 2012)
Fossil power plant additions and upgrades as planned (e.g., CHP5, Tavan Tolgoi, Telmen), plus renewables that are already in operation (e.g., Salkhit Wind Park); heat provided by CHP and coal-fired heat-only boilers
Expected trends towards gradually less energy-intensive end-use technologies
Recent plans Same as above, but with implementation of recent priority technologies as specified in Mongolia’s Technology Needs Assessment and draft Energy Sector Mast Plan
Same as above Large hydropower plants (e.g., Sheuren) and wind turbines as in Energy Sector Master Plan; application of more-efficient pulverized coal combustion technologies
Implement efficient lighting and improved insulation of panel apartment buildings
Expanded green energy scenario
Same as above, but with implementation of extensive energy efficiency measures and implementation of all already-proposed renewable energy projects
Same as above Implementation of all currently-proposed renewal hydro (e.g., Elgiin, Sheuren, Orkhontul), solar PV (Sainshand, Khurmen), and wind (e.g. Govisumber, Umnogovi) power projects; reduction in electricity T&D losses
As above, but with additional energy efficiency measures in residential and commercial buildings, industry, transportation, up to potentials
Shift in energy exports
Same as expanded green energy scenario, but with shift to increased green energy exports
Same as above Shift in energy exports from coal to renewable power to a large Northeast Asian “super grid”
Same as in expanded green energy scenario

29
4.2 Methodological approach
This study employs a bottom-up techno-economic analysis of energy and GHG-reduction scenarios.
This type of analysis is commonly used by countries in their energy and climate change mitigation
planning, as well as for in reporting to international bodies such as the UNFCCC (Sathaye and Meyers
1995; UNFCCC 2012). In a bottom-up analysis, groups of energy-saving and energy-supply measures
are combined into broad scenarios that reflect alternative development choices. Energy demand is
specified according to assumptions on how underlying drivers (e.g., population, mineral production)
may evolve, and does not take into account responses to economic changes (such as changes in
consumer spending or other macroeconomic variables) that may result from the measures introduced.
This approach is straight-forward, and is more transparent to analysts and decision-makers, than
more complicated methods involving economic models. This approach also provides consistency with
prior scenario efforts in Mongolia, especially the country’s National Communications to the UNFCCC
(MNET 2010) and recent bottom-up analyses (Dorjpurev 2013). In this study, the scenarios are
assembled in the LEAP model (Heaps 2012). For further details about LEAP, see Box 4-1 on the next
page or Appendix F.
Subsequent chapters of this report (chapters 3 through 7) describe the energy-saving and renewable
energy measures for each sector in detail. The project team selected these measures if they are
widely considered (in local or international literature) to be scalable to bring significant energy savings
or GHG benefits, at costs of up to $100 per tCO2e avoided.6 We include the measures prioritized by
Mongolia’s Technology Needs Assessment (MEGD 2013b) as well as by the draft Energy Sector
Development Plan (egen and MonEnergy Consult 2013): large hydropower plants; wind turbines;
more-efficient pulverized coal combustion technologies; efficient lighting; and improved insulation of
panel apartment buildings.
Mongolia’s existing greenhouse gas inventory, like all inventories submitted by countries to the
UNFCCC, is based on the emissions released within the country. Using this “territorial” approach,
Mongolia’s emissions have been dominated by CO2 from power and heat generation (about one-
third), methane (CH4) from enteric fermentation (about one-third), and (to a lesser extent)
combustion of fossil fuels in vehicles and buildings (about one-fifth) (MNET 2010). Government policy,
especially policies on Mongolia’s energy supply, can affect releases of these GHGs within the country,
and existing government targets for carbon intensity and carbon productivity are based on this
territorial GHG inventory.
6 As in major international assessments of costs of abatement measures (IEA 2012a). In practice, this excludes carbon
capture and storage (CCS) technology. We include one measure that we calculate to be greater than $100/tCO2e – CNG
buses – because it has been the focus of some recent efforts focused on urban air pollution.

30
Box 4-1: The Long-range Energy Alternatives Planning (LEAP) System
The Long-range Energy Alternatives Planning system (LEAP) is software tool for energy policy analysis
and climate change mitigation assessment. LEAP was developed at the Stockholm Environment
Institute (SEI).
LEAP is an integrated modeling tool that can be used to track energy consumption, production and
resource extraction in all sectors of an economy. LEAP is a demand-driven tool, in that the user first
describes current and future energy requirements for households, transport, industry, and other
sectors, then uses LEAP to model processes such as electricity generation, coal mining, and other
energy supply systems that provide fuels for final consumption. LEAP can be used to account for both
energy sector and non-energy sector greenhouse gas (GHG) emission sources and sinks. In addition
to tracking GHGs, LEAP can also be used to analyze emissions of local and regional air pollutants.
Finally, LEAP can track the direct costs of fuels and resources, of devices and systems that use energy,
and of energy supply infrastructure so as to estimate the relative costs of different approaches to
providing energy for an economy.
LEAP is not a model of a particular energy system, but rather a tool that can be used to create models
of different energy systems, where each requires its own unique data structures. LEAP supports a
wide range of different modeling methodologies: on the demand side these range from bottom-up,
end-use accounting techniques to top-down macroeconomic modeling. LEAP also includes a range of
optional specialized methodologies including stock-turnover modeling for areas such as transport
planning. On the supply side, LEAP provides a range of accounting and simulation methodologies that
are powerful enough for modeling electric sector generation and capacity expansion planning, but
which are also sufficiently flexible and transparent to allow LEAP to easily incorporate data and results
from other more specialized models.
LEAP is designed around the concept of long-range scenario analysis. Using LEAP, policy analysts can
create and then evaluate alternative scenarios by comparing their energy requirements, their costs
and benefits and their environmental impacts.
LEAP was developed by the Stockholm Environment Institute (SEI). More information, including
access to the LEAP software and licensing options, a LEAP Users’ Guide, examples of studies carried
out using LEAP, and other energy-environment modeling resources is available on the LEAP web site:
www.energycommunity.org.
31
At the same time, there are other ways to account for GHG emissions that Mongolia may influence,
and which offer important added perspectives on sustainable development as well as on
competitiveness in a low-carbon world. For example, current patterns of economic growth in
Mongolia are strongly dependent on exports from mining. One of Mongolia’s most significant exports
– coal – also creates CO2 emissions in the countries that import and burn it. To account for this
practice, our analysis will also introduce a supplemental accounting for the GHGs associated with
fossil fuels extracted in Mongolia (most of which are exported). Such an approach, called “extraction-
based” emissions accounting, has been proposed for national accounting (Davis et al. 2011; Peters et
al. 2012), and is one means to offer a more complete perspective on a country’s contributions to
global GHG emissions. Doing so can help assess alternative development pathways for “low-carbon
competitiveness” (Vivid Economics 2009) and carbon “entanglement” (Gurría 2013). For further
details on this and other accounting approaches, please see Appendix B.
4.3 Energy scenario analysis in the context of green growth
Energy strategy studies in Mongolia, as elsewhere, have often considered GHG emissions abatement,
sustainable development, and other objectives. In the context of green growth, additional
dimensions may be important. No universal definition of green growth exists, but key international
institutions working in this area -- GGGI, the United Nations Environment Program (UNEP), and the
Organization for Economic Cooperation and Development (OECD) – all emphasize improvement in
human well-being while sustaining natural resources (GGGI 2011; UNEP 2011; OECD 2012).
These institutions have worked together to translate the concept of green growth into a common set
of metrics to measure and track progress, in the following five categories (GGKP 2013):
Natural asset base, such as whether natural resource stocks are being depleted;
Environmental and resource productivity / intensity, such as measures of economic activity (GDP) per unit of emissions (CO2);
Environmental quality of life, especially the fraction of the population exposed to air pollution;
Policies and economic opportunities, which may affect indicators in any of the three categories above, and which may include environmentally related taxes or subsidies that stand in the way of cleaner production and consumption, as well as measures to shift the structure of the economy;
Socio-economic context, such as standard macroeconomic variables, and measures of equity, social inclusion, and access to services.
Though not all of these can be evaluated quantitatively here, these concepts were considered by the
project team in designing the scenarios described above. (For further discussion of these indicators,
see Appendix C.)
32
PART II. SCENARIO DETAILS AND RESULTS, BY SECTOR
5 Power and Heat Supply
5.1 Sector Overview
More than any other sector, power and heat dominate energy use in Mongolia – over 40% of final
energy demand in 2011 was electricity and heat (IEA 2011). For this reason – and because power
plants, heat-only boilers, and combined heat and power (CHP) plants in this sector provides power
and heat to the other sectors that demand it – this report begins its discussion of scenario details with
power and heat.
It should be noted that the all-fuels, all-sector energy model prepared to explore the scenarios
presented in this report, though it includes annual modeling of heat and power flows in Mongolia, is
not intended to model the flows of heat and power on the level of individual energy systems (for
example, the Central and regional energy systems) or on a seasonal or daily basis. More detailed
modeling is a possible focus for future work, given time, much more detailed input data, and possibly
using other modeling tools, taking advantage of and building from the work included in the just-
completed Energy Sector Development Plan (egen and MonEnergy Consult 2013).
5.2 Reference scenario
The reference scenario sees continuation of Mongolia’s coal-dominated power and central heat
supply through 2035, with limited improvements in system efficiency and coal-fired units expanded to
meet growth in demand. This growth includes the construction of CHP5, with 150 MW of capacity in
2016 and 450 MW of capacity beginning in 2017, of the Telmen power plant (100 MW beginning in
2016) and the Talvan Tolgoi plant at 150 MW in 2017 and 450 MW thereafter. The reference scenario
also includes the Amgalan heat station coming online in 2014. A planned new 500 MW coal-fired CHP
plant near the Chinese border from which power would be exported directly to China with no
connection to Mongolian national energy system, has also been reported (Yeren-Ulzii 2012;
Minchener 2013), but was not considered sufficiently certain to be included in the reference scenario.
The reference scenario also includes continued operation of the Salkhit wind farm (50 MW) as well as
a number of smaller hydro, solar, and wind plants.

33
Other Specific assumptions are based on a synthesis of the reference case of the recently released
analysis for Mongolia’s Energy Sector Development Plan (egen and MonEnergy Consult 2013) and
insights provided by the Technical Team.
In the reference scenario, for electricity:
New subcritical coal-fired units, including CHP (combined heat and power) and non-CHP units, are the predominant source of new capacity. Specific additions include CHP5 (150 MW in 2016, increasing to 450 in 2017), the Western Energy System (60 MW in 2017), Telem CHP (100 MW in 2016), and (as of 2011) the 18 MW Uhaa Hudag power plants, and the expansion of other existing CHP (combined heat and power) facilities (except for CHP2, which is retired in 2016). When additional capacity beyond those units already planned is needed to meet power requirements (after 2014), new coal-fired plants using lignite coal are added,
The only new, non-coal resource addition is the 50 MW Salkhit wind farm, which went into operation in mid-2013.
Over 60 percent of diesel generating units are retired by 2035, as the transmission grid expands and interconnects previously isolated systems.
Generation efficiency remains static over time, as any upgrades in performance are balanced, on average, by declines due to the aging of existing facilities.
Own-use efficiency improves slightly at existing units. Station own use of electricity falls from, on average, 15.6% to 15.0% in 2030, with reductions from own-use improvement programs partly offset by increased in-plant electricity loads due to added emissions controls.7
Electricity distribution losses fall from about 14 percent in 2010 to 10 percent by 2035 as a result of ongoing improvement efforts.
Electricity transmission losses fall slightly over time, from 3.0 to 2.9%, as system improvements are partially offset by added losses from network extension to more remote areas.
In the reference scenario, for heat:
Through the several large combined heat and power plants, including those operating today, those to be expanded, and those to be built new, a significant portion of the district heat requirements of cities and industries are met. Additional district heat requirements are provided by existing heat-only boilers (HOB), including 9 smaller and 12 larger boilers serving building heating demands in Ulaanbaatar and elsewhere. Over the next few years (through 2015), small and soum boilers with a total capacity of 300 Gcal/hr are due to be retired, replaced by 11 new units, all but one with reported capacities (each) of 30 Gcal/hr8. As noted above, the Amgalan Heat Station, with a capacity of 300 Gcal/hr, is assumed to come on line in
7 Examples of these changes, include the installation of a modified firing system in CHP-4, with new systems that increase
efficiency, and reduce own-use. Recent changes have reduced own-use from 20% to 15-16%. Changes are underway to
modify boilers to decrease PM emissions. Generation efficiencies for CHP units have reportedly been averaging 40-43% in
winter, 29-30%.in summer, though efficiencies vary substantially from unit to unit. 8 Based on input from Advisory Committee members.

34
2014. Starting in 2028, additional heat-only boilers are added to meet additional heat demand beyond that provided for by CHP units and existing HOB units.
Station own-use of heat stays constant.
Heat distribution losses, as calculated for 2010 based on the National Thermal Energy Balance, are assumed to fall from 2.5 percent to 2 percent on average by 2030 as distribution systems are extended with new piping, and existing systems are slowly upgraded.
Figure 5-1 displays electricity capacity in the reference scenario; and Figure 5-2 displays electricity generation.9
Figure 5-1. Electricity capacity in the reference scenario
9 Note that both figures omit the smaller village-level renewable energy systems existing as of 2012, the capacity and
output of which, though important for their local areas, are too small to appear on these national-level graphs. Note also
that total generation in 2020 here is 13.9 TWh, which is between the Medium (13.3 TWh) and High (15.8) scenarios in the
Draft Energy Sector MasterPlan (egen and MonEnergy Consult 2013). In 2030, our scenario of electricity generation, 18.0
TWh, is lower than the Draft MasterPlan’s Low scenario, 22.1 TWh, because we assume that the rate of economic growth
slows over time.
.
-
500
1,000
1,500
2,000
2,500
3,000
3,500
4,000
4,500
2010 2015 2020 2025 2030 2035
Capacity(MW)
Solar
Wind
Hydro
Pumped storage hydro
Oil
Coal - Other new
Coal - Other existing
Coal - Tavan Tolgoi
Coal - CHP5
Coal - CHP4

35
Figure 5-2. Electricity generation in the reference scenario
Figure 5-3. District heat demand in the reference scenario
0%
10%
20%
30%
40%
50%
60%
70%
80%
90%
100%
-
5,000
10,000
15,000
20,000
25,000
2010 2015 2020 2025 2030 2035
Fractionrenewable
Electricitygeneration
(GWh)
Electricity imports
Solar
Wind
Hydro
Pumped storage hydro
Oil
Coal - Other new
Coal - Other existing
Coal - Tavan Tolgoi
Coal - CHP5
Coal - CHP4
Fraction renewable
-
10
20
30
40
50
60
70
80
2010 2015 2020 2025 2030 2035
Heat Demand (PJ)
Agriculture
Industry - HOB
Industry - CHP
Buildings - HOB
Buildings - CHP

36
5.3 Recent plans scenario
The recent plans scenario builds from the reference scenario to include additional wind resources
(beyond the 50 MW 2013 Salkhit project) :100 MW of wind power in 2020, and 50 MW additional in
2022, along with the addition of the 390 MW Sheuren hydro power plant (producing 170 average MW)
in 2021 (egen and MonEnergy Consult 2013, p. 82).10 Taking advantage of the additional power
available from the Sheuren hydro plants, the recent plans scenario also retires a portion of CHP 3
earlier, reducing its capacity from 186 to 136 MW in 2023, and includes the coal-fired Baganuur
power plant at only half of its reference case capacity, at 350 MW instead of 700 MW, when the plant
comes on line in 2025, as by that time sufficient demand-side savings have accrued from the lighting
energy efficiency programs (see Chapter 4) included in the recent plans scenarios as to reduce future
generation capacity needs. New coal-fired non-CHP power plants included in the recent plans
scenario have higher efficiency, and slightly higher capital cost, than the standard coal-fired plants
included in the reference case. (New plants in this scenario are modeled as supercritical plants,
compared to subcritical plants in the reference case. Another technology, circulating fluidized bed
combustion, CFBC, can in some cases achieve CO2 emissions levels comparable to supercritical plants,
and can take fuels with lower heat content.).11
10 Scenario 2c 11 These boilers use a stream of air passing up through the boiler to suspend a mixture of burning fuel, an inert material—
typically sand, and sometimes limestone or other material to absorb pollutants. CFBC plants offer some advantages with
respect to flexibility in the use of coals (and other fuels, such as biomass) of different qualities, and also can have lower
emissions of key local and regional pollutants, most notably sulfur oxides and particulate matter, than standard pulverized
coal-fired power plants.
37
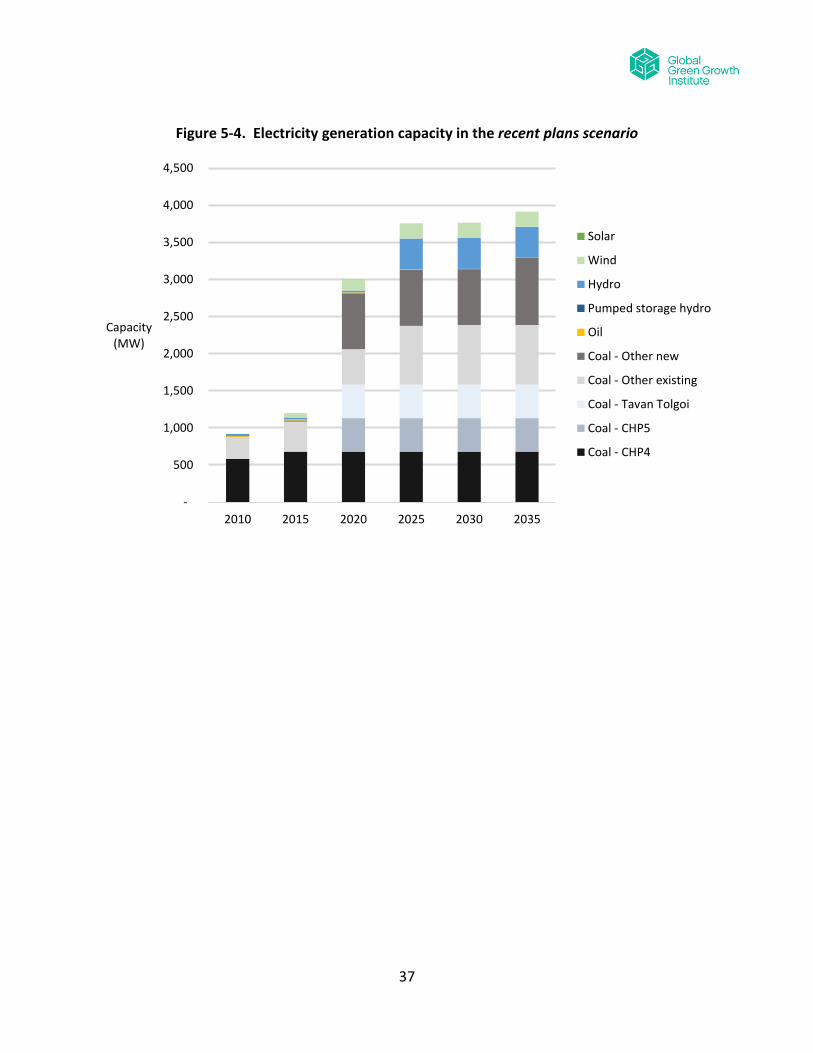
Figure 5-4. Electricity generation capacity in the recent plans scenario
-
500
1,000
1,500
2,000
2,500
3,000
3,500
4,000
4,500
2010 2015 2020 2025 2030 2035
Capacity(MW)
Solar
Wind
Hydro
Pumped storage hydro
Oil
Coal - Other new
Coal - Other existing
Coal - Tavan Tolgoi
Coal - CHP5
Coal - CHP4
38
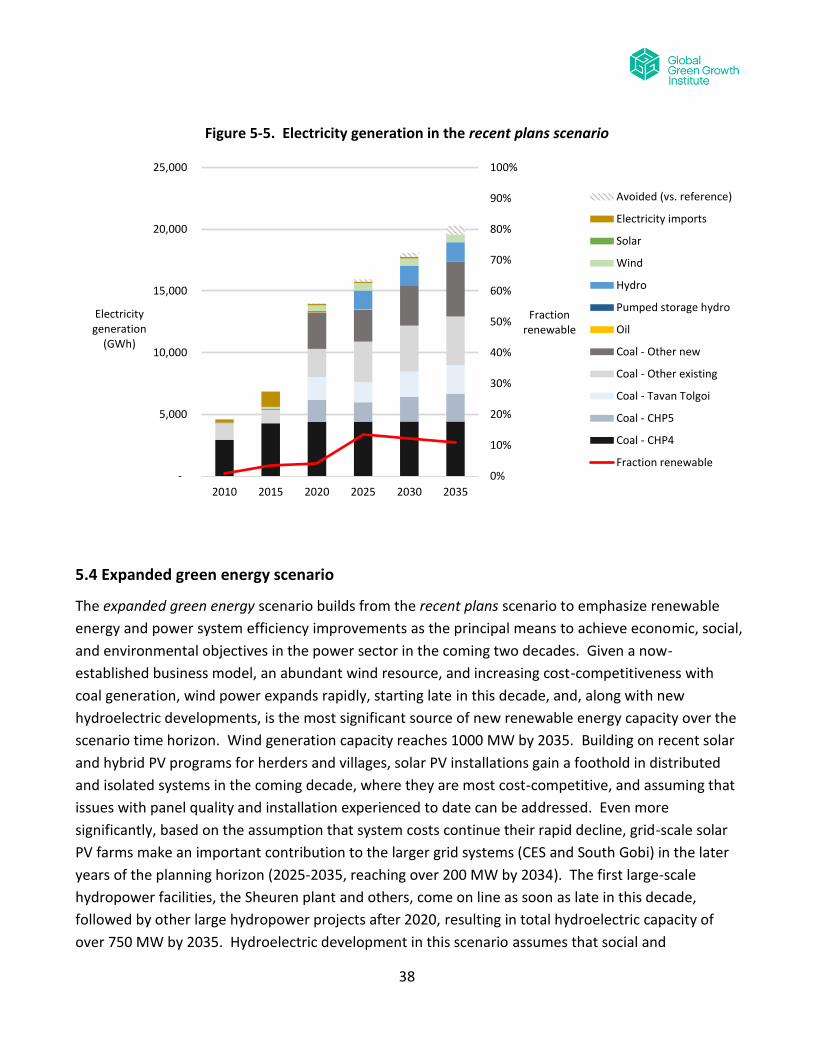
Figure 5-5. Electricity generation in the recent plans scenario
5.4 Expanded green energy scenario
The expanded green energy scenario builds from the recent plans scenario to emphasize renewable
energy and power system efficiency improvements as the principal means to achieve economic, social,
and environmental objectives in the power sector in the coming two decades. Given a now-
established business model, an abundant wind resource, and increasing cost-competitiveness with
coal generation, wind power expands rapidly, starting late in this decade, and, along with new
hydroelectric developments, is the most significant source of new renewable energy capacity over the
scenario time horizon. Wind generation capacity reaches 1000 MW by 2035. Building on recent solar
and hybrid PV programs for herders and villages, solar PV installations gain a foothold in distributed
and isolated systems in the coming decade, where they are most cost-competitive, and assuming that
issues with panel quality and installation experienced to date can be addressed. Even more
significantly, based on the assumption that system costs continue their rapid decline, grid-scale solar
PV farms make an important contribution to the larger grid systems (CES and South Gobi) in the later
years of the planning horizon (2025-2035, reaching over 200 MW by 2034). The first large-scale
hydropower facilities, the Sheuren plant and others, come on line as soon as late in this decade,
followed by other large hydropower projects after 2020, resulting in total hydroelectric capacity of
over 750 MW by 2035. Hydroelectric development in this scenario assumes that social and
0%
10%
20%
30%
40%
50%
60%
70%
80%
90%
100%
-
5,000
10,000
15,000
20,000
25,000
2010 2015 2020 2025 2030 2035
Fractionrenewable
Electricitygeneration
(GWh)
Avoided (vs. reference)
Electricity imports
Solar
Wind
Hydro
Pumped storage hydro
Oil
Coal - Other new
Coal - Other existing
Coal - Tavan Tolgoi
Coal - CHP5
Coal - CHP4
Fraction renewable

39
environmental concerns associated with large hydro projects are adequately addressed. Together,
these renewable resources are sufficient to significantly exceed the nation’s renewable electricity
output target of 20% by 2025 (reaching 35%), ultimately achieving over a 40% share of output by
2030.
Significant penetration of dispersed and intermittent wind and solar resources will require
corresponding investments in grid infrastructure in order to provide sufficient transmission, storage,
and balancing services, including voltage control and grid stability. Concomitant development of
hydropower capacity will be important for providing firm capacity to back up intermittent wind and
solar units, utilizing the ability of hydroelectric plants to act indirectly as electricity storage, and to
thus reduce efficiency penalties from increased cycling at coal-fired plants. This scenario also
envisions construction of a pumped-storage hydroelectric facility at a capacity of 100 MW by 201612,
with total pumped-storage capacity expanding to 200 MW in 2020 and 300 MW in 2023, which may
be important in enabling a higher penetration of wind and solar and allowing more efficient coal plant
operation by reducing the need to increase and decrease coal plant output to meet changing power
loads. (Such a service may also be provided by Sheuren or other hydropower plants, potentially,
though not necessarily, precluding the need for pumped storage hydro.)
Development of these more geographically-dispersed renewable resources will create new
employment and economic opportunities, contributing to “green growth.” That said, large-scale
penetration of renewables could face a number of challenges, given the lower average wind speeds
and solar insolation during Mongolia’s peak winter electricity demand seasons, as well as future
variations in season precipitation that could affect hydro power operation.
Therefore, another important element of the expanded green energy scenario is modernization and
efficiency improvement of the coal power fleet. This includes efficiency improvements in heat and
electricity transmission and distribution, upgrading/replacement of existing boilers and power plants,
coal processing for improved efficiency of combustion and reduced pollutant emissions, using higher-
efficiency coal-fired plants when building (before 2020) new coal-fired plants, building higher-
efficiency, though higher cost, ultra-supercritical coal-fired power plants instead of standard power
plants when additional capacity is required, and other options.
Nuclear energy could also potentially play a role in Mongolia’s energy future, leveraging the country’s
significant uranium resources. This option, however, is more likely to be attractive beyond the 2035
timeframe of this analysis.
12 Pumped-storage hydroelectric facilities store electrical energy by using off-peak power to pump water uphill into a
storage reservoir, releasing stored water to flow back down through a channel or penstock (pipe) to turn a turbine
generating unit and produce power at times of higher demand.

40
The specific assumptions for the expanded green energy scenario are adapted in part from those
developed for the high-renewables, emission-reduction scenario (2c) recommended in the draft
Energy Sector Development Plan (Energy Masterplan) out to the early 2020s (the Masterplan update
includes projections through 2025) (egen and MonEnergy Consult 2013). The draft Masterplan
update found that this scenario, while vastly expanding system diversity, reducing coal combustion
emissions, and creating new economic opportunities, would result in NPV costs only 5 to 8% higher
than the reference case.13 The expanded green energy scenario described here departs from the
Masterplan in that it adopts renewables somewhat faster, and adopts extensive demand-side
measures (see next sections) employed result in a slower demand growth for electricity and other
energy forms, and enable the delay or deferment of the addition of new coal-fired power plants and
potentially other (including renewable) resources, often for years, which will lead to significant
reductions in both capital and operating expense requirements by reducing the costs of required
infrastructure. From the mid-2020s, most additional electricity demand is met by a mix of new
renewable resources.
It is important to note that the draft Energy Masterplan focuses on the Central Energy System. Its
expansion plan meets the country’s renewable energy target only for the CES, and does not speak (at
least in the draft executive summary) to renewable energy development for the South Gobi and other
isolated grids. The expanded green energy scenario considered here thus envisions development of
distributed small-hydro, PV, and wind systems for the Eastern and Western regions, as well, up to a
total hydro capacity of over 750 MW, nearly 300 MW of central-station solar PV and solar thermal
combined heat and power capacity (with additional distributed solar PV, as noted in Chapter 4), and
1000 MW of wind capacity by 2035. Although the geographical locations of these generation
resources are not explicitly included in the LEAP model, they could include deploying wind capacity in
the South Gobi to supply energy for minerals production there, or greater penetration of renewable
energy on the Central and other grids to offset coal-fired power production at and for mine-mouth
power plants such as the planned Baganuur and Shivee Ovoo power plants.
It is likely that the implementation of the renewable electricity components of the expanded green
energy scenario will require at least somewhat different configurations of transmission capacity
infrastructure than the reference case. The expanded green energy scenario currently assumes
slightly higher average transmission and distribution (T&D) costs than the reference case, largely to
fund improvements in T&D efficiency improvements. Depending on the location of new renewable
electricity plants in this scenario, as well as of coal-fired plants not built in this scenario (but built in
the reference case), either more or, possibly, less T&D investment could be required in this scenario
(which also requires substantially less electricity generation overall due to savings in demand through
13 Depending on the weighted average cost of capital (WACC) assumed, per Tables 42 to 44 of the draft MasterPlan (egen
and MonEnergy Consult 2013)
41
implementation of energy efficiency measures). Determining the ultimate impact of this scenario on
overall T&D investment requirements is beyond the scope of the current study, but may be a an
important topic for future research.14
In the expanded green energy scenario, the renewable energy facilities described above are used at
full capacity when resources are available to take advantage of their very low operating costs relative
to fossil-fuelled plants, with coal-fired and pumped-storage plants providing load-following
capabilities. Note that the overall electricity demand required of the expanded green energy scenario
is lower than in the Reference case—by nearly 15 percent in 2025 and over 36 percent in 2035—
enabling renewable energy targets to be met with reduced additions of renewable generation.
Finally, the expanded green energy scenario makes increasingly greater use of ground source heat
pumps as well as solar water heaters for heat (space and water heat) supply on the demand side and
also reduces overall heat demand in the buildings sector, curtailing the need for heat-only boilers
(HOB).
Figures Figure 5-6 and Figure 5-7 show, respectively, the trends in electricity generation capacity and
in output by plant type in the expanded green energy scenario. Although capacity in this scenario is in
most years slightly greater than that of the reference case (and about 500 MW greater in the years
following major hydro additions), the output electricity in the expanded green energy scenario is
significantly less, due to a combination of the addition of significant intermittent resources with lower
capacity factors than coal-fired plants, and to the lower electricity demand due to aggressive
application of energy efficiency measures on the demand side.
14 Similarly, examining the costs and benefits of improved transmission interconnections between the Central and Eastern
and Western electricity grids has been beyond the scope of this study. Interconnection of the three grids in Mongolia
could bring reliability benefits, and could ease the process of connecting wind, solar, and hydro resources to the grid. A
number of major transmission projects have been planned by both government and private organizations to both
interconnect the grids and to provide routes to electricity markets for proposed new large coal-fired power plants.
Exploring the costs and benefits of the various options for stronger interconnection of the separate grids, and the
interaction of interconnections with prospects for expanded renewable power generation, is a topic that merits further
study.

42
Figure 5-6. Electricity capacity in the expanded green energy scenario
Figure 5-7. Electricity generation in the expanded green energy scenario
-
500
1,000
1,500
2,000
2,500
3,000
3,500
4,000
4,500
5,000
2010 2015 2020 2025 2030 2035
Capacity(MW)
Solar
Wind
Hydro
Pumped storage hydro
Oil
Coal - Other new
Coal - Other existing
Coal - Tavan Tolgoi
Coal - CHP5
Coal - CHP4
0%
10%
20%
30%
40%
50%
60%
70%
80%
90%
100%
-
5,000
10,000
15,000
20,000
25,000
2010 2015 2020 2025 2030 2035
Fractionrenewable
Electricitygeneration
(GWh)
Avoided (vs. reference)
Electricity imports
Solar
Wind
Hydro
Pumped storage hydro
Oil
Coal - Other new
Coal - Other existing
Coal - Tavan Tolgoi
Coal - CHP5
Coal - CHP4
Fraction renewable

43
Figure 5-8. District heat demand in the expanded green energy scenario
5.5 Shift in energy export scenario
In the shifts in energy export scenario, Mongolia makes two significant and highly ambitious shifts in
the type of energy it exports. First, it extensively develops its solar and wind resources in the Gobi
desert, exporting renewable electricity to other nations in Northeast Asia. Second, it dramatically
reduces its exports of coal (both thermal and coking coal), and does not pursue export of coal-fired
electricity.
In the power sector, the rationale for this scenario is to take advantage of growing regional electricity
demand (e.g., from China) while pursuing rapid renewable electricity deployment as “green growth”
in Mongolia. Coupled with its rapid growth and limits on CO2 emissions and coal usage, China is
increasingly looking to electricity imports to help reduce its coal consumption, including to make
greater use of transfers of electricity from west to east (Maidowski 2012). Mongolia’s wind resource
is greater than that of all of China, even though China’s land area is greater. Further development of
regional, northeast Asian electricity markets, supported by a regional grid, could also enable Mongolia
to sell electricity to help meet demand growth in other countries in northeast Asia, including Japan
and Korea. Mongolia has long been involved in studies and discussions with international partners for
a regional electricity grid, and the concept could start becoming reality early next decade (Song 2013)
-
10
20
30
40
50
60
70
80
2010 2015 2020 2025 2030 2035
Heat Demand (PJ)
Avoided (vs. reference)
Agriculture
Industry - HOB
Industry - CHP
Buildings - HOB
Buildings - CHP
44
Mongolia could create significant in-country economic growth, while reducing global greenhouse gas
emissions, by exporting renewable energy to help meet this regional electricity demand. The shifts in
energy export scenario demonstrates what might be possible with highly ambitious political, financial,
and technical commitment from a variety of actors.
Indeed, renewable energy exports has gained traction among some government officials in Mongolia,
including President Tsakhia Elbegdor15 and Minister of Energy Sonompil (Oxford Business Group 2013,
p.135). Despite the great challenges, the prospect of planning for a regional northeast Asian
electricity grid, coupled with significant renewable energy supplies from Mongolia’s Gobi region, may
be more likely now than at any other time in the past.
In this shifts in energy export scenario, Mongolia rapidly builds out solar PV and wind resources in
Gobi region, starting with 30 MW in 2017 and then growing with installations growing at an annual
rate averaging about 60% (higher in early years, lower in later years), an average rate of renewables
expansions that matches China’s over the past two decades (IEA 2012b).
At this level, Mongolia could install nearly 12 GW of renewables in the South Gobi by 2031, displacing
a significant fraction (potentially even all) of the value of coal exports by that time, depending on the
value of exported electricity and fossil fuels. For example, if, as assumed in preparing this scenario,
the price received for renewable electricity exports covers production costs (including both capital
and operating costs), assumed to start at an average of about $117 per MWh in 2017 (the average of
solar PV and wind power production costs in 2017 in this analysis) and declining gradually thereafter
as costs, especially for solar PV, decline) and coal prices hold constant at about $48/tce (as in the draft
Energy Sector Masterplan) – Mongolia could offset the value of its reference scenario coal exports. As
such, this scenario reduces Mongolia’s coal production by about 90 percent, respectively, relative to
the reference scenario (in which it was expected to grow dramatically), with the remaining 15%
remaining to be used domestically. These reductions also reduce the energy use (especially for coal
production) and greenhouse gas emissions associated with production of those the two fuels.
Exporting this amount of power will require large investments in transmission and distribution
facilities, probably with multiple connections to entry points on the Chinese grid as well as high-
voltage direct current (HVDC) lines to other nations, such as Korea and Japan. There are multiple
possible scenarios, depending who the buyers of renewable electricity generated in Mongolia would
be, where the plants in Mongolia would be located, how these lines might be configured, and which
participants in an export/import project would pay what fractions of the overall required costs.
Exploration of these T&D scenarios for renewable electricity export has been beyond the scope of this
study, but a worthy topic of, for example, a multi-national research effort. Even 12 GW of renewable
15 http://www.rtcc.org/mongolias-green-gold-revolution-in-un-spotlight/

45
power, however, represents just over 2 percent of the solar resource in the South Gobi region16.
Electricity generation included in the shift in energy exports scenario – about 27 TWh – would be less
than 1% of China’s forecast electricity consumption in 2030. (IEA 2012b)
Substituting exports of fossil fuels for exports of renewable electricity could help Mongolia to
substantially increase the country’s “low-carbon competitiveness”, should global demand for fossil
fuels begin to decline based on concerns over climate change (Vivid Economics 2009; HSBC 2012). For
example, if major economies were to take a path similar to that in the IEA’s “450 ppm” scenario,
emissions associated with fossil fuels could be subject to limits or carbon prices, demand for coal
could decline, and countries with economies highly dependent on coal and other high-carbon exports
could be exposed to much greater risk and, potentially, stranded assets (Carbon Tracker Initiative
2011). The shift in energy export scenario would be one means for Mongolia to prepare for such a
risk while also diversifying its economy away from mineral extraction, another commonly cited goal.
At the same time, this scale of renewable energy investment and export brings up a host of issues,
among them: how to finance, build, route and price transmission capacity to take power to non-
adjacent countries; how renewable energy “credits”, or credit for avoided greenhouse gas emissions,
might be shared between nations; how to address the intermittency of solar and wind resources; how
to organize the governance and operation of international power lines carrying renewable electricity
to markets in other nations, and a host of other economic, technical, and institutional issues
(Maidowski 2012; Chen et al. 2010). Due to the high potential for economic growth, reduction of
economic risk, and reduction in global greenhouse gas emissions (perhaps the greatest potential of
any option in this study), the potential to shift energy exports from coal to renewable electricity
deserves significantly more research.
Figure 5-9 and Figure 5-10 show, respectively, the trends in electricity generation capacity and
electricity output in the shift in energy exports scenario. Here, for simplicity, we have assumed that
the added electricity for export would be an equal mix of solar PV and wind power. The added
capacity for export brings Mongolia’s total electrical capacity to 18.5 GW in 2035 and total generation
to 42 TWh.
16 The solar energy potential of the Gobi desert has been estimated at 1092 TWh (Terawatt-hours); see Newcom Group,
undated, ”physical solar potential of Mongolia's Gobi desert”, available as
https://jref.or.jp/images/pdf/20110912/110912_Newcom.pdf.

46
Figure 5-9. Electricity capacity in the shift in energy export scenario
-
2,000
4,000
6,000
8,000
10,000
12,000
14,000
16,000
18,000
20,000
2010 2015 2020 2025 2030 2035
Capacity(MW)
Electricity imports
Solar
Wind
Hydro
Pumped storage hydro
Oil
Coal - Other new
Coal - Other existing
Coal - Tavan Tolgoi
Coal - CHP5
Coal - CHP4

47
Figure 5-10. Electricity generation in the shift in energy export scenario
5.6 Discussion and possible initiatives
The power and heat sector plays a central role in both providing key energy services in Mongolia and
in the overall current and future greenhouse gas emissions in the nation. How Mongolia’s power and
heat systems are developed will, to a large extent, determine the future greenhouse gas emissions of
the nation. As seen in the scenario results above, the industry and buildings sectors together
comprise well over half of Mongolia’s future GHG emissions, suggesting the importance of electricity
and heat supply to these sectors (as well as efforts to reduce these sectors’ energy demand).
Later chapters of this report will describe measures to reduce electricity and heat demand. Together,
efficiency measures can substantially reduce future demand, such that growth in overall electricity
and heat demand may decrease from an annual growth rate of 4.6% to a rate of about 2.8% per year.
If these efficiency measures can be implemented, and result in electricity consumption savings similar
to those projected, Mongolian energy planners may not need to focus as much on increasing supply in
the future. This could make it easier to meet renewable energy goals, as there may be less pressure
to rapidly scale up power supply using coal-fired units. Note, however, that a crucial element of the
-
5,000
10,000
15,000
20,000
25,000
30,000
35,000
40,000
45,000
2010 2015 2020 2025 2030 2035
Electricitygeneration
(GWh)
Electricity imports
Solar
Wind
Hydro
Pumped storage hydro
Oil
Coal - Other new
Coal - Other existing
Coal - Tavan Tolgoi
Coal - CHP5
Coal - CHP4
48
success of any demand-side program to reduce heat requirements will likely be to implement heat
metering and control technologies, as well as heat pricing systems that assure that heat producers
recover, at least on average, the full costs of heat production. Heat tariffs that adequately reflect the
cost of heat generation provide heat users with the incentive to conserve, and control mechanisms—
valves and thermostats, for example—provide users with the control they need to moderate their
heat demand as desired.
Mongolia has rich solar and wind energy resources, which (together with hydropower) will be critical
in meeting renewable energy targets and emission reduction goals set out by the Mongolian
government. At present, two major policies guide Mongolia’s renewable energy development: the
2005 Renewable Energy Program and the 2007 Renewable Energy Law. The Renewable Energy
Program set forth the goal of renewable energy comprising 20 to 25 percent of total national energy
production in 2020 and set forth a number of projects (e.g. to construct specific hydropower plants,
to electrify soum centers) and research (e.g. feasibility studies) aimed at expanding renewable energy
in the country. The Renewable Energy Law regulates generation and supply of power, including
setting forth ranges for renewable energy feed-in tariffs.
To support the growth of renewable energy in Mongolia along the lines of this study’s expanded
green energy scenario, policymakers in Mongolia could:
1. Strengthen the 2007 Renewable Energy Law, to renew momentum and to take into account
recent priorities, perhaps based on the scenarios in this study, or on subsequent analysis, by
the Ministry of Energy.
2. Develop a new Renewable Energy Program. The 2005 Renewable Energy Program could be
updated to reflect the Ministry of Energy’s latest analysis and priorities for renewable energy,
as they may be developed based on the LEAP model or other assessments. A new renewable
energy program would need to be coordinated with other programs and plans such as the as
National Action Program on Climate Change (MEGD), Green Development Strategy (MEGD)
and Investment plans and list of concessions (MED), among others.
These steps would involve coordination among a number of ministries, led by the Ministry of Energy
(MoE) and involving the Ministry of Economic Development (MED) and Ministry of Environment and
Green Development (MEGD). (For a diagram of these ministries and their relevant agencies and
state-owned enterprises, see Appendix D.)
To support either of these options, further research may be necessary, building from this study, the
draft Master Plan, and other efforts. In particular, further research could address the following key
issues:
Intermittency and storage. Wind and solar resources are by their nature intermittent,
meaning that either other, likely fossil-fueled resources, electricity storage on a large scale, or
a combination of the two would need to be employed for renewable power generation to
49
operate effectively in Mongolia’s energy system. In tandem with consideration of
intermittency and storage, changes in transmission and distribution infrastructure needed to
accommodate new wind and solar resources, and to adjust to changes in coal-fired capacity
(plants retired early and plants not built in an expanded green energy case), should also be
researched.
Renewable heat. One key question is how to provide heat for residential and other buildings
using renewable energy. One advanced option is to use ground-source heat pumps to turn
electricity into heat at very high efficiencies.17 It may also be possible generate and then store
heat for hours, days, or even between seasons. Heat would then be released to the district
heating system (or to an individual home or building) when needed. Lastly, a simple (though
less efficient) option may be inexpensive resistance heaters in homes and businesses, or
adding resistance coils to district heating systems so that those systems can use renewable
electricity when it is available as surplus.
Heat tariff reform and control systems. As noted above, district heat must be priced
sufficiently to recover the costs of heat generation, and control systems need to be provided
at the consumer level to allow heat system improvement and/or renewable heat programs,
whether on the demand or supply sides, to be effective.
In addition, this analysis includes a shift in energy export scenario that describes a major role for
Mongolia in supplying electricity to northeast Asia, such as China, Korea, and Japan. This is a
promising option for Mongolia to contribute to economic growth by exporting a product (renewable
electricity) with significant global GHG benefits. Seeing this option to fruition, whether through
government-owned plants or from plants owned and operated by the private sector, will require
intensive work on a number of issues, ranging from the technical to the economic to the political, and
partnerships with the wide variety of stakeholders involved in regional cooperation on electricity
systems, including UNESCAP and the Greater Tumen Initiative (GTI), as well as the governments of
neighbor countries.
Lastly, while increasing the deployment of renewable energy and decreasing energy demand would
both help increase the fraction of renewables in electricity and heat supply in the country, so would
reducing the emphasis on the greatest source of power in the country: coal. According to the
International Monetary Fund, Mongolia has devoted a greater share of its GDP to subsidizing coal
(4.6%) than any other country analyzed, including major developing-country coal producers China
17 Resistance heaters convert electricity into heat with an efficiency of essentially 100 per cent. Heat pumps use electric
motors and pumps to compress and expand a “working fluid” to move heat from the ambient air or water or, in the case
of ground-source (or “geothermal” heat pumps, from the earth, resulting in an overall efficiency that can be well over 100
percent. Depending on the conditions, ground-source heat pumps can produce heat from electricity at an efficiency of
300 percent (or a “coefficient of performance” ratio of heat out to electricity in, of 3.0) or more.
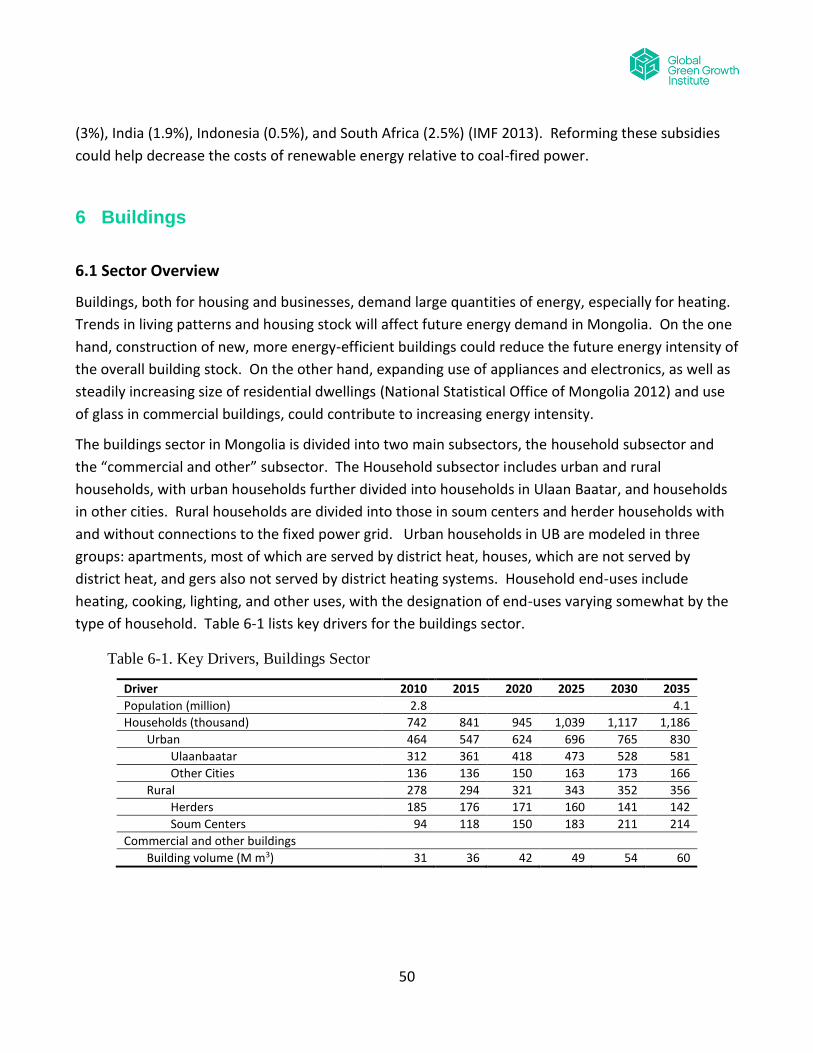
50
(3%), India (1.9%), Indonesia (0.5%), and South Africa (2.5%) (IMF 2013). Reforming these subsidies
could help decrease the costs of renewable energy relative to coal-fired power.
6 Buildings
6.1 Sector Overview
Buildings, both for housing and businesses, demand large quantities of energy, especially for heating.
Trends in living patterns and housing stock will affect future energy demand in Mongolia. On the one
hand, construction of new, more energy-efficient buildings could reduce the future energy intensity of
the overall building stock. On the other hand, expanding use of appliances and electronics, as well as
steadily increasing size of residential dwellings (National Statistical Office of Mongolia 2012) and use
of glass in commercial buildings, could contribute to increasing energy intensity.
The buildings sector in Mongolia is divided into two main subsectors, the household subsector and
the “commercial and other” subsector. The Household subsector includes urban and rural
households, with urban households further divided into households in Ulaan Baatar, and households
in other cities. Rural households are divided into those in soum centers and herder households with
and without connections to the fixed power grid. Urban households in UB are modeled in three
groups: apartments, most of which are served by district heat, houses, which are not served by
district heat, and gers also not served by district heating systems. Household end-uses include
heating, cooking, lighting, and other uses, with the designation of end-uses varying somewhat by the
type of household. Table 6-1 lists key drivers for the buildings sector.
Table 6-1. Key Drivers, Buildings Sector
Driver 2010 2015 2020 2025 2030 2035
Population (million) 2.8 4.1
Households (thousand) 742 841 945 1,039 1,117 1,186
Urban 464 547 624 696 765 830
Ulaanbaatar 312 361 418 473 528 581
Other Cities 136 136 150 163 173 166
Rural 278 294 321 343 352 356
Herders 185 176 171 160 141 142
Soum Centers 94 118 150 183 211 214
Commercial and other buildings
Building volume (M m3) 31 36 42 49 54 60
51
6.2 Reference scenario
In the reference case, energy use in households is in part driven by population growth, plus an
ongoing decrease in the size of households, with the combination leading to an increase in the
number of households, as well as by growth in personal income. Population is expected to grow from
2.8 million in 2010 (National Statistical Office of Mongolia 2012) to 4.1 million in 2035 (UN 2013)(18,),
creating an increased demand for housing. Improvements in energy efficiency, e.g. due to more-
efficient appliances or to better-insulated buildings, will tend to be more than balanced by increases
in consumption due to greater size of dwellings and higher use of appliances and electronics.
Development of commercial and institutional dwellings is expected to increase in urban areas,
especially in UB, which has a city development plan calling for increases in both housing and social
infrastructure—commercial, education, recreation, health care, and other services.
Urbanization increases in the reference scenario, with 70 percent of households in urban areas by
2035 (up from 63% in 2010 and 43% in 1990), and with 70 percent of those households in
Ulaanbaatar (UB). Both within UB and in other cities, a greater fraction of households are housed in
apartments over time and less in ger districts. Urbanization tends to increase energy intensity
compared to housing in the ger districts or rural areas, as more appliances are used.
Increases in appliance use, as greater incomes allow for greater penetration of lighting, televisions,
computers, and other appliances. The intensity of electricity use in cooking is assumed to grow at 2%
per year, and the intensity of LPG use in cooking grows at 1 percent annually among apartment
dwellers, though there is also a trend towards more use of LPG as a cooking fuel. The ownership of
other major appliances among apartment dwellers, already at or near full saturation in UB, is
assumed to change relatively little over time, and the energy intensity of those appliances also
changes little, as trends toward increasing use and/or size of appliances are balanced by general
improvements in energy intensity. The use of other electric devices, however, increases with
increasing income. In the aimags, increased electrification means better access to power, increased
purchase and use of electrical devices. Tariff incentives being implemented for electric heating to
reduce air pollution also drive up power use, and the use of LPG stoves in soum centers is assumed to
increase as well.
Decreases in appliance energy intensity and carbon intensity, as most appliances become gradually
more efficient, following international trends. Lighting, too, declines in energy intensity, with a slow
trend toward the use of more efficient fluorescent and compact fluorescent bulbs. An ongoing ger
district clean air program with efficient stoves and the use of cleaned coal is being implemented and
leads to modest declines in the energy and carbon intensity of cooking in the ger district. The energy
18 Based on the United Nations Medium projection for population, which is close to the projection in МОНГОЛ УЛСЫН ХЇН
АМЫН 2008−2030 ОНЫ ХЭТИЙН ТООЦОО, dated 2008
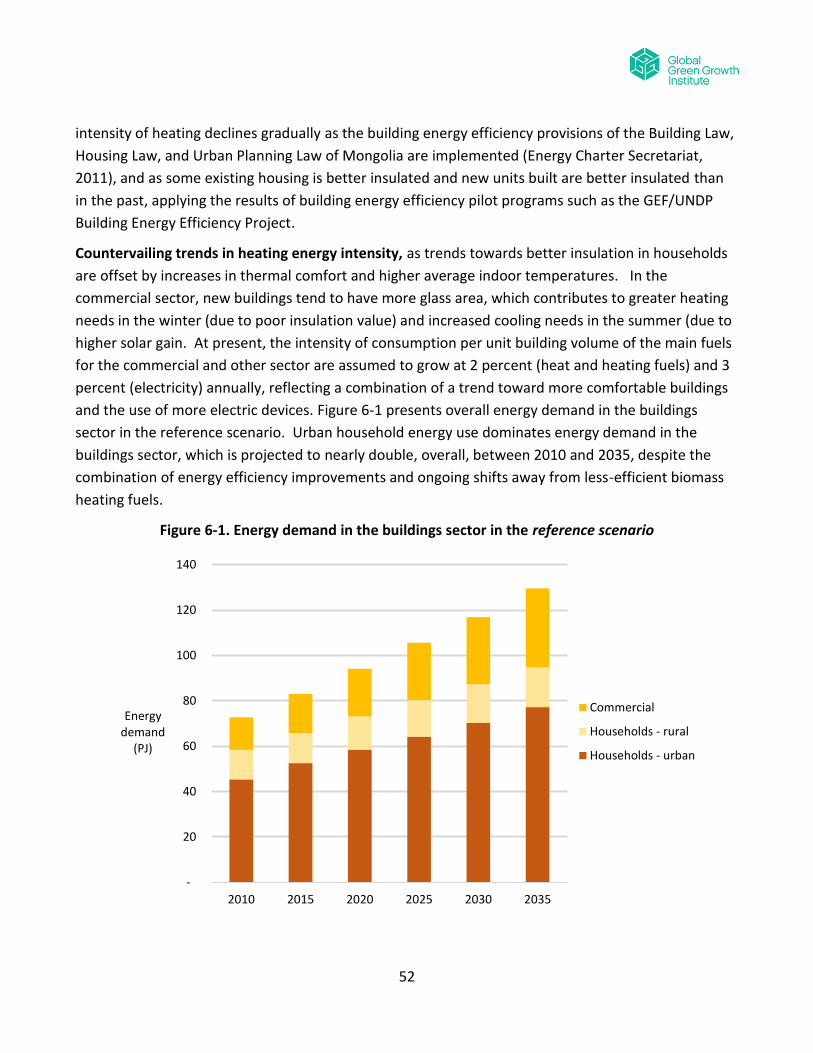
52
intensity of heating declines gradually as the building energy efficiency provisions of the Building Law,
Housing Law, and Urban Planning Law of Mongolia are implemented (Energy Charter Secretariat,
2011), and as some existing housing is better insulated and new units built are better insulated than
in the past, applying the results of building energy efficiency pilot programs such as the GEF/UNDP
Building Energy Efficiency Project.
Countervailing trends in heating energy intensity, as trends towards better insulation in households
are offset by increases in thermal comfort and higher average indoor temperatures. In the
commercial sector, new buildings tend to have more glass area, which contributes to greater heating
needs in the winter (due to poor insulation value) and increased cooling needs in the summer (due to
higher solar gain. At present, the intensity of consumption per unit building volume of the main fuels
for the commercial and other sector are assumed to grow at 2 percent (heat and heating fuels) and 3
percent (electricity) annually, reflecting a combination of a trend toward more comfortable buildings
and the use of more electric devices. Figure 6-1 presents overall energy demand in the buildings
sector in the reference scenario. Urban household energy use dominates energy demand in the
buildings sector, which is projected to nearly double, overall, between 2010 and 2035, despite the
combination of energy efficiency improvements and ongoing shifts away from less-efficient biomass
heating fuels.
Figure 6-1. Energy demand in the buildings sector in the reference scenario
-
20
40
60
80
100
120
140
2010 2015 2020 2025 2030 2035
Energydemand
(PJ)
Commercial
Households - rural
Households - urban

53
6.3 Recent plans scenario
The recent plans scenario largely follows the reference case in the buildings sector, with the
exceptions that it includes building energy efficiency—improvements in building envelopes—and
lighting efficiency improvements, both of which are part of recent policies proposed for the sector.
These improvements are implemented in both the households and commercial subsectors. Figure 6-2
shows the trend in energy demand in the buildings sector. Relative to the reference case, year 2035
energy demand is reduced in this scenario by 20%.
Figure 6-2. Energy demand in the buildings sector in the recent plans scenario
6.4 Expanded green energy scenario
In the expanded green energy scenario, trends in population, urbanization, household size, appliance
use, and scale of commercial development mirror the reference case. Improvements in heating and
electric power efficiency, however, are greater but do not necessarily counterbalance growth in
average household size or appliance use. In some cases, notably for heating requirements and many
appliance categories, a downward trend in per household energy demands results as improved
building-insulation and appliance efficiency outweigh increased living space and appliance ownership.
-
20
40
60
80
100
120
140
2010 2015 2020 2025 2030 2035
Energydemand
(PJ)
Avoided (vs reference)
Commercial
Households - rural
Households - urban
54
Within the commercial sector, increases in energy demand are dampened relative to the reference
scenario, decreasing on a per cubic meter of building volume basis. However, the rapid expansion of
infrastructure continues to drive up the overall heat and power required by commercial buildings
through 2035.
The major departures from the reference scenario modelled are:
Energy retrofits of existing apartment buildings proceed rapidly, with retrofits starting in 2014 and
proceeding at an annual rate of roughly 5% of the building stock, such that all of the remaining
existing buildings are retrofit by 2035. Due to better insulation and air sealing, these retrofit buildings
require 29% less heat per household (Fraunhofer IBP 2008). Improved insulation of apartment
buildings was identified as one of the top priorities in MEGD’s Technology Needs Assessment (MEGD
2013b). Furthermore, phase-in of heat metering allows further reduction of heat demand by 20% per
household by providing a clear incentive to not over-heat, as has been achieved in industry and
service sector buildings (MNET 2010). As the members of the building trade in Mongolia become
more familiar with measures for improving the energy efficiency in buildings, both the annual rate of
conversion of the building stock and the improvement in efficiency could increase beyond what has
been included in the expanded green energy scenario, as the savings rate above is based on the
results of a relatively limited case study.
Higher energy standards for new apartment buildings take effect in 2014 with better compliance
rates, decreasing the thermal energy demands by 28% for all new apartment buildings compared to
reference (UNDP 2007). Higher energy standards for new buildings would build upon the provisions
of the Building Law, Housing Law, and Urban Planning Law. As with retrofit buildings, introduction of
heat metering saves an additional 20% per household (MNET 2010).
Transition to high-efficiency appliances and lighting for all grid-connected residential and
commercial buildings occurs with more aggressive deployment than in the reference scenario,
achieving reductions in electricity demand of 25% for residential and 21% for commercial buildings
relative to the reference scenario, similar to that achieved for Russia in the IEA’s 2DS scenario (IEA
2012a).
Demand for fuel for heat in urban ger districts decreases 40% per household (ADB 2008; MEGD 2013)
by 2035 through increased use of efficient stoves and better insulation (blankets). For cookstoves,
efficient coal stoves replace existing coal stove technology at a rate of 2% per year starting in 2015,
with an associated 40% improvement in energy efficiency per stove (Arc Finance 2012; MEGD 2013).
Heating and coal demand in the commercial sector is reduced by 28% through a combination of
increased efficiency standards, higher compliance with the standards, and building retrofits starting in
2015 at a rate of about 5% per year. The amount of heat and fuel savings is consistent with the
improved building standard and enforcement (UNDP 2007) and retrofits (Fraunhofer IBP 2008), while
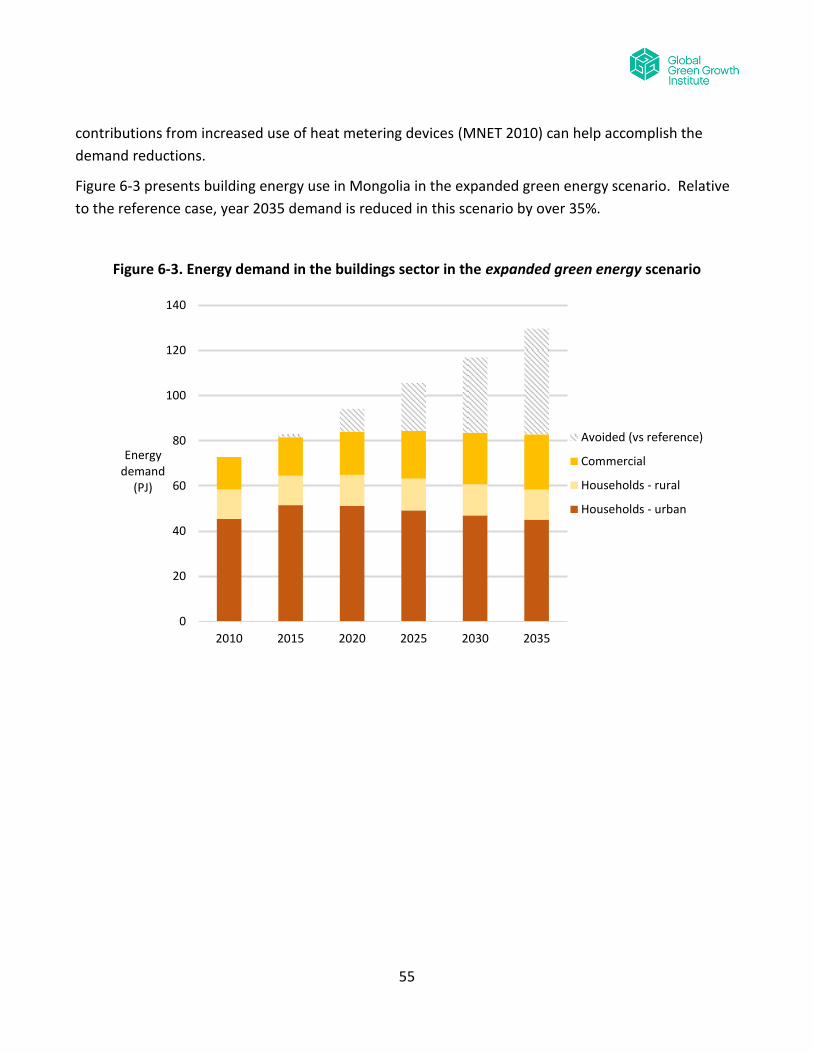
55
contributions from increased use of heat metering devices (MNET 2010) can help accomplish the
demand reductions.
Figure 6-3 presents building energy use in Mongolia in the expanded green energy scenario. Relative
to the reference case, year 2035 demand is reduced in this scenario by over 35%.
Figure 6-3. Energy demand in the buildings sector in the expanded green energy scenario
0
20
40
60
80
100
120
140
2010 2015 2020 2025 2030 2035
Energydemand
(PJ)
Avoided (vs reference)
Commercial
Households - rural
Households - urban

56
Box 6-1: Considerations for Natural Gas for Heat in Mongolia
Mongolia does not have significant natural gas reserves, and so energy planning in Mongolia has not
generally included serious consideration of natural gas for power or heat supply. Future imports of
natural gas, either via pipeline (perhaps from Russia) or by rail as liquefied natural gas (LNG),
remains a possibility, however (Maidowski 2012), and natural gas (as CNG) has some momentum as
a fuel for buses in Ulaanbaatar (GGGI 2013). Furthermore, it is possible that in-country sources of
methane (e.g., coal mines, animal wastes) could supplement (or, perhaps, substitute for) sources of
imported natural gas, at least for some smaller applications.
Gas could potentially be deployed as a heating fuel in Mongolia, whether as used in dedicated
boilers, in CHP, or directly to buildings (e.g., in UB’s ger districts, if distribution infrastructure was
developed). Several factors may need to be considered in evaluating this potential:
Costs of transmission and distribution infrastructure (and, if applicable, collection infrastructure,
e.g. for methane from animal wastes)
Greenhouse gas or other pollutant benefits per unit of gas. Given that quantities of natural gas
(or methane) are likely to be constrained in Mongolia, it may be advisable to use the gas where
societal benefits are the greatest, e.g. where each unit of natural gas has the greatest air
pollution or greenhouse gas emissions benefit. This may tend to favor use of gas in centralized
power or heat (or CHP) applications where the efficiency benefit of gas (compared to alternative
fuels) may be the greatest.
“Upstream” or “life-cycle” GHG balance of gas relative to alternative fuels; though the GHG
emissions of combusting natural gas are much less (per unit of energy obtained) than coal, when
leaks in production and transport infrastructure are considered, the GHG benefits of natural gas
can be much less, or (according to some researchers) eliminated. Furthermore, other means of
providing heat (such as ground source heat pumps) may be able to yield (particularly in the long
term) much greater GHG savings at comparable costs.
The scenarios in this study do not include new natural gas infrastructure, due to lack of a domestic
resource and lack of significant import capacity.

57
6.5 Discussion and possible initiatives
The expanded green energy scenario indicates that the potential for increased energy efficiency in
buildings is significant – perhaps reducing energy intensity by 35% in 2035 relative to the reference
case scenario, for a total energy savings of nearly 47 PJ. This finding, in turn based largely on a
number of studies by Mongolia’s international partners, suggests that a greater focus on end-use
energy efficiency may be needed in the country. A number of initiatives already exist, involving the
Mongolian government and outside partners such as the Global Environment Facility, UNDP, GIZ, and
others. Still, Mongolia’s Ministry of Energy has no formal national energy efficiency priorities and
policies (Minchener 2013), unlike for renewable energy. As will be explored further in Chapter 8,
energy efficiency is often the most cost-effective means of meeting goals for reductions in GHG
emissions or other pollutants, and it may deserve more attention.
To support the realization of energy efficiency’s potential to reduce the need for future power plants,
bring energy savings to consumers, and reduce GHG and other emissions, the Mongolian Ministry of
Energy, together with partners at the Ministry of Environment and Green Development and Ministry
of Road, Transportation, Construction and Urban Development, may consider developing a more
formalized framework for building energy efficiency, such as a national energy efficiency or energy
conservation law. Such a law has been considered in Parliament before, but not yet passed as of
January 2014. A new law could set out energy efficiency goals and priorities, much like the 2007
Renewable Energy Law did for renewable electricity. Perhaps as part of such a law (or as individual
initiatives), Mongolia could develop:
An expanded program, perhaps coupled with financing, to retrofit existing buildings, and
expanding on existing programs such as those focused on pre-cast apartment buildings in UB
and the wider distribution of ger blankets.
Appliance efficiency standards to ensure that appliances and other electronics, use of which is
rapidly expanding in Mongolia, meet stringent standards. Policy templates and assistance is
available from a number of international organizations, including the Collaborative Labeling &
Appliance Standards Program (CLASP) and the Super-efficient Equipment and Appliance
Deployment (SEAD) Initiative. This initiative could be developed and implemented by some
combination of the Ministry of Energy, Ministry of Environment and Green Development, and
the Mongolian Agency for Standard and Measurement. Currently, the Ministry of Energy is
preparing a draft of an energy efficiency law that would establish an energy conservation
committee to implement energy efficiency standards and other measures in energy
consumers.
A stringent building energy code to ensure that future residential and
commercial/institutional buildings are efficient. Given the rate of growth of Mongolia’s
economy, coupled with ongoing urbanization, buildings that are yet to be built may comprise
58
a significant fraction of all building energy demand in the reference case in 2035, suggesting
the importance of standards the minimize the energy intensity of these buildings while
avoiding “locking in” poor thermal performance. This standard could be developed and
implemented by the Ministry of Road, Transportation, Construction and Urban Development
with assistance from the Mongolian Agency for Standard and Measurement under the Deputy
Prime Minister.
As in other sectors, further research and data development could also be beneficial. (See section 11.3
for a list of possible follow-on research and initiatives.)
7 Transport
7.1 Sector Overview
Transportation activity has been expanding in Mongolia, both passenger and freight travel. In
particular, there has been a strong trend towards increase in the number private passenger vehicles,
with rates of private vehicle ownership over 15 times higher in 2010 than they were in 1990 (National
Statistical Office of Mongolia 2012). Passenger travel has increased from 980 passenger-kilometers
(pkm) per person in 1990 to 1,200 pkm in 2010. Freight transport has increased from 3,300 tonne-
kilometers (tkm) per person in 1990 to 4,400 tkm in 2010, with large majority by rail (National
Statistical Office of Mongolia 2012). Table 7-1 lists assumptions regarding key drivers for the
reference scenario.
Table 7-1. Key Drivers, Transport Sector
Driver 2010 2015 2020 2025 2030 2035
Passenger transport (thousand pkm/resident) 1.3 2.2 3.0 4.0 5.1 6.2
Road 0.5 1.1 1.8 2.5 3.2 4.0
Rail 0.4 0.5 0.4 0.4 0.4 0.4
Air 0.3 0.6 0.8 1.1 1.4 1.7
UB Subway 0.0 0.0 0.0 0.1 0.1 0.1
Freight transport (thousand tkm/resident) 4.4 5.6 7.2 9.1 11.7 14.9
Road 0.7 1.6 2.1 2.9 3.9 5.2
Rail 3.7 4.0 5.0 6.3 7.8 9.7
Air <0.1 <0.1 <0.1 <0.1 <0.1 <0.1
59
7.2 Reference scenario
In the reference scenario, expansion of private passenger travel continues, and although some
improvements are expected, efforts to reduce transport energy use are assumed to be modest in
scale. The reference scenario is also characterized by the following trends.
Continued increase in personal travel, as passenger kilometers travelled increase with population
growth, and with a roughly five-fold increase in travel per person by 2035 relative to 2010, following
recent trends tempered with consideration of a maturing economy. Based on data from IEA 2012,
these estimated trends for passenger-km per person by 2035 yield roughly half of that projected for
China and about 40 percent of the total in Russia over the same time frame. Over time, a greater
fraction of passenger transport is by private cars (40% of passenger-kms in 2020 and 49% in 2035, up
from 25% in 2010) and air (a 27% by 2020, maintained through 2035, up from 21% in 2011). A
subway in UB starts service in 2022, providing 2% of passenger-kms.
Continued increase in freight travel, to support increasing consumption of goods and industrial
activity. Freight transport per capita is assumed to increase by an average of 5 percent annually, with
road freight continuing to gain ground on rail, transporting 35 percent of tonne-kms by 2035 (up from
15 percent in 2010).
Gradual decline in energy intensity of vehicles, following forecast international trends (IEA 2012a),
for both passenger (declining about 1% per year for cars, 0.5% per year for buses) and freight vehicles
(declining 0.4% per year).
Figure 7-1 shows the reference case trends in energy demand in the transport sector, respectively, by
subsector. Freight road transport dominates (using diesel fuel), much of it related to coal and
minerals production.19
19 Electricity use in vehicles is included only for expansion of the existing urban trolley system in the reference case, but
the reference case also includes new electric train transport in the form of the planned Ulaan Baatar subway system,
which is assumed to come into operation in 2022.
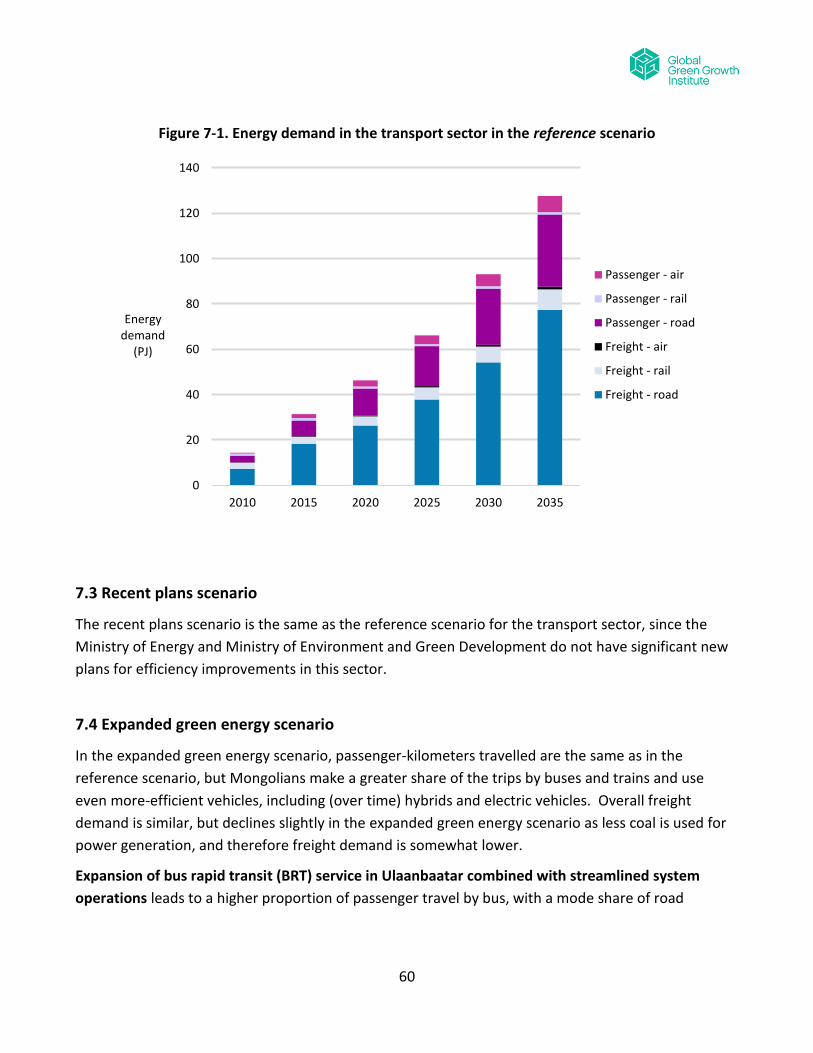
60
Figure 7-1. Energy demand in the transport sector in the reference scenario
7.3 Recent plans scenario
The recent plans scenario is the same as the reference scenario for the transport sector, since the
Ministry of Energy and Ministry of Environment and Green Development do not have significant new
plans for efficiency improvements in this sector.
7.4 Expanded green energy scenario
In the expanded green energy scenario, passenger-kilometers travelled are the same as in the
reference scenario, but Mongolians make a greater share of the trips by buses and trains and use
even more-efficient vehicles, including (over time) hybrids and electric vehicles. Overall freight
demand is similar, but declines slightly in the expanded green energy scenario as less coal is used for
power generation, and therefore freight demand is somewhat lower.
Expansion of bus rapid transit (BRT) service in Ulaanbaatar combined with streamlined system
operations leads to a higher proportion of passenger travel by bus, with a mode share of road
0
20
40
60
80
100
120
140
2010 2015 2020 2025 2030 2035
Energydemand
(PJ)
Passenger - air
Passenger - rail
Passenger - road
Freight - air
Freight - rail
Freight - road
61
transport increasing from 40% presently to 43% in 2020, compared to a drop to 33% in 2020 in the
reference scenario. This is consistent with GGGI’s transport study (GGGI 2013).20
Greater adoption of energy-efficient vehicles, including hybrids for both passenger and freight
vehicles, with highly efficient internal-combustion and hybrid vehicles comprising 25% and electric
vehicles 4% of the road passenger and freight fleet by 2035 (up from 0% in the reference scenario),
roughly tracking the potential market for these vehicles in nearby Russia but somewhat behind that in
China (IEA 2012a). In the green energy scenario, electric vehicles consume roughly one-quarter the
energy of the equivalent liquid fuel vehicles (IEA 2009)21.
Partial conversion of bus fleet to compressed natural gas (CNG) buses, with the transition of 20% of
the bus fleet to CNG between 2014 and 2020, consistent with the maximum CNG conversion scenario
in GGGI’s transport study (GGGI 2013). (For additional discussion of CNG vehicles, see Box 7-1.)
Increased use of rail for passenger and freight transport, as rail transport provides twice the share of
passenger-kms in 2035 (12% of passenger-kms) as in the reference scenario (6%), with the majority of
the shift from road travel and some from air travel. In this scenario, rail still comprises a much lower
share of passenger travel in 2035 (12%) than it does currently (34%) due to rapid growth of personal
vehicle travel, though overall rail travel does climb, from 440 pkm per person in 2010 to 740 pkm per
person in 2035. In freight transport, use of rail increases relative to the reference scenario,
comprising 94% of tonne-km in 2035, compared to 90% in the reference scenario (both of which are a
decrease from 97% mode share in 2010, due to continued growth of road freight transport.)
Figure 7-2 and shows trends in energy demand by vehicle type in the expanded green energy scenario.
Features of these results relative to the reference case include markedly lower overall energy use
(nearly 39 percent by 2035), and a very modest shift in fuel types away from petroleum products to
electricity and, to a lesser extent, natural gas.
20 GGGI’s Transport study, assumed, in a medium case, that 15% of personal vehicle travel in UB switches to buses. Fifteen
percent of car mode share in the reference scenario of 67.5% is 10% and is therefore the difference between the bus
mode share in the reference scenario in 2020. 21 This comparison refers to end-use energy consumption, and does not include conversion or transmission and
distribution losses associated with electricity use.

62
Figure 7-2. Energy demand by vehicle type in the transport sector in the expanded green energy
scenario
0
20
40
60
80
100
120
140
2010 2015 2020 2025 2030 2035
Energydemand
(PJ)
Avoided (vs. reference)
Passenger - air
Passenger - rail
Passenger - road
Freight - air
Freight - rail
Freight - road

63
Box 7-1: Considerations for CNG Vehicles
Urban areas, including Ulaanbaatar, are sometimes drawn to compressed natural gas (CNG) vehicles
as a means to improve local urban air quality. Compared to gasoline or diesel, CNG yields fewer
particular air pollutants and nitrous oxides per unit of energy, and in some cases existing vehicle stock
can be converted. CNG also produces less carbon dioxide emissions from combustion than does
gasoline or diesel. However, whether converting vehicle fleets from gasoline or diesel to CNG would
reduce greenhouse gas emissions is an open question. CNG is made primarily of methane (CH4),
which itself is a potent greenhouse gas, many times more potent than carbon dioxide. If the process
of producing and delivering natural gas, plus operating the CNG vehicle, leaks even a small amount
(e.g., 3%) of natural gas, the net effect of CNG vehicles could actually be to increase global
greenhouse gas emissions (Alvarez et al. 2012). The expanded green energy scenario converts, in the
short term, 20% of the buses in Ulaanbaatar to CNG, consistent with the recent GGGI transport study
(GGGI 2013). In the long term, the expanded green energy scenario introduces electric vehicles. De-
carbonization of transport fuels could also be accomplished with low-GHG biofuels, if such fuels exist,
or fuel cell vehicles, if they are developed.
7.5 Discussion and possible initiatives
In the reference scenario, transporting people and goods demands nearly as much energy in 2035 as
do buildings or industry, though it grows at the fastest average rate (averaging 9% per year for both
freight and passenger transport through 2035). This rapid growth rate indicates the importance of
energy efficient and low-carbon transport in meeting Mongolia’s GHG reduction goals. Furthermore,
mobility of people, materials (e.g. coal and copper), and consumer goods is likely to be a critical factor
in maintaining economic growth in the country.
Energy use for transportation is dominated by road transport vehicles (cars and trucks). Results of the
expanded green energy scenario suggest that the three primary strategies to reduce transport energy
demand all have significant effects. These are: (1) avoid and shorten trips, especially through urban
planning that allows for proximity of services and employment to residents; (2) shift trips to other
modes, such as bus, rail, and non-motorized modes; (3) increase the efficiency of vehicles (including
adoption of electric vehicles in the long term).
Although a detailed assessment of policy options is beyond the scope of this study, experience in
other countries suggests that the following policies may need to be strengthened in Mongolia, and
building on the country’s existing national transport strategy:

64
National guidelines for urban planning, and combined land use and transportation planning, to
plan for growth and transportation systems in urban areas that minimizes the need for
personal vehicle travel. This may include guidelines on specific types of policies, such as
parking requirements or road system planning, which can encourage public and non-
motorized transit or dissuade personal vehicle travel.
Policy support for expanded public transportation, both inter-city rail and for public
transportation within major urban areas, especially UB, and perhaps including a national
strategy on moving people and goods that includes significant expansion of rail capacity.
Enhanced vehicle efficiency or emissions standards. More stringent fuel economy standards,
or CO2 emissions standards, could be implemented for vehicles in Mongolia, or enforcement
of existing regulations enhanced. These could build on Mongolia’s existing taxes based on
CO2-intensity and engine size and set long-term targets to give vehicle sellers greater certainty
(GGGI 2013).
The Ministry of Road, Transport, Construction, and Urban Development would be a natural lead for
these types of efforts. The Ulaanbaatar city government could play an important role in guidelines for
urban planning and combined land use and transportation planning. The Ministry of Environment and
Green Development would implement CO2 emission standards. And, although the discussion here
focuses primarily on road transport, the use of air transport is also increasing rapidly, and as air
transport is typically more energy intensive, per passenger-km, than other passenger transport modes,
policies or programs implemented to discourage flying or promote alternatives (such as long-distance
rail transport) could result in reductions in overall energy use. At the same time, some have
suggested that increasing some air travel (that of in-bound tourists) could perhaps contribute to
green development – this possibility is discussed further in Box 7-2.

65
Box 7-2: Tourism as green growth?
Increasing tourism is sometimes discussed as a potential source of economic growth in Mongolia.
Increasing the number of visitors could increase spending at hotels, restaurants, retailers, travel
and tour providers, and other businesses, with secondary effects for the broader economy. The
extent that tourism would be green growth depends on one’s perspective. In the context of energy
planning, one of the key metrics to assess a potential green growth initiative is greenhouse gas
emissions.
Most energy and greenhouse gas emissions associated with tourism are from air travel (UNWTO
and UNEP 2008). Whether increasing tourism in Mongolia would increase or decrease global GHG
emissions depends on who is travelling to Mongolia and where else they otherwise might have
travelled. For example, if a European traveler were to travel to Mongolia instead of to another
destination in Europe, global GHG emissions may increase because of the further transport
distance. On the other hand, if a Chinese traveler were to travel to Mongolia instead of to
southeast Asia, air travel could be shorter and global GHG emissions could decrease.
Another perspective could be whether increasing tourism in Mongolia may yield a greater increase
in GDP per unit of GHG emissions than alternative development paths, such as increased mining.
Based on global economic data compiled from the Global Trade and Analysis Project , the GHG-
intensity (per unit of economic value) of travel is not significantly different than mining coal or
copper, however – both yield, on average, about 2 kg of CO2e per dollar of economic value
(Hertwich and Peters 2010). The GHG-intensity of tourism could be decreased if the tourism
involved greater expenditures in low GHG-intensity activities, such as recreation activities within
Mongolia that do not depend heavily on additional travel.

66
8 Industry: Mining and Manufacturing
8.1 Sector overview
Exploration of fossil and mineral resources has proceeded rapidly in Mongolia, especially for coal and
copper, for which production is now poised to grow four-fold by the end of this decade (IMF 2012) .
Copper extraction is poised to be a major driver of economic growth in Mongolia, due in large part to
the Oyu Tolgoi copper and gold mine, which contains an estimated 25 million tonnes of copper and
1,100 tonnes of gold (Temuulen 2010). The mine, situated in the south Gobi region, is also expected
to be a large electricity user, due to the demands of ore processing equipment such as crushers,
grinders, and separators, as it ramps up production in the next few years.
The territory of Mongolia may contain as much as 160 billion tons of coal resources (USGS 2012;
Baatar 2012; Minchener 2013; BGR 2013). By far the largest single deposit of economically
recoverable coal reserves is the Tavan Tolgoi deposit, with an estimated 7.5 billion tons of mineable
reserves of bituminous hard coal (Minchener 2013).
Mongolia also has significant iron ore, gold, and crude oil resources, and production of these
commodities may also be poised to grow rapidly in the coming years (Eurasia Capital 2011). Domestic
crude oil is mainly exported to China, however plans exist for Mongolia’s first refinery, which could
largely rely on Russian crude inputs (Oxford Business Group 2013). Further opportunity remains to
extract and refine Mongolian crude within the country, and two additional smaller refineries have
been discussed (Maidowski 2012).
In addition to these primary resources, other resource industries will also grow in Mongolia: iron and
steel production, cement production, and a host of other secondary industries. Though each
demands less overall energy than does mining, together they still comprise a significant fraction of
Mongolia’s energy demand.
Table 8-1. Key Drivers, Industry Sector lists assumptions regarding key drivers for the industry sector
assumed for all scenarios.

67
Table 8-1. Key Drivers, Industry Sector
Driver 2010 2015 2020 2025 2030 2035
Copper (Million tonnes)
Oyu Tolgoi 0.00 0.20 0.55 0.55 0.55 0.55
Erdenet 0.12 0.12 0.12 0.12 0.12 0.12
Coal (Million tonnes)
Tavan Tolgoi 9 22 40 45 50 50
Other 15 26 30 35 38 41
Crude oil (Million barrels) 2.2 4.4 4.4 4.4 4.4 4.4
Iron Ore (Million tonnes) 3.2 6.5 7.5 7.5 7.5 7.5
Gold (Tonnes) 6.0 20.7 20.7 20.7 20.7 20.7
Cement (Thousand tonnes) 323 1,348 2,500 3,506 4,475 5,188
Steel and iron (Thousand tonnes) 126 161 205 262 334 427
8.2 Reference scenario
In the reference scenario, production of most commodities increases rapidly, with energy intensity
declining gradually due to installation of new, more efficient equipment.
Copper. The Oyu Tolgoi mine produces 200,000 tonnes of copper in its first full year (2014), rising to
roughly 500,000 tonnes in 2017, increasing to 550,000 tonnes in 2019, and holding constant through
2035 (IMF 2012; Temuulen 2010). Production at Mongolia’s other copper mines, especially Erdenet,
continues at about 120,000 tonnes of copper annually. The energy intensity of copper mining holds
relatively constant, as Mongolia’s copper mines follow historical patterns of gradually decreasing ore
quality as the richer deposits are mined first22, and lower ore content results in higher energy
intensity per ton of ore (Norgate and Haque 2010). The increased energy intensity from mining of
lower ore quality offsets improvements mining, hauling, and processing technologies. Energy
requirements per ton of concentrated of copper ore are higher for Erdenet copper mining than for
Oyu Tolgoi due to the higher quality ore content of the Oyu Tolgoi mine (Fisher et al. 2011).
Coal. Tavan Tolgoi rapidly increases output, to 35 million tonnes in 2017 (IMF 2012), after which
output growth levels off somewhat, rising to 50 million tons in 2030. Output of other coal mines
increases from about 15 million tonnes per year in 2010 (National Statistical Office of Mongolia 2012)
to 35 million tonnes per year by 2017 (IMF 2012) and over 40 million tonnes by 2035.23 The energy
22 See, in the case of Mongolia, decreasing ore quality at Erdenet between 2007 and 2011
(http://www.erdenetmc.mn/index.php?option=com_content&view=article&id=57%3Atechnic&catid=37%3Aindicator&Ite
mid=55&lang=en) as well assumed reduced ore quality by Fisher et al. (2011). 23 Growth rates in output decline over time, in part due reduced issuance of licenses for exploration and production over
time—including a recent decrease in exploration permits from 50% to 20% of Mongolia’s land area—based on “wise
exploitation of minerals”, and more control over the mining sector.

68
intensity of coal mining holds constant in the reference scenario, as gains in the efficiency of
equipment are offset by gradually increasing difficulty in extracting coal and/or, in the case of
electricity use, increased use of electricity for mining processes.
Crude oil. The planned oil refinery in Darkhan (jointly owned by Marubeni Corp and Toyo Engineering)
starts producing in late 2015, at a capacity of 44,000 barrels per day and produces refined products
roughly in proportion to existing in-country demand, which is consistent with stated annual
production goals of one million tonnes of diesel fuel, 630 thousand tonnes of gasoline, and 60
thousand tonnes of jet fuel. 24 Planning is also underway for another refinery in Sainshand, though
that refinery is not included in the reference scenario due to uncertainty about its feasibility
(Maidowski 2012). Domestic crude oil output grows from about 2.2 million barrels per year in 2010 to
4.4 million barrels per year in 201525. Alternative projections for crude oil output from the literature
(Eurasia Capital 2011) suggest continued strong growth in crude oil output at least into the 2020s, but
these estimates were judged to be unrealistic by Advisory Committee members. The energy intensity
of petroleum refining holds constant in the reference scenario, with an average efficiency of 95%. It is
expected, based on input from the Advisory Committee that, due to geographical considerations,
crude oil extracted in Mongolia will continue to be exported, and oil refining in Mongolia will use
crude oil imported from Russia.26
Iron ore. Production of iron ore expands from just over 3 million tonnes in 2010 to 7.5 million tonnes
in 2020, remaining at that level thereafter.
Gold. Mining for gold continues to accelerate, growing by a factor of three between 2010 and 2015,
but then remaining steady out to 2035. As with copper and iron ore mining, increasingly lower grade
ore quality serves to cancel out decreased energy intensity from improved technology, leaving energy
intensity essentially unchanged through 2035 in the reference scenario. Mining intensities are based
on US DOE (2007), IEA (2007), and Mudd (2007).
24 See, for example https://www.marubeni.com/dbps_data/news/2010/100929f.html 25 Projections of crude oil production capacity/output for 2015 and on are based on Advisory Committee input received
10/2013. 26 A recent announcement indicates that HBOil JSC, an oil trading and refining company based in UB, has acquired a 20
percent stake in an existing oil refinery in North Korea, near that nation’s border with Russia and China. It is unclear how
the Mongolian company intends to provide crude oil for the refinery, which was built with assistance from the Soviet
Union in the 1970s) when and if it is brought back on line (the refinery has been mostly idle for nearly 20 years), or where
the products the refinery would produce would be sent, although it has been suggested that petroleum products trades
involving the Russian Far East could be a possible mechanism for supplying fuels from the project to Mongolia. See, for
example, Bloomberg Sustainability (2013), “Mongolia Taps North Korea Oil Potential to Ease Russian Grip”, by Michael
Kohn and Yuriy Humber, dated June 18, 2013, and available as http://www.bloomberg.com/news/2013-06-17/mongolia-
taps-north-korean-oil-potential-to-ease-russia-reliance.html.
69
Steel and iron production is assumed to increase at 5 percent annually through 2035 with constant
per unit energy demand. Modest improvements in energy intensity of output for both electricity (-
0.5%) and coal heat (-0.3%) are achieved in the reference scenario, consistent with recent historical
energy intensity decline (worldsteel 2011; IEA 2011).
Cement output increases from 426,000 tonnes in 2011 to 2.5 million tonnes in 2020, and then at a
slower rate of growth (as the economy matures and growth in the building sector slows) to 5.2 million
tonnes in 2035. Modest improvements in energy intensity of output for both electricity (-0.5%) and
coal heat (-0.3%) are achieved in the reference scenario.
Construction, following a decrease in output in 2009 during the global recession, resumes its strong
growth, with sectoral GDP increasing from 343 million dollars in 2010 to nearly 2.7 billion dollars in
2035. Growth in the construction sector is assumed to gradually slow over time, as the Mongolian
economy matures and population growth declines. As in other industrial sectors, modest
improvements in the energy intensity of output for both electricity (-0.5%) and coal heat (-0.3%) are
achieved in the reference scenario, with the intensity of other fuels use (diesel, gasoline, and
bitumen/asphalt) remaining steady at 2010/2012 levels.
Other, secondary industry outputs grow in a manner consistent with recent trends. Energy
intensities slowly decrease (at the same rate as for steel and iron and cement manufacturing).
Figure 8-1 and Figure 8-2 show growth in energy consumption by subsector and by fuel, respectively,
for the industrial sector. Electricity use in the sector jumps with the increase in copper output from
2014-on, with electricity initially coming from imports from China (starting in 2013), and later from
the Tavan Tolgoi power plant27.
27 Before 2013, electricity for Tavan Tolgoi was reportedly generated on-site using large diesel-fueled generation units.

70
Figure 8-1. Energy demand by subsector type in the industrial sector, reference scenario
Figure 8-2. Energy demand by fuel in the Industrial sector, reference scenario
-
20
40
60
80
100
120
140
2010 2015 2020 2025 2030 2035
Energydemand
(PJ)
Construction
Other secondary industry
Steel
Cement
Crude oil
Iron ore
Coal
Gold
Copper
-
20
40
60
80
100
120
140
2010 2015 2020 2025 2030 2035
Energydemand
(PJ)
Wood
Electricity
HOB Heat
Heat
Gasoline
Diesel
China Elect. Imports for TT
Bitumen
Petroleum Coke
Coal Lignite
Coal Bituminous

71
8.3 Recent plans scenario
Assumptions for the industrial sector for the recent plans scenario are the same as for the reference
scenario.
8.4 Expanded green energy scenario
In the expanded green energy scenario, industrial production volumes match those in the reference
scenario, but industries transition to very low energy-intensity technologies, in some cases reaching
(current) practical minimum intensities by 2035.
Copper. In the expanded green energy scenario, copper mining operations are conducted with even
more energy efficient equipment, especially in the long term. Compared to reference case levels
(which are assumed, given the relative newness of the equipment), to be similar to current world
“best practice” levels, energy intensity in 2035 reaches practical minimum levels, estimated here to
be 42% less electricity and 30% less diesel than in the reference case (US DOE 2007). These energy
efficiency improvements are phased in from 2020 on.
Coal. The efficiency of mining operations improves substantially with improved equipment and
technology use for extraction, materials handling, and beneficiation and processing (which includes
crushing and grinding and separations). In this scenario, coal mining demands approximately 15% less
electricity and 30% less diesel in 2020 than in the reference scenario (US DOE 2007). By 2035,
continual upgrades to reduce energy intensity even further, with energy intensity reaching practical
minimum levels – 48% less electricity and 48% less diesel compared to the static reference case (US
DOE 2007).28
Crude oil refining. Petroleum refining steadily realizes improvement in energy efficiency, to reach
best available technology (Saygin et al. 2011) levels by 2035, which reduces energy intensity by about
50%, and increases efficiency to roughly 97.5%.
Iron ore. In this sector, mining equipment also reaches practical minimum energy intensities in the
long term: 1% savings between 2014-2020 and an additional 21% savings by 2035 relative to the
reference case (Norgate and Haque 2010).
Gold: Gold mining energy intensities undergo the same relative improvements as copper mining,
reaching practical minimum energy intensities by 2035 (US DOE 2007). Savings relative to the static
reference scenario are 27% by 2020 and 58% by 2035 for electricity, and 20% by 2020 and 45% by
2035 for diesel demand versus the reference scenario.
28 Planned, but not yet implemented in the modeling of the green energy scenario, are coal-bed and coal-mine methane
capture and usage to reduce greenhouse gas emissions associated with coal mining. Further research is needed to
determine the applicability of these options to the predominantly open-cast coal mines in Mongolia.

72
For steel and iron, and cement, uptake of energy efficiency technologies and practices reduce
electricity demand by 10% in 2020 and 28% in 2035 relative to the reference scenario, driven by
mainly by implementation of improved electric motors and drive systems, with additional demand
reduction from improvements in lighting and other industrial end uses, and a shift from vertical shaft
to horizontal shift kilns in cement production. Demand for solid fuels and heat, decline 10% by 2020
and 30% by 2035 relative to the reference scenario, primarily from introduction of higher-efficiency
boilers and furnaces and more efficient end use of heat.
All secondary and other industries, undergo the same reductions in electricity demand and solid fuel
requirements as cement and steel and iron, driven by implementation of similar industry wide
technologies.
Figure 8-3 and Figure 8-4, respectively, show energy demand by fuel type and by industrial subsector
under the expanded green energy scenario. As a result of efficiency improvements, overall energy
demand in 2035 is 29 percent less than in the reference case, and overall industrial energy use,
though more than twice 2010 levels, grows only slowly after 2020.
Figure 8-3. Energy demand by subsector type in the industrial sector, expanded green energy
scenario
-
20
40
60
80
100
120
140
2010 2015 2020 2025 2030 2035
Energydemand
(PJ)
Avoided (vs reference)
Construction
Other secondary industry
Steel
Cement
Crude oil
Iron ore
Coal
Gold
Copper

73
Figure 8-4. Energy demand by fuel in the industrial sector, expanded green energy scenario
8.5 Shifts in energy export scenario
Although mining activity is expanding rapidly, the Mongolian government also realizes that the
economy has become perhaps too dependent on mining exports, and it has been evaluating means of
diversifying its economy (UNIDO and Government of Mongolia 2011; Minchener 2013; Enkhbayar
2013; Oxford Business Group 2013). The Ministry of Economic Development (which, following the
2012 general election and subsequent restructuring, replaced the Mongolian National Development
and Innovation Committee) is tasked with developing economic development priorities. The Ministry
of Environment and Green Development, a “core” ministry that reports directly to the prime minister
and is responsible for the country meeting environmental standards, has also recently been assessing
the opportunity for “green development”, including developing draft targets for growing the share of
other (non-mining) industrial sectors, agriculture, and tourism in Mongolia’s economy (MEGD 2013a).
Furthermore, plans to rapidly increase exports of coal depend on continued high Asian demand for
coal, especially from China, and on Mongolia being able to compete in those markets. While high
demand for coal seems relatively certain in the near term, in addition to risks from typical cyclical
price variations, other risks to the long-term coal outlook for Mongolia may present themselves, such
as the prospect of competition from low-cost coal from other areas (such as from the USA or
Indonesia) (Minchener 2013). Furthermore, if major world economies were to move decisively
-
20
40
60
80
100
120
140
2010 2015 2020 2025 2030 2035
Energydemand
(PJ)
Avoided (vs reference)
Wood
Electricity
HOB Heat
Heat
Gasoline
Diesel
China Elect. Imports for TT
Bitumen
Petroleum Coke
Coal Lignite
Coal Bituminous

74
towards creating a low-carbon economy, demand for coal – both thermal and metallurgical coal --
could decrease, leaving countries that depend heavily on exports of fossil fuels at greater risk for
reduced competitiveness (Vivid Economics 2009; IEA 2013). In the words of OECD Secretary Angel
Gurria,
“If policy makers cap carbon emissions, the risk of ‘unburnable assets’ could have a
significant impact on the valuation of some companies…The fact is that any new fossil
resources brought to market – conventional or unconventional – risk taking us further
away from the trajectory we need to be on, unless there is a firm CCS requirement in
place or governments are prepared to risk writing off large amounts of invested capital.
A very strong tide is what we call ‘carbon entanglement’. What does this mean?
Basically, that governments everywhere on behalf of their citizens have major stakes in
bringing fossil fuel to market and taking their share of the rents…..Carbon entanglement
will not be easily undone and the very modest progress of climate policy over the last
two decades is in part testament to that. These are some of the strongest tides that we
have to confront.”
This further suggests the need for Mongolia to diversify its economy going forward, which could have
implications for domestic energy demand (and associated greenhouse gas emissions).
The shifts in energy export scenario maintains coal mining to meet domestic needs, but substitutes
export of renewable electricity for export of coal while maintaining overall economic activity.
Accordingly, energy demand associated with coal mining declines proportionally.
In principle, this scenario would also maintains crude oil refining to meet domestic needs, but
gradually substitutes export of renewable electricity for export of crude oil while maintaining overall
economic activity. However, because crude oil exports are expected to be just a small fraction of coal
exports, they are not included in the calculations for this scenario.
8.6 Discussion and possible initiatives
In the reference scenario, demand for energy in Mongolia’s industrial sector increases more than in
any other sector, overtaking buildings as the country’s most significant energy user within the next
few years, and continuing a steady increase through this study’s time period. Energy demand from
the mining sector – especially for copper and gold – is particularly significant, and is driven by energy
use for loaders, excavators, shovels, grinders, crushers, and fans (for ventilation), even though some
stakeholders have indicated that new mining operations are installing the newest, most energy-
efficient equipment. Other major sources of energy demand in industry include in cement kilns (for
producing clinker) and various pumps, drives, and motors used in a variety of secondary
manufacturing facilities.
75
Though Mongolia’s industry sector uses energy in a wide variety of end-use technologies, the
concentration of energy demand in a few key sectors and technologies may present opportunities for
policy influence. For example, the Mongolian government could perhaps:
Implement energy standards on particular pieces of widely-used technologies, such as the
different types of mining equipment listed above, cement kilns, and industrial motors. These
could be developed by the Ministry of Energy and the Ministry of Industry and Agriculture
(heavy industry policy implementation Department) and also Ministry of Environment and
Green Development.
Implement energy or emissions performance standards that could encompass all energy use
or emissions associated with production of particularly energy-intensive and homogenous
products. For example, the government could require production of copper concentrate to
release less than a particular quantity of CO2 emissions (including indirect emissions
associated with electricity use) per ton of copper concentrate. A possible alternative, or
supplemental, approach could be to create a tradable CO2-intensity standard where industrial
facilities that did not meet the standard could purchase credits from other facilities that
exceeded it. This unique approach has been developed and applied for numerous industrial
sectors in India, where it is called the “Perform, Achieve, Trade” system. The Ministry of
Environment and Green Development could take the lead in emissions performance standards.
9 Agriculture
9.1 Sector overview
Mongolia’s agricultural output has been and is still driven strongly by livestock production, with about
three-quarters of output (on an economic basis) being from livestock, the remainder from crops.29
Traditionally, livestock production has required relatively limited amounts of commercial energy (oil
products, coal, and electricity), although in recent years herders have adopted greater use of
gasoline-powered vehicles, including motorcycles, for herding of animals, and a program of providing
solar PV power for herding households has been very successful.
29 A relatively small amount of output is also derived from the forestry sector, and corresponding energy use is included
here under agriculture. Mongolia’s forest resources are mostly in the north of the country, estimated at 15.2 million
hectares (Statistical Yearbook, 2011), with wood stocks of 1.2 billion cubic meters
76
9.2 Reference scenario
In the reference scenario, it is assumed that the area cropped in Mongolia, which has been relatively
small in the past (as livestock production has dominated the sector) increases rapidly over time,
increasing 5-fold by 2035. This assumption is consistent in direction with the Mongolia Development
Institute data indicating increased hectares of cereals (wheat and potatoes) and other field crops.
Relatedly, there is a trend in Mongolia to expand production of fodder in order to stabilize food for
livestock from year to year, and reduce the need to cull herds (as well as livestock deaths) in years
when natural pasture productivity is inadequate. There will also be a trend toward increased
concentration/intensification of livestock production for milk and meat production. This will result in
more used of electricity, for example, for dairy, pig, and poultry farms, whereas traditional livestock-
raising emphasizes production of goats and sheep. The use of diesel is for general farm machinery, as
well as in “pud-pud” diesel tractors, which are used to generate power for on-farm use as well as for
field use. Used as generators, these devices are not particularly efficient at producing electricity. It is
assumed that current intensities of fuel use per unit of area cropped will continue to hold through the
end of the modelling period, as improvements in device efficiency are balanced by more use of
mechanized equipment.
In the forestry subsector, the future growth rate of commercial wood harvests is assumed to be 3%/yr
through 2020 (roughly consistent with recent experience), declining to 2%/yr by 2030.
Figure 9-1 and Figure 9-2 show reference case energy demand by fuel and by subsector, respectively.
Fuel use is dominated by gasoline use for motorcycle herding, though it must be emphasized that the
estimate of this use of fuels is a rough approximation.

77
Figure 9-1. Energy demand by subsector in the agriculture sector, reference scenario
Figure 9-2. Energy demand by fuel type in the agriculture sector, reference scenario
-
5
10
15
20
25
2010 2015 2020 2025 2030 2035
Energy Demand(PJ)
All
Forestry
Livestock
Crops
-
2
4
6
8
10
12
14
16
18
20
2010 2015 2020 2025 2030 2035
Energy Demand(PJ)
Heat and HOB Heat
Electricity
Diesel
Gasoline
Coal

78
9.3 Expanded green energy scenario
The expanded green energy scenario sees improvements in the energy efficiency of electric pumps
and other electrical devices of 28% by 2035, similar to those modelled for the industrial sector.30
These improvements lead to a modest reduction in overall energy use in the agriculture sector of 2.5
percent by 2035. (Given this small reduction, no graphs are presented here.)
9.4 Discussion and possible initiatives
Agriculture has traditionally been a mainstay of the Mongolian economy and cultural identity, and will
continue to be, even as other economic sectors, most notably mining, grow rapidly. Though the
sector is not a major energy user (consuming about 5% of the country’s energy), it may grow more
energy-intensive over time if agricultural practices become more centralized and mechanized.
Expanding agriculture may also be a strategy to maintain diversity in Mongolia’s economy, bringing
another source of growth alongside the mining industry, though accessing regional or global markets
may be more difficult than for mineral commodities. (For other considerations on if and how
agriculture may contribute to green growth, see Box 9-1.)
Efforts to develop policy initiatives to reduce agricultural energy use in Mongolia would require more
detailed data, suggesting that collection of data on energy use, and on trends affecting energy use, in
the agricultural sector, would be particularly helpful,31 as may be surveys of livestock production
practices (including on trends toward centralized production facilities) or renewable energy pilots
(including for biogas from animal wastes as well on application of solar PV or wind systems, possibly
with energy storage, for remote farming applications).
30 Additional reductions in agricultural sector GHG emissions could be possible through diesel engine efficiency
improvements, and if methane capture was implemented at more mechanized and centralized livestock facilities. Given
lack of detailed data, these options were not modeled at this time. 31 Collection and analysis of this type of information could be the focus, for example, of one or a pair of coupled doctoral
theses, or of a sponsored research program, possibly in conjunction with a program to follow-up recent efforts to
encourage herder families who move from pasture to pasture to adopt solar photovoltaic power systems.

79
Box 9-1: Local Agriculture as Green Growth?
Mongolia currently imports about 200,000 tonnes of food annually, about two-thirds of which is flour,
sugar, and fruit (National Statistical Office of Mongolia 2012). If feasible, producing more of these
commodities locally could contribute to economic growth. Whether increasing agriculture would
contribute to green growth is a matter of perspective. Field and tree crops such as these do not
generally require significant energy or cause significant GHG emissions per ton of product, at least
compared to energy-intensive commodities such as steel or petroleum products. At the same time,
these crops are also are relatively low value, and so GHG intensity per dollar may not be substantially
different than for the economy as a whole (Hertwich and Peters 2010). Supposing that half of these
crops could be grown locally, and assuming an average price of 0.50 USD per kg, growing more of
these crops could potentially add USD 50 million annually to Mongolia’s economy. The global GHG
impact would depend, however, on whether Mongolia could grow these crops with more or fewer
carbon-intensive energy sources than the countries from which Mongolia currently imports food, as
well as the relative energy associated with transporting the food to markets in Mongolia. Growing
and bringing to markets agricultural products in Mongolia in ways that reduce energy use in
greenhouse gas emissions relative to food imports may be difficult for some crops, such as fruit, that
depend on warmer climates.
Another strategy to increase local agriculture could be to increase production of existing agricultural
products that are not imported at high rates (and in some cases may be exported), such as mutton,
goat, beef, milk, wool, and cashmere. Meat from ruminant animals such as sheep, goats, and cattle,
however, are among the highest-GHG (per kg) foods (Weber and Matthews 2008), and compared to
other economic sectors are also among the highest products in terms of GHGs per dollar of value
(Hertwich and Peters 2010), due in large part to the high releases of methane (CH4) from these
animals. That said, producing more of these commodities in Mongolia for export could conceivably
reduce global GHG emissions if they could be produced with fewer GHG emissions than in alternative
locations of production.
80
PART III. OVERALL RESULTS, CONCLUSIONS, AND NEXT STEPS
10 Overall Scenario Results
The project team has developed and evaluated three major scenarios for the evolution of the energy
sector in Mongolia. The reference scenario represents “business as usual” for Mongolia, in terms of
both growth in driving activities—such as population, GDP growth, and output of industrial
products—and in terms of trends in energy intensities—the amount of energy used to heat a home,
produce a tonne of cement, or move a passenger a kilometer. The reference case also continues to
rely primarily on coal-fired systems to supply power and heat for the energy users of Mongolia. The
recent plans scenario uses the same driving activities as the reference case, but includes building
energy efficiency and lighting energy efficiency in the buildings (household and
commercial/institutional) sector, and implements new, large hydroelectric facilities to diversify the
resources use for power production. The expanded green energy scenario incorporates a collection
of energy efficiency measures throughout the economy, together with the aggressive implementation
of electricity generation from renewable resources, and some earlier retirement of older coal-fired
facilities. A special case of the expanded green energy scenario, the shift in energy exports case,
replaces exports of coal with exports of electricity from renewable resources.
Table 10-1 presents overall scenario results for the first three scenarios in terms of electricity
generation, overall energy demand, and GHG emissions.
Table 10-1. Electricity generation, energy demand, and GHG emissions in three scenarios
Variable and Scenario 2010 2015 2020 2025 2030 2035
Electricity generation, GWh
Reference scenario 4,591 6,865 14,006 15,953 18,084 20,283
Recent plans scenario 4,591 6,857 13,961 15,757 17,745 19,571
Expanded green energy scenario 4,591 6,747 13,027 13,431 13,927 14,508
Overall energy demand, TJ
Reference scenario 133 189 248 298 356 419
Recent plans scenario 133 188 243 288 339 393
Expanded green energy scenario 133 186 223 244 265 285
Greenhouse gas emissions, M t CO2e
Reference scenario 16 20 37 43 49 56
Recent plans scenario 16 20 35 38 43 49
Expanded green energy scenario 16 20 27 28 27 28
Below we summarize additional results of the first three scenarios with regard to electricity
generation, energy demand, and GHG emissions.
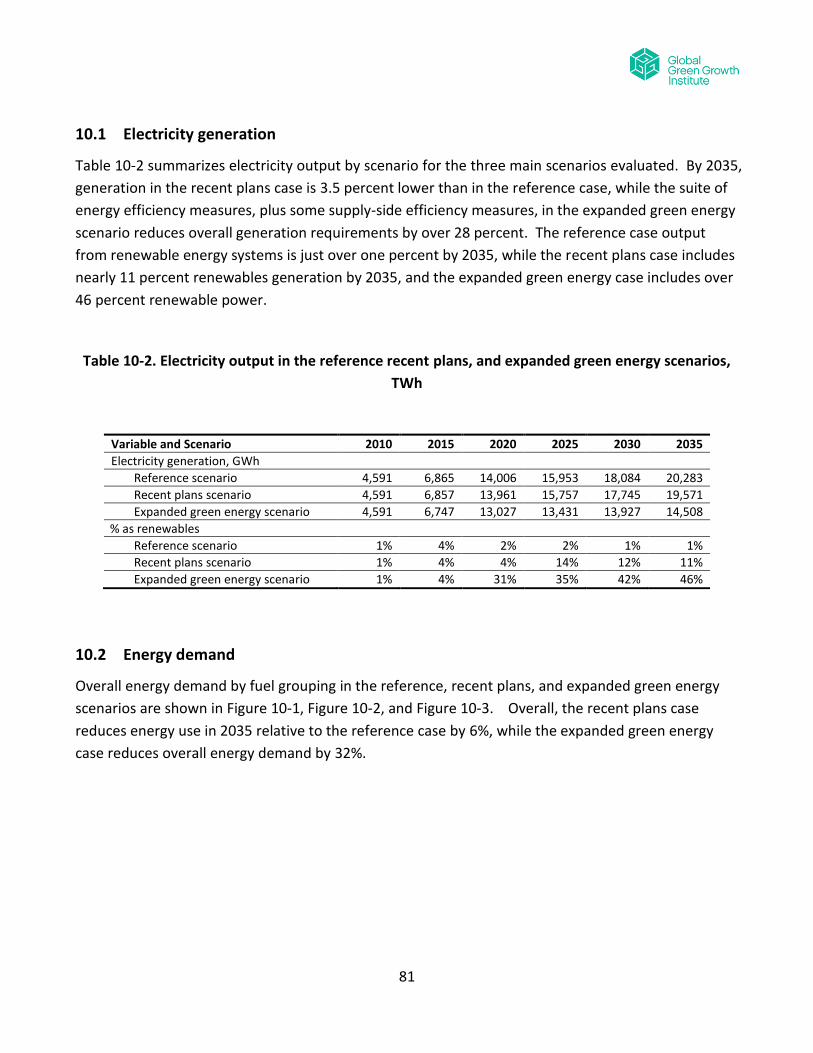
81
10.1 Electricity generation
Table 10-2 summarizes electricity output by scenario for the three main scenarios evaluated. By 2035,
generation in the recent plans case is 3.5 percent lower than in the reference case, while the suite of
energy efficiency measures, plus some supply-side efficiency measures, in the expanded green energy
scenario reduces overall generation requirements by over 28 percent. The reference case output
from renewable energy systems is just over one percent by 2035, while the recent plans case includes
nearly 11 percent renewables generation by 2035, and the expanded green energy case includes over
46 percent renewable power.
Table 10-2. Electricity output in the reference recent plans, and expanded green energy scenarios,
TWh
Variable and Scenario 2010 2015 2020 2025 2030 2035
Electricity generation, GWh
Reference scenario 4,591 6,865 14,006 15,953 18,084 20,283
Recent plans scenario 4,591 6,857 13,961 15,757 17,745 19,571
Expanded green energy scenario 4,591 6,747 13,027 13,431 13,927 14,508
% as renewables
Reference scenario 1% 4% 2% 2% 1% 1%
Recent plans scenario 1% 4% 4% 14% 12% 11%
Expanded green energy scenario 1% 4% 31% 35% 42% 46%
10.2 Energy demand
Overall energy demand by fuel grouping in the reference, recent plans, and expanded green energy
scenarios are shown in Figure 10-1, Figure 10-2, and Figure 10-3. Overall, the recent plans case
reduces energy use in 2035 relative to the reference case by 6%, while the expanded green energy
case reduces overall energy demand by 32%.

82
Figure 10-1. Overall energy demand by fuel group, reference scenario
Figure 10-2. Overall energy demand by fuel group, recent plans scenario
-
50
100
150
200
250
300
350
400
450
2010 2015 2020 2025 2030 2035
Energy Demand(PJ)
Biomass
Heat
Electricity
Natural Gas
Oil
Coal
-
50
100
150
200
250
300
350
400
450
2010 2015 2020 2025 2030 2035
Energy Demand(PJ)
Avoided (vs. reference)
Biomass
Heat
Electricity
Natural Gas
Oil
Coal

83
Figure 10-3. Overall energy demand by fuel group, expanded green energy scenario
Figure 10-4, Figure 10-5, and Figure 10-6 each focus on electricity demand in one of the three major
scenarios (not counting the shift in energy export scenario). Here, the combination of measures in
the recent plans case reduce 2035 electricity demand by 3.5% relative to the reference case, while the
more extensive suite of options in the expanded green energy case reduce overall 2035 electricity
demand by 27%, despite the addition of some electricity demand, relative to the reference case, in
the buildings (for ground-source heat pumps) and transportation sector.
-
50
100
150
200
250
300
350
400
450
2010 2015 2020 2025 2030 2035
Energy Demand(PJ)
Avoided (vs. reference)
Biomass
Heat
Electricity
Natural Gas
Oil
Coal

84
Figure 10-4. Electricity demand by sector, reference scenario
Figure 10-5. Electricity demand by sector, recent plans scenario
-
2,000
4,000
6,000
8,000
10,000
12,000
14,000
16,000
18,000
20,000
2010 2015 2020 2025 2030 2035
Electricity Demand(GWh)
Agriculture
Industry - construction
Industry - manufacturing
Industry - mining & quarrying
Transport
Buildings - household
Buildings - commercial and other
-
2,000
4,000
6,000
8,000
10,000
12,000
14,000
16,000
18,000
20,000
2010 2015 2020 2025 2030 2035
Electricity Demand(GWh)
Avoided (vs. reference)
Agriculture
Industry - construction
Industry - manufacturing
Industry - mining & quarrying
Transport
Buildings - household
Buildings - commercial and other

85
Figure 10-6. Electricity demand by sector, expanded green energy scenario
10.3 Greenhouse gas emissions
Figure 10-7 and Figure 10-8 show reference case GHG emissions, respectively, by sector and by fuel.
(In these charts, GHG emissions are shown on a “territorial” or “production” basis, or the emissions
that would be released within Mongolia.) Electricity generation (including combined heat and power)
produces the largest share of GHGs throughout the modeling period, with emissions from coal
comprising over three quarters of Mongolian GHG emissions until 2035. Overall GHG emissions rise
to about 56 million tonnes of carbon dioxide equivalent by 2035. Figure 10-9 and Figure 10-10 show
results for the recent plans scenario. Overall GHG emissions in the recent plans scenario are 49
MTCO2e by 2035. As shown in Figure 10-11 and Figure 10-12, expanded green energy scenario
emissions by sector and fuel are half of reference case emissions by 2035, with the most significant
reductions being in the electricity generation sector (whether due to energy efficiency or renewable
energy), but with reductions throughout the economy. Measures with at least 2 million tonnes of
GHG abatement potential are (from higher to lower potential): energy efficiency improvement in the
mining sector, energy efficiency in other industrial sectors, wind power, hydropower, appliance
efficiency, and transport mode shift to rail. The high potential for these first five measures is not
surprising, given the rapid growth in the mining and other industrial sectors, the dominance of GHG
emissions from power supply, and the growth in appliance and electronics usage in urban areas
(especially UB). The high GHG abatement potential from mode shift in the transport sector is
surprising and interesting, however, and derives in large part from the assumption that transport
demand will grow rapidly in Mongolia (about 5% per year) and that most of that new demand will be
in road transport. If transport activity does not grow that fast, overall energy use, GHG emissions, and
emissions abatement potential may be less in the transport sector than indicated here. (For a more
-
2,000
4,000
6,000
8,000
10,000
12,000
14,000
16,000
18,000
20,000
2010 2015 2020 2025 2030 2035
Electricity Demand(GWh)
Avoided (vs. reference)
Agriculture
Industry - construction
Industry - manufacturing
Industry - mining & quarrying
Transport
Buildings - household
Buildings - commercial and other
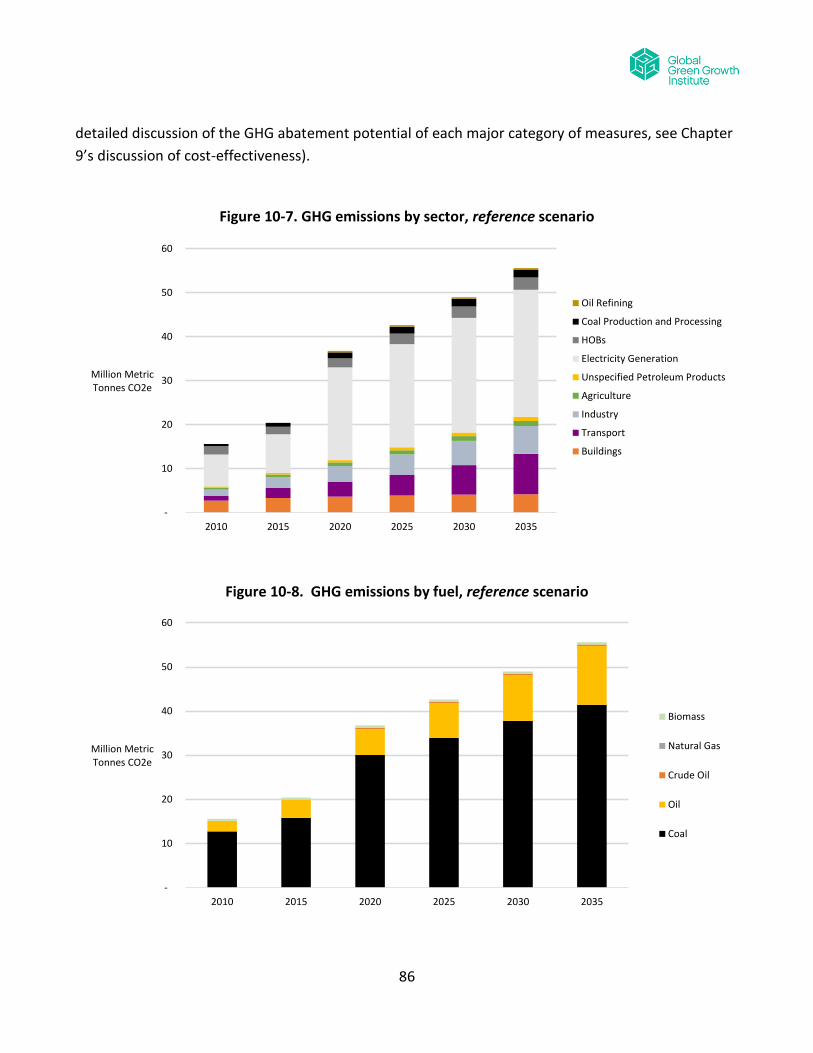
86
detailed discussion of the GHG abatement potential of each major category of measures, see Chapter
9’s discussion of cost-effectiveness).
Figure 10-7. GHG emissions by sector, reference scenario
Figure 10-8. GHG emissions by fuel, reference scenario
-
10
20
30
40
50
60
2010 2015 2020 2025 2030 2035
Million Metric Tonnes CO2e
Oil Refining
Coal Production and Processing
HOBs
Electricity Generation
Unspecified Petroleum Products
Agriculture
Industry
Transport
Buildings
-
10
20
30
40
50
60
2010 2015 2020 2025 2030 2035
Million MetricTonnes CO2e
Biomass
Natural Gas
Crude Oil
Oil
Coal

87
Figure 10-9. GHG emissions by sector, recent plans scenario
Figure 10-10. GHG emissions by fuel, recent plans scenario
-
10
20
30
40
50
60
2010 2015 2020 2025 2030 2035
Million MetricTonnes CO2e
Avoided (vs. reference)
Oil Refining
Coal Production and Processing
HOBs
Electricity Generation
Unspecified Petroleum Products
Agriculture
Industry
Transport
Buildings
-
10
20
30
40
50
60
2010 2015 2020 2025 2030 2035
Million MetricTonnes CO2e
Avoided (vs. reference)
Biomass
Natural Gas
Crude Oil
Oil
Coal

88
Figure 10-11. GHG emissions by sector, expanded green energy scenario
Figure 10-12. GHG emissions by fuel, expanded green energy scenario
As discussed in Chapter 2, another way to account for GHG emissions is to count the eventual CO2
emissions that result from a fossil fuel extracted in a country, such as coal in Mongolia, regardless of
where it is combusted. To explore the implications of this study’s results on Mongolia’s extraction-
based emissions, Figure 10-13 compares the extraction-based emissions for the reference and shift in
-
10
20
30
40
50
60
2010 2015 2020 2025 2030 2035
Million MetricTonnes CO2e
Avoided (vs. reference)
Oil Refining
Coal Production and Processing
HOBs
Electricity Generation
Unspecified Petroleum Product
Agriculture
Industry
Transport
Buildings
-
10
20
30
40
50
60
2010 2015 2020 2025 2030 2035
Million MetricTonnes CO2e
Avoided (vs. reference)
Biomass
Natural Gas
Crude Oil
Oil
Coal
89
energy exports scenarios. Here, year 2035 extraction-based emissions in the reference case are
nearly four times higher than the territorial emissions calculated as in Figure 10-7 and Figure 10-8,
suggesting that Mongolia’s contribution to global greenhouse gas emissions, viewed from the
perspective of fuel extraction, is significantly greater than its in-country emissions may suggest. The
shift in energy exports scenario reduces Mongolia’s extraction-based emissions to less than 20
MTCO2e by 2035, equivalent to the in-country emissions from burning coal (as in the expanded green
energy scenario), and yielding a reduction in extraction-based GHG emissions of 180 MtCO2. Whether
global GHG emissions would ultimately be reduced by a similar amount would depend on whether the
consumers of these fuels (e.g., power or steel plants in China) ultimately substituted for coal imported
from Mongolia with other sources of coal. At the same time, CO2 benefits could also result if the
electricity exported by Mongolia under the shift in energy exports scenario were to displace
additional coal-fired power generation outside Mongolia (other than that which would have used
Mongolian coal), though those possible benefits have not been quantified here. Regardless, this
analysis indicates Mongolia’s most significant contribution to global greenhouse gas emissions may be
in the coal it may export, and that shifting from exporting coal to exporting renewable electricity
could perhaps be its most significant contribution to a low-carbon, green economy.
Assessing GHG emissions from an extraction-based perspective can also help assess alternative
development for “low-carbon competitiveness” (Vivid Economics 2009) and carbon “entanglement”
(Gurría 2013), as described earlier in this report and explored further in Appendix B. For example,
should China or other coal consumers place limits or taxes on CO2 emissions or coal consumption (as
China is already planning to do), demand for Mongolia’s coal could decline. Counting the emissions
associated with coal from such an extraction-based perspective is one step towards quantifying this
risk.

90
Figure 10-13. Extraction-based emissions under the shift in energy exports scenario, relative to the
reference scenario
10.4 Other pollutant emissions
One of the most important problems facing policymakers in Mongolia, particularly those in the
Ministries of Energy and of Environment and Green Development, is local air pollution, particularly air
pollution in Mongolia’s cities during the heating season. Reducing episodes of heating season “smoke”
(a combination of particulate matter, sulfur oxides and nitrogen oxides) from coal-fired combined
heat and power plants, but also from coal-fired district heating plants and on-site boilers and, crucially,
fuels—including coal, biomass, and wastes such as used tires--burned to provide heat in urban and
per-urban households, is a key concern. Emissions of, and impacts of, air pollutants such as these is
an especially local concern that is best treated with localized assessments and models that take into
account specific locations and control technologies rather than national analyses such as that
conducted here. At the same time, we can use results of this study to estimate directional impacts on
key air pollutants, such as for sulfur oxide and nitrogen oxide (SOx and NOx) emissions nationwide.
Figure 10-14 and Figure 10-15 show the estimated sulfur oxides (as SO2) and nitrogen oxides
emissions over time in the reference, recent plans, and green energy scenarios.
-
50
100
150
200
250
2010 2015 2020 2025 2030 2035
CO2
emissions(Mt CO2e)
Avoided (vs reference)
Shifts in energy export scenario

91
Figure 10-14. Sulfur Oxide Emissions under Three Scenarios
Figure 10-15. Nitrogen Oxide Emissions under Three Scenarios
-
50
100
150
200
250
300
350
400
2010 2015 2020 2025 2030 2035
Thousand Tonnes SOx
Reference Recent plans Expanded green energy
-
50
100
150
200
250
300
2010 2015 2020 2025 2030 2035
Thousand Tonnes NOx
Reference Recent Plans Expanded Green Energy

92
The recent plans case offers modest reductions in both types of emissions, while the expanded green
energy scenario reduces emissions of both by over 50 percent in 2035, relative to the reference case.
Although particulate matter (smoke) emissions cannot be directly estimated here32, these emissions
would be reduced at least proportionately with NOx and SOx emissions by the green energy scenario,
and possibly more, depending on how, for example, the specific modifications to coal-fired power
plants and HOB are implemented, and to the emissions characteristics of ger heating stoves displaced
or upgraded.
It should be emphasized that although the inventory of current and estimate of future emissions of
local and regional air pollutants such as Sox, NOx, and particulate matter are a first step in developing
plans for mitigation of the impacts of those emissions, it is only a first step. The estimation of human
health and other environmental impacts (other than climate change) associated with these emissions
requires, sequentially, the geographic specification of emission source locations, the modeling of
atmospheric transport , ambient concentrations, and deposition of pollutants, and the assessment of
impacts on humans, animals, and plants. These steps are beyond the scope of the current project,
but could be the focus of future modeling work, as suggested in the presentation of potential follow-
on activities described in Chapter 9 of this Report.
10.5 Cost-effectiveness analysis
Transitioning Mongolia to a low-carbon economy brings a number of costs and benefits. Estimating
all costs and benefits all would be an enormous undertaking, depend on a number of unknown factors
(such as rate of reduction in costs in key efficiency and renewable energy technologies), and be
subject to large uncertainties. At the same time, estimating the cost effectiveness of options at
meeting key goals – such as greenhouse gas reduction – can help planners understand differences in
costs, and where measures that save costs (e.g. energy efficiency) may be able to help offset costs of
other, higher cost measures that are desirable because they bring extra benefits they may bring, or
because they too are needed to meet goals on renewable energy deployment or GHG emission
reduction. This section estimates the cost-effectiveness of the measures assessed in this study
according to the cost per ton of GHGs avoided or reduced, as is common in scenario analyses of low-
emissions development strategies (Winkler 2007; Halsnaen et al. 1999; Johnson et al. 2010). This
method assesses the incremental capital and operating and maintenance costs of key technologies
(such as renewable electricity or energy efficiency retrofits) as well as the savings from avoided fuel
usage. It does not include taxes or subsidies, financing costs (e.g., interest), or administrative costs.
32 Preparing estimates of particulate emissions require Mongolia-specific emission factors for major sources of these
pollutants, both on the energy demand (for example, ger stoves burning biomass and waste fuels) and energy supply
(power and heat) sides. Although a comprehensive set of particulate emission factors was not available for this project, it
could be developed and applied to the LEAP model described here;
93
All costs after 2010 are discounted using a 5 percent real annual discount rate. Costs are included for
all measures except those related to reduction in vehicle travel (through urban planning) or shifting
from one transport mode (typically car, truck, or airplane) to another (typically bus or train), due to
the complexity in estimating costs of building new transport infrastructure and avoiding others (e.g.
specific vehicles.)33 Estimating future costs of technologies and fuels is difficult over even a fairly
short time frame, as costs will vary based on global energy markets, economic growth in Mongolia
and elsewhere, and technology learning. Accordingly, all estimates of these costs are subject to
significant uncertainty.
Figure 10-16 presents a greenhouse gas abatement “cost curve” of results for all of the measures,
comparing overall estimated annualized costs (that is, with capital costs amortized for presentation
on an annual basis) with emissions savings that could be realized in the year 2035 relative to the
reference scenario. Cost curves have become common tools in GHG abatement analyses (as they
have been in energy savings assessments for decades previously) to help assess how savings might be
achievable for how much cost.
Many of the measures and options show negative costs of reduced GHG emissions, meaning that the
overall direct benefits of the options exceed the costs. For example, though upgrading industrial
boilers has a cost, it can lead to considerable savings in energy (coal) costs over time. As indicated in
Figure 10-16, about half of the 28 MtCO2e GHG abatement potential in this study is available at
negative costs, suggesting significant potential savings to Mongolia’s economy for energy efficiency.
33 As a result, these options are included in the cost curve at zero cost.

94
Figure 10-16. “Cost Curve” showing GHG savings and cost per tonne of CO2e reduced in 2035
The estimation of costs also enables an estimate of the incremental costs associated with entire
scenarios (compared to the reference case), including the types of capital and operations and
maintenance costs discussed above. The total net present value (NPV) of the expanded green energy
scenario compared to the reference scenario through 2035 is a benefit of USD 380 million. This is
comprised of significant investments in demand-side efficiency (roughly 2.5 billion USD) such as for
building envelope improvements, relatively modest net incremental investments in electric
generation (170 million USD) such as the extra costs of hydroelectric power plants compared to coal-
fired power plants, and significant fuel savings (roughly 3 billion USD), as specified in Table 10-3. Over
half of the fuel savings is from avoided oil consumption as a result of more efficient vehicles, a finding
that is driven in party by the high cost (per equivalent unit of energy) of gasoline and diesel relative to
coal in Mongolia.
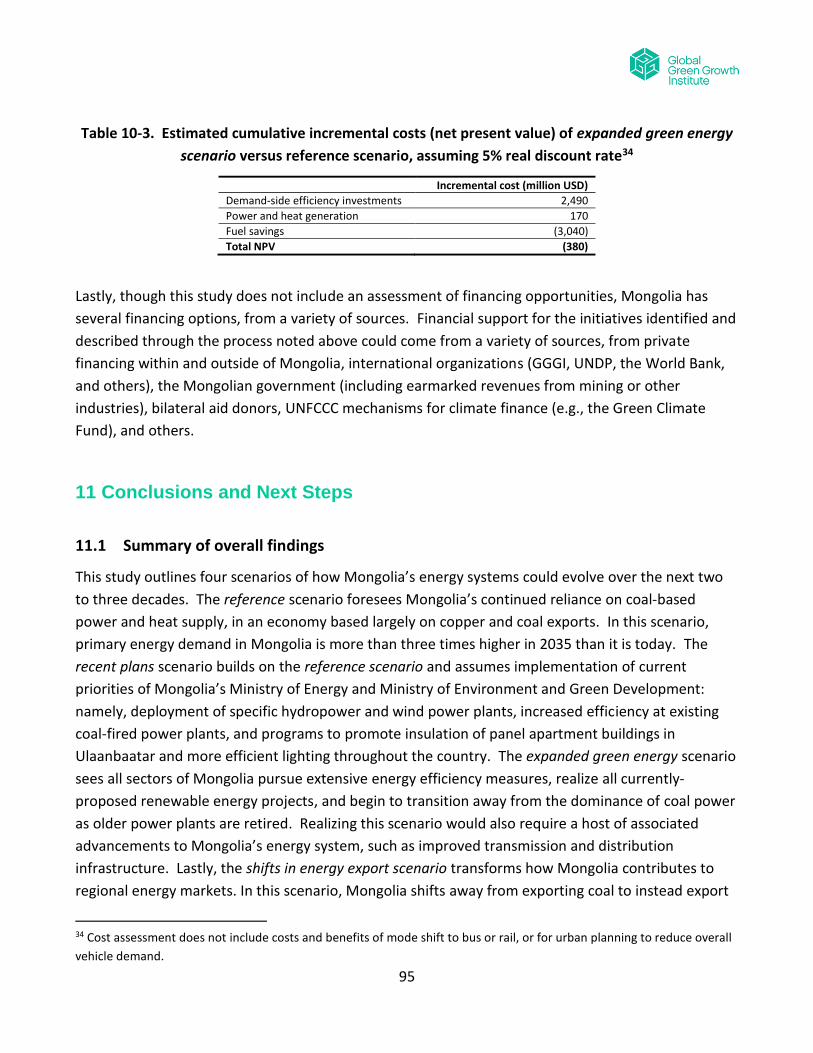
95
Table 10-3. Estimated cumulative incremental costs (net present value) of expanded green energy
scenario versus reference scenario, assuming 5% real discount rate34
Incremental cost (million USD)
Demand-side efficiency investments 2,490
Power and heat generation 170
Fuel savings (3,040)
Total NPV (380)
Lastly, though this study does not include an assessment of financing opportunities, Mongolia has
several financing options, from a variety of sources. Financial support for the initiatives identified and
described through the process noted above could come from a variety of sources, from private
financing within and outside of Mongolia, international organizations (GGGI, UNDP, the World Bank,
and others), the Mongolian government (including earmarked revenues from mining or other
industries), bilateral aid donors, UNFCCC mechanisms for climate finance (e.g., the Green Climate
Fund), and others.
11 Conclusions and Next Steps
11.1 Summary of overall findings
This study outlines four scenarios of how Mongolia’s energy systems could evolve over the next two
to three decades. The reference scenario foresees Mongolia’s continued reliance on coal-based
power and heat supply, in an economy based largely on copper and coal exports. In this scenario,
primary energy demand in Mongolia is more than three times higher in 2035 than it is today. The
recent plans scenario builds on the reference scenario and assumes implementation of current
priorities of Mongolia’s Ministry of Energy and Ministry of Environment and Green Development:
namely, deployment of specific hydropower and wind power plants, increased efficiency at existing
coal-fired power plants, and programs to promote insulation of panel apartment buildings in
Ulaanbaatar and more efficient lighting throughout the country. The expanded green energy scenario
sees all sectors of Mongolia pursue extensive energy efficiency measures, realize all currently-
proposed renewable energy projects, and begin to transition away from the dominance of coal power
as older power plants are retired. Realizing this scenario would also require a host of associated
advancements to Mongolia’s energy system, such as improved transmission and distribution
infrastructure. Lastly, the shifts in energy export scenario transforms how Mongolia contributes to
regional energy markets. In this scenario, Mongolia shifts away from exporting coal to instead export
34 Cost assessment does not include costs and benefits of mode shift to bus or rail, or for urban planning to reduce overall
vehicle demand.

96
renewable electricity, with potential economic benefits for the country (“green growth”), and global
benefits for greenhouse gas emissions and climate. This transformative scenario, which would
require significant international partnerships and financing, is motivated (in part) by the possibility
that global coal demand could decline if the world’s major economies implement policies to confront
climate change and limit warming to two degrees C over pre-industrial levels.
The results of the expanded green energy scenario suggests that energy efficiency initiatives can slow
the growth in Mongolia’s energy demand by 10% below reference levels in 2020 and by more than 30%
below reference levels in 2035.. Along with increasing penetration of renewable electricity (and heat),
the measures included in the expanded green energy scenario could halve GHG emissions by 2035,
from 56 million tonnes CO2e in the reference case to 28 million tonnes CO2e. Mongolia also has the
potential to contribute even more strongly to global climate change mitigation by exporting
renewable electricity and phasing down exports of coal, the fuel that is most carbon-intensive and
contributes most to global climate change. Doing so could also provide economic benefits to
Mongolia, including reduced exposure to climate and other policies that reduce global, in addition to
Chinese, coal demand and make Mongolia a shining example of “green growth”.
At the same time, neither these scenarios nor this report should be read as an endorsement of any
particular energy or emissions pathway. While this analysis shows what might be possible with
assertive efforts by Mongolia’s government and most other economic actors in the country, other
pathways are also possible, and may bring similar social, economic, and political benefits.
Furthermore, none of the scenarios (even the reference scenario) should be interpreted as a
definitive forecast. Mongolia’s economy is developing rapidly, and the mining, construction, and
other sectors, and their associated energy use, could evolve much differently than assumed here.
Any ambitious effort to greatly expand renewable energy and energy efficiency in Mongolia will
require political leadership and partnerships with the international community, as well as concerted
effort to address a host of factors, from financial to technical to administrative, that have limited
uptake of renewable energy and energy efficiency to date. To those ends, below we discuss some
potential policy initiatives that Mongolia could pursue, as well as an initial list of possible projects and
research efforts that could begin the transition to a low-carbon economy in Mongolia, and that could
attract international support.
Indeed, international financial support will likely be critical, especially given Mongolia’s relatively
modest level of development. For example, the “Green Climate Fund” of the United Nations
Framework Convention on Climate Change is intended to provide funds totaling $100 billion per year
by 2020 to support GHG emission reductions in developing countries. Discussions on longer-term
financing under the UNFCCC have also begun to draw distinctions between the deep level of
emissions reductions needed in developing countries and the parties (e.g., developed countries) that

97
may finance those reductions (Metz 2013; Ngwadla 2013). This suggests that efforts to pursue deep
GHG emissions in Mongolia may benefit from significant support in the long-term.
11.2 Policies for consideration
The preceding sections have discussed possible policy initiatives to scale up energy efficiency and
renewable energy in each major sector: power and heat, buildings, industry, and agriculture. Though
a comprehensive assessment of each was beyond the scope of this report, we summarize the possible
policy initiatives here to help prompt further discussion. Each of these initiatives is associated with
measures (as in the cost curve in Chapter 8) that could reduce Mongolia’s GHG emissions by at least
one million tonnes in 2035, as well as deliver local air pollution benefits, relative to the reference case:
Strengthening the 2007 Renewable Energy Law, and developing a new Renewable Energy
Program, based on analysis such as that presented in this report
Reforming subsidies on coal, electricity, and district heat to minimize support, via tariffs or
otherwise, for inefficient consumption and high-carbon energy sources
Developing and enforcing more stringent building energy codes and appliance efficiency
standards
Expanding building retrofit programs from the existing programs focused on energy retrofits of
existing apartment buildings
Developing guidelines for urban planning and transportation planning, including combined
land use and transportation planning, as well as a national strategy for moving people and
goods more effectively and efficiently
Developing energy and/or emissions standards for widely used industrial- technologies (e.g.
those in the mining sector) or for primary industry sectors that make particularly energy-
intensive materials
Enhancing vehicle efficiency or emissions standards
In addition, the Ministry of Environment and Green Development may wish to use this analysis to help
inform or explore national goals on GHG emission reduction. For example, this analysis could help
inform national targets on GHG emission reduction or sustainable development, and strategies to
attain them. Furthermore, in addition to goals on territorial GHG-intensity (per unit of GDP) that
MEGD has considered, developing a supplemental goal based on extraction-based GHG-intensity may
help Mongolia more comprehensively track progress towards a green economy and away from
“carbon entanglement”.

98
Each of these policy initiatives could likely also benefit from further research, pilot programs, and
program development, which are discussed in the next section.
11.3 Potential “next steps” for green energy development: projects, pilots, and further
research
Below we discuss opportunities for ongoing energy planning projects, pilots, or research that
Mongolia, could undertake, building upon the results of this project. These efforts could include:
Periodic revision/updating of energy plans using the tools and training provided during the
project;
Regular data collection and updating of the LEAP model for Mongolia;
Additional surveys to collect more accurate data for planning;
Periodic use of the tools provided by the project to update emissions inventories for Mongolia;
Developing capacities for local air pollution impact modeling, potentially using the LEAP model
as one source of emissions data; and
Other potential initiatives, together with the organizational structures and training needed to
support them.
Some of these areas for future work are elaborated below.
Data gathering
By the standards of many countries, data availability for energy and environmental analysis in
Mongolia is quite good. There remain, however, a number of areas where the implementation of
periodic surveys would benefit future planning efforts, and make the analysis of energy and
environmental policy options more straightforward and accurate. These areas include:
Household energy end-use surveys, for all fuels, in each major type of housing and major
residential area in Mongolia. Such surveys, based, for example, on survey instruments
developed by the World Bank or in use in the United States (the “RECS” Residential Energy
Consumption Survey, which is undertaken every few years by the US Department of Energy),
would provide estimates of device ownership by household type, and fuel/energy use by
devices in households.
Commercial building sector surveys allowing the division of the commercial and institutional
sector by type of building and/or by type of activity (for example, hotel, restaurant, office,
hospital/health care, and education). Such surveys would indicate the fraction of total

99
building floorspace or volume in each subsector, and a series of such surveys would chart
changes in the commercial/institutional sector over time.
Commercial energy end-use surveys, for all fuels, divided each major type of building and/or
activity (as above). Such surveys, of which the United States “CBECS” Commercial Building
Energy Consumption Survey is an example, provide estimates of energy use per unit building
space or volume by building type and by fuel.
Industrial energy surveys and audits, which would provide estimates of energy intensity,
overall energy use, and available energy savings in the industrial sectors. To some extent
these surveys may be accomplished through review (with confirmation/correction where
necessary) of Ministry of Industry data, at least for major facilities, as private industries,
including mining, become more important for the Mongolian economy. Monitoring and
reporting efforts, such as those being developed and implemented at national levels through
international partnerships such as the Partnership for Market Readiness, could be of
particular relevance.
Surveys in the agriculture sector, on energy use and livestock production practices.
Ongoing testing of the efficiency and emissions performance of appliances used in Mongolia,
and especially devices, including cooking and heating stoves, that may be unique to Mongolia
and central Asia. This would include testing not only of emissions of GHGs from these devices,
but of other air pollutants
The data collection activities above should ideally be established within a comprehensive, regular (for
example, every three years), reviewed, and internally cross-checked system of collection of
information for energy, transport, and climate change action planning. This would include
regularizing extensive and methodologically-sound surveys of energy use in each of the sectors of
Mongolia’s economy, with surveys on the national level backed up by as appropriate by surveys at the
municipal and provincial levels.
Capacity building
Strengthening of capacity for energy and climate mitigation planning at the National, and, as needed,
provincial and municipal levels could be encouraged though a program of training and tools
development, ideally with customizable but common tools used throughout the country. In addition,
to ensure that skills in using such tools are maintained, a regular process of GHG inventory
preparation and mitigation action planning could be instituted, possibly, for example, in conjunction
and cooperation with the preparation of national and regional Master Plans and Power Development
Plans, and the evolving requirements for biennial update reports to National Communications under
100
the UNFCCC. The tool used for the analysis presented in this report, LEAP, could remain part of the
capacity building, as it was for the Mongolian government officials involved in this project.
Pilot programs
Pilot programs could help demonstrate technologies or practices for eventual widespread adoption.
These may include
Mongolian government buildings could launch “lead by example programs” where they were
to implement highly efficient building and lighting energy retrofits, to demonstrate the
efficacy of these approaches.
Demonstration projects on reduction of electricity use in industry through increasing the use
in existing facilities, and insisting on the purchase for new facilities, of high-efficiency electric
motors, variable speed motor controls, and electric motor-related technological
improvements, for example, in pumping, air compressors, materials handling, and process
equipment, other end-uses. Many of these measures apply to agricultural electricity use
(irrigation, crop processing, ice-making) as well. A program to do so could include restrictions
on imports of motors that do not meet efficiency standards, industrial audits, particularly in
large enterprises, to identify savings opportunities, the development of funding mechanisms
for paying the initial capital costs of implementing efficiency options, and the provision of
technical information on options to consumers large and small.
Continued pilots and demonstrations of ground source heat pumps, one of the few
technologies available in Mongolia that has the capacity to create, in the long-term, very low
carbon heating.
Pilot demonstrations of revised tariffs for district heat, for example, in specific sectors or
service areas, coupled with implementation of metering and control systems for use by heat
consumers.
Continued pilots on institutional and governance models for energy efficiency and renewable
energy, including on modes of engagement for energy providers and technology suppliers,
finance options, and public-private partnerships.
Research
Additional research would be helpful on a number of topics, including (but not limited to) the
following.
Review of heat and power options incorporating renewable electricity generation. As noted
above, the territory of Mongolia includes rich solar and wind energy resources that could be

101
tapped to yield clean energy for Mongolia and for exports. These resources, however, are by
their nature intermittent, meaning that either other, likely fossil-fueled resources, electricity
storage on a large scale, or a combination of the two would need to be employed for
renewable power generation to operate effectively in Mongolia’s energy system. Further
research is needed to understand how to address intermittency through storage and balancing
services, including the role of hydro and pumped storage hydro, in meeting peak loads.
Further research is also needed to recommend pricing reforms that can allow for on-peak and
off-peak power to be, at least for most consumers, priced at a level to allow full cost recovery.
Another key question is how to provide heat for residential and other buildings using
renewable energy. One advanced option is to use ground-source heat pumps to turn
electricity into heat at very high efficiencies.35 It may also be possible generate and then store
heat for hours, days, or even between seasons. Heat would then be released to the district
heating system (or to an individual home or building) when needed. Lastly, a simple (though
less efficient) option may be inexpensive resistance heaters in homes and businesses, or
adding resistance coils to district heating systems so that those systems can use renewable
electricity when it is available as surplus.
A potential follow-on initiative to the current project is therefore to explore future scenarios
for the integration of renewable electricity systems with urban or rural heating. For urban
systems, this would require advanced modeling of heat heeds in urban areas, including of the
timing and extent of heat requirements by different types of consumers, and by different
central heating systems (for example, those currently supplied by CHP or by heat-only boilers).
This process would build upon some of the work undertaken during the recent effort to
update the Energy Sector Master Plan, undertaking with funding from the Asian Development
Bank (ADB). It would also require a review of the cost and performance of existing and
potential technologies for electric space heating, and for electricity and/or heat storage.
Development of a pilot project is a longer-term possibility.
On a smaller scale, a similar follow-on initiative might be to explore the use of renewable
heating and heat storage systems for deployment in soum centers and villages, again, possibly,
with a pilot project to demonstrate key technologies. (To date, solar hot water systems have
been limited by a number of factors, including pollution causing grime on surfaces of collectors,
cold temperatures, and limited cost-effectiveness.) 35 Resistance heaters convert electricity into heat with an efficiency of essentially 100 per cent. Heat pumps use electric
motors and pumps to compress and expand a “working fluid” to move heat from the ambient air or water or, in the case
of ground-source (or “geothermal” heat pumps, from the earth, resulting in an overall efficiency that can be well over 100
percent. Depending on the conditions, ground-source heat pumps can produce heat from electricity at an efficiency of
300 percent (or a “coefficient of performance” ratio of heat out to electricity in, of 3.0) or more.

102
Review of heat and power options for Ulaanbaatar with consideration of impacts on local air
pollution. A special case of the exploration of heat and power options above would be to
focus on the unique situation in Ulaan Baatar (UB), and to develop a demand- and supply-side
model focusing on the provision of heat and power to the residents and businesses in the city,
with a special emphasis on exploring alternatives for reducing air pollution. Such a project
would bring together considerations of urban planning (for example, evolving housing and
transport systems to promote the use of cleaner energy source for heating) with engineering
of heat and power systems, and with the modeling of emissions and atmospheric transport of
air pollutants such as particulate matter, sulfur oxides, and nitrogen oxides. Note, however,
that detailed air pollution modeling is a technically-demanding and data intensive process,
thus it may be prudent to approach the project in phases, for example, starting with an
inventory of local air pollutant emissions (adding detail and location-specific data to the LEAP
model developed for this project), including perhaps installation of stationary emissions
monitoring devices, then exploring detailed future scenarios for UB while at the same time
developing or expanding capabilities for atmospheric modeling of air pollution in the UB
“airshed”.
Continued research on residential and commercial energy efficiency financing and
implementation structures, in partnership with the existing local and international institutions
working on this topic, including information on building owner and tenant attitudes, barriers,
and decision-making processes regarding energy efficiency upgrades.
Research on possible legal and market instruments for reducing GHG emissions in Mongolia.
Other countries, including developing countries, have been exploring and implementing
various forms of emissions limits, trading, and pricing systems, including coal caps and
emissions trading systems (ETS) in China and intensity-based trading in industrial sectors in
India. Research could explore possible application of similar mechanisms in Mongolia.
Advanced exploration of green energy exports scenarios. As noted above, to bring to fruition
a future in which Mongolia, whether through government-owned plants or from plants owned
and operated by the private sector—exports power generated from renewable energy to
China, and perhaps to Korea and/or Japan, will require intensive work on a number of issues,
ranging from the technical to the economic to the political. An initiative to follow on the initial
work on the green energy export scenario explored during the current project could include
more fully evaluating the costs and potential economic benefits to Mongolia as a whole, and
to various actors in Mongolia, of different scenarios for exporting electricity generated from
Mongolia’s solar and wind resources, necessarily combined with a review of the technical
requirements for such exports. In parallel, explorations, probably as a part of an existing or
new regional international group, would need to be carried out to further develop some of the

103
international technical and financial options for (and challenges involved in) selling power to
countries in the region, including developing infrastructure for exporting across borders,
pricing for renewable electricity, technical and environmental standards for transmission lines,
and other issues, perhaps drawing on experiences from other international power sharing
arrangements, whether in Asia (e.g., Southern Mekong) or from other continents (e.g., UCTE in
Western and Central Europe, NORD-POOL in Scandinavia) . Coordination with existing multi-
national programs and/or institutions in which Mongolian government agencies are involved,
such as the Greater Tumen Initiative organized by UNDP, will likely be desirable.
Exploration of the effect of exports of Mongolian coal to regional markets. This study has
introduced the concept of extraction-based emissions accounting to describe the emissions
associated with fossil fuel extracted in Mongolia, much of which is exported. Further research
could explore the effect of shifting exports away from coal on broader fossil fuel markets in
the region (especially in China), and the extent to which such a shift may contribute to global
GHG emission reductions on one hand, or emissions leakage (e.g., if coal consumers in China
find other sources) on the other hand.

104
12 References Cited
ADB, 2008. Energy Conservation and Emissions Reduction from Poor Household.
Alvarez, R. A., Pacala, S. W., Winebrake, J. J., Chameides, W. L. and Hamburg, S. P., 2012. ‘Greater
focus needed on methane leakage from natural gas infrastructure’. Proceedings of the National
Academy of Sciences, 109(17). 6435–40. doi:10.1073/pnas.1202407109.
Arc Finance, 2012. ‘Xacbank’s Eco-Banking Department: Improving Air Quality with Credit, Carbon
Finance and Smart Subsidies’.
Baatar, B., 2012. ‘Country Presentation: Mongolia’. Presented at the Training and Dialogue Programs
of JICA: Energy Policy (B). Institute of Energy Economics, Japan.
http://eneken.ieej.or.jp/data/4480.pdf.
Barma, N., Kaiser, K., Le, T. M. and Viñuela, L., 2011. Rents to Riches? The Political Economy of Natural
Resource-Led Development. The World Bank, Washington, DC.
BGR, 2013. Energy Study 2012: Reserves, Resources and Availability of Energy Resources. The Federal
Institute for Geosciences and Natural Resources (BGR) on behalf of the German Mineral Resources
Agency (DERA)., Hannover, Germany.
http://www.bgr.bund.de/DE/Gemeinsames/Produkte/Downloads/DERA_Rohstoffinformationen/rohs
toffinformationen-
15e.pdf;jsessionid=AAA371EC060D47D474F1F529163D4CAE.1_cid334?__blob=publicationFile&v=3.
Carbon Tracker Initiative, 2011. Unburnable Carbon – Are the World’s Financial Markets Carrying a
Carbon Bubble? London. http://www.carbontracker.org/carbonbubble.
Chen, W., Li, H. and Wu, Z., 2010. ‘Western China energy development and west to east energy
transfer: Application of the Western China Sustainable Energy Development Model’. Energy Policy,
38(11). 7106–20. doi:10.1016/j.enpol.2010.07.029.
Davis, S. J., Peters, G. P. and Caldeira, K., 2011. ‘The supply chain of CO2 emissions’. Proceedings of
the National Academy of Sciences, 108(45). 18554 –18559. doi:10.1073/pnas.1107409108.
Dorjpurev, J., 2013. GHG Mitigation Scenarios in Energy Sector (Summary). EEC Co. for the Mongolia
Ministry of Environment and Green Development, Ulaanbaatar, Mongolia.
ECA, 2008. Renewable Energy Regulatory Analysis Report. Mongolia: Renewable Energy Regulatory
Development Road Map. Economic Consulting Associates Limited, London, UK.
egen and MonEnergy Consult, 2013. Updating Energy Sector Development Plan: Draft Executive
Summary. Prepared for The Asian Development Bank and The Mongolian Ministry of Energy.

105
Elliott, D., Schwartz, M., Scott, G., Haymes, S., Heimiller, D. and George, R., 2001. Wind Energy
Resource Atlas of Mongolia. NREL/TP-500-28972. National Renewable Energy Lab., Golden, CO (US).
http://www.osti.gov/energycitations/product.biblio.jsp?osti_id=787886.
Enkhbayar, S., 2013. Special Feature: Latest Developments in the Mongolian Economy. ERINA Report,
109. Economic Research Institite for Northeast Asia.
Ernedal, S., 2013. ‘Utilizing the energy and cost saving potential in the Mongolian energy sector
through a legal framework for energy efficiency as well as performance optimization and preventive
maintenance in energy utilities’.
Eurasia Capital, 2011. Mongolia Outlook 2010-2020. Hong Kong. http://www.eurasiac.com.
Fisher, B. S., Batdelger, T., Gurney, A., Galindev, R., Begg, M., Buyantsogt, B., Lkhanaajav, E. and
Chadraaval, B., 2011. The Development of the Oyu Tolgoi Copper Mine: An Assessment of the
Macroeconomic Consequences for Mongolia. BAEconomics for Rio Tinto, Canberra.
Fraunhofer IBP, 2008. Scientific Monitoring of Building Restorations in Ulan Bator and Assessment of
the Energy Savings Potential as Well as Derivation of General Measures for Quality Assurance.
GGGI, 2013. Strategies for Green Public Transport in Mongolia. Global Green Growth Institute.
GGGI, 2011. Green Growth in Motion: Sharing Korea’s Experience. Global Green Growth Institute,
Seoul.
GGKP, 2013. Moving towards a Common Approach on Green Growth Indicators. Green Growth
Knowledge Platform Scoping Paper. GGKP including staff from the Global Green Growth Institute,
Organisation for Economic Co-operation and Development, United Nations Environment Programme,
and World Bank, Paris. http://issuu.com/ggkp/docs/ggkp_moving_towards_a_common_approa.
GoM, 2008. Millennium Development Goals Based Comprehensive National Development Strategy of
Mongolia. Government of Mongolia Task force to develop comprehensive national development
strategy, Ulaanbaatar City.
Gurría, A., 2013. ‘The climate challenge: Achieving zero emissions’.
http://www.oecd.org/about/secretary-general/the-climate-challenge-achieving-zero-emissions.htm.
Halsnaen, K., Callaway, L. and Meyers, H., 1999. Economics of GHG Limitations. Main Report.
Methodological Guidelines. Available on the request from UNEP Collaborating Centre for Energy and
Environment, Riso National Laboratory, Denmark.
Heaps, C. B., 2012. Long-Range Energy Alternatives Planning (LEAP) System. Stockholm Environment
Institute - U.S., Somerville, MA.
Hertwich, E. G. and Peters, G. P., 2010. Multiregional Input-Output Database: OPEN:EU Technical
Document. One Planet Economy Network, 7th Framework Programme for Research and Technological
106
Development, Trondheim, Norway.
http://www.oneplaneteconomynetwork.org/resources/programme-
documents/WP1_MRIO_Technical_Document.pdf.
HSBC, 2012. Coal and Carbon: Stranded Assets: Assessing the Risk. HSBC Global Research, London.
https://www.research.hsbc.com/midas/Res/RDV?p=pdf&key=dXwE9bC8qs&n=333473.PDF.
IEA, 2013. World Energy Outlook 2013. International Energy Agency, Paris.
http://www.worldenergyoutlook.org/publications/weo-2013/.
IEA, 2012a. Energy Technology Perspectives 2012: Pathways to a Clean Energy System. International
Energy Agency / OECD Publishing, Paris. http://dx.doi.org/10.1787/20792603.
IEA, 2012b. World Energy Outlook 2012. International Energy Agency, Paris.
http://www.worldenergyoutlook.org.
IEA, 2011. World Energy Balances 2011. International Energy Agency, Paris. http://www.iea.org/stats/.
IEA, 2009. Transport, Energy and CO2: Moving towards Sustainability. Paris.
IEA, 2007. Tracking Industrial Energy Efficiency and CO2 Emissions. International Energy Agency, Paris.
IIASA, 2012. Mongolia: Energy Profile and Policy. Rapid Assessments. International Institute for
Applied System Analysis.
IMF, 2013. Energy Subsidy Reform: Lessons and Implications. International Monetary Fund.
http://www.imf.org/external/np/pp/eng/2013/012813.pdf.
IMF, 2012. Mongolia: Staff Report for the 2012 Article IV Consultation and Third Post-Program
Monitoring - Debt Sustainability Analysis. International Monetary Fund.
Intergovernmental Panel on Climate Change, 2011. IPCC Special Report on Renewable Energy Sources
and Climate Change Mitigation. O. Edenhofer, R. Pichs-Madruga, Y. Sokona, K. Seyboth, P. Matschoss,
S. Kadner, T. Zwickel, P. Eickemeier, G. Hansen, S. Schlomer, and C. von Stechow (eds.). Cambridge
University Press, Cambridge, UK.
Jarvis, M., Lange, G.-M., Hamilton, K., Desai, D., Fraumeni, B., Edens, B., Ferreira, S., Li, H., Chakraborti,
L. and Kingsmill, W., 2011. The Changing Wealth of Nations: Measuring Sustainable Development in
the New Millennium. The World Bank, Washington, DC.
Johnson, T., Alatorre, C., Romo, Z. and Liu, F., 2010. Low-Carbon Development for Mexico. World Bank,
Washington, DC.
Lenzen, M., Kanemoto, K., Moran, D. and Geschke, A., 2012. ‘Mapping the Structure of the World
Economy’. Environmental Science & Technology, 46(15). 8374–81. doi:10.1021/es300171x.

107
Lkhagvadorj, I., 2010. Mongolia Renewable Energy Report. Asian and Pacific Centre for Transfer of
Technology Of the United Nations – Economic and Social Commission for Asia and the Pacific (ESCAP),
Ulaanbaatar.
Maidowski, P., 2012. How to Create Efficient, Reliable, and Clean Electricity Markets: A Regulatory
Design for Mongolia and Northeast Asia. Tufts University.
MEGD, 2013a. Green Civilization: Draft Strategic Plan for Green Development (English Translation).
Ministry of Environment and Green Development, Government of Mongolia, Ulaanbaatar.
MEGD, 2013b. Technology Needs Assessment for Climate Change Mitigation in Mongolia. Ministry of
Environment and Green Development, Mongolia, Ulaanbaatar.
Metz, B., 2013. ‘Making a Pledge and Review system work: national green growth plans, policies and a
different approach to equity | Controlling Climate Change’.
http://controllingclimatechange.net/making-a-pledge-and-review-system-work.
Minchener, A., 2013. Energy Issues for Mongolia. IEA Clean Coal Centre.
MNET, 2010. Mongolia Second National Communication Under the United Nations Framework
Convention on Climate Change. Ulaanbaatar, Mongolia.
Mudd, G. M., 2007. ‘Global trends in gold mining: Towards quantifying environmental and resource
sustainability’. Resources Policy, 32(1–2). 42–56. doi:10.1016/j.resourpol.2007.05.002.
National Statistical Office of Mongolia, 2012. Mongolian Statistical Yearbook. Government of
Mongolia, Ulaanbaatar, Mongolia.
Ngwadla, X., 2013. Equitable Access to Sustainable Development: Relevance to Negotiations and
Actions on Climate Change. MAPS.
Norgate, T. and Haque, N., 2010. ‘Energy and greenhouse gas impacts of mining and mineral
processing operations’. Journal of Cleaner Production, 18(3). 266–74.
doi:10.1016/j.jclepro.2009.09.020.
OECD, 2012. Green Growth and Developing Countries. Paris.
Oxford Business Group, 2013. The Report: Mongolia 2013. Oxford Business Group.
Peters, G. P., 2008. ‘From production-based to consumption-based national emissions inventories’.
Ecological Economics, 65(1). 13–23. doi:10.1016/j.ecolecon.2007.10.014.
Peters, G. P., Davis, S. J. and Andrew, R., 2012. ‘A synthesis of carbon in international trade’.
Biogeosciences, 9(8). 3247–76. doi:10.5194/bg-9-3247-2012.
Sathaye, J. and Meyers, S., 1995. Greenhouse Gas Mitigation Assessment: A Guidebook. Kluwer
Academic Publishers, Dordrecth, the Netherlands.
108
Saygin, D., Worrell, E., Patel, M. K. and Gielen, D. J., 2011. ‘Benchmarking the energy use of energy-
intensive industries in industrialized and in developing countries’. Energy, 36(11). 6661–73.
doi:10.1016/j.energy.2011.08.025.
Song, J., 2013. ‘North-East Asia Super Grid in Gobi desert’. Presented at the Expert Group Meeting on
Conceptualizing the Asian Energy Highway, Urumqi, China.
Temuulen, G., 2010. Strategically Significant Mineral Deposits of Mongolia. Erdenes MGL LLC.
Tovuudorj, P., 2013. ‘Mongolian National Energy Agenda and Policy Measures: Scope for subregional
cooperation’.
Tsendsuren, B., 2013. ‘Expectation from New Market Mechanism in Mongolia: some concerns and
possible project examples’.
UN, 2013. World Population Prospects: 2012 Edition. United Nations Department of Economic and
Social Affairs, Population Division, New York. http://esa.un.org/wpp/.
UNDP, 2007. ‘Energy Efficiency in New Construction in the Residential and Commercial Buildings
Sector in Mongolia’.
UNEP, 2011. Towards a Green Economy: Pathways to Sustainable Development and Poverty
Eradication. United Nations Environment Programme, [Nairobi, Kenya].
UNFCCC, 2012. Training Handbook on Mitigation Assessment for Non-Annex I Parties. United Nations
Framework Convention on Climate Change, Bonn.
UNIDO and Government of Mongolia, 2011. Strategic Directions on Industrial Policy in Mongolia.
United Nations Industrial Development Organization, Vienna, Austria.
UNWTO and UNEP, 2008. Climate Change and Tourism: Responding to Global Challenges. World
Tourism Organization ; United Nations Environment Programme, Madrid; Paris.
US DOE, 2007. Mining Industry Energy Bandwidth Study. Prepared by BCS Inc. for the U.S. Department
of Energy Industrial Technologies Program, Washington D.C.
USGS, 2012. 2011 Minerals Yearbook: Mongolia. United States Geological Survey.
Van der Ploeg, F., 2011. ‘Natural Resources: Curse or Blessing?’ Journal of Economic Literature, 49(2).
366–420. doi:10.1257/jel.49.2.366.
Vivid Economics, 2009. G20 Low Carbon Competitiveness. The Climate Institute and E3G.
http://www.vivideconomics.com/index.php/publications/g20-low-carbon-competitiveness-report.
Weber, C. L. and Matthews, H. S., 2008. ‘Food-miles and the relative climate impacts of food choices
in the United States’. Environmental Science & Technology, 42(10). 3508–13. doi:10.1021/es702969f.

109
Westphal, M., Hughes, G. and Brommelhorster eds., 2013. Economics of Climate Change in East Asia.
Asian Development Bank, Manduluyong City, Philippines.
Winkler, H., 2007. Long Term Mitigation Scenarios: Technical Report. Prepared by the Energy
Research Centre for Department of Environment Affairs and Tourism, Pretoria.
worldsteel, 2011. Steel Statistical Yearbook 2011. worldsteel Committee on Economic Studies,
Brussels. http://www.worldsteel.org.
Yeren-Ulzii, B., 2012. ‘Current and Future Prospects of the Electricity Sector in Mongolia’.
http://www.unescap.org/esd/Energy-Security-and-Water-
Resources/energy/security/workingpmeeting/documents/Ulzii.pdf.

110
Appendix A: Listing of the Members of the Project Advisory Committee
Name Organization/Position
Guidance Team
Mr. Tovuudorj Purevjav Director General, Department of Strategic Policy and Planning, Ministry of Energy
Mr. Bekhbat Sodnom Director General, Department of Innovation and PPP, Ministry of Economic Development
Mr. Angarag Myagmar Head of Renewable Energy Division, Department of Policy Implementation and Coordination, Ministry of Energy
Ms. Tsendsuren Batsuuri Head, CDM National Bureau, Climate Change Coordination Office, Ministry of Environment and Green Development
Mr. Enebish Namjil Advisor to the Minister, Ministry of Energy
Mr. Chimeddorj Demchigjav (Project Key Contact Person)^^
Head of Energy Division, Department of Policy Implementation and Coordination, Ministry of Energy
Technical Team
Mr. Gerelt-od Tsogtbaatar Officer, Climate Change Coordination office, Ministry of Environment and Green Development
Ms. Tegshjargal Bumtsend ^ Officer, Climate Change Coordination office, Ministry of Environment and Green Development
Mr. Tumenjargal Makhbal
Specialist in Charge of Policy in Renewable Energy, Department of Strategic Policy and Planning, Ministry of Energy
Mr. Atarjargal Tserendoo Specialist in Charge of Energy Efficiency and Economic Modeling, Department of Strategic Policy and Planning, Ministry of Energy
Mr. Purevdash Solikhuu Specialist in Charge of Solar Energy, Renewable Energy Division, Department of Policy Implementation and Coordination, Ministry of Energy
Ms. Gerel Jambaa Officer, Department of Strategic Planning and Policy, Ministry of Energy
Ms. Ariunzul Dashjamts Specialist in Charge of Environmental Impact Assessment, Fuel Division, Department of Policy Implementation and Coordination, Ministry of Energy
Ms. Javzanpagma N.* Officer, Department of Innovation and PPP, Ministry of Economic Development
Mr. Misheelt Ganbold ^ Officer, Energy and Mining Policy, Ministry of Economic Development
Mr. Enkh-Amgalan Davaa-Ochir Specialist, National Renewable Energy Center
Mr. Enkhsaihan Tumen-Ulzii Engineer, Mongolian Energy Association
Local Consultant Team
Dr. (Mr.) Dorjpurev Jargal Director and senior consultant, EEC Co., Ltd
Mr. Sukhbaatar Tsegmid Senior Advisor, Necom Group, and Director, Mongolian Energy Association
Ms. Oyunchimeg Chogdon
Project Manager, Local Consultant Team
* Participated in first Project Meeting; subsequently moved to another organization
^ Participated in Project starting in third project meeting
^^ As of December, 2013, promoted to Director of Combined Heat and Power Plant #3, Ministry
of Energy
111
Appendix B: Approaches to accounting for GHG emissions
Mongolia’s greenhouse gas inventory, like all inventories submitted by countries to the United
Nations Framework Convention on Climate Change (UNFCCC), is based on the emissions
released within the country. Using this “territorial” approach, Mongolia’s emissions are
dominated by CO2 from power generation, methane (CH4) from enteric fermentation, and (to a
lesser extent) combustion of fossil fuels in vehicles and buildings. Counting these emissions for
Mongolia makes sense, because government policy, especially policies on Mongolia’s energy
supply, can affect releases of these GHGs within the country. Existing targets for carbon
intensity and carbon productivity are based on this territorial GHG inventory.
There are other ways to account for GHG emissions that offer important added perspectives on
sustainable development as well as on competitiveness in a low-carbon world. For example, a
carbon “footprint”, or consumption-based accounting of emissions, can provide a fuller
understanding of the impact of Mongolian households on global GHG emissions. A
consumption-based inventory attributes the emissions associated with producing and
delivering goods and services to households (and countries) that consume them, rather than to
the businesses (and countries) that produce and transport them. For example, energy is used
to make computers, appliances, household items, and other goods purchased and used in
Mongolia, many of which are made in other countries. A consumption-based GHG inventory is
therefore a relevant approach to use in the context of “green consumption” objectives, as has
been considered in the development of Mongolia’s green development concept (which, in mid-
2013, when this appendix was drafted, was being called Green Civilization.)
Counting the GHG emissions associated with making the goods and services consumed in
Mongolia requires a different set of analytical tools than those used to compile a traditional
GHG inventory (Peters 2008). Techniques to calculate consumption-based inventories have
advanced considerably in recent years, and it is now possible to develop them for countries
such as Mongolia (Lenzen et al. 2012).
Current patterns of economic growth in Mongolia are strongly dependent on exports from
energy-intensive mining. One of Mongolia’s most significant exports – coal – also creates CO2
emissions in the countries that import and burn it. This suggests a third possible way of
accounting for GHG emissions – one associated with production and trade in fuels. In fact, such
a system has been proposed, and is gaining some traction (Davis et al. 2011; Peters et al. 2012).
Furthermore, accounting for the emissions associated with fuel production and trade can
provide an indicator of potential risks associated with a future low-carbon economy. In
addition to being subject to cyclical price variations independent of environmental

112
considerations, future global coal markets may also be strongly affected by international efforts
to address greenhouse gas emissions – such as limits or taxes on coal consumption – that could
reverse the global growth in consumption and introduce risks to countries, including Mongolia,
that are highly dependent on coal exports for economic growth. In fact, for various reasons,
China has recently introduced caps on coal use in a number of regions, and is contemplating a
national cap on coal use.
The International Energy Agency has outlined a range of possible future scenarios of coal
demand. These scenarios range from continued growth in demand, to one where global coal
use peaks before 2020 and declines steadily after that (IEA 2012b). As shown in Figure B-1,
recently announced (“New”) policies in major economies have lowered the IEA’s forecasts of
future coal demand, and further action by countries to address greenhouse gas emissions,
through caps on coal usage (as in China), carbon pricing (as in Europe and under development
in China), and other measures (such as emissions limits on new power plants, such as in the
United States) could lead to declining coal demand, as in the IEA’s 450 ppm scenario.
Figure B-1. Scenarios of Global Coal Demand
(IEA 2012b)
Counting the emissions associated with exports of fuels produced within a given country
(especially coal) could thus provide an indicator of the associated risks should major economies
begin to limit coal use as in the IEA’s 450 ppm scenario above, while providing another,
complementary means to track a country’s contribution to global GHG emissions. For example,
in 2010, Mongolia exported 594,000 TJ of coal (IEA 2011), which, when burned in the
-
1,000
2,000
3,000
4,000
5,000
6,000
2005 2010 2015 2020 2025 2030 2035
GlobalCoal
Demand(Mtoe)
Current Policies
New Policies
450 ppm Scenario

113
destination countries, released an estimated 59 million tons CO2, several times more CO2 than
released from energy consumption inside Mongolia. If major economies were to take a path
similar to that in the IEA’s 450 ppm scenario above, these emissions could be subject to limits
or carbon prices, demand for coal could decline, and with falling prices, countries with
economies highly dependent on coal and other high-carbon exports could be exposed to much
greater economic risk and, potentially, stranded assets (Carbon Tracker Initiative 2011). In
contrast, economies that develop low-carbon energy systems and low-carbon exports may
benefit from a higher degree of “low-carbon competitiveness” if major economies take serious
action to address climate change (Vivid Economics 2009). Note that accounting for emissions
associated with energy exports is already standard practice for electricity, for which emissions
associated with electricity produced within a given country are included in the usual, territorial
UNFCCC inventory even if exported.
The range of possible global scenarios for coal markets may be of particular concern to
Mongolia, where coal production has grown rapidly as a share of Mongolia’s GDP, as indicated
in Figure B-2.
Figure B-2. Natural Resource Rents in Mongolia as a Function of National GDP
Based on Data from the World Bank (Jarvis et al. 2011)
Furthermore, climate change concerns aside, reliance on natural resource extraction has not
always led to long-term economic growth in major economies – and sometimes has proved a
hindrance (Barma et al. 2011; van der Ploeg 2011). As Mongolia is among the most resource-
dependent economies (and by far the most coal-export-dependent economy) in the world,
0%
10%
20%
30%
40%
50%
60%
1981 1983 1985 1987 1989 1991 1993 1995 1997 1999 2001 2003 2005 2007 2009 2011
NaturalResource
Rents(% of GDP)
Other (Oil/Gas/Forest)
Mineral
Coal

114
economic diversification will likely be necessary (Minchener 2013), as will means to invest the
resource rents (economic profits) into other sectors.
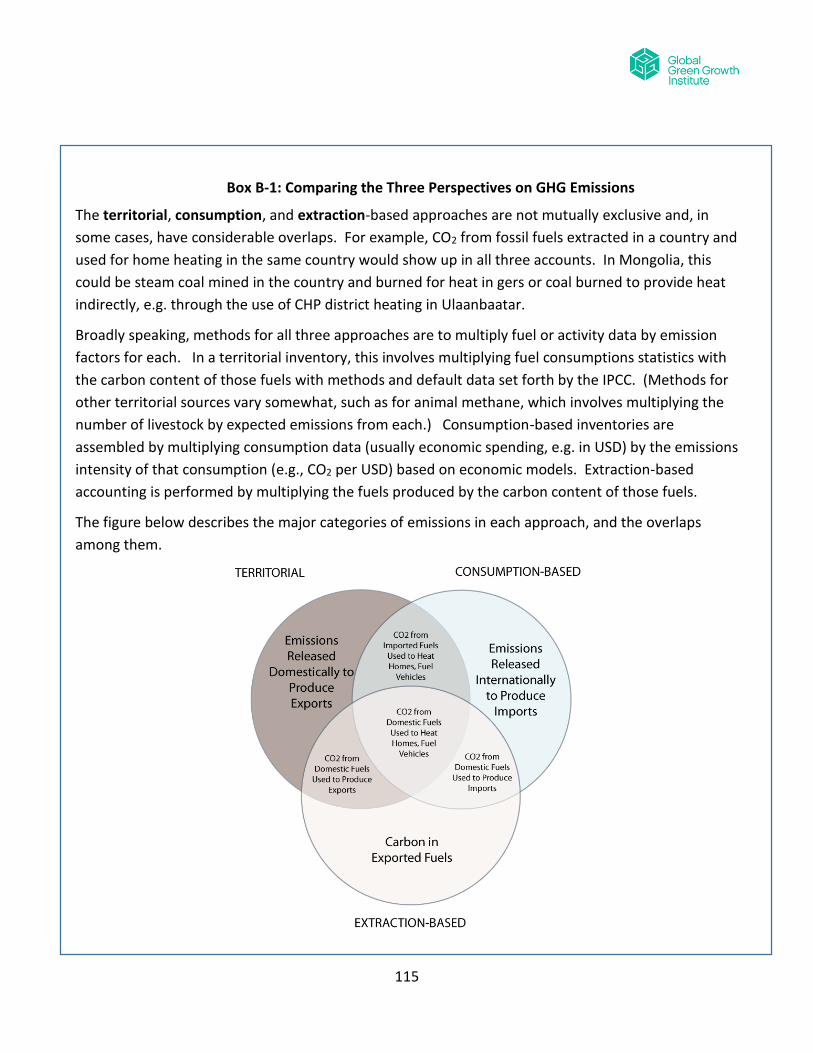
115
Box B-1: Comparing the Three Perspectives on GHG Emissions
The territorial, consumption, and extraction-based approaches are not mutually exclusive and, in
some cases, have considerable overlaps. For example, CO2 from fossil fuels extracted in a country and
used for home heating in the same country would show up in all three accounts. In Mongolia, this
could be steam coal mined in the country and burned for heat in gers or coal burned to provide heat
indirectly, e.g. through the use of CHP district heating in Ulaanbaatar.
Broadly speaking, methods for all three approaches are to multiply fuel or activity data by emission
factors for each. In a territorial inventory, this involves multiplying fuel consumptions statistics with
the carbon content of those fuels with methods and default data set forth by the IPCC. (Methods for
other territorial sources vary somewhat, such as for animal methane, which involves multiplying the
number of livestock by expected emissions from each.) Consumption-based inventories are
assembled by multiplying consumption data (usually economic spending, e.g. in USD) by the emissions
intensity of that consumption (e.g., CO2 per USD) based on economic models. Extraction-based
accounting is performed by multiplying the fuels produced by the carbon content of those fuels.
The figure below describes the major categories of emissions in each approach, and the overlaps
among them.

116
Implications for Green Growth and Sustainable Development Planning
Based on the research outlined above, we suggest that Mongolia may wish to expand its current focus
on territorial CO2 emissions and emissions intensity to include additional metrics and goals for
consumption-based and extraction-based emissions.
Recent advances in data availability have enabled the preparation of estimates of GHG emissions for
each of these three approaches (Peters et al. 2012). (For a brief summary of each method, see Box B-
1.) Here, we estimate energy-related CO2 for each approach for Mongolia, based on data for 1990-
2008 compiled in the global Eora database (Lenzen et al. 2012) and on coal extraction statistics for
Mongolia published by the International Energy Agency (IEA 2011). . Figure B-3, below, presents
time-series results for each approach on the same graph.
Figure B-3. Energy-related CO2 for Mongolia in
Territorial, Consumption, and Extraction-based Accounting Approaches
As Mongolia develops its approach to sustainable development and green growth, it could track the
metrics above and take measures to reduce the GHGs or GHG-intensity of its economy by each metric.
This study finds that Mongolia could reduce its CO2 emissions by over one third relative to reference-
-
10
20
30
40
50
60
70
1990 1995 2000 2005 2010
Million tonsCO2
Territorial
Consumption
Extraction

117
case projections in 2035. Other policy and technical measures may be needed to reduce the intensity
of consumption and extraction-based emissions. Some of these are summarized in Table B-1 below.
Table B-1. Possible Measures to Reduce Territorial, Consumption,
and Extraction-based GHG Emissions
( = measure would reduce emissions relative to BAU)
Measures Impact on GHG emissions relative to business-as-usual Effect on Economic Growth
Territorial Consumption Extraction
Renewable Energy for Domestic Use
(coal prod down) Uncertain
Renewable Energy for Export
(if energy exported to countries that export products make to Mongolia)
(GDP up, coal prod same)
Could increase economic growth via increasing exports
Energy Efficiency in Households and Government
(GDP same or up, coal prod down)
Uncertain; could increase due to energy savings
Energy Efficiency in Services and Industry
(GDP same or up, coal prod down)
Uncertain; could increase due to energy savings
Low-carbon consumption (purchase of low-GHG goods and services)
Uncertain
Emphasize economic growth in non-extractive sectors
Uncertain (if coal extraction lower than BAU)
Could lead to more resilient economy in long term, perhaps at expense of near term economic growth, particularly growth of fossil fuel exports
In summary, Mongolia has considered GHG emissions and GHG-intensity (CO2e per unit GDP) as core
metrics in its sustainable development planning, as well as in its prior (and currently in-process)
National Communications to the UNFCCC (MNET 2010). These metrics usually considers primarily
only territorial greenhouse gas emissions. We suggest that measures of territorial GHG emissions
continue, and that Mongolia also introduce accounting for consumption and extraction-based GHG
emissions to more completely track Mongolia’s contribution to global greenhouse gas emissions, as
well as to help assess possible financial risks associated with being overly reliant on exports of fuels
(especially coal).

118
Appendix C: Possible Green Growth Indicators for Mongolia
No universal definition of green growth exists, but key international institutions working in this area --
GGGI, the United Nations Environment Programme (UNEP), and the Organization for Economic
Cooperation and Development (OECD) – all emphasize improvement in human well-being while
sustaining natural resources (GGGI 2011; UNEP 2011; OECD 2012).
Together with the World Bank, these institutions have worked through the Green Growth Knowledge
Platform (GGKP) to translate the concept of green growth into a common set of metrics to measure
and track progress, in the following five categories (GGKP 2013):
Natural asset base, such as whether natural resource stocks are being depleted;
Environmental and resource productivity / intensity, such as measures of economic activity (GDP) per unit of emissions (CO2);
Environmental quality of life, especially the fraction of the population exposed to air pollution;
Policies and economic opportunities, which may affect indicators in any of the three categories above, and which may include environmentally related taxes or subsidies that stand in the way of cleaner production and consumption, as well as measures to shift the structure of the economy;
Socio-economic context, such as standard macroeconomic variables, and measures of equity, social inclusion, and access to services.
In the table below, we describe and develop a few of the indicators that appear relevant to
Mongolia’s existing goals on expansion of renewable energy, reduction in CO2-intensity, and
improvement of air quality, all of which are also themes of this project.
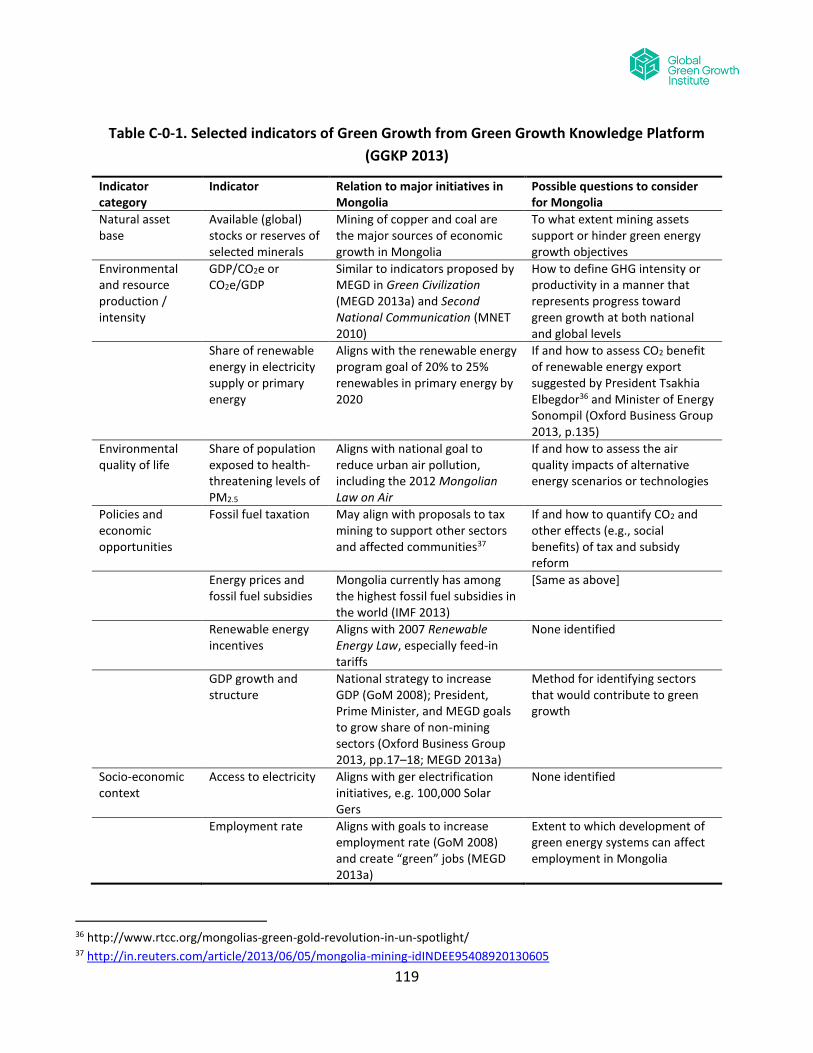
119
Table C-0-1. Selected indicators of Green Growth from Green Growth Knowledge Platform
(GGKP 2013)
Indicator category
Indicator Relation to major initiatives in Mongolia
Possible questions to consider for Mongolia
Natural asset base
Available (global) stocks or reserves of selected minerals
Mining of copper and coal are the major sources of economic growth in Mongolia
To what extent mining assets support or hinder green energy growth objectives
Environmental and resource production / intensity
GDP/CO2e or CO2e/GDP
Similar to indicators proposed by MEGD in Green Civilization (MEGD 2013a) and Second National Communication (MNET 2010)
How to define GHG intensity or productivity in a manner that represents progress toward green growth at both national and global levels
Share of renewable energy in electricity supply or primary energy
Aligns with the renewable energy program goal of 20% to 25% renewables in primary energy by 2020
If and how to assess CO2 benefit of renewable energy export suggested by President Tsakhia Elbegdor36 and Minister of Energy Sonompil (Oxford Business Group 2013, p.135)
Environmental quality of life
Share of population exposed to health-threatening levels of PM2.5
Aligns with national goal to reduce urban air pollution, including the 2012 Mongolian Law on Air
If and how to assess the air quality impacts of alternative energy scenarios or technologies
Policies and economic opportunities
Fossil fuel taxation May align with proposals to tax mining to support other sectors and affected communities37
If and how to quantify CO2 and other effects (e.g., social benefits) of tax and subsidy reform
Energy prices and fossil fuel subsidies
Mongolia currently has among the highest fossil fuel subsidies in the world (IMF 2013)
[Same as above]
Renewable energy incentives
Aligns with 2007 Renewable Energy Law, especially feed-in tariffs
None identified
GDP growth and structure
National strategy to increase GDP (GoM 2008); President, Prime Minister, and MEGD goals to grow share of non-mining sectors (Oxford Business Group 2013, pp.17–18; MEGD 2013a)
Method for identifying sectors that would contribute to green growth
Socio-economic context
Access to electricity Aligns with ger electrification initiatives, e.g. 100,000 Solar Gers
None identified
Employment rate Aligns with goals to increase employment rate (GoM 2008) and create “green” jobs (MEGD 2013a)
Extent to which development of green energy systems can affect employment in Mongolia
36 http://www.rtcc.org/mongolias-green-gold-revolution-in-un-spotlight/ 37 http://in.reuters.com/article/2013/06/05/mongolia-mining-idINDEE95408920130605

120
Based on a review of these indicators, several issues may warrant further consideration for energy
planning in Mongolia. These are listed in the last column of Table C-0-1. We discuss each below:
Extent to which mining assets support or hinder green growth objectives. Proposals have been advanced in Mongolia to use economic gains from the mining sector to support other environmental and social objectives in the country. Questions to consider may include, for example, what is the scale of tax revenues or other economic rents that could be made available to support energy efficiency and renewable energy, increased electricity access in rural areas, cleaner cooking and heating fuels in urban areas, increased employment in “green” vocations, or other social or green energy initiatives? Or, instead, does large-scale development of coal resources (even if primarily for export) drive down coal prices to the extent that renewable energy cannot compete domestically?
How to define GHG intensity or productivity in a manner that represents progress toward green growth at both national and global levels. Mongolia’s targets for carbon intensity (and its inverse, carbon productivity) are based on a “territorial” accounting for greenhouse gas emissions that counts emissions released within Mongolia. Actions to decrease GHG-intensity within Mongolia may have significant impact on GHG emissions outside the country’s borders, however (e.g., through carbon “leakage”) (GGKP 2013). Two means to account for GHG emissions can be used to help provide a more complete picture of a country’s contribution to global GHG emission: a consumption and an extraction approach. A consumption-based approach (also called a carbon “footprint) would count the emissions associated with producing goods and services consumed in Mongolia (even if those goods were imported). An extraction-based approach would track emissions associated with the eventual combustion of exported fuels (e.g., coal), which could help provide an indicator of possible financial risks to the country’s growth, as emissions from burning these fuels could be subject to limits or carbon prices in the importing countries, such as caps on coal usage in China. Using these other two approaches can help design strategies that result in global (not just local) reductions in GHG emissions (or intensity).
If and how to assess the CO2 benefits of renewable energy exports. Several figures in the Mongolian government have suggested that Mongolia could develop solar and wind power for export, e.g. to China or to a proposed broader Asian “supergrid.” Such developments could contribute to economic development in Mongolia, but reductions in emissions through use of the renewable energy exported would occur in other countries. Assessing the emissions benefits of expansion of Mongolian renewable energy for export would involve, at a minimum, consideration of what energy sources were being displaced in the importing countries.
If and how to assess the air quality impacts of alternative energy scenarios or technologies. Quantifying the GHG emissions associated with different energy technologies is relatively straightforward; emissions of other pollutants, such as particulates including PM2.5, can depend on specific control technologies. Furthermore, where the other pollutants are released – such as near population centers – can have a great impact on the potential health impacts. If and how to assess these impacts quantitatively – or, alternately, qualitatively – as

121
well as whether to make reduction in particulate emissions an explicit goal of the scenarios (which could increase energy use) – will need to be addressed.
If and how to quantify potential CO2 and other effects (e.g., social benefits) of tax and subsidy reform. Discussions are underway in Mongolia about if and how to reform fossil fuel taxation to support investments in renewable energy, other types of business, and social initiatives. Changing the pricing structure of fossil fuels, whether directly through taxes or instead through removal of subsidies (Mongolia has among the world’s highest subsidies on fossil fuels), could have an impact on fossil fuel consumption and CO2 emissions. Quantifying these potential CO2 effects would need to involve an economic model or, at a minimum, assumptions about economic elasticities to estimate demand response to changes in prices.
Method for identifying sectors that would contribute to green growth. The mining sector has dominated Mongolia’s recent economic growth, and goals have been announced to grow other economic sectors, such as agriculture. Yet it is not clear which sectors would contribute to green growth. Efforts to identify and evaluate economic sectors that would contribute to green growth face several questions, such as potential impact on national and global GHGs, air pollutants, and a host of other green growth indicators (GGKP 2013), as well as whether the necessary knowledge and other factors are in place in Mongolia for the target sectors to grow. Some sectors, such as livestock for food or wool, may have low energy-intensity but potentially high GHG-intensity (in this case, due to methane emissions from ruminant animals). Other sectors may have relatively low (local) energy intensity (per unit of GDP produced), but substantially contribute to global GHG emissions (e.g., international tourism, or coal mining). And some sectors may have other economic or social impacts, positive or negative, beyond GHG emissions. Developing a method to screen and evaluate sectors, taking into account these types of considerations, could be challenging.
Extent to which development of green energy systems can affect employment in Mongolia. Several studies have suggested the development of renewable energy creates more jobs per unit of energy created than does development of fossil energy (UNEP 2011). However, the methods to analyze employment effects are challenging and require an assessment of how the full supply chain (from production of equipment and parts to labor for installation) would adjust in both the medium and long term (IPCC 2011). Whether to assess employment potential quantitatively using such methods, or instead describe the potential (and needed supporting policies and institutions) qualitatively, is an open question for this project.
Addressing all of these questions would require a substantial resource effort, likely over many years.
In this report, we address the first four questions only, leaving the other questions to future work or
related efforts.

122
Appendix D. Ministries and Agencies Responsible for Renewable Energy in Mongolia
Ministry of Energy (one of the top priority activities of the ministry is to
support and develop renewable energy use)
National Renewable
energy center (State owned enterprise)
Energy Development
Center (State owned enterprise)
Strategic policy
planning department
- To prepare long term and
midterm plan for renewable
energy development
- To prepare draft of
renewable energy law
- To do policy coordination
for renewable energy
development
The main goals of National Renewable Energy Center (NREC) activities are to: introduce sustainable
development principles to Mongolia; achieve the goals of the Renewable Energy National Program;
complete a detailed study on renewable energy resources and utilization; introduce new renewable
energy technologies to Mongolia; undertake research on introducing new technology suitable to the
special features of Mongolia’s climate; implement projects, programs and surveys?(measurements)
throughout the country; and develop Mongolia’s technical capacity?(technical control).
The Energy Development Center organizes implementation of standards, rules and guidelines and
trainings, prepares training needs assessments human resources in Energy Sector
Energy Regulatory
Committee
(Government agency)
Energy Corporation (State owned enterprise)
Renewable energy
section
- To coordinate
implementation of
renewable energy projects
- To implement renewable
energy related guidelines
and standards
The ERC is responsible for licensing of enterprises-renewable energy
producers in electricity and heat.
The ERC approves electricity market rules.
Detailed Designs; projects, Project budget estimate
Ministry of Environment and Green
Development (To establish legal and policy framework and
institutional arrangements for green development of
the country
Green Development policy planning department
Climate Change
Coordination Office (Government Agency)
The main purpose of the office is to bear main responsibility for the
climate change related activities nationwide, to formulate and implement
climate change related government policies, strategies, and programs,
provide inter-sectoral coordination on climate change, activities and
support implementation of international agreements, conventions and
protocols on climate change within the country.
National Electricity
Transmission
Company
(State owned enterprise)
The National Electricity Transmission Company is responsible to make
power purchase agreement with grid connected renewable electricity
producers such as wind park, hydropower plants, Solar PV.
Ministry of Economic Development (The role of the Ministry of Economic Development is to
formulate, develop and coordinate Mongolian economic
and social development policy, Long, mid and short term
strategy and planning, investment and trade policy. )
The Ministry of Economic Development is responsible to find investment
option for bid projects such as wind park, hydropower plants, Solar PV.
The Ministry could introduce public-private partnership for
implementation of Renewable energy projects according to the
concession law

123
Appendix E: Listing of LEAP Scenarios in Mongolia Data Set
The table that follows provides a brief listing of the individual sub-scenarios included in the Mongolia
LEAP (Long-range Energy Alternatives Planning) dataset developed for the “Strategies for
Development of Green Energy Systems in Mongolia” Project. The discussion in the body of this report
has focused on the results for four overarching scenarios: “Reference”, “Recent Plans”, “Expanded
Green Energy”, and “Shift in Energy Exports”. With the exception of the Reference case, each of
these scenarios is in turn built up from a number of individual LEAP sub-scenarios, each starting from
the Reference case, that focus on the application of green energy measures to change the reference
case in, for example, a particular demand end-use or a particular energy supply process. In some
cases, intermediate scenarios were used to collect a group of individual scenarios (for example,
“Green Energy Demand-side Measures”), and the intermediate scenarios were included in the
overarching scenarios.
The tables that follows provides the LEAP codes used to refer to individual LEAP scenarios, the title of
the scenarios as used in LEAP, a brief description of each scenario, and, where applicable, a “mapping”
of how the individual LEAP sub-scenarios are combined (“inherited”) into composite or overarching
scenarios.
Overarching Scenarios
LEAP
Code
Title Inherits
from
Description
CA Current Accounts [None] Describes energy supply and demand in Mongolia
in the base year (now 2010) and, in some cases,
previous years.
REF Reference Current
Accounts
Describes reference-case changes in Mongolia’s
energy sector. Includes fossil power plant
additions and upgrades as planned (e.g., CHP5,
Tavan Tolgoi, Telmen), plus renewables that are
already in operation (e.g., Salkhit Wind Park); heat
provided by CHP and coal-fired heat-only boilers.
In the energy demand sectors, includes expected
trends towards gradually less energy-intensive
end-use technologies.
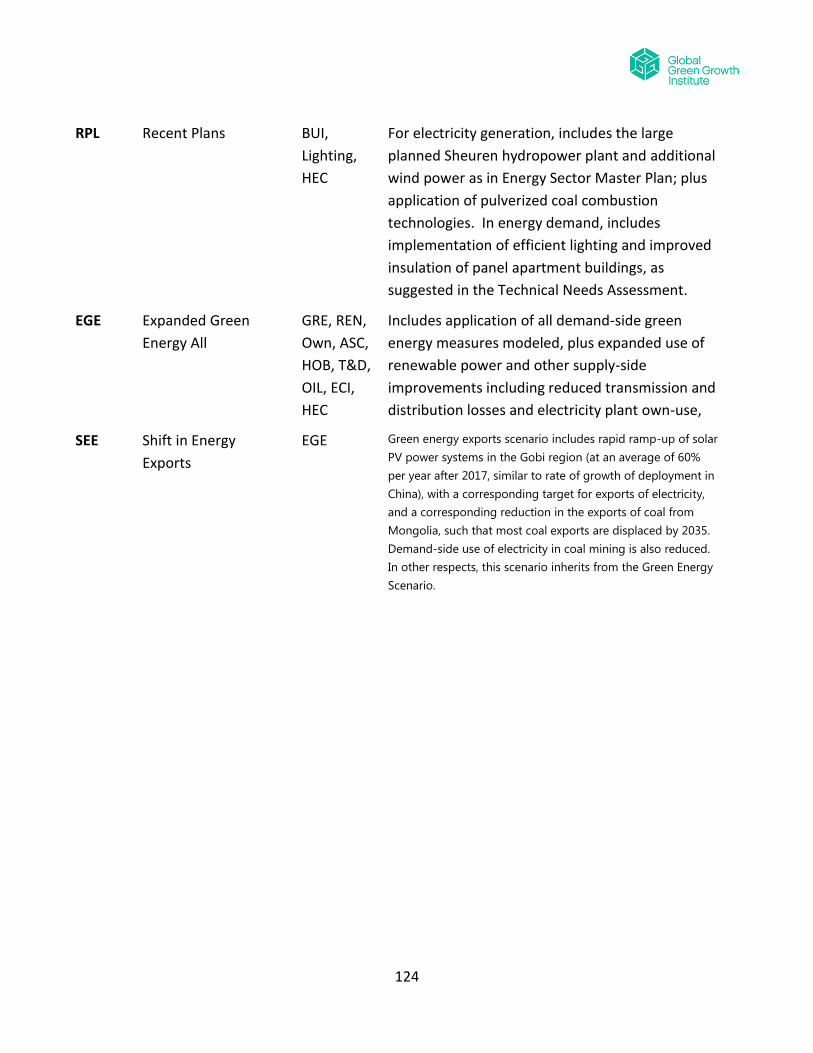
124
RPL Recent Plans BUI,
Lighting,
HEC
For electricity generation, includes the large
planned Sheuren hydropower plant and additional
wind power as in Energy Sector Master Plan; plus
application of pulverized coal combustion
technologies. In energy demand, includes
implementation of efficient lighting and improved
insulation of panel apartment buildings, as
suggested in the Technical Needs Assessment.
EGE Expanded Green
Energy All
GRE, REN,
Own, ASC,
HOB, T&D,
OIL, ECI,
HEC
Includes application of all demand-side green
energy measures modeled, plus expanded use of
renewable power and other supply-side
improvements including reduced transmission and
distribution losses and electricity plant own-use,
SEE Shift in Energy
Exports
EGE Green energy exports scenario includes rapid ramp-up of solar
PV power systems in the Gobi region (at an average of 60%
per year after 2017, similar to rate of growth of deployment in
China), with a corresponding target for exports of electricity,
and a corresponding reduction in the exports of coal from
Mongolia, such that most coal exports are displaced by 2035.
Demand-side use of electricity in coal mining is also reduced.
In other respects, this scenario inherits from the Green Energy
Scenario.

125
Intermediate Scenarios
LEAP
Code
Title Inherits from Description
GRE Green Energy Demand
Side Measures MEI, INC, INE,
SWH, VEH,
TRA, BNG,
RBS, APP,
CSG, GHI,
Lighting, BUI,
URB, GHB,
GH3
Combines green energy measures from the
buildings, transport, industrial, and
agricultural sectors.
REN Renewable HYDRO, SOL,
WIND Combines electricity generation additions
from renewable energy sources
(hydroelectric, solar photovoltaic/thermal,
and wind power)

126
Individual Scenarios
LEAP
Code
Title Description
APP Appliance Efficiency Efficiency improvements in multiple electric appliances,
including in power supplies for electronics.
ASC Advanced Ultra
Supercritical
Implements higher-efficiency new coal plants when additional
electricity supplies (beyond those provided through other
plants in the scenario) are needed.
BNG CNG Bus
Implementation
Implementation of CNG bus use in Ulaanbaatar based on GGGI
Transport study (2013).
BUI Building Energy
Efficiency
Improvements in building energy efficiency (residential and
commercial sectors) related mostly to space heating.
CMM* Coal Mine Methane
Capture
Capture of methane from coal mines/coal beds.
CSG Efficient Ger Coal
Stoves
Implementation of efficient coal stoves for gers.
ECI Existing CHP
Efficiency
Improvements
Improvements to boost the performance of existing CHP units
in the power sector.
GHB Ger Heating Blanket
Program
Applies heating blankets (additional insulation) to gers in
urban and rural areas.
GHI Ger Heating
Improvement
Improvements in coal briquette and wood-fired ger heating
stoves.
GH3 Ground Source Heat
Pumps (Revised)
Phases in ground-source heat pumps for space heating in
urban houses and in the commercial sector.
HEC Higher Efficiency New
Coal Plants
Implements higher efficiency standards for new coal and CHP
plants--assumed 3% or greater improvements in electricity
generation efficiency than conventional plants in reference
case.
HOB HOB Improvement Improvements in the efficiency of heat-only boilers providing
district heat in urban and soum areas.
HYDRO Hydro Power Additional hydroelectric power plant development beyond

127
LEAP
Code
Title Description
Expansion reference case levels.
INC Industrial Coal and
Heat Use Measures
Measures to improve coal-fired boilers and furnaces and
reduce industrial heat use.
INE Industrial Electric
Measures
Implements energy efficiency improvements in industrial
electricity use.
Lighting Efficient lighting Lighting efficiency improvement measures in buildings sectors.
MEI Mining Energy
Intensity
Improvement
With the exception of the newest mines and minerals
processing plants, assumes transition to current best practice
energy electricity and fuel-use intensities by 2020, with
improvement to current “practical minimum” energy
intensities by 2035 in all subsectors.
OWN Station own use Reduction in the “own use” of electricity in electricity
generation plants.
RBS Road Transport Mode
Shift
Shifting passengers from private vehicles to buses. Based on
four strategies in the GGGI Transport study (2013) and the
modeled efficacies of same, implementation of BRT,
improvements in operations, and improved fare systems yield
about 15% shift of private road vehicle trips from cars to buses
by the year 2020.
SOL Solar PV Addition of solar photovoltaic and solar thermal power
(supply-side).
SSH Soum Solar Heating Addition of solar heating for groups of households in soums.
SWH Solar Water Heating Solar water heating applications in apartments, gers, and the
commercial sector.
TRA Transport mode shift
to Rail
Shifts transport for passenger and freight transport to rail
from road and air travel.
T&D Transmission and
distribution losses
Reduction in transmission and distribution losses for
electricity, and distribution losses for heat.
URB Urban Planning to
Reduce Travel
Urban planning measures undertaken to reduce growth in
requirements for personal and other travel.

128
LEAP
Code
Title Description
Demand
VEH Vehicle Efficiency
Improvement
Improvements in road vehicle efficiency, including
improvements in gasoline and diesel vehicles, and some
implementation of electric vehicles.
WIND Wind Park Additional wind power development.
*Note that this scenario/measure has been included in the cost curve shown in this report, but is not
yet included in any of the overarching scenarios.
129
Appendix F: Summary Description of LEAP Software Tool
LEAP, the Long range Energy Alternatives Planning System, is a software tool for energy policy analysis
and climate change mitigation assessment developed at the Stockholm Environment Institute.
LEAP has been adopted by thousands of organizations and many thousands of individual researchers
and analysts in more than 190 countries worldwide. Its users include government agencies,
academics, non-governmental organizations, consulting companies, and energy utilities, and it has
been used at scales ranging from households, factories, cities and states to national, regional and
global applications.
Countries use LEAP to undertake integrated resource planning, greenhouse gas (GHG) mitigation
assessments, and Low Emission Development Strategies (LEDS) especially in the developing world.
Many countries have also chosen to use LEAP as part of their commitment to report to the U.N.
Framework Convention on Climate Change (UNFCCC).
In comparison to the other tools for energy and environmental planning, which may have more
sophisticated energy modeling capabilities, but are harder to use and more data intensive, LEAP’s
focus is on transparency of results, ease-of-use, data flexibility, adaptability to different scales,
powerful data & scenario management and policy-friendly reporting. LEAP is also notable for the
degree of methodological choice that it provides to its users, as well as for the ability to link to other
models and software, including LEAP’s sister program for water resource planning, the water or WEAP,
as well as the MS-Office programs, and through its advanced programming interface, with other
models that users might already be using.
Integrated Planning
LEAP is an integrated modeling tool that can be used to track energy consumption, production and
resource extraction in all sectors of an economy. LEAP is a demand-driven tool, in that the user first
describes current and future energy requirements for households, transport, industry, and other
sectors, then uses LEAP to model processes such as electricity generation, coal mining, and other
energy supply systems that provide fuels for final consumption. It can be used to account for both
energy sector and non-energy sector greenhouse gas (GHG) emission sources and sinks. In addition
to tracking GHGs, LEAP can also be used to analyze emissions of local and regional air pollutants,
making it well-suited to studies of the climate co-benefits of local air pollution reduction. Finally,
LEAP can track the direct costs of fuels and resources, of devices and systems that use energy, and of
energy supply infrastructure so as to estimate the relative costs of different approaches to providing

130
energy for an economy. The diagram below shows the relationships of the different integrated
elements of the LEAP structure, and of the calculation flows within LEAP.
LEAP Structure and Calculation Flows
Flexibility and Ease-Of Use
LEAP has developed a reputation among its users for presenting complex energy analysis concepts in
a transparent and intuitive way. At the same time, LEAP is flexible enough for users with a wide
range of expertise: from leading global experts who wish to design polices and demonstrate their
benefits to decision makers to trainers who want to build capacity among young analysts who are
embarking on the challenge of understanding the complexity of energy systems.
Modeling Methodologies
LEAP is not a model of a particular energy system, but rather a tool that can be used to create models
of different energy systems, where each requires its own unique data structures. As a demand-driven
DemographicsMacro-
Economics
Demand
Analysis
Transformation
Analysis
Statistical
Differences
Stock
Changes
Resource
Analysis
Integrated Cost-Benefit AnalysisEn
viron
menta
l Loa
dings
(Poll
utant
Emiss
ions)
Non-Energy Sector
Emissions Analysis
Environmental
Externalities
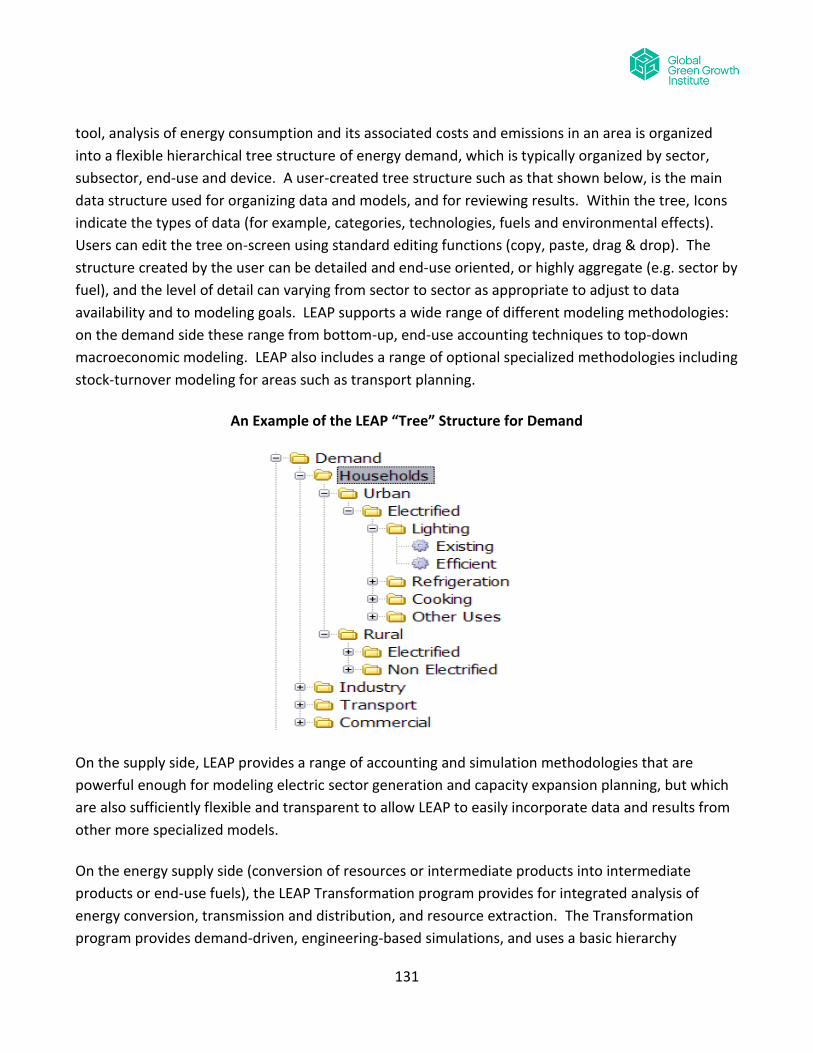
131
tool, analysis of energy consumption and its associated costs and emissions in an area is organized
into a flexible hierarchical tree structure of energy demand, which is typically organized by sector,
subsector, end-use and device. A user-created tree structure such as that shown below, is the main
data structure used for organizing data and models, and for reviewing results. Within the tree, Icons
indicate the types of data (for example, categories, technologies, fuels and environmental effects).
Users can edit the tree on-screen using standard editing functions (copy, paste, drag & drop). The
structure created by the user can be detailed and end-use oriented, or highly aggregate (e.g. sector by
fuel), and the level of detail can varying from sector to sector as appropriate to adjust to data
availability and to modeling goals. LEAP supports a wide range of different modeling methodologies:
on the demand side these range from bottom-up, end-use accounting techniques to top-down
macroeconomic modeling. LEAP also includes a range of optional specialized methodologies including
stock-turnover modeling for areas such as transport planning.
An Example of the LEAP “Tree” Structure for Demand
On the supply side, LEAP provides a range of accounting and simulation methodologies that are
powerful enough for modeling electric sector generation and capacity expansion planning, but which
are also sufficiently flexible and transparent to allow LEAP to easily incorporate data and results from
other more specialized models.
On the energy supply side (conversion of resources or intermediate products into intermediate
products or end-use fuels), the LEAP Transformation program provides for integrated analysis of
energy conversion, transmission and distribution, and resource extraction. The Transformation
program provides demand-driven, engineering-based simulations, and uses a basic hierarchy

132
including “modules” (sectors, for example, electricity generation), each containing one or more
“processes”, such as power plants or types of power plants. Each process can have one or more
feedstock fuels and one or more auxiliary fuels. LEAP allows for simulation of both capacity expansion
and process dispatch, and calculates imports, exports and primary resource requirements, as well as
costs and environmental loadings. A schematic of a generic Transformation “Module” is shown below,
but any given module can be very simple (for example, modules can have just one input and one
output, and a single process and conversion efficiency, or can have multiple input and output fuels,
and many different processes or plants) or very complex, depending on the data available and the
modeling choices made by the user.
Generic Elements of Transformation Modules in LEAP
For electricity generation in particular, although LEAP is not intended to be a full-fledged dispatch
model, it does provide the capability to dispatch different electricity generation resources
(“processes”) using criteria ranging from running to full capacity, to dispatch by share of capacity or
historical output, merit order, or least-cost resource. Plants are dispatched to meet both total
demand (in MWh) as well as the instantaneous peak demand that can be defined to vary by hour, day
and season. If peak demand is to be tracked, users can exogenously specify a load-duration curve and

133
LEAP will dispatch plants by merit order. Alternatively, load shapes be specified for each demand
device so that the overall system load is calculated endogenously. Thus the effect of demand-side
management (DSM) or energy efficiency policies on the overall load shape can then be explored in
scenarios. Plant dispatch can also then be varied by season (for example, to reflect how hydro
dispatch may vary between wet and dry seasons).
LEAP’s modeling capabilities operate at two basic conceptual levels. At one level, LEAP's built-in
calculations handle straightforward energy, emissions and cost-benefit accounting calculations. At
the second level, users enter spreadsheet-like expressions that can be used to specify time-varying
data or to create a wide variety of sophisticated multi-variable models, thus enabling econometric
and simulation approaches to be embedded within LEAP’s overall accounting framework. As of 2013,
LEAP also supports optimization modeling: allowing for the construction of least cost models of
electric system capacity expansion and dispatch, potentially under various constraints such as limits
on CO2 or local air pollution.
Time Frame
LEAP is intended as a medium to long-term modeling tool. Most of its calculations occur on an annual
time-step, and the time horizon can extend for an unlimited number of years. Studies typically
include both a historical period known as the Current Accounts, in which the model is run to test its
ability to replicate known statistical data, as well as multiple forward looking scenarios. Typically,
most studies use a forecast period of between 20 and 50 years. Some results are calculated with a
finer level of temporal detail. For example, for electric sector calculations the year can be split into
different user-defined “time slices” to represent seasons, types of days or even representative times
of the day. These slices can be used to examine how loads vary within the year and how electric
power plants are dispatched differently in different seasons.
Scenario Analysis
LEAP is designed around the concept of long-range scenario analysis. Scenarios are self-consistent
storylines of how an energy system might evolve over time. Using LEAP, policy analysts can create
and then evaluate alternative scenarios by comparing their energy requirements, their social costs
and benefits and their environmental impacts. Scenarios can be used to test policy assumptions and
for sensitivity analysis.
Inheritance in scenarios allows the user to create hierarchies of scenarios that inherit default
expressions from their parent scenario. All scenarios inherit from a common set of Current Accounts
describing energy supply and demand in one or more historical years, thereby minimizing data entry

134
and allowing common assumptions to be edited in one place. Multiple inheritance allows scenarios to
inherit expressions from more than one parent scenario, and allows the combining of measures to
create integrated scenarios. Expressions within LEAP scenarios are color coded to show which
expressions have been entered explicitly in a scenario (blue), and which are inherited from a parent
scenario (black) or from another region (purple).
The LEAP Scenario Manager, shown below, can be used to describe individual policy measures that
can then be combined in different combinations and permutations into alternative integrated
scenarios. This approach allows policy makers to assess the marginal impact of an individual policy as
well as the interactions that occur when multiple policies and measures are combined. For example,
the benefits of appliance efficiency standards combined with a renewable portfolio standard might be
less than the sum of the benefits of the two measures considered separately. In the screen shown,
individual measures are combined into an overall GHG Mitigation scenario containing various
measures for reducing greenhouse gas emissions.
LEAP Scenario Manager Screen

135
Low Initial Data Requirements
A key benefit of LEAP is its low initial data requirements. Modeling tools that rely on optimization
tend to have high initial data requirements because they require that all technologies are fully defined
both in terms of both their operating characteristics and their costs. They also require that the market
penetration rates of those technologies have been reasonably constrained to prevent implausible
knife-edge solutions. Developing the data for such models is a time-consuming task, requiring
relatively high levels of expertise. By contrast, because LEAP relies on simpler accounting principles,
and because many aspects of LEAP are optional, its initial data requirements are thus relatively
low. Energy and environmental forecasts can be prepared before any cost data have been
entered. Moreover, LEAP’s adaptable and transparent data structures are well suited to an iterative
analytical approach: one in which the user starts by rapidly creating an initial analysis that is as simple
as possible. In later iterations the user adds complexity only where data is available and where the
added detail provides further useful insights into the questions being addressed in the analysis.
Decision Support System
While methodology is an important factor in choosing an energy model, LEAP is more than just a
model: it is a full decision support system (DSS) providing extensive data management and reporting
capabilities. It can serve as both a historical database showing the evolution of an energy system
and a forward-looking scenario-based tool that can create forecasts of how a system might evolve or
“backcasts” that examine how a society might try to meet its development goals in the energy
sector. LEAP provides powerful data management tools including full importing and exporting to
Microsoft Excel, Word and PowerPoint, and a rich graphical environment for visualizing data and
results.
Analysis View
LEAP is structured as a series of “views” of an energy system. The main “Analysis View” (shown below)
is the place where users create data structures and scenarios and enter all of the data describing both
historical years and forward-looking scenarios. In the Analysis View a hierarchical tree displays the
main data structure for the analysis. As noted above, the tree supports standard operations (copying,
pasting, dragging and dropping, etc.) that simplify the construction and maintenance of data in an
energy analysis. The tree affords a great deal of flexibility in how a system is modeled. For example
a demand model might be highly disaggregated in a sector where a detailed technology-based
analysis is required, but much more aggregate in sectors where energy use is less important or less
well-understood. LEAP also supports multi-regional analyses in which different data structures can be
created for each region. For example, some countries might be described in more detail where data
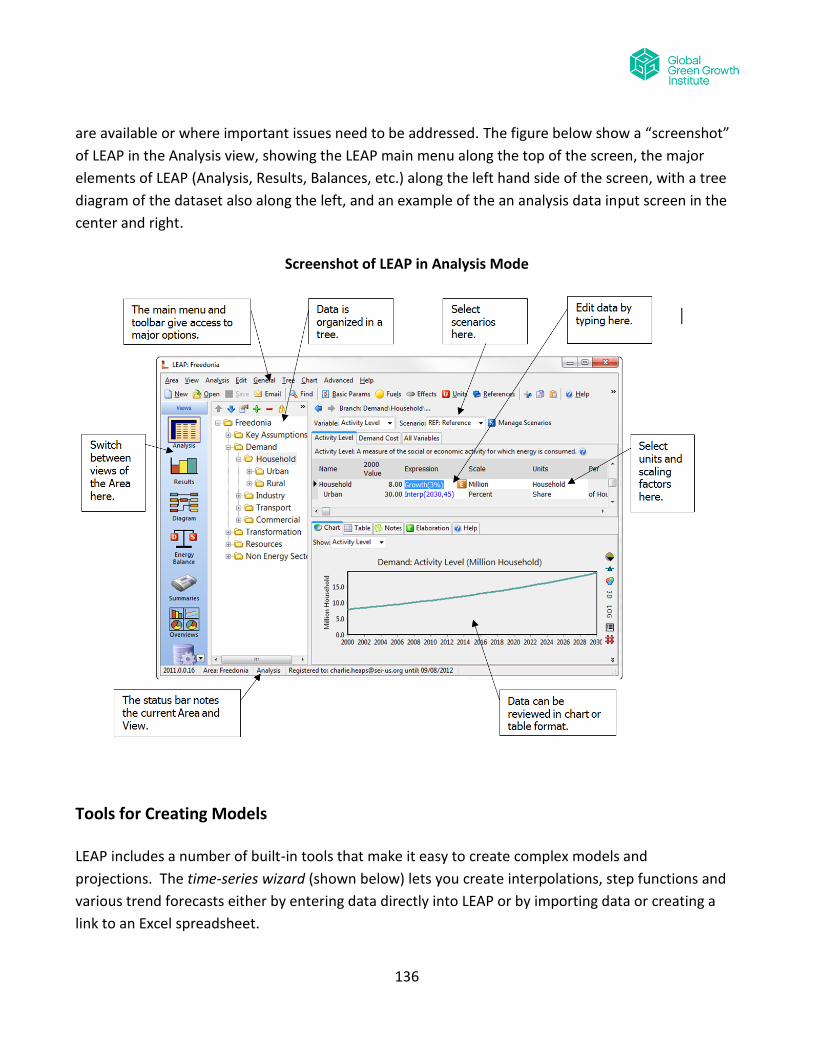
136
are available or where important issues need to be addressed. The figure below show a “screenshot”
of LEAP in the Analysis view, showing the LEAP main menu along the top of the screen, the major
elements of LEAP (Analysis, Results, Balances, etc.) along the left hand side of the screen, with a tree
diagram of the dataset also along the left, and an example of the an analysis data input screen in the
center and right.
Screenshot of LEAP in Analysis Mode
Tools for Creating Models
LEAP includes a number of built-in tools that make it easy to create complex models and
projections. The time-series wizard (shown below) lets you create interpolations, step functions and
various trend forecasts either by entering data directly into LEAP or by importing data or creating a
link to an Excel spreadsheet.

137
The LEAP “Time Series Wizard” Tool for Entering Data
The Expression Builder lets you construct complex models that use LEAP’s large library of built-in
functions as well as references to other data and results calculated within LEAP. Expressions are
similar to expressions used in spreadsheets, and are used to specify the value of variables in many
different parts of the LEAP program. Expressions can be numerical values, or a formula that yields
different results in each year, can use many built-in functions, or refer to the values of other variables,
can be linked to Excel spreadsheets, and can be inherited from one scenario to another. Variable
references can be constructed graphically by simply dragging and dropping branches from the main
tree data structure into the Expression Builder tool. To help debug these models, the Expression
Builder also provides check-as-you type validation of modeling expressions, displaying any syntax or
run-time error messages on a toolbar in real-time.
Results View and Overviews
Intuitive and easy-to-use reporting is another key ingredient of LEAP, helping users to visualize and
interpret results and catch errors. LEAP calculates a huge set of results, which can be displayed as
charts, tables and even maps. The Results View (shown below) makes working with multi-
dimensional results very easy. For example, energy demand results are calculated across five
dimensions: fuels, years, scenarios regions, and branches (i.e. the sectors and subsectors of the
analysis). The user simply chooses the dimensions to display on each axis of the chart. For the other
dimensions, the user can choose to display results for just one element or to sum results across all or
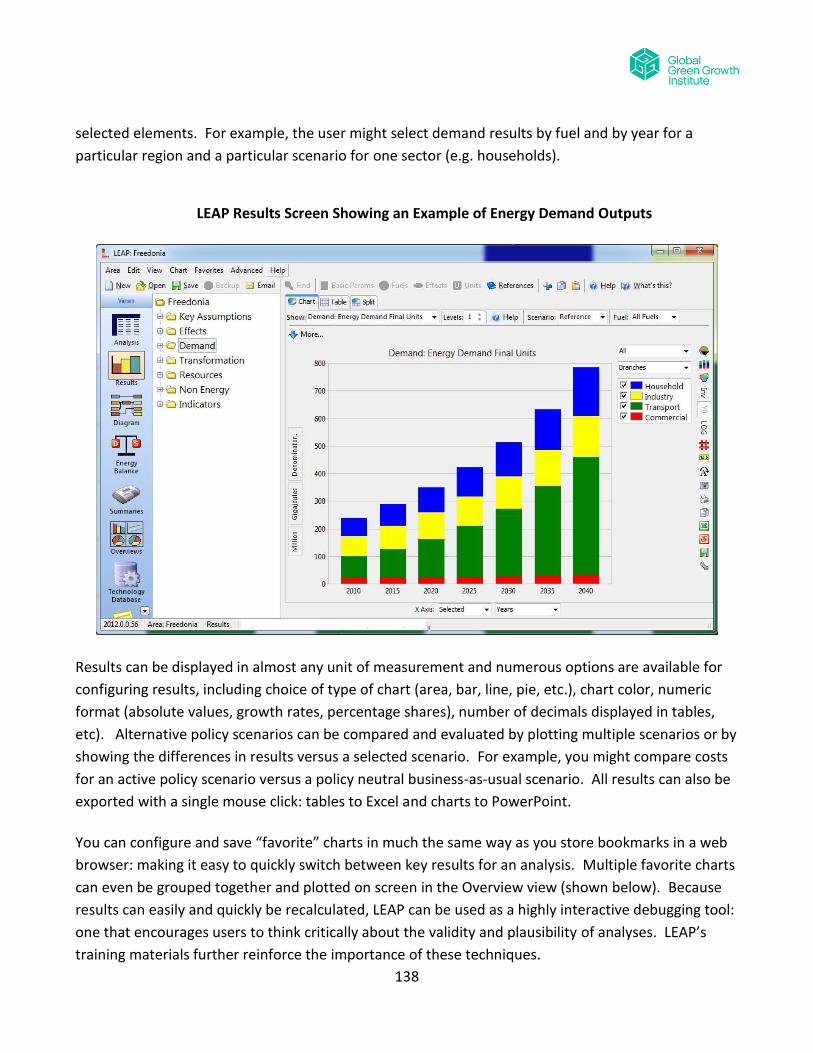
138
selected elements. For example, the user might select demand results by fuel and by year for a
particular region and a particular scenario for one sector (e.g. households).
LEAP Results Screen Showing an Example of Energy Demand Outputs
Results can be displayed in almost any unit of measurement and numerous options are available for
configuring results, including choice of type of chart (area, bar, line, pie, etc.), chart color, numeric
format (absolute values, growth rates, percentage shares), number of decimals displayed in tables,
etc). Alternative policy scenarios can be compared and evaluated by plotting multiple scenarios or by
showing the differences in results versus a selected scenario. For example, you might compare costs
for an active policy scenario versus a policy neutral business-as-usual scenario. All results can also be
exported with a single mouse click: tables to Excel and charts to PowerPoint.
You can configure and save “favorite” charts in much the same way as you store bookmarks in a web
browser: making it easy to quickly switch between key results for an analysis. Multiple favorite charts
can even be grouped together and plotted on screen in the Overview view (shown below). Because
results can easily and quickly be recalculated, LEAP can be used as a highly interactive debugging tool:
one that encourages users to think critically about the validity and plausibility of analyses. LEAP’s
training materials further reinforce the importance of these techniques.

139
Energy Balance View
LEAP also includes a series of specialized reports including standard energy balance reports and
energy flow diagrams. An energy balance is an accounting system that describes the flows of energy
through an economy during a given period. The name “balance” refers to the fact that the quantities
of primary energy produced must be equal to the quantities consumed, after accounting for changes
in stocks, imports and exports and the share used for conversion into secondary energy carriers,
including losses. The energy balance report (shown below) closely follows the standard format
employed by the IEA and most national energy planning agencies. LEAP’s energy balances can be
displayed in table, chart and flow diagram format and they can be customized to summarize
information for detailed or simplified fuel categories, for different years or for different
regions. Balance results can also be shown by sector or by subsector in any energy unit.
Example of a LEAP Energy Balance Table
TED: The Technology and Environmental Database
Analysts often need ready access to comprehensive and up-to-date data describing energy
technologies. Such data are spread across a range of sources, which are not easily accessible,
particularly to analysts in the developing countries. To address this problem, LEAP includes a
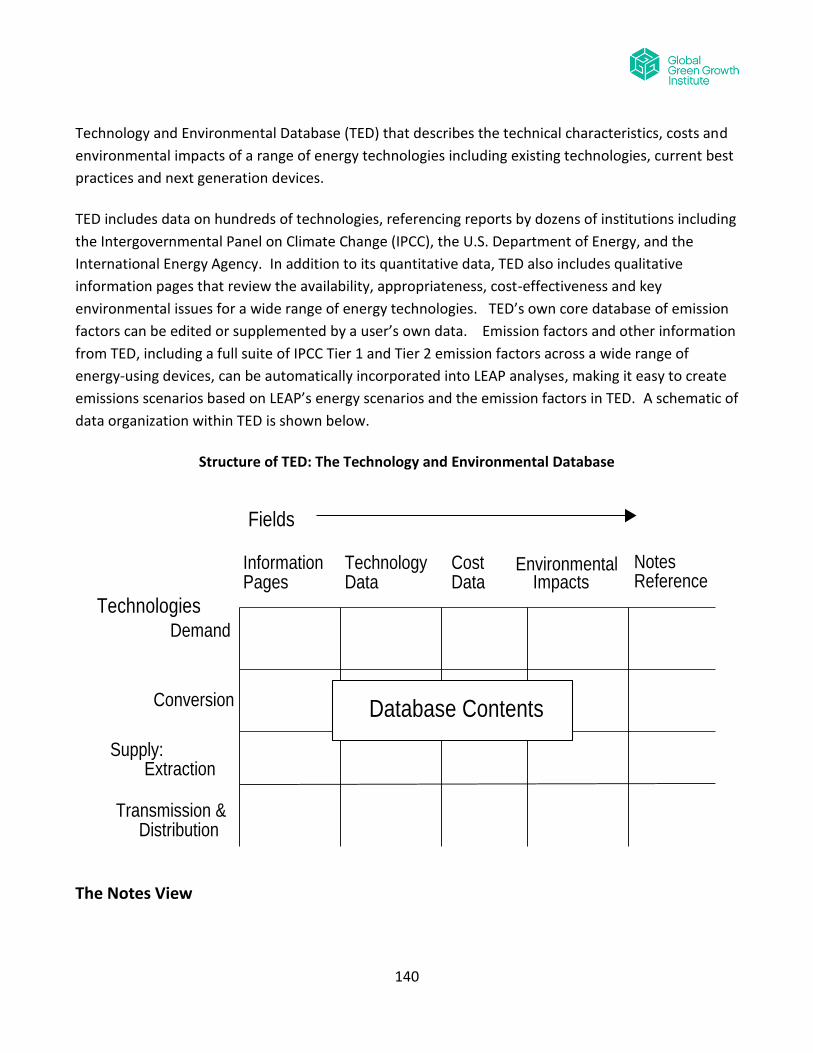
140
Technology and Environmental Database (TED) that describes the technical characteristics, costs and
environmental impacts of a range of energy technologies including existing technologies, current best
practices and next generation devices.
TED includes data on hundreds of technologies, referencing reports by dozens of institutions including
the Intergovernmental Panel on Climate Change (IPCC), the U.S. Department of Energy, and the
International Energy Agency. In addition to its quantitative data, TED also includes qualitative
information pages that review the availability, appropriateness, cost-effectiveness and key
environmental issues for a wide range of energy technologies. TED’s own core database of emission
factors can be edited or supplemented by a user’s own data. Emission factors and other information
from TED, including a full suite of IPCC Tier 1 and Tier 2 emission factors across a wide range of
energy-using devices, can be automatically incorporated into LEAP analyses, making it easy to create
emissions scenarios based on LEAP’s energy scenarios and the emission factors in TED. A schematic of
data organization within TED is shown below.
Structure of TED: The Technology and Environmental Database
The Notes View
Technologies
Demand
Conversion
Transmission & Distribution
Supply: Resource Extraction
Information Pages
Technology Data
Cost Data
Environmental Impacts
Fields
Database Contents
Notes and References

141
However well-designed an analysis, its usefulness will depend on how well it is documented and
referenced. The Notes View in LEAP helps to address this problem, by providing a simple word
processing tool with built-in bibliographic references database. The Notes view encourages users to
document their data, assumptions and methods, both for their own use and for the use of colleagues
or other reviewers looking at the dataset. Notes can be entered at each branch of the tree data
structure, and subsequently printed or exported to Microsoft Word for use in reports.
National Starter Data
The SEI Energy Modeling team has created a set of national level "starter" data sets for LEAP. These
data sets compile international data together in a consistent manner as a starting point from which
developing country analysts can subsequently develop their own more detailed analyses. They are
designed to combine historical energy balance data provided by the IEA (International Energy Agency)
with various other data sources such as emission factors from the IPCC (Intergovernmental Panel on
Climate Change), population projections from the United Nations, development indicators from the
World Bank, non-energy sector GHG sources and sinks from the World Resources Institute and energy
resource data from the World Energy Council. More information on starter datasets is available at
http://www.energycommunity.org/default.asp?action=153.
Internationalization
LEAP and its associated training materials are already available in English, French, Spanish, Portuguese
and Chinese with many additional translations currently under development by volunteers. A menu
option within LEAP lets you immediately switch between any of its available language
translations. LEAP also allows data to be input and to be displayed in any regional numeric format.
Recent New Features and Advanced Modeling Capabilities in LEAP
Among some of the recent (2012-2013) additions to the capabilities of the LEAP system are:
Modeling of the energy-water nexus through links to SEI’s “WEAP” water model for integrated energy/water assessment.
The availability of flexible region and fuel groupings (used in new global mode). For example, SEI’s new global energy model, built in LEAP, modeled 22 global regions, while results were presented aggregated across 22, 10, 6 and 3 macro regions.
Improved ease-of-use (many screens redesigned and simplified).
New demand modeling methods.

142
More options for formatting charts that can be exported in high resolution for direct use in reports.
Improved optimization calculations, including support for specification of a Renewable Portfolio Standard, and ability to specify maximum and minimum capacity constraints and annual addition constraints.
Better treatment of externality costs.
An improved Manage Areas screen: better tools for managing data sets.
LEAP now allows up to 400 user-defined variables (up from 30). The visibility of these can be set so they appear only at certain branches and in certain scenarios. They can also be color coded and have default expressions set for Current Accounts and Scenarios.
Better support for previously committed (residual) capacity.
Now supports Mixed Integer Linear Programming to accurately simulate discrete capacity additions.
Supports 64 bit version of GLPK – faster and less prone to out-of-memory errors
Supports 20, 100 and 500 Year GWP (global warming potential) factors, and includes a library of GWP factors from all four IPCC assessment reports.
In addition to its use as a stand-alone modeling system, LEAP can also be integrated into a larger
network of models using its standard Application Programming Interface (API). The API allows LEAP
to be controlled using any standard object-oriented programming language, such as Visual Basic, C or
Java. Programs can control how LEAP runs, insert and edit data, extract results or even
programmatically alter data structures in LEAP. LEAP even includes its own built-in scripting tool,
which you can user to create Visual Basic scripts that control LEAP.
Indicators
In addition to its modeling capabilities, LEAP can now also be used as a tool for calculating, evaluating
and displaying many social, economic, and energy-related development indicators. A range of
functions are available that make it easy to create composite normalized indicators that compare
results across regions or that evaluate the performance of alternative scenarios. A wide variety of
indicators can be generated including 5 and 10 star scores, rankings and z-scores.
Hardware and Software Requirements
LEAP is a single-user system that operates on any PC using Windows 2000, XP, Vista, Windows 7 or
Windows 8. It requires a 400 MHz or better CPU with a minimum of 128 MB of RAM. An Internet
connection is not required but is useful for online access to updates, technical support and additional
143
data sets. Similarly, LEAP is designed to work closely with Microsoft Office applications although
these are not required. Additional experimental information about using LEAP within the WINE
environment, which allows it to operate also on Linux and Apple computers, is available at
http://www.energycommunity.org/default.asp?action=183.
Documentation and Help
LEAP includes extensive documentation and context-sensitive help. The help system, which contains
over 300 pages of help, can be accessed from anywhere in the program using standard help keys or a
point-and-click “What’s this?” help system. In addition, succinct “balloon help” messages are
available for all on-screen elements (buttons, menu options and all variables). LEAP even includes a
tip-of-the-day feature, which helps users to deepen their knowledge as they use LEAP.
Training and Capacity Building
LEAP is one of a very few integrated energy-environmental planning tools that have been consistently
updated, used, and supported over many decades. From its origin in the late 1970s and early 1980s
as a mainframe tool for the Beijer Institute's Kenya Fuelwood Project, through it’s development as a
tool for personal computers starting in 1985 and its first Windows-based edition in the early 2000s,
LEAP’s continued development has drawn financial support from international organizations, and
national aid agencies in recognition of its global utility as a planning tool and a focus for capacity-
building. LEAP’s design as a comprehensive decision support system, has allowed it to develop a
reputation among its users for presenting complex energy analysis concepts in a transparent and
intuitive way. "LEAP is the only substantial energy modeling software that is reasonably accessible to
energy consultants who are not modeling specialists," says Mark Borchers, Director of Sustainable
Energy Africa.
For over twenty years LEAP has been an important tool in the training and capacity building
programmes of many national and international institutions in all major regions of the world. SEI has
created a range of training materials designed to support these efforts. These have been translated
into various languages and have been applied by SEI and its partners in a huge number of seminars
and training workshops worldwide. The training materials are designed to draw out typical energy-
environment policy dilemmas, and to encourage trainees to think about the tradeoffs inherent in
different policy options.
Information Resources

144
COMMEND, the Community for Energy Environment and Development (www.energycommunity.org),
is a web-based initiative designed to foster a community among developing country energy planners
and to provide support to users of LEAP and other energy modeling tools. The site is open to all at no
charge. COMMEND includes discussion forums
(http://www.energycommunity.org/default.asp?action=48) where users can receive LEAP technical
support from SEI and other expert LEAP users. The site also has links to reference materials including
descriptions of LEAP applications, (http://www.energycommunity.org/default.asp?action=45), an
online library of useful data sources and guidebooks for energy analysis, which also provides access to
energy and related studies done with LEAP and other tools, is available at
http://www.energycommunity.org/default.asp?action=73, and a publications database is available at
http://www.energycommunity.org/default.asp?action=172. The COMMEND website provides a
variety of different resources designed to aid the user in energy and environmental modeling projects.
A listing of many of the different models available is provided as
http://www.energycommunity.org/default.asp?action=71. . A listing of courses offered around the
world courses that may be of interest to those studying energy, environment and sustainability issues
is provided as http://www.energycommunity.org/default.asp?action=81. The reader is urged to
access the COMMEND website for additional information.
Dissemination
LEAP and all of its associated training materials and documentation are distributed free of charge to
academic, governmental and not-for-profit organizations based in the developing world. These
training materials (see http://www.energycommunity.org/default.asp?action=42) and user guides
(http://www.energycommunity.org/default.asp?action=41) are available for download at the
COMMEND website along with information on licensing
(http://www.energycommunity.org/default.asp?action=43) arrangements for other types of
organizations. A user name and password are required to fully enable LEAP. These are made
available on completion of a license agreement, which all users are expected to sign.
Technical Support
In addition to the included help files and other materials, LEAP offers features allowing users to send
LEAP datasets to SEI-US and to others as desired for review and help. In addition, as noted above, the
COMMEND website includes discussion forums where users can receive LEAP technical support from
SEI and other expert LEAP users. Support for LEAP is also available from SEI via email at leap@sei-
us.org.

145
While LEAP is designed to be as user-friendly as possible and is, we believe, significantly easier to use
than other energy modeling tools, nevertheless it remains a relatively complex tool. Most users will
typically need training for about one week before they can use it effectively. Training is available
through SEI and its regional partner organizations. We do organize regular LEAP training workshops in
various regions of the world (see http://www.energycommunity.org/default.asp?action=104). Please
check the COMMEND web site for news of these. Alternatively, please contact SEI ([email protected])
to request a quotation for a training workshop for a particular country or organization.
Citing LEAP
Guidelines on how to properly cite LEAP in published research are available at
http://www.energycommunity.org/default.asp?action=171.
LEAP Team Contacts
For more information about LEAP or COMMEND, please contact:
The COMMEND Team
Stockholm Environment Institute - US Center
11 Curtis Avenue, Somerville, MA 02144, USA
Email: [email protected]
Web: www.sei-us.org
Phone: +1 (617) 627-3786