Embed Size (px)
Citation preview

Strategies for Estimating Behavioural Frequency in
Survey Interviews
Frederick G Conrad
US Bureau of Labor Statistics
Norman R Brown
University of Alberta Canada
Erin R Cashman
University of Illinois USA
When people answer survey questions of the form ``During the past month how
many times did you rsquo rsquo their responses provide valuable data for researchers and
policy makers Yet the way respondents produce their answers to these
``behavioural frequency quest ionsrsquo rsquo is not well unders tood This article
demonstrates that survey respondents can use an array of distinct estimation
strategies depending on what information is available in their memories The kind
of event information that people use is related to factors such as the regularity of
occurrence similarity of one episode to the next and frequency In a study
conducted as a telephone survey respondentsrsquo verbal reports and response-time
patterns indicate that they usually answer behavioural frequency questions by
either retrieving and counting episodes re trieving or estim ating rates of
occurrence or converting a general impression of frequency into a numerical
quantity The third strategy should be of particular concern to survey researchers
because respondents provide a quantitative estim ate without any relevant
numerical knowledge The set of strategies and the factors that influence their
use are integrated into a statistical model that could help survey practitioners to
improve data quality and memory researchers to broaden their perspective
MEMORY 1998 6 (4) 339plusmn366
Requests for reprints should be sent to Frederick Conrad Bureau of Labor Statistics 2
Massachusetts Avenue NE Suite 4915 W ashington DC 20212 USA Email Conrad_Fblsgov
We are grateful to Brian Harris-Kojetin Steve Miller and Clyde Tucker for their invaluable
statistical advice W e thank Jim Kennedy Paul Mullin Stanley Presser Dan Wright and an
anonymous reviewer for discussing earlier versions of the manuscript We also thank David Cantor
James Doree Marj Flemister Clyde Tucker and Jon Truswell for logistical and methodological
assistance The views expressed here are those of the authors alone and do not necessarily reflect the
views of their institutions This research was supported in part by an NSERC operating grant awarded
to the second author
Oacute 1998 Psychology Press Ltd
INTRODUCTION
People estimate various frequencies on an everyday basis For example when
people seek medical treatment they are typically asked to describe the
frequency of their symptoms When they consider moving to a new
neighbourhood they might assess how frequently they have heard about crime
in that area When they purchase a new product one consideration might be how
often they believe they will use the product This article concerns the way people
estimate the frequency of autobiographical events when asked about their
behaviour on survey questionnaires We report the results of a study conducted
as a telephone survey in which respondents were timed as they answered
questions about the frequency of their own behaviour After answering each
question they described how they arrived at their answer and then rated the
regularity and similarity of the target events
So-called behavioural frequency questions are usually of the form ``During
the last month how many times did you pay to see a moviersquo rsquo where both the
time frame and event category can vary The responses to these questions have
widespread political and economic implications so there is social value in
understanding how they are formulated For example the monthly unemploy-
ment rates reported by the US government are based in part on responses to
behavioural frequency questions on federal surveys In addition there are good
methodological reasons for studying performance on this task It is a relatively
familiar task for most people and it is carried out in naturalistic settings with
stimuli (autobiographical events) that have personal meaning yet answering
behavioural frequency questions can be studied with some experimental control
There are relatively distinct bodies of literature on how people answer
behavioural frequency questions in survey situations and how they estimate
frequency in laboratory tasks Survey methods researchers (eg Blair amp Burton
1987 Burton amp Blair 1991 Means amp Loftus 1991 Menon 1993) have focused
their studies on the use of two response strategies episode enumeration
(counting all retrieved instances of the event category within the specified time
period) and rate-based inferences (recalling that the behaviour happens once a
week and reasoning that it must therefore have occurred four times in the last
month) Certain conditions promote the use of one strategy over another and
these have been manipulated experimentally (eg Blair amp Burton 1987) This is
essentially a dual-strategy view in which responses are based on either counts of
retrieved episodes (enumeration) or retrieved rates of occurrence In this article
we present evidence that people use additional strategies for answering these
questions but the important point is that survey respondents are assumed to be
capable of using multiple strategies
In contrast individual laboratory studies have tended to focus on the use of
individual strategies For example Tversky and Kahneman (1973) demonstrated
that people use the ease of retrieving instances as a key to frequencyETH the
340 CONRAD BROWN CASHMAN
availability heuristic Hintzman (1988) modelled frequency judgements as a
comparison of a target itemrsquo s similarity to exemplars in memoryETH a similarity
principle Barsalou and Ross (1986) provided evidence that subjects retrieve and
count category instances when reporting category frequencyETH an enumeration
strategy Although many memory researchers have noted that subjects may
estimate frequency in more than one way (Begg Maxwell Mitterer amp Harris
1986 Bruce Hockley amp Craik 1991 Hintzman 1976 Howell 1973 Johnson
Raye Wang amp Taylor 1979 Jonides amp Jones 1992 Jonides amp Naveh-
Benjamin 1987 Voss Vereb amp Bisanz 1975) the data from laboratory studies
point primarily to the use of individual strategies In a series of laboratory
studies that are in many ways analogous to the current survey-format study
Brown (1995) illustrated that individual subjects used multiple strategies to
assess the frequency of items that they had recently studied He used a
combination of verbal protocols and response times to differentiate the
strategies
In the current article we present a study of how respondents answer
behavioural frequency questions which is intended to integrate and extend
findings from these two bodies of literature We identify a range of strategies
that differ in their conditions of use as well as in their underlying processes and
we suggest that respondents use whichever strategy is best served by the
available information
THE MULTIPLE STRATEGY PERSPECTIVE
Our central idea is that people estimate frequency based on the contents of their
memory or in the absence of relevant content the state of their memory In
order to count episodes they must be able to retrieve episodes in order to infer
frequency based on typical rate of occurrence they must be able to retrieve rate
information When they cannot retrieve this type of information they may be
able to use qualitative impressions of frequency such as ``that happened a lotrsquo rsquo
converting the impression into a numerical estimate When none of this
information is directly available people can evaluate the state of their memory
to derive frequency information We term this memory assessment The
availability heuristic (Tversky amp Kahneman 1973) is a good example The more
difficult it is to retrieve instances the less frequent they are assumed to be In
principle one can almost always assess the state of onersquo s memory regardless of
whether episodes rates or other relevant information can be retrieved
Consequently we view memory assessment strategies as default procedures
This view implies that if one could know the value of certain variables one
could at least rule out the use of certain strategies For example in order to
enumerate episodes one needs to be able to distinguish one remembered episode
from the next Remembered episodes will be relatively distinguishable if they
occur on an irregular schedule and do not have similar characteristics If one can
STRATEGIES FOR ESTIMATING FREQUENCY 341
determine just how distinctive one episode is from another it would be possible
to determine whether an enumeration strategy is feasible We discuss certain
variables that have been associated with event distinctiveness later
From a practical viewpoint this means survey researchers may be able to
determine what strategies respondents are capable of using and to rule out
others because the necessary information is lacking This may be useful for
example in evaluating response accuracy An enumeration strategy is more
likely to lead to underreporting than overreporting because people are more
likely to forget individual episodes than to recall episodes that either did not
happen or occurred outside the relevant time interval (Sudman amp Bradburn
1974) A methodological intervention that increases reported frequency can be
assumed to be increasing response accuracy if one can be sure respondents
are enumerating However if the episodes about which they are questioned
are not distinctive then enumeration is unlikely and the assumptions about
accuracy may need to be questioned (Note that we do not address response
accuracy in this article but concentrate instead on the processes that underlie
frequency estimates)
Although the multiple strategy view leads to clear predictions about when
certain strategies will not be used it is less decisive about when a particular
strategy will be used This is because more than one kind of relevant
information may be available For instance a film enthusiast might know that
he or she goes to the movies twice a week (rate information) and might also
be able to recall the names and plots of the last several movies attended
(episode information) either source of information could be sufficient for an
estimate so the issue is which source respondents will use Fortunately there
are a number of factors known to affect strategy choice and the way these
factors tend to combine makes one strategy more likely to be used than
another Later in the article we report a statistical analysis in which we
examined the combined effect of several variables on the use of particular
strategies
Factors That Affect Strategy Use
Several factors are known to affect strategy use Blair and Burton (1987) and
Burton and Blair (1991) point to the importance of actual frequency in
predicting strategy use They found that episodes tend to be enumerated when
frequency is low that is when there are relatively few episodes to recallETH
rate information tends to be used when frequency is higher Frequency was
manipulated by eliciting judgements for either one-month or six-month
reference periods the idea being that frequency is greater for longer time
periods They also found that the time allocated to respond affects strategy
selection more time led to more episode enumeration Finally question
wording had a weak effect on response strategy ``How often rsquo rsquo produced
342 CONRAD BROWN CASHMAN
more responses expressed as rates than ``How many times rsquo rsquo In their
discussion the authors speculate that the regularity and distinctiveness of
events may affect strategy as well (Blair amp Burton 1987 p287 Burton amp
Blair 1991 pp64plusmn65)
The regularity with which events occur has subsequently been shown to
affect how respondents produce behavioural frequencies Means and Loftus
(1991) found that activities that presumably occur irregularly like visiting the
doctor for an injury led to frequency judgements based on recalled incidents
more than did activities like visiting the allergist which presumably occur on a
regular schedule They also showed that similar episodes (minor medical
conditions) were recalled less often than distinctive ones (serious medical
conditions) although they did not show that such activities led respondents to
use rate knowledge instead of enumerating episodes They did not measure
event regularity or distinctiveness and did not look at both variables together
Menon (1993) has systematically explored the effects of event regularity
and similarity on strategy choice In a series of studies she found that events
were primarily enumerated when event instances occurred on an irregular
basis and when subjects considered them to be distinctive (low in rated
similarity) Other levels of these event characteristics led to increased use of
rate knowledge Menonrsquo s perspective differs from our own in that she adopts
a strict dual strategy viewETH respondents either enum erate or use rate
information but there is no role for non-numerical strategies such as those
that involve general impressions or memory assessment However like Menon
(1993) we give considerable weight to the role of regularity and similarity in
strategy choice
Predictions
The multiple strategy perspective leads to several predictions First the
regularity with which instances of an event occur will be related to the use of
rate-based strategies and (indirectly) to the use of enumeration-based strategies
We assume that people are likely to acquire rate information when events occur
on a relatively regular schedule If someone performs a certain activity every
Thursday from 200 to 330 it is likely the person would become aware of this
In contrast it is unlikely someone would have weekly rate information available
for an event that may occur several times in one week and then not again for
several weeks We predict therefore that strategies based on rate information
will be used more often for regularly occurring than for irregularly occurring
events
Second regularity should reduce the accessibility of event instances This is
because a regularly occurring event has identical temporal characteristics each
time it takes place so people may poorly encode the separate episodes In other
words all else being equal instances of regularly occurring events should be
STRATEGIES FOR ESTIMATING FREQUENCY 343
more similar to one another than instances of irregularly occurring events In
turn this implies that instances of regularly occurring events should be more
difficult to retrieve than instances of irregularly occurring events and hence less
likely to evoke enumeration Thus there are two reasons for predicting that rate-
based responses will be more common for regularly occurring events such
events promote the encoding of rate information and the decontextualisation of
individual events
A number of autobiographical memory studies (eg Barclay amp Wellman
1986 Brewer 1988 Linton 1982 Neisser 1986 Wagenaar 1986) have
demonstrated that events judged to be similar to many others are hard to recall
and recognise Highly similar episodes lead people to represent common
features of those episodes but not features that distinguish one from the next
(Neisser 1981 Strube 1987) Therefore our second prediction is that
enumeration should be rare when instances of a target activity closely resemble
one another and should be used more often as the episodes become more
distinctive and hence are easier to retrieve
Our third prediction concerns the times to answer a frequency question In
the current study response times are used as a means of corroborating the
subjectsrsquo retrospective strategy reports We assume that it takes a fixed
amount of time to retrieve one episode so that the more episodes retrieved
the longer the response time (Bousfield Sedgewick amp Cohen 1954 Brown
1995) In contrast we assume that people associate rate knowledge with
particular event categories and (as a result) it is directly retrievable It should
take no more time to retrieve a rate of once a day than of once a month all
else being equal Our third prediction therefore is that response times should
increase with estimated frequency when respondents enumerate episodes but
there should be no relation between response time and estimated frequency
when they use a rate Similarly there is no reason a priori why response
times should be related to estimated frequency when respondents use
heuristics like availability
In summary we are predicting that enumeration will be relatively common
when event instances are distinctive and occur at irregular intervals and that
rate-based responses will be prevalent when the events occur at regular intervals
We are also predicting that response times will increase with reported frequency
when people enumerate and that they will not when people rely on rate-based
strategies Note that although we assume that respondents have multiple
strategies available to them we have focused our predictions on enumeration
and rate-based strategies There is little empirical evidence about what other
strategies respondents might use to answer frequency questions on surveys In
light of this our study has an exploratory character to it as well We designed the
study to identify these additional strategies and to examine which factors
(among similarity regularity reported frequency and response time) are related
to their use
344 CONRAD BROWN CASHMAN
METHOD
Design
The study was conducted as a telephone survey Three experienced interviewers
asked 106 respondents to estimate the frequency of 10 autobiographical events
and to rate the regularity and similarity of those events1
The respondents were
contacted from a sample of 250 telephone numbers These numbers were
randomly drawn from a nationally representative sample based on rural and
metropolitan areas of the United States and stratified by Census region and
population If potential respondents declined to participate interviewers did not
attempt to persuade them to take part Each interview was audiotaped with the
respondentrsquo s consent
Procedure
The respondents were presented with four tasks First they were asked to answer
10 behavioural frequency questions (see Table 1) They were told to think
silently before answering and to take as much time as they needed but to
respond as soon as they had made up their mind Second after answering each
question the respondents were asked to explain how they came up with the
answer that is they were asked for a retrospective protocol (Ericsson amp Simon
1993)2
The interviewers occasionally probed if they felt the protocol was not
informative
In the third task the interviewers presented the 10 events in the Table 1
questions and asked respondents to rate the regularity of each on a 4-point scale
Respondents were told that if they engaged in an event on a routine schedule it
was Very Regular (4) if they never engaged in it on a routine schedule it was
Very Irregular (1) The intermediate response options were Somewhat Regular
(3) and Somewhat Irregular (2) The respondents were explicitly instructed not
to confuse (in)frequent events with (ir)regular events The fourth task required
respondents to judge the similarity of the events on a 4-point scale They were
told that if their experiences were virtually the same each time they engaged in a
behaviour then they should rate it Very Similar (4) if each encounter with the
event seemed like a totally unique experience then it should receive a Very
Different (1) rating For similarity ratings between these extreme values
respondents were given the option of Somewhat Similar (3) and Somewhat
1The event categories were chosen to vary in the similarity and regularity of their individual
instances on intuitive grounds however this was not systematically controlled or evaluated and is
not discussed further2
We collected retrospective as opposed to concurrent protocols in order to obtain strategy reports
that did not affect the time of the response in the first task Although retrospective protocols can be a
less direct measure of mental process they do not interfere with the primary task as concurrent think-
aloud methods can (Schooler Ohlsson amp Brooks 1993)
STRATEGIES FOR ESTIMATING FREQUENCY 345
Different (2) We settled on the number of points and the particular verbal labels
for both the regularity and similarity scales after pilot testing the rating tasks
This approach to assigning similarity and regularity ratings to stimulus events
differs from others in the literature In particular Menon (1993) collected ratings
from independent judges and established a set of stimuli that were rated either
high on both regularity and similarity low on both or high on one and low on
the other A particular event was then considered fixed in these characteristics
for all respondents This was effective under Menonrsquo s approach in part because
her stimulus events were relatively fine-grained (eg snacking washing onersquo s
hair) and her subjects were of relatively uniform demographics (undergraduate
students) Our stimulus events were somewhat more complicated (eg
performing a transaction with a teller in a bank) and our respondents more
diverse demographically (a stratified national sample) This means that in our
sample two different respondents might experience events quite differently
Consider a social security recipient who deposits her cheque at the bank each
month when it arrives and interacts with the same teller each time This event
would be quite regular and similar In contrast a busy professional whose salary
is directly deposited and whose transactions are primarily with an automated
teller machine would be likely to interact with a human teller irregularly
(although each interaction may be similar to the next) Under our approach an
eventrsquo s regularity and similarity were based on within-subject judgements This
meant that one respondent could judge an event to be Very R egular and another
respondent could rate the same event Very Irregular and subsequent analyses
could take into account such individual differences For this reason average
regularity and similarity ratings are not particularly important in our analyses
Three different random orders of the events were generated for each
respondent one for eliciting the frequency reports and retrospective protocols
one for the regularity rating task and one for the similarity rating task A single
TABLE 1Stimulus Questions
During the last month how many times did you
1 conduct a transaction with an Automated Teller Machine
2 perform a transaction with a teller in a bank
3 shop in a grocery store
4 shop in a department store
5 purchase gas for your car
6 pay to have your car repaired
7 receive subscription magazines by mail
8 receive catalogues by mail
9 eat ice cream
10 eat spicy food
346 CONRAD BROWN CASHMAN
reference period of one month was used for the frequency questions Our pilot
study indicated that respondents found it disruptive to shift reference periods
between questions and that zero responses were relative infrequent across the
events for this time frame
Response Coding The authors listened to a subset of taped interviews and
developed a preliminary taxonomy for the response strategies that were evident
in the protocols Two groups of two coders then classified the complete set of
protocols reaching each coding decision by consensus within a group and
expanding the coding taxonomy as needed Because the groups consistently
disagreed on how to code one event (receiving subscription magazines) it was
eliminated from further analysis In a first pass at coding the protocols the inter-
group reliability for the nine remaining items was 75 All discrepancies were
then resolved through discussion between the groups so that subsequent analyses
were based on complete agreement The final set of strategies is presented in
Table 2
Response Times The duration of each taped response was measured from
completion of the question by the interviewer to initiation of the spoken
frequency by the respondent Response times included the durations of
extraneous speech prior to the actual frequency for example qualifiers such
as ``Irsquo d say about rsquo rsquo and verbalisations of respondentsrsquo thinking such as
``Well I do it twice a week so rsquo rsquo The durations were measured by both
groups of coders As their measurements were highly correlated (r = 97 P lt 01
n = 950) only one set of times was further analysed About 9 of these
TABLE 2Major Response Categories and Percentage of Observations
R esponse Strategy Percentage of Observations
Non-zero R esponses
1 Episode Enumeration 27
2 Rate Retrieval 15
3 Rate Estimation 12
4 Rate and Adjustment 9
5 General Impression 18
6 Uncodable 18
n = 660
Zero Responses
7 Attempted Enumeration 15
8 Rate Retrieval 80
9 Uncodable 5
n = 265
STRATEGIES FOR ESTIMATING FREQUENCY 347
observations were excluded because respondents asked for clarification or were
disrupted before responding
RESULTS AND DISCUSSION
The overall response rate was 42 which is somewhat low for most surveys
However the research procedure could have been at least partially responsible
14 of those contacted were willing to be interviewed but not willing to be tape
recorded3
It is possible that some of those people who were contacted but
declined to participate could have been persuaded to take part however to
reduce interview time and associated cost the interviewers were instructed not
to engage in such ``conversionrsquo rsquo activities
Response Strategies
Response strategies were classified separately for frequency reports of zero
(26) and all other values (74) Looking first at the non-zero responses 18
of the protocols were uncodable A total of 96 of the remaining data was
assigned to one of five response strategy categories episode enumeration rate
retrieval rate estimation rate and adjustment general impression To a certain
extent all but episode enumeration rely on information about the general event
category rather than individual episodes and so might be reduced to a single
rate strategyETH and this is what is typically done (eg Burton amp Blair 1991
Hubbard 1992) However the protocols suggested that the underlying processes
were different so the five distinctions were maintained The remaining 4 of
the codable protocols were assigned to the category of item enumeration (in
particular listing the catalogues typically received in answering the catalogue
question) These are not considered further because they were rare and diverged
from the phenomenon of interest in that respondents were not concerned with
events but rather with items
Based on reports in the literature we expected evidence in the protocols of
both episode enumeration and of some kind of rate strategies and both were
observed 27 of the protocols were coded as episode enumeration and 36
were coded as some type of rate-based strategy An example of an episode
enumeration protocol in response to the question about gas purchases is
``Three Today and about ten days ago on a job and one other time when I
was practically emptyrsquo rsquo We subdivided the rate-based responses into rate
retrieval (15) rate estimation (12) and rate and adjustment (9) By rate
3The kind of response-time methodology promoted by Bassili (1993 Bassili amp Fletcher 1991)
would be of some help under these circumstances because it times telephone responses ``liversquo rsquo as
opposed to measuring recorded responses However our procedure involved coding retrospective
strategy reports which requires a permanent record of the report For this reason we tape recorded the
interviews
348 CONRAD BROWN CASHMAN
retrieval we are referring to rate information stored some time prior to the
interview eg ``Four I go grocery shopping on Fridaysrsquo rsquo Rate estimation refers
to those observations for which respondents compute rate informationETH as
opposed to retrieving itETH while answering the question A rate estimation
protocol referred to the respondentrsquo s knowledge that the event occurred
regularly but with an uncertain frequency that frequency was somehow
constructed in the response process An example in response to the automated
teller machine question is ``Eight Last week I went twice so in the last
month that would be eightrsquo rsquo
Respondents were considered to use the rate and adjustment strategy when
they relied on rate information (we did not distinguish between retrieved and
estimated rates for this strategy) and adjusted up or down to account for
exceptions to the rate An example from the question about grocery shopping is
``Eight Once a week regularly and four more times for spontaneous
itemsrsquo rsquo
In addition to episode enumeration and the several rate-based strategies we
observed evidence in 18 of the protocols that respondents relied on general
impressions The key characteristic of general impression reports is that
respondents use a coarse sense of magnitude to infer a specific frequency This
was usually indicated by so-called vague quantifiers (Wright Gaskell amp
Orsquo Muircheartaigh 1994)ETH magnitude terms that have quantitative implications
but are not explicitly numerical for example ``all the timersquo rsquo or ``a lotrsquo rsquo
Consider the following report in response to the question about bank teller
transactions ``Eight Wersquo re in the process of buying a house so Irsquo ve been
going there a lotrsquo rsquo This strategy is fundamentally different from enumeration
(and its variants) and rate-based responding (and its variants) in that respondents
who lack any numerical frequency information can provide a numerical
response by converting their impressions of frequency to a number
Turning now to the zero responses 26 of all reported frequencies were
zero Of these 5 were uncodable The protocols for the remaining 21 of
the responses indicated that respondents use two strategies to determine that
that they have not engaged in an activity over a given time frame In
particular the protocols contained evidence of attempted enumeration and rate
retrieval Protocols were coded for attempted enumeration if there was
evidence that a memory search failed to locate any episodes within the time
period For example a protocol provided in response to the ice cream
question was ``Zero Trying to remember if my wife had bought any this
month She hasnrsquo trsquo rsquo These were apparent for 15 of zero responses For
80 of zero responses respondents indicated that they never engage in the
activity or simply knew they had not done so in the previous month These
protocols were coded for rate retrieval For example in answering the
question about ATM activity one respondent reported ``None I donrsquo t use
themrsquo rsquo
STRATEGIES FOR ESTIMATING FREQUENCY 349
Regularity and Similarity Ratings
Consistent with findings reported by Menon (1993) regularity and similarity
had clear effects on the choice of response strategy Mean regularity and
similarity ratings for the major response strategies are presented in Table 3
Looking first at non-zero responses regularity varied with the five response
strategies F(4424) = 1741 P lt 01 MSE = 12854
When respondents enumer-
ated episodes they judged events to be less regular than when they retrieved
rates F(1424) = 5485 P lt 01 MSE = 4049 confirming our first prediction
Moreover regularity ratings on trials exhibiting episode enumeration were lower
than for all other strategies F(1424) = 6258 P lt 01 MSE = 4620 by a ScheffeAcirc
test This last effect underscores the idea that events are enumerated primarily
when they occur on an irregular basis Finally frequency reports relied on
general impressions when events were less regular than for the three strategies
involving rates F(1424) = 1354 P lt 01 by a ScheffeAcirctest It seems therefore
that like enumeration general impressions are used in the absence of rate
information However as is described in the next section the frequency
conditions under which enumeration and general impressions are used are
different
Similarity showed much the same pattern as regularity Overall similarity
varied with response strategy F(4423) = 439 P lt 01 MSE = 304 In particular
similarity ratings for episode enumeration were lower than for rate retrieval
4All ANOVA results reported here are based on models that include a subject term and an item
term as classified variables The subject term is included to account for repeated measures effects and
the item term is included to account for item effects All contrasts reported on the basis of ANOVA
are planned unless otherwise noted
TABLE 3Mean Regularity and Similarity Ratings for the Major Response Strategies
R esponse Strategy R egularity Similarity
Non-zero R esponses
1 Episode Enumeration 239 286
2 Rate Retrieval 366 354
3 Rate Estimation 343 331
4 Rate and Adjustment 365 343
5 General Impression 291 311
Zero R esponses
6 Attempted Enumeration 185 246
7 Rate Retrieval 140 216
1 = very irregular 4 = very regular
1 = very differen t 4 = very similar
350 CONRAD BROWN CASHMAN
F(1423) = 1254 P lt 01 MSE = 870 confirming the second prediction
Similarity ratings were lower for episode enumeration than for all of the other
strategies F(1423) = 1642 P lt 01 MSE = 1139 by a ScheffeAcirctest consistent
with the idea that enumeration is used primarily when episodes are quite
dissimilar and consequently differentiated in episodic memory
Both event characteristics varied with the strategies observed for zero
responses Events were judged less regular for rate retrieval than for attempted
enumeration F(1144) = 525 P lt 05 MSE = 248 though both mean ratings are
very low (140 and 185 respectively) Knowing that the event of interest has not
occurred in the reference period respondents may well be mapping their belief
that the event could happen in a given month onto the regularity rating scale By
this view the more plausible it is that an event might occur the more regularly it
is judged to occur Similarity ratings are low in general but lower for rate
retrieval (216) than for attempted enumeration (246) F(1141) = 439 P lt 05
MSE = 304 One explanation is that respondents treat the low end of the
similarity scale as a ``uniquenessrsquo rsquo scale where lower values are more unique
events that are known never to occur would be extremely unique (low similarity)
if they were somehow to occur and events that can plausibly occur would share
some characteristics when they do in fact take place making them less unique
(higher similarity)
Regularity and similarity were correlated across the entire data set that is for
both non-zero and zero responses (r = 48 P lt 01 n = 936) Although one can
imagine scenarios in which regularity and similarity are independent their
correlation is consistent with our earlier contention that events that occur on a
regular schedule are experienced much the same from one episode to the next
even if they differ in all other characteristics each occurrence of a regularly
occurring event is temporally similar to the next
Frequency
Another factor that has been shown to affect which estimation strategies
respondents choose is the approximate level of an eventrsquo s frequency In
particular subjects are more likely to enumerate low-frequency than high-
frequency events in arriving at frequency reports presumably because the effort
of retrieving individual episodes increases with the number of episodes (Blair amp
Burton 1987 Burton amp Blair 1991 Means amp Loftus 1991) This is replicated
in the current study Mean frequencies and times for five strategies are presented
in Table 4 Overall frequencies vary with strategy F(4425) = 1099 P lt 01
MSE = 115309 In addition frequency for episode enumeration is lower than for
rate retrieval F(1425) = 1627 P lt 01 MSE = 170740 and for all other
strategies F(1425) = 4118 P lt 01 MSE = 432143 by a ScheffeAcirctest
The observation that respondents primarily enumerate low-frequency events
(23 occurrences per month on average) may well be related to the presence of
STRATEGIES FOR ESTIMATING FREQUENCY 351
contextual information for these events In order to retrieve events there must be
some information to distinguish one event from another Context can play
exactly such a distinguishing role Because of their repetition high-frequency
events may become decontextualised (Bahrick amp Karis 1982 Linton 1982
Strube 1987) and so cannot easily be retrieved
Respondents used general impressions to report the highest average estimates
(123 occurrences per month) This is consistent with a finding by Bruce (Bruce
amp Reed 1988 Bruce amp Van Pelt 1989) concerning estimates of event
frequency on a bicycle trip The relationship between general impressions and
high frequency estimates can be explained if we assume that repeated
occurrences allow respondents to directly albeit imprecisely encode the fact
that particular episodes are frequent For example the frequency stored for a
repeated event might be ``a lotrsquo rsquo Infrequently occurring events would be less
likely to lead to the impression that the behaviour is rare because there is simply
less opportunity to form this impression Because respondents do not have
precise rate information available when they use a general impression strategy
(these events receive the second lowest regularity ratings) all they can do is
convert their impression that frequency is high to a relatively large number
Figure 1 presents the percentages of different frequency responses for episode
enumeration rate retrieval rate estimation and general impression strategies
The primary thing to notice is the peaks when respondents enumerated episodes
(Fig 1a) their estimates were usually small with the number of larger estimates
dropping off quickly The peaks for rate retrieval (Fig 1b) and rate estimation
(Fig 1d) strategies primarily reflect weekly activity The peaks at four eight
and twelve (over the two strategies) suggest that respondents had access to
weekly rate information and then multiplied these weekly rates by four (the
number of weeks in a month) Although rate retrieval and rate estimation both
TABLE 4Mean Frequency and Response Times for the Major
Response Strategies
R esponse Strategy Frequency Time (in seconds)
Non-zero R esponses
1 Episode Enumeration 23 452
2 Rate Retrieval 78 436
3 Rate Estimation 111 728
4 Rate and Adjustment 119 667
5 General Impression 123 617
Zero R esponses
6 Attempted Enumeration 0 387
7 Rate Retrieval 0 158
352 CONRAD BROWN CASHMAN
FIG
1
Fre
quency
of
repo
rted
valu
es
for
four
stra
tegie
s(a
)ep
isod
een
um
era
tio
n
(b)
rate
retr
ieval
(c)
genera
lim
pre
ssio
n
and
(d)
rate
est
imati
on
353
show evidence of converting weekly inform ation to m onthly figures
respondentsrsquo verbal protocols suggest that the underlying rates have different
origins for these two strategies Retrieved rates are so named because they
appear to be stored estimated rates appear to be the result of partial
enumeration This distinction is further supported by the reaction time data
presented in the next section
When respondents answered on the basis of their general impressions (Fig
1c) their estimates were often divisible by five This has the appearance of
rounding (Huttenlocher Hedges amp Bradburn 1990) It would make sense for
respondents using the general impression strategy to produce rounded estimates
because they need to convert their impressions which are qualitative into
numbers one way to do this is to report a prototypical quantity for the available
verbal description for example quantifying an impression of ``pretty oftenrsquo rsquo as
``10rsquo rsquo In this domain (as in many others) such prototypical values tend to be
divisible by five One reason that a respondent would map an impression to such
a value is that he or she is probably more likely to think of a prototypical than a
non-prototypical quantity Moreover to provide a non-prototypical quantity say
11 would imply a level of precision that a prototypical value would not
necessarily convey because the conversion from an impression to a number is
inherently imprecise respondents may be more inclined to report the rounded
value
Response Times
Not only do frequency reports vary with response strategies but they are related
to response times in different ways for the various strategies Response times
have been examined in behavioural frequency studies in relation to accuracy
(Burton amp Blair 1991) and as an indicator of effort (Menon 1993) In the
current study response times provide detail about how the different strategies
are executed In particular we predicted that as frequency reports based on
enumeration increase the latencies for those reports should increase but
frequency and time should not be associated for rate-based reports
As predicted the time to report a frequency using this strategy increases with
the size of the frequency (r2= 25 P lt 01) Also as predicted there is no
relationship between response time and frequency when respondents answered
by retrieving a rate Regression equations in which response time is a function
of estimated rate are presented for five strategies in Table 5 The differences
between the functions for these two strategies indicate that for enumeration a
noticeable amount of time is associated with the retrieval of each additional
episode (about 84 seconds using the slope of the regression equation for
enumeration as an estimate) but for rate retrieval time does not change with the
size of rates the invariance of time with frequency for rate-based responses
suggests that access to rate information requires a fixed number of mental
354 CONRAD BROWN CASHMAN
operationsETH presumably a single retrieval There was also no relationship
between response time and the magnitude of the reported frequencies when
respondents used their general impressions Clearly general impressions are not
based on enumeration The pattern for this strategy could indicate that
impressions are retrieved fully formed Alternatively it could suggest that the
result of assessing onersquo s memory is a general impression We cannot distinguish
between these interpretations on the basis of the current data
When respondents based their estimates on rate estimation their response
time increased with the size of the estimates (r2
= 14 P lt 01) although the
relationship does not appear to be as strong as it is for episode enumeration (the
slope of the regression equation is 15) Median response times (for non-zero
responses) are plotted against reported frequency for episode enumeration and
rate estimation in Fig 2 If there were less than five observations for a particular
frequency that value was omitted from the plot Both curves show a linear
relationship between time and frequency although the curve for rate estimation
is clearly shallower than the curve for enumeration One explanation for a slope
of intermediate steepness is that rates are estimated by enumerating episodes for
a portion of the reference period for example a week the respondent then
generalises to the complete time period much as would be the case with rate
retrieval It is the extrapolation part of the strategy that would weaken the
relationship between frequency and time relative to that observed for pure
enumeration because it is possible for a single mental operation (presumably
multiplication) to produce a relatively large frequency report
No relationship between frequency and time is evident for rate and
adjustment Therefore rate and adjustment may resemble rate retrieval more
than rate estimation (where there was a positive relationship between time and
frequency) In both rate and adjustment and rate retrieval the information on
which respondents base their estimates is known to them a priori and is not
estimated through partial enumeration However because responses based on
rate and adjustment were generally slower than those based on rate retrieval
adjusting the rate seems to require extra time This suggestion is strengthened by
TABLE 5Regression Equations for Response Time as a Function of Estimated Frequency
R esponse Strategy Equation r2
P
Episode Enumeration time = 264 + 84 (reported frequency) 25 lt 0001
Rate Retrieval time = 423 + 02 (reported frequency) 00 ns
General Impression time = 608 + 01 (reported frequency) 00 ns
Rate Estimation time = 556 + 15 (reported frequency) 14 lt 0013
Rate and Adjustment time = 597 + 07 (reported frequency) 04 ns
Time is measured in seconds
STRATEGIES FOR ESTIMATING FREQUENCY 355
the observation that regularity and similarity judgements for the two strategies
are about the same indicating that they are used under comparable
circumstances
A homogeneity of slopes test confirms that the relationship between time and
frequency varies with response strategy F(4368) = 774 P lt 01 MSE = 7053
In particular the regression line for episode enumeration was steeper than that
fo r ra te retr ieval and general im pression F (1 368) = 2056 P lt 01
MSE = 18741 The line for rate estimation was also steeper than that for rate
FIG 2 Median response time as a function of reported frequency and response strategy
356 CONRAD BROWN CASHMAN
retrieval F(1368) = 620 P lt 05 MSE = 5647 by a ScheffeAcirctest but not as
steep as the episode enumeration line F(1368) = 1405 P lt 01 MSE = 12804
by a ScheffeAcirctest supporting the idea that the rate estimation strategy is indeed a
hybrid of episode enumeration and rate retrieval strategies These results suggest
that respondents may set a threshold for time spent enumerating and once this is
exceeded they extrapolate
Regardless of the reported frequency rate retrieval is faster than episode
enumeration F(1368) = 1235 P lt 01 This essentially replicates a pattern
found by Menon (1993) in which frequency responses for regular items were
faster than those for irregular items And it is also consistent with the finding by
Burton and Blair (1991) that inducing respondents to use more time in
responding increases the incidence of enumeration But a lesson of the current
study is that overall time tells only part of the story In arriving at a strategy
respondents are probably influenced by the number of discrete time-consuming
steps they will need to execute in order to respond
Finally the two strategies observed for zero frequencies have different
response times Rate retrieval responses were faster than attempted enumeration
F(1103) = 3077 P lt 01 MSE = 7835 A simple model for attempted
enumeration is that respondents search for a reportable episode for a reasonable
amount of time and abandon the search (report ``zerorsquo rsquo ) after that Based on the
regression equation for (non-zero) episode enumeration time to enumerate one
episode is about 35 secondsETH in the same ballpark as the mean response time of
39 seconds for attempted enumeration One reading is that subjectsrsquo threshold is
the time required to enumerate one item Rate retrieval responses were
particularly fast for zero reports faster in fact that non-zero reports based on
the same strategy This difference could arise if non-zero reports demand extra
time when a rate expressed in one temporal unit say weeks is applied to a
reference period expressed in other units say a month in contrast no such
extrapolation is required in order to know that an event never occurs and
therefore report zero
A Multivariate Approach to Strategy Choice
Each of the variables we have examined in the previous sections (regularity
similarity reported frequency and response time) is related to respondentsrsquo
choice of estimation strategy One problem with looking at these relationships
individually is that it is hard to see how they jointly lead a respondent to use a
particular strategy on a particular occasion For example low regularity leads
respondents to enumerate when frequency is low however low regularity leads
respondents to use their general impressions when frequency is high This
relatively simple example involves two variables and two strategies The
patterns become harder to describe when they involve three or four variables and
as many strategies In order to see how particular patterns of several variables
STRATEGIES FOR ESTIMATING FREQUENCY 357
are associated with the use of multiple strategies we performed a discriminant
analysis
Our primary purpose was to describe the combinations of variables that are
related to respondentsrsquo use of different strategies not to predict how individual
respondents would answer particular questions In fact two of the variables in
the analysis (response time and reported frequency) were measured as part of the
response process and could not be used for prediction purposes The idea was to
form equations from variables such as regularity similarity reported frequency
and response times and use these equations to tell us what strategy was most
likely to have been involved in answering each question It was then possible to
evaluate the agreement between the strategy classifications of the discriminant
analysis and those of our coders Good agreement would suggest that the
discriminant equations credibly describe the relationships between these
variables and strategy choice Recall that the coders judged what strategy was
used to answer a question solely from the content of the protocol whereas the
equations classified an observation solely on the basis of the discriminating
variables blind to the content of the protocol
In the interest of simplicity the analysis was limited to three strategies
enumeration rate retrieval and general impression These three appear to
involve the most distinct underlying operations whereas rate estimation and rate
and adjust strategies are basically variants of enumeration andor rate retrieval
The discriminant functions were developed under the assumption that any of the
three strategies could occur with equal probability
The functions were created to differentiate between these strategies on the
basis of five discriminating variables regularity similarity frequency response
time and an indicator variable that was equal to 1 if the estimate was divisible
by five and 0 if it was not The last variable was created because respondents
appeared to round their estimates to multiples of five when they relied on
general impressions
Two discriminant functions emerged from the analysis They were then used
to classify the strategy for each observation The results agreed with the codersrsquo
judgements on 65 of the observations As we have already noted regularity
and similarity are correlated We might therefore be able to remove one of
these variables without sacrificing classification power Similarly the indicator
variable that is concerned with divisibility by five is based on frequency and so
those two variables are not independent Therefore the functions might be
further simplified by removing one of these To construct more parsimonious
functions we performed a step-wise discriminant analysis This resulted in two
discriminant functions that included regularity response time and divisibility by
five
strategy = 22 regularity + 27 response time + 87 divisible by five
strategy = 98 regularity plusmn 31 response time plusmn 33 divisible by five
358 CONRAD BROWN CASHMAN
The first function is clearly driven by divisibility by five with moderate
contributions from the other discriminating variables It should therefore
discriminate the use of general impressions from the other strategies because of
the rounding that is typical when using this kind of non-numerical information
The second function is dominated by regularity with moderate contributions
from the other two terms This function should be effective at discriminating
between rate retrieval and episode enumeration because they are on opposite
ends of the regularity range (rate retrieval is highest episode enumeration is
lowest) The moderate response time effect in both functions should help to
distinguish between the use of general impressions on the one hand and episode
enumeration and rate retrieval on the other The average response time for
general impressions is 617 seconds and the average times for episode
enumeration and rate retrieval are 452 and 456 seconds respectively
These reduced functions were almost as effective at classifying strategy for
each response as were the more complicated functions the agreement between
the functions and coders was 644 The agreement for each of the strategies is
presented in Table 6 We interpret this as a reasonable level of agreement
because the functions involve only three discriminating variables and still agree
with the coders on about two thirds of the observations A c 2test on Table 6
confirms that this pattern of agreement would not be expected by chance
( c 2= 15494 P lt 001) supporting our impression that these discriminant
functions successfully differentiate among these strategies
The discriminant analysis illustrates that several factors simultaneously affect
respondentsrsquo strategy use It seems likely that respondents weigh the available
information and settle on one or more strategies to pursue Consider an event
that occurs irregularly and often Because of the eventrsquo s irregularity the
respondent is not likely to adopt a rate strategy however he or she may be able
TABLE 6Classification Results from Discriminant Analysis
Predicted Strategy
Coded Strategy Number of Cases Enumeration R ate Retrieval
General
Impressions
Enumeration 162 117
72
37
23
8
5
Rate Retrieval 92 18
20
57
62
17
19
General Impressions 108 32
30
17
16
59
55
Top entries in each cell are number of cases bottom entries are percentage of cases in row
STRATEGIES FOR ESTIMATING FREQUENCY 359
to recall and count distinct episodes Because the event occurs frequently the
respondent is likely to have the impression that it occurs frequently Assuming it
is quicker to convert an impression to a number than to enumerate a large
number of episodes the respondent would base his or her estimate on a general
impression
A TAXONOMY OF STRATEGIES
The multiple strategy view is depicted in terms of the underlying processes for
each strategy in Fig 35
From our perspective strategy selection is restricted by
the contents of memory but not dictated by them A strategy may be selected
when the relevant information is available although in several situations other
strategies may be applicable as well However a given strategy will definitely
not be selected when the requisite information is unavailable This position
implies that respondents must often choose between several competing
strategies It is likely that task demands (eg time available for a response
importance of an accurate response) context (eg previous strategies) and the
ease with which different types of relevant information can be recalled all
influence the strategy selection process
At the highest level we distinguish between enumeration strategies and all
other strategies This reflects our belief that there is a fundamental difference
between using remembered episodes and using generic event-type information as
the basis of a frequency report Two of the strategies we explored appear under the
``Enumerationrsquo rsquo heading episode enumeration and rate estimation6
The first of
these is the simple retrieve and count strategy It yields the lowest frequency
reports and is used for the most distinguishable and least regular events
The second strategy rate estimation appears under Enumeration in Fig 3
because the relationship between reaction times and frequency reports implies
that respondents retrieve individual episodes from a sample portion of the
reference period and then extrapolate to the entire period The strategy seems to
be preferred for events of moderate regularity and similarity and it produces
large estimates These factors in combination may lead respondents to stop
enumerating before they have retrieved all episodes It is difficult to recall
episodes that are not highly distinctive and respondents may sense that there is a
large number of such episodes to retrieve the regularity of the events gives
respondents licence to abandon their enumeration and extrapolate to the full
reference period
The right side of Fig 3 Non-enumeration is subdivided into strategies that
rely on Direct Retrieval processes and those that rely on some type of Memory
5This is quite similar to the taxonomy that has emerged from laboratory work (Brown 1995)
although the current taxonomy is an extension in that it includes rate strategies6
We did not observe an enumerate and adjust strategy here even though one of us (Brown 1995)
has observed such a strategy in a laboratory analogue to this study
360 CONRAD BROWN CASHMAN
FIG
3
Ata
xon
om
yo
fst
rate
gie
sfo
ransw
eri
ng
beh
avio
ura
lfr
equ
ency
quest
ion
s
361
Assessment Direct R etrieval strategies operate on information that is encoded in
respondentsrsquo memory before they hear the question7
This stored information
can be Quantitative or Qualitative The kind of quantitative information that is
stored is rate information for example the knowledge that ``I purchase gas
several times a weekrsquo rsquo Both the rate retrieval8
and rate and adjust strategies
seem to rely on retrieved knowledge of this type and both are applied to regular
and similar events High regularity is a prerequisite for the availability of rate
information and high similarity discourages episode enumeration (Menon
1993)
In contrast to strategies that use stored quantitative information a general
impression strategy could rely on stored qualitative characterisations of
frequency such as ``I do it all the timersquo rsquo From this perspective the strategy
has two parts a stored impression must be retrieved and once it is retrieved the
impression must be converted into an actual number This conversion process
strikes us as a possible locus for the kinds of response scale effects reported by
Schwarz and his colleagues (eg Menon Raghubir amp Schwarz 1995 Schwarz
amp Bienias 1990 Schwarz amp Hippler 1987 Schwarz Hippler Deutsch amp
Strack 1985) Basically the finding is that when survey respondents are asked
to report frequency judgements using fixed response categories the size of those
categories affects the average estimates For example more people report low
frequencies of television watching when the scale ranges from ``up to 1
2 hourrsquo rsquo to
``more than 21
2 hoursrsquo rsquo than when it ranges from ``up to 21
2 hoursrsquo rsquo to ``more than
41
2 hoursrsquo rsquo (Schwarz amp Hippler 1987 Schwarz et al 1985) Our view is that
without a precise metric to drive the conversion of an impression to a number
respondents may assign extreme impressions like ``rarelyrsquo rsquo and ``all the timersquo rsquo
to the extreme categories regardless of the numerical labels for those categories
and estimates they consider to be typical to the middle category again without
regard to the label
The far right branch in Fig 3 is titled Memory Assessment The strategies in
this class are distinguished from the others in that they yield frequencies on the
basis of judgements about memory processes and states rather than content and
these judgements are made at the time of responding In addition to the
availability heuristic (Tversky amp Kahneman 1973) other strategies in this class
7This is also true of course for all strategies involving enumeration as individual episodes are
directly retrieved8
Rate retrieval could in principle be subdivided into those cases in which the respondent retrieves
a rate that is expressed in the same units as the referen ce period and those in which a rate is retrieved
which is associated with a unit that is smaller than the referen ce period and is then multiplied to
extend to the complete time fram e This is similar to the decomposition strategies (Armstrong
Denniston amp Gordon 1975) that have been observed by Bradburn R ips and Shevell (1987) and
Blair and Burton (1987) Because these two variants of rate retrieval rely on the same underlying
processes (with the exception of the extrapolation step) and are applied under identical similarity
regularity and frequency conditions we have not distinguished between them in this taxonomy
362 CONRAD BROWN CASHMAN
might take stock of the familiarity of events (Whittlesea 1993) and the
similarity of what is remembered to what is being asked about (Hintzman 1988
Jones amp Heit 1993)
We have not directly observed memory assessment strategies in our study
and despite compelling experimental evidence for their use other researchers in
the area report the same curious absence of these strategies (eg Blair amp Burton
1987) One reason for this absence might be the limits of verbal protocolsETH the
primary data for identifying strategies in our study and most other studies of
behavioural frequency (Blair amp Burton 1987 Burton amp Blair 1991 Means amp
Loftus 1991 Menon 1993) Accurate verbal reports about a mental process
require that working memory be involved in the process (Ericsson amp Simon
1993) Because memory assessment does not involve transferring information
from long-term memory into working memoryETH it involves judgements about
the state of long-term memoryETH people cannot verbally report about the strategy
(Nisbett amp Wilson 1977 Wilson 1994) This raises the possibility that some of
the uncodable responses (18 of the non-zero responses) were based on
memory assessment In addition some of the verbal reports that we associate
with general impression responses could implicate memory assessment
although we cannot test that here
CONCLUSIONS
People can answer questions about the frequency of their behaviours using a
variety of strategies but the set of strategies that is useful on any one occasion is
limited by what information is available Our multiple strategy perspective makes
clear what strategies cannot be used when the necessary information is lacking
One practical concern raised by this is the fact that people are able to provide
numerical responses when they lack numerical informationETH that is when they
know virtually nothing about the actual quantities involved Of the non-zero
responses 18 were based on general impressions If our proposal about the way
people produce these estimates is right then it does not bode well for the quality
of these estimates Because people can map their impressions to whatever
numerical information is available (such as a response scale) or to prototypical
values (such as numbers divisible by five) it is unlikely that their estimates are as
accurate as survey sponsors assume they are The logical next step is to study the
accuracy ranges for the strategies we have identified in the current study
We have begun to address the issue of what strategy is used when the
information required for several strategies is available Our discriminant analysis
provides some of the flavour of plausible decision rules under these
circumstances However we need an explicit model of how respondents
actually choose strategies when they are asked a frequency question This would
provide a more complete theoretical account of the estimation process and could
be valuable to survey practitioners
STRATEGIES FOR ESTIMATING FREQUENCY 363
In conjunction with these additional research activities our findings can help
survey practitioners in two ways First it may be possible to develop
interventions that help to reduce error for particular strategies For example if
respondents are likely to enumerate when they answer a particular question then
the intervention should be designed to help them recall more episodes in more
detail (eg Fisher amp Quigley 1992) if respondents use their general
impressions the intervention might provide helpful numerical references (eg
Brown 1995) The particular intervention would be determined by the strategy
that is most likely given the patterns of predictive variables
Second if it is possible to infer what strategies respondents have used the
survey practitioner can adjust the published frequency statistics following the
logic of seasonal (eg Bell amp Hillmer 1984) or quality (Armknecht amp Weyback
1989) adjustment If one can establish the direction and magnitudes of errors for
particular strategies in particular survey domainsETH potentially by pretesting a
small subsample for whom verification data are availableETH then the data analyst
can increment or decrement the reported estimates accordingly
The goal of bringing memory research to bear on surveys is to improve data
quality for the survey practitioner and to produce more realistic theories for the
psychologist The current study is one step in satisfying these goals How often
has interdisciplinary work of this kind actually forged new knowledge That all
depends on how you go about answering the question
REFERENCES
Armknecht P amp W eyback D (1989) Adjustments for quality change in the US Consumer Price
Index Journal of Official Statistics 5 107plusmn123
Armstrong SJ Denniston W B amp Gordon MM (1975) The use of the decomposition principle
in making judgments Organizational Behavior and Human Performance 14 257plusmn263
Bahrick H amp Karis D (1982) Long term ecological memory In CR Puff (Ed) Handbook of
research methods in human memory and cognition (pp427plusmn465) New York Academic Press
Barclay C amp Wellman H (1986) Accuracies and inaccuracies in autobiographical memories
Journal of Memory and Language 25 93plusmn103
Barsalou L W amp Ross BH (1986) The roles of automatic and strategic processing in sensitivity
to superordinate and property frequency Journal of Experimental Psychology Learning
Memory and Cognition 12 116plusmn134
Bassili JN (1993) Response latency versus certain ty as indexes of the strength of voting
intentions in a CATI survey Public Opinion Quarterly 55 331plusmn346
Bassili JN amp Fletcher JF (1991) Response-time measurement in survey research A method for
CATI and a new look at nonattitudes Public Opinion Quarterly 57 54plusmn61
Begg I Maxwell D M itterer JO amp Harris G (1986) Estimates of frequency Attribute or
attribution Journal of Experimental Psychology Learning Memory and Cognition 12 496plusmn508
Bell W R amp Hillmer SC (1984) Issues involved with the seasonal adjustment of economic time
series Journal of Business and Economic Statistics 2 291plusmn349
Blair E amp Burton S (1987) Cognitive processes used by survey respondents to answer
behavioral frequency questions Journal of Consumer R esearch 14 280plusmn288
Bousfield WA Sedgewick CHW amp Cohen B H (1954) Certain temporal characteristics of
the recall of verbal associates American Journal of Psychology 67 111plusmn118
364 CONRAD BROWN CASHMAN
Bradburn NM Rips L J amp Shevell SK (1987) Answering autobiographical questions The
impact of memory and inference on surveys Science 236 157plusmn161
Brewer WF (1988) Memory for randomly sampled autobiographical events In U Neisser amp E
Winograd (Eds) R emembering reconsidered (pp21plusmn90) New York Cambridge University
Press
Brown NR (1995) Estimation strategies and the judgment of event frequency Journal of
Experimental Psychology Learning Memory and Cognition 21 1539plusmn1553
Bruce D Hockley WE amp Craik FIM (1991) Availability and category-frequency informa-
tion Memory amp Cognition 19 301plusmn312
Bruce D amp Read JD (1988) The how and why of memory for frequency In M M Gruneberg
PE Morris amp RN Sykes (Eds) Practical aspects of memory Current research and issues Vol
1 Memory in everyday life (pp317plusmn322) New York John Wiley amp Sons
Bruce D amp Van Pelt M (1989) Memories of a bicycle tour Applied cognitive Psychology 3
137plusmn156
Burton S amp Blair E (1991) Task conditions response formulation processes and response
accuracy for behavioral frequency questions in surveys Public Opinion Quarterly 55 50plusmn79
Ericsson KA amp Simon HA (1993) Protocol analysis Verbal reports as data R evised Edition
Cambridge MA M IT Press
Fisher RP amp Quigley KL (1992) Applying cognitive theory in public health investigations
Enhancing food recall with the cognitive interview In JM Tanur (Ed) Questions about
questions Inquiries into the cognitive basis of surveys (pp154plusmn172) New York Russell Sage
Foundation
Hintzman DL (1976) Repetition and memory In GH Bower (Ed) The psychology of learning
and motivation (Vol 10 pp47plusmn91) New York Academic Press
Hintzman DL (1988) Judgments of frequency and recognition memory in a multiple-trace
memory model Psychological R eview 95 528plusmn551
Howell WC (1973) Representation of frequency in mem ory Psychological Bulletin 80 44-53
Hubbard M (1992) Laboratory experiments testing new questioning techniques In CF Turner
JT Lessler amp JC Gfroerer (Eds) Survey measurement of drug use Methodological studies
(pp53plusmn84) W ashington DC US Government Printing Office
Huttenlocher J Hedges L amp Bradburn N (1990) Reports of elapsed time Bounding and
rounding processes in estimation Journal of Experimental Psychology 16 196plusmn213
Johnson M K Raye CL W ang AY amp Taylor T H (1979) Fact and fantasy The role of
accuracy and variability in confusing imaginations with perceptual experiences Journal of
Experimental Psychology Human Learning and Memory 5 220plusmn240
Jones CM amp Heit E (1993) An evaluation of the total similarity principle Effects of similarity
on frequency judgment Journal of Experimental Psychology Learning Memory and Cognition
19 799plusmn812
Jonides J amp Jones CM (1992) Direct coding for frequency occurrence Journal of Experimental
Psychology Learning Memory and Cognition 18 368plusmn378
Jonides J amp Naveh-Benjamin M (1987) Estimating frequency of occurrence Journal of
Experimental Psychology Learning Memory and Cognition 13 230plusmn240
Linton M (1982) Transformations of memory in everyday life In U Neisser (Ed) Memory
observed R emembering in natural context (pp77plusmn91) San Francisco WH Freem an
Means B amp Loftus E (1991) W hen personal history repeats itself Decomposing memories for
recurring events Applied Cognitive Psychology 5 297plusmn318
Menon G (1993) The effects of accessibility of information in memory on judgments of
behavioral frequencies Journal of Consumer Research 20 431plusmn440
Menon G Raghubir P amp Schwarz N (1995) An accessibilityplusmndiagnosticity fram ework for
behavioral frequency judgments The use of response alternatives versus rate of occurrence as
sources of information Journal of Consumer R esearch 22 212plusmn228
STRATEGIES FOR ESTIMATING FREQUENCY 365
Neisser U (1981) John Deanrsquo s memory A case study Cognition 9 1plusmn22
Neisser U (1986) Nested structure in autobiographical m emory In DC Rubin (Ed)
Autobiographical memory (pp71plusmn81) New York Cambridge University Press
Nisbett R amp Wilson T (1977) Telling more than we can know Verbal reports on mental
processes Psychological R eview 84 231plusmn259
Schooler JW Ohlsson S amp Brooks K (1993) Thoughts beyond words When language
overshadows insight Journal of Experimental Psychology General 122 166plusmn183
Schwarz N amp Bienias J (1990) What mediates the impact of response alternatives on frequency
reports of mundane behaviors Applied Cognitive Psychology 4 61plusmn72
Schwarz N amp Hippler H (1987) What response scales may tell your respondents Informative
functions of response alternatives In H Hippler N Schwarz amp S Sudman (Eds) Social
information processing and survey methodology (pp163plusmn178) New York Springer-Verlag
Schwarz N Hippler H Deutsch B amp Strack F (1985) Response categories Effects on
behavioral reports and comparative judgments Public Opinion Quarterly 49 388plusmn395
Strube G (1987) Answering survey questions The role of memory In H Hippler N Schwarz amp
S Sudman (Eds) Social information processing and survey methodology (pp86plusmn101) New
York Springer-Verlag
Sudman S amp Bradburn N (1974) R esponse effects in surveys San Francisco Jossey-Bass
Tversky A amp Kahneman D (1973) Availability A heuristic for judging frequency and
probability Cognitive Psychology 4 207plusmn232
Voss JF Vereb C amp Bisanz G (1975) Stimulus frequency judgments and latency of stimulus
frequency judgments as a function of constant and variable response conditions Journal of
Experimental Psychology Learning Memory and Cognition 3 337plusmn350
Wagenaar W (1986) My memory A study of autobiographical memory over six years Cognitive
Psychology 24 666plusmn678
Whittlesea BWA (1993) Illusions of fam iliarity Journal of Experimental Psychology Learning
Memory and Cognition 19 1235plusmn1253
W ilson TD (1994) The proper protocol V alidity and com pleteness of verbal reports
Psychological Science 5 249plusmn252
Wright DB Gaskell GD amp Orsquo Muircheartaigh C A (1994) How much is `Quite a bitrsquo
M apping between numerical values and vague quantifiers Applied Cognitive Psychology 8
479plusmn495
366 CONRAD BROWN CASHMAN
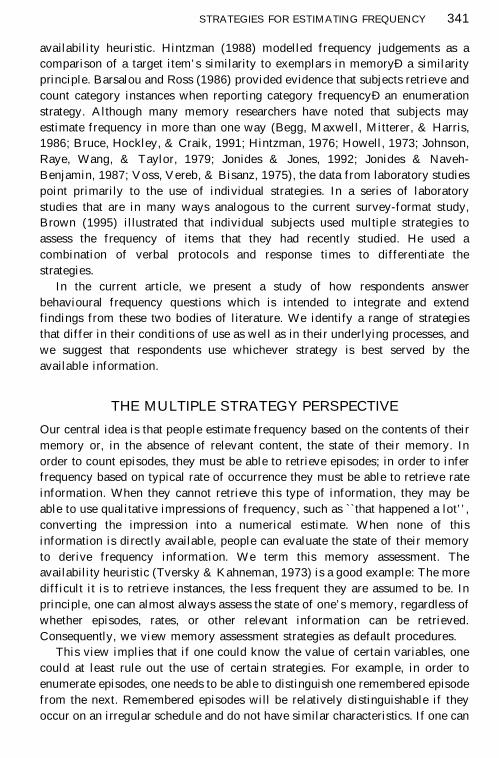
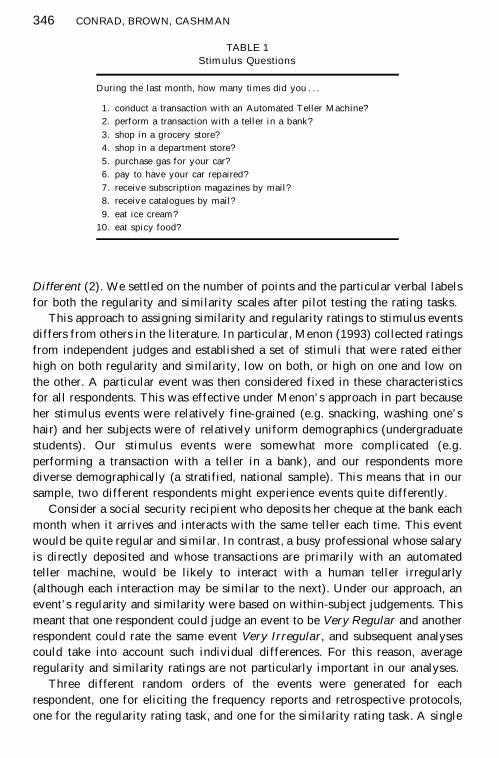
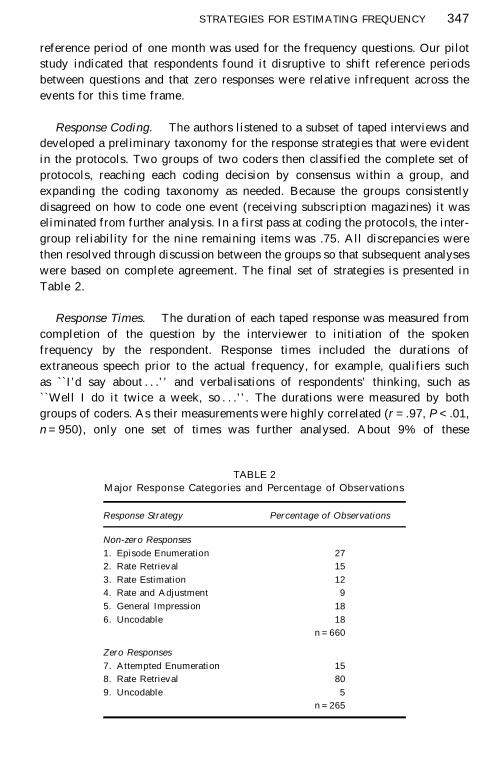
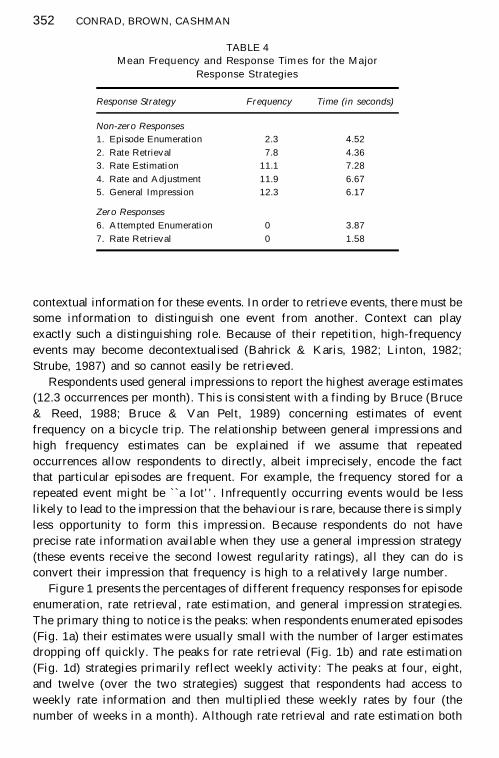
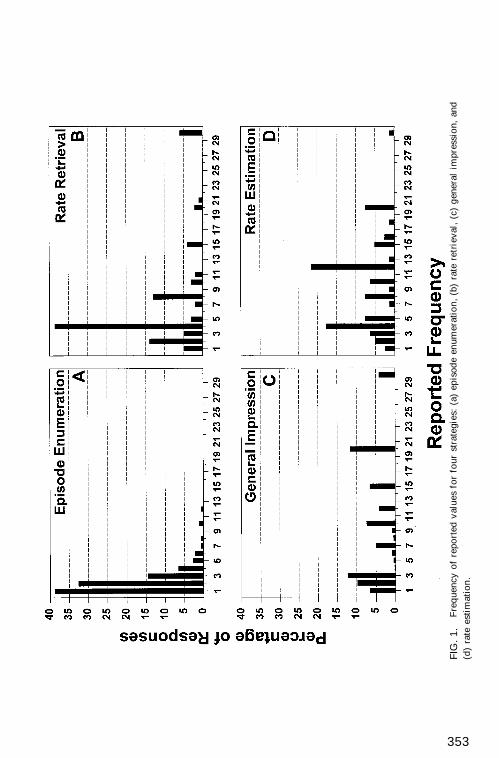
FIG
1
Fre
quency
of
repo
rted
valu
es
for
four
stra
tegie
s(a
)ep
isod
een
um
era
tio
n
(b)
rate
retr
ieval
(c)
genera
lim
pre
ssio
n
and
(d)
rate
est
imati
on
353
show evidence of converting weekly inform ation to m onthly figures
respondentsrsquo verbal protocols suggest that the underlying rates have different
origins for these two strategies Retrieved rates are so named because they
appear to be stored estimated rates appear to be the result of partial
enumeration This distinction is further supported by the reaction time data
presented in the next section
When respondents answered on the basis of their general impressions (Fig
1c) their estimates were often divisible by five This has the appearance of
rounding (Huttenlocher Hedges amp Bradburn 1990) It would make sense for
respondents using the general impression strategy to produce rounded estimates
because they need to convert their impressions which are qualitative into
numbers one way to do this is to report a prototypical quantity for the available
verbal description for example quantifying an impression of ``pretty oftenrsquo rsquo as
``10rsquo rsquo In this domain (as in many others) such prototypical values tend to be
divisible by five One reason that a respondent would map an impression to such
a value is that he or she is probably more likely to think of a prototypical than a
non-prototypical quantity Moreover to provide a non-prototypical quantity say
11 would imply a level of precision that a prototypical value would not
necessarily convey because the conversion from an impression to a number is
inherently imprecise respondents may be more inclined to report the rounded
value
Response Times
Not only do frequency reports vary with response strategies but they are related
to response times in different ways for the various strategies Response times
have been examined in behavioural frequency studies in relation to accuracy
(Burton amp Blair 1991) and as an indicator of effort (Menon 1993) In the
current study response times provide detail about how the different strategies
are executed In particular we predicted that as frequency reports based on
enumeration increase the latencies for those reports should increase but
frequency and time should not be associated for rate-based reports
As predicted the time to report a frequency using this strategy increases with
the size of the frequency (r2= 25 P lt 01) Also as predicted there is no
relationship between response time and frequency when respondents answered
by retrieving a rate Regression equations in which response time is a function
of estimated rate are presented for five strategies in Table 5 The differences
between the functions for these two strategies indicate that for enumeration a
noticeable amount of time is associated with the retrieval of each additional
episode (about 84 seconds using the slope of the regression equation for
enumeration as an estimate) but for rate retrieval time does not change with the
size of rates the invariance of time with frequency for rate-based responses
suggests that access to rate information requires a fixed number of mental
354 CONRAD BROWN CASHMAN
operationsETH presumably a single retrieval There was also no relationship
between response time and the magnitude of the reported frequencies when
respondents used their general impressions Clearly general impressions are not
based on enumeration The pattern for this strategy could indicate that
impressions are retrieved fully formed Alternatively it could suggest that the
result of assessing onersquo s memory is a general impression We cannot distinguish
between these interpretations on the basis of the current data
When respondents based their estimates on rate estimation their response
time increased with the size of the estimates (r2
= 14 P lt 01) although the
relationship does not appear to be as strong as it is for episode enumeration (the
slope of the regression equation is 15) Median response times (for non-zero
responses) are plotted against reported frequency for episode enumeration and
rate estimation in Fig 2 If there were less than five observations for a particular
frequency that value was omitted from the plot Both curves show a linear
relationship between time and frequency although the curve for rate estimation
is clearly shallower than the curve for enumeration One explanation for a slope
of intermediate steepness is that rates are estimated by enumerating episodes for
a portion of the reference period for example a week the respondent then
generalises to the complete time period much as would be the case with rate
retrieval It is the extrapolation part of the strategy that would weaken the
relationship between frequency and time relative to that observed for pure
enumeration because it is possible for a single mental operation (presumably
multiplication) to produce a relatively large frequency report
No relationship between frequency and time is evident for rate and
adjustment Therefore rate and adjustment may resemble rate retrieval more
than rate estimation (where there was a positive relationship between time and
frequency) In both rate and adjustment and rate retrieval the information on
which respondents base their estimates is known to them a priori and is not
estimated through partial enumeration However because responses based on
rate and adjustment were generally slower than those based on rate retrieval
adjusting the rate seems to require extra time This suggestion is strengthened by
TABLE 5Regression Equations for Response Time as a Function of Estimated Frequency
R esponse Strategy Equation r2
P
Episode Enumeration time = 264 + 84 (reported frequency) 25 lt 0001
Rate Retrieval time = 423 + 02 (reported frequency) 00 ns
General Impression time = 608 + 01 (reported frequency) 00 ns
Rate Estimation time = 556 + 15 (reported frequency) 14 lt 0013
Rate and Adjustment time = 597 + 07 (reported frequency) 04 ns
Time is measured in seconds
STRATEGIES FOR ESTIMATING FREQUENCY 355
the observation that regularity and similarity judgements for the two strategies
are about the same indicating that they are used under comparable
circumstances
A homogeneity of slopes test confirms that the relationship between time and
frequency varies with response strategy F(4368) = 774 P lt 01 MSE = 7053
In particular the regression line for episode enumeration was steeper than that
fo r ra te retr ieval and general im pression F (1 368) = 2056 P lt 01
MSE = 18741 The line for rate estimation was also steeper than that for rate
FIG 2 Median response time as a function of reported frequency and response strategy
356 CONRAD BROWN CASHMAN
retrieval F(1368) = 620 P lt 05 MSE = 5647 by a ScheffeAcirctest but not as
steep as the episode enumeration line F(1368) = 1405 P lt 01 MSE = 12804
by a ScheffeAcirctest supporting the idea that the rate estimation strategy is indeed a
hybrid of episode enumeration and rate retrieval strategies These results suggest
that respondents may set a threshold for time spent enumerating and once this is
exceeded they extrapolate
Regardless of the reported frequency rate retrieval is faster than episode
enumeration F(1368) = 1235 P lt 01 This essentially replicates a pattern
found by Menon (1993) in which frequency responses for regular items were
faster than those for irregular items And it is also consistent with the finding by
Burton and Blair (1991) that inducing respondents to use more time in
responding increases the incidence of enumeration But a lesson of the current
study is that overall time tells only part of the story In arriving at a strategy
respondents are probably influenced by the number of discrete time-consuming
steps they will need to execute in order to respond
Finally the two strategies observed for zero frequencies have different
response times Rate retrieval responses were faster than attempted enumeration
F(1103) = 3077 P lt 01 MSE = 7835 A simple model for attempted
enumeration is that respondents search for a reportable episode for a reasonable
amount of time and abandon the search (report ``zerorsquo rsquo ) after that Based on the
regression equation for (non-zero) episode enumeration time to enumerate one
episode is about 35 secondsETH in the same ballpark as the mean response time of
39 seconds for attempted enumeration One reading is that subjectsrsquo threshold is
the time required to enumerate one item Rate retrieval responses were
particularly fast for zero reports faster in fact that non-zero reports based on
the same strategy This difference could arise if non-zero reports demand extra
time when a rate expressed in one temporal unit say weeks is applied to a
reference period expressed in other units say a month in contrast no such
extrapolation is required in order to know that an event never occurs and
therefore report zero
A Multivariate Approach to Strategy Choice
Each of the variables we have examined in the previous sections (regularity
similarity reported frequency and response time) is related to respondentsrsquo
choice of estimation strategy One problem with looking at these relationships
individually is that it is hard to see how they jointly lead a respondent to use a
particular strategy on a particular occasion For example low regularity leads
respondents to enumerate when frequency is low however low regularity leads
respondents to use their general impressions when frequency is high This
relatively simple example involves two variables and two strategies The
patterns become harder to describe when they involve three or four variables and
as many strategies In order to see how particular patterns of several variables
STRATEGIES FOR ESTIMATING FREQUENCY 357
are associated with the use of multiple strategies we performed a discriminant
analysis
Our primary purpose was to describe the combinations of variables that are
related to respondentsrsquo use of different strategies not to predict how individual
respondents would answer particular questions In fact two of the variables in
the analysis (response time and reported frequency) were measured as part of the
response process and could not be used for prediction purposes The idea was to
form equations from variables such as regularity similarity reported frequency
and response times and use these equations to tell us what strategy was most
likely to have been involved in answering each question It was then possible to
evaluate the agreement between the strategy classifications of the discriminant
analysis and those of our coders Good agreement would suggest that the
discriminant equations credibly describe the relationships between these
variables and strategy choice Recall that the coders judged what strategy was
used to answer a question solely from the content of the protocol whereas the
equations classified an observation solely on the basis of the discriminating
variables blind to the content of the protocol
In the interest of simplicity the analysis was limited to three strategies
enumeration rate retrieval and general impression These three appear to
involve the most distinct underlying operations whereas rate estimation and rate
and adjust strategies are basically variants of enumeration andor rate retrieval
The discriminant functions were developed under the assumption that any of the
three strategies could occur with equal probability
The functions were created to differentiate between these strategies on the
basis of five discriminating variables regularity similarity frequency response
time and an indicator variable that was equal to 1 if the estimate was divisible
by five and 0 if it was not The last variable was created because respondents
appeared to round their estimates to multiples of five when they relied on
general impressions
Two discriminant functions emerged from the analysis They were then used
to classify the strategy for each observation The results agreed with the codersrsquo
judgements on 65 of the observations As we have already noted regularity
and similarity are correlated We might therefore be able to remove one of
these variables without sacrificing classification power Similarly the indicator
variable that is concerned with divisibility by five is based on frequency and so
those two variables are not independent Therefore the functions might be
further simplified by removing one of these To construct more parsimonious
functions we performed a step-wise discriminant analysis This resulted in two
discriminant functions that included regularity response time and divisibility by
five
strategy = 22 regularity + 27 response time + 87 divisible by five
strategy = 98 regularity plusmn 31 response time plusmn 33 divisible by five
358 CONRAD BROWN CASHMAN
The first function is clearly driven by divisibility by five with moderate
contributions from the other discriminating variables It should therefore
discriminate the use of general impressions from the other strategies because of
the rounding that is typical when using this kind of non-numerical information
The second function is dominated by regularity with moderate contributions
from the other two terms This function should be effective at discriminating
between rate retrieval and episode enumeration because they are on opposite
ends of the regularity range (rate retrieval is highest episode enumeration is
lowest) The moderate response time effect in both functions should help to
distinguish between the use of general impressions on the one hand and episode
enumeration and rate retrieval on the other The average response time for
general impressions is 617 seconds and the average times for episode
enumeration and rate retrieval are 452 and 456 seconds respectively
These reduced functions were almost as effective at classifying strategy for
each response as were the more complicated functions the agreement between
the functions and coders was 644 The agreement for each of the strategies is
presented in Table 6 We interpret this as a reasonable level of agreement
because the functions involve only three discriminating variables and still agree
with the coders on about two thirds of the observations A c 2test on Table 6
confirms that this pattern of agreement would not be expected by chance
( c 2= 15494 P lt 001) supporting our impression that these discriminant
functions successfully differentiate among these strategies
The discriminant analysis illustrates that several factors simultaneously affect
respondentsrsquo strategy use It seems likely that respondents weigh the available
information and settle on one or more strategies to pursue Consider an event
that occurs irregularly and often Because of the eventrsquo s irregularity the
respondent is not likely to adopt a rate strategy however he or she may be able
TABLE 6Classification Results from Discriminant Analysis
Predicted Strategy
Coded Strategy Number of Cases Enumeration R ate Retrieval
General
Impressions
Enumeration 162 117
72
37
23
8
5
Rate Retrieval 92 18
20
57
62
17
19
General Impressions 108 32
30
17
16
59
55
Top entries in each cell are number of cases bottom entries are percentage of cases in row
STRATEGIES FOR ESTIMATING FREQUENCY 359
to recall and count distinct episodes Because the event occurs frequently the
respondent is likely to have the impression that it occurs frequently Assuming it
is quicker to convert an impression to a number than to enumerate a large
number of episodes the respondent would base his or her estimate on a general
impression
A TAXONOMY OF STRATEGIES
The multiple strategy view is depicted in terms of the underlying processes for
each strategy in Fig 35
From our perspective strategy selection is restricted by
the contents of memory but not dictated by them A strategy may be selected
when the relevant information is available although in several situations other
strategies may be applicable as well However a given strategy will definitely
not be selected when the requisite information is unavailable This position
implies that respondents must often choose between several competing
strategies It is likely that task demands (eg time available for a response
importance of an accurate response) context (eg previous strategies) and the
ease with which different types of relevant information can be recalled all
influence the strategy selection process
At the highest level we distinguish between enumeration strategies and all
other strategies This reflects our belief that there is a fundamental difference
between using remembered episodes and using generic event-type information as
the basis of a frequency report Two of the strategies we explored appear under the
``Enumerationrsquo rsquo heading episode enumeration and rate estimation6
The first of
these is the simple retrieve and count strategy It yields the lowest frequency
reports and is used for the most distinguishable and least regular events
The second strategy rate estimation appears under Enumeration in Fig 3
because the relationship between reaction times and frequency reports implies
that respondents retrieve individual episodes from a sample portion of the
reference period and then extrapolate to the entire period The strategy seems to
be preferred for events of moderate regularity and similarity and it produces
large estimates These factors in combination may lead respondents to stop
enumerating before they have retrieved all episodes It is difficult to recall
episodes that are not highly distinctive and respondents may sense that there is a
large number of such episodes to retrieve the regularity of the events gives
respondents licence to abandon their enumeration and extrapolate to the full
reference period
The right side of Fig 3 Non-enumeration is subdivided into strategies that
rely on Direct Retrieval processes and those that rely on some type of Memory
5This is quite similar to the taxonomy that has emerged from laboratory work (Brown 1995)
although the current taxonomy is an extension in that it includes rate strategies6
We did not observe an enumerate and adjust strategy here even though one of us (Brown 1995)
has observed such a strategy in a laboratory analogue to this study
360 CONRAD BROWN CASHMAN
FIG
3
Ata
xon
om
yo
fst
rate
gie
sfo
ransw
eri
ng
beh
avio
ura
lfr
equ
ency
quest
ion
s
361
Assessment Direct R etrieval strategies operate on information that is encoded in
respondentsrsquo memory before they hear the question7
This stored information
can be Quantitative or Qualitative The kind of quantitative information that is
stored is rate information for example the knowledge that ``I purchase gas
several times a weekrsquo rsquo Both the rate retrieval8
and rate and adjust strategies
seem to rely on retrieved knowledge of this type and both are applied to regular
and similar events High regularity is a prerequisite for the availability of rate
information and high similarity discourages episode enumeration (Menon
1993)
In contrast to strategies that use stored quantitative information a general
impression strategy could rely on stored qualitative characterisations of
frequency such as ``I do it all the timersquo rsquo From this perspective the strategy
has two parts a stored impression must be retrieved and once it is retrieved the
impression must be converted into an actual number This conversion process
strikes us as a possible locus for the kinds of response scale effects reported by
Schwarz and his colleagues (eg Menon Raghubir amp Schwarz 1995 Schwarz
amp Bienias 1990 Schwarz amp Hippler 1987 Schwarz Hippler Deutsch amp
Strack 1985) Basically the finding is that when survey respondents are asked
to report frequency judgements using fixed response categories the size of those
categories affects the average estimates For example more people report low
frequencies of television watching when the scale ranges from ``up to 1
2 hourrsquo rsquo to
``more than 21
2 hoursrsquo rsquo than when it ranges from ``up to 21
2 hoursrsquo rsquo to ``more than
41
2 hoursrsquo rsquo (Schwarz amp Hippler 1987 Schwarz et al 1985) Our view is that
without a precise metric to drive the conversion of an impression to a number
respondents may assign extreme impressions like ``rarelyrsquo rsquo and ``all the timersquo rsquo
to the extreme categories regardless of the numerical labels for those categories
and estimates they consider to be typical to the middle category again without
regard to the label
The far right branch in Fig 3 is titled Memory Assessment The strategies in
this class are distinguished from the others in that they yield frequencies on the
basis of judgements about memory processes and states rather than content and
these judgements are made at the time of responding In addition to the
availability heuristic (Tversky amp Kahneman 1973) other strategies in this class
7This is also true of course for all strategies involving enumeration as individual episodes are
directly retrieved8
Rate retrieval could in principle be subdivided into those cases in which the respondent retrieves
a rate that is expressed in the same units as the referen ce period and those in which a rate is retrieved
which is associated with a unit that is smaller than the referen ce period and is then multiplied to
extend to the complete time fram e This is similar to the decomposition strategies (Armstrong
Denniston amp Gordon 1975) that have been observed by Bradburn R ips and Shevell (1987) and
Blair and Burton (1987) Because these two variants of rate retrieval rely on the same underlying
processes (with the exception of the extrapolation step) and are applied under identical similarity
regularity and frequency conditions we have not distinguished between them in this taxonomy
362 CONRAD BROWN CASHMAN
might take stock of the familiarity of events (Whittlesea 1993) and the
similarity of what is remembered to what is being asked about (Hintzman 1988
Jones amp Heit 1993)
We have not directly observed memory assessment strategies in our study
and despite compelling experimental evidence for their use other researchers in
the area report the same curious absence of these strategies (eg Blair amp Burton
1987) One reason for this absence might be the limits of verbal protocolsETH the
primary data for identifying strategies in our study and most other studies of
behavioural frequency (Blair amp Burton 1987 Burton amp Blair 1991 Means amp
Loftus 1991 Menon 1993) Accurate verbal reports about a mental process
require that working memory be involved in the process (Ericsson amp Simon
1993) Because memory assessment does not involve transferring information
from long-term memory into working memoryETH it involves judgements about
the state of long-term memoryETH people cannot verbally report about the strategy
(Nisbett amp Wilson 1977 Wilson 1994) This raises the possibility that some of
the uncodable responses (18 of the non-zero responses) were based on
memory assessment In addition some of the verbal reports that we associate
with general impression responses could implicate memory assessment
although we cannot test that here
CONCLUSIONS
People can answer questions about the frequency of their behaviours using a
variety of strategies but the set of strategies that is useful on any one occasion is
limited by what information is available Our multiple strategy perspective makes
clear what strategies cannot be used when the necessary information is lacking
One practical concern raised by this is the fact that people are able to provide
numerical responses when they lack numerical informationETH that is when they
know virtually nothing about the actual quantities involved Of the non-zero
responses 18 were based on general impressions If our proposal about the way
people produce these estimates is right then it does not bode well for the quality
of these estimates Because people can map their impressions to whatever
numerical information is available (such as a response scale) or to prototypical
values (such as numbers divisible by five) it is unlikely that their estimates are as
accurate as survey sponsors assume they are The logical next step is to study the
accuracy ranges for the strategies we have identified in the current study
We have begun to address the issue of what strategy is used when the
information required for several strategies is available Our discriminant analysis
provides some of the flavour of plausible decision rules under these
circumstances However we need an explicit model of how respondents
actually choose strategies when they are asked a frequency question This would
provide a more complete theoretical account of the estimation process and could
be valuable to survey practitioners
STRATEGIES FOR ESTIMATING FREQUENCY 363
In conjunction with these additional research activities our findings can help
survey practitioners in two ways First it may be possible to develop
interventions that help to reduce error for particular strategies For example if
respondents are likely to enumerate when they answer a particular question then
the intervention should be designed to help them recall more episodes in more
detail (eg Fisher amp Quigley 1992) if respondents use their general
impressions the intervention might provide helpful numerical references (eg
Brown 1995) The particular intervention would be determined by the strategy
that is most likely given the patterns of predictive variables
Second if it is possible to infer what strategies respondents have used the
survey practitioner can adjust the published frequency statistics following the
logic of seasonal (eg Bell amp Hillmer 1984) or quality (Armknecht amp Weyback
1989) adjustment If one can establish the direction and magnitudes of errors for
particular strategies in particular survey domainsETH potentially by pretesting a
small subsample for whom verification data are availableETH then the data analyst
can increment or decrement the reported estimates accordingly
The goal of bringing memory research to bear on surveys is to improve data
quality for the survey practitioner and to produce more realistic theories for the
psychologist The current study is one step in satisfying these goals How often
has interdisciplinary work of this kind actually forged new knowledge That all
depends on how you go about answering the question
REFERENCES
Armknecht P amp W eyback D (1989) Adjustments for quality change in the US Consumer Price
Index Journal of Official Statistics 5 107plusmn123
Armstrong SJ Denniston W B amp Gordon MM (1975) The use of the decomposition principle
in making judgments Organizational Behavior and Human Performance 14 257plusmn263
Bahrick H amp Karis D (1982) Long term ecological memory In CR Puff (Ed) Handbook of
research methods in human memory and cognition (pp427plusmn465) New York Academic Press
Barclay C amp Wellman H (1986) Accuracies and inaccuracies in autobiographical memories
Journal of Memory and Language 25 93plusmn103
Barsalou L W amp Ross BH (1986) The roles of automatic and strategic processing in sensitivity
to superordinate and property frequency Journal of Experimental Psychology Learning
Memory and Cognition 12 116plusmn134
Bassili JN (1993) Response latency versus certain ty as indexes of the strength of voting
intentions in a CATI survey Public Opinion Quarterly 55 331plusmn346
Bassili JN amp Fletcher JF (1991) Response-time measurement in survey research A method for
CATI and a new look at nonattitudes Public Opinion Quarterly 57 54plusmn61
Begg I Maxwell D M itterer JO amp Harris G (1986) Estimates of frequency Attribute or
attribution Journal of Experimental Psychology Learning Memory and Cognition 12 496plusmn508
Bell W R amp Hillmer SC (1984) Issues involved with the seasonal adjustment of economic time
series Journal of Business and Economic Statistics 2 291plusmn349
Blair E amp Burton S (1987) Cognitive processes used by survey respondents to answer
behavioral frequency questions Journal of Consumer R esearch 14 280plusmn288
Bousfield WA Sedgewick CHW amp Cohen B H (1954) Certain temporal characteristics of
the recall of verbal associates American Journal of Psychology 67 111plusmn118
364 CONRAD BROWN CASHMAN
Bradburn NM Rips L J amp Shevell SK (1987) Answering autobiographical questions The
impact of memory and inference on surveys Science 236 157plusmn161
Brewer WF (1988) Memory for randomly sampled autobiographical events In U Neisser amp E
Winograd (Eds) R emembering reconsidered (pp21plusmn90) New York Cambridge University
Press
Brown NR (1995) Estimation strategies and the judgment of event frequency Journal of
Experimental Psychology Learning Memory and Cognition 21 1539plusmn1553
Bruce D Hockley WE amp Craik FIM (1991) Availability and category-frequency informa-
tion Memory amp Cognition 19 301plusmn312
Bruce D amp Read JD (1988) The how and why of memory for frequency In M M Gruneberg
PE Morris amp RN Sykes (Eds) Practical aspects of memory Current research and issues Vol
1 Memory in everyday life (pp317plusmn322) New York John Wiley amp Sons
Bruce D amp Van Pelt M (1989) Memories of a bicycle tour Applied cognitive Psychology 3
137plusmn156
Burton S amp Blair E (1991) Task conditions response formulation processes and response
accuracy for behavioral frequency questions in surveys Public Opinion Quarterly 55 50plusmn79
Ericsson KA amp Simon HA (1993) Protocol analysis Verbal reports as data R evised Edition
Cambridge MA M IT Press
Fisher RP amp Quigley KL (1992) Applying cognitive theory in public health investigations
Enhancing food recall with the cognitive interview In JM Tanur (Ed) Questions about
questions Inquiries into the cognitive basis of surveys (pp154plusmn172) New York Russell Sage
Foundation
Hintzman DL (1976) Repetition and memory In GH Bower (Ed) The psychology of learning
and motivation (Vol 10 pp47plusmn91) New York Academic Press
Hintzman DL (1988) Judgments of frequency and recognition memory in a multiple-trace
memory model Psychological R eview 95 528plusmn551
Howell WC (1973) Representation of frequency in mem ory Psychological Bulletin 80 44-53
Hubbard M (1992) Laboratory experiments testing new questioning techniques In CF Turner
JT Lessler amp JC Gfroerer (Eds) Survey measurement of drug use Methodological studies
(pp53plusmn84) W ashington DC US Government Printing Office
Huttenlocher J Hedges L amp Bradburn N (1990) Reports of elapsed time Bounding and
rounding processes in estimation Journal of Experimental Psychology 16 196plusmn213
Johnson M K Raye CL W ang AY amp Taylor T H (1979) Fact and fantasy The role of
accuracy and variability in confusing imaginations with perceptual experiences Journal of
Experimental Psychology Human Learning and Memory 5 220plusmn240
Jones CM amp Heit E (1993) An evaluation of the total similarity principle Effects of similarity
on frequency judgment Journal of Experimental Psychology Learning Memory and Cognition
19 799plusmn812
Jonides J amp Jones CM (1992) Direct coding for frequency occurrence Journal of Experimental
Psychology Learning Memory and Cognition 18 368plusmn378
Jonides J amp Naveh-Benjamin M (1987) Estimating frequency of occurrence Journal of
Experimental Psychology Learning Memory and Cognition 13 230plusmn240
Linton M (1982) Transformations of memory in everyday life In U Neisser (Ed) Memory
observed R emembering in natural context (pp77plusmn91) San Francisco WH Freem an
Means B amp Loftus E (1991) W hen personal history repeats itself Decomposing memories for
recurring events Applied Cognitive Psychology 5 297plusmn318
Menon G (1993) The effects of accessibility of information in memory on judgments of
behavioral frequencies Journal of Consumer Research 20 431plusmn440
Menon G Raghubir P amp Schwarz N (1995) An accessibilityplusmndiagnosticity fram ework for
behavioral frequency judgments The use of response alternatives versus rate of occurrence as
sources of information Journal of Consumer R esearch 22 212plusmn228
STRATEGIES FOR ESTIMATING FREQUENCY 365
Neisser U (1981) John Deanrsquo s memory A case study Cognition 9 1plusmn22
Neisser U (1986) Nested structure in autobiographical m emory In DC Rubin (Ed)
Autobiographical memory (pp71plusmn81) New York Cambridge University Press
Nisbett R amp Wilson T (1977) Telling more than we can know Verbal reports on mental
processes Psychological R eview 84 231plusmn259
Schooler JW Ohlsson S amp Brooks K (1993) Thoughts beyond words When language
overshadows insight Journal of Experimental Psychology General 122 166plusmn183
Schwarz N amp Bienias J (1990) What mediates the impact of response alternatives on frequency
reports of mundane behaviors Applied Cognitive Psychology 4 61plusmn72
Schwarz N amp Hippler H (1987) What response scales may tell your respondents Informative
functions of response alternatives In H Hippler N Schwarz amp S Sudman (Eds) Social
information processing and survey methodology (pp163plusmn178) New York Springer-Verlag
Schwarz N Hippler H Deutsch B amp Strack F (1985) Response categories Effects on
behavioral reports and comparative judgments Public Opinion Quarterly 49 388plusmn395
Strube G (1987) Answering survey questions The role of memory In H Hippler N Schwarz amp
S Sudman (Eds) Social information processing and survey methodology (pp86plusmn101) New
York Springer-Verlag
Sudman S amp Bradburn N (1974) R esponse effects in surveys San Francisco Jossey-Bass
Tversky A amp Kahneman D (1973) Availability A heuristic for judging frequency and
probability Cognitive Psychology 4 207plusmn232
Voss JF Vereb C amp Bisanz G (1975) Stimulus frequency judgments and latency of stimulus
frequency judgments as a function of constant and variable response conditions Journal of
Experimental Psychology Learning Memory and Cognition 3 337plusmn350
Wagenaar W (1986) My memory A study of autobiographical memory over six years Cognitive
Psychology 24 666plusmn678
Whittlesea BWA (1993) Illusions of fam iliarity Journal of Experimental Psychology Learning
Memory and Cognition 19 1235plusmn1253
W ilson TD (1994) The proper protocol V alidity and com pleteness of verbal reports
Psychological Science 5 249plusmn252
Wright DB Gaskell GD amp Orsquo Muircheartaigh C A (1994) How much is `Quite a bitrsquo
M apping between numerical values and vague quantifiers Applied Cognitive Psychology 8
479plusmn495
366 CONRAD BROWN CASHMAN