Embed Size (px)
Citation preview
Strategies for Value Creation:Strategies for Value Creation: Its Formulation and MeasurementIts Formulation and Measurement
Arnoldo C. Hax
Economic value is only created when the businesses of the firm -- and the firm as a whole -- enjoy profit-ability levels which exceed that of their respective cost of capital.
Sources of Value CreationSources of Value Creation
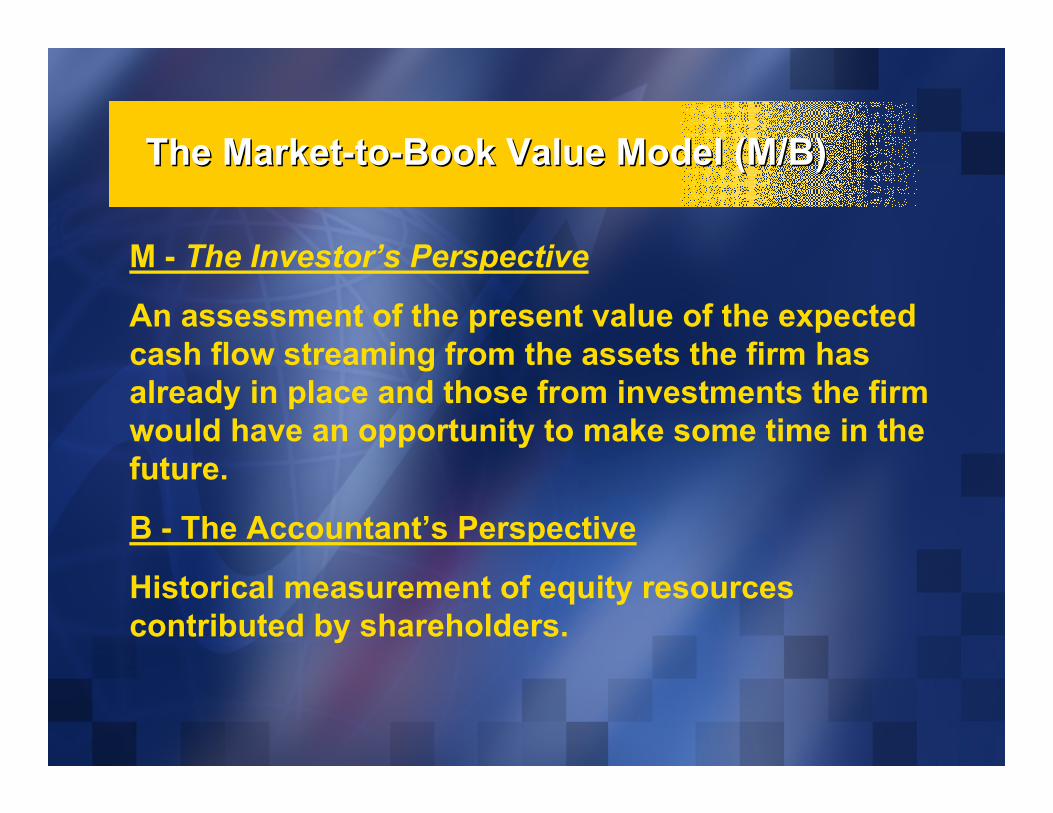
M - The Investor’s Perspective
An assessment of the present value of the expected cash flow streaming from the assets the firm has already in place and those from investments the firm would have an opportunity to make some time in the future.
B - The Accountant’s Perspective
Historical measurement of equity resources contributed by shareholders.
The MarketThe Market--toto--Book Value Model (M/B)Book Value Model (M/B)
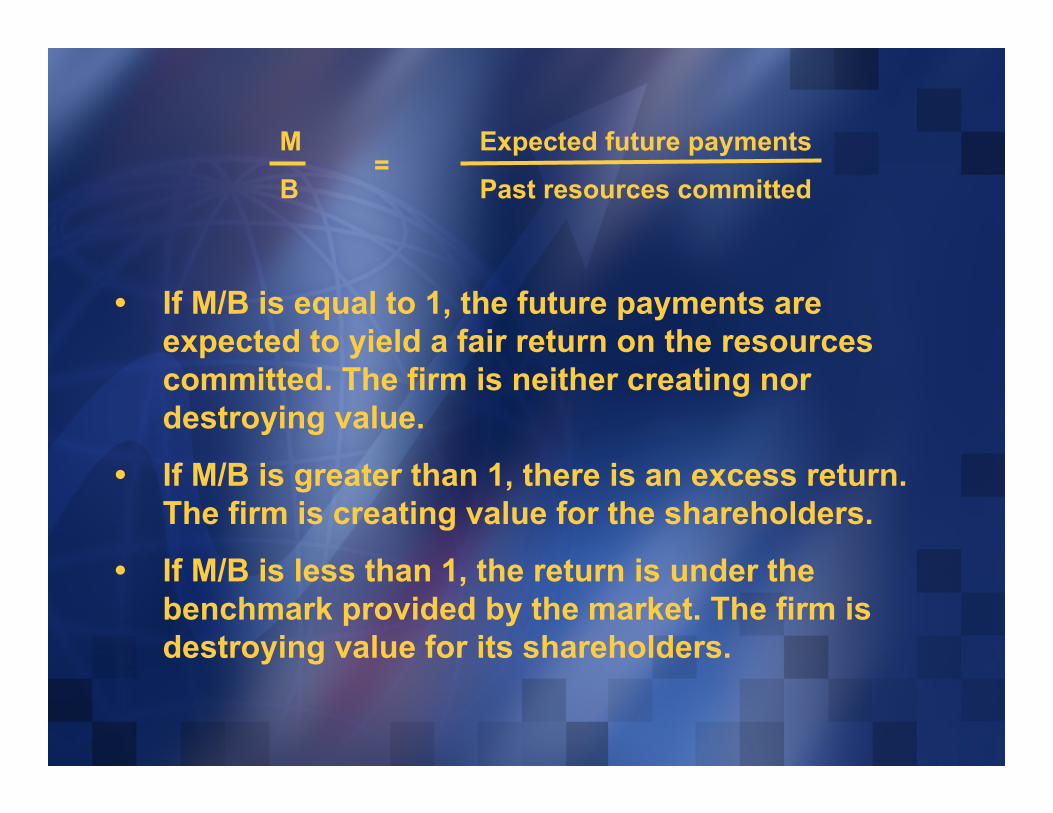
M Expected future payments =
B Past resources committed
• If M/B is equal to 1, the future payments are expected to yield a fair return on the resources committed. The firm is neither creating nor destroying value.
• If M/B is greater than 1, there is an excess return. The firm is creating value for the shareholders.
• If M/B is less than 1, the return is under the benchmark provided by the market. The firm is destroying value for its shareholders.
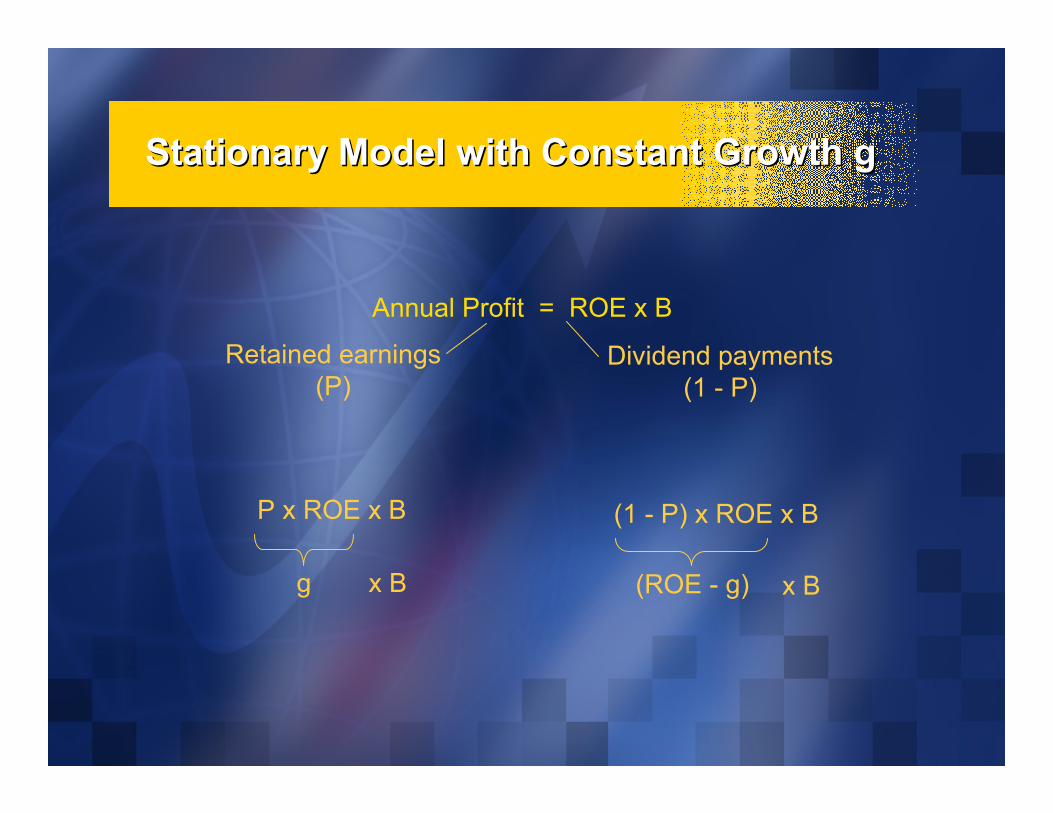
Stationary Model with Constant Growth gStationary Model with Constant Growth g
Annual Profit = ROE x B
Retained earnings (P)
Dividend payments (1 - P)
P x ROE x B (1 - P) x ROE x B
x B (ROE - g) x Bg
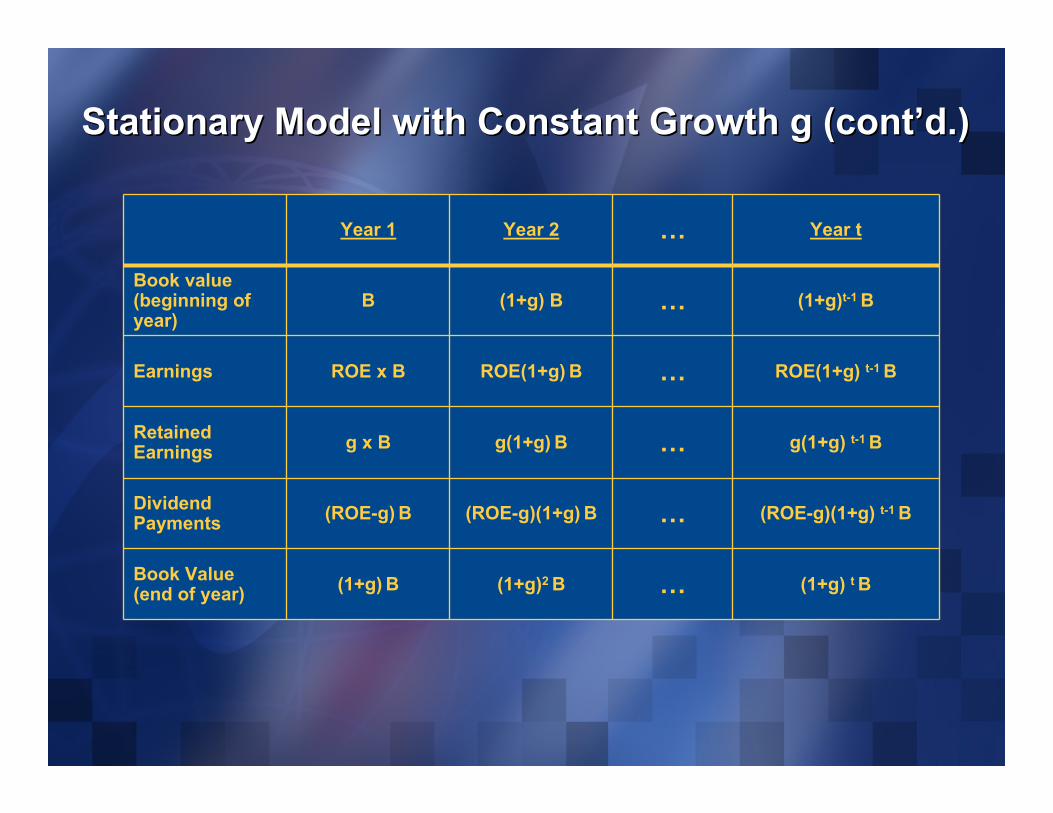
Stationary Model with Constant Growth g (contStationary Model with Constant Growth g (cont’’d.)d.)
Year 1 Year 2 … Year t
Book value (beginning of year)
B (1+g) B … (1+g)t-1 B
Earnings ROE x B ROE(1+g) B … ROE(1+g) t-1 B
Retained Earnings g x B g(1+g) B … g(1+g) t-1 B
Dividend Payments (ROE-g) B (ROE-g)(1+g) B … (ROE-g)(1+g) t-1 B
Book Value (end of year) (1+g) B (1+g)2 B … (1+g) t B
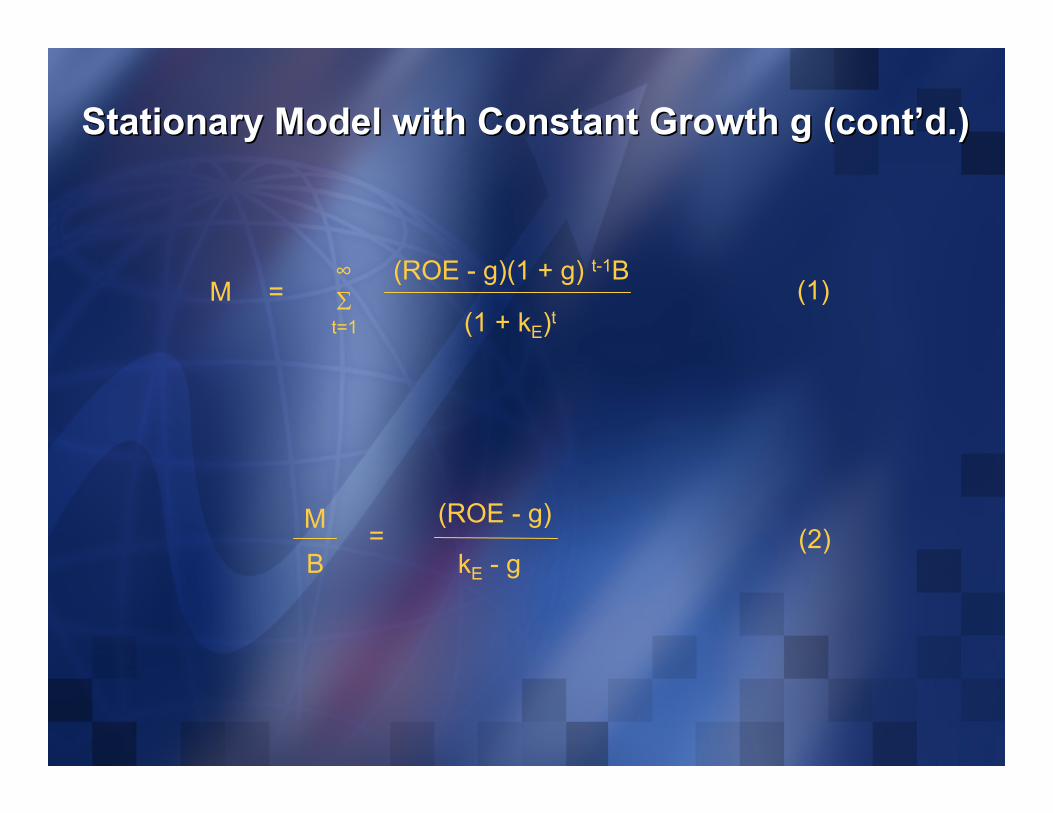
Stationary Model with Constant Growth g (contStationary Model with Constant Growth g (cont’’d.)d.)
(1)M = (ROE - g)(1 + g) t-1B
(1 + kE)t Σ
t=1
∞
(2)(ROE - g)
kE - g = M
B
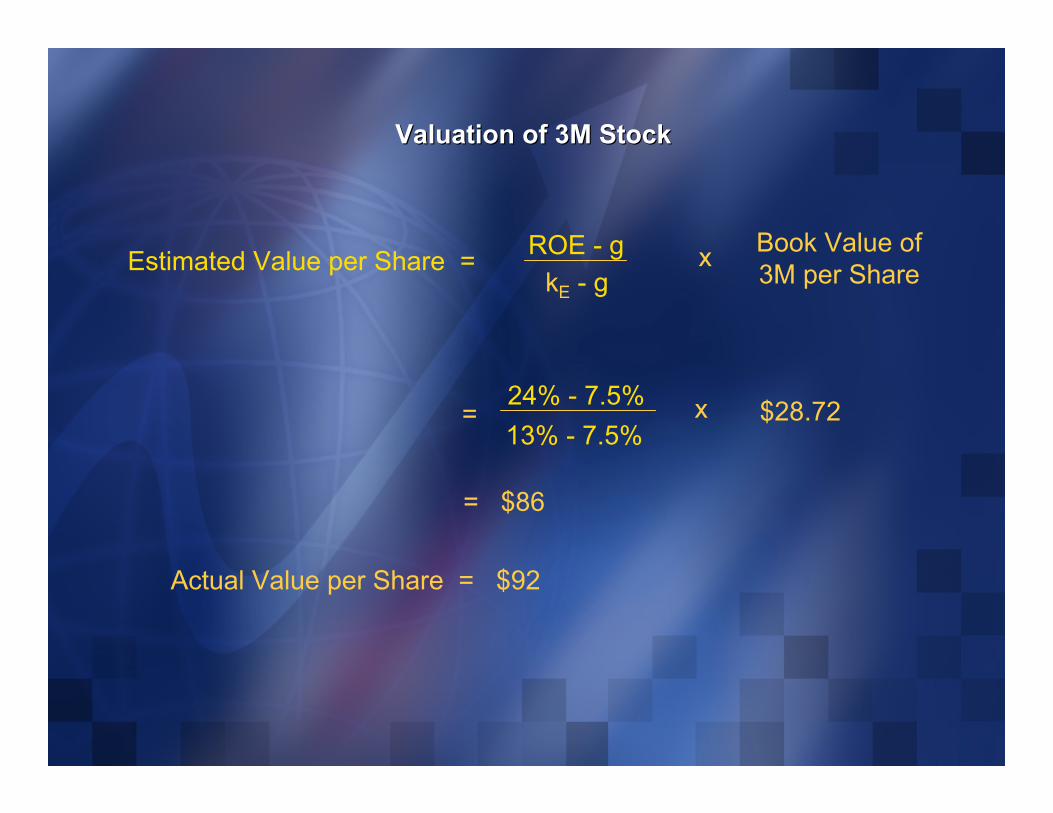
Valuation of 3M StockValuation of 3M Stock
Estimated Value per Share = ROE - g kE - g
x Book Value of 3M per Share
= 24% - 7.5% x $28.72 13% - 7.5%
= $86
Actual Value per Share = $92
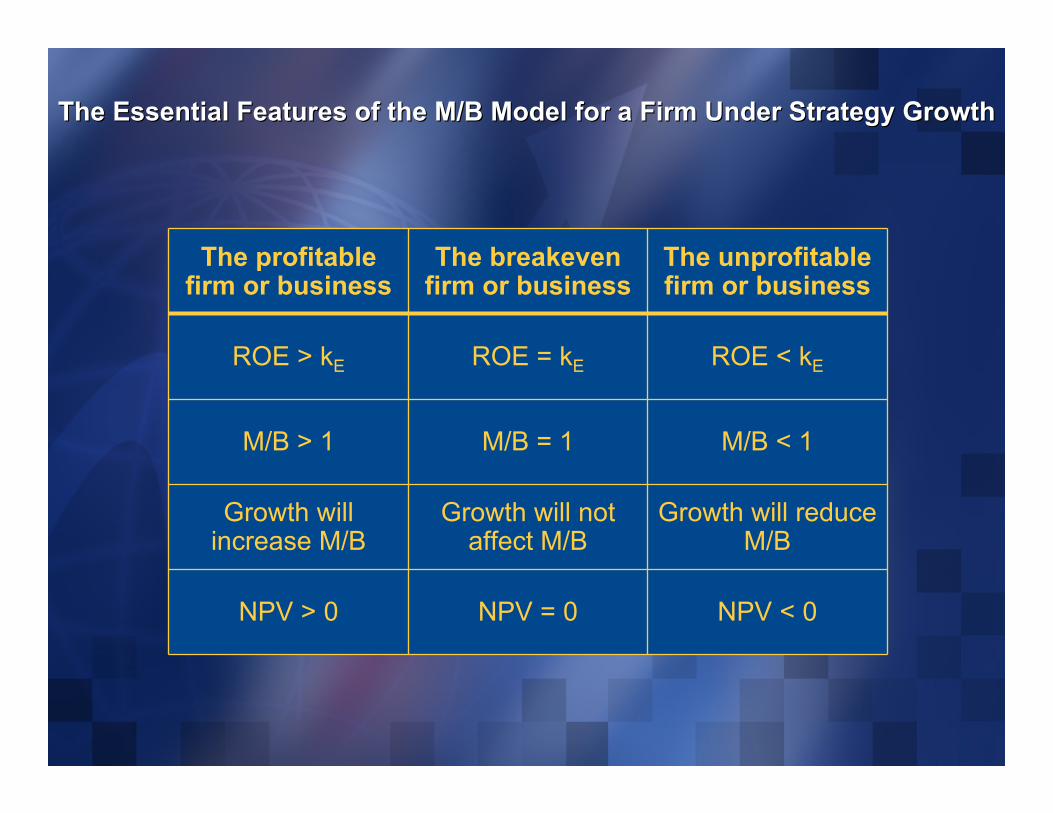
The Essential Features of the M/B Model for a Firm Under StrategThe Essential Features of the M/B Model for a Firm Under Strategy Growthy Growth
The profitablefirm or business
The breakeven firm or business
The unprofitablefirm or business
ROE > kE ROE = kE ROE < kE
M/B > 1 M/B = 1 M/B < 1
Growth will Growth will not Growth will reduce increase M/B affect M/B M/B
NPV > 0 NPV = 0 NPV < 0
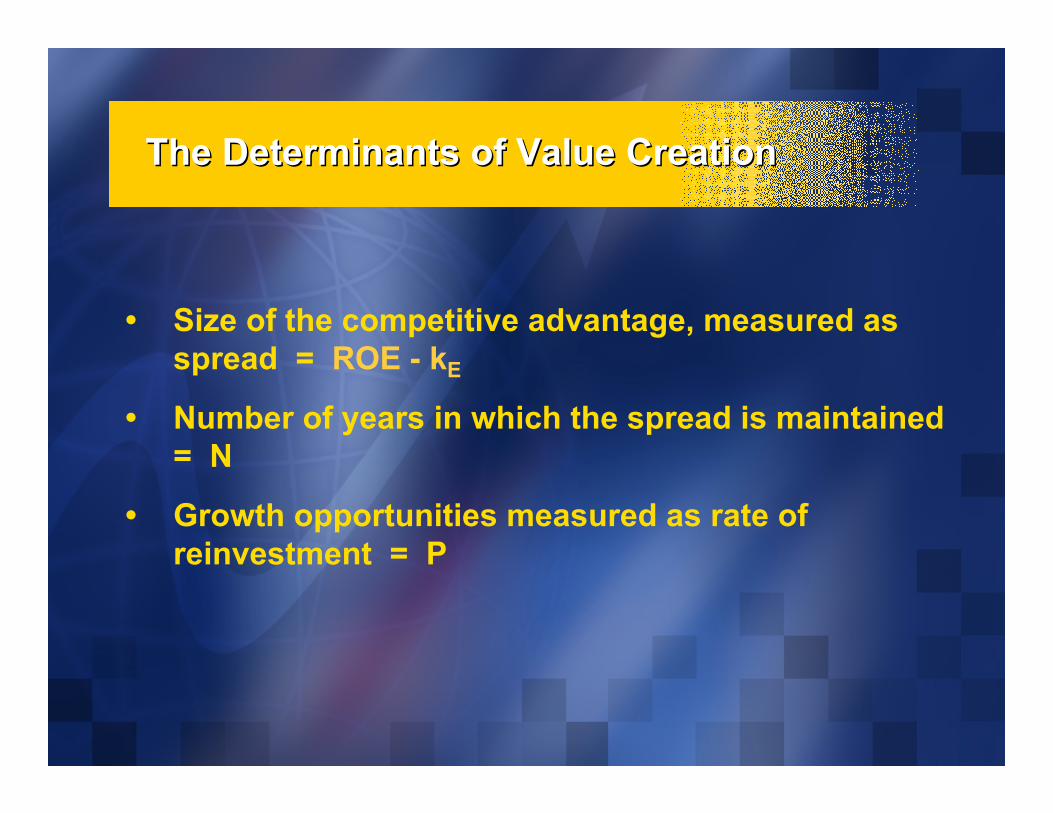
• Size of the competitive advantage, measured as spread = ROE - kE
• Number of years in which the spread is maintained = N
• Growth opportunities measured as rate of reinvestment = P
The Determinants of Value CreationThe Determinants of Value Creation
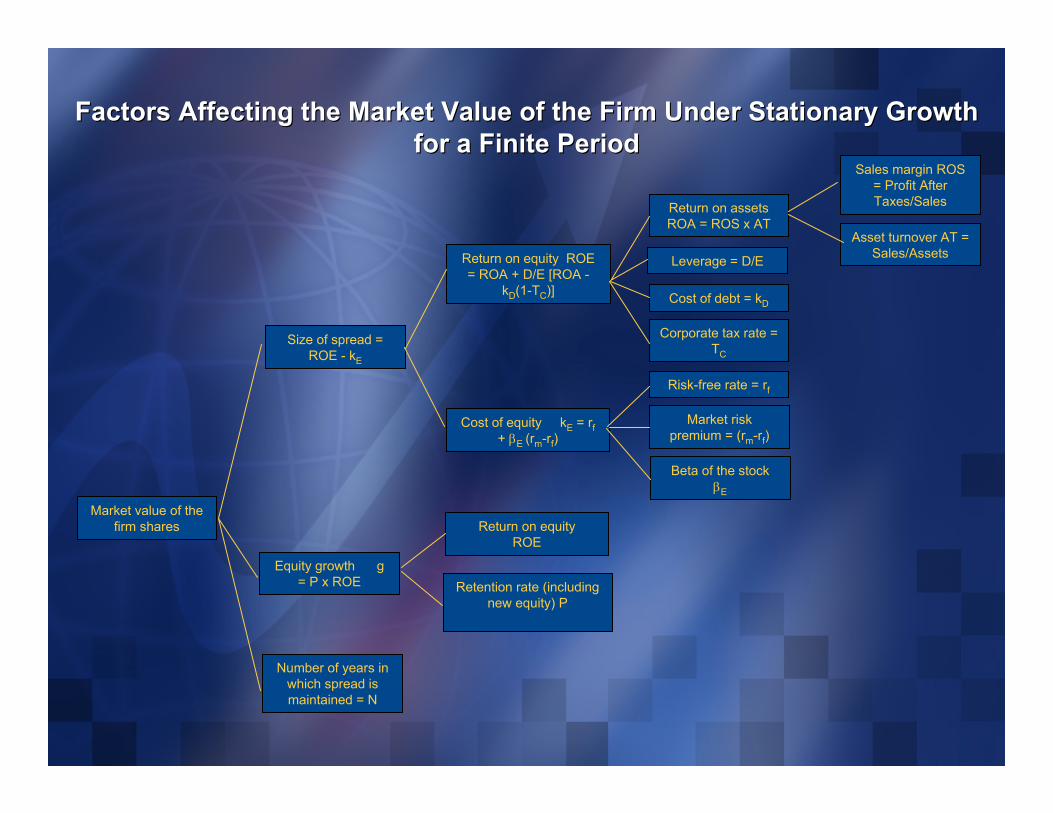
Factors Affecting the Market Value of the Firm Under StationaryFactors Affecting the Market Value of the Firm Under Stationary GrowthGrowth for a Finite Periodfor a Finite Period
Sales margin ROS = Profit After Taxes/SalesReturn on assets
ROA = ROS x AT
Cost of debt = kD
Leverage = D/E
Risk-free rate = rf
Corporate tax rate = TC
Beta of the stock βE
Market risk premium = (rm-rf)
Asset turnover AT = Sales/AssetsReturn on equity ROE
= ROA + D/E [ROA -kD(1-TC)]
Cost of equity kE = rf + βE (rm-rf)
Return on equity ROE
Retention rate (including new equity) P
Number of years in which spread is maintained = N
Equity growth g = P x ROE
Size of spread = ROE - kE
Market value of the firm shares
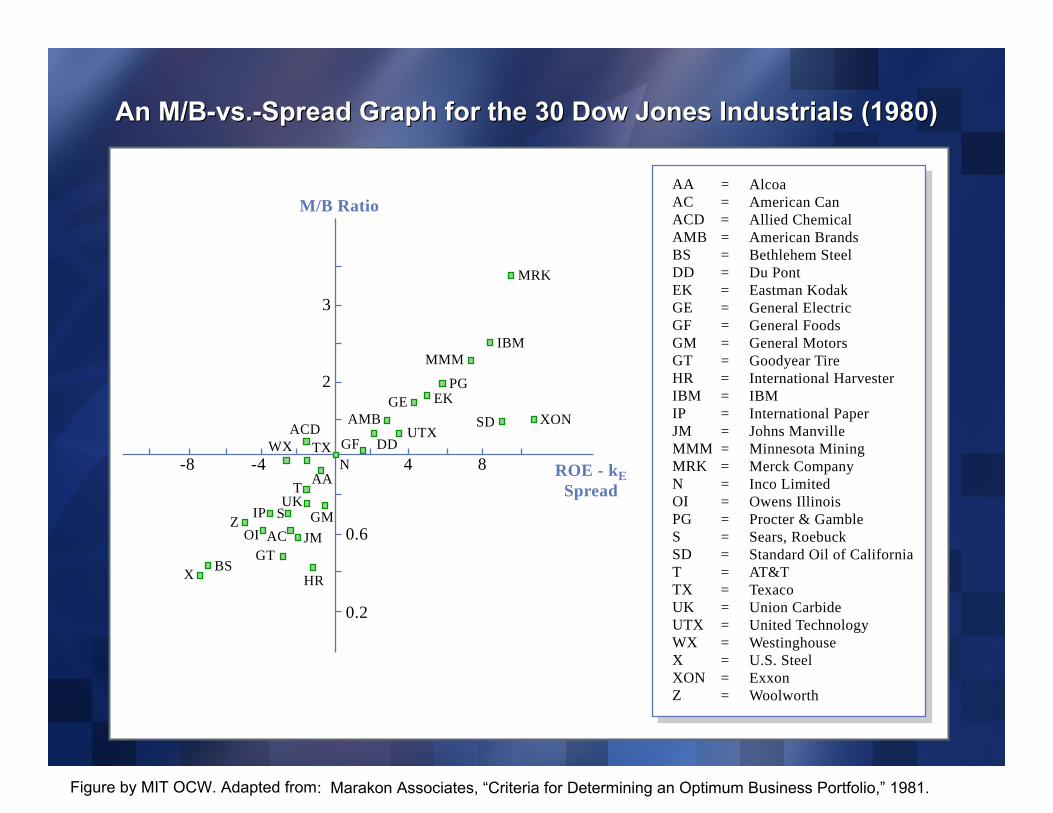
An M/BAn M/B--vs.vs.--Spread Graph for the 30 Dow Jones Industrials (1980)Spread Graph for the 30 Dow Jones Industrials (1980)
-8
X BS GT
HR
Z OI AC JM
IP S UK
T
GM
AA
WX TX N GF
UTX DD
AMB GE EK
PG
MMM IBM
SD XON
MRK
ACD
-4
0.2
0.6
2
3
M/B Ratio
ROE - kE Spread
4 8
AA AC ACD AMB BS DD EK GE GF GM GT HR IBM IP JM MMM MRK N OI PG S SD T TX UK UTX WX X XON Z
= = = = = = = = = = = = = = = = = = = = = = = = = = = = = =
Alcoa American Can Allied Chemical American Brands Bethlehem Steel Du Pont Eastman Kodak General Electric General Foods General Motors Goodyear Tire International Harvester IBM International Paper Johns Manville Minnesota Mining Merck Company Inco Limited Owens Illinois Procter & Gamble Sears, Roebuck Standard Oil of California AT&T Texaco Union Carbide United Technology Westinghouse U.S. Steel Exxon Woolworth
: Marakon Associates, “Criteria for Determining an Optimum Business Portfolio,” 1981. Figure by MIT OCW. Adapted from
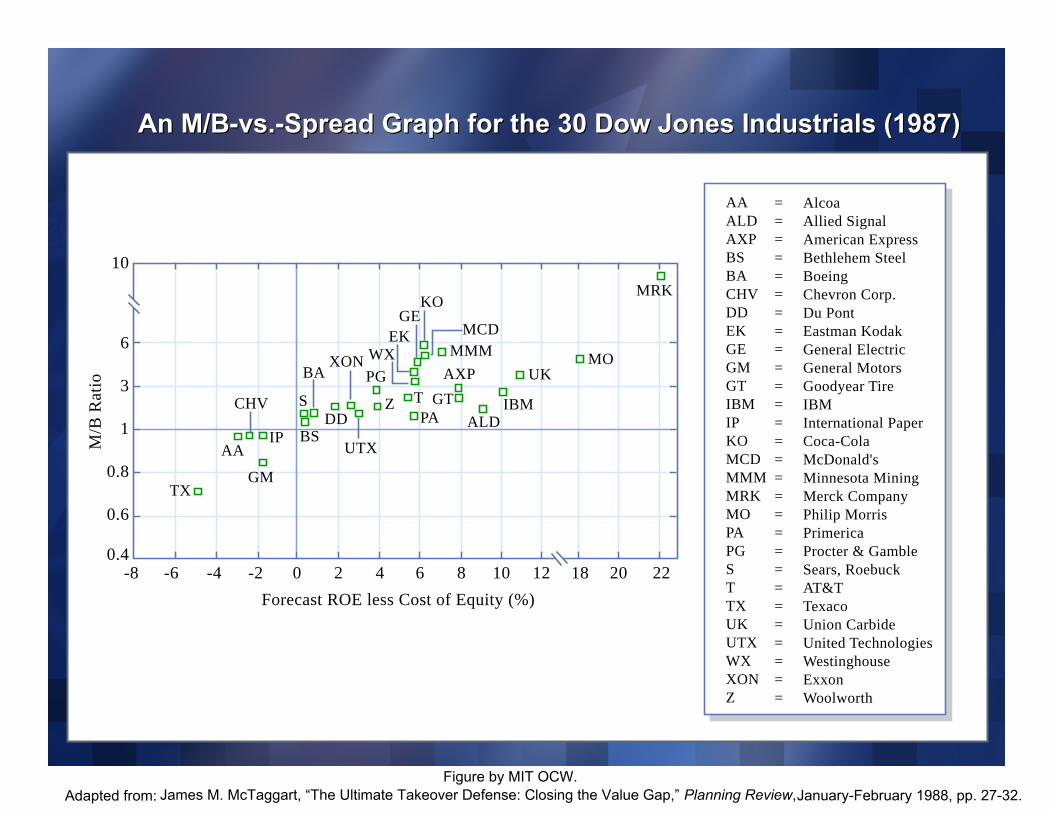
An M/BAn M/B--vs.vs.--Spread Graph for the 30 Dow Jones Industrials (1987)Spread Graph for the 30 Dow Jones Industrials (1987)
-8 0.4
0.6
0.8
1
3
6
10
-6 -4 -2 0 2 4 6 8 10 12 18 20 22
TX GM
AA IP
CHV
BA
S
BS DD
PG
Z
UTX
PA T GT
ALD IBM
UK MO
MRK
Forecast ROE less Cost of Equity (%)
M/B
Rat
io
MCD
KO GE
EK WX MMM
AXP XON
AA ALD AXP BS BA CHV DD EK GE GM GT IBM IP KO MCD MMM MRK MO PA PG S T TX UK UTX WX XON Z
= = = = = = = = = = = = = = = = = = = = = = = = = = = =
Alcoa Allied Signal American Express Bethlehem Steel Boeing Chevron Corp. Du Pont Eastman Kodak General Electric General Motors Goodyear Tire IBM International Paper Coca-Cola McDonald's Minnesota Mining Merck Company Philip Morris Primerica Procter & Gamble Sears, Roebuck AT&T Texaco Union Carbide United Technologies Westinghouse Exxon Woolworth
Figure by MIT OCW. Adapted from: James M. McTaggart, “The Ultimate Takeover Defense: Closing the Value Gap,” Planning Review,January-February 1988, pp. 27-32.
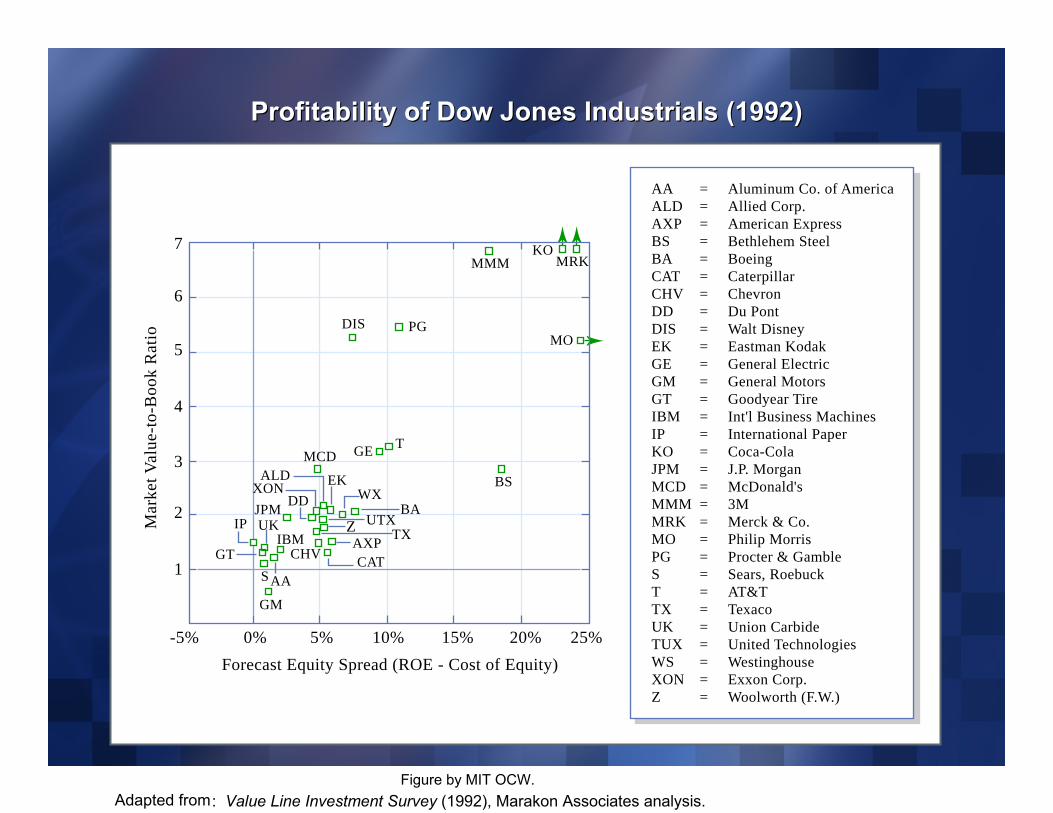
Profitability of Dow Jones Industrials (1992)Profitability of Dow Jones Industrials (1992)
-5%
Mar
ket V
alue
-to-B
ook
Rat
io
1
2
3
4
5
6
7
0%
GM
S AA
GT
IP UK JPM DD
MCD
XON ALD
TGE
DIS PG MO
MMM MRK KO
BS
Z
CAT AXP TX
UTX BA
WX EK
CHV IBM
5% 10% 15% 20% 25% Forecast Equity Spread (ROE - Cost of Equity)
AA ALD AXP BS BA CAT CHV DD DIS EK GE GM GT IBM IP KO JPM MCD MMM MRK MO PG S T TX UK TUX WS XON Z
= = = = = = = = = = = = = = = = = = = = = = = = = = = = = =
Aluminum Co. of America Allied Corp. American Express Bethlehem Steel Boeing Caterpillar Chevron Du Pont Walt Disney Eastman Kodak General Electric General Motors Goodyear Tire Int'l Business Machines International Paper Coca-Cola J.P. Morgan McDonald's 3M Merck & Co. Philip Morris Procter & Gamble Sears, Roebuck AT&T Texaco Union Carbide United Technologies Westinghouse Exxon Corp. Woolworth (F.W.)
Figure by MIT OCW.Adapted from: Value Line Investment Survey (1992), Marakon Associates analysis.
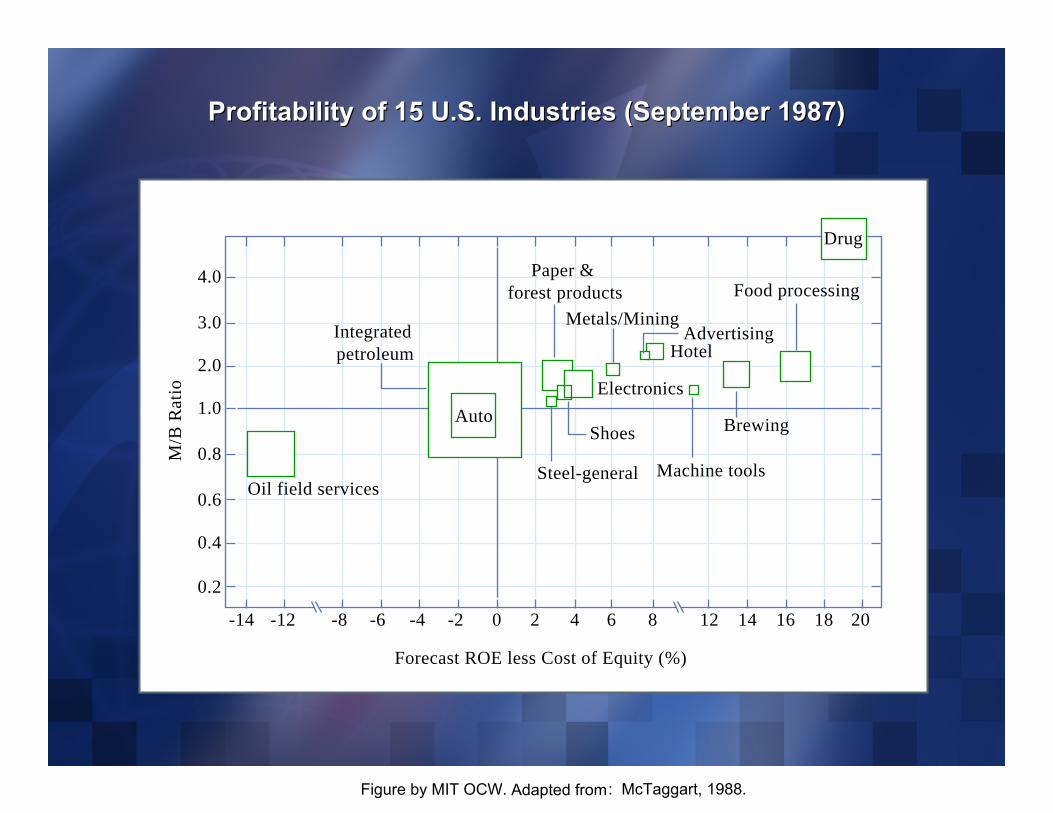
Profitability of 15 U.S. Industries (September 1987)
-14
0.2
0.4
0.6
0.8
1.0
2.0
3.0
4.0
-12
M/B
Rat
io
Integrated petroleum
Auto
Steel-general
Shoes
Machine tools
Brewing
Advertising
Food processing Metals/Mining
Drug
Hotel
Electronics
Paper & forest products
-6 -4 -2
Forecast ROE less Cost of Equity (%)
0 2 4 6 8 12 14 16 18 20-8
Oil field services
Profitability of 15 U.S. Industries (September 1987)
Figure by MIT OCW. Adapted from: McTaggart, 1988.
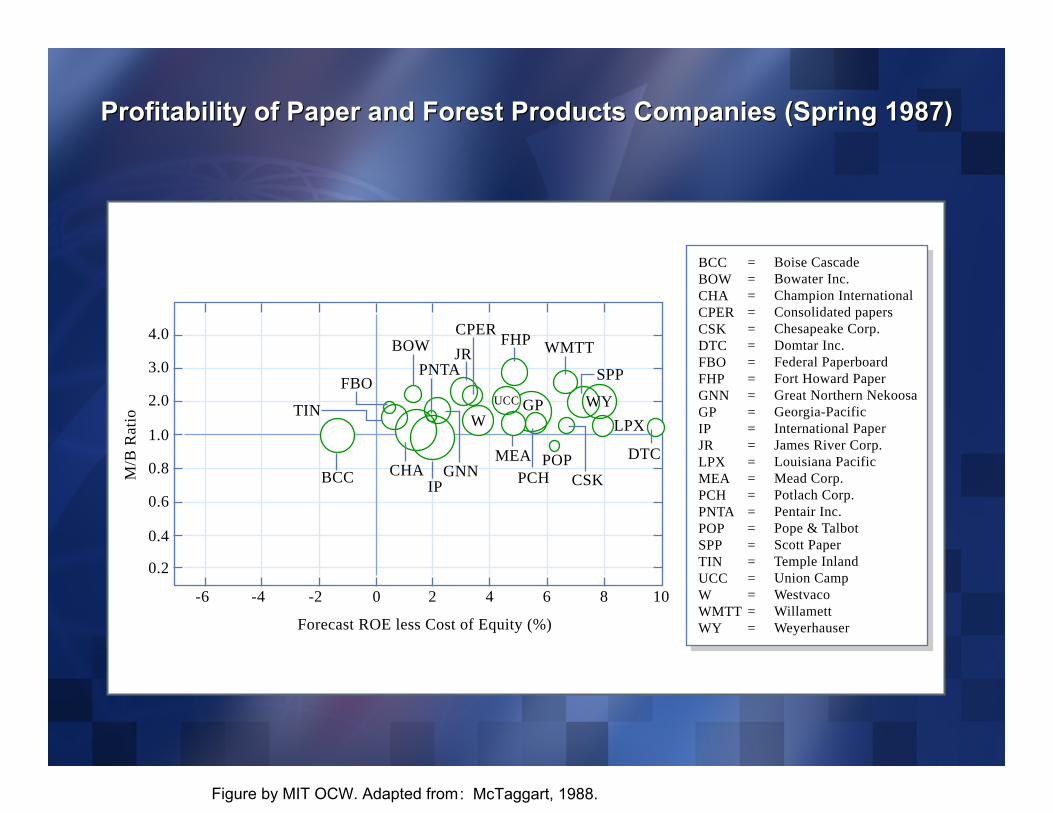
Profitability of Paper and Forest Products Companies (Spring 198Profitability of Paper and Forest Products Companies (Spring 1987)7)
0.2
-6 -4 -2
BCC
TIN
FBO
BOW PNTA
JR
IP GNNCHA
CPER FHP
GP
PCH MEA
CSK
WMTT
SPP
POP
WY LPX
DTC
Forecast ROE less Cost of Equity (%)
M/B
Rat
io
0 2 4 6 8 10
0.4
0.6
0.8
1.0
2.0
3.0
4.0
W
BCC BOW CHA CPER CSK DTC FBO FHP GNN GP IP JR LPX MEA PCH PNTA POP SPP TIN UCC W WMTT WY
= = = = = = = = = = = = = = = = = = = = = = =
Boise Cascade Bowater Inc. Champion International Consolidated papers Chesapeake Corp. Domtar Inc. Federal Paperboard Fort Howard Paper Great Northern Nekoosa Georgia-Pacific International Paper James River Corp. Louisiana Pacific Mead Corp. Potlach Corp. Pentair Inc. Pope & Talbot Scott Paper Temple Inland Union Camp Westvaco Willamett Weyerhauser
UCC
Figure by MIT OCW. Adapted from : McTaggart, 1988.
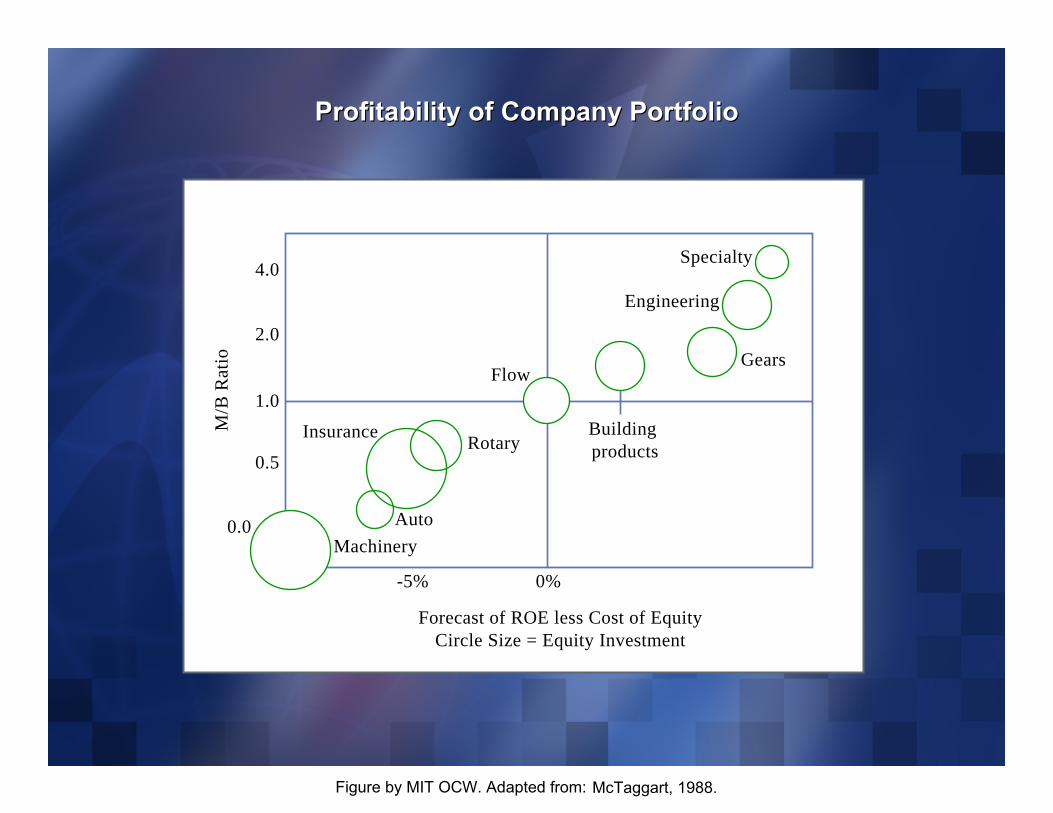
Profitability of Company PortfolioProfitability of Company Portfolio
-5%
Machinery Auto
Flow Gears
Building products
Engineering
Specialty
Rotary Insurance
Forecast of ROE less Cost of Equity Circle Size = Equity Investment
M/B
Rat
io
0.0
0.5
1.0
2.0
4.0
0%
Figure by MIT OCW. Adapted from: McTaggart, 1988.
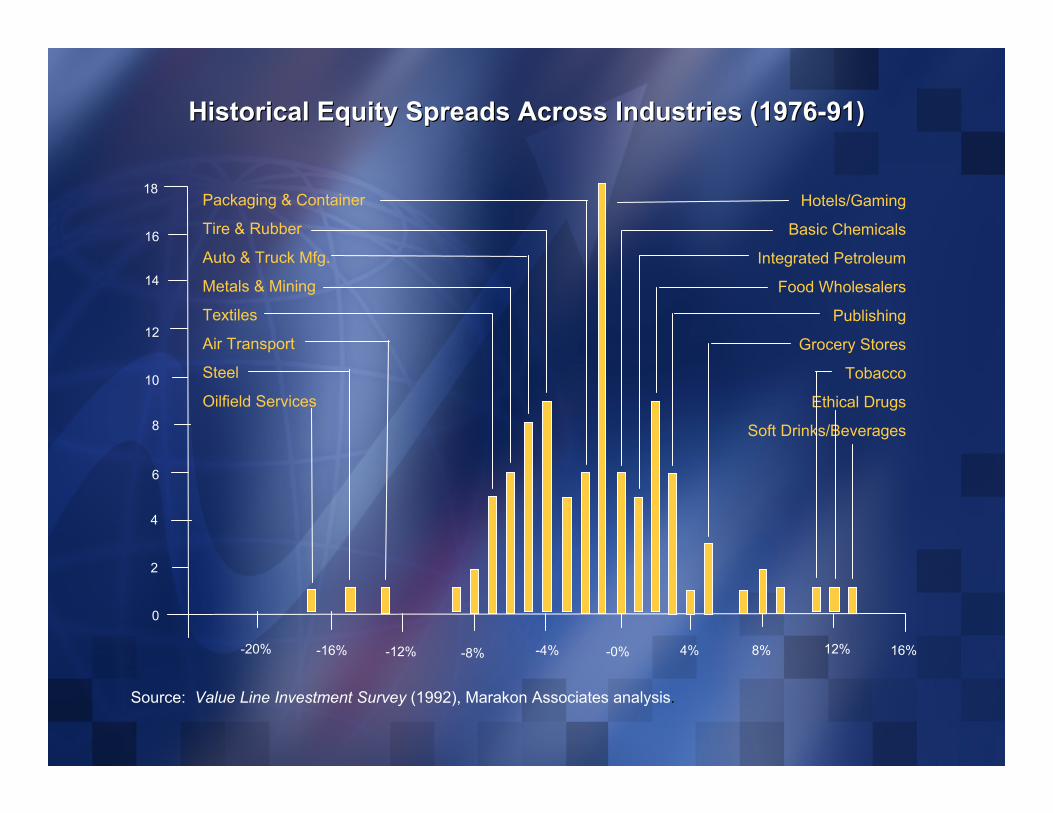
Historical Equity Spreads Across Industries (1976Historical Equity Spreads Across Industries (1976--91)91)
18
16
14
12
10
8
6
4
2
0
-20% -16% -12% -8% -4% -0% 4% 8% 12% 16%
Packaging & Container
Tire & Rubber
Auto & Truck Mfg.
Metals & Mining
Textiles
Air Transport
Steel
Oilfield Services
Hotels/Gaming
Basic Chemicals
Integrated Petroleum
Food Wholesalers
Publishing
Grocery Stores
Tobacco
Ethical Drugs
Soft Drinks/Beverages
Source: Value Line Investment Survey (1992), Marakon Associates analysis.
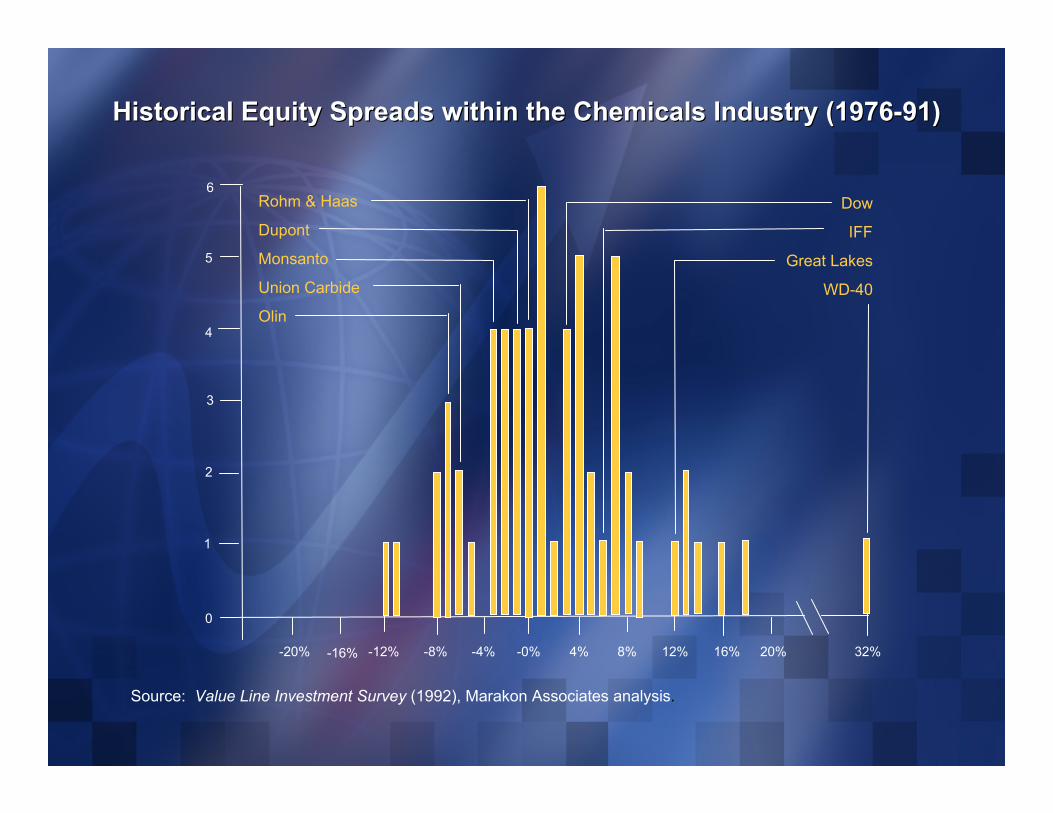
Historical Equity Spreads within the Chemicals Industry (1976Historical Equity Spreads within the Chemicals Industry (1976--91)91)
6
4
2
1
3
5
0
Rohm & Haas
Dupont
Monsanto
Union Carbide
Olin
Dow
IFF
Great Lakes
WD-40
-20% -16% -12% -8% -4% -0% 4% 8% 12% 16% 20% 32%
Source: Value Line Investment Survey (1992), Marakon Associates analysis.