Embed Size (px)
Citation preview

SRI International®
A Comprehensive Economic Development
Strategy for Southern Nevada
Vision 2025
Prepared by SRI International®
Las Vegas
Global
Economic
Alliance
July 2021
Photo Courtesy of Carol Highsmith/Library of Congress/Flickr

Authors
This report was researched and written by Steven Deitz, Paul Liu, Emily Mellicant, Roland Stephen,
and J.R. Sullivan at the Center for Innovation Strategy and Policy, SRI International. The authors
would like to acknowledge significant support provided by Jonas Peterson and the staff of the Las
Vegas Global Economic Alliance.
Note
This report was developed by SRI, based on research funded by the Las Vegas Global Economic
Alliance. The findings, conclusions, and any errors in the report are the sole responsibility of the
authors. SRI International is a registered trademark.

Contents
Executive Summary
Highlights of Southern Nevada’s Progress
1 Introduction
2 A Note on the Impact of the COVID-19 Pandemic in
Southern Nevada
3 Summary Background & Economic Assessment
16 SWOT Analysis
18 Strategic Direction & Activities Plan
33 Evaluation Framework
40 Appendix A: Interviewee & Participant List
42 Appendix B: Stakeholder Engagement Exercises
45 Appendix C: Detailed SWOT Analysis
65 Appendix D: Additional Visualizations
67 Appendix E: Data Used for Dislocated Workforce Analysis
70 Notes

Acknowledgements
This Comprehensive Economic Development Strategy is the outcome of a collaborative process
involving dozens of institutions across Southern Nevada. The project would not have been possible
without their participation. We thank the following organizations that contributed to this effort:
Airport Concessionaires,
LLC
Amerityre Corporation
Bank of Nevada
Barclays U.S. Operations
Barrick Gold USA
Black Raven Films
Boulder City
Boulder City Chamber of
Commerce
Boyd Gaming
Brown & Brown Insurance
City of Henderson
City of Las Vegas
City of Mesquite
City of North Las Vegas
Clark County
Clark County School District
College of Southern Nevada
Cox Communications
Eastridge Workforce
Solutions
Fingerprinting Express
Frazier and Deeter, LLC
Gordon Law
Governor’s Office of
Economic Development
Governor’s Office of
Workforce Innovation
Green Valley Grocery
Greenberg Traurig, LLP
Henderson Chamber of
Commerce
Hilton Grand Vacations
JPMorgan Chase
Klai Juba Wald Architects
Las Vegas Global Economic
Alliance
Las Vegas HEALS
Las Vegas Power
Professionals
Manpower Las Vegas
Marnell Properties
Martin-Harris Construction
Mesquite Chamber of
Commerce
MGM Resorts International
Nevada State College
Omni Limousine
PENTA Building Group
Raiders
Regional Transportation
Commission of Southern
Nevada (RTC)
Renhead
Silverton Casino and Hotel
Southern Nevada Water
Authority
Sun Commercial Real
Estate
Tango Car
U.S. Bank
University of Nevada, Las
Vegas
University of Phoenix
Urban Chamber of
Commerce
Vegas Golden Knights
WaterStart
Wells Fargo Bank
Western Governors
University Nevada
Workforce Connections

Executive Summary
Vision 2025: A Comprehensive Economic
Development Strategy for Southern Nevada
SRI engaged with stakeholders across
Southern Nevada to develop a vision
that captures the ambitions and
capabilities of the region.
Focus Groups
SRI arranged focus groups with dozens of
organizations throughout Southern
Nevada to identify areas where the region
outperformed and areas that could use
further attention. In general, comments in
these focus groups frequently related to:
Education, training, & workforce
Strong communities
Entrepreneurship & business support
Transportation
Technology & innovation
Visioning Exercises
SRI also conducted a series of visioning
exercises with local stakeholders that
included the use of hypothetical personas
to identify specific pain points for different
types of residents in the region. The needs
of the different personas generally aligned
with those of the focus group, with some
additions.
Education opportunities & trained
workforce
Local amenities
Affordable housing & cost of living
These engagement sessions led SRI to
develop the following vision for Southern
Nevada:
Southern Nevada is a global center for
enterprise, imagination, and new
experience, driven by innovation in
entertainment, industry, and technology.
SRI also developed a series of goals
and objectives that serve as a
roadmap for Southern Nevada’s
future development efforts.
Promote a Resilient &
Diverse Economy
Connect People, Businesses,
& Ideas
Support the Emergence &
Maturation of Southern Nevada’s
New Target Industries
Stimulate a Future-Ready
Workforce
Strengthen & Reimagine Regional
Collaboration

To assess the region’s economy, SRI
conducted a Summary Background &
Economic Assessment.
Southern Nevada’s population is
increasing rapidly, growing twice as
fast as the average for U.S. metro
areas since 2010. This population
growth is driven by high domestic
migration from other regions in the
country. Population increase is
weighted toward young adults and
seniors, with lower growth in prime
working age adults.
The region’s economy has recovered
from the Great Recession, with large
increases in GDP and business
establishments and a reduction in
measures of economic distress.
Job growth is strong, and
unemployment continues to decline.
Unemployment has declined
approximately 10 percentage points
since its recession peak and is rapidly
closing on the national average.
Additionally, job growth has been
greater in higher wage non-hospitality
target industries, and average wages
across the workforce have increased.
Educational attainment in Southern
Nevada is significantly lower than peer
metro areas in the West. The portion
of adults with postsecondary degrees
is rising, but at a slow pace.
University research and development
(R&D) is increasing, but overall
innovation resources and activity in
the region are limited. University
technology transfer and the
production of science and engineering
degree holders are very low. However,
new technology-focused collaborations
and spaces have been established,
and venture capital funding is
increasing.
SRI used a SWOT analysis to go
beyond a purely economic analysis,
capturing trends in Southern
Nevada’s communities.
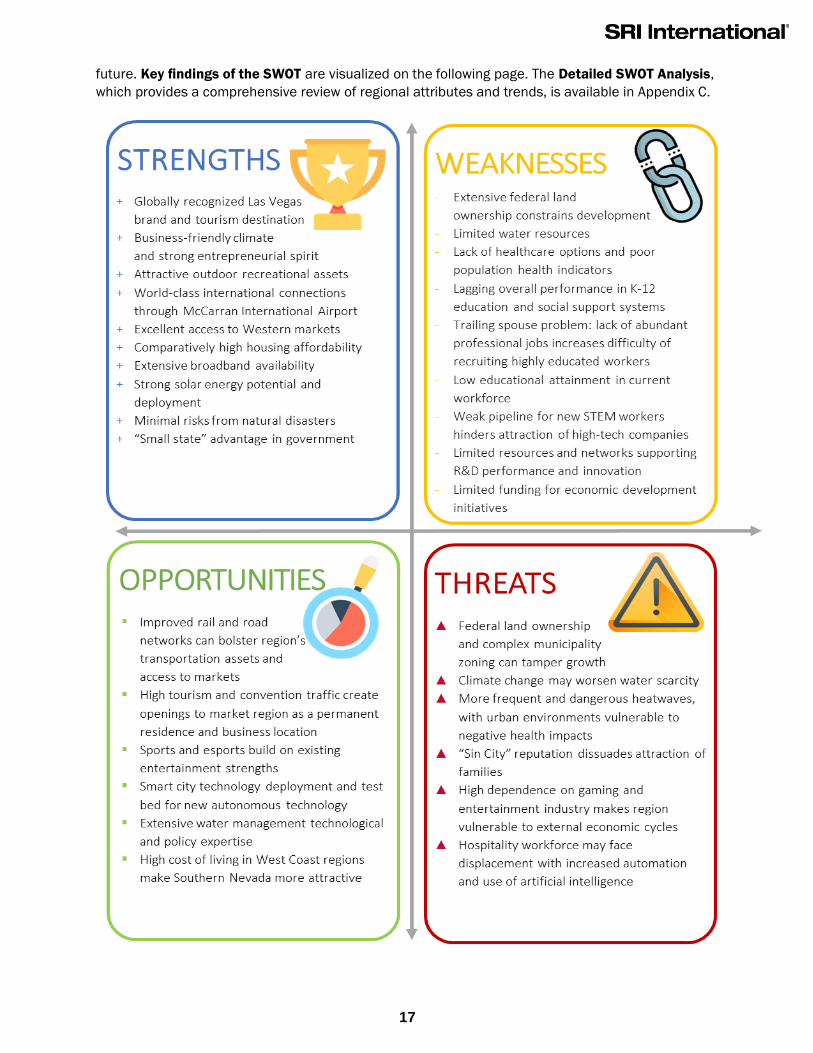
Strengths
Southern Nevada has achieved a globally
recognized brand built on its world-class
entertainment options. A business-friendly
climate, strong infrastructure and data
connectivity, and competitive cost of living
have enabled the region’s sustained
growth.
Weaknesses
Low educational attainment in the
region’s workforce and limited
resources for R&D and innovation
hinder growth in high-skill, high-wage
sectors. A scarcity of high-skill job
opportunities poses the “trailing
spouse” problem for dual-income
families.
Opportunities
Southern Nevada can enhance its
global connections and emerge as the
leading sports and entertainment
destination in the world. It can be a
dynamic testbed for smart city and
autonomous technology, and a global
policy and technology leader in water
management.
Threats
The region remains vulnerable to
external economic shocks, and its “Sin
City” reputation can deter families
from moving to the area. Its hospitality
workforce may face displacement with
increased automation and use of
artificial intelligence. Climate change
may worsen water scarcity and lead to
dangerous heatwaves.

Highlights of Southern Nevada’s Progress
Despite the impact of the pandemic on Southern Nevada’s communities and economy, the region
has made significant process over the last decade that leaves it better positioned to recover from
the pandemic-induced recession. Key institutions in the region have made significant achievements
and formed new initiatives and collaborations and continue to reach major milestones. Highlights of
Southern Nevada’s progress include the following:
Education &
Workforce Development
Southern Nevada’s post-secondary education
and training institutions have significantly
increased their offerings.
Notably, the University of Nevada, Las Vegas (UNLV)
doubled its research and development (R&D) performance
over the last decade and reached R1 status in 2018, the
highest classification for research universities.
Additionally, the newly formed UNLV School of Medicine
started class in 2017, and the university established Black
Fire Innovation, a hospitality and gaming hub supported by
collaborations with Intel and Caesars Entertainment.
Nevada State College (NSC) more than double its degree
awards since 2011, with especially strong growth in
awards to racial and ethnic minorities, and in health
professions that support a key regional target industry.
The College of Southern Nevada (CSN) was named as a
Leader College of Distinction by national non-profit
network Achieving the Dream in 2019 for its work on
improving student outcomes and reducing student
achievement gaps.
Innovation Ecosystem
In 2016, Las Vegas established an
Innovation District to spur smart-city
technology infrastructure and launched
the International Innovation Center @ Vegas
(IIC@V) incubator to support development of high
priority emerging technologies. Also, StartUpNV
launched the Southern Nevada Angel Conference
Seed Fund.
The Las Vegas-based Nevada Institute for
Autonomous Systems was designated in 2013 as
one of six official unmanned aircraft systems (UAS)
test sites in the United States, and the UNLV Tech
Park has quickly emerged as a hub for regional
innovation.
In July 2019, Google broke ground on a $600
million data center, and in October 2019 Switch
announced a partnership with UNLV to support
sports science R&D. Switch also expanded its
footprint in Southern Nevada to 4.6 million square
feet of data center space.
The Las Vegas Convention and Visitors Authority
(LVCVA) partnered with the Boring Company to
build a high-speed electric autonomous people
mover for the Las Vegas Convention Center.
Number of jobs
added between
2011 and 2019.
200,000
Number of new
business establishments
added between 2011
and 2019.
7,500
Milestone graduation
rate for Clark County
School District in 2019.
85% 50
Million
Record number of
passengers travelling
through McCarran
International Airport in 2019.
1
Introduction
This Comprehensive Economic Development Strategy (CEDS) presents a new plan for regional
economic development in Southern Nevada. The CEDS will provide essential guidance to regional
leaders across industry, government, nonprofits, and educational institutions in framing their
deliberations on the activities that have strategic economic value for the region. It was developed
with broad community participation, which was essential for developing a shared vision and set of
goals for Southern Nevada.
The Las Vegas Global Economic Alliance (LVGEA) plays a critical role in economic development as
Southern Nevada’s regional development authority. LVGEA has overseen the implementation of the
region’s previous CEDS, which was approved by the U.S. Economic Development Administration
(EDA) in 2013 and revised in 2016. LVGEA will take a leadership role in advancing this new strategy,
but its implementation requires a shared, coordinated effort across Southern Nevada’s institutions.
This strategy addresses Southern Nevada’s unique regional economic context while following EDA
guidelines for a CEDS. Major sections of the document include:
I. Summary Background and Economic Assessment. The Summary Background and
Economic Assessment evaluates Southern Nevada across a broad array of factors that
shape the region’s competitiveness. This quantitative analysis considers Southern
Nevada’s performance over time and in comparison to peer regions.
II. SWOT Analysis. The SWOT Analysis examines Southern Nevada’s regional strengths,
weaknesses, opportunities, and threats (SWOT). It is designed to enable Southern
Nevada to assess its current capabilities and understand how to work with them in order
to navigate future uncertainty.
III. Strategic Direction and Activities Plan. The Strategic Direction and Activities Plani lay
out an economic vision for Southern Nevada and describes the means by which the
region will achieve that vision. The Strategic Direction identifies where stakeholders
would like to be in the near- to mid-future, and the Activities Plan sets out how they will
work together to get there. This portion of the CEDS considers the regional assets and
external factors influencing Southern Nevada’s development examined in the Economic
Assessment and SWOT Analysis.
IV. Evaluation Framework. The Evaluation Framework provides a logic model for assessing
progress toward the goals of the CEDS and includes specific performance measures.
Supplementary information and the Detailed SWOT Analysis are provided in the appendices. The
Executive Summary, which begins on the following page, highlights key findings of the analyses and
briefly describes the vision, goals, and objectives of the strategy.
2
A Note on the Impact of the COVID-19 Pandemic in Southern Nevada
The COVID-19 Pandemic introduced significant headwinds for Southern Nevada’s economy.
Beginning in March 2020, large segments of local, regional, national, and international
economies began indefinite closures due to the public health emergency. The dominance of
tourism, gaming, and hospitality in Southern Nevada’s economy once again left the region
disproportionately affected by these closures and, like the Great Recession, the region faced
higher rates of unemployment than other U.S. metropolitan areas.
However, interventions by state and federal governments, as well as local stakeholders like
LVGEA, likely prevented the type of severe, protracted recession that Southern Nevada
experienced in 2010 and 2011 after the Great Recession. These interventions, coupled with the
rapid rollout of vaccines, have jumpstarted Southern Nevada’s recovery. However, actions
remain necessary to strengthen Southern Nevada’s economy in the near-term and fortify it in the
long-term.
The discussion that follows in this CEDS will make references to the impact of the pandemic;
however, the purpose of this document is not to detail a pandemic-recovery strategy for Southern
Nevada. Rather, this document will build off the CEDS that SRI provided to LVGEA in February
2020, maintaining the original dedication to a five-year economic development strategy. While
the pandemic has introduced near-term headwinds for the region and will continue to hamper
growth in Southern Nevada’s traditionally dominant industries, many of the trends identified in
the 2020 CEDS remain true a year after the beginning of the pandemic. Such trends include:
Las Vegas remains one of the United States’ fastest growing metropolitan areas,
attracting individuals from all age groups, but particularly retirees.
Southern Nevada’s economy remains robust, with strong growth between 2011 and 2019
and a rapidly evolving recovery in 2020 and 2021.
Workforce capabilities remain a key concern for regional employers, and regional
organizations such as LVGEA and the Clark County government have made workforce
development efforts a leading priority for the region’s pandemic recovery.
Educational attainment continues to improve in Southern Nevada, but a more skilled
workforce remains necessary for the development of new industries in the region.
Southern Nevada’s innovation ecosystem remains an area in need of further support if
the region is to grow its capabilities in next-generation industries like advanced
manufacturing.
As a result, many of SRI’s original recommendations remain relevant during the pandemic and
will likely remain critical for post-pandemic growth and diversification. Nevertheless, SRI has
revised the 2020 CEDS to include data that captures the impact of the COVID-19 pandemic,
where possible, and provided a modified Strategic Direction & Activities Plan.

3
Summary Background & Economic Assessment
The Summary Background and Economic Assessment evaluates Southern Nevada across a broad
array of factors that shape the region’s competitiveness. These factors include demographics,
general economic conditions, labor market attributes and educational attainment, trends in target
industry sectors, and innovation and entrepreneurship activity. This quantitative analysis considers
Southern Nevada’s performance over time and in comparison to peer regions; qualitative factors and
stakeholder insights are more thoroughly discussed in the subsequent SWOT analysis. The trend
analysis primarily uses 2011 as the baseline year given its significance as the period of most intense
economic distress in Southern Nevada due to the Great Recession. SRI selected peer regions in
consultation with LVGEA on a mix of criteria, including size, rate of growth, geographic proximity,
climate similarities, and shared industry sectors.
Methodological Note
Most of the data in the Summary Background and Economic Assessment is analyzed at the level
of the metropolitan statistical area (MSA), as defined by the U.S. Office of Management and
Budget. The Las Vegas-Henderson-Paradise MSA is coextensive with Clark County, Nevada. Clark
County is the only county in the Southern Nevada region as defined by the Nevada Governor’s
Vision 2025
Summary Background &
Economic Assessment A Comprehensive Economic Development
Strategy for Southern Nevada
Photo Courtesy of Mathieu Lebreton/Flickr
4
Office of Economic Development (GOED) and supported by LVGEA as the state-appointed
regional development authority (RDA).2 This report uses the terms Southern Nevada, greater Las
Vegas, and Las Vegas region/metro area interchangeably, and these should be seen as
equivalent.
Additionally, the names of the Las Vegas metro area and its peer regions may appear differently
in different tables and figures; this is due to differences in how the metro areas are named by
each data source. For example, the Las Vegas metro area may be referred to as Las Vegas-
Paradise, NV or Las Vegas-Henderson-Paradise, NV. Peer region names may also differ, such as
Phoenix-Mesa-Scottsdale, AZ and Phoenix-Mesa-Glendale, AZ. Regardless of the presented name
for the metro areas, the data provided comprehensively represents the various regions examined
in this report.
This analysis uses comprehensive datasets from Emsi, a commercial data service that integrates
economic and workforce data from a variety of data providers, as well as data gathered directly
from federal statistical agencies, such as the U.S. Census Bureau, Bureau of Economic Analysis,
and Bureau of Labor Statistics.
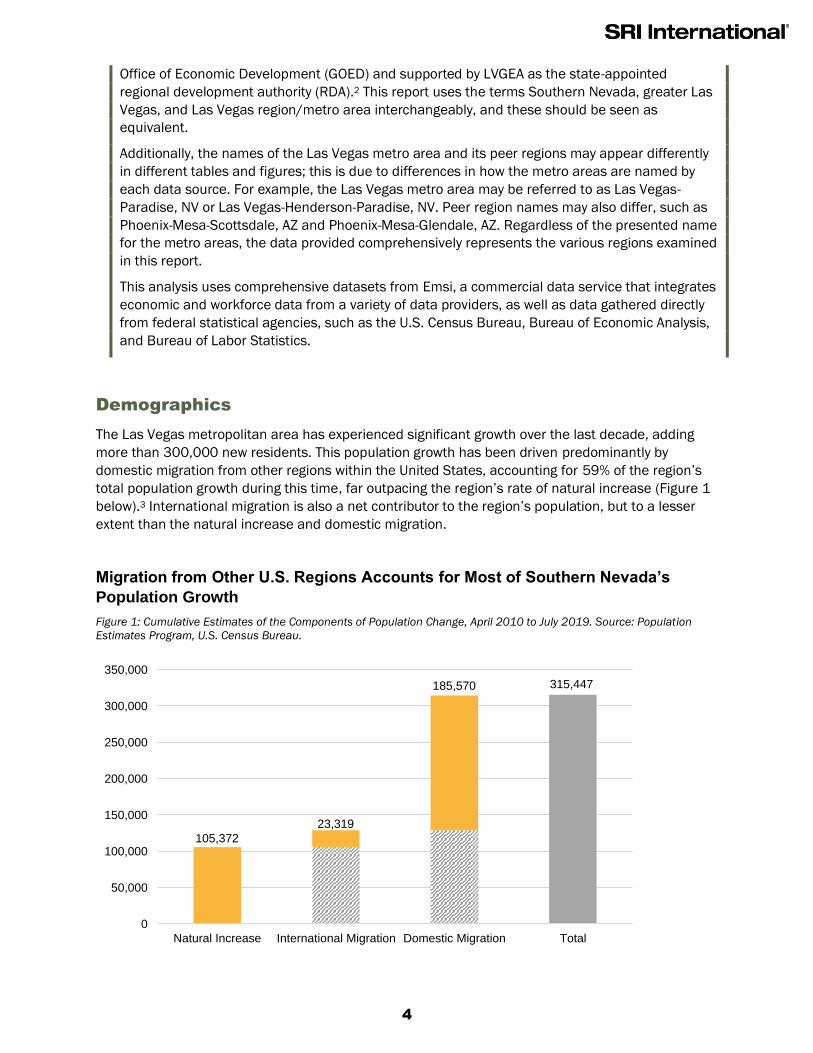
Demographics
The Las Vegas metropolitan area has experienced significant growth over the last decade, adding
more than 300,000 new residents. This population growth has been driven predominantly by
domestic migration from other regions within the United States, accounting for 59% of the region’s
total population growth during this time, far outpacing the region’s rate of natural increase (Figure 1
below).3 International migration is also a net contributor to the region’s population, but to a lesser
extent than the natural increase and domestic migration.
Migration from Other U.S. Regions Accounts for Most of Southern Nevada’s
Population Growth
Figure 1: Cumulative Estimates of the Components of Population Change, April 2010 to July 2019. Source: Population
Estimates Program, U.S. Census Bureau.
105,372
23,319
185,570 315,447
0
50,000
100,000
150,000
200,000
250,000
300,000
350,000
Natural Increase International Migration Domestic Migration Total

5
Overall, between 2011 and 2019, the region’s population grew by nearly 16%. Among the peer
regions selected for this analysis, only three metros grew at a quicker pace: Austin, Orlando, and
Phoenix. Figure 2 provides detail on population change in Las Vegas and its peer metro regions (see
Table 9, Table 10, and Figure 13 in Appendix D for more detailed demographic data).
Within this overall population increase, it is worthwhile to disaggregate trends for different age
groups. The growth rate for individuals aged 25–44 is of particular interest given that this group
captures early- and mid-career workers who are likely to make significant contributions to the
region’s workforce. For the Las Vegas metropolitan area, the population of this age group increased
by 7.6% between 2011 and 2019. As the figure shows, however, Las Vegas’ growth for those aged
25–44 is relatively low among its peer regions, ranking the Las Vegas metropolitan area ninth out of
the ten regions examined.
Southern Nevada has experienced a substantial increase in its population aged 65 and older, a
common trend among its peer metro areas, many of which are located in the Southwest (see Figure
13 in Appendix D). A variety of factors may be driving the increase in this population group, but these
likely include Southern Nevada’s favorable cost-of-living, especially as compared to neighboring
coastal states, as well as the relative stability and warmth of the region’s climate.
Southern Nevada’s Population has Grown Rapidly, Fueled by Those Aged 65+
Figure 2: Population Change in Las Vegas and its Peer Metro Areas, 2011-2019. Source: U.S. Census Bureau, Population
Division; American Community Survey.
% Change in Total: 15.5%% Change in 25-44: 7.6%
% Change in 65+: 47.5%
0% 10% 20% 30% 40% 50% 60% 70%
Albuquerque, NM
Sacramento-Roseville-Folsom, CA
Portland-Vancouver-Hillsboro, OR-WA
Salt Lake City, UT
Colorado Springs, CO
Denver-Aurora-Lakewood, CO
Las Vegas-Henderson-Paradise, NV
Phoenix-Mesa-Chandler, AZ
Orlando-Kissimmee-Sanford, FL
Austin-Round Rock-Georgetown, TX

6
General Economic Measures
Over the last decade, Southern Nevada has achieved strong gross domestic product (GDP) growth,
with GDP increasing by nearly 50% between 2011 and 2019 (Figure 3Error! Reference source not
found.). Growth in the Las Vegas metro accelerated in the latter half of the decade, placing the
region in the middle of the pack of its peer metros.
The Las Vegas Metro Area Has Experienced Strong GDP Growth
Figure 3: Index of GDP Growth for Las Vegas and Peer Metros (2011=100). Source: Bureau of Economic Analysis, Federal
Reserve Bank of St. Louis.
However, while data for 2020 are not yet available for MSA GDP, it is clear the pandemic has had a
negative impact on Southern Nevada’s economy, and it is likely the regional economic contraction
has moderated the gains made since 2011 (for example, see the rise in unemployment in Figure 5).
Despite general economic expansion prior to the pandemic, poverty rates increased for adults in Las
Vegas across all levels of educational attainment, climbing the highest for those with a high school
diploma or equivalent (Table 11). The increase in poverty rates follows a general trend shared by
many of Las Vegas’ peer metros, which have significantly expanded their economies and
populations. An increasing poverty rate can be a consequence of in-migration of lower income
populations rather than regional economic decline. Data from the Economic Innovation Group (EIG)
show that even as the poverty rate has increased, the percentage of Clark County’s population living
in distressed ZIP codes has more than halved, falling from 31.6% (2007–2011) to 14.1% (2014–
2018).4
100 101
105
109
117
122
128
139
146
100
110
120
130
140
150
160
170
2011 2012 2013 2014 2015 2016 2017 2018 2019
Las Vegas-Henderson-
Paradise, NV

7
Wages and Educational Attainment
Wages in Southern Nevada have shown moderate growth since the Great Recession. According to
the Bureau of Labor Statistics, the average wage in the region increased from $41,290 in 2011 to
$44,450 in 2017, an increase of almost 8%.5 However, data from the U.S. Census Bureau for the
same time period indicate that wages are not rising consistently across different education levels in
Southern Nevada; instead, the data suggest that wages are actually rising slowest for the highly
educated.6 This trend counteracts developments in peer regions and much of the rest of the nation,
where wages are increasing most quickly for those with higher levels of educational attainment. For
example, wages have increased by over 10% for workers with graduate degrees in the Portland and
Salt Lake City metros, while remaining static in the Las Vegas metro. Low-wage growth for higher
education levels produces disincentives on two fronts: Southern Nevada’s workers may not see a
need for further education, and highly educated workers located outside the region may fear a pay
decrease if they relocate to the area.
The Las Vegas metro still lags far behind peer regions in educational attainment (Table 1). Las Vegas
has the lowest concentration of adults with a bachelor’s degree and those with a graduate degree or
higher. Southern Nevada still struggles to develop and attract highly skilled workers.
Southern Nevada’s Labor Force Remains Concentrated in Lower Education
Levels
Table 1. Percentage of Adults 25 and Over by Highest Educational Attainment Among Peer Metros, 2019. Source:
American Community Survey, U.S. Census Bureau.
Metropolitan Area
High
School
Graduate
Some
College
Associates
Degree
Bachelor’s
Degree
Graduate
Degree or
Higher
Albuquerque, NM 25% 23% 9% 18% 14%
Austin-Round Rock-San Marcos, TX 19% 20% 6% 29% 16%
Colorado Springs, CO 21% 24% 11% 24% 15%
Denver-Aurora-Broomfield, CO 20% 20% 8% 28% 16%
Las Vegas-Paradise, NV 28% 25% 8% 16% 8%
Orlando-Kissimmee-Sanford, FL 26% 20% 12% 21% 11%
Phoenix-Mesa-Glendale, AZ 23% 24% 9% 20% 11%
Portland-Vancouver-Hillsboro, OR-WA 20% 24% 9% 25% 15%
Sacramento--Arden-Arcade--Roseville, CA 21% 25% 10% 22% 12%
Salt Lake City, UT 23% 24% 9% 22% 13%
Southern Nevada has experienced some growth in the percentage of adults with a bachelor’s degree
or higher, but not to the same extent as its peer regions (Figure 4). The Las Vegas metro only saw a
2.4 percentage point increase in the share of people 25 years or older with a bachelor’s degree or
higher. While Las Vegas is growing rapidly, it is still lagging peer metropolitan areas in expanding its
educated workforce.

8
Las Vegas Lags in Developing and Attracting High-Skilled Workers
Figure 4: Percentage Point Change in the Share of Population Over 25 with a Bachelor’s Degree or Higher among Peer
Metropolitan Areas, between 2011 and 2019. Source: American Community Survey, U.S. Census Bureau.
Employment
Prior to the pandemic recession, Southern Nevada experienced rapid job growth. Total employment
in all sectors increased by roughly 17%, from about 876,000 in 2011 to 1,086,000 in 2019.
Concurrently, the unemployment rate in the region fell sharply. As Figure 5 shows, the Las Vegas
metropolitan area followed peer metropolitan regions’ trends in reducing unemployment between
2011 and 2019, falling from 13.2% to under 4.0%. However, the pandemic has rapidly increased the
levels of unemployment in Southern Nevada, and the region’s annual average for 2020 was 4.5
percentage points higher than the next-highest metro area (Orlando, FL). By February 2021, the
unemployment rate in Las Vegas had fallen to 9.3%, though remained higher than the U.S. average
(6.6%) and all peer metro areas.7
0.0 1.0 2.0 3.0 4.0 5.0 6.0 7.0
Portland-Vancouver-Hillsboro, OR-WA
Denver-Aurora-Broomfield, CO
Austin-Round Rock-San Marcos, TX
Salt Lake City, UT
Orlando-Kissimmee-Sanford, FL
Colorado Springs, CO
Sacramento--Arden-Arcade--Roseville, CA
Phoenix-Mesa-Glendale, AZ
Albuquerque, NM
Las Vegas-Paradise, NV

9
Prior to the Pandemic, Southern Nevada Had Rapidly Reduced Unemployment
Figure 5: Unemployment Rate among Peer Metropolitan Areas, by Year, 2011-2020. Source: Bureau of Labor Statistics,
Local Area Unemployment Statistics.
Southern Nevada Target Industry Trends
In 2017, LVGEA undertook a target industry validation study to identify specific industries that have
the potential to grow significantly in Southern Nevada, compared to most other industries.8 These
industries, adapted from prior targets in the 2011 SRI-Brookings report,9 included the following:
Autonomous Systems
Business Headquarters and Services
Emerging Technology
Finance, Banking, and Insurance
Gaming, Tourism, and Conventions
Health Care Services and Medical
Education
Logistics, Manufacturing, and Supply
Chain Management
Since 2017, Southern Nevada has made progress in diversifying its economy by growing
employment in the above target industries. Certain industries—such as Emerging Technology (+89%)
and Logistics, Manufacturing, and Supply Chain Management (+61%)—have significantly grown their
share of total employment in Southern Nevada. Overall, between 2011 and 2017 employment in
these target industries grew by about 20%, though their overall share of total employment in the
region remained relatively flat (about 56%). For a more comprehensive examination of shifts in
Southern Nevada’s 2017 target industries, please see Table 12 in Appendix D.
In early 2021, LVGEA contracted SRI to revisit the existing target industries to determine if LVGEA
should pursue opportunities in new industries that were not captured in the current set of targets.
SRI’s study of new target industries found that while several of the existing target industries were
well-aligned with Southern Nevada’s capabilities and ambitions, there were emerging opportunities
that had not yet been identified. In addition to identifying these new targets, SRI identified a series of
component industries related to each target that can be used to monitor the composition of growth
more closely within each target industry.
13.2%
11.3%
9.7%
8.0%
6.8%5.8%
5.2%4.7%
4.0%
14.7%
0%
2%
4%
6%
8%
10%
12%
14%
16%
2011 2012 2013 2014 2015 2016 2017 2018 2019 2020
Las Vegas-Henderson-Paradise, NV

10

11
By 2019, these new target industries represented slightly more than 33% of total employment in
Southern Nevada and, despite the pandemic, this number reached almost 35% in 2020 (see Table 2
below). While this share is smaller than the previous set of target industries, this is largely due to the
exclusion of gaming, tourism, and hospitality from the new target industries. Gaming, tourism, and
hospitality will continue to play a prominent role in the region’s economy due to the comparative
advantage Southern Nevada has in this industry over other regions of the United States. However,
the region will need to create programs and initiatives, such as workforce development partnerships,
that make Southern Nevada a competitive location for businesses in the new target industries.
Southern Nevada’s New Target Industries Represent an Increasing Share of the
Region’s Total Employment
Table 2: Changes in Target Industry Employment, 2011–2019. Source: Emsi.
Target Industry 2011
Employment
2019
Employment
Percent
Change
2011
Employment
Share
2019
Employment
Share
Total Target Industries 229,898 340,751 +48.2% 28.7% 33.2%
General & Advanced Manufacturing 18,615 24,420 +31.2% 2.3% 2.4%
Business & Financial Services 101,074 140,691 +39.2% 12.6% 13.7%
Creative Industries 14,332 17,157 +19.7% 1.8% 1.7%
Clean Technologies 14,981 21,352 +42.5% 1.9% 2.1%
Transportation & Logistics Technologies 16,529 33,822 +104.6% 2.1% 3.3%
Information & Communication Technologies 10,500 26,283 +150.3% 1.3% 2.6%
Healthcare Services 53,866 77,025 +43.0% 6.7% 7.5%
Growth within each target industry is usually driven by a primary component industry. Between 2011
and 2019, growth in General & Advanced Manufacturing was driven by General Manufacturing
(+44%); by Management & Professional Services (+55%) in Business & Financial Services; by
Entertainers & Supporting Services (+24%) in Creative Industries; by HVAC & Plumbing Contractors
(+97%) in Clean Technologies; by Distribution & Warehousing (+165%) in Transportation & Logistics
Technologies; by ICT Professional Services (+232%) in Information & Communications Technologies;
and by General & Specialist Healthcare Services (+39%) in Healthcare Services. For a more detailed
discussion of trends within Southern Nevada’s new target industries, see Target Industry Validation
Study: Revisiting Southern Nevada’s Approach to Economic Diversification.10
The use of component industries within the new target industries allows LVGEA to track not only
employment dynamics within a target industry, but also wage variation between different component
industries within a target industry. Because employment growth is driven by employment changes in
higher- and lower-paying industries, it is important for the target industries to capture higher- and
lower-paying industries. Figure 6 below provides a range of average wages across Southern
Nevada’s new target industries. The range of each target industry is comprised of the average wages
for each industry’s component industries.

12
Wages Vary Significantly among Southern Nevada’s Target Industries
Figure 6: Range of Average Earnings for Southern Nevada's New Target Industries. Source: Emsi.
Methodological Note
Target industry estimates are based on analysis of employment and wage data as measured at
the 6-digit North American Industry Classification System (NAICS) level in the Emsi platform. Data
limitations place some qualifications on our conclusions. First, some industry sub-sectors are
common across multiple target industries. Summing employment figures across industries will
result in an overestimate of total target industry employment. As a result, sub-sectors that occur
in more than one industry have been listed only once in a single target industry, rather than
duplicated across several target industries. This minimizes overestimations in the data that may
show some target industries as larger than they are. Secondly, data are occasionally suppressed
at the detailed NAICS levels to avoid disclosure of sensitive information. Despite these
limitations, it remains feasible to evaluate employment and wage trends in the industries of
greatest interest to LVGEA.
Innovation and Entrepreneurship
Southern Nevada is known for its creative and entrepreneurial culture, but regional activity related to
innovation and high-technology business formation and growth is limited. Stakeholders and
policymakers have created new and exciting initiatives and institutions (discussed later in the SWOT
Analysis) to bolster the region’s innovation ecosystem, yet some indicators suggest that Southern
Nevada continues to experience a dearth of innovation resources and activity.
The University of Nevada, Las Vegas (UNLV) is Southern Nevada’s leading public research university
and, as such, is among the region’s most significant innovation assets. UNLV has roughly doubled its
level of research and development (R&D) performance over the last decade and has recently
achieved an R1 research university classification,11 indicative of rising academic research intensity.
$-
$20,000
$40,000
$60,000
$80,000
$100,000
$120,000
$140,000
$160,000
$180,000
General &Advanced
Manufacturing
Business &FinancialServices
CreativeIndustries
CleanTechnologies
Transportation& Logistics
Technologies
Information &CommunicationTechnologies
HealthcareServices

13
The distribution of UNLV’s R&D expenditures varies significantly from the average for all U.S. higher
educational institutions. Expenditures in life sciences R&D make up 26% of the total at UNLV,
considerably lower than the national average of 58%. In contrast, UNLV has a much higher R&D
concentration in fields outside of science and engineering (S&E): 25% of UNLV’s expenditures are in
non-S&E fields, over four times more than the average (Figure 7). Within these non-S&E fields, R&D
in business management and administration at UNLV is roughly on par with the national average,
and R&D in visual and performing arts is significantly higher, indicative of a close alignment with
Southern Nevada’s unique regional economy.12
Compared to the Average University, UNLV Concentrates R&D Less in Life
Sciences and Far More in Fields Outside of Science and Engineering
Figure 7: Percent Distribution of R&D Spending at UNLV and All U.S. Higher Education Institutions, 2018. Source: National
Center for Science and Engineering Statistics, Higher Education Research and Development Survey.
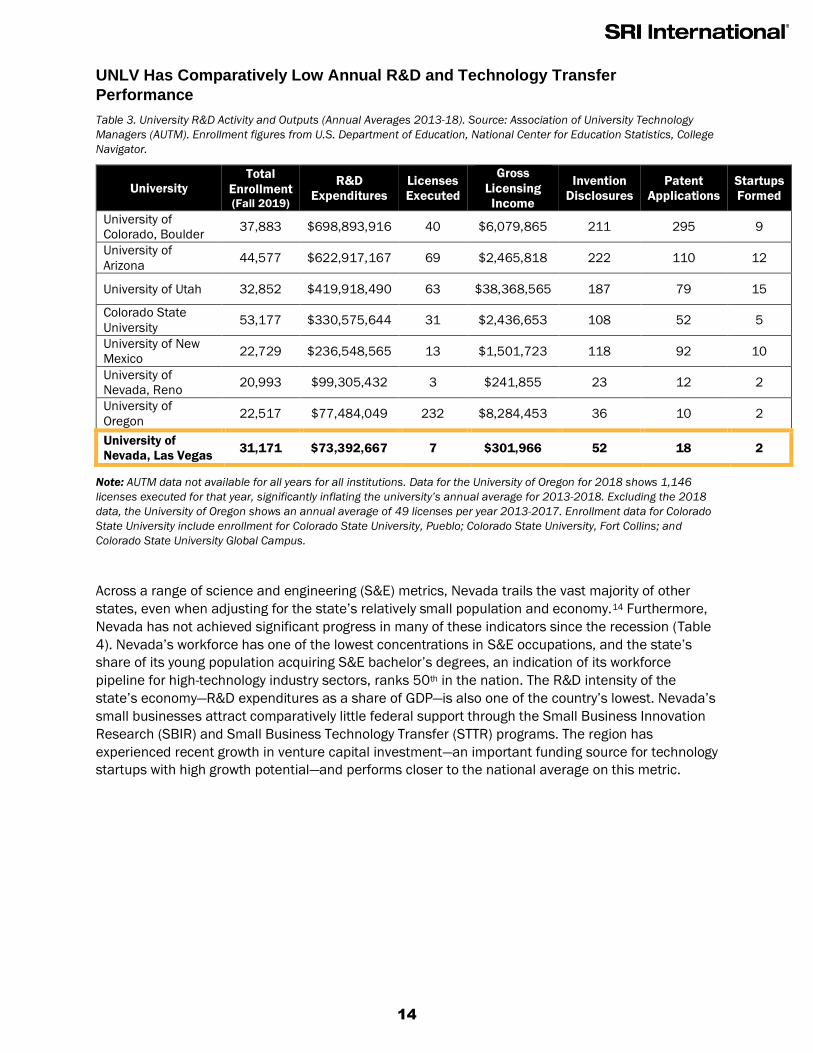
Despite UNLV’s increase in R&D expenditures, closer examination shows that institution research
and technology transfer activity remain comparatively low overall (Table 3). Relative to similarly sized
research universities in neighboring states, UNLV has vastly lower R&D expenditures, averaging
roughly $73 million per year in recent years.13 In terms of innovation outputs such as licenses,
invention disclosures, patents, and startup creation, the university also lags by a significant margin.
All U.S. Institutions
University of Nevada, Las Vegas
0% 10% 20% 30% 40% 50% 60% 70%
Psychology
Other Sciences
Mathematics and Statistics
Computer and Information Sciences
Social Sciences
Earth Sciences
Physical Sciences
Engineering
Non-S&E Fields
Life Sciences
14
UNLV Has Comparatively Low Annual R&D and Technology Transfer
Performance
Table 3. University R&D Activity and Outputs (Annual Averages 2013-18). Source: Association of University Technology
Managers (AUTM). Enrollment figures from U.S. Department of Education, National Center for Education Statistics, College
Navigator.
University Total
Enrollment (Fall 2019)
R&D
Expenditures
Licenses
Executed
Gross
Licensing
Income
Invention
Disclosures
Patent
Applications
Startups
Formed
University of
Colorado, Boulder 37,883 $698,893,916 40 $6,079,865 211 295 9
University of
Arizona 44,577 $622,917,167 69 $2,465,818 222 110 12
University of Utah 32,852 $419,918,490 63 $38,368,565 187 79 15
Colorado State
University 53,177 $330,575,644 31 $2,436,653 108 52 5
University of New
Mexico 22,729 $236,548,565 13 $1,501,723 118 92 10
University of
Nevada, Reno 20,993 $99,305,432 3 $241,855 23 12 2
University of
Oregon 22,517 $77,484,049 232 $8,284,453 36 10 2
University of
Nevada, Las Vegas 31,171 $73,392,667 7 $301,966 52 18 2
Note: AUTM data not available for all years for all institutions. Data for the University of Oregon for 2018 shows 1,146
licenses executed for that year, significantly inflating the university’s annual average for 2013-2018. Excluding the 2018
data, the University of Oregon shows an annual average of 49 licenses per year 2013-2017. Enrollment data for Colorado
State University include enrollment for Colorado State University, Pueblo; Colorado State University, Fort Collins; and
Colorado State University Global Campus.
Across a range of science and engineering (S&E) metrics, Nevada trails the vast majority of other
states, even when adjusting for the state’s relatively small population and economy.14 Furthermore,
Nevada has not achieved significant progress in many of these indicators since the recession (Table
4). Nevada’s workforce has one of the lowest concentrations in S&E occupations, and the state’s
share of its young population acquiring S&E bachelor’s degrees, an indication of its workforce
pipeline for high-technology industry sectors, ranks 50th in the nation. The R&D intensity of the
state’s economy—R&D expenditures as a share of GDP—is also one of the country’s lowest. Nevada’s
small businesses attract comparatively little federal support through the Small Business Innovation
Research (SBIR) and Small Business Technology Transfer (STTR) programs. The region has
experienced recent growth in venture capital investment—an important funding source for technology
startups with high growth potential—and performs closer to the national average on this metric.

15
Nevada Continues to Rank Low in Its Innovation Resources and Activity
Table 4. Nevada values and rankings for selected science and engineering indicators. Source: National Science Board.
2018. Science and Engineering Indicators 2018, State Indicators (NSB-2018-1).
Indicator 2010 Rank
2018
(or most recent
year)
Rank
S&E Bachelor’s Degrees Conferred per
1,000 Individuals 18–24 Years Old 8.50 50 12.78 50
S&E Occupations as a Percentage of All
Occupations 2.41% 47 2.43% 44
R&D as a Percentage of GDP 0.76% 45 0.54%
(2017) 50
Business R&D as a Percentage of Private
Industry Output 0.65% 37
0.45%
(2017) 43
Average Annual SBIR and STTR Funding
per $1 Million GDP
$44.39
(2010–12 avg) 44
$35.17
(2014–16 avg.) 42
Venture Capital Disbursed per $1 Million
GDP $232.12 38
$469.53
(2017) 36

16
SWOT Analysis
The SWOT analysis examines Southern Nevada’s regional strengths, weaknesses, opportunities, and
threats (SWOT). The SWOT reviews the following elements:
Strengths are regional competitive advantages. They refer to what is satisfactory in the present and
are primarily internal.
Weaknesses are regional competitive disadvantages. They refer to what is currently unsatisfactory
and are primarily internal.
Opportunities are chances or occasions for regional improvement or progress. They refer to
emerging trends that present openings for growth and resilience and are primarily external.
Threats are chances or occasions for negative impacts on the region or regional decline. They refer
to emerging trends that present obstacles to growth and resilience and are primarily external.15
The SWOT analysis is designed to enable Southern Nevada to assess its current capabilities and
understand how to work with them in order to navigate future uncertainty. It is a critical part of the
CEDS as it illuminates regional vulnerabilities to economic and environmental shocks and helps
guide subsequent economic development strategy toward enhanced resiliency. The results of the
SWOT guide the subsequent Strategic Direction and Activities Plan of the CEDS.
The SWOT analysis synthesizes stakeholder interview and workshop input with a detailed review of
social, economic, education, industry, and environmental data relevant to the region’s economic
Vision 2025
SWOT Analysis A Comprehensive Economic Development
Strategy for Southern Nevada
Photo Courtesy of Tiomax80/Flickr
17
future. Key findings of the SWOT are visualized on the following page. The Detailed SWOT Analysis,
which provides a comprehensive review of regional attributes and trends, is available in Appendix C.

18
Vision 2025
Strategic Direction
& Action Plan A Comprehensive Economic Development
Strategy for Southern Nevada
Photo Courtesy of Bert Kaufmann/Flickr
Strategic Direction & Activities Plan
The Strategic Direction and Activities Plan lay out an economic vision for Southern Nevada and
describes the means by which the region will achieve that vision. The Strategic Direction identifies
where stakeholders would like to be in the near- to mid-future, and the Activities Plan sets out how
they will work together to get there. This portion of the CEDS considers the regional assets and
external factors influencing Southern Nevada’s development examined in the Economic Assessment
and SWOT Analysis.
The Strategic Direction is composed of a vision, goals, and objectives. The vision describes a
desired future for Southern Nevada that reflects the collective aspirations of regional stakeholders. A
small set of broad goals is articulated, which, if achieved, will help Southern Nevada realize this
vision. Each goal is then disaggregated into specific, measurable objectives to be accomplished.
Community involvement is critical to the formation of a compelling and broadly shared vision. To that
end, interviews and stakeholder visioning sessions were held with representatives from dozens of
organizations across Southern Nevada. Stakeholder engagement revealed a range of aspirations
spanning economic competitiveness and diversification, workforce development, quality of life,
regional identity, and social connection. Accordingly, the goals of this CEDS relate to Southern
Nevada’s economic development understood broadly—supporting durable, long-term gains in the

19
region’s economic and social well-being. In short, the goals and objectives of this CEDS aim to make
Southern Nevada the best place it can be for businesses and for communities. Additional
information on stakeholder engagement and participant comments is available in Appendix B.
The Activities Plan translates the content of the Strategic Direction into concrete steps to be taken
by Southern Nevada’s stakeholders in support of regional development goals. It describes the
specific activities to be performed and designates lead and supporting organizations responsible for
conducting these activities. Each activity has an approximate time frame for execution over a 5-year
period, as well as a rough indication of resources required to conduct the activity. Some activities
may require little to no additional resources, whereas others are conditional on new financial
commitments. This distinction should be noted when evaluating the implementation of the CEDS.
Resilience
The intense socioeconomic distress and high unemployment that Southern Nevada encountered
during the Great Recession demonstrated the region’s vulnerability to external shocks in stark terms.
Strengthening resilience—the ability to prevent, withstand, and quickly recover from shocks—should
be central to Southern Nevada’s economic strategy. Two important drivers of potential shocks
emerged from the SWOT. First is the loss of gaming- and tourism-derived income and government
revenue that can result from greater economic downturns, as consumers cut back on discretionary
spending and travel to destinations like Southern Nevada. Second is climate change, which is likely
to exacerbate regional water scarcity and fuel increasingly dangerous heatwaves. Many of the goals
and objectives presented in the Strategic Direction and Activities Plan are formulated to address
these threats.
Strategic Direction
Vision
Vision: Southern Nevada is a global center for enterprise, imagination, and new experience, driven
by innovation in entertainment, industry, and technology.
Crucial drivers of the region’s success will be a business-ready environment that fosters
entrepreneurship and continued progress toward a diversified economy with high-skill, high-wage
jobs. Success also requires that Southern Nevada offer residents quality education and flexible
opportunities to acquire new skills so they can meet the needs of the region’s industries and adapt
to an evolving labor market. Promotion of regional quality of life, increased availability of healthcare
services, and greater social engagement will help attract and retain the human capital required to
power the region’s economy. Enhanced connections in transportation, data, and business networks
will boost commerce and collaboration. Finally, a proactive mindset, coupled with bold and creative
approaches, will keep Southern Nevada resilient in the face of technological and environmental
change in the next decade and beyond.
Community Vision Components
Participants in stakeholder engagement exercises imagined what success looks like for Southern
Nevada. Each participant submitted his or her top three most important components of that vision of
success. The figure below visualizes the most common words across participant submissions (see
Appendix B for more details on stakeholder exercises).
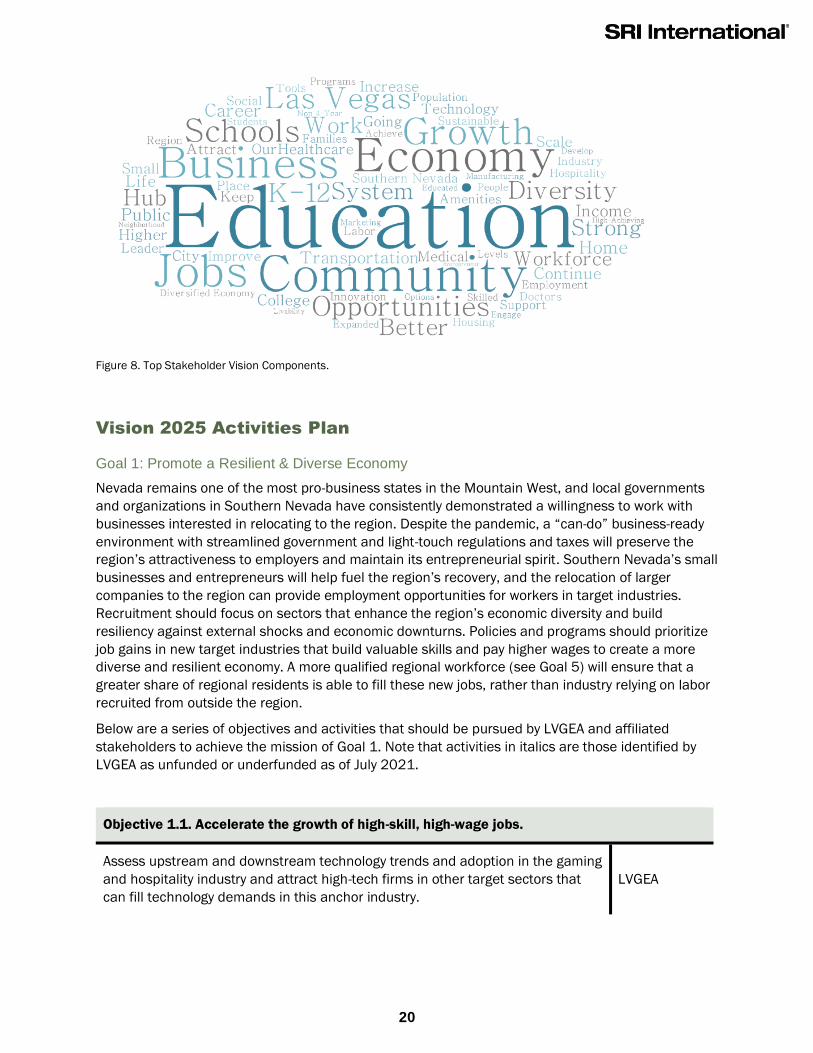
20
Figure 8. Top Stakeholder Vision Components.
Vision 2025 Activities Plan
Goal 1: Promote a Resilient & Diverse Economy
Nevada remains one of the most pro-business states in the Mountain West, and local governments
and organizations in Southern Nevada have consistently demonstrated a willingness to work with
businesses interested in relocating to the region. Despite the pandemic, a “can-do” business-ready
environment with streamlined government and light-touch regulations and taxes will preserve the
region’s attractiveness to employers and maintain its entrepreneurial spirit. Southern Nevada’s small
businesses and entrepreneurs will help fuel the region’s recovery, and the relocation of larger
companies to the region can provide employment opportunities for workers in target industries.
Recruitment should focus on sectors that enhance the region’s economic diversity and build
resiliency against external shocks and economic downturns. Policies and programs should prioritize
job gains in new target industries that build valuable skills and pay higher wages to create a more
diverse and resilient economy. A more qualified regional workforce (see Goal 5) will ensure that a
greater share of regional residents is able to fill these new jobs, rather than industry relying on labor
recruited from outside the region.
Below are a series of objectives and activities that should be pursued by LVGEA and affiliated
stakeholders to achieve the mission of Goal 1. Note that activities in italics are those identified by
LVGEA as unfunded or underfunded as of July 2021.
Objective 1.1. Accelerate the growth of high-skill, high-wage jobs.
Assess upstream and downstream technology trends and adoption in the gaming
and hospitality industry and attract high-tech firms in other target sectors that
can fill technology demands in this anchor industry.
LVGEA

21
Monitor trends in Southern Nevada’s target industries and redefine targets as
new industry clusters and economic development opportunities emerge. LVGEA
Research potential economy-wide shifts and disruptions driven by new
technology and identify vulnerable sectors and occupations. LVGEA
Objective 1.2. Encourage a business-ready environment that enables entrepreneurship.
Conduct a survey of regional small- and medium-sized enterprises to identify
issues that entrepreneurs face when starting, maintaining, and growing their
businesses (e.g., permitting, regulatory, tax, infrastructure, zoning, and land use).
LVGEA,
Chambers of
Commerce
Facilitate the development of partnership programs that educate Southern
Nevadans about the potential of entrepreneurship.
LVGEA,
Chambers of
Commerce,
SBDC
Support the preservation of Nevada’s pro-business advantages relative to higher
cost regional competitors.
LVGEA,
Chambers of
Commerce
Support the retention and expansion of community banks in Southern Nevada,
providing a critical funding resource to the region’s entrepreneurs. LVGEA
Objective 1.3. Support the growth of existing Nevada businesses and help them expand within
and beyond the region.
Assist existing Southern Nevadan businesses in reaching new markets by
connecting them to resources (e.g., financial, professional, etc.) and
decisionmakers.
LVGEA, Cities,
Clark County,
Chambers of
Commerce
Continue to provide events, resources, and networking opportunities for
Southern Nevadan firms to make business connections and form new
partnerships.
LVGEA,
Chambers of
Commerce
Increase utilization of Southern Nevada’s foreign trade zone through expanded
freight rail integration with regional firms. LVGEA
Provide economic forecasting and market trend identification to help companies
prepare for upcoming opportunities. LVGEA
Implement regional business retention and expansion program (BizCONNECT) to
connect businesses with available resources and identify business satisfaction
levels, growth opportunities, and barriers.
LVGEA, Cities,
Clark County
Objective 1.4. Ensure sufficient land, infrastructure, and resources are available for new
development in Southern Nevada.

22
Continue to work with local, state, and federal lawmakers to identify land parcels
for potential future development.
Clark County,
Cities, GOED,
LVGEA,
NAIOP, SIOR
Execute a feasibility study for the Jean Industrial Complex to determine the best
development opportunities for this area (e.g., advanced manufacturing, logistics)
and the necessary infrastructure.
LVGEA
Collaborate with city and county leaders in developing an infill strategy
(residential and commercial) for Southern Nevada.
Clark County
OCED, Cities
Deploy clean technology-related infrastructure, including expanded access to
electric vehicle charging stations and industry-specific clean energy solutions.
NV Energy,
RTC, Cities,
County
Coordinate with city and county agencies to integrate transportation and land
use planning through transit-oriented development to enhance access, promote
housing diversity, and increase economic development
RTC, Cities,
County
Objective 1.5. Promote and coordinate access to federal, state, and local economic recovery
programs and services.
Maintain and update the Business Information Network (BIN) as needed.
LVGEA,
Chambers of
Commerce
Provide marketing support and/or events to raise awareness of COVID-19
business recovery resources and programs.
LVGEA,
Chambers of
Commerce,
Cities
Objective 1.6. Increase Southern Nevada’s appeal to young families and professionals.
Gauge unmet needs for local family-friendly attractions that would increase
attraction and retention of families (for example, through surveys and focus
groups).
LVGEA
Provide community welcome and engagement resources to new residents,
especially young professionals.
LVGEA,
Chambers of
Commerce
Continue to conduct the “Here You Can” initiative and advertise Southern
Nevada as a desirable location for businesses and place to live for families. LVGEA
Expand the “Here You Can” initiative to promote Las Vegas’s quality of life
attributes to outside talent. LVGEA

23
Goal 2: Connect People, Businesses, & Ideas
Connections—physical, digital, and social—sustain Southern Nevada’s economic dynamism, and the
COVID-19 pandemic has highlighted the value of these connections to the region’s communities.
Further developing the region’s physical infrastructure, such as by swiftly building out 5G networks
and closing its remaining digital divides, will enable Las Vegas to claim a leadership position as the
data capital of the Mountain West. The region has many strengths in physical infrastructure and road
networks, but limited commuting options outside of personal auto transport will hamper its growth.
New transportation connections between key tourist and business destinations will further expand
the region’s capacity for commerce and deliver a more attractive experience for visitors.
Strengthening institutional infrastructure—such as business collaboration frameworks or
entrepreneurship funding networks—will foster new connections, creative partnerships, and
entrepreneurial collaborations.
Below are a series of objectives and activities that should be pursued by LVGEA and affiliated
stakeholders to achieve the mission of Goal 2. Note that activities in italics are those identified by
LVGEA as unfunded or underfunded as of July 2021.
Objective 2.1. Become the Data Capital of the Mountain West through expansions in 5G
infrastructure, ICT businesses, and broadband access.
Close the remaining digital divides in Southern Nevada by increasing internet
access for underserved populations and enabling broader participation in the
region’s digital economy.
Internet
service
providers,
Cities, Clark
County
Pursue opportunities to recruit information and communication technology
companies to Southern Nevada at major information and communication
technology events.
LVGEA
Boost collaboration between resorts, technology companies, and researchers to
accelerate development and deployment of innovations in gaming and
hospitality.
UNLV
Economic
Development
Build out 5G networks to improve the speed and reliability of regional data
connections.
Internet
Service
Providers
Objective 2.2. Encourage effective business collaborations, including partnerships between
startups and established, larger businesses.
Develop “buy local” supply chain strategies to connect area small businesses
with resorts.
LVGEA,
Chambers of
Commerce,
Cities, Clark
County

24
Explore the establishment of a Technology Association or Council for Southern
Nevada that promotes the region’s technology industry and supports
technology talent recruitment, development, and networking.
LVGEA
Form minority-owned small business collaboration groups with larger business
partner anchors to share best practices, provide mentoring services, and
increase networking opportunities.
LVGEA,
Chambers of
Commerce
Advance incubator, accelerator, and makerspace facilities throughout Southern
Nevada (for example, UNLV’s Black Fire innovation Hub, UNLV Incubator, City of
Las Vegas’s International Innovation Center, and Switch’s Innevation Center).
UNLV, Switch,
City of Las
Vegas
Objective 2.3. Pursue new connections between regional transportation hubs and key tourist
and business destinations.
Explore opportunities to deploy innovative transportation solutions that more
seamlessly move visitors from McCarran International Airport to local
businesses, the Strip, and other key attractions in Southern Nevada.
RTC, Cities,
County,
Transportation
Companies
Pilot innovative transportation services for convention and conference visitors. LVCVA
Increase the frequency, capacity, and reach of public transportation service in
the greater Las Vegas metropolitan area. RTC
Incentivize and market commuting options that reduce the portion of workers
driving along to their place of work (for example, park and ride lots, Clube Ride
incentives, employer-sponsored subsidies, “car-free diet” resources).
RTC
Coordinate with regional stakeholders to implement the High-Capacity Transit
Network (HCT) identified in the On Board Mobility Plan to connect activity
centers located throughout the region.
RTC, Cities,
County
25
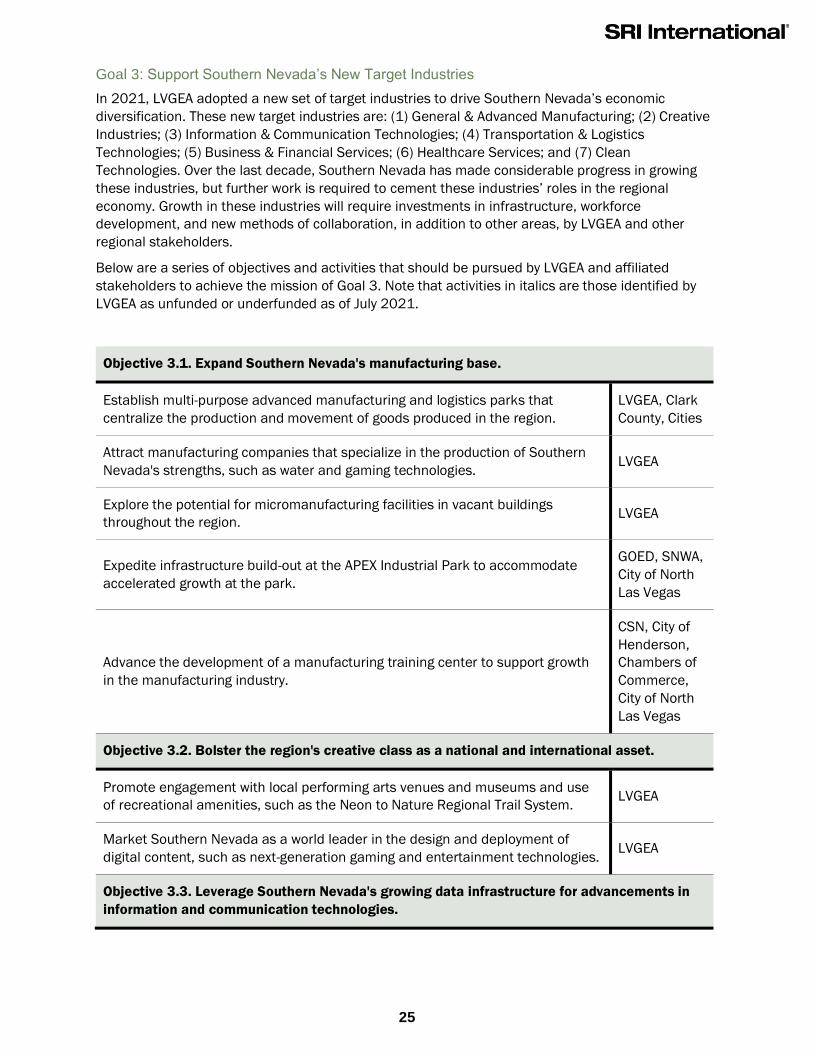
Goal 3: Support Southern Nevada’s New Target Industries
In 2021, LVGEA adopted a new set of target industries to drive Southern Nevada’s economic
diversification. These new target industries are: (1) General & Advanced Manufacturing; (2) Creative
Industries; (3) Information & Communication Technologies; (4) Transportation & Logistics
Technologies; (5) Business & Financial Services; (6) Healthcare Services; and (7) Clean
Technologies. Over the last decade, Southern Nevada has made considerable progress in growing
these industries, but further work is required to cement these industries’ roles in the regional
economy. Growth in these industries will require investments in infrastructure, workforce
development, and new methods of collaboration, in addition to other areas, by LVGEA and other
regional stakeholders.
Below are a series of objectives and activities that should be pursued by LVGEA and affiliated
stakeholders to achieve the mission of Goal 3. Note that activities in italics are those identified by
LVGEA as unfunded or underfunded as of July 2021.
Objective 3.1. Expand Southern Nevada's manufacturing base.
Establish multi-purpose advanced manufacturing and logistics parks that
centralize the production and movement of goods produced in the region.
LVGEA, Clark
County, Cities
Attract manufacturing companies that specialize in the production of Southern
Nevada's strengths, such as water and gaming technologies. LVGEA
Explore the potential for micromanufacturing facilities in vacant buildings
throughout the region. LVGEA
Expedite infrastructure build-out at the APEX Industrial Park to accommodate
accelerated growth at the park.
GOED, SNWA,
City of North
Las Vegas
Advance the development of a manufacturing training center to support growth
in the manufacturing industry.
CSN, City of
Henderson,
Chambers of
Commerce,
City of North
Las Vegas
Objective 3.2. Bolster the region's creative class as a national and international asset.
Promote engagement with local performing arts venues and museums and use
of recreational amenities, such as the Neon to Nature Regional Trail System. LVGEA
Market Southern Nevada as a world leader in the design and deployment of
digital content, such as next-generation gaming and entertainment technologies. LVGEA
Objective 3.3. Leverage Southern Nevada's growing data infrastructure for advancements in
information and communication technologies.

26
Develop data center and cybersecurity training programs at the certificate,
associate's, and bachelor's degree and higher levels.
Area higher
education,
post-
secondary
training
providers
Assess opportunities for capturing technology and innovation spillovers from
local military facilities and activities to spur innovation in the private sector,
including the region’s commercial UAS industry.
LVGEA, Nellis
AFB, AFWERX
Test and deploy AI, autonomous technology, and information technology that
optimize traffic and infrastructure use, assist first responders, and coordinate
public services.
RTC, Cities,
County
Objective 3.4. Capitalize on Southern Nevada's connectivity to major domestic and
international markets.
Advance UNLV’s Transportation Research Center, providing the necessary input
for the effective development of the university’s land assets for the research,
development, and deployment of new logistics technologies.
UNLV, GOED,
Transportatio
n Companies
Pioneer the deployment of last-mile delivery innovations that enable quicker and
more efficient consumer deliveries.
Cities, Clark
County
Objective 3.5. Recruit businesses with compelling value propositions for Southern Nevada
that diversify the region’s economy.
Market Southern Nevada to foreign firms as a high-growth launching pad for
opening North American operations, driven by its low cost of doing business and
proximity to lucrative markets.
LVGEA
Represent Southern Nevada as the pre-eminent business destination for
relocating and expanding out-of-state companies at industry trade shows and
other business events throughout the United States.
LVGEA
Market the advantages and cost savings of Southern Nevada’s foreign trade
zone (FTZ) to firms with international operations. LVGEA
Establish a jointly funded full-time business recruitment director based in
Southern California to capitalize on the growing number of firms relocating from
California.
LVGEA, Cities,
Clark County
Develop and launch a recruitment strategy for companies listed in the Fortune
1000. LVGEA
Strength and enhance communication and collaboration with site selectors. LVGEA
Host in-market familiarization tours for high-value prospects and site selectors. LVGEA

27
Prioritize the recruitment of companies that assist Nevada in reaching its carbon
reduction goals through the deployment of clean technologies (e.g., all-electric
vehicles fleets, on-site clean energy generation).
LVGEA
Objective 3.6. Prepare the healthcare industry for the region's growing population.
Advance sports medicine education, research, and development. UNLV
Increase opportunities for medical students not only to study in Southern
Nevada, but also conduct clinical rotations and residencies in local hospitals and
medical centers, growing regional healthcare services.
Local
hospitals,
Touro
University,
UNLV,
Roseman
University
Increase the capacity and quality of public healthcare programs for local area
residents.
Local
hospitals,
Touro
University,
UNLV,
Roseman
University
Objective 3.7. Position Southern Nevada as a leader in the research, development, and
deployment of clean energy technologies.
Achieve international recognition as a leading region for water management
technology and policy solutions through exchanges, site visits, and promotional
efforts.
SNWA,
WaterStart
Build a water tech innovation ecosystem through the recruitment, launch, and
expansion of water technology companies and deployment of new water
management solutions.
WaterStart,
LVGEA, SNWA
Actively recruit corporations and researchers who explore leading-edge solar
power generation technologies to Southern Nevada. LVGEA
Examine new methods of assessing real-time building energy use and pilot new
technologies and practices that reduce the environmental impacts of tourism
and business visitors.
NV Energy,
Cities, Clark
County
Leverage industry-disrupting superconductor research at UNLV to position
Southern Nevada as a leader in next-generation energy research. UNLV

28
Goal 4: Reimagine Regional Collaboration
Southern Nevada has an active economic development stakeholder community, and many
stakeholder organizations have a significant stake in the region’s economic development priorities.
The COVID-19 pandemic has brought unprecedented levels of cooperation to the region, requiring
organizations to cooperate to protect the community’s health while supporting the safe reopening of
the regional economy. However, as the pandemic subsides and normalcy returns, it is important for
stakeholders to maintain high levels of engagement and cooperation. This is particularly necessary
as the region seeks to further diversify its economy, build its workforce, and fortify communities
when faced with future economic headwinds.
Below are a series of objectives and activities that should be pursued by LVGEA and affiliated
stakeholders to achieve the mission of Goal 4. Note that activities in italics are those identified by
LVGEA as unfunded or underfunded as of July 2021.
Objective 4.1. Ensure Adequate Resources for Regional Aspirations.
Explore new funding methods, such as multi-year fundraising campaigns, to
enhance funding for regional economic development. LVGEA
Contract with a grant-writing training firm to offer workshops for community
organizations and stakeholders in grant identification and writing.
Clark County
OCED
Contract with a non-profit training firm to develop training courses for community
organizations and others in non-profit management and fundraising.
Clark County
OCED
Objective 4.2. Develop Innovative Partnership Agreements for Cross-Domain Priorities.
Build upon unprecedented levels of collaboration among nonprofits by exploring
new organizational structures, formal partnerships, and joint funding
opportunities.
LVGEA,
Chambers of
Commerce
Support the development of issue-specific working groups (e.g., workforce
development, transportation planning) that engage stakeholders across the
county.
LVGEA, Cities,
County
Share data and insights from technology pilot programs and form collaborations
to support Southern Nevada’s progress towards an integrated “Smart Region.”
Cities, Clark
County, UNLV,
RTC
Support collaborations between employees and employers that encourage
productivity-enhancing innovations while preparing employees to work alongside
new technology.
LVGEA
Objective 4.3. Enhance and align regional economic development efforts.
Organize Economic Development Advisory Group to aligned economic
development strategies and encourage communication. LVGEA

29
Regularly provide deal flow reporting to municipalities. LVGEA
Objective 4.4. Engage community and business leaders in the economic development
process.
Organize Southern Nevada Council of Chambers to identify common issues and
collaboration opportunities.
LVGEA,
Chambers of
Commerce
Collaborate with real estate and construction leaders on strategic business
development efforts. LVGEA

30
Goal 5: Stimulate a Future-Ready Workforce
The long-term dominance of leisure and hospitality in Southern Nevada’s economy has historically
been a hinderance to the development of a highly skilled workforce in the region. However, as the
region’s economy has continued to diversify in recent years, the need for a well-qualified and skill-
diverse workforce has increased significantly. The identification of target industries for the region
and the employment impacts of the COVID-19 pandemic have heightened this need. Opportunities
for re-skilling and upskilling low- and middle-skilled workers should be explored to mitigate the most
adverse impacts of the pandemic on regional employment. Likewise, expanding and institutionalizing
regional collaboration on workforce development initiatives will enable stakeholders in Southern
Nevada to routinely revisit and adjust these initiatives has industry needs change. Incorporating new
and novel education and training approaches, such as those rooted in multi- and inter-generational
learning, will ensure Southern Nevada’s approach to workforce development is equitable and aligns
with the needs of young and adult learners in the region.
Below are a series of objectives and activities that should be pursued by LVGEA and affiliated
stakeholders to achieve the mission of Goal 5. Note that activities in italics are those identified by
LVGEA as unfunded or underfunded as of July 2021.
Objective 5.1. Establish a deeper understanding of trends in Southern Nevada’s labor force
and the needs of regional employers
Execute a survey of Southern Nevada’s employers to determine gaps in skills
and knowledge proficiencies among the region’s labor force.
Workforce
Connections,
LVGEA
Map the coverage of Southern Nevada’s higher education programs and identify
gaps and redundancies in skills delivery for the region’s existing workforce.
LVGEA,
Workforce
Connections,
Vegas
Chamber
Assess labor trends among various underserved populations in the wake of the
COVID-19 pandemic.
ImpactNV,
Clark County
OCED
Objective 5.2. Encourage and institutionalize collaboration among stakeholders in Southern
Nevada’s workforce development community.
Develop an up-to-date directory of workforce stakeholders to serve as a
reference for increased collaboration among workforce development groups.
LVGEA,
Workforce
Connections
Create an inventory of workforce development programs with key indicators
designating their target audience, geographic range, funding sources, and points-
of-contact.
OWINN,
Workforce
Connections
Establish a recurring Workforce Task Force. Workforce
Connections
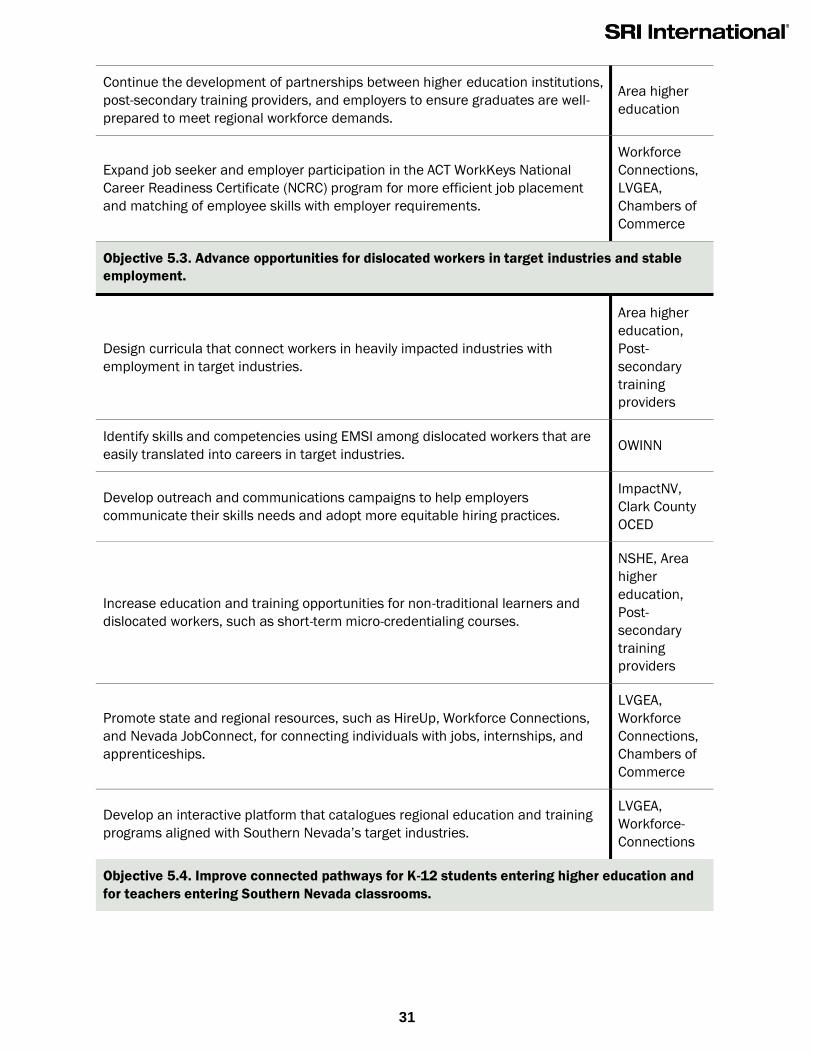
31
Continue the development of partnerships between higher education institutions,
post-secondary training providers, and employers to ensure graduates are well-
prepared to meet regional workforce demands.
Area higher
education
Expand job seeker and employer participation in the ACT WorkKeys National
Career Readiness Certificate (NCRC) program for more efficient job placement
and matching of employee skills with employer requirements.
Workforce
Connections,
LVGEA,
Chambers of
Commerce
Objective 5.3. Advance opportunities for dislocated workers in target industries and stable
employment.
Design curricula that connect workers in heavily impacted industries with
employment in target industries.
Area higher
education,
Post-
secondary
training
providers
Identify skills and competencies using EMSI among dislocated workers that are
easily translated into careers in target industries. OWINN
Develop outreach and communications campaigns to help employers
communicate their skills needs and adopt more equitable hiring practices.
ImpactNV,
Clark County
OCED
Increase education and training opportunities for non-traditional learners and
dislocated workers, such as short-term micro-credentialing courses.
NSHE, Area
higher
education,
Post-
secondary
training
providers
Promote state and regional resources, such as HireUp, Workforce Connections,
and Nevada JobConnect, for connecting individuals with jobs, internships, and
apprenticeships.
LVGEA,
Workforce
Connections,
Chambers of
Commerce
Develop an interactive platform that catalogues regional education and training
programs aligned with Southern Nevada’s target industries.
LVGEA,
Workforce-
Connections
Objective 5.4. Improve connected pathways for K-12 students entering higher education and
for teachers entering Southern Nevada classrooms.
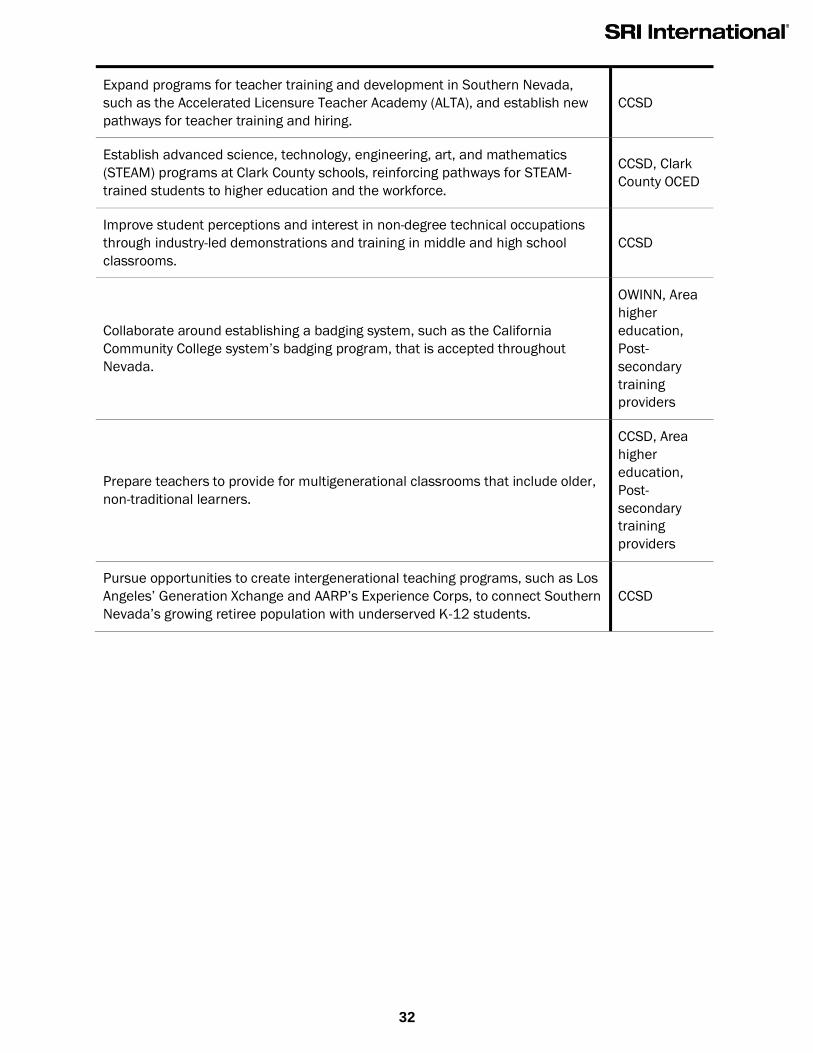
32
Expand programs for teacher training and development in Southern Nevada,
such as the Accelerated Licensure Teacher Academy (ALTA), and establish new
pathways for teacher training and hiring.
CCSD
Establish advanced science, technology, engineering, art, and mathematics
(STEAM) programs at Clark County schools, reinforcing pathways for STEAM-
trained students to higher education and the workforce.
CCSD, Clark
County OCED
Improve student perceptions and interest in non-degree technical occupations
through industry-led demonstrations and training in middle and high school
classrooms.
CCSD
Collaborate around establishing a badging system, such as the California
Community College system’s badging program, that is accepted throughout
Nevada.
OWINN, Area
higher
education,
Post-
secondary
training
providers
Prepare teachers to provide for multigenerational classrooms that include older,
non-traditional learners.
CCSD, Area
higher
education,
Post-
secondary
training
providers
Pursue opportunities to create intergenerational teaching programs, such as Los
Angeles’ Generation Xchange and AARP’s Experience Corps, to connect Southern
Nevada’s growing retiree population with underserved K-12 students.
CCSD

33
Evaluation Framework
For most economic development programs, it is challenging to establish direct, causal relationships
between program activities and long-term outcomes. Logic models help to address this challenge by
establishing theoretical “if-then” relationships across a program’s activities, outputs, and immediate
outcomes. As such, they are useful tools for structuring program evaluations, helping to account for
immediate, measurable impacts that stem from a program’s activities, while logically relating these
outputs to longer-term quantitative outcomes. The illustration below shows a generalized logic model
for non-infrastructure economic development programs.16
Photo Courtesy of Carol Highsmith/Library of Congress/Flickr
Vision 2025
Evaluation Framework A Comprehensive Economic Development
Strategy for Southern Nevada

34
The performance measures presented here allow LVGEA and its partners to first measure progress
toward its goals and then to adapt and improve its work. Many activities proposed in this CEDS can
help the region reach multiple economic development goals and multiple activities can help the
region reach one goal. Performance measures include some program activities (largely conducted by
LVGEA) in support of business and economic development but are primarily outcomes for the region.
These outcomes include a mix of capacity outcomes that enhance the region’s capabilities, and
longer-term realized outcomes such as job and wage growth.
Metrics should not be interpreted as evaluations of any single organization or group of organizations.
Figure 9: General logic model for non-infrastructure economic development programs. From [12].

35
Performance Measures
Goal 1 Measures: Promote a Resilient & Diverse Economy
Metric Data Source
Total employment Bureau of Labor Statistics, Quarterly Census of
Employment and Wages
Hachman Index of economic diversity
Bureau of Labor Statistics, Quarterly Census of
Employment and Wages (value must be calculated
via location quotients)
Studies performed on target industry trends LVGEA
Job gains from businesses attracted or expanded* LVGEA
Unemployment rate Bureau of Labor Statistics, Local Area
Unemployment Statistics
Average annual pay Bureau of Labor Statistics, Quarterly Census of
Employment and Wages
Number of site visits and business development
meetings* LVGEA
Number of businesses attracted* LVGEA
Number of businesses expanded* LVGEA
Total number of business establishments Bureau of Labor Statistics, Quarterly Census of
Employment and Wages
New capital investment* LVGEA
Best place to do business rankings [state-level] Multiple: Area Development, CNBC, Forbes, U.S.
News & World Report, WalletHub
Marketing activities and social media engagement
for "Here You Can" initiative LVGEA
* Metric also used in LVGEA 2019-2020 Action Plan. Available at https://www.lvgea.org/wp-
content/uploads/2019/03/2019-2020-Action-Plan.pdf.
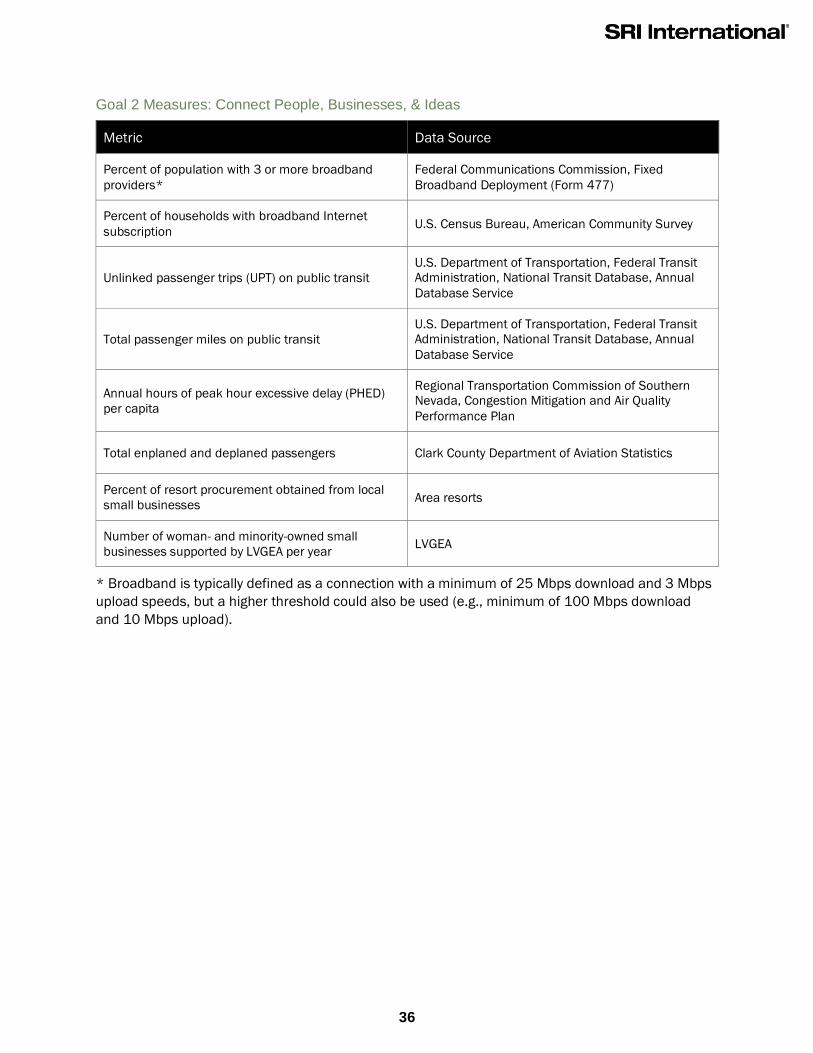
36
Goal 2 Measures: Connect People, Businesses, & Ideas
Metric Data Source
Percent of population with 3 or more broadband
providers*
Federal Communications Commission, Fixed
Broadband Deployment (Form 477)
Percent of households with broadband Internet
subscription U.S. Census Bureau, American Community Survey
Unlinked passenger trips (UPT) on public transit
U.S. Department of Transportation, Federal Transit
Administration, National Transit Database, Annual
Database Service
Total passenger miles on public transit
U.S. Department of Transportation, Federal Transit
Administration, National Transit Database, Annual
Database Service
Annual hours of peak hour excessive delay (PHED)
per capita
Regional Transportation Commission of Southern
Nevada, Congestion Mitigation and Air Quality
Performance Plan
Total enplaned and deplaned passengers Clark County Department of Aviation Statistics
Percent of resort procurement obtained from local
small businesses Area resorts
Number of woman- and minority-owned small
businesses supported by LVGEA per year LVGEA
* Broadband is typically defined as a connection with a minimum of 25 Mbps download and 3 Mbps
upload speeds, but a higher threshold could also be used (e.g., minimum of 100 Mbps download
and 10 Mbps upload).
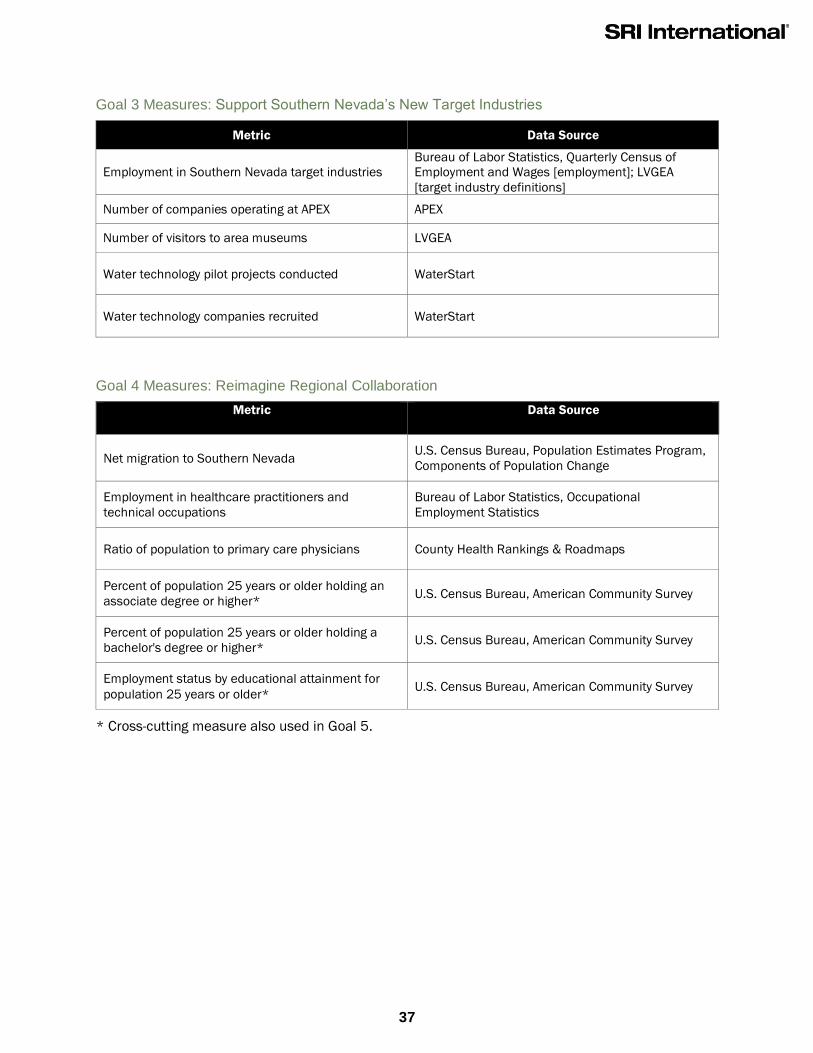
37
Goal 3 Measures: Support Southern Nevada’s New Target Industries
Metric Data Source
Employment in Southern Nevada target industries
Bureau of Labor Statistics, Quarterly Census of
Employment and Wages [employment]; LVGEA
[target industry definitions]
Number of companies operating at APEX APEX
Number of visitors to area museums LVGEA
Water technology pilot projects conducted WaterStart
Water technology companies recruited WaterStart
Goal 4 Measures: Reimagine Regional Collaboration
Metric Data Source
Net migration to Southern Nevada U.S. Census Bureau, Population Estimates Program,
Components of Population Change
Employment in healthcare practitioners and
technical occupations
Bureau of Labor Statistics, Occupational
Employment Statistics
Ratio of population to primary care physicians County Health Rankings & Roadmaps
Percent of population 25 years or older holding an
associate degree or higher* U.S. Census Bureau, American Community Survey
Percent of population 25 years or older holding a
bachelor's degree or higher* U.S. Census Bureau, American Community Survey
Employment status by educational attainment for
population 25 years or older* U.S. Census Bureau, American Community Survey
* Cross-cutting measure also used in Goal 5.

38
Goal 5 Measures: Stimulate a Future-Ready Workforce
The LVGEA Workforce Blueprint provides indicators for assessing Southern Nevada’s progress in
solving regional workforce supply issues and improving alignment of regional education and training
providers. Many of those indicators also allow for evaluation of the education and workforce
component of the CEDS and have been imported here, along with several additional performance
measures.
Metric Data Source
AP participation and test passage rates for CCSD
students* CCSD
Average ACT score of CCSD high schoolers* CCSD
Number of CCSD high schoolers participating in
career technical education (CTE)* CCSD
CCSD high school graduation rate CCSD
Percent of CCSD graduates who do not require
remediation coursework* NSHE
Number of postsecondary graduates from Southern
Nevada institutions* NSHE / NPWR
Graduation rates for Southern Nevada higher
education institutions NSHE / NPWR
Percent of recent NSHE graduates employed in
Nevada* NSHE
Number of National Career Readiness Certificate
(NCRC) holders*
Workforce Connections / ACT Work Ready
Communities
Number of employers participating in NCRC program Workforce Connections / ACT Work Ready
Communities
Number of registered apprenticeships completed* OWINN RAPIDS
Percent of population 25 years or older holding an
associate degree or higher* U.S. Census Bureau, American Community Survey
Percent of population 25 years or older holding a
bachelor's degree or higher* U.S. Census Bureau, American Community Survey
Employment status by educational attainment for
population 25 years or older U.S. Census Bureau, American Community Survey
Percent of employment in occupations typically
requiring a bachelor's degree or higher Bureau of Labor Statistics, Employment Projections
Program, Education and Training Data [Employment
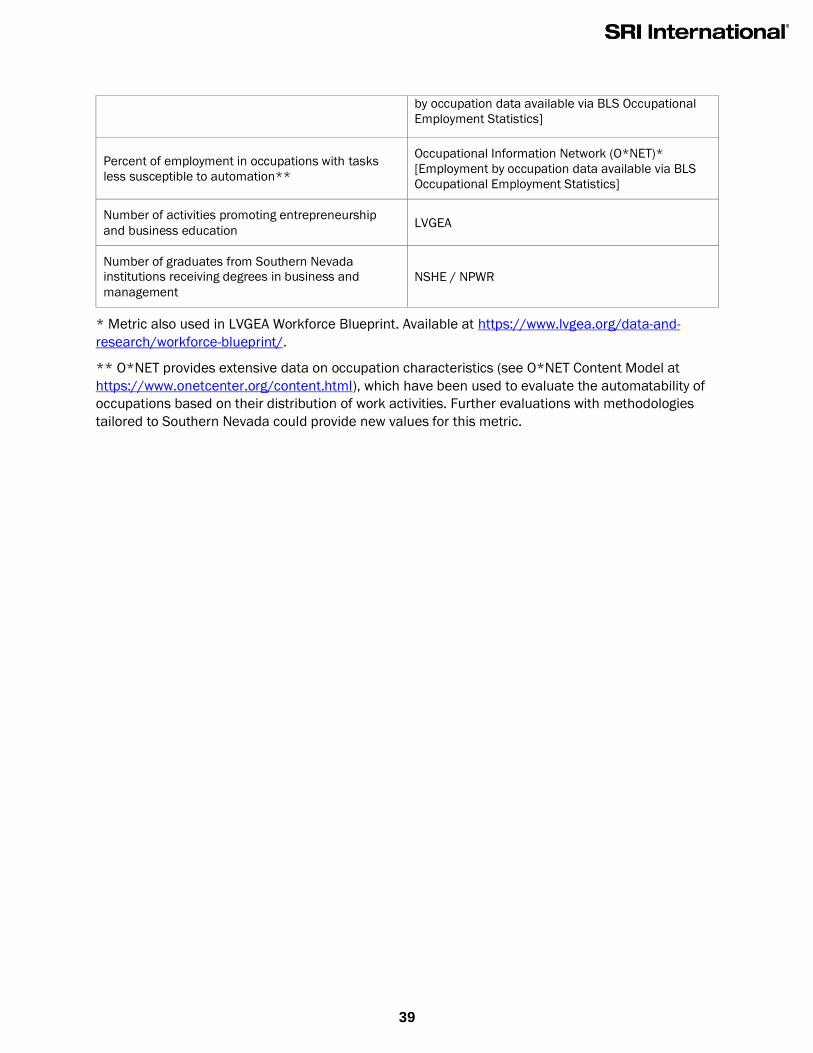
39
by occupation data available via BLS Occupational
Employment Statistics]
Percent of employment in occupations with tasks
less susceptible to automation**
Occupational Information Network (O*NET)*
[Employment by occupation data available via BLS
Occupational Employment Statistics]
Number of activities promoting entrepreneurship
and business education LVGEA
Number of graduates from Southern Nevada
institutions receiving degrees in business and
management
NSHE / NPWR
* Metric also used in LVGEA Workforce Blueprint. Available at https://www.lvgea.org/data-and-
research/workforce-blueprint/.
** O*NET provides extensive data on occupation characteristics (see O*NET Content Model at
https://www.onetcenter.org/content.html), which have been used to evaluate the automatability of
occupations based on their distribution of work activities. Further evaluations with methodologies
tailored to Southern Nevada could provide new values for this metric.
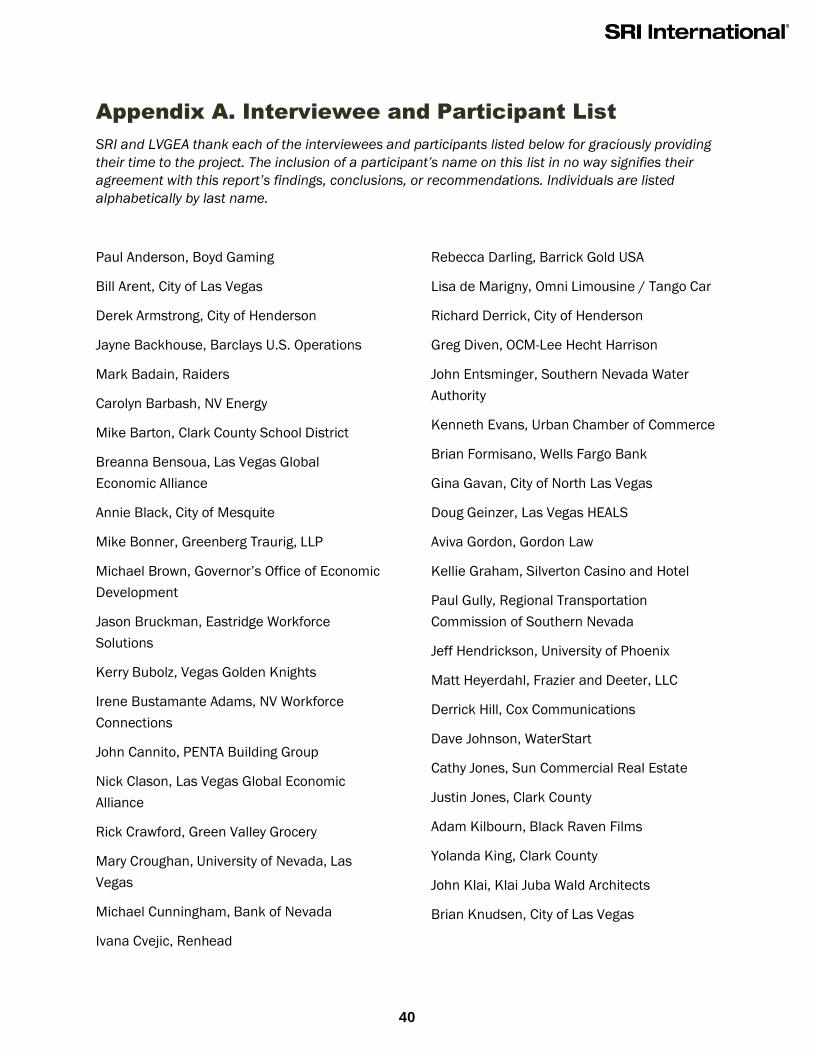
40
Appendix A. Interviewee and Participant List
SRI and LVGEA thank each of the interviewees and participants listed below for graciously providing
their time to the project. The inclusion of a participant’s name on this list in no way signifies their
agreement with this report’s findings, conclusions, or recommendations. Individuals are listed
alphabetically by last name.
Paul Anderson, Boyd Gaming
Bill Arent, City of Las Vegas
Derek Armstrong, City of Henderson
Jayne Backhouse, Barclays U.S. Operations
Mark Badain, Raiders
Carolyn Barbash, NV Energy
Mike Barton, Clark County School District
Breanna Bensoua, Las Vegas Global
Economic Alliance
Annie Black, City of Mesquite
Mike Bonner, Greenberg Traurig, LLP
Michael Brown, Governor’s Office of Economic
Development
Jason Bruckman, Eastridge Workforce
Solutions
Kerry Bubolz, Vegas Golden Knights
Irene Bustamante Adams, NV Workforce
Connections
John Cannito, PENTA Building Group
Nick Clason, Las Vegas Global Economic
Alliance
Rick Crawford, Green Valley Grocery
Mary Croughan, University of Nevada, Las
Vegas
Michael Cunningham, Bank of Nevada
Ivana Cvejic, Renhead
Rebecca Darling, Barrick Gold USA
Lisa de Marigny, Omni Limousine / Tango Car
Richard Derrick, City of Henderson
Greg Diven, OCM-Lee Hecht Harrison
John Entsminger, Southern Nevada Water
Authority
Kenneth Evans, Urban Chamber of Commerce
Brian Formisano, Wells Fargo Bank
Gina Gavan, City of North Las Vegas
Doug Geinzer, Las Vegas HEALS
Aviva Gordon, Gordon Law
Kellie Graham, Silverton Casino and Hotel
Paul Gully, Regional Transportation
Commission of Southern Nevada
Jeff Hendrickson, University of Phoenix
Matt Heyerdahl, Frazier and Deeter, LLC
Derrick Hill, Cox Communications
Dave Johnson, WaterStart
Cathy Jones, Sun Commercial Real Estate
Justin Jones, Clark County
Adam Kilbourn, Black Raven Films
Yolanda King, Clark County
John Klai, Klai Juba Wald Architects
Brian Knudsen, City of Las Vegas

41
Carol Kolson, Mesquite Chamber of
Commerce
Jill Lagan, Boulder City Chamber of Commerce
Michelle Larime, Regional Transportation
Commission of Southern Nevada
Rae Lathrop, Regional Transportation
Commission of Southern Nevada
John Lee, City of North Las Vegas
Clifton Marshall, Airport Concessionaires, LLC
Guy Martin, Martin-Harris Construction
Kiernan McManus, Boulder City
Scott Muelrath, Henderson Chamber of
Commerce
Leslie Mujica, Las Vegas Power Professionals
Monica Pappas, Fingerprinting Express
Bart Patterson, Nevada State College
Bob Potts, Governor’s Office of Economic
Development
Flo Rogers, Nevada Public Radio
Brad Schnepf, Marnell Properties
Hena Shakir, JPMorgan Chase
Melanie Sheldon, Governor’s Office of
Economic Development
Les Lee Shell, Clark County
Michael Sherwood, City of Las Vegas
Ryan Smith, City of Las Vegas
Spencer Stewart, Western Governors
University Nevada
Michael Sullivan, Amerityre Corporation
Craig von Collenberg, Governor’s Office of
Workforce Innovation
Michael Walsh, Las Vegas Global Economic
Alliance
Shannon Weldon, Hilton Grand Vacations
Lori Wilkinson, Brown & Brown Insurance
Brian Wolf, Manpower Las Vegas
Clark Wood, U.S. Bank
Frank Woodbeck, College of Southern Nevada
Steven Zanella, MGM City Center
Chris Zunis, Las Vegas Global Economic
Alliance
42
Appendix B. Stakeholder Engagement Exercises
Community participation is a vital part of the CEDS creation process, especially in the crafting of a
vision statement and the generation of goals for the region. In addition to interviews with individual
community members, several stakeholder engagement sessions were conducted in November 2019
at LVGEA headquarters. These sessions were designed to collect community input on a vision for
Southern Nevada and elicit priorities for the CEDS. Each session included a small but diverse group
of participants from key stakeholder organizations in the region. Participants were guided through
three exercises:
1. Visioning Success – Participants were asked to imagine what success looks like for
Southern Nevada. Each participant submitted three specific components of this vision that
they deemed most important.
2. Priority Goals – Each participant submitted three priority goals for making Southern Nevada
the best place to live and do business17 over the next 5 years. Goals were clustered by
similarity and participants discussed the most common goals.
3. Meeting the Needs of a Diverse Population – Participants divided into small groups, with
each group receiving a “persona”—a hypothetical individual or household representative of a
different slice of the region’s current or prospective population. Each group considered the
potential goals, motivations, and concerns of their persona and determined what Southern
Nevada must offer to help meet the needs of the persona.
Vision & Priority Goals
Stakeholder comments from the first two exercises covered a wide range of topics but, nonetheless,
broadly shared desires emerged:
Education, Training, and Workforce
o A high-performing education and training system that prepares students for
successful careers and delivers a workforce that meets employers’ needs
o Improvements in K-12 and higher education
o Vocational training opportunities
o Enhanced methods for connecting job seekers and employers
Strong Communities
o Local and affordable amenities
o Community-building events
o Promotion of regional identity and multi-generational attachment
o Inclusivity of diverse individuals and families
Entrepreneurship and Business Support
o Pro-business culture and policies
o Stronger business collaboration
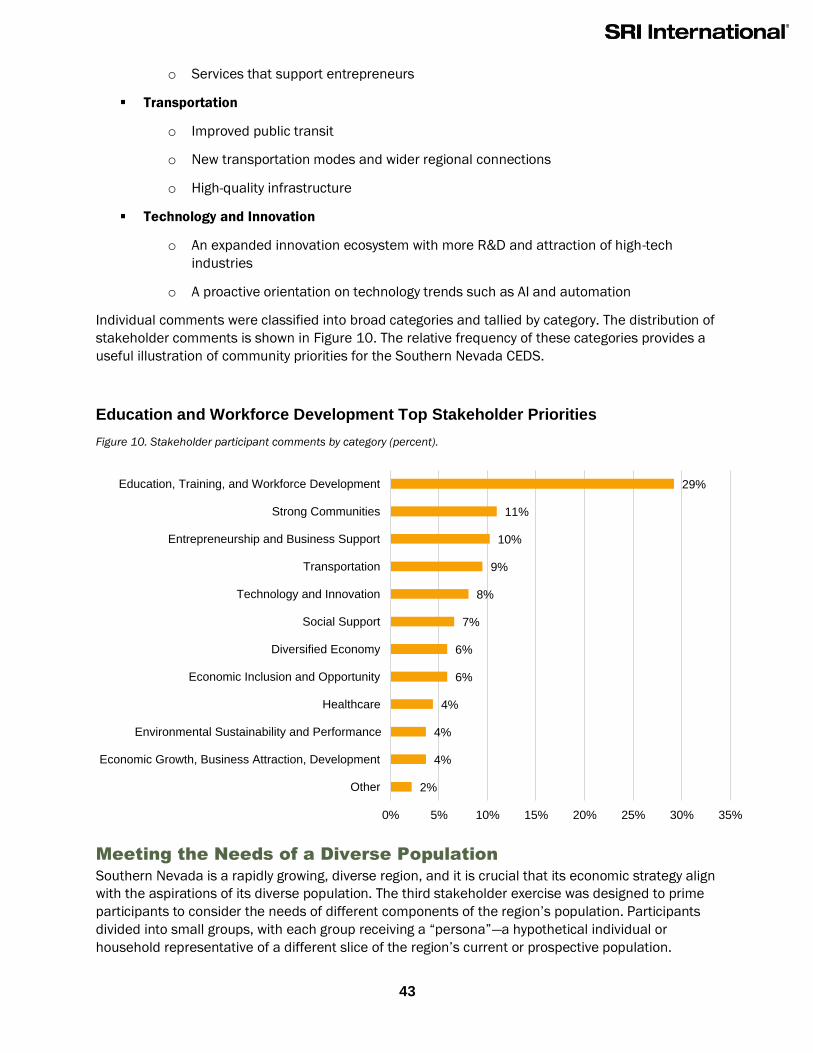
43
o Services that support entrepreneurs
Transportation
o Improved public transit
o New transportation modes and wider regional connections
o High-quality infrastructure
Technology and Innovation
o An expanded innovation ecosystem with more R&D and attraction of high-tech
industries
o A proactive orientation on technology trends such as AI and automation
Individual comments were classified into broad categories and tallied by category. The distribution of
stakeholder comments is shown in Figure 10. The relative frequency of these categories provides a
useful illustration of community priorities for the Southern Nevada CEDS.
Education and Workforce Development Top Stakeholder Priorities
Figure 10. Stakeholder participant comments by category (percent).
Meeting the Needs of a Diverse Population
Southern Nevada is a rapidly growing, diverse region, and it is crucial that its economic strategy align
with the aspirations of its diverse population. The third stakeholder exercise was designed to prime
participants to consider the needs of different components of the region’s population. Participants
divided into small groups, with each group receiving a “persona”—a hypothetical individual or
household representative of a different slice of the region’s current or prospective population.
2%
4%
4%
4%
6%
6%
7%
8%
9%
10%
11%
29%
0% 5% 10% 15% 20% 25% 30% 35%
Other
Economic Growth, Business Attraction, Development
Environmental Sustainability and Performance
Healthcare
Economic Inclusion and Opportunity
Diversified Economy
Social Support
Technology and Innovation
Transportation
Entrepreneurship and Business Support
Strong Communities
Education, Training, and Workforce Development

44
Five personas were developed, informed by analysis of regional socioeconomic data and interview
findings:
• A dual-income family considering moving into the region. One spouse, a lawyer, has received
a job offer, but the other, a doctor, is still searching and would like to stay employed in his
profession. They have two young children in elementary school.
• A manufacturing worker who has some work experience in other sectors and joined the
workforce right out of high school. He is looking to gain new skills and advance in his career
toward a higher wage but is unable to take substantial time away from work for training or
school.
• A retired couple thinking of relocating to Southern Nevada. They have significant savings but
are careful in how they manage their resources. They seek to remain physically and socially
active but recognize their needs and health status may change as they age.
• A recent UNLV graduate with a degree in a STEM discipline who wants a rewarding career in
his field. A first-generation college student, he funded his own education and needs to be
financially independent.
• A small business owner that provides consulting services to resorts in Las Vegas. She must
recruit workers with different skill sets and education levels to meet her clients’ needs and
expand.
Each group considered the potential goals, motivations, and concerns of its persona and determined
what Southern Nevada must offer to help meet the needs of the persona. Needs that are common
across multiple personas provide useful indication for what topics warrant greatest attention in the
CEDS. High-quality educational opportunities and a capable, trained workforce were, on average, the
needs identified most frequently across the personas. Local amenities were also commonly cited,
followed by affordable housing and cost of living, access to quality healthcare, and transportation.
45
Appendix C. Detailed SWOT Analysis
The ability to foresee change and analyze current capacity to handle change not only increases the
resiliency of an organization during times of economic turmoil, but also assists an organization in
capitalizing on opportunities during times of growth. In the 1960s and 1970s, a team of researchers
at SRI undertook the monumental effort of creating a blueprint for this process. In order to create
this guide, researchers surveyed thousands of organizations and executives to best understand how
organizations were managing perceived changes to their industries, and how change management
could be improved. Their findings led to what eventually came to be known as the SWOT analysis.
Strength refers to what is satisfactory in the present (internal).
Weakness refers to what is currently unsatisfactory (internal).
Opportunity is an emerging trend that presents a chance for growth (external).
Threat is an emerging trend that presents an obstacle for growth (external).
A SWOT analysis enables organizations and regions to assess their current capabilities and
understand how to work with them in order to navigate future uncertainty. This powerful analysis
serves as the basis for strategy and highlights sources of strength on which to rely, weakness that
may be addressed, opportunities to be realized, and dangers and difficulties to be avoided or
addressed.
The SWOT analysis in this section is an in-depth examination of Southern Nevada’s regional
strengths, weaknesses, opportunities, and threats. The SWOT is a critical part of the CEDS and is
required by EDA as a component of the document.18 The SWOT analysis illuminates regional
vulnerabilities to economic and environmental shocks and helps guide subsequent economic
development strategy toward enhanced resiliency. The SWOT analysis synthesizes stakeholder
interview and workshop input with a detailed review of social, economic, education, industry, and
environmental data relevant to the region’s economic future. Our key findings are summarized on
the following page.

46
Strengths
Physical Infrastructure
Natural Resources and Environment
Southern Nevada possesses a significant amount of undeveloped land with the potential for future
development.19 In addition to its potential for growth for an increasing population, the natural
environment of Southern Nevada appeals to many outdoor enthusiasts, as well as renewable
technology companies that seek to harness the region’s abundant sunshine (on average, sunshine
occurs for at least 80% of the year in Southern Nevada)20 to develop new solar power technologies.
According to the National Renewable Energy Laboratory (NREL), Southern Nevada has some of the
highest solar energy technology potential in the nation. Southern Nevada has already begun to
capitalize on this natural advantage, ranking fourth in the nation for cumulative installed solar
electricity capacity (3,500 megawatts).21,22
Southern Nevada’s desert climate has made water a precious and limited resource in the region,
and its conservation has been a top priority for decisionmakers. Strong, coordinated efforts among
the region’s stakeholders have made Southern Nevada a model for water management and one of
the most water-secure metro areas in the Southwest. The Southern Nevada Water Authority (SNWA),
created in 1991, has been instrumental in managing the region’s water resources, releasing
comprehensive water resource plans and budgets that make effective use of the limited resources
available. Through its conservation programs, the SNWA has reduced per capita water use by 52%
between 2002 and 2019, despite the net addition of nearly 730,000 new residents to the region
over that time; SNWA aims to reduce consumption from 127 gallons per capita per day (GPCD) in
2017 to 105 GPCD by 2035.23 Specific policies that have aided water conservation include the
banning of front lawns in new construction, and the payments to existing residents to remove their
lawns and replace them with more drought-tolerant landscaping.24,25
Transportation
Geographic connectivity remains a strength for Southern Nevada. The communities of Clark County
are well-served by McCarran International Airport, which is the nation’s eighth busiest airport in
terms of passenger traffic.26 In addition to numerous direct flights to domestic destinations,
McCarran has about 30 direct flights to and from international destinations in 13 different
countries.27 In 2019, McCarran International broke its all-time record, serving over 50 million
passengers.28
The Regional Transportation Commission of Southern Nevada (RTC) has joined the Complete Streets
Initiative, which aims to design roads that are safe for all users, including car drivers, transit riders,
pedestrians, and bicyclists.29 Projects within the initiative intend to make alternative forms of
transportation other than driving more attractive and feasible for regional residents, all the while
increasing residents’ physical activity levels and reducing the region’s emissions. Complete Streets
projects, as well as similar projects, have directly attributed to Las Vegas achieving Silver Bicycle
Friendly Community status from the League of American Bicyclists; by 2018, the city had increased
the number of bike lanes and trails to more than 465 miles, a significant increase from the 125
miles the city had in 2006.30
Despite the region’s population boom, workers in Southern Nevada continue to experience
comparatively short commutes. Average travel time to work in the Las Vegas metro area is 25.2
minutes, lower than the national average (26.9) and most peer regions (Table 5). Additionally, the
rapid growth seen in Southern Nevada in recent decades has been accompanied by a significant

47
number of infrastructure improvement projects, leaving the region with a relatively modern
transportation infrastructure network.31
Workers in Southern Nevada Enjoy Shorter Commutes
Table 5: Average One-Way Commute Times for Peer Metro Regions, 2019. Source: American Community Survey 5-year
Estimates, U.S. Census Bureau.
Metropolitan Area Average One-Way Commute
Time (minutes)
Salt Lake City, UT 22.7
Albuquerque, NM 23.8
Colorado Springs, CO 24.0
Las Vegas-Henderson-Paradise, NV 25.2
Phoenix-Mesa-Scottsdale, AZ 26.4
U.S. Average 26.9
Portland-Vancouver-Hillsboro, OR-WA 27.1
Austin-Round Rock, TX 27.1
Sacramento--Roseville--Arden-Arcade, CA 27.2
Denver-Aurora-Lakewood, CO 28.0
Orlando-Kissimmee-Sanford, FL 29.0
Note: One-way commute time data availability varies by metro area. Sacramento—Roseville—Arden-Arcade, CA, Austin-
Round Rock, TX, and Phoenix-Mesa-Scottsdale, AZ data are only available for 2018. ACS Five-Year Estimates for 2018 use
data from 2014-2018. ACS Five-Year estimates for 2019 use data from 2015-2019.
Broadband
In addition to its extensive transportation connections, Southern Nevada maintains strong
broadband connectivity. According to the Federal Communications Commission (FCC), broadband
availability refers to a population’s ability to access broadband speeds of at least 25 megabits per
second (Mbps) for downloading and 3 Mbps for uploading.32 Using these metrics, residents of Clark
County are exceptionally well-connected, with 99% of residents having access to these speeds
through at least three service providers and 100% of residents having access through at least two
service providers. This is above the national average, with 95% of all Americans having access
through at least three service providers.33 That said, the presence of multiple broadband providers in
Southern Nevada has not translated into universal internet service. According to the U.S. Census
Bureau, 17% of households in Clark County—including more than one-third of households with less
than $20,000 in annual income—reported not having an Internet subscription in 2019.34
Recognizing the importance of internet access to economic opportunity, Clark County leaders have
launched efforts to address this digital divide.35
Broadband connectivity is important for a region’s economic growth and development as it allows
communities to participate in local, regional, national, and international value chains. This
connectivity is important for the communities of Southern Nevada, which are increasingly the
preferred choice for large-scale data centers, such as Switch. Maintaining strong, leading-edge
connectivity will continue to be important for the region as its economy further expands into data-
heavy sectors and industries.
Housing
Since the Great Recession, the Las Vegas housing market has shown strong signs of recovery.
Compared to other regions in the state as well as neighboring states, the Las Vegas housing market
remains relatively affordable (Table 6). Similar to national trends, however, affordability has gradually

48
declined in recent years, with the housing affordability index (HAI) for Las Vegas falling nearly 15%
from 140.6 (2017) to 120.0 (2018).36 Among the selected peer metropolitan areas, housing in Las
Vegas remains competitively affordable.
Housing Remains Affordable in the Las Vegas Metro Region
Table 6: Housing Affordability Index of Las Vegas and Peer Regions, 2018. Source: National Association of Realtors.
Metropolitan Area
Housing
Affordability Index
(HAI)
Percent Change
2017-2018
Albuquerque, NM 162.4 -9.3
Austin-Round Rock, TX 152.6 -9.2
Phoenix-Mesa-Scottsdale, AZ 141.2 -12.1
Salt Lake City, UT 129.3 -10.4
Colorado Springs, CO 128.1 -13.3
Orlando-Kissimmee-Sanford, FL 124.1 -12.4
Las Vegas-Henderson-Paradise, NV 120.0 -14.6
Sacramento--Roseville--Arden-Arcade, CA 116.2 -10.5
Portland-Vancouver-Hillsboro, OR-WA 114.0 -7.3
Denver-Aurora-Lakewood, CO 109.2 -11.1
Social Infrastructure
Recreation
Las Vegas is a global tourist destination and is often regarded as the entertainment capital of the
United States. This status is largely due to the presence of the gaming and tourism industries in
Southern Nevada’s economy. The city boasts over 150,000 hotel rooms and more than 100 casinos,
which offer world-renowned shows, dining, and other entertainment. Additionally, Las Vegas is host
to many global conferences and trade shows, such as the Consumer Electronics Show (CES), the
Global Gaming Expo (G2E), and the World of Concrete. In 2015, conventions and conferences in Las
Vegas brought five million attendees to the city, injecting an estimated $50 billion into the Southern
Nevada economy.37
Southern Nevada has built upon its strengths in the entertainment industry as it pursues the goal of
becoming the sports and entertainment capital of the United States. Future venues, such as the Las
Vegas Stadium, the MSG Sphere at the Venetian, and the Las Vegas Ballpark, promise to bring
additional entertainment options to the region’s residents and visitors. The existing and new venues
are expected to have seating capacity for over 350,000 spectators.38
In addition to indoor entertainment, Southern Nevada boasts many outdoor recreation attractions,
such as Lake Mead, Red Rock Canyon, and Mount Charleston, which provide year-round recreation
opportunities. Recently, there also has been significant growth in professional sports in Southern
Nevada, with new teams being established or relocating to the area, most prominently the Golden
Knights (NHL), Raiders (NFL), Aces (WNBA), Lights (USL), and Aviators (MiLB). Regional professional
sports teams serve as additional attractions for visitors while also providing long-term residents with
an increased sense of community.
Human Capital Development and Retention
Education
With a population of 362,000 students, the Clark County School District (CCSD) is the 5 th largest
school district in the country. CCSD serves the Las Vegas metropolitan area, which includes cities

49
and suburbs as well as rural sections of Clark County. The school district recently adopted the Focus
2024 strategic plan, which aims to bring K-12 education in Clark County in line with the high-skills
needs of Nevada employers.39 The district plans to make data on achievement, access to specialized
programs, enrollment, outcomes, and discipline by demographic group readily available to build
credibility in the community. By closely following the strategic plan, CCSD hopes to avoid mission
creep, meet business and operational goals, and maintain sound fiscal management of limited
resources.
The University of Nevada, Las Vegas (UNLV) has recently been ranked as an R1 research university,
indicating that it conducts a “very high” degree of academic research, and it aims to be a “top tier”
university nationwide by 2025.40 UNLV joins 129 other U.S. universities ranked as R1, making it one
of the nation’s most research-intensive institutions. UNLV has been recognized as having the world’s
top hospitality and leisure school; the William F. Harrah College of Hospitality was ranked number
one in the world in 2017 by QS World University Rankings.41 This makes Las Vegas one of the world’s
preeminent destinations for an education in hospitality management.
Southern Nevada is served by other higher education institutions as well, including the College of
Southern Nevada (CSN) and Nevada State College (NSC), which play important roles in developing
skilled workers for the region’s industries. For example, CSN has been particularly adept at working
with industry to develop a labor pool that meets the needs of new and emerging industries. CSN’s
Division of Workforce and Economic Development has created workforce development programs
focusing on healthcare, manufacturing, and coding/app development. This provides students who do
not intend to pursue a four-year degree with critical training in the region’s growing industries.
Attraction and Retention of a Skilled Workforce
Southern Nevada’s entertainment and recreation assets have broad appeal, providing the region
with a significant “pull” factor to attract workers. Likewise, the many conferences and conventions
held in Las Vegas every year bring in many skilled workers, exposing them to the region’s offerings.
The region’s ample business and recreation opportunities have fueled a high level of in-migration in
Southern Nevada, as well as a notable increase in working-age population (Table 10). Migration
brings to the region individuals with diverse backgrounds, skills, and entrepreneurial pursuits, adding
to the region’s overall ability to meet the needs of nascent and growing industries.
Workforce Development Programs
Southern Nevada’s workforce development programs are found predominantly at the region’s higher
education institutions, though the Clark County School District (CCSD) has also developed career and
technical education (CTE) pathways. CCSD offers seven vocational pathways: agriculture and natural
resources, business and marketing, education, hospitality and human services, health science and
public safety, information and media technologies, and skilled and technical sciences. Over 65,000
CCSD students participate in CTE courses, and the average CCSD high school offers over 9 CTE
program offerings. In addition to vocational training, CCSD has seen a remarkable increase in the
number of students enrolling in dual-enrollment courses, in which they receive high school and
college-level credit; over the past three years, enrollment in dual-enrollment courses has increased
over 420%.42
Education institutions in Southern Nevada have connected with industries in the region to develop
programs and curricula that align with their workforce needs. For example, CSN has partnered with
Apple to teach coding and app development to CSN students, increasing the marketability of
students who complete the program to technology firms in Southern Nevada. Alongside its traditional
degree programs, CSN offers non-credentialed, industry-aligned continuing education programs for
in-demand occupations that fall in target industries. NSC has also begun the process of re-aligning
50
curricula with target industries and has launched several new programs, with plans to create a data
informatics program.43
UNLV’s College of Hospitality offers non-degree-based courses for professional development through
the Sands Center for Professional Development, and its “How Vegas Does Vegas” program connects
students with behind-the-scenes tours of major hospitality players in the Las Vegas market and
provides training in topically-relevant areas such as esports and gaming. Additionally, the new Black
Fire Innovation incubator, a partnership between UNLV and Caesars Entertainment, promises to give
students valuable work experience while enhancing university-industry collaboration and testing of
new technologies.44,45
Other education institutions, including the University of Phoenix, Roseman University, and Touro
University Nevada, have begun offering workforce development opportunities aligned with the
region’s targets and needs, such as healthcare. Likewise, non-academic institutions, such as the
United Way of Southern Nevada (UWSN) and the Vegas Broadcasting Service, now offer non-degree
training programs to secure workforce pipelines for needed occupations.46
Through this expanding set of education and training opportunities, Southern Nevada has bolstered
its capacity to train a workforce equipped for in-demand careers in strategically valuable industries.
The ACT WorkKeys assessment measures the hard and soft skills, such as critical thinking and
problem solving, of a region’s workforce and certifies the region’s ability to meet the needs of
industry. Clark County is not only the first county in Nevada to gain the ACT Work Ready Community
distinction, but it is also the largest county-based certified community in the United States.47,48
Business and Industrial Development
Southern Nevada’s economic strengths have historically been in the tourism, gaming, and
entertainment industry. While the importance of this industry to the region remains high, the shock
of the Great Recession, accompanied by Southern Nevada’s slow recovery, encouraged many local
governments and LVGEA to pursue relationships with businesses in sectors less susceptible to
boom-bust economic cycles. As a result, Southern Nevada has observed growth in many higher skill,
higher wage industries, such as autonomous systems and logistics, manufacturing, and supply chain
management. Growth in non-boom-bust industries increases the resiliency of Southern Nevada’s
economy in the face of future recessions.
Local governments have been able to attract these firms due to the region’s reputation for ease of
doing business. Low taxes and accessibility to public officials have made Southern Nevada an
attractive destination for many companies and industries.
The regional development authority model, as managed by LVGEA in Southern Nevada, has been
successful in boosting business expansion and community engagement. In 2018, LVGEA and its
regional partners facilitated business expansions and relocations projected to lead to nearly 4,400
jobs over the next five years.49 LVGEA’s Board of Directors, known as the “LVGEA 50,” is the largest
business board of its kind in Nevada, signaling a high degree of community commitment and
cooperation in economic development. LVGEA has achieved designation as an Accredited Economic
Development Organization by the International Economic Development Council (IEDC), placing it
among an elite group of high-performing and trusted economic development organizations.50
Innovation
Southern Nevada’s strong entrepreneurial spirit and overall business-friendly environment provide a
robust foundation for regional innovation efforts. UNLV’s recent attainment of Carnegie R1 (very high
research activity) status and its ongoing Top Tier Initiative signify progress in and ongoing
commitment to expanding local university research capabilities.51
51
Overall levels of R&D funding and early-stage investment in technology companies in the region
remain low, but there are a variety of institutions supporting innovation and entrepreneurship in the
greater Las Vegas area. For example, UNLV hosts the Troesh Center for Entrepreneurship and
Innovation and the Rebel Venture Fund, a student-led venture capital fund. Battle Borne Venture,
Nevada’s state venture capital program, has made numerous investments in Las Vegas area
companies. The International Innovation Center @ Vegas (IIC@V) assists companies with developing
and testing technologies that are specifically aligned with the City of Las Vegas’ innovation and smart
city priorities. The Innevation Center, created by Switch Founder and CEO Rob Roy, is a 65,000
square foot collaborative workspace and community event venue designed to support Nevada’s
emerging innovation-based economy. StartUpNV, a business incubator and accelerator program
located at the Innevation Center, is launching the Southern Nevada Angel Conference Seed Fund
with funding from the U.S. Economic Development Administration (EDA). StartUpNV’s upcoming
Southern Nevada Angel Conference aims to educate local investors, help founders with pitch
techniques, and assist in matchmaking between investors and startups.52
Two regional innovation strengths to emerge in recent years are unmanned aerial systems (UAS) and
data centers. Southern Nevada is home to significant military installations, including Nellis Air Force
Base, and has seen early successes in the commercial UAS sector.53 The Las Vegas-based Nevada
Institute for Autonomous Systems, a non-profit entity supported by the Governor’s Office of Economic
Development (GOED), is one of six official UAS test sites in the nation supporting safe integration of
UAS into the national airspace.
Extensive broadband connectivity and a climate with minimal natural disasters make Southern
Nevada an ideal location for data centers. The development of the Switch campus in Las Vegas has
been a visible sign of the local growth of this sector. The recent groundbreaking of a $600 million
Google data center in Henderson is another high-profile example of Southern Nevada’s emerging
innovation economy.54

52
Weaknesses
Physical Infrastructure
Natural Resources and Environment
While Southern Nevada is abundant in undeveloped land, the Federal Bureau of Land Management
(BLM) oversees 57% of the land surrounding Las Vegas and its suburbs. Though the BLM has
historically cooperated with communities in developing federal land to accommodate regional
growth, federal ownership adds a degree of uncertainty for many developments while inflating the
cost for future development.55 Extensive federal land ownership also results in a limited supply of
industrial parcels that are ready-to-build for companies moving to the region. For many relocating
companies, the available land lacks the infrastructure that their operations require, which can
significantly inflate the costs of industrial development, especially when compared to other industrial
areas in Nevada, such as the Tahoe-Reno Industrial Center.
Additionally, as Southern Nevada is a desert region, water is a scarce natural resource. Southern
Nevada is heavily dependent upon the Colorado River and Lake Mead for its water; these sources
provide 90% of the region’s overall water supply.56 These resources are shared with many western
states, as well as areas of Mexico, which makes Southern Nevada dependent upon the conservation
efforts of many other actors to achieve sustained water security.
Transportation
Southern Nevada has made significant improvements in much of its infrastructure and roadways,
but deployment of public transportation in the region has been limited. The development of a light
rail system through central Las Vegas has received public support but has not been pursued.
Instead, public officials opted to increase the number of buses, citing the inflexibility of light rail
systems to accommodate changing routes and traffic patterns, as well as the much higher cost of
light rail systems as opposed to additional buses.57 This has resulted in Las Vegas being one of the
largest cities in the western United States to lack rail-based options; after the opening of new subway
stations in Los Angeles, downtown Las Vegas will be the densest urban space in the nation that lacks
rail-based transit.58 Additionally, excluding the four-mile monorail located on the Strip, Las Vegas is
one of the only cities among its peers that lacks a light rail option for regional commuters, in addition
to Albuquerque, NM and Colorado Springs, CO. The lack of an extensive intermodal transportation
system with plentiful rail and bus routes for commuters will likely hinder Southern Nevada’s capacity
to meet the needs of a rapidly expanding population.
Social Infrastructure
Health
Southern Nevada has struggled to attract medical professionals to the region. UNLV has established
a medical school to serve Southern Nevada, but without plentiful residency options for medical
students, it is likely the region will continue to suffer a shortage of trained medical professionals.59
Similarly, a disproportionately high number of uninsured individuals in Clark County (22%), compared
to state (19%) and national (15%) levels, incentivizes medical professionals to enter other markets
where individuals are better able to afford medical services (Table 7).60
Southern Nevada’s Population Struggles with Healthcare Access
Table 7: Healthcare Indicators for Clark County, Nevada, and the United States. Sources: Southern Nevada Health District,
ImpactNV
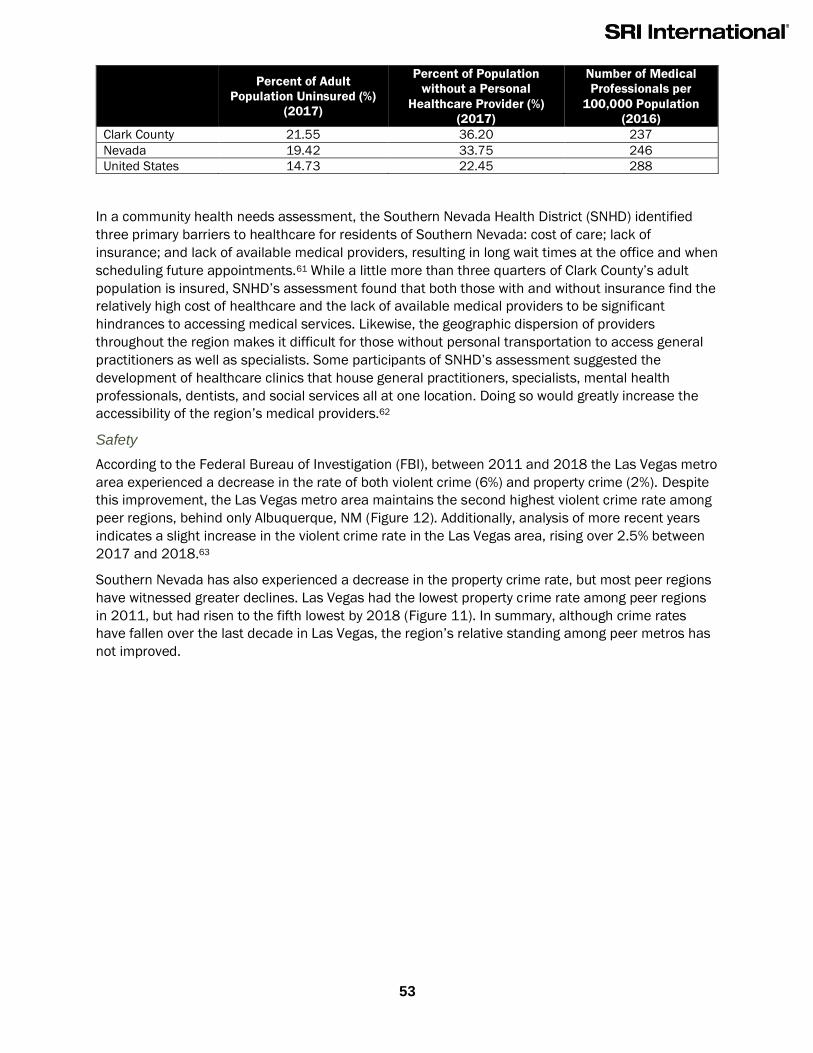
53
Percent of Adult
Population Uninsured (%)
(2017)
Percent of Population
without a Personal
Healthcare Provider (%)
(2017)
Number of Medical
Professionals per
100,000 Population
(2016)
Clark County 21.55 36.20 237
Nevada 19.42 33.75 246
United States 14.73 22.45 288
In a community health needs assessment, the Southern Nevada Health District (SNHD) identified
three primary barriers to healthcare for residents of Southern Nevada: cost of care; lack of
insurance; and lack of available medical providers, resulting in long wait times at the office and when
scheduling future appointments.61 While a little more than three quarters of Clark County’s adult
population is insured, SNHD’s assessment found that both those with and without insurance find the
relatively high cost of healthcare and the lack of available medical providers to be significant
hindrances to accessing medical services. Likewise, the geographic dispersion of providers
throughout the region makes it difficult for those without personal transportation to access general
practitioners as well as specialists. Some participants of SNHD’s assessment suggested the
development of healthcare clinics that house general practitioners, specialists, mental health
professionals, dentists, and social services all at one location. Doing so would greatly increase the
accessibility of the region’s medical providers.62
Safety
According to the Federal Bureau of Investigation (FBI), between 2011 and 2018 the Las Vegas metro
area experienced a decrease in the rate of both violent crime (6%) and property crime (2%). Despite
this improvement, the Las Vegas metro area maintains the second highest violent crime rate among
peer regions, behind only Albuquerque, NM (Figure 12). Additionally, analysis of more recent years
indicates a slight increase in the violent crime rate in the Las Vegas area, rising over 2.5% between
2017 and 2018.63
Southern Nevada has also experienced a decrease in the property crime rate, but most peer regions
have witnessed greater declines. Las Vegas had the lowest property crime rate among peer regions
in 2011, but had risen to the fifth lowest by 2018 (Figure 11). In summary, although crime rates
have fallen over the last decade in Las Vegas, the region’s relative standing among peer metros has
not improved.

54
Crime in Las Vegas Has Fallen but Performance is Mixed Compared to Peer Metros
Southern Nevada, however, has been proactive in addressing the crime in the region, evidenced by
the recent removal of the 2025 sunsetting of the “More Cops” sales tax, which funds increased
officer hiring.64 In addition to more hiring, partnerships between community members and law
enforcement, as well as between the region’s many law enforcement jurisdictions, will aid in creating
a safer community.65
Note: These graphics were constructed using data from the Federal Bureau of Investigation’s Uniform Crime
Reporting (UCR) statistics database. The data used represent violent and property crime data for metropolitan
statistical areas (MSAs). For Southern Nevada, this includes the city of Las Vegas, Henderson, and the remaining
residents of Clark County. The rates are calculated based upon the total population of the MSA, which for Las
Vegas was roughly 2.1 million in 2011 and 2.2 million in 2018. The property crime rate for Las Vegas, NV MSA
for 2018 was not available, so the 2017 statistic has been used.
Figure 12. Violent Crime Rates for Las Vegas and Peer
Metropolitan Areas. Source: Federal Bureau of
Investigation.
Figure 11. Property Crime Rates for Las Vegas and Peer
Metropolitan Areas. Source: Federal Bureau of Investigation.
647
608
0
200
400
600
800
1,000
1,200
2011 2018
Las Vegas, NV MSA
2,7282,671
1,500
2,000
2,500
3,000
3,500
4,000
4,500
5,000
2011 2018
Las Vegas, NV MSA
55
Human Capital Development and Retention
Education
Southern Nevada’s residents are served by the nation’s fifth largest school district, Clark County
School District (CCSD). CCSD is responsible for 75% of the state’s K-12 school-going population, and
nearly 77% of the district’s student body is from a minority background, making CCSD a minority-
majority district. The move toward a minority-majority district follows national trends; in 2014, for the
first time, the U.S. public K-12 education system became minority-majority, with minorities
accounting for just over 50% of total public school enrollment.66 It is important as minority
enrollment increases in public school districts that curricula and programs reflect the needs and
capabilities of the majority of students. According to the Annie E. Casey Foundation, adopting certain
initiatives, such as expanded English literacy programs in elementary school, and working harder to
account for social factors that are outside the educators’ control, can boost student achievement in
minority-majority districts like CCSD.67
Some stakeholders indicated that CCSD has increased the number of services offered to minority
and disadvantaged students; for example, 67% of CCSD students are now on free or reduced lunch
plans. However, the level of support required to serve disadvantaged students continues to increase
throughout the district and may put strains on CCSD and social services organizations. Moreover,
funding remains constrained for CCSD, a concern frequently expressed by education and workforce
professionals in the region. CCSD spends comparatively less on a per pupil basis than other major
school systems: out of the 100 largest elementary and secondary school systems in the United
States, Clark County is 75th, reporting $8,973 in spending per pupil.68
CCSD has managed to improve student achievement on many fronts, including increasing graduation
rates, standardized test scores, and CTE enrollment. For example, the high school graduation rate
surpassed 85% for the first time in 2019 and remains higher than the state’s rate (83%). However,
despite increases in recent years, CCSD has continued to struggle with student performance on
standardized tests. Average ACT scores for CCSD students reached 17.54 in 2019, slightly below the
state average (17.66) and notably below the national average (20.8).69,70 Additionally, slightly less
than half of CCSD’s K-12 students scored as proficient on the national English language arts
standards, and even fewer (42% of elementary, 31% of middle, and 25% of high school students)
ranked as proficient in mathematics.71
Ultimately, these factors have led to a slightly-below-average level of high school degree attainment
in Southern Nevada (Table 8). Below average achievement in K-12 education can also affect the
region’s higher education attainment levels, especially given that at UNLV, the region’s premier
university, nearly 85% of the student body comes from within the state.72 This below-average
achievement is reflected in the large number of local students that are required to take remedial
classes before enrolling in university-level courses.
Education Achievement in Clark County Remains Below State and National Averages
Table 8: Education Achievement Comparison of Clark County, Nevada, and the United States, 2019. Source: American
Community Survey, U.S. Census Bureau.

56
High school or
higher (%)
High School
Graduate
Average Earnings
Bachelor’s or higher
(%)
Bachelor’s
Graduate
Average Earnings
Clark County 86.1 $31,749 24.5 $49,337
Nevada 86.7 $32,067 24.7 $49,770
United States 88.0 $31,264 32.1 $54,925
The wage premium for postsecondary education in Southern Nevada is comparatively small relative
to the rest of the nation, which can discourage students from pursuing education beyond high
school. Although individuals can still succeed in the labor force without a 4-year degree, Southern
Nevada’s lack of highly educated workers, especially STEM workers essential to the region’s high-
tech target industries, may hamper its economic development. Nevada has the lowest portion of
bachelor’s degree holders in the labor force of any state in the country, and also ranks near the
bottom in the share of individuals in science and engineering (S&E) occupations.73 Furthermore,
regional stakeholders consistently pointed to a limited workforce pipeline for high-tech sectors,
which is borne out in the data. Nevada’s development of new high-skill workers, as measured by
bachelor’s degree awards in science and engineering relative to the state’s 18–24-year-old
population, continues to fall far short of the national average.74
Attraction and Retention of a Skilled Workforce
The historical dominance of tourism, gaming, and entertainment in the local economy of Southern
Nevada has limited the extent to which the region’s workforce has diversified. According to a study
by the Las Vegas Convention and Visitors Authority (LVCVA), in 2017 30% of Southern Nevada’s
workforce was employed by the tourism industry, ranking it as the most tourism-dependent
workforce in the United States. Additionally, 22% of wages earned in the region are sourced from the
tourism sector, the largest share for a metropolitan area in the United States.75 These numbers have
not changed significantly since the beginning of the decade, at which time 29% (2009) of the
region’s workforce was employed in the tourism sector and 22% (2007) of wages were sourced from
the sector.76
In October 2019, LVGEA released its Workforce Blueprint 2.0 report, which identified the top in-
demand occupations throughout Southern Nevada. For all but twelve of the top 50, Southern
Nevada recorded a deficit in supply; the region did not record a surplus for any of the top ten, and
only for two of the top 50. This indicates a significant unmet need for both home-grown talent and
the attraction of workers from other regions.77
Highly-educated couples considering relocation to Southern Nevada have encountered difficulty in
finding jobs for both individuals. The relative lack of jobs requiring advanced degrees and in high-
technology fields means that it can be challenging for certain couples to simultaneously find work in
their fields of training. This “trailing spouse” problem, in which the inability of both spouses to find
employment in their desired industries prevents the entire household from relocating to the region,
can undermine Southern Nevada’s attempts to diversify its workforce.
Workforce Development Programs
Southern Nevada has had difficulties in developing a workforce tightly aligned with the needs of new
and emerging industries. UNLV, the region’s largest 4-year higher education institution, has
continued to play to its strengths in hospitality and gaming; while this has resulted in one of the
world’s highest ranked hospitality schools, it has also led to the underdevelopment of other subject
areas that could attract firms in industries other than hospitality and gaming. For example, rather
than going to the region’s education institutions for skilled workers, stakeholders report that many
manufacturing firms have taken to training employees in-house. Low confidence in the region’s labor
57
pool and the education institutions that train them prevents many firms and industries from
successfully establishing in Southern Nevada.
Business and Industrial Development
Southern Nevada has made significant progress in diversifying its economy since the Great
Recession. The region’s Hachman Index, a measure of economic diversity, has continued to increase
since 2012. Employment in Southern Nevada has surpassed pre-recession levels, driven by job
growth in education and health services (32,600) and trade, transportation, and utilities (19,100).78
While this represents solid growth in emerging industries, Southern Nevada’s Hachman Index score
remains far below nearly all major metro areas in the western United States. Cities including
Phoenix, Denver, Portland, Sacramento, Salt Lake City, and Albuquerque each scored above 0.91,
while Las Vegas scored 0.68 in 2016.79
Even with higher job creation in non-tourism industries, Southern Nevada’s economy remains
uniquely dependent on tourism. According to a 2017 LVCVA study comparing Southern Nevada with
other major tourist destinations in the United States, roughly 20% of Southern Nevada’s GDP comes
from the tourism industry, ranking it the most tourism-dependent city in the United States; the
average for all major U.S. tourist destinations is 6% of GDP. 80 Comparison to a similar study in 2010
indicates that Southern Nevada’s economic reliance on tourism has not changed meaningfully over
the last decade.81 Dependence upon industries that are driven by consumer spending and
disposable income, such as tourism and gaming, limited Southern Nevada’s economic resilience in
the event of future recessions.
Governance
Nevada’s reputation for “small state” government and greater accessibility of decisionmakers has
been advantageous in driving businesses to relocate to the state. This accessibility is seen at both
the state and local level; however, in Southern Nevada, the diversity of communities, ranging from a
large urban core in Las Vegas to smaller suburban and rural communities, has led to a coordination
challenge when recruiting and retaining companies and talent to the region. For local economic
development to be successful and sustainable into the future, coordination needs to happen at two
levels: coordination between the local governments within a region, and coordination between local
governments and state-wide development authorities. LVGEA has played a role in both levels of
coordination.
Within Southern Nevada, local governments have had success in recruiting firms and industries to
their respective jurisdictions; however, it has been a challenge to steer the focus of the local
governments toward a regional perspective. A result of this dynamic is the perceived competition
between local governments within the region to attract high-value firms to their specific jurisdiction,
rather than using the collective assets of Southern Nevada, spread throughout the various
jurisdictions, as a reason to relocate to the region. LVGEA has provided a forum for the discussion of
regional challenges and the development of regional perspectives, but some stakeholders have
indicated that there is a need for improved coordination between the individual local governments
and LVGEA.
Innovation
Southern Nevada’s innovation ecosystem is in many respects still in an early stage of development.
As discussed in the Economic Assessment, resources for science, technology, and innovation are
limited, as is technology transfer activity at UNLV, the region’s largest research university. Preliminary
conversations with stakeholders suggest that investor and mentorship networks for technology-
focused startups are relatively undeveloped compared to other metro areas in the country.

58
Opportunities
Physical Infrastructure
Natural Resources and Environment
Southern Nevada’s arid climate has pushed the region to take creative approaches to water
conservation and resource management. The technological and policy expertise that Southern
Nevadans have acquired in this domain can help support regional economic development and
resiliency in the face of a changing climate and prolonged water shortages. WaterStart, a nonprofit
organization formed by state and local authorities in conjunction with the University of Nevada and
private firms, helps articulate shared challenges among the region’s water consumers and utilities,
and connects them to innovative companies with novel solutions.82 Many of these new technologies
have been implemented at the major resorts and casinos located throughout the region and brought
new firms to Southern Nevada, such as the Australian firms RedEye and STAR Water Solutions.83
WaterStart thus plays a role in optimizing Southern Nevada’s water resources, but also broadly
contributing to the region’s emerging reputation as a global leader in water management.
In its recent land proposal, known as the Southern Nevada Economic Development and
Conservation Act, Clark County identified over 56,000 acres of BLM land that, upon congressional
approval, would be opened for further development in the Las Vegas Valley. The proposal also
includes the designation of over 130,000 acres as off-highway vehicle recreation areas and bars any
further development in areas adjacent to Red Rock Canyon National Conservation Area. This
proposal represents a significant opportunity to meet the demands of a rapidly growing population;
however, conservationists have warned of possible negative effects of further expansion, particularly
threats to native plant species.84,85
Transportation
Opportunities remain for Southern Nevada to further develop its inter- and intra-regional
transportation networks, with the region supporting innovative transportation projects in various
stages of development. The development of a high-speed rail (HSR) line between Southern Nevada
and the greater Los Angeles metropolitan area has reached the financing and design stages, with
the potential to connect more than 22 million people through a 1.5-hour train ride, and generate
more than $2 billion for the local economy.86 To accompany the expansion of the Las Vegas
Convention Center, LVCVA awarded a $48.6M contract to the Boring Company for the construction of
a 0.83-mile, three station transit system. Upon completion, the system is expected to move 4,400
passengers per hour between the various sections of the center at speeds up to 150 miles per
hour.87 If successful, there is an opportunity to expand this system to other areas of Las Vegas,
improving connections between major attractions and transportation hubs, such as McCarran
International Airport and the Strip.
Significant developments in air and road transportation infrastructure bring even more opportunities
for economic growth and tourism. The expansion of I-11 from Southern Nevada to I-80 in Reno
promises to forge stronger ties between Northern and Southern Nevada. Within Southern Nevada,
the continued expansion of I-15 will reduce travel times in some of the region’s most congested
areas and increase the region’s ability to handle additional commercial traffic. In addition, the
continued growth of passenger travel at McCarran International Airport—which served a record 50
million passengers in 2019—further exposes the Southern Nevada market to domestic and
international audiences. For instance, the Federal Aviation Administration (FAA) is currently reviewing
the addition of a non-stop flight from Las Vegas to Tokyo which, if conducted daily, could amount to
an economic impact of over $140 million for the region.88

59
Housing
As the cost of living continues to climb in neighboring regions, particularly in California and other
coastal states, Southern Nevada’s attractiveness to businesses, individuals, and households grows.
Though affordability in Southern Nevada has declined in recent years, in line with national trends,
the supply of new housing has generally adjusted to reflect the needs of lower- and middle-income
buyers. The number of detached single-family homes being built in Las Vegas has fallen by 6%
between 2018 and 2019, while the number of new attached units increased by 77% during the
same time period. Attached units now account for 14% of all new residential buildings in the Las
Vegas area, which is a significant increase over historical trends; in 2017, attached units accounted
for less than 2% of the market.89
The shift to lower-cost, higher-density housing represents an opportunity for Southern Nevada to
market its relative affordability compared to its peer regions and coastal neighbors. More affordable
housing better enables Southern Nevada to lure people and businesses to the region, increasing the
pool of skilled young workers in the region’s workforce.
Social Infrastructure
Recreation
Southern Nevada has plentiful outdoor recreational opportunities and a strong, dynamic tourism and
entertainment industry that continues to innovate and diversify its many attractions. It has made
major advances in developing a cluster of professional sports teams and building out its spectator
sports venues. Finally, Las Vegas’ existing strengths make it poised to capitalize on the emerging
phenomenon of esports. Collectively, these trends mean that Las Vegas has the potential to achieve
international recognition as the sports and entertainment capital of the world.
LVGEA’s “Vegas: Here, You Can” initiative aims to address negative perceptions about life in Las
Vegas (for example, lack of cultural assets and family-friendly communities), by soliciting residents to
share their positive experiences as residents and business owners in Southern Nevada. The initiative
helps to showcase the recreational opportunities available to locals outside of the entertainment
industry, such as the vast amounts of outdoor activities within a short drive of the city center.90 Some
stakeholders indicated the initiative would have greater buy-in from regional participants if a series
of clear metrics were developed.
Professional sports and esports are a promising economic opportunity for Southern Nevada. New
professional sports teams have been established in or relocated to the area, like the Las Vegas
Raiders and the Vegas Golden Knights, while Las Vegas has also capitalized on the rapid growth and
momentum of esports. The Luxor Casino recently opened the HyperX Esports Arena, a 30,000
square foot multi-level arena for esports competitions.91 Esports stands out as an industry of
opportunity for Southern Nevada, with global revenue reaching nearly $1 billion in 2018 and
forecasted to reach $3 billion by 2022. Nearly 400 million people viewed esports in 2018, a number
that is expected to grow to 560 million by 2022.92
Business & Industrial Development
Southern Nevada continues to build on its pre-eminent strength as a tourism destination while
growing its economy across diverse industry sectors. LVGEA has helped create 18,000 jobs in the
region between 2012-2016, with a total economic impact of more than $11B.93 Expanding upon this
diversified growth is a significant opportunity for Southern Nevada to increase the resiliency of the
region’s economy in the event of future economic shocks.
Prior to the identification of new target industries for the region, employment in Southern Nevada’s
previous target industries increased significantly over the last decade (Table 12). Job growth was

60
especially high in Emerging Technology (46%), Business Headquarters and Services (33%), and
Logistics, Manufacturing, and Supply Chain Management (33%). Other target industries, such as
Autonomous Systems; Financing, Banking, and Insurance; Gaming, Tourism, and Conventions; and
Healthcare Services and Medical Education, saw notable increases as well.
As LVGEA promotes Southern Nevada as a compelling place to live and do business, it should
consider how best to build off Las Vegas’ existing marketing resources and reputation. LVCVA has
been highly effective in promoting Las Vegas as a business and leisure travel destination. The
organization has vast resources dedicated to bringing tourists and business visitors from across the
country and globe to Southern Nevada, spending roughly $100 million per year in advertising.94
There are opportunities for LVGEA and other regional organizations to build upon LVCVA’s work and
market their messages to the high volume of visitors brought to Las Vegas. The message of Southern
Nevada as a compelling place to live and establish business permanently should be seen as a
message that compliments, rather than conflicts with, the region’s appeal as a hub for
entertainment and conventions.
Innovation
Southern Nevada has an exciting chance to become a regional powerhouse for testing and deploying
new technologies. The region’s aggregate resources for R&D are limited compared to other major
metro areas in the nation—and will be for the foreseeable future—which means that Southern
Nevada’s leaders must be selective in how they pursue the development of the regional innovation
ecosystem.
Southern Nevada should explore how to better utilize the presence of military installations, such as
Nellis Air Force Base, for new ideas and technology in the civilian market. Recent research indicates
that government defense-related R&D spurs R&D activity in the private sector, leading to significant
economic spillovers and productivity gains.95 Overall federal defense spending and R&D funding is
unlikely to expand significantly in the near future, which suggests that Southern Nevada seek to
maximize benefits from existing federal innovation assets.
Southern Nevada’s entrepreneurial culture, pro-business regulatory environment, and geography
collectively make it a promising location for developing and testing autonomous, artificial intelligence
(AI), and smart city-related technology. The region has existing strengths in UAS, and further
development of the commercial UAS sector is a logical course of action. More expansively, if
policymakers create an environment amenable to testing and demonstrating technology, Southern
Nevada can benefit from integrating new innovations into daily life, even if they are originally
developed outside the region.
Significant developments in the deployment of emerging technology are already occurring in the
urban core of Las Vegas. The City of Las Vegas established its Innovation District in 2016 for testing
emerging technology and is advancing autonomous vehicles, intelligent traffic management, and
other IT and AI-related innovations.96 Lyft and autonomous vehicle company Aptiv have provided
more than 70,000 paid autonomous rides in Las Vegas, one of the largest commercial deployments
of autonomous vehicles to date.97 The newly opened International Innovation Center @ Vegas
(IIC@Vegas) provides further possibilities to recruit companies from across the world that can create
and apply innovations that are relevant to city priorities.98
New technology may endanger some jobs in the gaming and hospitality industry, but it also creates
opportunities to deliver exciting new customer experiences. Las Vegas boasts well-resourced resorts
that have a record of creatively pairing art and technology in their attractions. UNLV is well-positioned
to support innovation in this sector with its International Gaming Institute and Black Fire Innovation
laboratory. Effective collaboration between industry and academia could establish Southern Nevada
61
as a world leader in the use of autonomous technology in the gaming and hospitality sector.
Furthermore, thoughtful consideration of how to pair deployment of these new technologies with new
worker training can accelerate the region’s transition toward higher skilled jobs.
The Las Vegas area is also positioned to make progress as a center for innovation in healthcare,
particularly sports science, which logically compliments the region’s expansion in professional
sports. UNLV’s establishment of a medical school in 2017 has filled an important gap in the region’s
healthcare sector. UNLV has recently announced a partnership with Switch, one of Las Vegas’
keystone technology companies, focused on sports science. The multi-year initiative will not only
allow for greater support of UNLV student-athletes through data analytics, but also enable
collaboration between Switch and faculty researchers in sports science research and technology
development.99
Union Village, a 155-acre, $1.2B development in the Southern Nevada suburb of Henderson,
represents a significant innovation in the delivery of healthcare services. Termed as an “integrated
healthcare village,” Union Village is the first of its kind in the nation as a master-planned community
focused on health and wellness.100 Union Village will provide healthcare to community residents
(including those in senior-living units) through a variety of healthcare facilities, most notably
Henderson Hospital, which opened in 2016. The community is also planning the development of an
expansive wellness center with athlete training facilities. The expansion of professional sports in Las
Vegas gives projects like Union Village prospects to cultivate productive partnerships in the field of
sports medicine, further strengthening the region’s emerging network of healthcare innovation.
Threats
Physical Infrastructure
Natural Resources and Environment
The ability of Southern Nevada to develop land to accommodate its growing population is heavily
dependent upon the cooperation of the federal government, including the BLM and the Department
of Defense (DoD), in selling the land it owns throughout the region. While the BLM has historically
cooperated with developers and sold land at reasonable prices, the presence of DoD-owned military
installations throughout the region, coupled with the shrinking supply of developable land, has the
potential to drastically slow the process of development in Southern Nevada. This could essentially
“landlock” Las Vegas and its communities from further development.
Water scarcity will remain a risk factor for Southern Nevada and the region must remain vigilant in its
water management to maintain a resilient economy. Southern Nevada is classified as “low risk” by
the World Resource Institute’s Water Risk Atlas,101 and does not expect to encounter significant
water shortages for the foreseeable future. That said, sustained and rapid economic and population
growth in the American Southwest may increase shared demands on the Colorado River, the critical
water source for the region. Declining snowpack driven by climate change may also reduce the
availability of water to draw from the Colorado River.
Southern Nevada is generally safe from major natural disasters such as hurricanes and
earthquakes, but the risk posed by rising temperatures and heatwaves has increased over the
years.102,103 The National Weather Service reports that heat kills more individuals than any other
weather event in the United States. This is particularly true for Southern Nevada, where a study by
the Desert Research Institute (DRI) found that heat-related deaths have been increasing over the
last ten years, making them the deadliest weather event in the region. The average number of severe
heat events has increased by nearly 43%, from about three events per year in 2007-2009 to nearly

62
five per year in 2010-2016. This has led to more than 430 heat-related deaths in Las Vegas during
the same time period.104
Housing
While housing in Southern Nevada remains competitive with peer and surrounding regions, the rate
of home price appreciation in Las Vegas remains the highest in the nation at 9.7% since the summer
of 2018; the rate of appreciation has decreased since the previous year, at which point it was
14%.105 However, if appreciation rates remain above national and peer region averages, Southern
Nevada could quickly lose its competitive edge against other regions’ cost of living.
Part of the reason for the increase in housing costs in Southern Nevada, aside from price recovery
from the Great Recession, is the increasing costs to acquire and develop land in Southern Nevada. In
2015, the average price of an acre in the Las Vegas metropolitan area was just under $320,000, a
10.5% increase over 2014 values and a 50% increase over 2013 values. While this remains below
the pre-recession high of over $950,000 per acre in 2007, the increasing cost to acquire land often
results in higher prices for buyers, pricing some households out of the market.106 Additionally, though
the Bureau of Land Management often sells large parcels at lower prices, the land has no
transportation or utility infrastructure, which significantly increases the costs to developers.
Social Infrastructure
Health
Sprawling development and limited public transportation in the region can lead residents to adopt
less healthy lifestyles. Southern Nevada already experiences high temperatures throughout much of
the year, and as these temperatures rise, residents may be further discouraged from walking and
exercising outdoors. The National Climate Assessment, released by the U.S. Global Change Research
Program, finds that people living in urban areas, such as Las Vegas, are particularly susceptible to
negative health impacts as temperatures rise. Increasing temperatures exacerbate the effects of air
pollution, for which Las Vegas has historically ranked poorly. In its 2019 annual State of the Air
report, the American Lung Association (ALA) ranked Las Vegas as the 13th worst city in the nation for
high ozone days, which leads to severe negative health impacts, including aggravated asthma,
respiratory-related hospital admissions, and even premature death.107,108 While Las Vegas’ rankings
have improved in recent years, climate change will likely pose serious threats to the health of
Southern Nevada’s residents.
Recreation
The threat of rising temperatures also potentially impacts the recreation opportunities in Southern
Nevada, particularly outdoor natural assets like Lake Mead. An increasing number of days where
temperatures exceed 100 degrees has led to locals as well as tourists cancelling outdoor recreation
activities in favor of indoor entertainment options.109
Human Capital Development and Retention
Education
The performance and reputation of Southern Nevada’s K-12 education system may hinder regional
economic development. This is a multi-faceted issue: on the one hand, the system’s perception as
overloaded and underfunded worries prospective residents when deciding whether to relocate to the
region. On the other hand, a weak workforce pipeline limits the region’s pool of qualified workers
available to firms looking to relocate to the region. Additionally, stakeholders expressed concern that
limited university-industry partnerships and collaborations in Southern Nevada can result in curricula
that are not well-aligned with industry needs.

63
Attraction and Retention of a Skilled Workforce
Perceptions of Southern Nevada are highly influenced by Las Vegas’ “Sin City” reputation. While this
image has helped bolster the region’s status as a global entertainment powerhouse, it has also
instilled attitudes that the region is not family-friendly. This perception has been difficult for Las
Vegas to move past and is an oft-cited reason for families’ apprehension about moving to the area. A
continued reliance upon the region’s adult entertainment offerings can counteract efforts made by
development authorities and local governments to attract a greater diversity of individuals and
workers to further diversify the region’s workforce.
Additionally, the shortcomings of the region’s education system identified in the preceding section
have been known to deter families from moving to the region. This is an additional factor that
prevents skilled workers, especially those that have children in school, from relocating to the area.
Though there are neighborhoods throughout the region that are known to have high-performing
schools, an overall uncertainty toward the K-12 system threatens the region’s ability to attract and
retain highly skilled workers.
Increased automation in the gaming and hospitality industry may jeopardize the employment security
of the many workers employed in Las Vegas area resorts. Although projections vary considerably by
study, the Las Vegas metro area is frequently cited as one of the nation’s regional economies most
vulnerable to job losses through automation. For example, one study by researchers at the Institute
for Spatial Economic Analysis concluded that roughly 65% of jobs in Las Vegas are susceptible to
automation by 2035.110 A Brookings Institution analysis calculated that nearly half of tasks across all
occupations in the Las Vegas metro area were susceptible to automation, a proportion considerably
higher than the national average.111 It is increasingly plausible that a significant portion of jobs in
Southern Nevada’s largest industry will be radically changed, if not made obsolete, by current
technological trends.
Business and Industrial Development
Southern Nevada’s continued reliance on the tourism industry to drive economic growth and
employment (discussed in more detail in the weaknesses section) indicates that the region is still
highly susceptible to national and international economic boom-bust cycles. With 20% of the region’s
GDP coming from the tourism industry, Southern Nevada remains vulnerable and could experience
significant economic distress in the event of a recession, as it did in the late-2000s and early 2010s.

64
Appendix D. Additional Visualizations
The Las Vegas Metro Area Has Grown Rapidly
Table 9. Population Change for Select U.S. Metropolitan Areas, 2011 and 2019. Source: U.S. Census Bureau, Population
Division.
Metropolitan Area 2011 Population 2019 Population Percent Change
2011–2019
Austin-Round Rock, TX 1,780,535 2,227,083 25.08%
Orlando-Kissimmee-Sanford, FL 2,176,054 2,608,147 19.86%
Phoenix-Mesa-Scottsdale, AZ 4,253,037 4,948,203 16.35%
Las Vegas-Henderson-Paradise, NV 1,961,925 2,266,715 15.54%
Denver-Aurora-Lakewood, CO 2,602,918 2,967,239 14.00%
Colorado Springs, CO 660,674 745,791 12.88%
Salt Lake City, UT 1,106,800 1,232,696 11.37%
Portland-Vancouver-Hillsboro, OR 2,262,834 2,492,412 10.15%
Sacramento-Roseville-Arden-Arcade, CA 2,172,948 2,363,730 8.78%
All U.S. Metros 265,915,286 282,828,515 6.36%
Albuquerque, NM 898,016 918,018 2.23%
The Las Vegas Metro Area Has Experienced Modest Growth in the Population of
Working-Age Adults
Table 10. Cumulative Change in Population Among Peer Regions, Ages 25-44. 2011 and 2019. Source: American
Community Survey, U.S. Census Bureau.
Metropolitan Area 2011 2019 Cumulative Change
in Population
Austin-Round Rock, TX 545,891 696,990 27.68%
Orlando-Kissimmee-Sanford, FL 598,925 725,056 21.06%
Denver-Aurora-Lakewood, CO 763,729 904,725 18.46%
Colorado Springs, CO 172,752 203,764 17.95%
Salt Lake City, UT 326,156 371,989 14.05%
Portland-Vancouver-Hillsboro, OR 655,626 734,558 12.04%
Phoenix-Mesa-Scottsdale, AZ 1,177,893 1,309,095 11.14%
Sacramento-Roseville-Arden-Arcade, CA 575,406 627,359 9.03%
Las Vegas-Henderson-Paradise, NV 582,222 626,650 7.63%
Albuquerque, NM 234,885 245,387 4.47%
All U.S. Metros 78,826,252 82,706,227 4.92%
Note: The calculations above are done using county-level data for each MSA. County associations for each MSA can be found
at https://www.census.gov/geographies/reference-files/time-series/demo/metro-micro/delineation-files.html. Data are
calculated using the five-year estimates provided by the American Community Survey. 2011 data are five-year estimates for
2007-2011 and 2019 data are five-year estimates for 2015-2019.

65
The 65 and Older Population Has Grown Substantially in Las Vegas and Peer
Metro Areas
Figure 13: Percent Change in Population among Peer Metropolitan Areas, 65 Years and Older. 2011-2019. Source:
American Community Survey, U.S. Census Bureau.
Note: The calculations above are done using county-level data for each MSA. County associations for each MSA can be
found at https://www.census.gov/geographies/reference-files/time-series/demo/metro-micro/delineation-files.html. Data
are calculated using the five-year estimates provided by the American Community Survey. 2011 data are five-year
estimates for 2007-2011 and 2019 data are five-year estimates for 2015-2019.
Poverty Rates Have Increased for All Education Groups in the Las Vegas Metro
Area
Table 11: Poverty Rate by Education Level in Las Vegas Metropolitan Area: 2011 and 2019. Source: American Community
Survey, U.S. Census Bureau.
Educational Attainment Level 2011 2019
Less than High School 19.7% 20.5%
High School (or Equivalent) 10.3% 13.5%
Some College or Associates Degree 8.3% 10.0%
Bachelor’s Degree or Higher 4.9% 6.0%
Southern Nevada’s Target Industries Have Grown at Different Rates since the
Recession
Table 12: Southern Nevada Target Industry Employment: 2011–2019. Source: Emsi.
Target Industry 2011
Employment
2019
Employment
Percent
Change
2011
Employment
Share
2019
Employment
Share
Autonomous Systems 6,476 8,689 +34.2% 0.8% 0.8%
47.45%
0% 10% 20% 30% 40% 50% 60% 70%
Austin-Round Rock-Georgetown, TX
Las Vegas-Paradise, NV
Denver-Aurora-Broomfield, CO
Colorado Springs, CO
Phoenix-Mesa-Glendale, AZ
Portland-Vancouver-Hillsboro, OR-WA
Orlando-Kissimmee-Sanford, FL
Albuquerque, NM
Sacramento--Arden-Arcade--Roseville, CA
Salt Lake City, UT

66
Business Headquarters and Services 100,056 148,638 +48.6% 12.5% 14.5%
Emerging Technology 4,606 8,706 +89.0% 0.6% 0.8%
Finance, Banking, and Insurance 21,567 28,734 +33.2% 2.7% 2.8%
Gaming, Tourism, and Conventions 259,234 292,812 +13.0% 32.4% 28.6%
Health Care Services and Medical
Education 53,748 76,888 +43.1% 6.7% 7.5%
Logistics, Manufacturing, and Supply
Chain Management 37,664 60,573 +60.8% 4.7% 5.9%

67
Appendix E. Data Used for Dislocated Workforce
Analysis
To develop the fifth goal of the CEDS activities plan, SRI conducted a dislocated workforce analysis.
This analysis focused primarily upon the impact of the COVID-19 pandemic on employment in
Southern Nevada’s industries using data from the economic data firm Emsi. SRI first began by
identifying industries in Southern Nevada that were most impacted by the pandemic (Table 13
below). As can be seen from the data, the most impacted industries in Southern Nevada all relate to
the leisure and hospitality sector, which is the largest employer in the region.
All Ten Industries Hardest Hit by the COVID-19 Pandemic are Dependent on the
Leisure and Hospitality Sector
Table 13: Ten Industries in Southern Nevada with the Largest Employment Losses in 2020. Source: Emsi.
Industry Job Loss in 2020 % Jobs Lost
Casino Hotels 37,707 34%
Full-Service Restaurants 11,506 16%
Hotels (except Casino Hotels) and Motels 3,684 6%
Temporary Help Services 3,033 5%
Drinking Places (Alcoholic Beverages) 2,693 5%
Convention and Trade Show Organizers 2,582 5%
Corporate, Subsidiary, and Regional Managing Offices 2,103 4%
Taxi Service 1,722 4%
Food Service Contractors 1,667 4%
Limited-Service Restaurants 1,415 3%
After identifying those industries most impacted by the pandemic, SRI identified the most common
occupations of workers in those industries. As can be seen in Table 14, the most commonly
displaced occupations are strongly related to the leisure and hospitality industry.
Occupations of Southern Nevada’s Dislocated Workers are Commonly
Associated with the Gaming, Hotel, and Retail Industries
Table 14: Common Occupations of Dislocated Workers in Industries Which Experienced the Largest Employment Losses in
2020. Source: Emsi.
Common Occupations of Dislocated Workers
Gaming Dealers Gaming Supervisors
Maids & Housekeeping Cleaners Bartenders
Janitors & Cleaners Cashiers
Waiters & Waitresses Laborers & Freight Movers
Security Guards Hotel, Motel, & Resort Desk Clerks
Cooks (Restaurant) Maintenance & Repair Workers, General
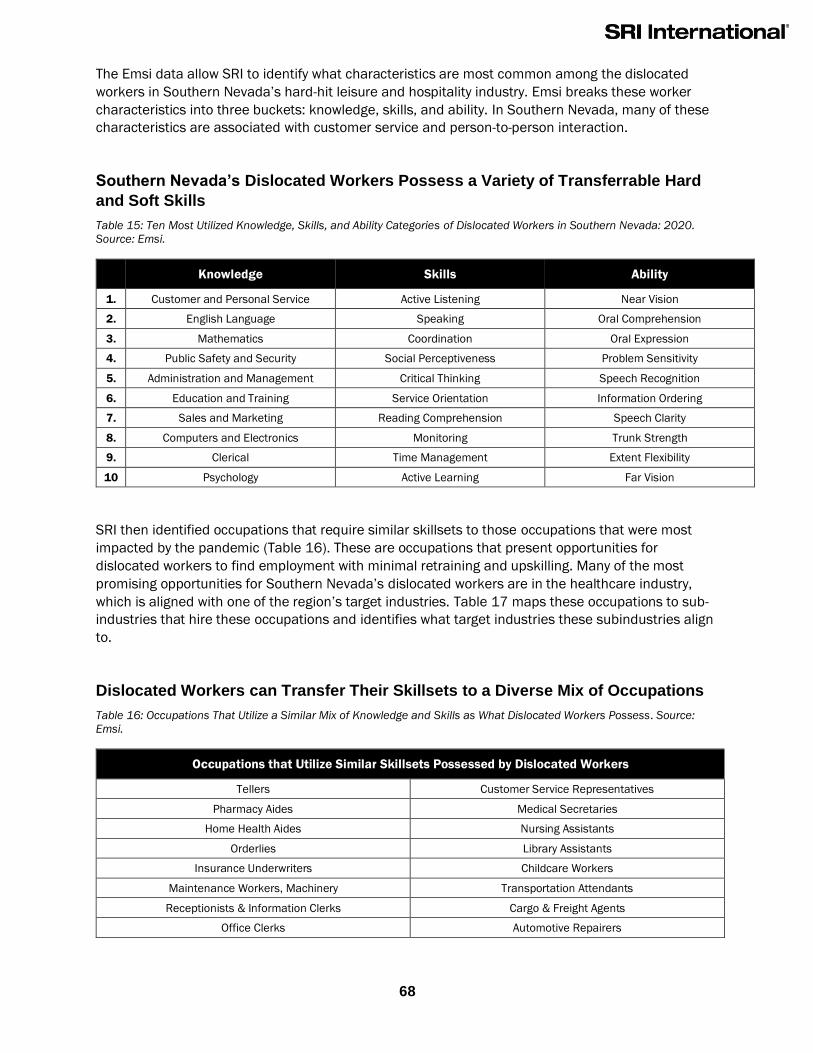
68
The Emsi data allow SRI to identify what characteristics are most common among the dislocated
workers in Southern Nevada’s hard-hit leisure and hospitality industry. Emsi breaks these worker
characteristics into three buckets: knowledge, skills, and ability. In Southern Nevada, many of these
characteristics are associated with customer service and person-to-person interaction.
Southern Nevada’s Dislocated Workers Possess a Variety of Transferrable Hard
and Soft Skills
Table 15: Ten Most Utilized Knowledge, Skills, and Ability Categories of Dislocated Workers in Southern Nevada: 2020.
Source: Emsi.
Knowledge Skills Ability
1. Customer and Personal Service Active Listening Near Vision
2. English Language Speaking Oral Comprehension
3. Mathematics Coordination Oral Expression
4. Public Safety and Security Social Perceptiveness Problem Sensitivity
5. Administration and Management Critical Thinking Speech Recognition
6. Education and Training Service Orientation Information Ordering
7. Sales and Marketing Reading Comprehension Speech Clarity
8. Computers and Electronics Monitoring Trunk Strength
9. Clerical Time Management Extent Flexibility
10 Psychology Active Learning Far Vision
SRI then identified occupations that require similar skillsets to those occupations that were most
impacted by the pandemic (Table 16). These are occupations that present opportunities for
dislocated workers to find employment with minimal retraining and upskilling. Many of the most
promising opportunities for Southern Nevada’s dislocated workers are in the healthcare industry,
which is aligned with one of the region’s target industries. Table 17 maps these occupations to sub-
industries that hire these occupations and identifies what target industries these subindustries align
to.
Dislocated Workers can Transfer Their Skillsets to a Diverse Mix of Occupations
Table 16: Occupations That Utilize a Similar Mix of Knowledge and Skills as What Dislocated Workers Possess. Source:
Emsi.
Occupations that Utilize Similar Skillsets Possessed by Dislocated Workers
Tellers Customer Service Representatives
Pharmacy Aides Medical Secretaries
Home Health Aides Nursing Assistants
Orderlies Library Assistants
Insurance Underwriters Childcare Workers
Maintenance Workers, Machinery Transportation Attendants
Receptionists & Information Clerks Cargo & Freight Agents
Office Clerks Automotive Repairers
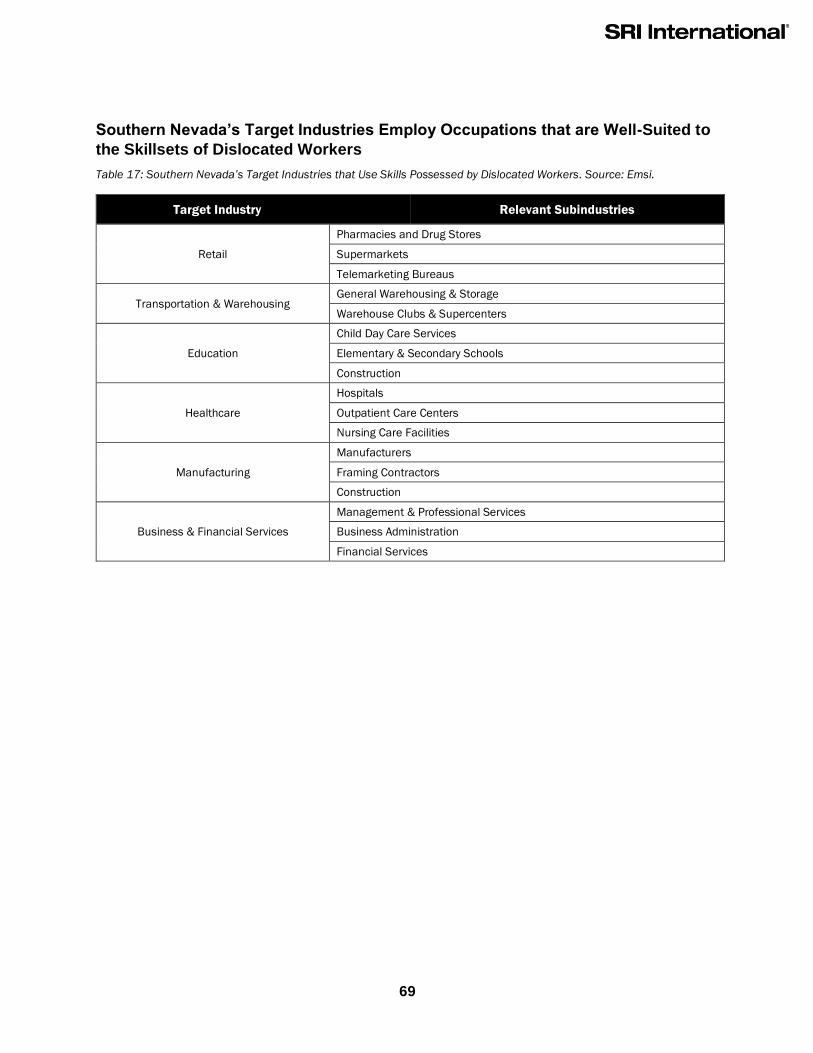
69
Southern Nevada’s Target Industries Employ Occupations that are Well-Suited to
the Skillsets of Dislocated Workers
Table 17: Southern Nevada’s Target Industries that Use Skills Possessed by Dislocated Workers. Source: Emsi.
Target Industry Relevant Subindustries
Retail
Pharmacies and Drug Stores
Supermarkets
Telemarketing Bureaus
Transportation & Warehousing General Warehousing & Storage
Warehouse Clubs & Supercenters
Education
Child Day Care Services
Elementary & Secondary Schools
Construction
Healthcare
Hospitals
Outpatient Care Centers
Nursing Care Facilities
Manufacturing
Manufacturers
Framing Contractors
Construction
Business & Financial Services
Management & Professional Services
Business Administration
Financial Services
70
Notes
i The term “Activities Plan” is used here instead of the EDA term “Action Plan” to avoid confusion with
LVGEA’s Action Plan, a separate document.
2 “Regions.” Nevada Governor’s Office of Economic Development. Accessed September 2019.
http://www.diversifynevada.com/why-nevada/regions/#southern.
3 As defined by the U.S. Census Bureau, natural increase refers to the difference between the
number of births and deaths in a region’s population. “Growth or Decline: Understanding
How Populations Change.” U.S. Census Bureau. Accessed September 2019.
https://www.census.gov/newsroom/blogs/random-samplings/2016/03/growth-or-decline-
understanding-how-populations-change.html.
4 “Distressed Communities Index: U.S. Counties.” Economic Innovation Group. Accessed September
2019. https://eig.org/dci/2018-dci-map-national-counties-map.
5 “Occupational Employment Statistics.” Bureau of Labor Statistics. Accessed September 2019.
https://www.bls.gov/oes/tables.htm.
6 American Community Survey, 2011 and 2017. U.S. Census Bureau.
7 “Unemployment Rates for Metropolitan Areas, May 2021.” Bureau of Labor Statistics.
https://www.bls.gov/web/metro/laummtrk.htm
8 “Southern Nevada Target Industry Validation Study.” Las Vegas Global Economic Alliance. March
2017. https://www.lvgea.org/wp-content/uploads/2017/03/LVGEA_1122BBA.pdf.
9 “Unify, Regionalize, Diversify: An Economic Development Agenda for Nevada.” Brookings Institution,
Brookings Mountain West, SRI International. 2011.
https://www.brookings.edu/wpcontent/uploads/2016/06/1114_nevada_economy.pdf.
10 “Target Industry Validation Study: Revisiting Southern Nevada’s Approach to Economic
Diversification.” Las Vegas Global Economic Alliance. March 2021.
https://www.lvgea.org/wp-content/uploads/2021/04/LVGEA-Target-Industries-Report.pdf
11 “Top Tier Initiative.” University of Nevada Las Vegas. Accessed September 2019.
https://www.unlv.edu/toptier/initiative.
12 National Science Foundation, National Center for Science and Engineering Statistics, Higher
Education Research and Development Survey 2018.
13 This figure is an annual average of R&D expenditures in the mid-2010s and does not include the
data for 2018, for which UNLV reported considerably higher expenditures.
14 R&D and other innovation data have very limited availability at the metro level. As the vast majority
of Nevada’s population resides in the greater Las Vegas area, state-level metrics are used to
approximate Southern Nevada’s performance.
15 “SWOT Analysis: An in-depth analysis of regional strengths, weaknesses, opportunities and
threats.” U.S. Economic Development Administration. Accessed November 2019.
https://www.eda.gov/ceds/content/swot-analysis.htm.
16 “Innovative Metrics for Economic Development: Final Report.” SRI International. November 17,
2017. https://www.eda.gov/files/performance/Innovative-Metrics-ED-Report.pdf
17 Question focus alternated between sessions.
71
18 “Overview.” U.S. Economic Development Administration. Accessed September 2019.
https://www.eda.gov/ceds/.
19 Extensive federal Bureau of Land Management (BLM) ownership of surrounding territory places
some constraints on growth, which is discussed later in the analysis.
20 “Climate of Nevada.” Western Regional Climate Center. Accessed September 2019.
https://wrcc.dri.edu/narratives/NEVADA.htm.
21 “Top 10 Solar States.” Solar Energy Industries Association. Accessed September 2019.
https://www.seia.org/research-resources/top-10-solar-states-0.
22 “Renewable Energy Technical Potential.” The National Renewable Energy Laboratory. Accessed
September 2019. https://www.nrel.gov/gis/re-potential.html.
23 “2020 Water Resource Plan.” Southern Nevada Water Authority. 2020.
https://www.snwa.com/assets/pdf/water-resource-plan-2020.pdf.
24 Elizabeth Daigneau. “Las Vegas Bets on Becoming a Hub for Water Innovation.” Governing. July
2016. https://www.governing.com/topics/transportation-infrastructure/gov-las-vegas-water-
innovation.html.
25 “Water Smart Landscapes Rebate.” Southern Nevada Water Authority. Accessed September 2019.
https://www.snwa.com/rebates/wsl/index.html.
26 “Las Vegas - McCarran International Airport.” Federal Aviation Administration. September 10,
2018. https://www.faa.gov/nextgen/snapshots/airport/?locationId=35.
27 “Destinations from Las Vegas.” Flightsfrom.com. Accessed September 2019.
https://www.flightsfrom.com/LAS/destinations.
28 “McCarran Celebrates 50 Million Passengers.” Clark County. Accessed January 2019.
https://www.clarkcountynv.gov/public-communications/news/Pages/McCarran-Celebrates-
50-Million-Passengers.aspx.
29 “Complete Streets.” Regional Transportation Commission of Southern Nevada. Accessed
September 2019. https://www.rtcsnv.com/projects-initiatives/initiatives/complete-streets/.
30 “Transportation & Infrastructure.” City of Las Vegas. Accessed September 2019.
https://www.lasvegasnevada.gov/Business/Planning-Zoning/Master-Plan/Transportation-
Infrastructure.
31 “Nevada 2018 Infrastructure Report Card.” Infrastructure Report Card. Accessed October 2019.
https://www.infrastructurereportcard.org/wp-content/uploads/2018/12/ASCE-Report-Card-
2018-Final.pdf
32 Jameson Zimmer. “FCC Broadband Definition Has Changed Before and Will Change Again.”
BroadbandNOW. February 10, 2018. https://broadbandnow.com/report/fcc-broadband-
definition/.
33 “Percentage of population with broadband providers.” Federal Communications Commission.
Accessed September 2019. https://broadbandmap.fcc.gov/#/area-
comparison?version=jun2018&tech=acfosw&speed=25_3&searchtype=county&geoid=32&
searched=y.
34 American Community Survey, 2018. U.S. Census Bureau.

72
35 Trey Arline. “Initiatives seek to grant internet access to low-income families.” The Nevada
Independent. July 19, 2019. https://thenevadaindependent.com/article/city-of-las-vegas-
initiative-seeks-to-grant-internet-access-to-low-income-families.
36 The HAI measures if a region’s median income is sufficient to purchase a house at the region’s
median sale price. For instance, if a region’s HAI is 100.0, this indicates that households
earning the state’s median income are exactly able to purchase a home at the state’s
median sale price. Las Vegas’ score of 120.0 for 2018 indicates that households have 120%
of the income necessary to purchase a typical home in the metropolitan area.
“Affordability Index of Existing Single-Family Homes for Metropolitan Areas.” National Association of
Realtors. Accessed September 2019.
https://www.nar.realtor/sites/default/files/documents/metro-affordability-2018-existing-
single-family-2019-06-11.pdf.
37 “The 7 Largest Conventions Held in Las Vegas.” The International School of Hospitality. Accessed
September 2019. https://tisoh.edu/the-7-largest-conventions-held-in-las-vegas/.
38 “Southern Nevada Sports and Entertainment Outlook 2019.” Las Vegas Global Economic Alliance.
November 2018. https://www.lvgea.org/wp-content/uploads/2018/12/LVGEA-
SportsOutlook-FINAL-72dpi.pdf.
39 “Focus 24: Clark County School District’s Five-Year Strategic Plan.” Clark County School District.
2019. https://newsroom.ccsd.net/wp-content/uploads/2019/02/Focus-2024.pdf.
40 “Top Tier Initiative.” University of Nevada, Las Vegas. Accessed September 2019.
https://www.unlv.edu/toptier/initiative.
41 “UNLV Harrah Hotel College Ranked World's Best for Hospitality and Leisure Management.”
University of Nevada, Las Vegas. Accessed September 2019.
https://www.unlv.edu/news/release/unlv-harrah-hotel-college-ranked-worlds-best-
hospitality-and-leisure-management.
42 Workforce Blueprint 2.0. Las Vegas Global Economic Alliance. 2019. https://www.lvgea.org/wp-
content/uploads/2019/10/LVGEA_Workforce-Blueprint-2.0-Report_FINAL_10_1_19.pdf.
43 Ibid.
44 Black Fire Innovation. Accessed October 2019. http://www.blackfireinnovation.com.
45 Sands Center for Professional Development. University of Nevada, Las Vegas. Accessed
September 2019. https://www.unlv.edu/sandscenter.
46 Workforce Blueprint 2.0. Las Vegas Global Economic Alliance. 2019. https://www.lvgea.org/wp-
content/uploads/2019/10/LVGEA_Workforce-Blueprint-2.0-Report_FINAL_10_1_19.pdf.
47 Ibid.
48 “WorkKeys Assessments.” ACT. Accessed October 2019.
http://www.act.org/content/act/en/products-and-services/workkeys-for-
employers/assessments.html.
49 “2018 Annual Report.” Las Vegas Global Economic Alliance. Accessed September 2019.
https://www.lvgea.org/wp-content/uploads/2019/02/2018-Annual-Report-digital.pdf.
73
50 Nicole Santero. “LVGEA Becomes an Accredited Economic Development Organization.” Las Vegas
Global Economic Alliance. January 26, 2018. https://www.lvgea.org/lvgea-becomes-
accredited-economic- development-organization/.
51 “Top Tier.” University of Nevada, Las Vegas. Accessed September 2019.
https://www.unlv.edu/toptier.
52 Southern Nevada Angel Conference. StartUpNV. Accessed September 2019.
https://startupnv.org/snac/#.
53 See for example: “Southern Nevada Target Industry Validation Study.” p.21. Las Vegas Global
Economic Alliance. Accessed September 2019. https://www.lvgea.org/wp-
content/uploads/2017/03/LVGEA_1122BBA.pdf.
54 Eli Segall. “Google Holds Ceremonial Groundbreaking for Henderson Data Center.” Las Vegas
Review-Journal. July 1, 2019. https://www.reviewjournal.com/business/google-holds-
ceremonial-groundbreaking-for-henderson-data-center-1699324/.
55 Daniel Rothberg. “Clark County Seeks Federal Bill as It Looks to Open More Public Lands for
Development.” The Nevada Independent. March 5, 2018.
https://thenevadaindependent.com/article/clark-county-seeks-federal-bill-as-it-looks-to-
open-more-public-lands-for-development.
56 “2018 Water Resource Plan and Water Budget.” Southern Nevada Water Authority. 2018.
https://www.snwa.com/assets/pdf/water-resource-plan.pdf.
57 Robert Lang and William Brown, Jr. “The People in Las Vegas Wanted Light Rail, but the Leaders
Voted for a Bus.” Las Vegas Sun. April 28, 2019.
https://lasvegassun.com/news/2019/apr/28/the-people-wanted-light-rail-but-the-leaders-
voted/.
58 Ibid.
59 2018 Southern Nevada State of Sustainability Report. ImpactNV. 2018.
http://www.clarkcountynv.gov/comprehensive-planning/eco-
county/Documents/2018report.pdf.
60 Community Health Needs Assessment. Clark County, Nevada. May 2019.
https://media.southernnevadahealthdistrict.org/download/sothd/2019-community-health-
needs-assessment.pdf.
61 Ibid.
62 Ibid.
63 “Preliminary Semiannual Crime Statistics for 2018 Released.” Federal Bureau of Investigation.
February 25, 2019. https://www.fbi.gov/news/stories/2018-preliminary-semiannual-
uniform-crime-report-released-022519.
64 Doug Puppel. “Metro Poised to Hire 600 Officers As 'More Cops' Sales Tax Kicks In.” Nevada Public
Radio. February 21, 2017. https://knpr.org/knpr/2017-02/metro-poised-hire-600-officers-
more-cops-sales-tax-kicks.
74
65 Community Health Needs Assessment. Clark County, Nevada. May 2019.
https://media.southernnevadahealthdistrict.org/download/sothd/2019-community-health-
needs-assessment.pdf.
66 Grace Chen. “White Students are Now the Minority in U.S. Public Schools.” Public School Review.
September 4, 2018. https://www.publicschoolreview.com/blog/white-students-are-now-the-
minority-in-u-s-public-schools.
67 “Race for Results: Building a Path to Opportunity for All Children.” The Annie E. Casey Foundation.
2014. http://www.aecf.org/m/resourcedoc/AECF-RaceforResults-2014.pdf.
68 U.S. Census Bureau, Public Elementary-Secondary Education Finances: Fiscal Year 2017 (Table
18). https://www.census.gov/data/tables/2017/econ/school-finances/secondary-
education-finance.html
69 Nevada Accountability Portal. Nevada Department of Education. Accessed September 2019.
http://nevadareportcard.com/DI/nv/clark/2019.
70 “2018 State Percent of ACT-Tested High School Graduates, Average Composite Score, and Percent
Meeting Benchmarks by Subject.” ACT.org. 2018.
https://www.act.org/content/dam/act/unsecured/documents/cccr2018/Average-Scores-by-
State.pdf.
71 Nevada Accountability Portal. Nevada Department of Education. Accessed September 2019.
http://nevadareportcard.com/DI/nv/clark/2019.
72 “University Student Profile - Fall 2018.” University of Nevada, Las Vegas. Accessed September
2019. https://ir.unlv.edu/IAP/Reports/Content/UniversityStudentProfile_Fall2018.aspx.
73 “Bachelor's Degree Holders in the Labor Force (Percent).” National Science Board. Science and
Engineering Indicators 2018. Accessed September 2019.
https://www.nsf.gov/statistics/state-indicators/indicator/bachelors-degree-holders-in-labor-
force/table;
“Individuals in Science and Engineering Occupations as a Percentage of All Occupations
(Percent).” National Science Board. Science and Engineering Indicators 2018. Accessed
September 2019. https://www.nsf.gov/statistics/state-indicators/indicator/se-occupations-
to-all-occupations/map/2018.
74 “Bachelor's Degrees in Science and Engineering Conferred per 1,000 Individuals 18–24 Years Old
(Degrees).” National Science Board. Science and Engineering Indicators 2018. Accessed
September 2019. https://www.nsf.gov/statistics/state-indicators/indicator/se-bachelors-
degrees-per-1000-18-24-year-olds.
75 “The Relative Dependence on Tourism of Major U.S. Economies.” Las Vegas Convention and
Visitors Authority. January 2019.
https://assets.simpleviewcms.com/simpleview/image/upload/v1/clients/lasvegas/EIS_Tou
rism_Dependence_Jan_2019_FINAL_e332cdc1-7e25-4179-b4e9-63e1890adefe.pdf.
76 Economic Impact Series, Volume I, Issue VIII. Las Vegas Convention and Visitors Authority.
Accessed September 2019. http://water.nv.gov/hearings/past/Spring%20-%20Cave%20-
%20Dry%20Lake%20and%20Delamar%20Valleys%202011/Exhibits/SNWA%20Exhibits/SN
WA_Exh_033_Applied%20Analysis,%202010.pdf.
75
77 “Workforce Blueprint 2.0.” Las Vegas Global Economic Alliance. Accessed October 2019.
https://www.lvgea.org/data-and-research/workforce-blueprint/.
78 “The State of Economic Development: Winning the Jobs War.” Las Vegas Global Economic Alliance.
February 1, 2019. https://www.lvgea.org/wp-content/uploads/2017/02/2017-State-of-
Economic-Development.pdf.
79 John Restrepo. “The Indy Outlook: Las Vegas Economy: A for Growth, D+ for Diversity.” The Nevada
Independent. May 7, 2017. https://thenevadaindependent.com/article/indy-outlook-las-
vegas-economy-growth-d-diversity.
80 “The Relative Dependence on Tourism of Major U.S. Economies.” Las Vegas Convention and
Visitors Authority. January 2019.
https://assets.simpleviewcms.com/simpleview/image/upload/v1/clients/lasvegas/EIS_Tou
rism_Dependence_Jan_2019_FINAL_e332cdc1-7e25-4179-b4e9-63e1890adefe.pdf.
81 Economic Impact Series, Volume I, Issue VIII. Las Vegas Convention and Visitors Authority.
Accessed September 2019. http://water.nv.gov/hearings/past/Spring%20-%20Cave%20-
%20Dry%20Lake%20and%20Delamar%20Valleys%202011/Exhibits/SNWA%20Exhibits/SN
WA_Exh_033_Applied%20Analysis,%202010.pdf.
82 WaterStart. Accessed September 2019. https://waterstart.com/.
83 Matt Weiser. “How Las Vegas Aims to Be the Next Silicon Valley for Water Innovation.” GreenBiz.
October 25, 2017. https://www.greenbiz.com/article/how-las-vegas-aims-be-next-silicon-
valley-water-innovation.
84 Miranda Willson. “Critics of Clark County Lands Bill Hope it’s not too Late to Rein in Proposal.” Las
Vegas Sun. August 15, 2019. https://lasvegassun.com/news/2019/aug/15/critics-clark-
county-lands-bill-hope-rein-proposal/.
85 “Southern Nevada Economic Development and Conservation Act.” Clark County, Nevada
Government. September 4, 2019.
http://www.clarkcountynv.gov/airquality/Documents/ClarkCountyLandsBill/Landsbill_Sept0
4_2019_final.pdf.
86 Cinthia Maldonado. “High-Speed Train from Las Vegas to Southern California Back on Track,
Construction Set for 2020.” ABC News 10 San Diego. August 28, 2019.
https://www.10news.com/news/high-speed-train-to-ca-back-on-track-construction-set-for-
2020.
87 Aarian Marshall. “Las Vegas Orders Up a Boring Company Loop.” Wired. May 22, 2019.
https://www.wired.com/story/las-vegas-orders-up-boring-company-loop/.
88 Steve Wolford. “Non-Stop Air Service from Las Vegas to Tokyo Could Be a Reality Again.” NBC 3
News Las Vegas. March 18, 2019. https://news3lv.com/news/local/non-stop-air-service-
from-las-vegas-to-tokyo-could-be-a-reality-again.
89 “LAS VEGAS HOUSING 1Q19: Detached New Home Base Prices Fall for First Time in a Long Time
as Builders Pivot to Smaller Product.” MetroStudy. May 10, 2019.
https://www.metrostudy.com/las-vegas-housing-1q19-detached-new-home-base-prices-fall-
first-time-long-time-builders-pivot-smaller-product/.

76
90 Las Vegas Global Economic Alliance. Accessed September 2019. https://www.lvgea.org/here-you-
can/.
91 Luxor Las Vegas. Accessed September 2019.
https://luxor.mgmresorts.com/en/entertainment/esports-arena-las-vegas.html.
92 Lucy Koch. “Esports Playing in the Big Leagues Now.” EMarketer. February 5, 2019.
https://www.emarketer.com/content/esports-disrupts-digital-sports-streaming.
93 “The State of Economic Development: Winning the Jobs War.” Las Vegas Global Economic Alliance.
February 1, 2019. https://www.lvgea.org/wp-content/uploads/2017/02/2017-State-of-
Economic-Development.pdf.
94 “Popular Annual Financial Report.” Las Vegas Convention and Visitors Authority. June 30, 2018.
https://assets.simpleviewcms.com/simpleview/image/upload/v1/clients/lasvegas/FYE_20
18_PAFR_974f3cee-e473-4b80-8d85-76865d40680e.pdf.
95 Enrico Moretti, Claudia Steinwender, John Van Reenen. “The Intellectual Spoils of War? Defense
R&D, Productivity and International Spillovers.” The National Bureau of Economic Research.
November 2019. https://www.nber.org/papers/w26483.
96 “Technology Opportunities.” City of Las Vegas. Accessed September 2019.
https://www.lasvegasnevada.gov/Business/Economic-Development/Technology-
Opportunities.
97 Adam Frost. “Aptiv and Hyundai Unite for Autonomous Driving Project.” Traffic Technology Today.
September 25, 2019. https://www.traffictechnologytoday.com/news/autonomous-
vehicles/aptiv-and-hyundai-unite-for-autonomous-driving-project.html.
98 “International Innovation Center @ Vegas Opens Downtown.” City of Las Vegas. Accessed
September 2019. https://www.lasvegasnevada.gov/News/Blog/Detail/international-
innovation-center-vegas-opens-downtown.
99 “UNLV, Switch Launch Multi-Year Partnership for Sports Technology Innovation.” University of
Nevada Las Vegas News Center. Accessed October 2019.
https://www.unlv.edu/news/release/unlv-switch-launch-multi-year-partnership-sports-
technology-innovation.
100 Bryan Horwath. “Union Village Vision in Henderson Becoming a Reality.” Las Vegas Sun. July 1,
2019. https://vegasinc.lasvegassun.com/business/2019/jul/01/union-village-vision-in-
henderson-becoming-a-reali/.
101 Water Risk Atlas. Aqueduct. Accessed September 2019.
https://www.wri.org/applications/aqueduct/water-risk-atlas/.
102 “Weather Fatalities 2018.” National Weather Service. Accessed September 2019.
https://www.nws.noaa.gov/os/hazstats/resources/weather_fatalities.pdf.
103 Jeniffer Solis. “Hotter Summers Leading to More Las Vegas Deaths, DRI Study Says.” Nevada
Current. June 5, 2019. https://www.nevadacurrent.com/blog/hotter-summers-leading-to-
more-las-vegas-deaths-dri-study-says/.
104 E.R Bandala. K Kebede, N. Jonsson, et. al. “Extreme Heat and Mortality Rates in Las Vegas,
Nevada: Inter-Annual Variations and Thresholds.” 2019
https://link.springer.com/article/10.1007/s13762-019-02357-9.

77
105 “LAS VEGAS HOUSING 1Q19: Detached New Home Base Prices Fall for First Time in a Long Time
as Builders Pivot to Smaller Product.” MetroStudy. May 10, 2019.
https://www.metrostudy.com/las-vegas-housing-1q19-detached-new-home-base-prices-fall-
first-time-long-time-builders-pivot-smaller-product/.
106 Eli Segal. “Las Vegas Land Isn’t Dirt Cheap, but Here’s Why It Isn’t Selling Like It Once Was.” Las
Vegas Sun. January 15, 2016. https://lasvegassun.com/news/2016/jan/15/land-isnt-dirt-
cheap-las-vegas-heres-why-it-isnt-s/.
107 “State of the Air.” American Lung Association. Clark County, NV. Accessed September 2019.
https://www.lung.org/our-initiatives/healthy-air/sota/city-
rankings/states/nevada/clark.html.
108 Fourth National Climate Assessment. 2018. https://nca2018.globalchange.gov/chapter/14/.
109 C. Moon Reed. “How This Summer’s Extreme Weather Has Hampered Region’s Outdoor
Recreation.” August 14, 2018. https://lasvegassun.com/news/2018/aug/14/summer-
extreme-weather-curb-region-outdoor-activit/.
110 Jess Chen, Johannes Moenius. “OPINION: Two-thirds of jobs in this city could be automated by
2035.” MarketWatch. August 5, 2017. https://www.marketwatch.com/story/two-thirds-of-
jobs-in-this-city-could-be- automated-by-2035-2017-07-05.
111 Mark Muro, Robert Maxim, and Jacob Whiton. “Automation and Artificial Intelligence: How
machines are affecting people and places.” Brookings Institution. January 24, 2019.
https://www.brookings.edu/research/automation-and-artificial-intelligence-how-machines-
affect-people-and-places.