Embed Size (px)
Citation preview

STRATEGY
Research Analysts:
Learning from corporate failure
Prashant Mittal, [email protected]
March 2016
Complacency
to
competition
Complacent
capital
allocation
Complacency
to business
environment
CDRRocks
Top
Quality
Company
Saurabh Mukherjea, [email protected]: +91 22 3043 3174
Consultant: Anupam [email protected]
Ritesh Gupta, [email protected]
Parita Ashar, [email protected]
Ashvin Shetty, [email protected]
Paresh Dave, [email protected]

Strategy
March 23, 2016 Ambit Capital Pvt. Ltd. Page 2
CONTENTS
Learnings from corporate failure…………………………………………………… 3
Section 1: A framework for identifying failure ……………………………………4
Section 2 – Analysis of corporate failure …………………………………………10
- Case Study 1: Tata Steel (bottom slider) vs JSW Steel (top half) …………15
- Case Study 2: M&M (bottom slider) vs Tata Motors (top half) …………….19
- Case Study 3: Indian Oil Corporation (IOC; bottom slider) ……………...24 vs Bharat Petroleum Corporation (BPCL; top half)
- Case Study 4: GSK Pharma (bottom slider) vs Sun Pharma (top half) …..28
Section 3 – Spotting corporate failure on a prospective basis ………………..33
Appendix 1 ……………………………………………………………………………40

Ambit Capital and / or its affiliates do and seek to do business including investment banking with companies covered in its research reports. As a result, investors should be aware that Ambit Capital may have a conflict of interest that could affect the objectivity of this report. Investors should not consider this report as the only factor in making their investment decision.
Learning from corporate failure
64% of BSE200 companies (ex-Financial Services) that were “great” in FY05 slid to mediocrity by FY15. However, our analysis shows that secular (i.e., non-cyclical) companies have a much higher probability than cyclical companies of remaining great (i.e., delivering superior results over long periods of time). That said, even with secular companies, investors should watch out for promoters sleeping at the wheel, i.e., complacency to competition, to the business environment and to capital allocation; these remain the biggest reasons for failure. Leading businesses are prone to fail but provide enough red flags before sliding.
Identifying corporate failure Our 'Greatness Framework', unveiled in 2012, has a strong track record of identifying companies that allocate capital sensibly over long periods of time. Not much, however, is known about companies that have failed to do so. Hence, we now use the same framework to identify failure – companies that were once great, but have slipped over the past decade (FY05-FY15). Secular companies outgun cyclicals along different dimensions We ran our Greatness Filter on the BSE200 Index (ex-Financials) as it stood on 30th Oct 2005 and classified the companies into quartiles (with Q1 being the top quartile). Our analysis revealed that 64% of all Q1 companies as of FY05 end up in Q3 or Q4 by FY15. However, 50% of the FY05 secular companies stay in the top half (Q1+Q2) even as 71% of cyclical companies slide to the bottom half (Q3+Q4) over FY05-15. Expectedly, secular Q1 companies (in FY05) that remain in the top half (in FY15) provide the best stock price performance, beating cyclicals and the BSE200 (ex-BFSI) over FY05-15. Surprisingly, the few cyclical companies that managed to sustain their financial performance over FY05-15 delivered lower stock price returns than the secular companies which slid. Why do companies fail? Complacency is a key factor It is easy to blame the economy, the worsening of commodity cycle, etc., for the travails of companies that slid to the bottom half. We posit that the real reason is simpler: complacency in the face of rising competition and in light of a deteriorating business environment resulting in sub-optimal capital allocation. We provide four pairs of case studies - M&M v/s Tata Motors, Tata Steel v/s JSW Steel, IOC v/s BPCL and GSK Pharma v/s Sun Pharma – to highlight how amongst similar businesses, one slides to the bottom and the other does not. The red flags that signal an imminent slide to mediocrity Are companies that have stayed in Q1/Q2 over FY05-FY15 at risk of sliding to mediocrity going forward? We provide investors with a list of red flags. Watch out for complacent promoters who miss shifts in the market and changes in the business environment, and make excessively bold bets risking their balance sheet. Investors who avoid these companies can make more returns on their investment than promoters of those companies will make on their capital.
THEMATIC March 23, 2016
Strategy
Quartile 1 stocks in FY05 that stayed in Quartile 1 or 2 in FY15
Name
Secular companies (Magic Box)
Cyclical companies
Sun Pharma BPCL
Tata Motors GAIL (India)
Bosch JSW Steel
Nestle India Essar Ports
Sanofi India GE Shipping Co
Ipca Labs Monsanto India
Gujarat Alkalies
Quartile 1 stocks in FY05 that fell to Quartile 3 or 4 in FY15
Name Secular companies Cyclical companies
M & M IOCL
Hero MotoCorp Hindustan Zinc
GSK Pharma Siemens
Jubilant Life Ambuja Cements
SKF India Tata Steel
Asahi India Glass Bharat Electronics
BHEL
Vedanta
ACC
A B B
SAIL
Thermax
BEML Ltd
Chennai Petro. Corp
JP Associates
Gujarat NRE Coke
Bajaj Hindusthan
THIS NOTE CANNOT BE USED BY THE MEDIA IN ANY SHAPE OR FORM WITHOUT PRIOR CONSENT FROM AMBIT CAPITAL.
Research Analysts Saurabh Mukherjea, CFA +91 22 3043 3174 [email protected]
Prashant Mittal, CFA +91 22 3043 3218 [email protected]
Consultant Anupam Gupta [email protected]
“Magic Box” - Secular companies that remain great over FY05-15
Source: Company, Ambit Capital research

Strategy
March 23, 2016 Ambit Capital Pvt. Ltd. Page 4
Section 1: A framework for identifying failure "Every institution is vulnerable, no matter how great. No matter how much you've achieved, no matter how far you've gone, no matter how much power you've garnered, you are vulnerable to decline. There is no law of nature that the most powerful will inevitably remain at the top. Anyone can fall and most eventually do."
- Jim Collins, How the mighty fall (2009)
Given the efficacy of our “Greatness” framework in delivering market-beating returns (by identifying corporates which allocate capital sensibly over extended periods of time), we use the framework to identify corporate failures. In this section, we identify companies that were great in FY05 but slipped to mediocrity by FY15. Our analysis leads us to three startling conclusions:
(a) 64% of all Quartile 1 companies in the BSE200 (ex–BFSI) universe as of FY05 ended up in the bottom half (i.e., Quartile 3 and Quartile 4) by FY15, suggesting that great companies have a high tendency to slide to mediocrity.
(b) Secular (i.e., non-cyclical) companies are more resilient than cyclical ones; 50% of the secular companies in Quartile 1 in FY05 remain in the top half (i.e., Quartile 1 and Quartile 2) in FY15;
(c) Amongst the cyclical companies that were in Quartile 1 in FY05, only 29% remained in the top half in FY15 (implying that 71% of the FY05 Q1 cyclicals slid to mediocrity); and
(d) Secular companies that remained in the top half have posted much better total stock returns (median 25% CAGR) than cyclical companies that remained in the top half (median 15% CAGR) over FY05-FY15.
Our “Greatness” framework works
We had unveiled the ‘Greatness Framework’ on 19th January 2012 with the first iteration of the “Tomorrow’s ten baggers” report (click here). This framework quantifies a firm’s structural strengths by focusing not on absolutes but on improvements in capital allocation (as per the flow diagram given below) and corporate performance over long periods of time and the consistency of those improvements.
Exhibit 1: The ‘greatness’ framework
Source: Ambit Capital Research
More than half of the companies in Q1 in FY05 slide to the bottom half by FY15
Capital allocation lies at the core of our Greatness Framework
b. Conversion of investment to sales (asset turnover, sales)
c. Pricing discipline (PBIT margin)
d. Balance sheet discipline (D/E, cash ratio)
a. Investment (gross block)
e. Cash generation (CFO)

Strategy
March 23, 2016 Ambit Capital Pvt. Ltd. Page 5
Capital allocation lies at the core of our Greatness Framework; in the 10 years from FY05 to FY15, the stock price of BSE200 (ex-BFSI) companies with ROCE of more than 15% beat the BSE200 index by 7.7% on a CAGR basis. The Greatness Framework is reproduced in Appendix 1.
Since 2012, our Greatness Framework has held us in good stead, providing us with the quantitative approach for the ten-bagger portfolio (see our 19 Jan 2016 iteration here). As can be seen in the exhibit below, the ten-bagger portfolio has consistently beaten the BSE500 index since the inception of the portfolio in 2012.
Exhibit 2: Our ten-bagger portfolio has consistently beaten the BSE500 index since initiation
Source: Bloomberg, Ambit Capital Research
Identifying failure
Our three-step exercise begins with identifying companies that have slid to mediocrity on the basis of our Greatness Framework, comparing their total stock returns performance over the past ten years, and, finally, assigning probabilities of success and failure to a particular company in today’s top quartile.
Identifying the companies
We now use our Greatness Framework in reverse. While the ten-bagger portfolio identified stocks that have sustained and/or improved their financial performance, we now apply the greatness filter to identify companies whose financial performance has deteriorated in the past decade. The methodology is as follows:
Step 1: We start with the BSE200 Index, excluding banking and financial services industry (BFSI) stocks, as on 30th October 2005. The sample set consists of 161 companies.
Step 2: We apply the Greatness Framework (outlined in Appendix 1) on these companies for FY05-FY15 (10 years). In other words, we run our Greatness Framework on the selected 161 companies as at FY05-end and at FY15-end.
Step 3: We use quartiles to rank the sample set of 161 companies. Quartile 1 consists of the highest ranked companies in the Greatness Framework and Quartile 4 has the worst ranked companies. We use the term ‘top half’ to describe companies in Quartile 1 and Quartile 2 and ‘bottom half’ to describe companies in Quartile 3 and Quartile 4.
Step 4: We use the term ‘bottom slider’ to denote companies that slid from Quartile 1 in FY05 to the bottom half (Q3 or Q4) in FY15.
Step 5: We define as secular as any sector (mainly IT, Pharma, FMCG, Autos and Consumer Discretionary) that is not cyclical. As a result, 67% of the companies in Quartile 1 as at FY05-end are cyclical whilst 33% are secular.
6.7 9.8
43.4 52.6 53.3
(10) - 10 20 30 40 50 60 70 80
2012 2013 2014 2015 2016
Ret
urn
(%)
Ten-bagger iteration return index return cumulative alpha
We use our Greatness Framework in reverse to identify failures

Strategy
March 23, 2016 Ambit Capital Pvt. Ltd. Page 6
Applying the above methodology, we get the following results:
41 companies start in Quartile 1 (top quartile) of the BSE200 ex-Financials. We exclude five companies (Mylan Lab, Ranbaxy, Kochi Refineries, Bongaigaon Refineries and Sterlite Industries) that were delisted or merged over FY05-15. That leaves us with 36 companies in Quartile 1. Of these, 23 (i.e. 64%) slide to the bottom half by FY15, while 13 remain in the top half ten years hence.
Of the 23 bottom sliders, 17 are cyclical and 6 are secular. We highlight that the high share of cyclicals (17 out of 23 companies, or 74%) is much higher than the percentage of cyclicals (67%) in Quartile 1 at FY05-end (implying that cyclical companies are over-represented amongst the bottom-sliders).
Of the 13 top winners (i.e. companies that were Q1 in FY05 and remained in either Q1 or Q2 in FY15), 6 are secular and 7 are cyclical. Here, we highlight the high share of secular companies (6 out of the 13 top winners, or 46%) which is significantly higher than the seculars’ share of 33% in Quartile 1 at FY05-end (implying that secular companies are over-represented amongst the top winners).
The secular companies which started in Quartile 1 in FY05 and are in the top half in FY15 constitute the “Magic Box”. In other words, these are the companies which have the benefit of both being secular in nature, thus having higher probability of ending up in the top half in FY15 (~59%; computed as ‘1- probability of sliding to the bottom half (41%)’ as seen in exhibit 3 below), and being the best of that lot as well. Exhibit 3 below shows the number of secular and cyclical companies sliding from Q1 to the bottom half over three 10-year instances i.e. FY03-13, FY04-14 and FY05-15 and computes the probability of a secular or cyclical company sliding to the bottom half over a 10-year period.
Exhibit 3: Secular companies have a higher probability of ending up in the top half after a decade
Firms
in Q1
# of secular firms in
Q1
# of cyclical firms in
Q1
# of total firms
after a decade in
% of firms moving to
bottom half
# of secular firms after a
decade in
# of cyclical firms after a
decade in
% Seculars moving to
bottom half
% Cyclicals moving to
bottom half
Top half Bottom half Top
half Bottom
half Top half
Bottom half
FY03-13 41 23 18 18 23 56% (i.e. 23/41) 14 9 4 14 39%(i.e. 9/23) 78% (i.e. 14/18)
FY04-14 37 17 20 18 19 51% (i.e. 19/37) 11 6 7 13 35% (i.e. 6/17) 65% (i.e. 13/20)
FY05-15 36 12 24 13 23 64%(i.e. 23/36) 6 6 7 17 50% (i.e. 6/12) 71% (i.e. 17/24)
Average 57% 41% 71%
Source: Ambit Capital Research, Bloomberg
We summarize our findings in the exhibit below.
Exhibit 4: Magic Box – 6 secular stocks that beat their cyclical peers and the benchmark over FY05-15
Source: Ambit Capital research, Bloomberg.
The list of FY05 Q1 companies in the top half and the bottom half in FY15 are as follows:
Of the 36 companies in Q1, 13 remain in the top half till FY15 while 23 slide to the bottom half
Magic Box consists of six stocks that have beaten cyclical peers and the BSE200 (ex-BFSI) index
13 top half companies vs 23 bottom half companies

Strategy
March 23, 2016 Ambit Capital Pvt. Ltd. Page 7
Exhibit 5: Separating the winners from the bottom sliders
Remained in top half (FY05 to FY15) Slid to bottom half (FY05 to FY15)
Secular companies (10-year share price CAGR, 10-year EPS CAGR) Secular companies (10-year share price CAGR, 10-year EPS CAGR)
1 Nestle India (22%, 17%) 1 Hero MotoCorp (14%, 11%)
2 Bosch (25%, 14%) 2 Jubilant Life (7%, N/A)
3 Sanofi India (13%, 5%) 3 M & M (21%, 13%)
4 Tata Motors (16%, 19%) 4 Glaxosmithkline Pharma (14%, 6%)
5 Ipca Labs. (26%, 13%) 5 SKF India (19%, 12%)
6 Sun Pharma (32%, 26%) 6 Asahi India Glass (9%, -9%)
Cyclical companies (10-year share price CAGR, 10-year EPS CAGR) Cyclical companies (10-year share price CAGR, 10-year EPS CAGR)*
1 BPCL (17%, 10%) 1 Tata Steel (-2%, N/A)
2 GE Shipping Co (11%, 1%) 2 Gujarat NRE Coke (-20%, N/A)
3 JSW Steel (16%, 1%) 3 Vedanta (8%, N/A)
4 GAIL (India) (7%, 4%) 4 Bharat Electronics (18%, 10%)
5 Essar Ports (14%, -5%) 5 Siemens (19%, 13%)
6 Monsanto India (11%, 3%) 6 Thermax (18%, 12%)
7 Gujarat Alkalies (2%, 5%) 7 BEML Ltd (4%, -30%)
8 A B B (14%, 4%)
9 JP Associates (-10%, N/A)
10 BHEL (6%, 4%)
11 ACC (12%, 11%)
12 Hindustan Zinc (22%, 29%)
13 CPCL (Chennai Petroleum Corporation) (-1%, N/A)
14 IOCL (Indian Oil) (6%, -1%)
15 Ambuja Cements (12%, 10%)
16 SAIL (0%, -11%)
17 Bajaj Hindusthan (-19%, N/A)
Source: Ambit Capital research, Bloomberg. Note: 10-year share price CAGR computed from 31st Oct’05 to 30th Oct’15. * There are several “N/A” signs here as these companies did not make a profit in FY15.
Comparing total stock returns over FY05-15
We tracked the total stock returns of the above companies over a 10-year period from 31st October 2005 to 30th October 2015. One striking find was that secular companies in the top half gave the best returns (median returns of 25% CAGR versus 15% CAGR for the top half cyclical companies and 14% CAGR for the BSE200 (ex-BFSI)) over the 10-year period.
Cyclical companies in the bottom half gave the worst returns (median returns of 9% CAGR versus 17% CAGR for secular bottom half companies and 14% CAGR for the BSE200 universe (ex-BFSI)) over the 10-year period. Even more interestingly, cyclical companies who stayed in the top half gave 10-year share price returns similar to the broader market (15%) suggesting that even if one invests in the best cyclical companies AND even if these companies stay in the top half ten years hence, the shareholders in these names still won’t outperform the benchmark!
In order to make sure that our FY05-15 data run is not an anomaly, we have also performed similar data runs on FY03-13 and FY04-14. Our results for the three 10-year periods FY03-13, FY04-14 and FY05-15 are in the exhibit below.
Secular companies in the top half gave the best returns, while cyclical companies in the bottom half underperformed

Strategy
March 23, 2016 Ambit Capital Pvt. Ltd. Page 8
Exhibit 6: Secular companies in the top half in the tenth year contains the best performing stocks*
Median returns (CAGR)
Secular companies Cyclical companies BSE200
(ex-BFSI) returns
In top half in 10th year (The Magic Box)
In bottom half in 10th year
In top half in 10th year
In bottom half in 10th year
Over the ten years
FY03-13 16.4% 9.2% 12.2% 11.7% 13.7%
FY04-14 25.2% 17.2% 17.8% 16.5% 17.6%
FY05-15 24.9% 16.9% 14.5% 8.8% 13.7%
Average 22.2 % 14.5% 14.8% 12.3% 15.0%
Source: Ambit Capital research, Bloomberg. * The returns given above are total stock returns i.e. these returns take dividend payments into account and assume that dividends are reinvested on the ex-dividend date.
Probability of great companies sliding to mediocrity
We calculated the probability of a company in the top quartile now sliding to the bottom half over the next decade by looking at data from three 10-year data sets, i.e., FY03-13, FY04-14 and FY05-15. The results are as follows:
1) 23 of 36 great companies (in Quartile 1) slide to mediocrity over FY05-15 (implying a probability of 64% of sliding to mediocrity). Considering all the three 10-year data sets, the implied probability of a Q1 company ending up in the bottom half after a decade is 57% (computed using the proportion of companies sliding from Q1 to the bottom half as shown in exhibit 3 above).
2) However, given that it is already known at the beginning of the 10-year period if a company is secular or cyclical, we should look at this probability for secular and cyclical companies separately. Our analysis reveals that the chances of a Q1 secular company sliding to the bottom half is 41%, while the chances of a Q1 cyclical company sliding to the bottom half is higher, at 71% (as shown in exhibit 3 above).
3) Conversely, the chances of a Q1 secular company remaining in the top half is high (59%), while the chances of a Q1 cyclical company remaining in the top half is low (29%). It is worth reflecting on the latter finding for a minute – even if one invests in the best cyclical companies, history suggests that ten years hence, 71% of them would have slid to mediocrity (with obvious adverse implications for shareholders’ returns).
To ensure that these 10-year results do not give us anomalous findings, we ran the same exercise (i.e., applying the greatness filter on BSE200 ex-BFSI companies) over a five-year period for eight instances (shown in the exhibit below) and found that these findings are broadly in line with those of the 10-year data run. The chance of a Q1 secular company staying in the top half five years hence is 59%, while the chance of a Q1 cyclical company staying in the top half five years hence is only 39%. It is worth reflecting on the latter finding for a minute – even if one invests in the best cyclical companies, history suggests that in as little as five years, 61% of them would have slid to mediocrity (with obvious adverse implications for shareholders’ returns).
The chance of a Q1 secular company staying in the top half is high over a decade (at 59%) as well as over a five year period (at 59%)

Strategy
March 23, 2016 Ambit Capital Pvt. Ltd. Page 9
Exhibit 7: Secular companies have a higher probability of retaining top position even on a shorter time frame of 5 years*
5-year period
Secular companies Cyclical companies
Top half in 5th year (The Magic Box)
Bottom half in 5th year
Top half in 5th year
Bottom half in 5th year
FY03-08 50% 50% 41% 59%
FY04-09 47% 53% 57% 43%
FY05-10 57% 43% 36% 64%
FY06-11 47% 53% 48% 52%
FY07-12 67% 33% 28% 72%
FY08-13 50% 50% 46% 54%
FY09-14 70% 30% 36% 64%
FY10-15 86% 14% 20% 80%
Average 59% 41% 39% 61%
Source: Ambit Capital research, Bloomberg. *The above table depicts movement of secular and cyclical companies from Q1 to top/bottom half (basis greatness framework) over a 5 year timeframe.
The ‘cyclicals’ myth debunked
With 23 of 36 companies falling to the bottom half from top quartile (Q1) over FY05-15, our analysis tells us that great stocks have a very high tendency of sliding to mediocrity over a decade. However, the implications for cyclicals are even more damaging. As we have highlighted in our macro-economic research, investors are awaiting a recovery in the Indian economy, which we believe is unlikely anytime soon (we expect FY17 GDP growth of 6.8%, flat over FY16- (click here) for our 26 Oct 2015 note). This extended hope of economic recovery has led to a rising wave of investor fondness for cyclicals. We believe this fondness is not grounded in facts.
Firstly, cyclical companies are more vulnerable to a slide to mediocrity (falling to the bottom half from Quartile 1) over both 5-year period (61% chance) and 10-year period (71% chance).
Secondly, in terms of stock price performance over a decade, even those cyclical companies that remained in the top half (average return of 15% on CAGR basis) underperformed their secular counterparts in the top half (average return of 22% on CAGR basis). To put this more bluntly – by investing in cyclicals, investors carry too much risk for much lower return. The probability of the best cyclical companies sliding to mediocrity is high (see Exhibit 3) and even for those cyclical companies that stay in the top half, the decadal shareholder returns are only in-line with the benchmark (see Exhibit 6).
The case for investing in secular companies remains strong
The tendency of Q1 secular companies to slide to mediocrity is not just lower than that of cyclical ones, it is also much lower than 50%. Further, not only are secular companies much more likely to stay in the top half on a 5-year (59%) and 10-year (59%) basis, they also posted much better share price returns over the 10-year period. Q1 secular companies that stay in the top half a decade hence gave the best stock price performance over a decade (22% CAGR, compared to 15% for their cyclical counterparts in the top half and 15% for BSE200 ex-BFSI).
These findings raise two issues that the remainder of this report will investigate, namely:
Why do successful Indian companies slide to mediocrity so systematically? [see section 2]; and
Are secular companies currently in the Magic Box (Q1 in 2005 and the top half in 2015) a source of future outperformance or a death trap? [see Section 3]
By investing in cyclicals, investors carry too much risk for much lower return.
The tendency of secular companies to slide to mediocrity is not just lower than cyclical companies, it is also much lower than 50%.

Strategy
March 23, 2016 Ambit Capital Pvt. Ltd. Page 10
Section 2 – Analysis of corporate failure "I like to study failure, actually. My partner says, "I want to know where I'll die so I'll never go there." We want to see what has caused businesses to go bad. The biggest thing that kills them is complacency. ... The danger would always be that you rest on your laurels." - Warren Buffett's Top 10 Rules For Success1
“Success breeds complacency. Complacency breeds failure. Only the paranoid survive.” - Andy Grove, Only the Paranoid Survive (1996)
The list of FY05-15 bottom sliders contains some of India’s largest companies like Tata Steel, Vedanta and Hero MotoCorp. Why do these companies slide to mediocrity? It is tempting to ascribe the failure to simplistic reasons such as volatility in commodity prices and weakness in overall economic growth. However, we believe the biggest reason for this failure is complacency at the promoter level. In this section, we use case studies to show how complacency to competition, complacency to business environment and complacency to capital allocation sow the seeds of failure.
Revisiting corporate failure
While corporate success is celebrated, failure – and its important lessons – are ignored. This is our second major study of corporate failure. Our first report was titled “Why do great Indian companies self-destruct?” (click here) and published in June 2013. The central thesis of that report is that a great company’s slide to mediocrity is led by poor strategic decision-making fuelled by ’hubris and arrogance‘. Such faulty strategic decisions usually result in poor capital allocation, which destroys RoCE and creates financial stress. In that report, we created a 5-step framework to mark various phases in a great company’s slide to mediocrity. The framework was based on the works of respected authors like Jim Collins (How the mighty fall) and William Thorndike (The Outsiders). A recap of the five steps highlighted in our 2013 note:
Stage 1 - Hubris and arrogance: The company is on top of its game. Operating margins, RoCE, growth, valuation multiples, etc., are at all-time highs. Captivated by the success in its core business, the management starts believing its own press. Success and adulation intoxicate the top brass. Arrogance sets in. The company loses sight of the factors which made it successful in the first place.
Stage 2 – Unbridled expansion: In search of more growth and more adulation, management begins an expansion drive, often inorganic. The firm ’overreaches‘ into new geographies and product lines where it has no real experience or expertise. Sub-par capital allocation begins.
Stage 3 – Stuck in a rut: Often, cost discipline and/or product excellence erode and prices are then increased. Profits, return multiples and valuation multiples start sliding. Company politics thrives. The leader becomes increasingly autocratic and announces 'recovery plans' that are not based on accumulated experience.
Stage 4 – Grasping for solutions: The company thrashes around and looks for a solution even as profits and financial strength continue to slide. Senior management jobs are on the line. Often a new leader comes in and sometimes he tries to fire silver bullets (e.g., a 'transformative' acquisition, a blockbuster product, a cultural revolution, etc.). However, a new leader (ideally someone from inside) who takes a long, hard look at the facts and then acts calmly to put in place a measured recovery strategy with sensible use of cash and capital at its centre could be the saviour.
Stage 5a – Capitulation: The firm is sold or fades into insignificance or, and this happens rarely, shuts down.
Or Stage 5b – Recovery: The firm turns the corner and begins the long, slow climb to recovery.
Tata Steel is a good example of how the above process works.
1 https://www.youtube.com/watch?v=iEgu6p_frmE
The biggest reason for this failure is complacency at the promoter level
Our 2013 report had a 5-step chronology, marking a great company’s slide to mediocrity

Strategy
March 23, 2016 Ambit Capital Pvt. Ltd. Page 11
Exhibit 8: The five-stage framework
Source: Ambit Capital research, From the book ’How the Mighty Fall’.
Exhibit 9: Tata Steel's journey through the five stages Stage Remarks
Hubris and arrogance Superb financial performance through FY01-05
(FY01-05) Feted as the lowest-cost steel producer globally by World Steel Dynamics
Won the Deming prize
Company started believing it had insulated itself from steel price cycles
Unbridled expansion Evaluates alternative businesses to enter, including telecom, BPO, etc.
(FY06-08) Bids for Corus in 2006 and completes the acquisition in 2007 after a bidding war with CSN
Corus acquisition was at a value of US$12bn when the company’s net worth was US$2bn
Corus did not measure up to the criteria that the company had enunciated in its annual reports for growth/acquisition
Stuck in a rut After initial strong performance, Corus goes into the red
(FY09 - present) Domestic expansion plans get delayed
Company saddled with huge debt
Downturn in global steel cycle exacerbates the situation
Grasping for solutions Restructuring at Corus by mothballing capacities and disposing assets
(FY09 - present) Debt refinancing and equity raising
Enhances raw material security
Change of leadership at Corus
Capitulation or Recovery? Write-down of goodwill - acknowledgement that the acquisition is not working
(FY09 - present) Plans to sell off underperforming and inefficient assets of Corus
Accelerates expansion plans in India to improve the competitive structure of the entire company
Source: Company, Ambit Capital research
Later in this section, we look at a case study comparing Tata Steel and JSW Steel (a cyclical company that has remained in the top half over the past decade).
Corporate failure is ubiquitous
Clearly, different businesses fall apart for different reasons and these reasons are so varied that it is difficult to establish a neat categorisation or taxonomy. Moreover, most businesses in India struggle – evident from the fact that over the past 20 years, 75% of Indian stocks have delivered returns lower than the rate of inflation. Hence studying failure is a never ending task because the vast majority of Indian businesses have ‘failed’ insofar as the failed to even protect the value of shareholders’ money. Since our 2013 report (“Why do great Indian companies self-destruct?”; click here) we have found several of investors to be just as interested in understanding corporate failure better as they are in understanding the drivers of greatness. This prompted us to revisit our 2013 work on this complex topic.
Vast majority of Indian businesses have ‘failed’ insofar as they can’t even protect the value of their shareholders’ money

Strategy
March 23, 2016 Ambit Capital Pvt. Ltd. Page 12
Complacency, not arrogance, is the key culprit
We posit that the main source of greatness lost is staying still as the world changes, i.e., great companies lose their greatness not so much because they have a mighty fall but because they remain at a standstill in a changing world. To use an analogy from driving, great companies’ fall from grace is due to their falling asleep at the wheel and then crashing into the sidings as the road bends.
Exhibit 10: The list of bottom-slider companies
Slid to the bottom half (FY05 to FY15) FY05-15
Share price CAGR
FY05-15 EPS CAGR
FY05-15 cum. CFO /
cum. EBITDA
FY05-15 ROCE
change
Secular companies
1 Hero MotoCorp 14% 11% 96% -26%
2 Jubilant Life 7% N/A 86% -18%
3 M & M 21% 13% 29% -9%
4 GSK Pharma 14% 6% 100% -20%
5 SKF India 19% 12% 94% -10%
6 Asahi India Glass 9% -9% 87% -3%
7 Bajaj Hindusthan -19% N/A 52% -27%
Cyclical companies
1 Tata Steel -2% N/A 102% -56%
2 Gujarat NRE Coke -20% N/A 6% N/A
3 Vedanta 8% N/A 96% -102%
4 Bharat Electronics 18% 10% 88% -30%
5 Siemens 19% 13% 87% -33%
6 Thermax 18% 12% 97% -8%
7 BEML Ltd 4% -30% 40% -36%
8 ABB 14% 4% 70% -22%
9 JP Associates -10% N/A 66% -9%
10 BHEL 6% 4% 92% -21%
11 ACC 12% 11% 103% -4%
12 Hindustan Zinc 22% 29% 100% -15%
13 CPCL (Chennai Petroleum Corporation) -1% N/A 75% -30%
14 IOCL (Indian Oil) 6% -1% 49% -12%
15 Ambuja Cements 12% 10% 100% 0%
16 SAIL 0% -11% 87% -64%
Source: Bloomberg, Ace Equity, Ambit Capital Research. Note: 10-year share price CAGR computed from 31st Oct’05 to 30th Oct’15
Of the 23 names in the list shown above, none are over-aggressive except Tata Steel, which did an oversized acquisition. The 5-step Jim Collins framework does not appear to apply to them. So why did they fail? We believe that complacency lies at the heart of this failure, as follows:
1. Complacency to competition: One way to identify this complacency is when a company becomes used to staying at #1 and ignores competition catching up and eventually overtaking it. M&M stands out on this front given that it missed the shift in trend towards compact, urban sports utility vehicles (SUVs) – a market that was eventually captured by Ford’s Ecosport and Renault’s Duster. When M&M acquired Ssangyong Motors in 2010, Pawan Goenka, Executive Director M&M justified it, saying2, “There is an opportunity to introduce a premium portfolio of SUVs in the Indian market, providing a new growth avenue for SsangYong and further strengthen our dominant position in the UV segment.” After four years, when this premium SUV market failed to materialise, Mr. Goenka had this to say
2 http://www.business-standard.com/article/companies/mahindra-buys-70-in-ssangyong-110112400046_1.html
The main source of greatness lost is staying still as the world changes
M&M missed out on the shift in trend towards compact SUVs

Strategy
March 23, 2016 Ambit Capital Pvt. Ltd. Page 13
in a 2014 press interview3 when asked if M&M failed to spot the market preference for compact SUVs: “We didn’t miss the trend but we delayed it by about a year. We would have been more comfortable if new products had been launched this year rather than the next. The change or impetus for compact SUVs happened a year sooner than we thought. That’s the way I would put it.”
2. Complacency to the business environment: Changes in macro-environment – such as a slowdown in economic growth, collapse in commodity cycles – are difficult to predict. However, when such an event does occur, a complacent management does not react in time and by the time it does, it is too late. The smarter management teams ensure that their balance sheets are prepared to absorb these shocks. Tata Steel stands out as an example of excesses done during the peak of the cycle, like the acquisition of Corus, which landed them in trouble when the commodity cycle turned. As we wrote in our June 2013 thematic report (click here), “Why do great Indian companies self-destruct?”:
Leaving aside the acquisition price for Corus and leaving aside the recession that the world economy entered after September 2008, Tata Steel simply did not have the management bandwidth to run an ailing European steel manufacturer. While the intentions were noble, the organisation was completely unprepared. Instead of improving communication channels with the leadership team across units, insiders said Dr. Karl Köhler (Managing Director and CEO, Tata Steel Europe) surrounded himself with ‘yes men’. An executive from Tata Steel Europe, who declined to be named, said Köhler surrounded himself with former colleagues from ThyssenKrupp: “There is no British executive in the top management.” Thus, this was the first really large deal for a company; its earlier biggest challenge was operational in nature and internally focused – restructuring and modernisation. To top everything, the global financial crisis came soon after and demand in Europe is yet to recover to its pre-crisis levels.
3. Complacency to capital allocation: This happens when companies throw good money after bad and bet the balance sheet on ill-thought-out plans. Once again, M&M stands out for its forays into two-wheelers and trucks. While these ventures had no impact on their balance sheet, it is revealing that management chose to use acquisitions to foray into highly competitive sectors with little chance of meaningful success. M&M is also no stranger to global ambitions considering: a) it bid for European tractor maker Valtra in 2003 and was interested in bidding for JLR in 2007; b) acquired majority stakes in Korea’s Ssangyong Motors for US$463m in 2011and Italy’s Pininfarina for €25m in 2015. The Ssangyong acquisition took its toll on M&M’s financials even as it missed the compact SUV segment. As seen in the exhibit below, capital employed in M&M’s automotive segment shot up in FY11 and RoCE fell due to the acquisition. M&M’s 10% RoCE in FY15 is a far cry from peak levels in FY05.
3 http://www.thehindu.com/business/Industry/every-industry-has-to-innovate-disruptions-pawan-goenka/article6158306.ece
Tata Steel’s Corus acquisition stretched its balance sheet inordinately
M&M’s investments in trucks and two-wheelers had little impact on its overall profitability

Strategy
March 23, 2016 Ambit Capital Pvt. Ltd. Page 14
Exhibit 11: Investment in Ssangyong and loss of share in UVs have hit M&M’s automotive business RoCE
Source: Company, Ambit Capital research
We now delve into detailed case studies that highlight these issues. In all of them, we compare a bottom slider company with a top half company (i.e., one that stayed in the top half of our Greatness Framework over a 10-year period). The exhibit below lists these companies and their key financials and reasons for difference in performance over the last decade.
Exhibit 12: Key financials and differences between the four case study companies Case study company
FY05-15 Share price
CAGR
FY05-15 EPS CAGR
FY05-15 cum. CFO/
cum. EBITDA
FY05-15 ROCE
change Key differences
Tata Steel -2% N/A 102% -56% Acquired Corus putting balance sheet at risk
JSW Steel 16% 1% 80% -19% Focused on cost efficiencies in Indian operations
M & M 21% 13% 29% -9% Missed shift towards compact SUVs, invested outside UVs, tractors
Tata Motors 16% 19% 102% -13% Focused and filled product gaps in JLR portfolio, raised presence in China
IOCL (Indian Oil) 6% -1% 49% -12% Bureaucratic functioning has slowed network efficiencies compared to BPCL
BPCL 17% 10% 106% -6% Used branding initiatives, invested in upstream assets and gas ventures
GSK Pharma 14% 6% 100% -20% Impacted by drug price control order
Sun Pharma 32% 26% 80% 3% Turned around acquired companies effectively without impacting profitability
Source: Bloomberg, Ace Equity, Ambit Capital Research Note: 10-year share price CAGR computed from 31st Oct’05 to 30th Oct’15
0%
10%
20%
30%
40%
50%
60%
FY07 FY08 FY09 FY10 FY11` FY12 FY13 FY14 FY15
Share of automotive business in M&M's total capital employed
Average RoCE of automotive business

Strategy
March 23, 2016 Ambit Capital Pvt. Ltd. Page 15
Case Study 1: Tata Steel (bottom slider) vs JSW Steel (top half) Parita Ashar, CFA, [email protected], +91 22 3043 3223
Background: Tata Steel began operations in 1907 at its steel plant in Jamshedpur, which it developed into an industrial city. The plant was Asia's first integrated steel mill since Tata Steel had captive iron ore and coal mines near the factory. In 2004, Tata Steel acquired NatSteel Singapore, and in 2005, it acquired Millennium Steel Thailand. In 2008, Tata Steel acquired Corus for US$12bn – the largest acquisition by an Indian company. Currently, Tata Steel also has one new greenfield project underway in Odisha. JSW Steel is the flagship company of the Sajjan Jindal Group. The Jindals set up Jindal Iron & Steel Company in 1982, which was eventually merged with Jindal Vijaynagar Steel in 2005 to form JSW Steel. In Dec 2010, JSW Steel acquired Ispat Industries. Starting off as cold-rolled mill near Mumbai in 1982, JSW Steel now has six manufacturing locations in India (four in Maharashtra and one each in Karnataka and Tamil Nadu). As of end-FY15, JSW Steel had capacity of 14.3mt in India, compared to Tata Steel's 9.7mt. On a consolidated global level, however, Tata Steel is much larger with total capacity of ~30mt.
JSW Steel’s ability to stay in the top half of our Greatness Framework from FY05 to FY15 can be attributed to Sajjan Jindal’s reputation as a turnaround specialist. JSW Steel emerged successfully from a Corporate Debt Restructuring (CDR) scheme with IDBI Bank in the early 2000s. From there, JSW Steel acquired two debt-laden, ailing companies (Southern Iron and Steel Company in 2002 and Ispat Industries in 2010) and turned both of them around. In comparison, Tata Steel was likely a victim of its own ambitions of becoming a global steel superpower by acquiring Corus. Following the acquisition, Tata Steel struggled with integration issues since it simply did not have enough management bandwidth to run an ailing European steel manufacturer. More recently, while both companies have been hit by the slump in iron ore and steel prices (which began in 2011), JSW Steel has been better off due to its well-known cost-efficient operations in India, while Tata Steel has borne the brunt of the Corus acquisition.
We provide a snapshot comparison of the companies in the exhibit below:
Exhibit 13: Tata Steel vs JSW Steel Financial information (FY15) Tata Steel JSW Steel
Consolidated Sales (`bn) 1,395 530
Consolidated PAT (̀ bn) (3.3) 18
Pre-tax ROCE (%) 6.1% 10.3%
Total Assets (`bn) 1,214 590
Market cap (`bn) 291 290
FY05-15 stock price CAGR 3.2% 16.3%
Other information Number of subsidiaries 287 45
Peak ROCE between FY05-15 FY05: 61.6% FY05: 29.1%
Lowest ROCE between FY05-15 FY15: 6.1% FY09: 10.2%
Source: Company, Bloomberg, Ambit Capital research
JSW Steel has focused on cost efficiencies in its India operations, whereas Tata Steel’s global ambitions have weighed on stock price performance

Strategy
March 23, 2016 Ambit Capital Pvt. Ltd. Page 16
Exhibit 14: Tata Steel vs JSW Steel - stock price comparison
Source: Bloomberg, Ambit Capital research. Note: In the above chart, prices are indexed to 100 from 1st Jan 2004
Complacency to competition: Within India, JSW Steel’s rapid expansion has put it ahead of Tata Steel. Tata Steel’s balance sheet was stretched due to the Corus acquisition, which is likely to have resulted in the company going slow in the Indian market, allowing JSW Steel to race past. While Tata Steel did have global ambitions with the Corus acquisition, it does not feature in the Top 10 steel producers4 of the world. ArcelorMittal is the #1 player with production of 98mt in 2014, while Tata Steel comes in at #11 with 26mt.
Exhibit 15: Market share – JSW Steel has overtaken Tata Steel in India
Source: Company, Ambit Capital research
Complacency to business environment: Between the two, JSW Steel has remained focused on its Indian operations while Tata Steel has gone global. The Indian business environment for the steel industry has remained less volatile. The key factor, however, is how both companies handled the global business environment. Tata Steel’s acquisition of Corus raised a few issues. Corus did not have raw material security and would not be able to leverage on the low-cost production base in India. The Corus acquisition was not consistent with the company’s stated vision, as seen in the Management Discussion and Analysis (MDA) of its FY05 annual report: "In the near term, the industry cost structure is likely to remain high due to shortage of coking coal and iron ore. These structural deficiencies in the steel value chain are unlikely to be resolved in the near future... the company believes that the maximum value can be created by making semi-finished products (slabs/ billets) at locations where raw
4 https://www.worldsteel.org/statistics/top-producers.html
50
150
250
350
450
550
650
Jan-
04
May
-04
Sep-
04
Jan-
05M
ay-0
5
Sep-
05
Jan-
06M
ay-0
6Se
p-06
Jan-
07M
ay-0
7
Sep-
07
Jan-
08M
ay-0
8
Sep-
08Ja
n-09
May
-09
Sep-
09
Jan-
10M
ay-1
0
Sep-
10Ja
n-11
May
-11
Sep-
11
Jan-
12M
ay-1
2
Sep-
12
Jan-
13M
ay-1
3Se
p-13
Jan-
14M
ay-1
4
Sep-
14
Jan-
15M
ay-1
5Se
p-15
Jan-
16
Tata Steel
Sensex
JSW Steel
Tata Steel: Rising commodity demand and prices coupled with low cost of raw materials drive unbridled expansion
Tata Steel: 2009 demand meltdown sharply hits European profitability
Tata Steel: Declining commodity prices work adversely for an integrated player as domestic margins shrink; European margins never recovered, whereas acquisition debt burdened the balance sheet
02468
10121416
FY05 FY06 FY07 FY08 FY09 FY10 FY11 FY12 FY13 FY14 FY15
Tata Steel JSW Steel
Market share (%)
Within India, JSW Steel overtook Tata Steel as India’s largest steel player in the past decade
The Corus acquisition was not consistent with Tata Steel’s stated vision

Strategy
March 23, 2016 Ambit Capital Pvt. Ltd. Page 17
materials are available (or can be competitively assembled), and by finishing them at locations where customers/ markets currently exists or will grow in future."
The acquisition could have partly been driven by the then prevalent wisdom in the steel sector about consolidation, with Mittal Steel (LNM Group) showing the path. But LNM was consistently following the strategy of having primary manufacturing in countries which had cheap energy or availability of raw material or both. The other reason, and the less flattering one, could be that Tata Steel was driven by hubris into making a large acquisition to match the chairman’s vision of taking the group global. In Corus, Tata Steel saw the chance to become one of the largest steel producers in the world. In its FY07 annual report, Chairman Ratan Tata wrote to shareholders: "Undoubtedly the most notable event during the year was the company's public offer to acquire 100% of the shares of Corus group plc... the acquisition of Corus has transformed Tata Steel from a domestic producer to an international steel company with global scale."
Compare this with Sajjan Jindal's statement in the corresponding FY07 annual report for JSW Steel: "The company has adopted a dual strategy. One, expanding crude steel capacity significantly, with a multi-locational presence to capitalise on the India advantage. Two, evaluating inorganic opportunities for value-added facilities in the developed economies. With this intent, we have created a subsidiary and signed a share purchase agreement to take over a Service Center in UK with a proposed investment of £3.75million.
Complacency to capital allocation: With captive iron ore mines, Tata Steel had a natural advantage over JSW Steel. Although Tata Steel and JSW Steel’s cost heads are not strictly comparable as Tata Steel records expenses on iron ore royalty, employee expenses of the mining division, etc. in other expenses whereas for JSW Steel, these form are likely to form a part of their raw material costs, there still exists a wide difference between overhead and other costs for both the companies. As the exhibit below shows, JSW Steel has an edge on other costs such as power and fuel, employee and overhead costs (due to strong focus on efficiency and conversion costs). To be fair to Tata Steel, its overheads are also high because it maintains an industrial city off its books. However, the recent collapse in iron ore prices has significantly eroded Tata Steel’s raw material integration benefits. We also highlight that in FY12 (when both companies had added brownfield capacities), JSW Steel’s capex costs, at US$545/tonne, were less than half those of Tata Steel (US$1,116/tonne), primarily due to contribution from in house staff and efficient spends by JSW Steel.
Exhibit 16: Tata Steel has lower raw material costs…
Source: Company, Ambit Capital Research
Exhibit 17: …but JSW Steel has lower overhead costs
Source: Company, Ambit Capital Research. Note: in the above chart, overheads include employee costs, power and fuel and other costs.
-
5,000
10,000
15,000
20,000
25,000
30,000
FY05
FY06
FY07
FY08
FY09
FY10
FY11
FY12
FY13
FY14
FY15
Tata Steel JSW Steel
`/tonne
-
5,000
10,000
15,000
20,000
25,000
FY05
FY06
FY07
FY08
FY09
FY10
FY11
FY12
FY13
FY14
FY15
Tata Steel JSW Steel
`/tonne
JSW Steel has an edge over Tata Steel on overhead costs

Strategy
March 23, 2016 Ambit Capital Pvt. Ltd. Page 18
Both companies have seen their RoCE shrink significantly in the past decade, as can be seen in the exhibit below. However, JSW Steel has remained in the top half of our greatness filter, while Tata Steel has slipped to the bottom half. We highlight that this is mainly because JSW Steel performs better on our Greatness Framework filters such as Gross Block, Net Sales and FA turnover & CFO, whereas Tata Steel performs badly on most of these parameters, mainly due to Corus’s high cost of operations.
Exhibit 18: RoCE of both companies has come off sharply from peaks
Source: Company, Ambit Capital research.
0%
10%
20%
30%
40%
50%
FY05
FY06
FY07
FY08
FY09
FY10
FY11
FY12
FY13
FY14
Tata Steel JSW Steel
Tata Steel's RoCEs were higher as its raw material integration benefited the company in a bullish commodity price environment
Tata Steel's RoCE's decline sharply due to European acquisition
Muted RoCEs for JSW Steel as well as Tata Steel as falling iron ore prices gradually wipe off Tata Steel's raw material integration benefits

Strategy
March 23, 2016 Ambit Capital Pvt. Ltd. Page 19
Case Study 2: M&M (bottom slider) vs Tata Motors (top half) Ashvin Shetty, CFA, [email protected], +91 22 3043 3285
Background: M&M is India’s largest manufacturer of utility vehicles (UVs) and tractors. Tata Motors is India’s largest manufacturer of commercial vehicles, the fourth-largest in cars and the eighth-largest in utility vehicles. Following its 2008 acquisition of Jaguar-Land Rover (JLR) for US$2.3bn, Tata Motors is also an international major in the luxury passenger cars. Both companies are among India’s oldest and largest automobile companies with multiple subsidiaries and joint ventures. Both companies are known for the professional management that runs their major divisions. The main reason why Tata Motors has stayed in the top half of great companies is its success in making the high-priced JLR acquisition work in its favor even as it retained its dominance in the Indian truck industry. M&M, on the other hand, has seen its dominance of the UV industry decline, while its multiple ventures in other auto-related areas haven’t had meaningful impact. We note that on a 10-yr basis M&M’s stock price has outperformed Tata Motors stock price. However, we believe that the JLR acquisition was a major turning point for Tata Motors. Consequently, from Jan 2009 onwards –just after the JLR acquisition in late 2008 –Tata Motors’ stock price (60% CAGR from Jan 2009 to March 2015) has beaten M&M's stock price (39% CAGR), as can be seen in Exhibit 20.
We provide a snapshot comparison of the companies in the exhibit below:
Exhibit 19: A comparative snapshot of M&M and Tata Motors
M&M Tata Motors
Financial Information (FY15) Consolidated Sales (`bn) 719,486 2,627,963
Consolidated PAT (̀ bn) 23,178 141,710
ROCE (%) 12.6% 15.8%
Total Assets (`bn) 704,791 1,289,156
Market cap (`bn) 744 1,176
FY05-15 stock price CAGR 25% 21%
Other information Major Divisions Automotive, Farm Equipment Domestic CVs, PVs and
global luxury cars Number of subsidiaries 113 76
Non-auto businesses IT, Holidays, real estate, etc. None
Peak ROCE between FY05-15 FY10: 27% FY12: 33%
Lowest ROCE between FY05-15 FY15: 13% FY09: -3%
Source: Ambit Capital research, Bloomberg. Note: RoCE is pre-tax.
While Tata Motors has turned around JLR, M&M missed out on the shift to compact SUVs
Strategy
March 23, 2016 Ambit Capital Pvt. Ltd. Page 20
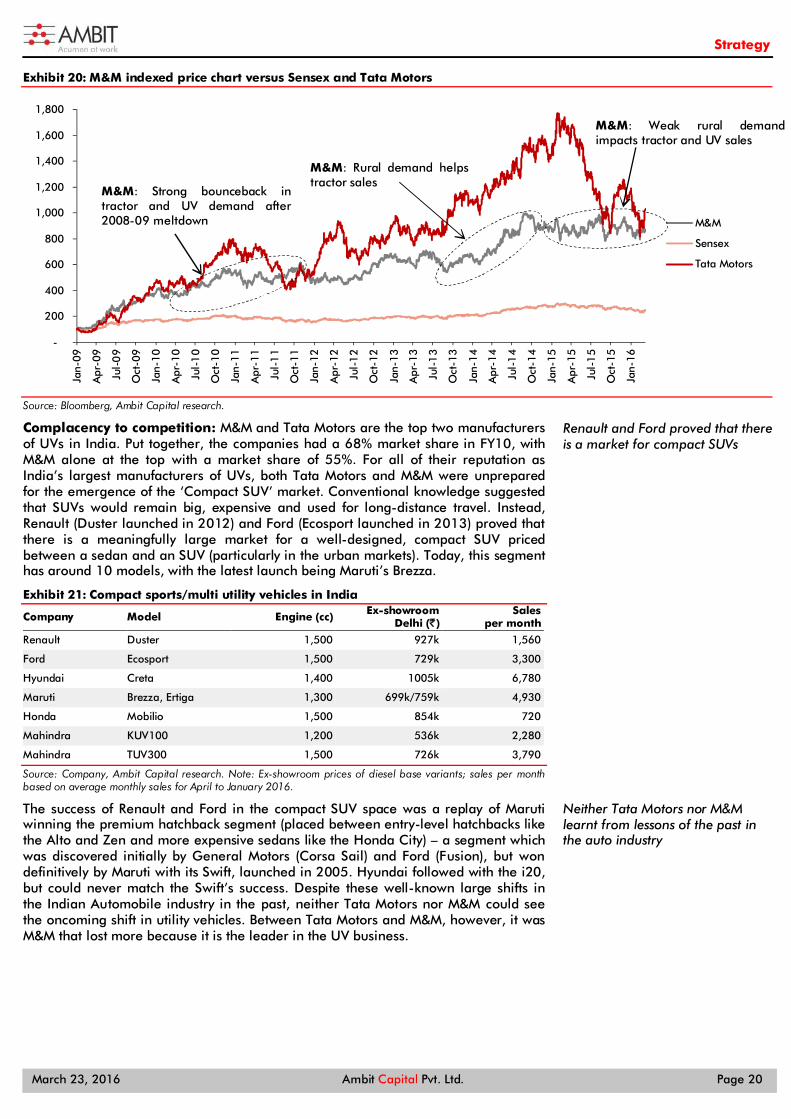
Exhibit 20: M&M indexed price chart versus Sensex and Tata Motors
Source: Bloomberg, Ambit Capital research.
Complacency to competition: M&M and Tata Motors are the top two manufacturers of UVs in India. Put together, the companies had a 68% market share in FY10, with M&M alone at the top with a market share of 55%. For all of their reputation as India’s largest manufacturers of UVs, both Tata Motors and M&M were unprepared for the emergence of the ‘Compact SUV’ market. Conventional knowledge suggested that SUVs would remain big, expensive and used for long-distance travel. Instead, Renault (Duster launched in 2012) and Ford (Ecosport launched in 2013) proved that there is a meaningfully large market for a well-designed, compact SUV priced between a sedan and an SUV (particularly in the urban markets). Today, this segment has around 10 models, with the latest launch being Maruti’s Brezza.
Exhibit 21: Compact sports/multi utility vehicles in India
Company Model Engine (cc) Ex-showroom Delhi (`)
Sales per month
Renault Duster 1,500 927k 1,560
Ford Ecosport 1,500 729k 3,300
Hyundai Creta 1,400 1005k 6,780
Maruti Brezza, Ertiga 1,300 699k/759k 4,930
Honda Mobilio 1,500 854k 720
Mahindra KUV100 1,200 536k 2,280
Mahindra TUV300 1,500 726k 3,790
Source: Company, Ambit Capital research. Note: Ex-showroom prices of diesel base variants; sales per month based on average monthly sales for April to January 2016.
The success of Renault and Ford in the compact SUV space was a replay of Maruti winning the premium hatchback segment (placed between entry-level hatchbacks like the Alto and Zen and more expensive sedans like the Honda City) – a segment which was discovered initially by General Motors (Corsa Sail) and Ford (Fusion), but won definitively by Maruti with its Swift, launched in 2005. Hyundai followed with the i20, but could never match the Swift’s success. Despite these well-known large shifts in the Indian Automobile industry in the past, neither Tata Motors nor M&M could see the oncoming shift in utility vehicles. Between Tata Motors and M&M, however, it was M&M that lost more because it is the leader in the UV business.
-
200
400
600
800
1,000
1,200
1,400
1,600
1,800
Jan-
09
Apr
-09
Jul-
09
Oct
-09
Jan-
10
Apr
-10
Jul-
10
Oct
-10
Jan-
11
Apr
-11
Jul-
11
Oct
-11
Jan-
12
Apr
-12
Jul-
12
Oct
-12
Jan-
13
Apr
-13
Jul-
13
Oct
-13
Jan-
14
Apr
-14
Jul-
14
Oct
-14
Jan-
15
Apr
-15
Jul-
15
Oct
-15
Jan-
16
M&M
Sensex
Tata Motors
Renault and Ford proved that there is a market for compact SUVs
Neither Tata Motors nor M&M learnt from lessons of the past in the auto industry
M&M: Strong bounceback in tractor and UV demand after 2008-09 meltdown
M&M: Rural demand helps tractor sales
M&M: Weak rural demand impacts tractor and UV sales

Strategy
March 23, 2016 Ambit Capital Pvt. Ltd. Page 21
Exhibit 22: M&M's falling share in UVs
Source: Company, Ambit Capital research.
For Tata Motors, focus had shifted to the international business, where – to be fair – it is doing a far better job of reading the changing market. For example, Tata Motors’ JLR has plugged product gaps with the launch of the Range Rover Evoque and Jaguar XE. JLR has also been successful in China, where it has raised sales to 25% of JLR volumes in FY15 from 9.7% in FY10.
Exhibit 23: China has contributed significantly to JLR’s volume growth
Source: Company, Ambit Capital research
Complacency to business environment: Despite its various branding exercises and the success of subsidiaries (Tech Mahindra, Mahindra Holidays), M&M continues to be perceived as a 'rural' brand. This is because of its dominance in tractors and the success of its rural UVs like Bolero and Scorpio. With rural, diesel-run engines, M&M missed the shift towards petrol-run, urban SUVs. M&M's tie-up with SsangYong Motors (Korea) didn't help since SsangYong's models were expensive. Neither Renault nor Ford has a large market share in the passenger car segment and yet both beat M&M to the urban, compact SUV market.
In comparison, Tata Motors has retained its dominance of the commercial vehicle (CV) industry in India (CVs, including LCVs, account for ~75% of Tata Motor’s India revenues). It has kept pace with shifts in tonnage in the medium and heavy commercial vehicle (M&HCV) segment and led the change in the light commercial vehicle (LCV) segment. In the past, with the launch of the Ace in May 2005, Tata Motors took the sub-1 tonne market away from three-wheelers. In the car segment, Tata Motors has seen more success in the international markets (Evoque and Jaguar XE) than in the domestic segment.
30%
35%
40%
45%
50%
55%
60%
FY05 FY06 FY07 FY08 FY09 FY10 FY11 FY12 FY13 FY14 FY15
M&M's share in utility vehicles (UVs)
4.7%
9.7%11.3%
17.3%
21.4%24.2% 25.4%
0.0%
5.0%
10.0%
15.0%
20.0%
25.0%
30.0%
0
20,000
40,000
60,000
80,000
100,000
120,000
140,000
FY09 FY10 FY11 FY12 FY13 FY14 FY15
China vols (nos) - LHS China as % of total JLR
M&M’s perception as a rural brand likely made an impact on its urban market share

Strategy
March 23, 2016 Ambit Capital Pvt. Ltd. Page 22
Complacency to capital allocation: Both M&M and Tata Motors have had big ambitions and both have approached these ambitions differently. M&M has taken many small bets, while Tata Motors has taken one massive bet. Incidentally, M&M was also in the race to acquire JLR, but dropped out early.
M&M has always wanted to have a presence across the automobile industry. Thus, it ventured into highly competitive and heavily consolidated industries like commercial vehicles (top 3 players control 87% market share), cars (top 3 players control 73% market share) and two-wheelers (top 3 players control 79% market share). None of these ventures have really worked and eventually, M&M has exited from some of these, such as the car ventures with Ford and Renault and the truck venture with Navistar.
Exhibit 24: M&M's history of joint ventures Company Reason/purpose Year of JV Year of exit
Ford Ford escort car 1995 2005
Renault Logan car 2005 2010
Navistar Trucks 2005 2012
Navistar Engines 2007 2012
Jiangling Tractor Company of China Entry in China 2005 Jiangsu Yueda Yancheng Tractor Manufacturing Co. Ltd
Consolidate its position in China 2009
BAE Systems Plc Defence land systems products 2010
Source: Ambit Capital research, Company
M&M is also the holding company for its myriad investments in businesses as diverse as Information Technology and holiday packages. As a result, M&M’s investment in its subsidiaries/associates accounted for a whopping 45% of its standalone + MVML assets and about 43% of market cap.
Exhibit 25: M&M subsidiary details
Name of entity FY15 book value (̀ mn) as % of net
worth (SA + MVML) Equity Preference L&As Total
Subsidiaries Mahindra Two Wheelers 18,621 - - 18,621 9.4%
Mahindra Navistar 5,134 - - 5,134 2.6%
Mahindra Engine & Chemical 4,368 - - 4,368 2.2%
Ssangyong 21,339 - - 21,339 10.7%
Bristlecone Ltd 193 469 1,134 1,795 0.9% Mahindra Overseas Investments (Mauritius) 5,058 - 769 5,826 2.9%
Mahindra Reva Electric Vehicles 3,802 - - 3,802 1.9%
Mahindra Aerospace 2,899 50 - 2,949 1.5%
Mahindra Lifespace Developers 2,769 - - 2,769 1.4% Mahindra & Mahindra Financial Services 1,509 - - 1,509 0.8%
Mahindra Sanyo Special Steel 2,143 - - 2,143 1.1%
Others 8,581 - 87 8,668 4.4%
Associates Tech Mahindra 10,040 - - 10,040 5.1%
Mahindra CIE 5,315 - - 5,315 2.7%
Others 35 54 - 89 0.0%
Other companies 157 181 - 338 0.2% Provision for diminution in value of investments (4,325) - - (4,325) -2.2%
Total 87,639 753 1,989 90,381 45.5%
Source: Company, Ambit Capital Research.
M&M has taken many small bets, while Tata Motors has taken one massive bet
M&M has a history of forming and exiting JVs

Strategy
March 23, 2016 Ambit Capital Pvt. Ltd. Page 23
Tata Motors has also had its fair share of ambitious, expensive forays. Its investment and persistence in passenger cars in India, beginning with the Indica in the 1990s until the Nano in 2008, have not worked in dislodging Maruti as the leader. Tata Motors’ international bet, on the other hand, has worked much better. Admittedly, the JLR acquisition was too large – the price tag of US$2.3bn was equal to its shareholder equity in FY08. However, in the eight years since, Tata Motors has worked hard at making this large acquisition work in its favour. JLR revenues have registered a 28% CAGR and profits have improved to GBP2.0bn in FY15 (vs loss of GBP0.4bn in FY09). In 9MFY16, JLR’s profits were `90bn vs consolidated profits of `85.7bn. Investors have ascribed an exponentially higher value to Tata Motors’ international business compared to its more cyclical, trucks-led Indian business – thus proving, with the huge benefit of hindsight, that the JLR acquisition was worth it.
Exhibit 26: Fall in UV sales has hit M&M’s consolidated RoCE
Source: Company, Ambit Capital Research
3.0
3.5
4.0
4.5
5.0
5.5
6.0
6.5
0%
10%
20%
30%
40%
50%
60%
70%
FY05
FY06
FY07
FY08
FY09
FY10
FY11
FY12
FY13
FY14
FY15
Capital employed turnover (x) RoCE (post-tax)
Despite persistent investment in cars, Tata Motors has not dislodged Maruti as #1
Weak UV sales, increase in input costs, commodity pricing pressure impacts margins
RoCE expansion led by strong margin expansion in both tractor & UV segment
Strong UV & tractor sales offset by lower margin (commodity price increase)
Market share loss in UV; slowdown in tractor sales

Strategy
March 23, 2016 Ambit Capital Pvt. Ltd. Page 24
Case Study 3: Indian Oil Corporation (IOC; bottom slider) vs Bharat Petroleum Corporation (BPCL; top half) Ritesh Gupta, CFA, [email protected], +91 22 3043 3242
Background: Formed in 1959, Indian Oil Corporation (IOC) is India's largest oil refining and marketing company. IOC has nearly 50% market share of sale of petroleum products and 35% share of refining capacity. It owns and operates 11 of India's 23 refineries with combined refining capacity of 80.7MMTPA. Bharat Petroleum Corporation Limited (BPCL) was formed when the Indian Government nationalised Burmah-Shell Refineries in 1976. BPCL has a 21% market share in petroleum products and a 14% share of refining capacity. BPCL owns four refineries with total refining capacity of 30.5mtpa. The key difference between IOC and BPCL lies in their legacy – IOC was formed by the Indian Government to be the country’s 'national oil company', while BPCL was taken over in 1976 from multinational, Mumbai-based, Burmah-Shell (then a consortium between Royal Dutch, Shell and Rothschild). While both companies are run professionally today, BPCL started off as an MNC that was nationalised. As a result, between the two, BPCL was better at focusing on customers and had a stronger internal architecture (for example, delegation of authority).
We provide a snapshot comparison of the companies in the exhibit below:
Exhibit 27: A comparative snapshot of IOC and BPCL Financial Information (FY15) IOC BPCL
Consolidated sales (`bn) 4,501 2,426
Consolidated PAT (̀ bn) 49 48
ROCE (%) 4% 12%
Total assets (`bn) 1,313 481
Market cap (`bn) 925 582
FY05-15 stock price CAGR 5% 16%
Other information Major divisions Refining and Marketing Refining , marketing and E&P
Number of subsidiaries 9 7
Non-OMC businesses Petchem business, JV for nuclear power, Wind power, E&P
E&P, city gas distribution, Petchem expansion at Kochi
Peak ROCE between FY05-15 FY07: 13% FY05: 25%
Lowest ROCE between FY05-15 FY15: 4% FY09: 6%
Source: Company, Ambit Capital research
IOC was formed by the Indian Government to be India's 'national oil company', while BPCL was taken over in 1976 from multinational, Mumbai-based Burmah-Shell

Strategy
March 23, 2016 Ambit Capital Pvt. Ltd. Page 25
Exhibit 28: Stock price evolution for IOC vs BPCL
Source: Bloomberg, Ambit Capital research
Complacency to competition: IOC, BPCL and Hindustan Petroleum (HPCL) dominate the marketing of petroleum products in India. Their market shares have broadly been in the ratio of 46%, 29% and 26% respectively. While the sector was opened to competition, private players like Reliance and Essar have early single digit market share. Thus, oil refining and marketing remains a closed play between three state-run oil marketing companies (OMCs). BPCL has been more proactive than IOC and HPCL. For example, since 1997, BPCL has aggressive vision-based plans to provide direction. Project Cusecs, in 1997, focused on ‘customer service customer satisfaction’ and Project Destiny, in 2005, aimed at doubling turnover and quadrupling profits in the next five years. In comparison, Delhi-based IOC has been more bureaucratic, focusing on the Government’s larger objectives of expanding in rural areas, providing employment, etc. While all three OMCs have expanded their petrol pump network at a similar pace (see exhibit 29 below), BPCL has more pumps in higher-yielding urban areas (17% compared to IOC’s 9%).
Exhibit 29: Pump expansions by OMCs
Source: Company, Ambit Capital research.
IOC’s refineries are also smaller in capacity and located inland compared to BPCL’s larger refineries in coastal locations. As a result, IOC’s gross refining margins (GRMs) are more volatile than BPCL’s, but IOC also benefits from inventory gains when crude prices go up as it carries the highest inventory among the three OMCs.
0
100
200
300
400
500
600
Apr-05 Apr-06 Apr-07 Apr-08 Apr-09 Apr-10 Apr-11 Apr-12 Apr-13 Apr-14 Apr-15
IOC Brent BPCL
BPCL: Re-rating on the back of diesel deregulation
BPCL: Petrolderegulated in June 2010
IOCL: Strong GRM outlook and increasedmarketing margins
Brent: 2009 global meltdown led to crude crash beneficial for OMCs
Brent: High crude prices leading to higher under recoveries
BPCL: E&P discoveries drive valuations
BPCL: Crash in crude lead to E&P valuationsdecline
0
5,000
10,000
15,000
20,000
25,000
30,000
FY05
FY06
FY07
FY08
FY09
FY10
FY11
FY12
FY13
FY14
FY15
BPCL
HPCL
IOC
(Number of petrol pumps)
BPCL has been more proactive than IOC and HPCL in responding to competition
IOC’s gross refining margins (GRMs) are more volatile than those of BPCL

Strategy
March 23, 2016 Ambit Capital Pvt. Ltd. Page 26
Exhibit 30: IOC benefits from inventory gains; BPCL has less volatile GRMs
Source: Company, Ambit Capital research.
Complacency to business environment: The business environment for OMCs is tightly controlled by the Government, from subsidy sharing to expansion of marketing network and pricing of products. While subsidy on petrol and diesel was stopped in 2010 and 2014, it continues in LPG and kerosene. Within such an environment, BPCL has a better track record. When oil marketing was opened to competition in 2005, BPCL was already ready with unique branding initiatives. It was the first OMC that ran a branding campaign (Pure for Sure in early 2000s) and also the first to introduce a loyalty card (Petrocard which was, incidentally, a chip-based card as far back as 1999). At the petrol pump level, some of its customer-focused ideas include free health check-ups for the public (aimed at truck drivers who drive into the pump), with the health report being given only at the petrol pump.
Internally, too, BPCL has looked at ways to improve cost efficiencies (since revenues were determined by Government policies and crude prices). BPCL introduced computers as far back as 1981, bought its own VSAT network in 1999, and was the first OMC to arm its fuel tankers with GPS devices in 2008. By switching from SAIL to Tata Steel as suppliers for its LPG cylinders, BPCL saved `1.5bn in 2008. As a result of these efforts, BPCL is No. 2 in terms of volume market share (29%) despite having the lowest market share in terms of network (25%).
Exhibit 31: ‘Network efficiency’ of BPCL vs IOC (based on volume share/fuel pump share)
Source: Company
All those efforts speak of a culture in BPCL with a clear boundary between the company’s day-to-day operational performance and occasional interference from the Government. IOC is a Maharatna PSU and BPCL a Navratna PSU (i.e. one rung lower) and between the two, BPCL has done a better job than IOC at maintaining this boundary line.
0123456789
10
FY06 FY07 FY08 FY09 FY10 FY11 FY12 FY13 FY14 FY15
$/bbl
IOC
BPCL
1.10
1.02
1.10 1.12
1.17 1.13
1.17 1.14 1.15 1.14 1.14
0.92
0.86 0.87 0.89 0.91
0.94 0.96 0.96 0.95 0.95 0.95
0.80
0.85
0.90
0.95
1.00
1.05
1.10
1.15
1.20
FY05 FY06 FY07 FY08 FY09 FY10 FY11 FY12 FY13 FY14 FY15
BPCL IOC
BPCL has a better track record than IOC of branding and customer focus
BPCL has better network efficiency than IOC

Strategy
March 23, 2016 Ambit Capital Pvt. Ltd. Page 27
Complacency to capital allocation: Despite operating in a tight, regulated sector, BPCL’s capital allocation decisions have been superior to those of IOC. This is evident in RoCE trends in the backdrop of crude price movement (see exhibit below). Both companies saw a decline in ROCE as crude prices rose, but over the long term, lower fluctuation in GRMs has helped BPCL more than it did IOC.
Exhibit 32: RoCE trends – IOC vs BPCL
Source: Company, Ambit Capital research.
However, there are three key areas where BPCL has trumped IOC on the capital allocation front despite both companies being PSUs:
BPCL has been more aggressive in acquiring upstream assets (Bharat Petro Resources, which has 18 assets across 6 countries since it was incorporated in 2006). In comparison, IOC’s biggest upstream investment is its ownership in ONGC, which hasn’t yielded much;
BPCL built a cost-efficient refinery at Bina, Madhya Pradesh, in collaboration with Oman Oil in 2011. While IOC followed up with the Paradip Refinery, the benefits of this investment have yet to play out;
BPCL has made aggressive inroads in the gas sector with investments in Indraprastha Gas (22.5% stake) and Petronet LPG (12.5% stake); with these investments BPCL is better positioned than IOC to play India’s gas consumption story.
2%4%6%8%
10%12%14%16%18%
FY07
FY08
FY09
FY10
FY11
FY12
FY13
FY14
FY15
BPCL
IOCL
IOCL, BPCL: Rising underecoveries due to costlier brent bloated the capital emloyed
BPCL’s capital allocation decisions have been superior to that of IOC
BPCL’s investments in IGL and Petronet position it better than IOC to play the gas consumption story in India
IOCL generated higher GRMs, driven by inventory gains on the back of rising crude and reduced under recoveries due to petrol deregulation
Steadier GRMs for BPCL led to the RoCE growth, IOCL suffered due to higher inventory losses and investing in the Paradip refinery

Strategy
March 23, 2016 Ambit Capital Pvt. Ltd. Page 28
Case Study 4: GSK Pharma (bottom slider) vs Sun Pharma (top half) Paresh Dave, CFA, [email protected], +91 22 3043 3212
Background: GSK Pharma is among India’s oldest and largest MNC pharma companies and a subsidiary of GlaxoSmithKline UK. GSK Pharma is a leader in dermatology, vaccines and anti-parasitics. Its four largest selling products are Augmentin, Calpol, ZInetac and Eltroxin. In vaccines, GSK Pharma is the largest in India; its leading brands include Varilrix, Havrix, Rotarix, Synflorix, Cervarix and Infanrix. Sun Pharma was formed in 1983 and, from the 1990s to date, has made 19 acquisitions, the largest being Ranbaxy (US$4bn) in 2014 and Taro (~US$330mn) in 2010. Today, it is India’s largest pharma company and the fifth-largest specialty generics company in the world with the US accounting for ~50% of revenues. In India, Sun Pharma specialises in CNS, CVS, anti-infective and gastroenterology, and its main brands include Gemer, Pantocid and Susten. In the US, Sun Pharma leads in generic dermatology with a presence in anti-fungal medicines and steroids. Sun Pharma invests 6-7% of its total revenue in R&D with a primary focus on specialty generics. Apart from specialty projects, Sun is working on development of innovative projects like NCEs and NDDS (e.g., Tildrkizumab in collaboration with Merck).
While GSK Pharma is an MNC focused on India, Sun Pharma is an Indian company with a large global revenue base – to that extent, perhaps both aren’t comparable in the way we have discussed the other three case studies in this report. We highlight that the primary reason for GSK Pharma to feature in the bottom sliders (i.e., fall from the top quartile (Q1) of our greatness filter in FY05 to the bottom half in FY15; see Section 1) was deterioration in financials over FY13-FY15 following the impact of the drug price control order in May 2013. That led to deterioration on other greatness filters like improvement in net sales and PBIT margin relative to the universe median. In comparison, Sun Pharma has made its acquisitions work for it, sustaining strong financials and its position in the top half of our greatness filters over FY05-FY15.
We provide a snapshot comparison of the companies in the exhibit below:
Exhibit 33: GSK Pharma vs Sun Pharma - a snapshot GSK Pharma Sun Pharma
Financial information (FY15) Consolidated sales (`bn) 33,629 274,334
Consolidated PAT (̀ bn) 4,764 45,394
ROCE (%) 39 25
Total assets (`bn) 4,764 81,933
Market cap (`bn) 285 2000
FY05-15 stock price CAGR 15.6% 33.2%
Other information Major Products Augmentin, Calpol, ZInetac
and Eltroxin Gemer, Pantocid and
Susten Peak ROCE between FY05-15 FY05: 54% FY08: 36%
Lowest ROCE between FY05-15 FY10: 45% FY10: 19%
Source: Company, Bloomberg, Ambit Capital research

Strategy
March 23, 2016 Ambit Capital Pvt. Ltd. Page 29
Exhibit 34: GSK Pharma and Sun Pharma stock price evolution over FY05-15
Source: Bloomberg, Ambit Capital research
Complacency to competition: GSK Pharma has fared better than other MNC pharma companies (AstraZeneca, Merck, Pfizer and Sanofi) on this parameter. While other MNCs have held back new product launches, GSK Pharma kept launching products, including five patented ones from its parent, GSK UK. It has also committed to investing in a `10bn manufacturing facility in Karnataka. Thus, the parent company is fully committed to the listed entity and to the Indian market. Meanwhile, Sun Pharma scores over competition in India on better sales-force productivity, led by its strategy of efficiently using medical representatives.
Exhibit 35: Sun Pharma’s sales productivity has remained high
Source: Company, Ambit Capital research
In the US, Sun has identified complex and niche products dermatology and CNS, which face limited competition, and offers the flexibility to raise prices.
Exhibit 36: Expansion in EBITDA margin led by price increases and improvement in sales force efficiencies
Source: Company, Ambit Capital research
0
500
1000
1500
2000
2500
Jan-
05
Jun-
05
Nov
-05
Apr
-06
Sep-
06
Feb-
07
Jul-
07
Dec
-07
May
-08
Oct
-08
Mar
-09
Aug
-09
Jan-
10
Jun-
10
Nov
-10
Apr
-11
Sep-
11
Feb-
12
Jul-
12
Dec
-12
May
-13
Oct
-13
Mar
-14
Aug
-14
Jan-
15
Jun-
15
Nov
-15
10-year stock price movement
Sun Pharma
GSK Pharma
Sensex
GSK: Buyback of shares at 25% premium to CMP
GSK :Imrpovement in revenue growth to mid-double digit vs mid-single digit earlier led by new product laucnhes
GSK: NPPA has capped prices of Bethamethasone in which Glaxo has highers market share
3.8 4.15.0
6.0
7.5 7.4
9.2 9.5
7.4 7.8 7.5
0
2
4
6
8
10
12
FY05 FY06 FY07 FY08 FY09 FY10 FY11 FY12 FY13 FY14 FY15
Sales per MR (`/m)
36%31% 32%
47%45%
31%34%
41%44% 44% 42%
0%
10%
20%
30%
40%
50%
FY05 FY06 FY07 FY08 FY09 FY10 FY11 FY12 FY13 FY14 FY15

Strategy
March 23, 2016 Ambit Capital Pvt. Ltd. Page 30
Complacency to business environment: The profitability of highly successful companies often attracts regulatory/government intervention in India, which is also a challenge across sectors. Such regulatory/government intervention then drags down profitability and hence the share price performance of the champion company – in this case GSK Pharma, one of the most prominent MNC Pharma companies in India. The drug price control order (DPCO) issued by the Government in May 2013 was a long time coming. And yet, prior to this order, GSK Pharma showed an unwillingness to adjust its business to the impending regulatory change.
Thus, when the DPCO, which fixed a ceiling on 348 drugs in the National List of Essential Medicines (NLEM), was issued in May 2013, it caught GSK Pharma unaware. While all MNC pharma companies were hit by the order, GSK was affected the most – 30-35% of its revenue. Thus, GSK Pharma’s FY14 profits fell by 14% and RoCE declined to 36% from 42% in FY13. As can be seen in the exhibit below, MNC pharma companies have seen a structural decline in RoCE, but GSK Pharma has fared better than the rest.
Exhibit 37: MNC pharma margins have trended lower since FY11
Source: Company, Ambit Capital research.
Sun Pharma, on the other hand, has known issues with the US FDA. Its Karkhadi plant continues to be under import alert and Halol plant is also under a warning letter from the US FDA. We believe that Sun Pharma’s management is overoptimistic on the timeline for remediation for its Halol facility – evident from the fact that they have not yet shifted production to alternate facilities. We see risks if remediation doesn’t happen as per management timeline of 4Q16.
Complacency to capital allocation: GSK Pharma’s core business is highly cash generative. It has paid out cash from operations (CFO) as dividend and yet hoarded enough cash to build reserves, which provide investment income; clearly, dividend payout could be higher. The company has performed one buyback and its promoter holding is high, at 75%. By maintaining high dividend payouts, GSK Pharma is adopting a more transparent method of paying back promoters as compared to charging high royalties and compromising minority interest. Capex was a modest `10bn (Karnataka plant) and funded from internal reserves.
-20
-10
0
10
20
30
40
50
FY11 FY12 FY13 FY14 FY15
Astra
GSK
Merck
Pfizer
Sanofi
(%)

Strategy
March 23, 2016 Ambit Capital Pvt. Ltd. Page 31
Exhibit 38: CFO accounts for high chunk of capital raised from FY03-14
Source: Company, Ambit Capital research
Exhibit 39: CFO has been used primarily to pay dividend
Source: Company, Ambit Capital research
The impact of the DPCO is evident in GSK Pharma’s RoCE. Average RoCE was 49% over FY05-FY11 (GSK Pharma followed the calendar year as its financial year until FY14; FY15 is March-ending). After the implantation of the DPCO, RoCE fell to 36% in FY14 before recovering to 40% in FY15.
Exhibit 40: GSK Pharma’s RoCE was hit by DPCO in FY14
Source: Company, Ambit Capital research
Sun has consistently generated above-average RoE and RoCE over the past 10 years. Sun’s growth and founder Dilip Shanghvi’s reputation have been built on successfully acquiring and profitably integrating 10 firms over the past decade or so. Unlike many successful companies which diversify into unrelated areas, Sun has remained focused on the pharma sector. Over the past few years, Sun has articulated a more aggressive M&A strategy towards expansion of branded generics business, both in the US and in other developed and emerging markets.
CFO, 62.4%
Interest received,
16.1%
Dividend received,
1.2%
Sale of investments
, 20.3%
Net capex, 6.7% Buyback of
shares, 3.2%
Dividend paid, 59.3%
Increase in cash and
cash equivalentat 30.5%
0
10
20
30
40
50
60
FY02 FY03 FY04 FY05 FY06 FY07 FY08 FY09 FY10 FY11 FY12 FY13 FY14 FY15
EBITDA margin expansion led by control over employee and other expenses
One off expense w.r.t to penalty paid for pricing higher than allowed by DPCO
NLEM impact
(%)

Strategy
March 23, 2016 Ambit Capital Pvt. Ltd. Page 32
Exhibit 41: Sun Pharma’s inorganic strategy has been a key contributor to shareholder wealth creation
Year Acquisition target Description Purchase consideration Rationale
1996 Gujarat Lyka Organics Ltd Manufacturer of Cephalexin Active NA Adding production of cephalexin bulk active brought Sun an USFDA-approved manufacturing facility.
1996 Knoll Pharmaceutical API plant at Ahmednagar NA Bulk actives manufacturing business.
1996 MJ Pharma Dosage form plant (now USFDA-approved) NA MJ Pharma give Sun its strong insulin production as well as a springboard for entry into Europe.
1997 Tamilnadu Dadha Pharmaceuticals Ltd
Gynecology and oncology brands; API and dosage form plant NA Strong gynaecology and oncology brands as well as
API and dosage form plant.
1997 Caraco Dosage form plant $7.5mn Speedy promotion of generic drugs in the US market.
1998 Natco – specific brands Respiratory brands NA
The company makes new products in the gastroenterology, orthopedics, pediatrics and other categories. Will have access to Natco's time-release technology.
2000 Pradeep Drug Company
NA Bulk actives business.
2004 Phlox Pharma
NA
Entry in the higher end of the second and third generation cephalosporin business. Phlox offered a low-cost entry opportunity in the regulatory market for these products with minimal capex. Manufacturer of cephalosporin API holding US and European approvals.
2005 Able labs Dosage form plant (NJ, US) and IP NA Acquired controlled substance manufacturing assets.
2005 ICN Hungary API and dosage form plant (Hungary) NA Controlled substance APIs and dosage form manufacturing plant.
2008 Chattem Chemicals, Inc Import registration with DEA, API plant approved by DEA in Tennessee, US ~US$52mn
A narcotic import registration as well as a fully operational USFDA- and DEA-approved API facility, with an expert team and approved active drug master file (DMFs) controlled substances with an API facility. Strategic resolve to be a more active player in the pain management segment in the US.
2010 Taro Pharmaceutical Dermatology and topical product Manufacturing plant at Israel and Canada ~US$330m Established North America presence and a strong
dermatology franchise.
2012 DUSA Pharma, Inc Access to branded derma product US$230mn Entry into dermatological treatment devices, where Sun saw good growth opportunities.
2013 URL’s generic business Adds 107 products to US portfolio ~US$70m A comprehensive list of ANDAs and generic products from Takeda Pharmaceuticals. Adds scale to US presence.
2014 Ranbaxy Laboratories
Adds US$600mn in sales in US (FY16E), US$570mn in RoW sales (FY16E) and US$100mn in India domestic sales (FY16E).
US$4bn
Scale in the US and India would help gain bargaining power from buyers and suppliers; RoW market platform could be leveraged to cross-sell Sun’s products; complementary portfolio in India helps in expanding market presence; cost synergies also available as infrastructure in India and US would overlap.
2014 Pharmalucence Inc. Adds capability in injectables NA
Pharmalucence helps Sun in extending its product portfolio in the specialty segment. Pharmalucence is engaged in manufacturing of sterile injectables with manufacturing facility approved by the US FDA.
Source: Company, Ambit Capital research

Strategy
March 23, 2016 Ambit Capital Pvt. Ltd. Page 33
Section 3 – Spotting corporate failure on a prospective basis “Every company in every industry works under certain forces – laws of organizational nature – that act powerfully to define what that company can and cannot do. Managers faced with disruptive technologies fail their companies when these forces overpower them.”
- The Innovator’s Dilemma, Clayton M. Christensen (1997)
Having analysed the reasons for corporate failure, we move to spotting symptoms of impending corporate failure. This is especially relevant for investors who are lucky enough to be holding ‘Magic Box’ companies (i.e., companies that were Q1 a decade ago and are still in the top half). We provide red flags which give telltale signs of management complacency - signs that should warn investors that the company is sleeping at the wheel and needs to wake up to avoid slipping into mediocrity.
How safe is the Magic Box?
As we observed in Section 1, 64% of ‘great’ companies slipped to mediocrity from FY05 to FY15. Of the remaining 36%, an elite set of 6 secular companies sustained superior financial performance and, as a result, delivered stellar stock price performance (25% CAGR over 10 years).
Exhibit 42: Magic Box of 6 secular companies
Secular companies in Quartile 1 Mcap (̀ bn)
FY05-15 Share price
CAGR
FY05-15 EPS CAGR
FY05-15 cum. CFO/
cum. EBITDA
FY05-15 ROCE
change
Nestle India 506 22% 17% 111% -61%
Bosch 610 25% 14% 97% -24%
Sanofi India 96 13% 5% 99% -34%
Tata Motors 1,221 16% 19% 102% -13%
Ipca Labs 71 26% 13% 79% -9%
Sun Pharma 2,012 32% 26% 80% 3%
Source: Ambit Capital research, Bloomberg Note: 10-year share price CAGR computed from 31st Oct’05 to 30th Oct’15
The obvious question for investors in these stocks is: what are the chances of companies in this Magic Box failing in the next decade, if not earlier? We approach this question from: a) the quantitative side – can these companies simply revert to the mean and slide to mediocrity? and b) the qualitative side – what are some telltale signs that the company is at risk of sliding into mediocrity?
Risk of mean reversion Our Greatness Framework assigns a ranking to a company on the basis of its historical 6-year financial performance relative to peers. Companies that show a consistent and higher improvement in most parameters (like sales growth, PBIT margin, ROCE, RoE, Leverage, etc.) during this period get a higher ranking than the ones that don’t. Thus, when divided into quintiles, Quintile 1 (Q1) consists of top 20% companies on the basis of last 6-year financial performance, whilst Quintile 5 (Q5) consists of the bottom 20% companies. However, as has been well-documented in a number of studies, financial parameters have a tendency to revert to the industry mean. For instance, a company that has been on a high growth trajectory in its early years is unlikely to continue doing so as it matures and will revert to the mean industry growth level as some other company embarks on a high growth path.
Mean reversion is a common occurrence in any system that combines skill and luck. Francis Galton’s Natural Inheritance (1889) highlighted this point with respect to height of adults. Galton showed that children of tall parents have a tendency to be tall but often not as tall as their parents. Similarly, children of short parents though short, are not as short as their parents. In other words, whilst heredity does play a role, the heights revert to mean over time.
‘Magic Box’ companies have delivered stock price returns of 25% CAGR over 10 years
Financial parameters have a tendency to revert towards industry mean
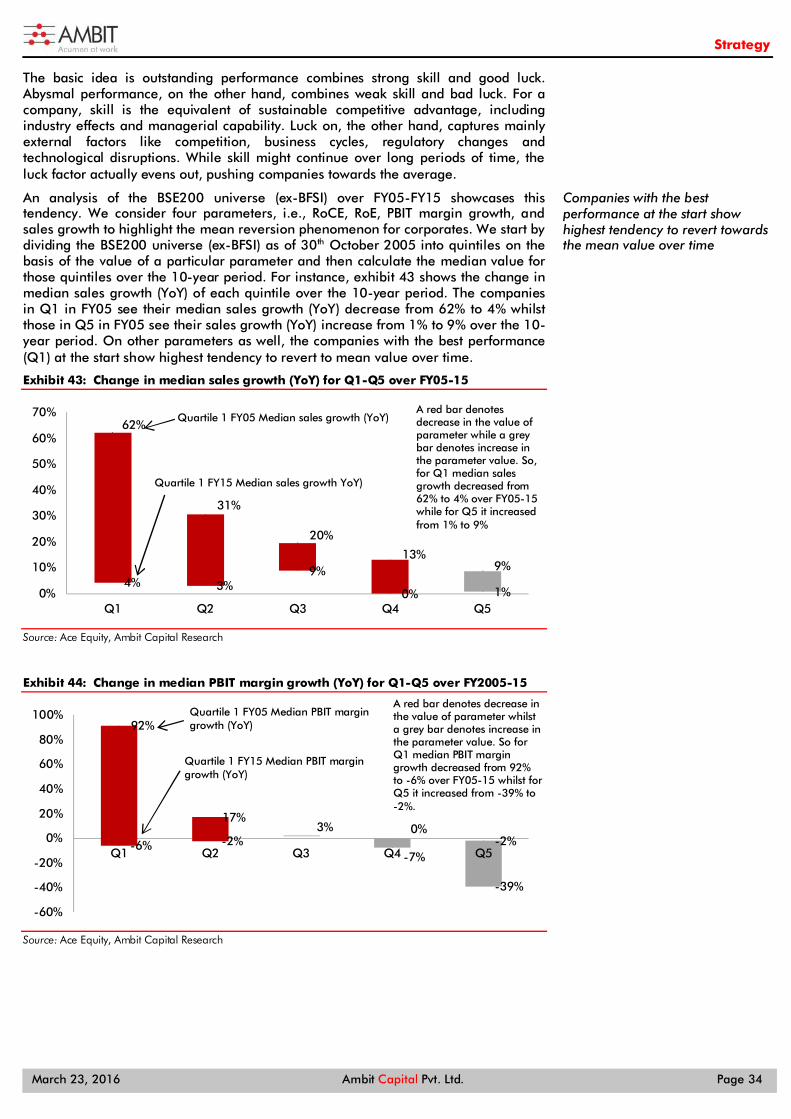
Strategy
March 23, 2016 Ambit Capital Pvt. Ltd. Page 34
The basic idea is outstanding performance combines strong skill and good luck. Abysmal performance, on the other hand, combines weak skill and bad luck. For a company, skill is the equivalent of sustainable competitive advantage, including industry effects and managerial capability. Luck on, the other hand, captures mainly external factors like competition, business cycles, regulatory changes and technological disruptions. While skill might continue over long periods of time, the luck factor actually evens out, pushing companies towards the average.
An analysis of the BSE200 universe (ex-BFSI) over FY05-FY15 showcases this tendency. We consider four parameters, i.e., RoCE, RoE, PBIT margin growth, and sales growth to highlight the mean reversion phenomenon for corporates. We start by dividing the BSE200 universe (ex-BFSI) as of 30th October 2005 into quintiles on the basis of the value of a particular parameter and then calculate the median value for those quintiles over the 10-year period. For instance, exhibit 43 shows the change in median sales growth (YoY) of each quintile over the 10-year period. The companies in Q1 in FY05 see their median sales growth (YoY) decrease from 62% to 4% whilst those in Q5 in FY05 see their sales growth (YoY) increase from 1% to 9% over the 10-year period. On other parameters as well, the companies with the best performance (Q1) at the start show highest tendency to revert to mean value over time.
Exhibit 43: Change in median sales growth (YoY) for Q1-Q5 over FY05-15
Source: Ace Equity, Ambit Capital Research
Exhibit 44: Change in median PBIT margin growth (YoY) for Q1-Q5 over FY2005-15
Source: Ace Equity, Ambit Capital Research
62%
31%
20%
13%
1%4% 3%
9%
0%
9%
0%
10%
20%
30%
40%
50%
60%
70%
Q1 Q2 Q3 Q4 Q5
92%
17%3%
-7%
-39%
-6% -2%0%
-2%
-60%
-40%
-20%
0%
20%
40%
60%
80%
100%
Q1 Q2 Q3 Q4 Q5
Companies with the best performance at the start show highest tendency to revert towards the mean value over time
Quartile 1 FY05 Median sales growth (YoY)
Quartile 1 FY15 Median sales growth YoY)
A red bar denotes decrease in the value of parameter while a grey bar denotes increase in the parameter value. So, for Q1 median sales growth decreased from 62% to 4% over FY05-15 while for Q5 it increased from 1% to 9%
Quartile 1 FY05 Median PBIT margin growth (YoY)
Quartile 1 FY15 Median PBIT margin growth (YoY)
A red bar denotes decrease in the value of parameter whilst a grey bar denotes increase in the parameter value. So for Q1 median PBIT margin growth decreased from 92% to -6% over FY05-15 whilst for Q5 it increased from -39% to -2%.
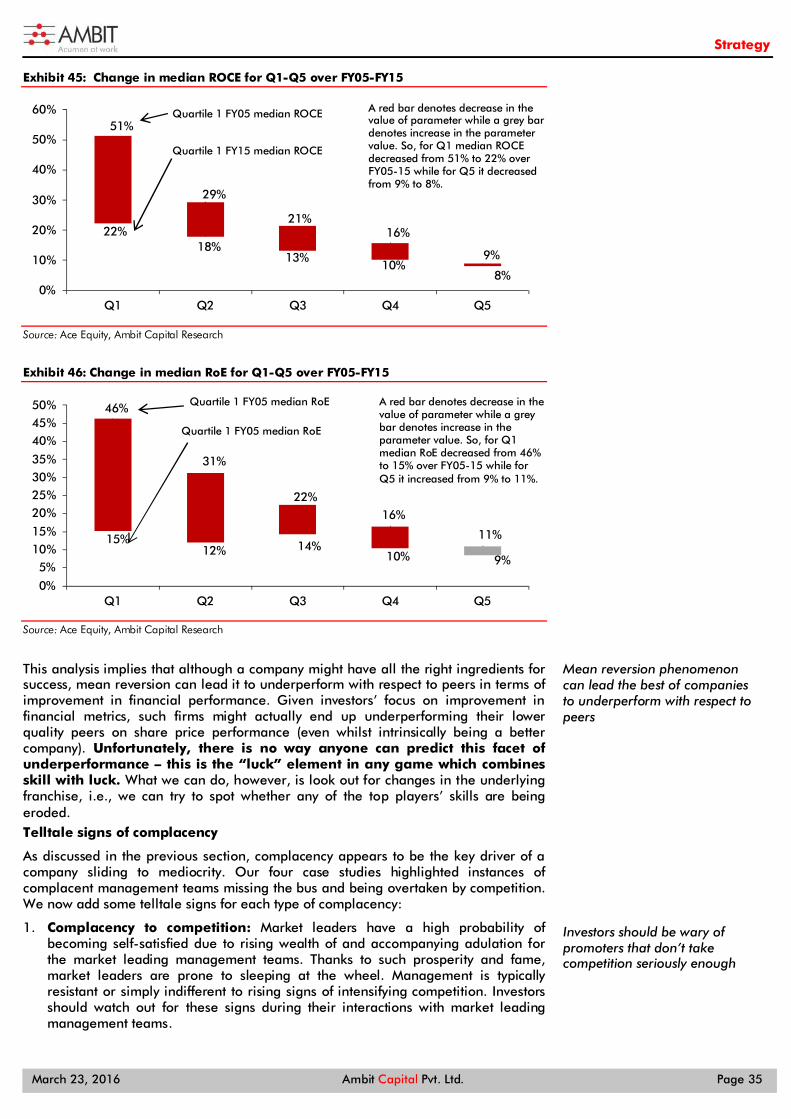
Strategy
March 23, 2016 Ambit Capital Pvt. Ltd. Page 35
Exhibit 45: Change in median ROCE for Q1-Q5 over FY05-FY15
Source: Ace Equity, Ambit Capital Research
Exhibit 46: Change in median RoE for Q1-Q5 over FY05-FY15
Source: Ace Equity, Ambit Capital Research
This analysis implies that although a company might have all the right ingredients for success, mean reversion can lead it to underperform with respect to peers in terms of improvement in financial performance. Given investors’ focus on improvement in financial metrics, such firms might actually end up underperforming their lower quality peers on share price performance (even whilst intrinsically being a better company). Unfortunately, there is no way anyone can predict this facet of underperformance – this is the “luck” element in any game which combines skill with luck. What we can do, however, is look out for changes in the underlying franchise, i.e., we can try to spot whether any of the top players’ skills are being eroded. Telltale signs of complacency
As discussed in the previous section, complacency appears to be the key driver of a company sliding to mediocrity. Our four case studies highlighted instances of complacent management teams missing the bus and being overtaken by competition. We now add some telltale signs for each type of complacency:
1. Complacency to competition: Market leaders have a high probability of becoming self-satisfied due to rising wealth of and accompanying adulation for the market leading management teams. Thanks to such prosperity and fame, market leaders are prone to sleeping at the wheel. Management is typically resistant or simply indifferent to rising signs of intensifying competition. Investors should watch out for these signs during their interactions with market leading management teams.
51%
29%
21%16%
9%
22%18%
13%10%
8%0%
10%
20%
30%
40%
50%
60%
Q1 Q2 Q3 Q4 Q5
46%
31%
22%16%
9%
15%12% 14%
10%
11%
0%
5%10%15%
20%25%30%35%
40%45%50%
Q1 Q2 Q3 Q4 Q5
Mean reversion phenomenon can lead the best of companies to underperform with respect to peers
Investors should be wary of promoters that don’t take competition seriously enough
Quartile 1 FY05 median ROCE
Quartile 1 FY15 median ROCE
A red bar denotes decrease in the value of parameter while a grey bar denotes increase in the parameter value. So, for Q1 median ROCE decreased from 51% to 22% over FY05-15 while for Q5 it decreased from 9% to 8%.
Quartile 1 FY05 median RoE
Quartile 1 FY05 median RoE
A red bar denotes decrease in the value of parameter while a grey bar denotes increase in the parameter value. So, for Q1 median RoE decreased from 46% to 15% over FY05-15 while for Q5 it increased from 9% to 11%.

Strategy
March 23, 2016 Ambit Capital Pvt. Ltd. Page 36
Telltale signs: Management frequently uses phrases like “retain/maintain/sustain #1 position”, “strengthen our leadership”, “we will remain sector leader”, “competition is not a major concern”, etc.
For example, Hero MotoCorp’s FY10 (a year before the Hero Group split with Honda) annual report stated: “All figures indicate that the Company achieved a pole position in the industry and continues to maintain its lead”. In the six years since, Honda Motorcycles & Scooters India (HMSI) has risen to #2 in the Indian two-wheeler industry, overtaking Bajaj Auto. While HMSI is yet to catch up with Hero MotoCorp, it has made explicit statements targeting the #1 spot.
An even more qualitative sign of complacency is whether the management team is falling in love with the good life. Are they coming to work at 10am? Are there multiple press reports and photographs of them with sports stars and film stars? In this context, Pawan Munjal’s (Hero Motocorp’s Chairman, Managing Director & CEO) golf match with Tiger Woods in 2014 (following which Tiger Woods signed a 4-year endorsement contract5 for Hero reportedly for $6m-8m per annum) sets the benchmark. It would appear that Mr. Munjal thought signing Tiger Woods would be a good response to rising competitive intensity in the Indian 2W sector.
2. Complacency to business environment: A complacent management team is also less prepared for adverse turns in the industry cycle; a complacent management cannot or does not react on time. As a result, the company ignores the impending signs of change, like a collapse in the commodity cycle, a slowdown in the economy, etc. These macro events do not happen overnight and there are enough signs – from dealers, suppliers, etc. – over a period of time that things are likely to worsen.
Telltale signs: Excessive focus by the management team on how all their woes are due to the macro-economic slowdown, the business cycle, capex cycle, etc., and how the company is poised to grow as and when conditions improve.
For example, in Thermax’s FY13 annual report, the Letter from the Managing Director begins with one paragraph dedicated to the impact of the economic slowdown on the company: “We have just crossed one of the toughest years for the company in recent times. As the downward spiral of the national economy continued, in the absence of a favourable investment environment, the capital goods sector languished. This has affected the performance of companies in this sector including that of Thermax. Though in the latter part of the year, signs of recovery appeared in some overseas markets, the shadow of overall economic uncertainty continued to hover over global markets, dampening demand and restraining the flow of goods and services.”
3. Complacency to capital allocation: Finally, when the management of a solid company starts throwing good money after bad, for example, through forays into unrelated areas, makes oversized and overpriced acquisitions to fuel global ambitions, etc., the biggest casualty is the balance sheet. In the commodity area, the Tata Steel-Corus acquisition stands out as a key example.
Telltale signs: Management justifies sub-optimal capital allocation and gives excuses why RoCE, RoE, etc., are not the right way to evaluate the company and that investors should focus on its various forays, huge expansion and capex plans, new launches, etc.
For example, in Tata Steel’s FY07 annual report, the Chairman’s letter (i.e. Ratan Tata’s letter) waxes over the impact of the Corus acquisition on Tata Steel’s balance sheet: “The Company has satisfied itself that the acquisition of Corus in no way jeopardises long-term shareholder value or the dividend paying capacity of the Company. Although there was a rise in market price of the Corus shares and while there was a competitive bid which further raised the acquisition price of Corus, I believe that when one looks back at this acquisition – even at this price, it will be seen as a bold visionary move.” From the date of the Chairman’s letter (31st May 2007) until 16th March 2016, Tata Steel’s stock declined 46% (or -7% annualised). To put this in
5 http://espn.go.com/golf/story/_/id/11974866/tiger-woods-hero-motocorp-deal-expected-pay-6-million-8-million-annually
A company can be lulled into complacency during good times
Oversized ambitions can lead to unrelated forays

Strategy
March 23, 2016 Ambit Capital Pvt. Ltd. Page 37
perspective, Tata Steel’s market capitalisation has reduced by US$4.7bn in the abovementioned period compared to US$12bn paid by Tata Steel for Corus. In forthcoming thematics, we will delve deeper into contemporary market leaders whose management’s behaviour and performance is replete with red flags.
What do winners do differently? Another way of deciphering the symptoms of impending failure is to check what successful companies do differently. Our Coffee Can list of companies achieves long periods of superior financial performance (10%+ revenue growth per annum and 15%+ RoCE per annum for 10 years). As we have discussed in the 02 Nov 2015 iteration of our Coffee Can report (click here), these companies display three common traits: Theme A: Focus on the long term (more than 10 years) without being distracted by short-term gambles. For example: Marico has consistently focused on oil right since it was incorporated. It remains the brand leader in hair oil (Parachute) and edible oil (Saffola). Similarly, Page Industries hasn’t forayed out of the men’s innerwear category, where it is the brand leader with the Jockey brand. As Mr. Ashok Genomal, promoter of Page, told us in a discussion in February 2014, “There is enormous potential in the innerwear space which is yet to be exploited. We are just scratching the surface of it currently. So, no point of diluting our focus on Jockey business until we have fully capitalised on this potential.”
Theme B: Constantly deepen the moat around the core franchise by using innovations, investing in brands, building internal architecture, and building strategic assets (this is also known as the IBAS framework, enunciated by British economist and columnist John Kay). Examples of this theme include Asian Paint’s legendary use of technology as early as the 1970s to help forecast sales patterns. Similarly, Astral Poly Technik has innovated with its CPVC pipes and fittings by launching products that are lead-free, soundproof, bendable, etc. As Mr. Sandeep Engineer, Promoter of Astral PolyTechnik, told us: “We grew at 40% plus CAGR for more 7-8 years up to 2014 while the economy wasn’t that strong; where was the slowdown? Slowdown is in the mind! If you create new product segments, if you create leadership, if you create brand, growth will be strong and ahead of industry.
Theme C: Allocate capital sensibly while studiously avoiding betting the balance sheet on expensive and unrelated forays. ITC stands out as a key example of a large-cap firm that, despite its many forays, has always paid back surplus funds back to shareholders and limited investments in its many forays. Similarly, Asian Paints has forayed overseas but never stretched its balance sheet for this purpose. Speaking to us in November 2015, KBS Anand, MD and CEO of Asian Paints, had this to say on the impact of the home improvements business on RoCE: “At the moment, the home improvements business is too small to have any significant impact on the overall firm’s RoCE. But if you are talking about building long-term strength with your channel partners, then whatever RoCE we lose in the new business will be more than offset by increase in RoCE of the paints business”.
All the above habits common to great companies are discussed in detail in our 02 Nov 2015 iteration of our Coffee Can Report (click here) as well as follow-up, deep-dive reports on Asian Paints (click here), Berger Paints (click here) Marico (click here).
Clarity of thought is a key strength
For the winning companies, there are always clear signs of cogent discussion by the management – these can be found in the management discussion and analysis (MDA) section of the annual report, in quarterly conference calls and when investors meet the management. Take, for example, Marico’s entry and exit from skincare. Marico’s FY02-03 annual report explained the entry into skincare as follows: “Kaya Skin Clinic would attempt to fill the existing needs gap in the Skin Care Services business in India in this area. Marico would seek to create a differentiation as a corporate service provider offering safe, efficacious and credible Skin Care Services range at multiple locations backed by medical procedures & technology.”
Coffee Can companies have common habits that drive their success…
First: focusing on core strengths and avoiding short-term distractions
Second: deepening competitive moat using IBAS
Third: Sensible capital allocation
Look for cogent discussion of management plans in the MDA section of annual reports

Strategy
March 23, 2016 Ambit Capital Pvt. Ltd. Page 38
Nearly a decade later, explaining the demerger of the skincare business, Mr. Harsh Mariwala, Chairman of Marico, said in an interview6: “After all it was our FMCG roots which provided a stronger foundation in the consumer insights area. It was this self-belief on which we entered the skincare business. I do not see any room for self-doubt. It is a matter of tweaking the execution and hopefully the new entrepreneurial way of running the business will yield better results."
Similarly, Asian Paints explained its acquisition of the Sleek Group in the MDA of its FY13 Annual Report as follows: “This acquisition of the Sleek Group has a strategic fit and is a step in the Company’s foray into Home Improvement. Your Company has chosen to enter the modern kitchen “space”, as it believes that the modern kitchen space is currently undergoing an inflection, has very few organised pan India players and is growing rapidly.” It reiterated its commitment in the MDA of its FY14 annual report as follows: “As emphasized during the last year, your Company had strategically looked at the Home Improvement and Décor sector as an avenue for future growth especially since it has synergy with the existing line of the decorative paints business in India. Last year, modern kitchen was identified as a key opportunity in this sector with the modern kitchen industry poised for greater organized sector play as well as overall growth with greater number of customers opting for modern kitchens.”
Investing for an unpredictable future
In his 1997 classic, The Innovator's Dilemma, American scholar Clayton M. Christensen wrote about the failure of companies to stay on top of their industries when confronted by changes in the market and technology. In his book, Christensen built a "failure framework" along five principles that would help managers harness disruptive innovation, instead of falling prey to it. These principles were:
Principle #1: Companies depend on customers and investors: By the time large companies respond to small, low-margin, but fast-growing markets, it is too late. Setting up an autonomous organisation, freed from the objectives of the large company, can focus on the newer, faster growing markets.
Principle #2: Small markets don’t solve the growth needs of large companies: Disruptive technologies result in emergence of new products that might be too small for large companies to enter. They also cannot wait till a market becomes large enough to enter. Giving the responsibility of capturing these fast-growing markets to small organizations makes sense.
Principle #3: Markets that don’t exist can’t be analysed: Companies that invest in new markets only after knowing that market's size and financial returns will make mistakes figuring out disruptive technologies on which, by definition, very little is known. They need to adopt a 'discovery-based planning' approach.
Principle #4: An organisation’s capabilities define its disabilities: An organisation's processes and values create capabilities; however, a fixed set of capabilities that help in one situation might hinder in another situation. Tools are required to create new capabilities to tackle new situations.
Principle #5: Technology supply may not equal market demand: As companies race up the value chain, they leave low-end markets to competition (with disruptive technologies) that rises up soon. Close monitoring of mainstream customer behavior can catch inflection points.
One of the best examples of a company harnessing an uncertain future is Apple Inc. and the way it shifted track from its Macintosh line of personal computers to the iPod. Walter Isaacson, in his biography of Apple founder Steve Jobs, recounts the origin of Apple's iconic iPod which was launched in 2001. "For the twenty-five years since Jobs and Wozniak had founded Apple, the personal computer had been the centerpiece of the digital revolution. Now experts were predicting that its central role was ending. It had “matured into something boring,” wrote the Wall Street Journal’s Walt Mossberg. Jeff Weitzen, the CEO of Gateway, proclaimed, “We’re clearly migrating away from the PC as the centerpiece.” It was at that moment that Jobs launched a new grand strategy
6 http://www.thehindubusinessline.com/companies/why-marico-shed-its-kayaskin/article4400584.ece
Five principles for harnessing disruptive innovation

Strategy
March 23, 2016 Ambit Capital Pvt. Ltd. Page 39
that would transform Apple—and with it the entire technology industry. The personal computer, instead of edging toward the sidelines, would become a “digital hub” that coordinated a variety of devices, from music players to video recorders to cameras." The rest, as the cliché goes, is history.
From an Indian perspective, we believe promoters should rigorously set aside a modest amount of their capital employed into ventures and/or technologies that have the potential to transform and/or protect their future. In our case study on M&M vs Tata Motors, we saw how unprepared M&M was for the emergence of the compact SUV. Contrast this with Marico’s and Asian Paints’ overseas forays or even ITC’s big bet on the FMCG segment. In fact, to ensure that it continuously pursues innovation, Marico follows the concept of strategic funding where a portion (up to ~10%) of annual profits is invested in pursuing product innovation. New products are tested through prototyping, where it is test marketed in a specific geography and then scaled up nationally if it meets internal benchmarks during prototyping.
We highlight Asian Paints, which, over the past decade, has been preparing for the future by investing in: a) businesses related to homes, such as kitchenware (Sleek acquisition), bath fittings (Ess Ess acquisition); and b) services that could disrupt the traditional Indian model of hiring painters to paint their homes. Through the launch of value-added services like Asian Paints home solutions, colour consultancies, Colour Ideas stores, and entry into the home improvement solutions business, Asian Paints intends to convert its existing mom-and-pop store network into a one-stop-shop for all the needs of the evolving paint customer.
Promoters should invest modest amounts in potentially transformative technologies

Strategy
March 23, 2016 Ambit Capital Pvt. Ltd. Page 40
Appendix 1 The ‘greatness’ framework
‘’Greatness is not in where we stand, but in what direction we are moving….’’
- Oliver Wendell Holmes
This quote appropriately captures the driving philosophy behind our ‘greatness‘ framework that lies at the core of our process of identifying potential ten baggers. We had unveiled this framework on 19 January 2012 with the first iteration of the ’Tomorrow’s ten baggers‘ note. This framework studies a firm’s structural strengths by focusing not on absolutes but rather on improvements over a period of time and the consistency of those improvements.
A basic sketch of the underlying process behind the making of a great firm has been recaptured in Exhibit 47 below.
Exhibit 47: The ’greatness‘ framework
Source: Ambit Capital research
We rank the BSE500 universe of firms (excluding financial services firms and excluding firms with insufficient data) on our ’greatness‘ score, which consists of six equally weighted headings—investments, conversion to sales, pricing discipline, balance sheet discipline, cash generation and EPS improvement, and return ratio improvement. Under each of these six headings, we further look at two kinds of improvements:
Percentage improvements in performance over FY13-15 vs FY10-12; and
Consistency in performance over FY10-15 i.e. improvements adjusted for underlying volatility in financial data
A complete list of factors that are considered whilst quantifying greatness has been provided in Exhibit 48 on the next page.
b. Conversion of investment to sales (asset turnover, sales)
c. Pricing discipline (PBIT margin)
d. Balance sheet discipline (D/E, cash ratio)
a. Investment (gross block)
e. Cash generation (CFO)
The ’greatness‘ framework
The framework essentially hinges on using publicly available historical data to assess which firms have, over a sustained period of time (FY10-15), been able to relentlessly and consistently:
(a) Invest capital; (b) Turn investment into
sales; (c) Turn sales into profit; (d) Turn profit into
balance sheet strength; (e) Turn all of that into
free cash flow; and (f) Invest free cash flows
again.
Clearly, this approach will have limited value if there is a structural break in the sector or in the company, which makes past performance a meaningless guide to future performance. (For identifying structural breaks of this sort, for example in the Indian boiler-turbine-generator sector or in the Indian utilities sector, we look to our sector leads for help.)
However, to the extent that such structural breaks tend to be the exception than the rule, the greatness model helps in creating a shortlist of stocks that investors can then analyse in greater detail.
Put simply, the greatness model separates the wheat from the chaff. Yet, it does not cook the whole meal for you!

Strategy
March 23, 2016 Ambit Capital Pvt. Ltd. Page 41
Exhibit 48: Factors used for quantifying greatness
Head Criteria
1 Investments a. Above median gross block increase (FY13-15 over FY10-12)*
b. Above median gross block increase to standard deviation
2 Conversion to sales a. Improvement in asset turnover (FY13-15 over FY10-12)*
b. Positive improvement in asset turnover adjusted for standard deviation
c. Above median sales increase (FY13-15 over FY10-12)*
d. Above median sales increase to standard deviation
3 Pricing discipline a. Above median PBIT margin increase (FY13-15 over FY10-12)*
b. Above median PBIT margin increase to standard deviation
4 Balance sheet discipline a. Below median debt-equity decline (FY13-15 over FY10-12)*
b. Below median debt-equity decline to standard deviation
c. Above median cash ratio increase (FY13-15 over FY10-12)*
d. Above median cash ratio increase to standard deviation
5 Cash generation and PAT improvement a. Above median CFO increase (FY13-15 over FY10-12)*
b. Above median CFO increase to standard deviation
c. Above median adj. PAT increase (FY13-15 over FY10-12)*
d. Above median adj. PAT increase to standard deviation
6 Return ratio improvement a. Improvement in RoE (FY13-15 over FY10-12)*
b. Positive improvement in RoE adjusted for standard deviation
c. Improvement in RoCE (FY13-15 over FY10-12)*
d. Positive improvement in RoCE adjusted for standard deviation
Source: Ambit Capital research. Note: * Rather than comparing one annual endpoint to another annual endpoint (say, FY09 to FY14), we prefer to average the data out over FY09- 11 and compare that to the averaged data from FY13-15. This gives a more consistent picture of performance (as opposed to simply comparing FY09 to FY14).
We rank the BSE500 universe of firms (excluding financial services firms) on this score to arrive at this year’s rankings on this measure of structural strength. After removing financial services firms and firms with insufficient data, 399 firms from the BSE500 were ranked based on this measure.
In the latest iteration of the ten-bagger exercise, from the 80 firms that clear more than two-thirds of our cut-off, we reach a shortlist of 30 firms after following a process of elimination. This involves removing firms:
that fall in the ‘Zone of Trouble’ in our accounting model (i.e. the bottom 4 deciles on accounting quality; for a full exposition of our accounting filter, please refer to our 17 December 2015 note which explains how our forensic accounting model works);
firms with suspect corporate governance; and
firms with structural issues around the underlying business (i.e. businesses where a great past is not likely to translate into a great future).
This shortlist of 30 firms that clear our greatness, accounting and corporate governance filters has been presented in Exhibit 49 below.
Both improvements and the consistency of those improvements are important

Strategy
March 23, 2016 Ambit Capital Pvt. Ltd. Page 42
Exhibit 49: Our 5th January 2016 ten baggers’ list
Sr. No. Ticker Company
Mcap (US$ mn)
6M ADV (US$ mn)
3-yr share price CAGR
3-yr Net
Sales CAGR
3-yr adj. PAT
CAGR
3-yr CFO
CAGR
3-yr avg PBIT
margin
3-yr avg RoE
3-yr avg
RoCE
FY15 Net Debt/
Equity
FY17 P/E
FY17 P/B
Attractive valuations*
1 ITC IN ITC Ltd. 38,922 38.8 2% 14% 16% 16% 34% 34% 50% -0.5 22.7 6.6
2 IDEA IN Idea Cellular 5,506 9.2 -2% 17% 65% 40% 14% 12% 12% 0.6 19.6 1.3
3 HCLT IN HCL Tech. 17,504 23.8 29% 21% 44% 29% 21% 37% 43% 0 13.5 3.4
4 TCS IN TCS 73,018 40.9 17% 25% 23% 41% 27% 41% 52% -0.4 18.3 5.9
5 GPPV IN Gujarat Pipavav 1,272 1.5 52% 21% 81% 80% 38% 14% 14% -0.2 26.7 3.7
6 MRF IN MRF 2,212 4.4 44% 11% 37% 39% 11% 23% 28% 0 9.7 1.8
7 TTMT IN Tata Motors 18,441 55.5 12% 17% 0% 24% 9% 27% 21% 0.5 8.4 1.4
Moderate valuations** 8 TRP IN Torrent Pharma 3,596 4.3 61% 20% 31% 18% 19% 36% 30% 0.8 18.6 4.9
Rich valuations***
9 LPC IN Lupin Ltd. 10,458 36.0 35% 22% 40% 70% 23% 30% 36% -0.2 21.7 5.2
10 PSYS IN Persistent Systems 858 1.1 40% 24% 26% 22% 17% 21% 28% -0.6 16.3 3.1
11 KJC IN Kajaria 1,127 1.4 74% 19% 30% 26% 13% 30% 32% 0.3 26.1 6.5
12 BRIT IN Britannia Industries Ltd.# 4,946 8.4 74% 13% 46% 33% 8% 54% 57% -0.5 32.5 14.5
13 SKB IN GSK Consumer Healthcare# 3,770 1.6 12% 16% 18% 16% 16% 33% 49% -1.1 31.5 8.7
14 PI IN PI Industries Ltd. 1,179 2.4 66% 30% 46% 21% 14% 28% 33% 0.1 22.6 5.5
15 MTCL IN Mindtree Ltd.# 1,655 6.1 45% 23% 33% 43% 17% 29% 37% -0.5 16.0 3.9
16 PAG IN Page Industries 1,931 2.5 52% 30% 29% 11% 20% 59% 64% 0.4 44.4 20.0
17 FNXC IN Finolex Cables 607 0.3 84% 6% 11% -4% 8% 17% 20% -0.3 16.8 2.6
18 SI IN Supreme Industries 1,497 0.9 36% 13% 10% 20% 13% 32% 37% 0.1 24.8 6.4
19 BRGR IN Berger Paints 2,427 1.3 34% 14% 13% 25% 9% 24% 25% 0.2 34.2 9.0
20 EIM IN Eicher Motors# 7,422 16.7 89% 15% 26% 37% 9% 21% 25% -0.6 38.9 13.3
21 TVSL IN TVS Motor 2,258 7.9 114% 12% 30% -45% 4% 19% 18% 0.5 22.5 6.7
22 SF IN Sundram Fasteners 454 0.2 54% 4% 10% -20% 7% 15% 14% 1 14.3 2.7
23 AJP IN Ajanta Pharma 1,827 3.7 101% 30% 60% 58% 26% 41% 50% -0.1 25.9 7.8
24 HTSMF IN Hatsun Agro Products 663 0.1 66% 22% 13% 6% 4% 35% 19% 2.7 26.1 11.0
25 LOG IN La Opala 493 0.4 110% 25% 49% 48% 24% 34% 39% -0.4 43.9 10.9
26 HUVR IN Hindustan Unilever 28,213 17.1 24% 11% 12% 2% 15% 103% 146% -1.4 39.2 39.7
27 VO IN Vinati Organics 306 0.3 53% 20% 28% 79% 21% 31% 32% 0.1 14.5 3.1
28 MRCO IN Marico Ltd. 4,737 7.4 34% 13% 21% 18% 13% 29% 31% 0 36.2 11.3
29 AIAE IN AIA Engineering 1,346 0.9 44% 16% 33% 48% 21% 20% 26% -0.3 22.6 3.3
30 ATLP IN Atul Ltd. 677 0.7 71% 14% 38% 51% 12% 22% 24% 0.2 13.8 3.0
Source: Bloomberg, Ambit Capital research; Note: + represents companies for which FY15 data is not available and FY14 data is used instead. This exhibit has been reproduced without any changes from our 05 January 2016 note: Ten baggers 5.0 * Trading below five-year average P/E, P/B, EV/EBITDA (on at least two of these three measures) ** Trading below either five-year average P/E, five-year P/B or five-year EV/EBITDA (on one of these three measures) *** Trading above five-year average P/E, P/B and EV/EBITDA # denotes that the relevant Ambit sector lead has a bottom-up SELL in the name

Strategy
March 23, 2016 Ambit Capital Pvt. Ltd. Page 43
Institutional Equities Team Saurabh Mukherjea, CFA CEO, Institutional Equities (022) 30433174 [email protected]
Research Analysts
Name Industry Sectors Desk-Phone E-mail
Nitin Bhasin - Head of Research E&C / Infra / Cement / Industrials (022) 30433241 [email protected]
Aadesh Mehta, CFA Banking / Financial Services (022) 30433239 [email protected]
Aakash Adukia Oil & Gas / Chemicals / Agri Inputs (022) 30433273 [email protected]
Abhishek Ranganathan, CFA Retail / Mid-caps (022) 30433085 [email protected]
Achint Bhagat, CFA Cement / Roads / Home Building (022) 30433178 [email protected]
Ashvin Shetty, CFA Automobile (022) 30433285 [email protected]
Bhargav Buddhadev Power Utilities / Capital Goods (022) 30433252 [email protected]
Deepesh Agarwal, CFA Power Utilities / Capital Goods (022) 30433275 [email protected] Dhiraj Mistry, CFA Consumer (022) 30433264 [email protected]
Gaurav Khandelwal, CFA Automobile (022) 30433132 [email protected] Girisha Saraf Mid-caps / Small-caps (022) 30433211 [email protected]
Karan Khanna, CFA Strategy (022) 30433251 [email protected]
Kushank Poddar Technology (022) 30433203 [email protected] Pankaj Agarwal, CFA Banking / Financial Services (022) 30433206 [email protected]
Paresh Dave, CFA Healthcare (022) 30433212 [email protected]
Parita Ashar, CFA Metals & Mining (022) 30433223 [email protected]
Prashant Mittal, CFA Derivatives (022) 30433218 [email protected]
Rahil Shah Banking / Financial Services (022) 30433217 [email protected]
Rakshit Ranjan, CFA Consumer (022) 30433201 [email protected]
Ravi Singh Banking / Financial Services (022) 30433181 [email protected]
Ritesh Gupta, CFA Oil & Gas / Chemicals / Agri Inputs (022) 30433242 [email protected]
Ritesh Vaidya, CFA Consumer (022) 30433246 [email protected] Ritika Mankar Mukherjee, CFA Economy / Strategy (022) 30433175 [email protected]
Ritu Modi Automobile (022) 30433292 [email protected]
Sagar Rastogi Technology (022) 30433291 [email protected]
Sumit Shekhar Economy / Strategy (022) 30433229 [email protected]
Utsav Mehta, CFA E&C / Industrials (022) 30433209 [email protected]
Vivekanand Subbaraman, CFA Media (022) 30433261 [email protected]
Sales
Name Regions Desk-Phone E-mail
Sarojini Ramachandran - Head of Sales UK +44 (0) 20 7614 8374 [email protected]
Dharmen Shah India / Asia (022) 30433289 [email protected]
Dipti Mehta India / USA (022) 30433053 [email protected]
Hitakshi Mehra India (022) 30433204 [email protected]
Krishnan V India / Asia (022) 30433295 [email protected]
Nityam Shah, CFA USA / Europe (022) 30433259 [email protected]
Parees Purohit, CFA UK / USA (022) 30433169 [email protected]
Praveena Pattabiraman India / Asia (022) 30433268 [email protected]
Shaleen Silori India (022) 30433256 [email protected]
Singapore
Pramod Gubbi, CFA – Director Singapore +65 8606 6476 [email protected]
Shashank Abhisheik Singapore +65 6536 1935 [email protected]
USA / Canada
Ravilochan Pola - CEO Americas +1(646) 361 3107 [email protected]
Production
Sajid Merchant Production (022) 30433247 [email protected]
Sharoz G Hussain Production (022) 30433183 [email protected]
Jestin George Editor (022) 30433272 [email protected]
Nikhil Pillai Database (022) 30433265 [email protected]
E&C = Engineering & Construction

Strategy
March 23, 2016 Ambit Capital Pvt. Ltd. Page 44
IPCA Laboratories Ltd (IPCA IN, NOT RATED)
Source: Bloomberg, Ambit Capital research
Sun Pharmaceutical (SUNP IN, NOT RATED)
Source: Bloomberg, Ambit Capital research
Tata Motors (TTMT IN, BUY)
Source: Bloomberg, Ambit Capital research
Nestle India Ltd (NEST IN, SELL)
Source: Bloomberg, Ambit Capital research
Gail India Ltd (GAIL IN, SELL)
Source: Bloomberg, Ambit Capital research
Bharat Petroleum Corp Ltd (BPCL IN, BUY)
Source: Bloomberg, Ambit Capital research
0
200
400
600
800
1,000
Mar
-13
Jun-
13
Sep-
13
Dec
-13
Mar
-14
Jun-
14
Sep-
14
Dec
-14
Mar
-15
Jun-
15
Sep-
15
Dec
-15
Mar
-16
IPCA LABORATORIES LTD
0200400600800
1,0001,2001,400
Mar
-13
Jun-
13
Sep-
13
Dec
-13
Mar
-14
Jun-
14
Sep-
14
Dec
-14
Mar
-15
Jun-
15
Sep-
15
Dec
-15
Mar
-16
SUN PHARMACEUTICAL INDUS
0
100200300400
500600700
Jan-
13
Apr
-13
Jul-
13
Oct
-13
Jan-
14
Apr
-14
Jul-
14
Oct
-14
Jan-
15
Apr
-15
Jul-
15
Oct
-15
Jan-
16
TATA MOTORS LTD
01,0002,0003,0004,0005,0006,0007,0008,000
Mar
-13
Jun-
13
Sep-
13
Dec
-13
Mar
-14
Jun-
14
Sep-
14
Dec
-14
Mar
-15
Jun-
15
Sep-
15
Dec
-15
Mar
-16
NESTLE INDIA LTD
0
100
200
300
400
500
600
Mar
-13
Jun-
13
Sep-
13
Dec
-13
Mar
-14
Jun-
14
Sep-
14
Dec
-14
Mar
-15
Jun-
15
Sep-
15
Dec
-15
Mar
-16
GAIL INDIA LTD
0
200
400
600
800
1,000
1,200
Mar
-13
Jun-
13
Sep-
13
Dec
-13
Mar
-14
Jun-
14
Sep-
14
Dec
-14
Mar
-15
Jun-
15
Sep-
15
Dec
-15
Mar
-16
BHARAT PETROLEUM CORP LTD

Strategy
March 23, 2016 Ambit Capital Pvt. Ltd. Page 45
Gujarat Nre Coke Ltd (GNC IN, NOT RATED)
Source: Bloomberg, Ambit Capital research
Hero Motocorp (HMCL IN, SELL)
Source: Bloomberg, Ambit Capital research
Indian Oil Corp Ltd (IOCL IN, BUY)
Source: Bloomberg, Ambit Capital research
Ambuja Cements Ltd (ACEM IN, BUY)
Source: Bloomberg, Ambit Capital research
Tata Steel Ltd (TATA IN, SELL)
Source: Bloomberg, Ambit Capital research
Bharat Electronics Ltd (BHE IN, BUY)
Source: Bloomberg, Ambit Capital research
0
5
10
15
20
Mar
-13
Jun-
13
Sep-
13
Dec
-13
Mar
-14
Jun-
14
Sep-
14
Dec
-14
Mar
-15
Jun-
15
Sep-
15
Dec
-15
GUJARAT NRE COKE LTD
0500
1,0001,5002,0002,5003,0003,500
Mar
-13
Jun-
13
Sep-
13
Dec
-13
Mar
-14
Jun-
14
Sep-
14
Dec
-14
Mar
-15
Jun-
15
Sep-
15
Dec
-15
Mar
-16
HERO MOTOCORP LTD
0
100
200
300
400
500
Mar
-13
Jun-
13
Sep-
13
Dec
-13
Mar
-14
Jun-
14
Sep-
14
Dec
-14
Mar
-15
Jun-
15
Sep-
15
Dec
-15
Mar
-16
INDIAN OIL CORP LTD
0
50
100
150
200
250
300
Mar
-13
Jun-
13
Sep-
13
Dec
-13
Mar
-14
Jun-
14
Sep-
14
Dec
-14
Mar
-15
Jun-
15
Sep-
15
Dec
-15
Mar
-16
AMBUJA CEMENTS LTD
0100200300400500600700
Mar
-13
Jun-
13
Sep-
13
Dec
-13
Mar
-14
Jun-
14
Sep-
14
Dec
-14
Mar
-15
Jun-
15
Sep-
15
Dec
-15
Mar
-16
TATA STEEL LTD
0200400600800
1,0001,2001,4001,600
Mar
-13
Jun-
13
Sep-
13
Dec
-13
Mar
-14
Jun-
14
Sep-
14
Dec
-14
Mar
-15
Jun-
15
Sep-
15
Dec
-15
Mar
-16
BHARAT ELECTRONICS LTD

Strategy
March 23, 2016 Ambit Capital Pvt. Ltd. Page 46
Bharat Heavy Electricals (BHEL IN, SELL)
Source: Bloomberg, Ambit Capital research
ACC Ltd (ACC IN, BUY)
Source: Bloomberg, Ambit Capital research
Steel Authority Of India (SAIL IN, SELL)
Source: Bloomberg, Ambit Capital research
Thermax Ltd (TMX IN, SELL)
Source: Bloomberg, Ambit Capital research
Bosch Ltd (BOS IN, NOT RATED)
Source: Bloomberg, Ambit Capital research
Sanofi India Ltd (SANL IN, NOT RATED)
Source: Bloomberg, Ambit Capital research
050
100150200250300350
Mar
-13
Jun-
13
Sep-
13
Dec
-13
Mar
-14
Jun-
14
Sep-
14
Dec
-14
Mar
-15
Jun-
15
Sep-
15
Dec
-15
Mar
-16
BHARAT HEAVY ELECTRICALS
0
500
1,000
1,500
2,000
Mar
-13
Jun-
13
Sep-
13
Dec
-13
Mar
-14
Jun-
14
Sep-
14
Dec
-14
Mar
-15
Jun-
15
Sep-
15
Dec
-15
Mar
-16
ACC LTD
0
20
40
60
80
100
120
Mar
-13
Jun-
13
Sep-
13
Dec
-13
Mar
-14
Jun-
14
Sep-
14
Dec
-14
Mar
-15
Jun-
15
Sep-
15
Dec
-15
Mar
-16
STEEL AUTHORITY OF INDIA
0200400600800
1,0001,2001,400
Mar
-13
Jun-
13
Sep-
13
Dec
-13
Mar
-14
Jun-
14
Sep-
14
Dec
-14
Mar
-15
Jun-
15
Sep-
15
Dec
-15
Mar
-16
THERMAX LTD
0
5,000
10,000
15,000
20,000
25,000
30,000
Mar
-13
Jun-
13
Sep-
13
Dec
-13
Mar
-14
Jun-
14
Sep-
14
Dec
-14
Mar
-15
Jun-
15
Sep-
15
Dec
-15
BOSCH LTD
0
1,000
2,000
3,000
4,000
5,000
Mar
-13
Jun-
13
Sep-
13
Dec
-13
Mar
-14
Jun-
14
Sep-
14
Dec
-14
Mar
-15
Jun-
15
Sep-
15
Dec
-15
SANOFI INDIA LTD

Strategy
March 23, 2016 Ambit Capital Pvt. Ltd. Page 47
Monsanto India Ltd (MCHM IN, NOT RATED)
Source: Bloomberg, Ambit Capital research
Gujarat Alkalies & Chemicals (GALK IN, NOT RATED)
Source: Bloomberg, Ambit Capital research
JSW Steel Ltd (JSTL IN, NOT RATED)
Source: Bloomberg, Ambit Capital research
Essar Ports Ltd (ESRS IN, NOT RATED)
Source: Bloomberg, Ambit Capital research
Great Eastern Shipping (GESCO IN, NOT RATED)
Source: Bloomberg, Ambit Capital research
Mahindra & Mahindra Ltd (MM IN, NOT RATED)
Source: Bloomberg, Ambit Capital research
0500
1,0001,5002,0002,5003,0003,5004,000
Mar
-13
Jun-
13
Sep-
13
Dec
-13
Mar
-14
Jun-
14
Sep-
14
Dec
-14
Mar
-15
Jun-
15
Sep-
15
Dec
-15
MONSANTO INDIA LTD
0
50
100
150
200
250
Mar
-13
Jun-
13
Sep-
13
Dec
-13
Mar
-14
Jun-
14
Sep-
14
Dec
-14
Mar
-15
Jun-
15
Sep-
15
Dec
-15
GUJARAT ALKALIES & CHEMICALS
0200400600800
1,0001,2001,4001,600
Mar
-13
Jun-
13
Sep-
13
Dec
-13
Mar
-14
Jun-
14
Sep-
14
Dec
-14
Mar
-15
Jun-
15
Sep-
15
Dec
-15
JSW STEEL LTD
020406080
100120140160
Mar
-13
Jun-
13
Sep-
13
Dec
-13
Mar
-14
Jun-
14
Sep-
14
Dec
-14
Mar
-15
Jun-
15
Sep-
15
ESSAR PORTS LTD
0
100
200
300
400
500
Mar
-13
Jun-
13
Sep-
13
Dec
-13
Mar
-14
Jun-
14
Sep-
14
Dec
-14
Mar
-15
Jun-
15
Sep-
15
Dec
-15
GREAT EASTERN SHIPPING CO
0200400600800
1,0001,2001,4001,600
Mar
-13
Jun-
13
Sep-
13
Dec
-13
Mar
-14
Jun-
14
Sep-
14
Dec
-14
Mar
-15
Jun-
15
Sep-
15
Dec
-15
MAHINDRA & MAHINDRA LTD

Strategy
March 23, 2016 Ambit Capital Pvt. Ltd. Page 48
Glaxosmithkline Pharmaceutic (GLXO IN, NOT RATED)
Source: Bloomberg, Ambit Capital research
Jubilant Life Sciences Ltd (JOL IN, NOT RATED)
Source: Bloomberg, Ambit Capital research
SKF India Ltd (SKF IN, NOT RATED)
Source: Bloomberg, Ambit Capital research
Asahi India Glass Ltd (AISG IN, NOT RATED)
Source: Bloomberg, Ambit Capital research
Bajaj Hindusthan Sugar Ltd (BJH IN, NOT RATED)
Source: Bloomberg, Ambit Capital research
Hindustan Zinc Ltd (HZ IN, NOT RATED)
Source: Bloomberg, Ambit Capital research
0500
1,0001,5002,0002,5003,0003,5004,000
Mar
-13
Jun-
13
Sep-
13
Dec
-13
Mar
-14
Jun-
14
Sep-
14
Dec
-14
Mar
-15
Jun-
15
Sep-
15
Dec
-15
GLAXOSMITHKLINE PHARMACEUTIC
0
100
200
300
400
500
Mar
-13
Jun-
13
Sep-
13
Dec
-13
Mar
-14
Jun-
14
Sep-
14
Dec
-14
Mar
-15
Jun-
15
Sep-
15
Dec
-15
JUBILANT LIFE SCIENCES LTD
0200400600800
1,0001,2001,4001,600
Mar
-13
Jun-
13
Sep-
13
Dec
-13
Mar
-14
Jun-
14
Sep-
14
Dec
-14
Mar
-15
Jun-
15
Sep-
15
Dec
-15
SKF INDIA LTD
0
50
100
150
200
Mar
-13
Jun-
13
Sep-
13
Dec
-13
Mar
-14
Jun-
14
Sep-
14
Dec
-14
Mar
-15
Jun-
15
Sep-
15
Dec
-15
ASAHI INDIA GLASS LTD
05
101520253035
Mar
-13
Jun-
13
Sep-
13
Dec
-13
Mar
-14
Jun-
14
Sep-
14
Dec
-14
Mar
-15
Jun-
15
Sep-
15
Dec
-15
BAJAJ HINDUSTHAN SUGAR LTD
0
50
100
150
200
Mar
-13
Jun-
13
Sep-
13
Dec
-13
Mar
-14
Jun-
14
Sep-
14
Dec
-14
Mar
-15
Jun-
15
Sep-
15
Dec
-15
HINDUSTAN ZINC LTD

Strategy
March 23, 2016 Ambit Capital Pvt. Ltd. Page 49
Siemens Ltd (SIEM IN, NOT RATED)
Source: Bloomberg, Ambit Capital research
Vedanta Ltd (VEDL IN, NOT RATED)
Source: Bloomberg, Ambit Capital research
ABB IN India Ltd (ABB IN, NOT RATED)
Source: Bloomberg, Ambit Capital research
BEML Ltd (BEML IN, NOT RATED)
Source: Bloomberg, Ambit Capital research
Chennai Petroleum Corp Ltd (MRL IN, NOT RATED)
Source: Bloomberg, Ambit Capital research
Jaiprakash Associates Ltd (JPA IN, NOT RATED)
Source: Bloomberg, Ambit Capital research
0200400600800
1,0001,2001,4001,6001,800
Mar
-13
Jun-
13
Sep-
13
Dec
-13
Mar
-14
Jun-
14
Sep-
14
Dec
-14
Mar
-15
Jun-
15
Sep-
15
Dec
-15
SIEMENS LTD
050
100150200250300350
Mar
-13
Jun-
13
Sep-
13
Dec
-13
Mar
-14
Jun-
14
Sep-
14
Dec
-14
Mar
-15
Jun-
15
Sep-
15
Dec
-15
VEDANTA LTD
0200400600800
1,0001,2001,4001,600
Mar
-13
Jun-
13
Sep-
13
Dec
-13
Mar
-14
Jun-
14
Sep-
14
Dec
-14
Mar
-15
Jun-
15
Sep-
15
Dec
-15
ABB INDIA LTD
0200400600800
1,0001,2001,4001,6001,800
Mar
-13
Jun-
13
Sep-
13
Dec
-13
Mar
-14
Jun-
14
Sep-
14
Dec
-14
Mar
-15
Jun-
15
Sep-
15
Dec
-15
BEML LTD
0
50
100
150
200
250
300
Mar
-13
Jun-
13
Sep-
13
Dec
-13
Mar
-14
Jun-
14
Sep-
14
Dec
-14
Mar
-15
Jun-
15
Sep-
15
Dec
-15
CHENNAI PETROLEUM CORP LTD
0
20
40
60
80
100
Mar
-13
Jun-
13
Sep-
13
Dec
-13
Mar
-14
Jun-
14
Sep-
14
Dec
-14
Mar
-15
Jun-
15
Sep-
15
Dec
-15
JAIPRAKASH ASSOCIATES LTD

Strategy
March 23, 2016 Ambit Capital Pvt. Ltd. Page 50
Explanation of Investment Rating
Investment Rating Expected return (over 12-month)
BUY >10%
SELL <10%
NO STANCE We have forward looking estimates for the stock but we refrain from assigning valuation and recommendation
UNDER REVIEW We will revisit our recommendation, valuation and estimates on the stock following recent events
NOT RATED We do not have any forward looking estimates, valuation or recommendation for the stock Disclaimer
This report or any portion hereof may not be reprinted, sold or redistributed without the written consent of Ambit Capital . AMBIT Capital Research is disseminated and available primarily electronically, and, in some cases,
in printed form.
Additional information on recommended securities is available on request.
Disclaimer
1. AMBIT Capital Private Limited (“AMBIT Capital”) and its affiliates are a full service, integrated investment banking, investment advisory and brokerage group. AMBIT Capital is a Stock Broker, Portfolio Manager and Depository Participant regis tered with Securities and Exchange Board of India Limited (SEBI) and is regulated by SEBI
2. AMBIT Capital makes bes t endeavours to ensure that the research analyst(s ) use current, reliable, comprehensive information and obtain such information from sources which the analyst(s) believes to be reliable. However, such information has not been independently veri fied by AMBIT Capital and/or the analys t(s ) and no representation or warranty, express or implied, is made as to the accuracy or completeness of any information obtained from third parties . The information, opinions, views expressed in this Research Report are those of the research analys t as at the date of this Research Report which are subject to change and do not represent to be an authority on the subject. AMBIT Capital may or may not subscribe to any and/ or all the views expressed herein.
3. This Research Report should be read and relied upon at the sole discretion and risk of the recipient. If you are dissatisfied with the contents of this complimentary Research Report or with the terms of this Disclaimer, your sole and exclusive remedy is to stop using this Research Report and AMBIT Capital or its affiliates shall not be responsible and/ or liable for any direct/consequential loss howsoever directly or indirectly, from any use of this Research Report.
4. If this Research Report is received by any client of AMBIT Capital or i ts affiliate, the relationship of AMBIT Capital/i ts affiliate with such client will continue to be governed by the terms and conditions in place between AMBIT Capital/ such affiliate and the client.
5. This Research Report is issued for information only and the 'Buy', 'Sell' , or ‘Other Recommendation’ made in this Research Report such should not be cons trued as an inves tment advice to any recipient to acquire, subscribe, purchase, sell , dispose of, retain any securities and should not be intended or treated as a substi tute for necessary review or validation or any professional advice. Recipients should consider this Research Report as only a single factor in making any investment decisions . This Research Report is not an offer to sell or the solici tation of an offer to purchase or subscribe for any investment or as an official endorsement of any investment.
6. This Research Report is being supplied to you solely for your information and may not be reproduced, redis tributed or passed on, directly or indirectly, to any other person or published, copied in whole or in part, for any purpose. Neither this Research Report nor any copy of i t may be taken or transmitted or distributed, directly or indirectly within India or into any other country including United States (to US Persons), Canada or Japan or to any resident thereof. The distribution of this Research Report in other jurisdictions may be strictly res tricted and/ or prohibited by law or contract, and persons into whose possession this Research Report comes should inform themselves about such restriction and/ or prohibition, and observe any such restrictions and/ or prohibition.
7. Ambit Capital Private Limited is regis tered as a Research Enti ty under the SEBI (Research Analysts ) Regulations, 2014. SEBI Reg.No.- INH000000313. Conflict of Interests
8. In the normal course of AMBIT Capital ’s business circumstances may arise that could result in the interests of AMBIT Capital conflicting with the interests of clients or one client’s interes ts conflicting with the interest of another client. AMBIT Capital makes bes t efforts to ensure that conflicts are identi fied and managed and that clients ’ interes ts are protected. AMBIT Capital has policies and procedures in place to control the flow and use of non-public, price sensitive information and employees’ personal account trading. Where appropriate and reasonably achievable, AMBIT Capital segregates the activities of staff working in areas where conflicts of interest may arise. However, clients/potential clients of AMBIT Capital should be aware of these possible conflicts of interests and should make informed decisions in relation to AMBIT Capital’s services .
9. AMBIT Capital and/or its affiliates may from time to time have or solicit inves tment banking, investment advisory and other business relationships with companies covered in this Research Report and may receive compensation for the same.
Additional Disclaimer for U.S. Persons
10. The research report is solely a product of AMBIT Capital
11. AMBIT Capital is the employer of the research analyst(s) who has prepared the research report
12. Any subsequent transactions in securities discussed in the research reports should be effected through Enclave Capital LLC. (“Enclave”).
13. Enclave does not accept or receive any compensation of any kind for the dissemination of the AMBIT Capital research reports .
14. The research analyst(s) preparing the email / Research Report/ attachment is resident outside the United States and is/are not associated persons of any U.S. regulated broker-dealer and that therefore the analyst(s ) is/are not subject to supervision by a U.S. broker-dealer, and is/are not required to satisfy the regulatory licensing requirements of FINRA or required to otherwise comply with U.S. rules or regulations regarding, among other things, communications with a subject company, public appearances and trading securi ties held by a research analyst account.
15. This report is prepared, approved, published and distributed by the Ambit Capital located outside of the United States (a non-US Group Company”). This report is dis tributed in the U.S.by Enclave Capital LLC, a U.S. regis tered broker dealer, on behalf of Ambit Capital only to major U.S. ins titutional investors (as defined in Rule 15a-6 under the U.S. Securi ties Exchange Act of 1934 (the “Exchange Act”)) pursuant to the exemption in Rule 15a-6 and any transaction effected by a U.S. customer in the securi ties described in this report must be effected through Enclave Capital LLC (19 West 44th Street, suite 1700, New York, NY 10036).
16. As of the publication of this report Enclave Capital LLC, does not make a market in the subject securi ties. 17. This document does not cons titute an offer of, or an invi tation by or on behalf of Ambit Capital or its affiliates or any other company to any person, to buy or sell any securi ty. The information contained herein has
been obtained from published information and other sources, which Ambit Capital or i ts Affiliates consider to be reliable. None of Ambit Capital accepts any liability or responsibili ty whatsoever for the accuracy or completeness of any such information. All estimates, expressions of opinion and other subjective judgments contained herein are made as of the date of this document. Emerging securi ties markets may be subject to risks significantly higher than more established markets. In particular, the political and economic environment, company practices and market prices and volumes may be subject to significant variations. The ability to assess such risks may also be limited due to significantly lower information quantity and quality. By accepting this document, you agree to be bound by all the foregoing provisions.
Additional Disclaimer for Canadian Persons
18. AMBIT Capital is not registered in the Province of Ontario and /or Province of Québec to trade in securities and/or to provide advice with respect to securi ties.
19. AMBIT Capital's head office or principal place of business is located in India.
20. All or substantially all of AMBIT Capital's assets may be situated outside of Canada. 21. It may be difficult for enforcing legal rights against AMBIT Capital because of the above.
22. Name and address of AMBIT Capital's agent for service of process in the Province of Ontario is: Torys LLP, 79 Wellington St. W., 30th Floor, Box 270, TD South Tower, Toronto, Ontario M5K 1N2 Canada.
23. Name and address of AMBIT Capital's agent for service of process in the Province of Montréal is Torys Law Firm LLP, 1 Place Ville Marie, Suite 1919 Montréal, Québec H3B 2C3 Canada. Additional Disclaimer for Singapore Persons
24. This Report is prepared and distributed by Ambit Capital Private Limited and dis tributed as per the approved arrangement under Paragraph 9 of Third Schedule of Securities and Futures Act (CAP 289) and Paragraph 11 of the Firs t Schedule to the Financial Advisors Act (CAP 110) provided to Ambit Singapore Pte. Limited by Monetary Authority of Singapore.
25. This Report is only available to persons in Singapore who are insti tutional investors (as defined in section 4A of the Securi ties and Futures Act (Cap. 289) of Singapore (the “SFA”).” Accordingly, if a Singapore Person is not or ceases to be such an ins titutional investor, such Singapore Person must immediately discontinue any use of this Report and inform Ambit Singapore Pte. Limited.
Disclosures 26. The analyst (s ) has/have not served as an officer, director or employee of the subject company. 27. There is no material disciplinary action that has been taken by any regulatory authority impacting equity research analysis activities . 28. All market data included in this report are dated as at the previous s tock market closing day from the date of this report. 29. Ambit and/or its associates have financial interest/equity shareholding in Tata Motors , GAIL, M&M, Siemens, Tata Steel, BHEL, SAIL, ITC, TCS, Lupin & TVS Motor. Analyst Certif ication Each of the analysts identified in this report certi fies , with respect to the companies or securi ties that the individual analyses, that (1) the views expressed in this report reflect his or her personal views about all of the subject companies and securities and (2) no part of his or her compensation was, is or will be directly or indirectly dependent on the specific recommendations or views expressed in this report. © Copyright 2015 AMBIT Capital Private Limited. All rights reserved.
Ambit Capital Pvt. Ltd. Ambit House, 3rd Floor. 449, Senapati Bapat Marg, Lower Parel, Mumbai 400 013, India. Phone: +91-22-3043 3000 | Fax: +91-22-3043 3100 CIN: U74140MH1997PTC107598 www.ambitcapital.com