Embed Size (px)
Citation preview

Research, Development and Technology
MoDOT
RDT 04-001
Strengthening of Martin SpringsOuter Road Bridge, Phelps County
January, 2004
RI 02-007
University of Missouri-Rolla
TECHNICAL REPORT DOCUMENTATION PAGE
1. Report No. RDT04-001
2. Government Accession No.
3. Recipient’s Catalog No.
5. Report Date January 2003
4. Title and Subtitle Strengthening of Martin Springs Outer Road Bridge, Phelps County
6. Performing Organization Code UMR
7. Author/s N. Galati, P. Casadei, and A. Nanni
8. Performing Organization Report No. RI02-007 10. Work Unit No. (TRAIS)
9. Performing Organization Name and Address Center for Infrastructure Engineering Studies University of Missouri - Rolla 223 ERL Rolla, MO 65409
11. Contract or Grant No.
13. Type of report and period covered
12. Sponsoring Organization Name and Address MODOT Research Development and Technology 1617 Missouri Blvd., Jefferson City, MO 65109 University TC 223 Engineering Research Lab., Rolla, MO 65409
14. Sponsoring Agency Code MoDOT
15. Supplementary Notes This investigation was conducted in cooperation with the U.S. Department of Transportation. 16. Abstract This report presents the use of externally bonded fiber reinforced polymers (FRP) laminates and near surface mounted FRP bars for the flexural strengthening of a concrete bridge. The bridge selected for this project is a three-span simply supported reinforced concrete slab with no transverse steel reinforcement, load posted and located on Martin Spring Outer Road in Phelps County, MO. The original construction combined with the presence of very rigid parapets caused the formation of a wide longitudinal crack which resulted in the slab to behave as two separate elements. The structural behavior was verified implementing the bridge model in a FEM program. The bridge analysis was performed for maximum loads determined in accordance to AASHTO 17th edition. The strengthening scheme was designed in compliance with the ACI 440.2R-02 design guide for externally bonded FRP materials, to avoid further cracking and such that the transverse flexural capacity be higher than the cracking moment. Both FRP strengthening techniques were easily implemented and showed satisfactory performance. An initial load test, to evaluate the structural behavior, was performed prior the strengthening following the AASHTO specifications. The retrofitting of the structure was employed in the summer of 2002, after the major cracks were injected to allow continuity in the cross section. Once the repair work was completed, another load test, identical in procedure to the previous one, was performed to evaluate the efficiency of the strengthening. As a result of this testing, and a report based on this testing by an independent consultant, the load posting of the bridge was removed. A third and last load test was performed in summer 2003, 12 months after the strengthening was finished, to evaluate the long term behavior of the bridge and to investigate whether any type of degradation occurred during the elapsed period. Comparison of the results of the last two load tests showed no significant degradation occurred during the 12 months period. Further, no more cracking was noted in the concrete deck as a result of the strengthening program.
17. Key Words Bridge, carbon fibers, FEM, fiber reinforced polymers, load test, reinforced concrete, strengthening.
18. Distribution Statement No restrictions. This document is available to the public through NTIC, Springfield, VA 22161
19. Security Classification (of this report) Unclassified
20. Security Classification (of this page) Unclassified
21. No. of Pages 36
Form DOT F 1700.7 (8-72) Reproduction of form and completed page is authorized

STRENGTHENING OF MARTIN SPRINGS OUTER ROAD BRIDGE, PHELPS COUNTY
by
Nestore Galati Paolo Casadei Antonio Nanni
January 30, 2004
CIES 04-48
CENTER FOR INFRASTRUCTURE ENGINEERING STUDIES

DISCLAIMER
The contents of this report reflect the views of the author(s), who are responsible
for the facts and the accuracy of information presented herein. This document is
disseminated under the sponsorship of the Center for Infrastructure Engineering
Studies (CIES), University of Missouri-Rolla, in the interest of information
exchange. CIES assumes no liability for the contents or use thereof.

II
The mission of CIES is to provide leadership in research and education for solving society's problems affecting the nation's infrastructure systems. CIES is the primary conduit for communication among those on the UMR campus interested in infrastructure studies and provides coordination for collaborative efforts. CIES activities include interdisciplinary research and development with projects tailored to address needs of federal agencies, state agencies, and private industry as well as technology transfer and continuing/distance education to the engineering community and industry.
Center for Infrastructure Engineering Studies (CIES) University of Missouri-Rolla
223 Engineering Research Laboratory 1870 Miner Circle
Rolla, MO 65409-0710 Tel: (573) 341-4497; fax -6215
E-mail: [email protected] http://www.cies.umr.edu/
III
RESEARCH INVESTIGATION RI03-007
STRENGTHENING OF MARTIN SPRINGS OUTER ROAD BRIDGE, PHELPS COUNTY
PREPARED FOR THE
MISSOURI DEPARTMENT OF TRANSPORTATION
IN COOPERATION WITH THE
U.S. DEPARTMENT OF TRANSPORTATION
Written By:
Nestore Galati, Research Engineer
Paolo Casadei, PhD Candidate
Antonio Nanni, V. & M. Jones Professor
CENTER FOR INFRASTRUCTURE ENGINEERING STUDIES
UNIVERSITY OF MISSOURI – ROLLA
Submitted
November 2003
The opinions, findings and conclusions expressed in this report are those of the principal investigators. They are not necessarily those of the Missouri Department of Transportation, U.S. Department of Transportation, Federal
Highway Administration. This report does not constitute a standard, specification or regulation.
IV
STRENGTHENING OF MARTIN SPRINGS OUTER ROAD BRIDGE,
PHELPS COUNTY
EXECUTIVE SUMMARY
This report presents the use of externally bonded fiber reinforced polymers (FRP) laminates and near surface mounted FRP bars for the flexural strengthening of a concrete bridge. The bridge selected for this project is a three-span simply supported reinforced concrete slab with no transverse steel reinforcement, load posted and located on Martin Spring Outer Road in Phelps County, MO. The original construction combined with the presence of very rigid parapets caused the formation of a wide longitudinal crack which resulted in the slab to behave as two separate elements. The structural behavior was verified implementing the bridge model in a FEM program.
The bridge analysis was performed for maximum loads determined in accordance to AASHTO 17th edition. The strengthening scheme was designed in compliance with the ACI 440.2R-02 design guide for externally bonded FRP materials, to avoid further cracking and such that the transverse flexural capacity be higher than the cracking moment. Both FRP strengthening techniques were easily implemented and showed satisfactory performance. An initial load test, to evaluate the structural behavior, was performed prior the strengthening following the AASHTO specifications.
The retrofitting of the structure was employed in the summer of 2002, after the major cracks were injected to allow continuity in the cross section. Once the repair work was completed, another load test, identical in procedure to the previous one, was performed to evaluate the efficiency of the strengthening. As a result, the load posting of the bridge was removed. A third and last load test was performed in summer 2003, 12 months after the strengthening was finished, to evaluate the long term behavior of the bridge and to investigate whether any type of degradation occurred during the elapsed period. Comparison of the results of the last two load tests showed no significant degradation occurred during the 12 months period. Further, no more cracking was noted in the concrete deck as a result of the strengthening program.

V
ACKNOWLEDGMENTS
The project was made possible with the financial support received from the Missouri Department of Transportation, UMR - University Transportation Center on Advanced Materials. Master Contractors installed the FRP systems. Hughes Brothers Inc. and Master Builders provided the FRP materials.
Phelps County’s commissioners and staff provided the opportunity and helped in the implementation.
VI
TABLE OF CONTENTS
TABLE OF CONTENTS.................................................................................................. VI LIST OF FIGURES .........................................................................................................VII LIST OF TABLES............................................................................................................... I 1. INTRODUCTION ...................................................................................................... 1
1.1 Objectives/technical approach .............................................................................1 1.2 Background & Significance of Work ..................................................................3
1.2.1 FRP Composites ..............................................................................................3 1.2.1.1 Externally Bonded Repair for Flexural Strengthening ...................................... 3 1.2.1.2 Near-Surface Mounted (NSM) FRP for Flexural Strengthening....................... 3
2. BRIDGE ANALYSIS................................................................................................. 4 2.1 Load Combinations..............................................................................................4 2.2 Design Truck and Design Lanes ..........................................................................4 2.3 Slab Analysis .......................................................................................................6
3. BRIDGE STRENTHENING ...................................................................................... 8 3.1 Externally Bonded CFRP Laminates .................................................................10 3.2 Near Surface Mounted Rectangular Bars ..........................................................11
4. FIELD EVALUATION ............................................................................................ 13 5. ADDITIONAL LOAD TEST ................................................................................... 16 6. FEM ANALYSIS...................................................................................................... 18 7. LOAD RATING ....................................................................................................... 21 8. REPORT BY INDIPENDENT CONSULTANT ..................................................... 23 9. CONCLUSIONS....................................................................................................... 23 10. REFERENCES ..................................................................................................... 24 APPENDIX I .................................................................................................................... 26 APPENDIX II ................................................................................................................... 57
VII
LIST OF FIGURES
Figure 1-1 – Martin Springs Bridge................................................................................................ 1
Figure 1-2 - Martin Spring Bridge Geometry ................................................................................. 2
Figure 1-3 - Soffit Slab Longitudinal Crack ................................................................................... 2
Figure 2-1 - Truck Loading............................................................................................................. 5
Figure 2-2 - Truck Load and Truck Lanes...................................................................................... 5
Figure 2-3 - Loading Conditions..................................................................................................... 5
Figure 2-4 - Flexural Design Configuration ................................................................................... 6
Figure 2-5 - Shear Design Configuration........................................................................................ 6
Figure 3-1 – Repair of Central Crack ............................................................................................ 9
Figure 3-2 – Strengthening with Laminates on Span 1 and 3...................................................... 10
Figure 3-3 – Phases of CFRP Laminate Application.................................................................. 11
Figure 3-4 – Strengthening with NSM Bars and CFRP Laminate on Span 2............................... 12
Figure 3-5 – Phases of NSM Bar Application ............................................................................. 12
Figure 4-1 – Load Test with H20 Truck ....................................................................................... 13
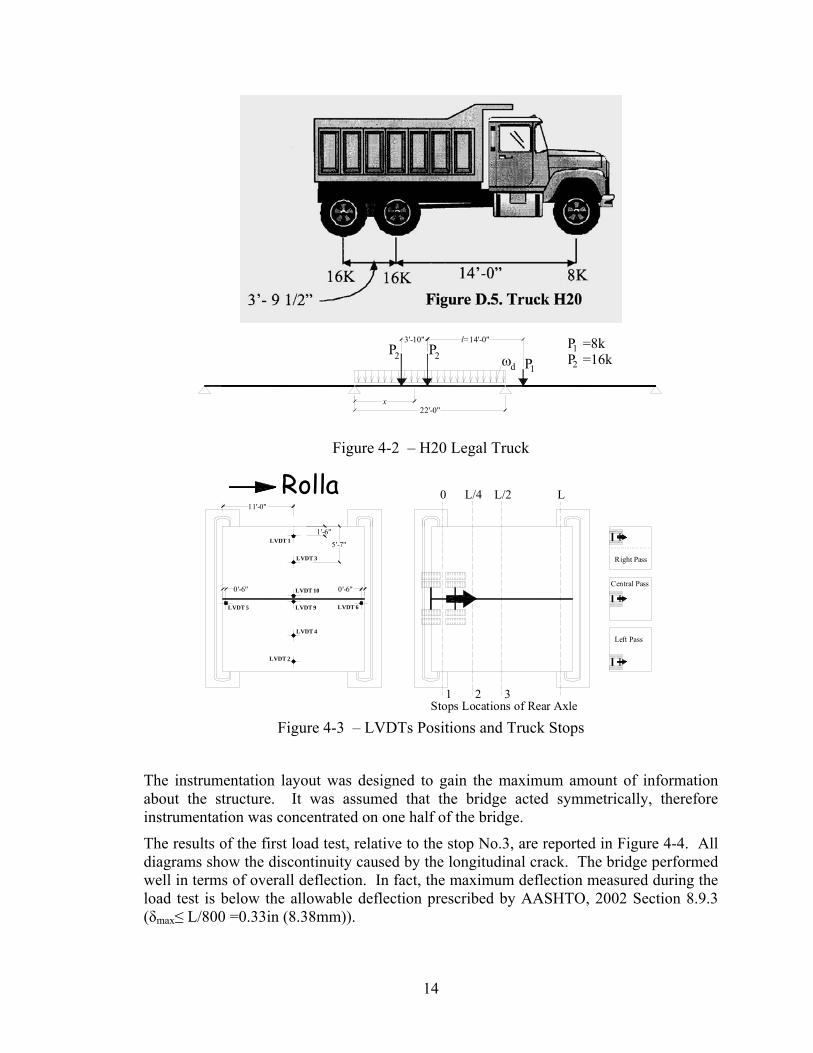
Figure 4-2 – H20 Legal Truck ..................................................................................................... 14
Figure 4-3 – LVDTs Positions and Truck Stops.......................................................................... 14
Figure 4-4 – Mid Span Deflection in the Transverse Direction, Stop No.3 ................................ 15
Figure 4-5 – Center Line Deflection in the Longitudinal Direction, Stop No.3........................... 15
Figure 4-6 – Mid Span Deflection in the Transverse Direction, Stop No.3 ................................. 16
Figure 5-1 –Mid Span Deflection in the Transverse Direction, Central Pass, Stop No.3 ........... 17
Figure 5-2– Mid Span Deflection in the Transverse Direction, Left Pass, Stop No.3.................. 17
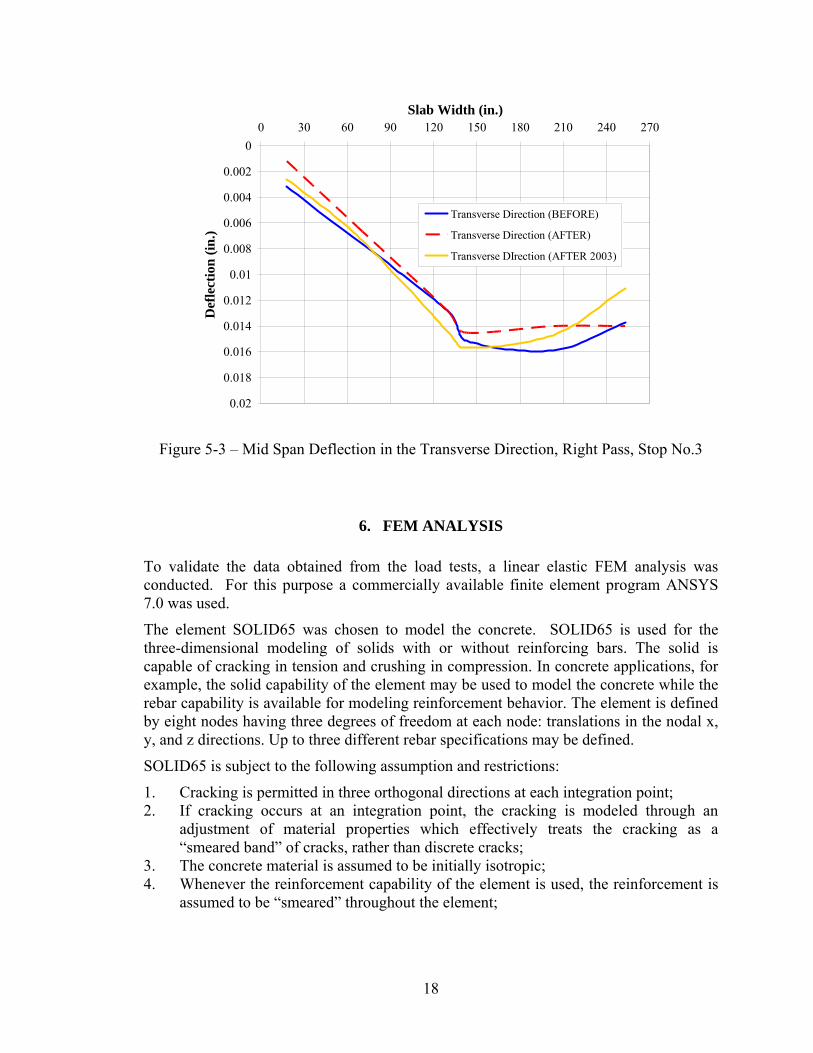
Figure 5-3 – Mid Span Deflection in the Transverse Direction, Right Pass, Stop No.3 .............. 18
Figure 6-1 – FEM Model Geometry ............................................................................................. 19
Figure 6-2 – Comparison of Experimental and Analytical Results in the Transversal Direction 20
Figure 6-3 – FEM Results of Sx Average Stresses for Axle Position at Stop 3............................ 20
LIST OF TABLES
Table 2-1 -Dead Load (1 k/ft = 14.7 kN/m).................................................................................... 7
Table 2-2 - Flexural and Shear Capacity ........................................................................................ 8
Table 3-1– Properties of CFRP Laminate Constituent Materials ................................................... 9
Table 3-2 – Properties of NSM CFRP Constituent Materials....................................................... 10
Table 7-1 - Maximum Shear and Moment due to Live Load ....................................................... 22
Table 7-2 - Rating Factor for the Slab (Bending Moment) .......................................................... 22
Table 7-3 - Rating Factor for the Slab (Shear) ............................................................................. 22
NOTATIONS
CE environmental reduction factor
Ec longitudinal modulus of elasticity of concrete, psi
Ef longitudinal modulus of elasticity of the longitudinal FRP reinforcement, psi
Es longitudinal modulus of elasticity of the steel reinforcement, psi
f`c concrete compressive strength, psi
f*fu guaranteed tensile strength, ksi
ffu design tensile strength, ks
fy yield stress of the steel shear reinforcement, ksi
Ig gross moment of inertia of the section, in4
I live load impact factor
L span length, ft
Mcr cracking moment of the section, kip-ft
Mn ultimate moment capacity, kip-ft
Mu design moment demand, kip-ft
Pi load on one wheel of the HS20-44 loading truck, kip
Vc concrete contribution to the shear capacity, kip
Vf FRP reinforcement contribution to the shear capacity, kip
βd modification factor based on the ratio of the modulus of the FRP reinforcement to that of steel reinforcement
φ strength reduction factor
φMn design moment capacity, kip-ft
ε*fu guaranteed ultimate strain
εfu design ultimate strain
ρf reinforcement ratio of the FRP-reinforced section
Dω total dead load, lb/ft
uω ultimate values of bending moments and shear forces, lb/ft
1
1. INTRODUCTION
1.1 Objectives/technical approach The overall objective of this research project was to demonstrate the feasibility of externally bonding fiber reinforced polymer (FRP) reinforcement for the flexural strengthening of concrete bridge structures.
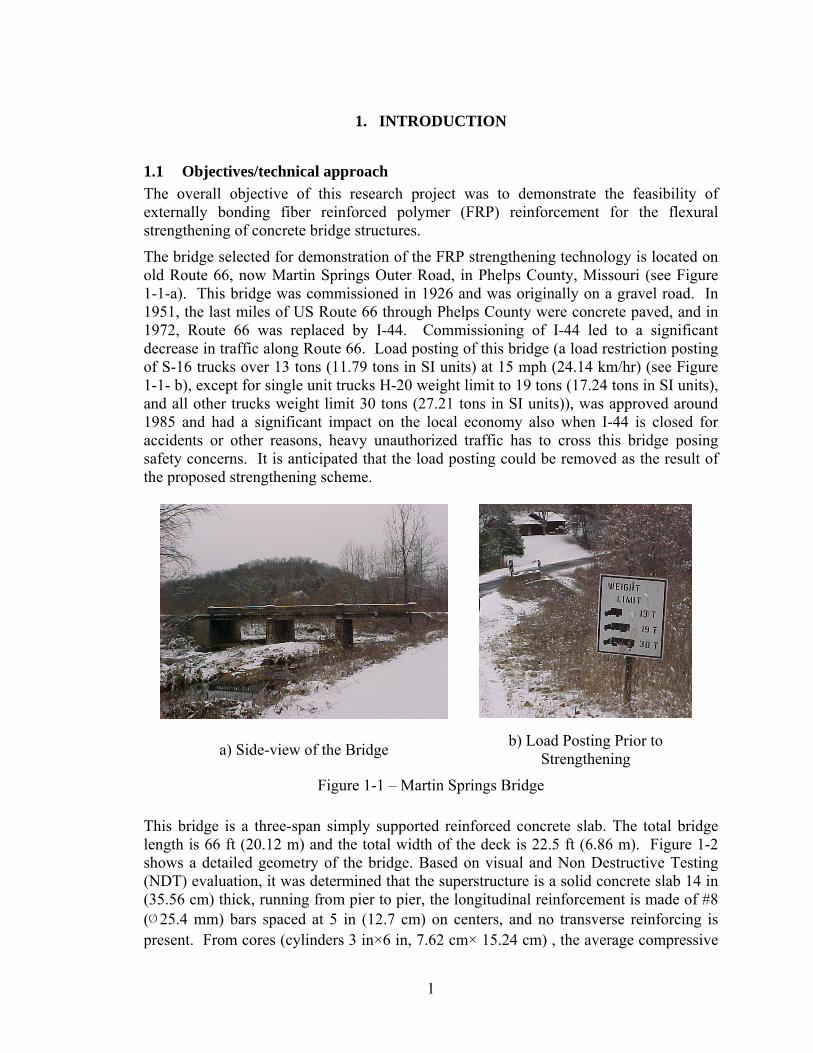
The bridge selected for demonstration of the FRP strengthening technology is located on old Route 66, now Martin Springs Outer Road, in Phelps County, Missouri (see Figure 1-1-a). This bridge was commissioned in 1926 and was originally on a gravel road. In 1951, the last miles of US Route 66 through Phelps County were concrete paved, and in 1972, Route 66 was replaced by I-44. Commissioning of I-44 led to a significant decrease in traffic along Route 66. Load posting of this bridge (a load restriction posting of S-16 trucks over 13 tons (11.79 tons in SI units) at 15 mph (24.14 km/hr) (see Figure 1-1- b), except for single unit trucks H-20 weight limit to 19 tons (17.24 tons in SI units), and all other trucks weight limit 30 tons (27.21 tons in SI units)), was approved around 1985 and had a significant impact on the local economy also when I-44 is closed for accidents or other reasons, heavy unauthorized traffic has to cross this bridge posing safety concerns. It is anticipated that the load posting could be removed as the result of the proposed strengthening scheme.
a) Side-view of the Bridge b) Load Posting Prior to Strengthening
Figure 1-1 – Martin Springs Bridge This bridge is a three-span simply supported reinforced concrete slab. The total bridge length is 66 ft (20.12 m) and the total width of the deck is 22.5 ft (6.86 m). Figure 1-2 shows a detailed geometry of the bridge. Based on visual and Non Destructive Testing (NDT) evaluation, it was determined that the superstructure is a solid concrete slab 14 in (35.56 cm) thick, running from pier to pier, the longitudinal reinforcement is made of #8 (∅25.4 mm) bars spaced at 5 in (12.7 cm) on centers, and no transverse reinforcing is present. From cores (cylinders 3 in×6 in, 7.62 cm× 15.24 cm) , the average compressive
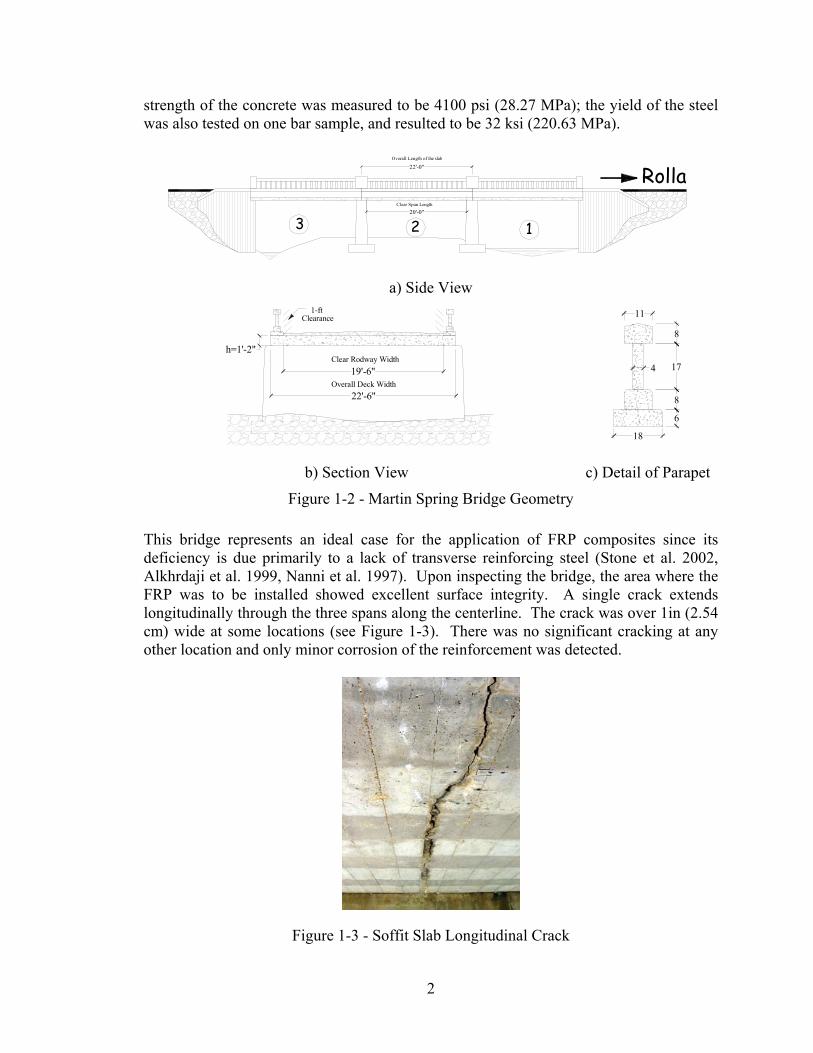
2
strength of the concrete was measured to be 4100 psi (28.27 MPa); the yield of the steel was also tested on one bar sample, and resulted to be 32 ksi (220.63 MPa).
23
Rolla
1
22'-0"
20'-0"
Overall Length of the slab
Clear Span Length
a) Side View
19'-6"
22'-6"
h=1'-2"
Overall Deck Width
Clear Rodway Width
1-ftClearance
18
6
8
17
8
11
4
b) Section View c) Detail of Parapet
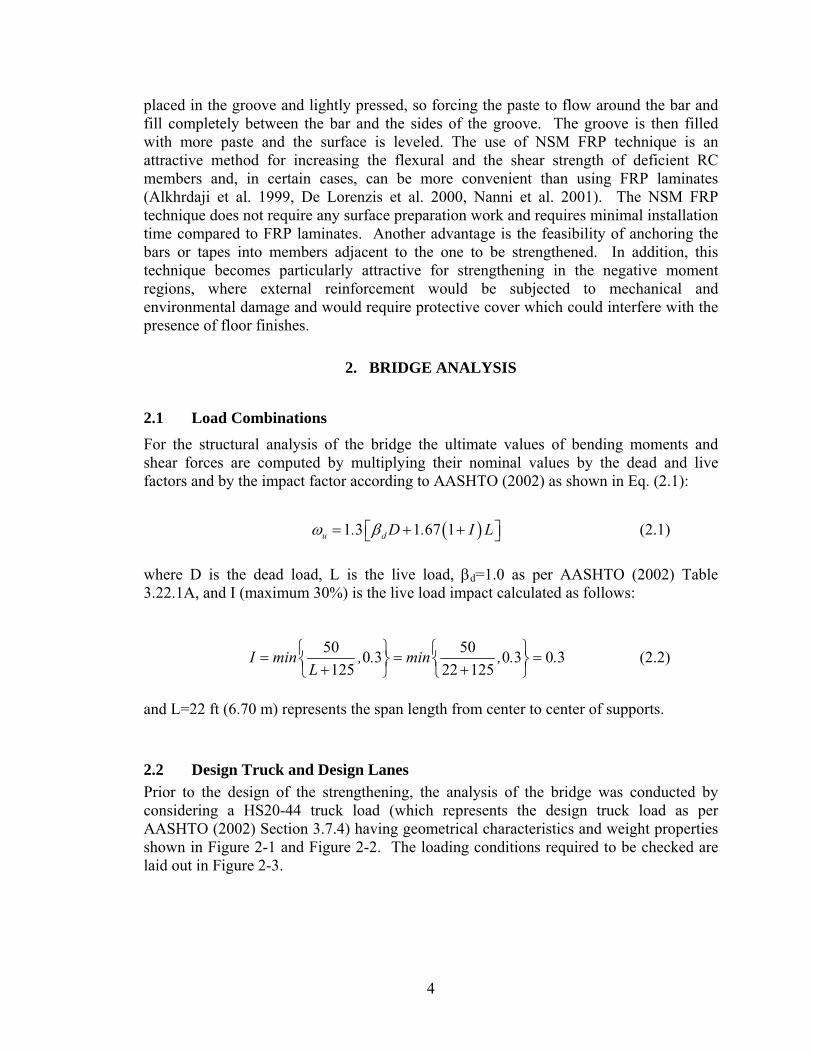
Figure 1-2 - Martin Spring Bridge Geometry This bridge represents an ideal case for the application of FRP composites since its deficiency is due primarily to a lack of transverse reinforcing steel (Stone et al. 2002, Alkhrdaji et al. 1999, Nanni et al. 1997). Upon inspecting the bridge, the area where the FRP was to be installed showed excellent surface integrity. A single crack extends longitudinally through the three spans along the centerline. The crack was over 1in (2.54 cm) wide at some locations (see Figure 1-3). There was no significant cracking at any other location and only minor corrosion of the reinforcement was detected.
Figure 1-3 - Soffit Slab Longitudinal Crack

3
This demonstration consisted of four major tasks, namely:
1. Design of the required transversal reinforcement; 2. On-site load tests before and after strengthening to demonstrate the effectiveness of
the FRP reinforcement; 3. Field construction; and 4. Development of a Finite Element Model to validate the experimental data collected
in the field. It is envisioned that this strengthening technique will lead to a bridge strengthening protocol for consideration by MoDOT for future applications.
1.2 Background & Significance of Work
1.2.1 FRP Composites Fiber-reinforced polymer (FRP) material systems, composed of fibers embedded in a polymeric matrix, exhibit several properties suitable for their use as structural reinforcement (Iyer and Sen 1991, JSCE Sub-Committee on Continuous Fiber Reinforcement 1992, White 1992, Neale and Labossiere 1992, Nanni 1993, Nanni and Dolan 1993, ACI Committee 440 1996, El-Badry 1996, Nanni 1997, Alkhrdaji et al. 1999, De Lorenzis et al. 2000, Nanni 2001). FRP composites are anisotropic and characterized by excellent tensile strength in the direction of the fibers. They do not exhibit yielding, but instead are elastic up to failure. FRP composites are corrosion resistant, and therefore should perform better than other construction materials in terms of weathering behavior. 1.2.1.1 Externally Bonded Repair for Flexural Strengthening Structural retrofit work has come to the forefront of industry practice in response to the problem of aging infrastructure and buildings worldwide. This problem, coupled with revisions in structural codes to better accommodate natural phenomena, creates the need for the development of successful structural retrofit technologies. The most important characteristics of repair-type work are: predominance of labor and shut-down costs as opposed to material costs, time and site constraints, long-term durability, difficulty in methodology selection and design, and effectiveness evaluation. An effective method for upgrading reinforced concrete (RC) members (prestressed and non-prestressed) is plate bonding. In Germany and Switzerland during the mid-80's, replacement of steel with FRP plates began to be viewed as a promising improvement in externally bonded repair. The advantages of FRP versus steel for the reinforcement of concrete structures include lower installation costs, improved corrosion resistance, on-site flexibility of use, and small changes in member size after repair. Of all countries, Japan has seen the largest number of field applications using bonded FRP composites (Nanni 1995). 1.2.1.2 Near-Surface Mounted (NSM) FRP for Flexural Strengthening The use of Near-Surface Mounted (NSM) FRP bars or tapes is emerging as a valid alternative to externally bonded FRP laminates. Embedment of the bars or tapes is achieved by grooving the surface of the member to be strengthened along the desired direction. The groove is filled half way with epoxy paste, the FRP bars/tapes are then
4
placed in the groove and lightly pressed, so forcing the paste to flow around the bar and fill completely between the bar and the sides of the groove. The groove is then filled with more paste and the surface is leveled. The use of NSM FRP technique is an attractive method for increasing the flexural and the shear strength of deficient RC members and, in certain cases, can be more convenient than using FRP laminates (Alkhrdaji et al. 1999, De Lorenzis et al. 2000, Nanni et al. 2001). The NSM FRP technique does not require any surface preparation work and requires minimal installation time compared to FRP laminates. Another advantage is the feasibility of anchoring the bars or tapes into members adjacent to the one to be strengthened. In addition, this technique becomes particularly attractive for strengthening in the negative moment regions, where external reinforcement would be subjected to mechanical and environmental damage and would require protective cover which could interfere with the presence of floor finishes.
2. BRIDGE ANALYSIS
2.1 Load Combinations For the structural analysis of the bridge the ultimate values of bending moments and shear forces are computed by multiplying their nominal values by the dead and live factors and by the impact factor according to AASHTO (2002) as shown in Eq. (2.1):
( )1 3 1 67 1u d. D . I Lω β= + +⎡ ⎤⎣ ⎦ (2.1)
where D is the dead load, L is the live load, βd=1.0 as per AASHTO (2002) Table 3.22.1A, and I (maximum 30%) is the live load impact calculated as follows:
50 500 3 0 3 0 3125 22 125
I min , . min , . .L
⎧ ⎫ ⎧ ⎫= = =⎨ ⎬ ⎨ ⎬+ +⎩ ⎭ ⎩ ⎭ (2.2)
and L=22 ft (6.70 m) represents the span length from center to center of supports.
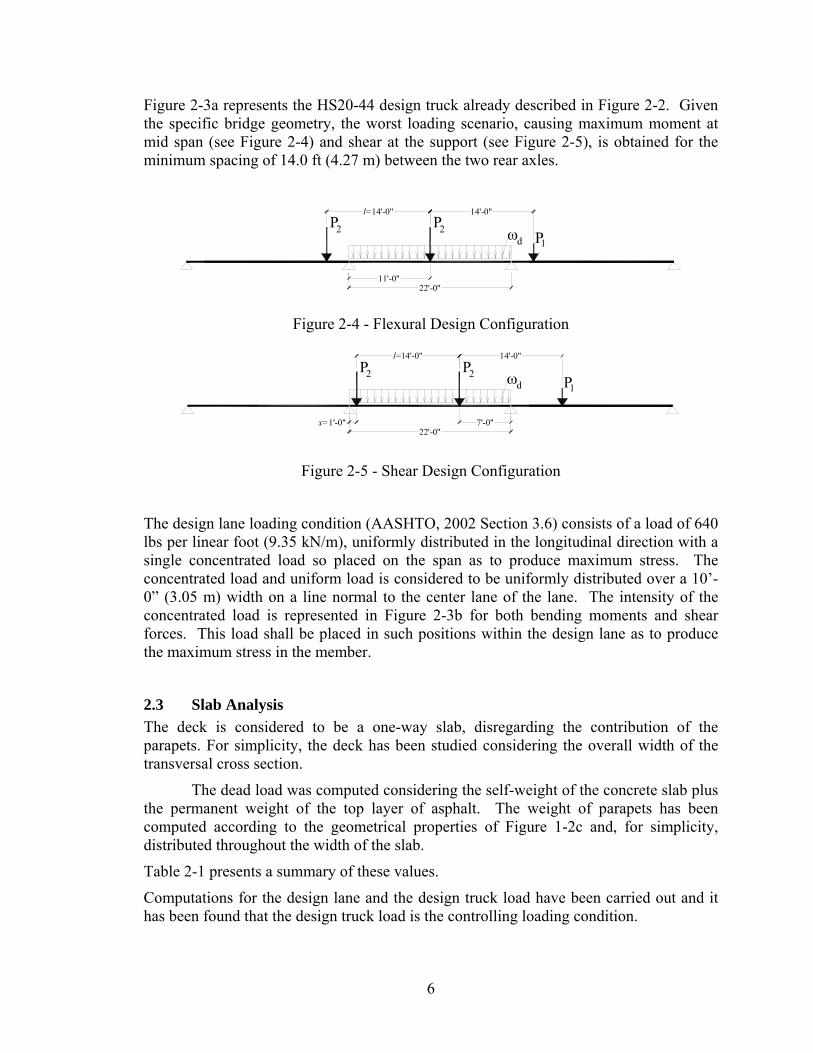
2.2 Design Truck and Design Lanes Prior to the design of the strengthening, the analysis of the bridge was conducted by considering a HS20-44 truck load (which represents the design truck load as per AASHTO (2002) Section 3.7.4) having geometrical characteristics and weight properties shown in Figure 2-1 and Figure 2-2. The loading conditions required to be checked are laid out in Figure 2-3.
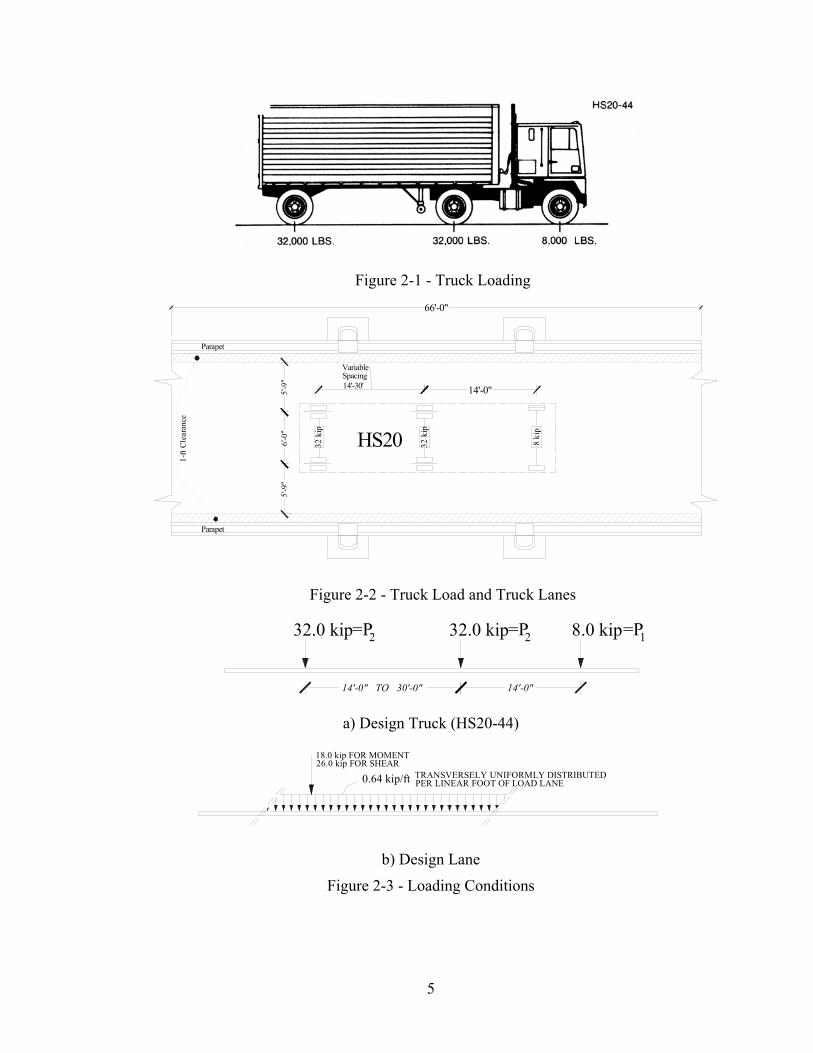
5
Figure 2-1 - Truck Loading 6'
-0"
5'-9
"5'
-9"
Variable
14'-0"Spacing14'-30'
1-ft
Cle
aran
ce
Parapet
Parapet
66'-0"
HS2032 k
ip
32 k
ip
8 ki
p
Figure 2-2 - Truck Load and Truck Lanes
32.0 kip 8.0 kip2=P 1=P
14'-0"14'-0" TO 30'-0"
=P32.0 kip 2
a) Design Truck (HS20-44)
TRANSVERSELY UNIFORMLY DISTRIBUTED26.0 kip FOR SHEAR18.0 kip FOR MOMENT
0.64 kip/ft PER LINEAR FOOT OF LOAD LANE
b) Design Lane
Figure 2-3 - Loading Conditions
6
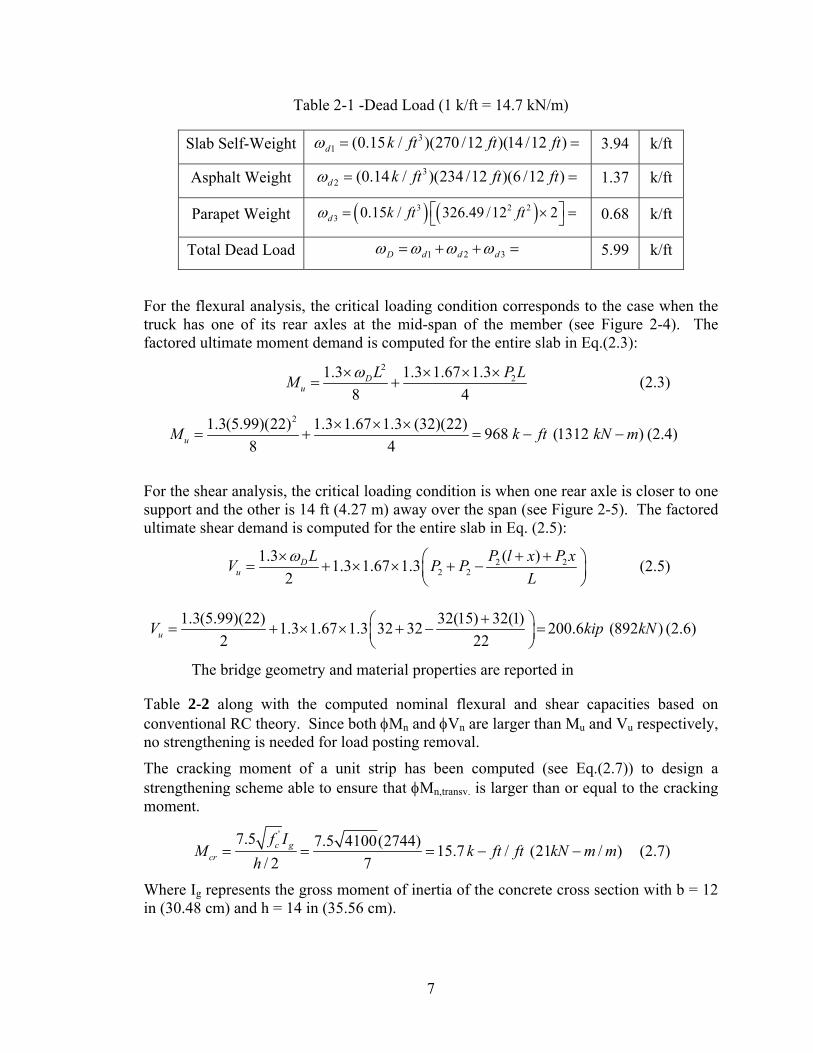
Figure 2-3a represents the HS20-44 design truck already described in Figure 2-2. Given the specific bridge geometry, the worst loading scenario, causing maximum moment at mid span (see Figure 2-4) and shear at the support (see Figure 2-5), is obtained for the minimum spacing of 14.0 ft (4.27 m) between the two rear axles.
ωd P12PP2
l=14'-0"
11'-0"22'-0"
14'-0"
Figure 2-4 - Flexural Design Configuration
22'-0"
14'-0"l=14'-0"
2P P2
x=1'-0"
ω1Pd
7'-0"
Figure 2-5 - Shear Design Configuration
The design lane loading condition (AASHTO, 2002 Section 3.6) consists of a load of 640 lbs per linear foot (9.35 kN/m), uniformly distributed in the longitudinal direction with a single concentrated load so placed on the span as to produce maximum stress. The concentrated load and uniform load is considered to be uniformly distributed over a 10’-0” (3.05 m) width on a line normal to the center lane of the lane. The intensity of the concentrated load is represented in Figure 2-3b for both bending moments and shear forces. This load shall be placed in such positions within the design lane as to produce the maximum stress in the member.
2.3 Slab Analysis The deck is considered to be a one-way slab, disregarding the contribution of the parapets. For simplicity, the deck has been studied considering the overall width of the transversal cross section.
The dead load was computed considering the self-weight of the concrete slab plus the permanent weight of the top layer of asphalt. The weight of parapets has been computed according to the geometrical properties of Figure 1-2c and, for simplicity, distributed throughout the width of the slab.
Table 2-1 presents a summary of these values.
Computations for the design lane and the design truck load have been carried out and it has been found that the design truck load is the controlling loading condition.
7
Table 2-1 -Dead Load (1 k/ft = 14.7 kN/m)
Slab Self-Weight 31 (0.15 / )(270 /12 )(14 /12 )d k ft ft ftω = = 3.94 k/ft
Asphalt Weight 32 (0.14 / )(234 /12 )(6 /12 )d k ft ft ftω = = 1.37 k/ft
Parapet Weight ( ) ( )3 2 23 0.15 / 326.49 /12 2d k ft ftω ⎡ ⎤= × =⎣ ⎦ 0.68 k/ft
Total Dead Load 1 2 3D d d dω ω ω ω= + + = 5.99 k/ft
For the flexural analysis, the critical loading condition corresponds to the case when the truck has one of its rear axles at the mid-span of the member (see Figure 2-4). The factored ultimate moment demand is computed for the entire slab in Eq.(2.3):
2
21.3 1.3 1.67 1.38 4
Du
L P LM ω× × × ×= + (2.3)
21.3(5.99)(22) 1.3 1.67 1.3 (32)(22) 968 (1312 )
8 4uM k ft kN m× × ×= + = − − (2.4)
For the shear analysis, the critical loading condition is when one rear axle is closer to one support and the other is 14 ft (4.27 m) away over the span (see Figure 2-5). The factored ultimate shear demand is computed for the entire slab in Eq. (2.5):
2 22 2
1.3 ( )1.3 1.67 1.32
Du
L P l x P xV P PL
ω× + +⎛ ⎞= + × × + −⎜ ⎟⎝ ⎠
(2.5)
1.3(5.99)(22) 32(15) 32(1)1.3 1.67 1.3 32 32 200.6 (892 )2 22uV kip kN+⎛ ⎞= + × × + − =⎜ ⎟
⎝ ⎠(2.6)
The bridge geometry and material properties are reported in
Table 2-2 along with the computed nominal flexural and shear capacities based on conventional RC theory. Since both φMn and φVn are larger than Mu and Vu respectively, no strengthening is needed for load posting removal.
The cracking moment of a unit strip has been computed (see Eq.(2.7)) to design a strengthening scheme able to ensure that φMn,transv. is larger than or equal to the cracking moment.
'7.5 7.5 4100(2744) 15.7 / (21 / )/ 2 7
c gcr
f IM k ft ft kN m m
h= = = − − (2.7)
Where Ig represents the gross moment of inertia of the concrete cross section with b = 12 in (30.48 cm) and h = 14 in (35.56 cm).
8
Table 2-2 - Flexural and Shear Capacity
b in
[cm]
h in
[cm]
d in
[cm]
As in2
[cm2]
φMn k-ft
[kN-m]
φVn kip
[kN]
Mu k-ft
[kN-m]
Vu kip
[kN] 270
[685.8] 14
[35.5] 12.7
[32.4] 42.7
[275.5]1229
[1666] 370
[1646] 968
[1312] 200.6 [892]
3. BRIDGE STRENTHENING
The objective of the strengthening is to provide the necessary transverse reinforcement so that the load posting can be removed. Since no reinforcement was provided in the transverse direction, minimal strengthening is needed to ensure that the transverse design moment capacity is larger or equal to the cracking moment computed in Eq.(2.7), in order to avoid further crack openings and deterioration of the concrete due to water percolation through the cracks.
Two commercially available carbon FRP systems have been adopted: (1) externally bonded Carbon Fiber Reinforced Polymers (CFRP) laminates installed by manual wet lay-up, and (2) Near-surface mounted CFRP rectangular bars embedded in pre-made grooves and bonded in place with an epoxy-based paste. The main difference between these two techniques belongs to the surface preparation necessary before the application of the strengthening that in turn depends upon the conditions of the concrete substrate on which the laminates and bars are bonded.
Before surface preparation for FRP application, the central crack was repaired in order to re-establish material continuity and assure no water percolation through the crack. For this purpose, the crack was sealed using an epoxy-paste and then injected with a very low viscosity resin as shown in Figure 3-1a-b. Once the crack had been repaired, FRP was applied following the design provisions.
The design of both FRP technologies is carried out according to the principles of ACI 440.2R-02 (ACI 440 in the following). The properties of the FRP composite materials used in the design are summarized in Table 3-1 and
Table 3-2. The reported FRP properties are guaranteed values.
The φ factors used to convert nominal values to design capacities are obtained as specified in AASHTO (2002) for the as-built and from ACI 440 for the strengthened members.
Material properties of the FRP reinforcement reported by manufacturers, such as the ultimate tensile strength, typically do not consider long-term exposure to environmental conditions, and should be considered as initial properties. FRP properties to be used in all design equations are given as follows (ACI 440):

9
*
*
fu E fu
fu E fu
f C f
Cε ε
=
= (3.1)
where fuf and fuε are the FRP design tensile strength and ultimate strain considering the
environmental reduction factor (CE) as given in Table 7.1 (ACI 440), and *fuf and *
fuε represent the FRP guaranteed tensile strength and ultimate strain as reported by the manufacturer. The FRP design modulus of elasticity is the average value as reported by the manufacturer. Calculations for both NSM FRP bars and FRP laminates are shown in Appendix I.
a) Crack Sealed Previous to Injection b) Crack Injection under the Bridge
Figure 3-1 – Repair of Central Crack
Table 3-1– Properties of CFRP Laminate Constituent Materials
Material
Ultimate tensile
strength f*fu
ksi [MPa]
Ultimate strain ε∗fu
in/in [mm/mm]
Tensile modulus
Ef
ksi [GPa]
Nominal thickness
tf in [mm]
Primer* 2.5 [17.2] 40 104 [0.7] - Putty* 2.2 [15.2] 7.0 260 [1.8] -
Saturant* 8.0 [55.2] 7.0 260 [1.8] - High Strength Carbon Fiber** 550 [3790] 0.017 33,000 [228] 0.0065 [0.1651]
* Values provided by the manufacturer (Watson Bowman Acme Corp. (2002)) ** Tested as laminate with properties related to fiber area (Yang, X., 2002)
10
Table 3-2 – Properties of NSM CFRP Constituent Materials
Material
Ultimate tensile
strength f*
fu Ksi [MPa]
Ultimate Strain
ε∗fu
[in/in]
Tensile modulus
Ef
ksi [GPa]
Cross Sectional
Area in2 [mm2]
Dimensions in×in
[mm×mm]
Concresive 1420 Epoxy*
4 [27.58]
0.1 - - -
Aslan 500 Carbon Tape**
300 [2,068]
0.017 19000 [131]
0.05 [32.2]
0.079×0.63 [2×16]
* Values provided by the manufacturer (Watson Bowman Acme Corp. (2002)) ** Values provided by the manufacturer and related to cross sectional area (Hughes Brothers, Inc. (2002))
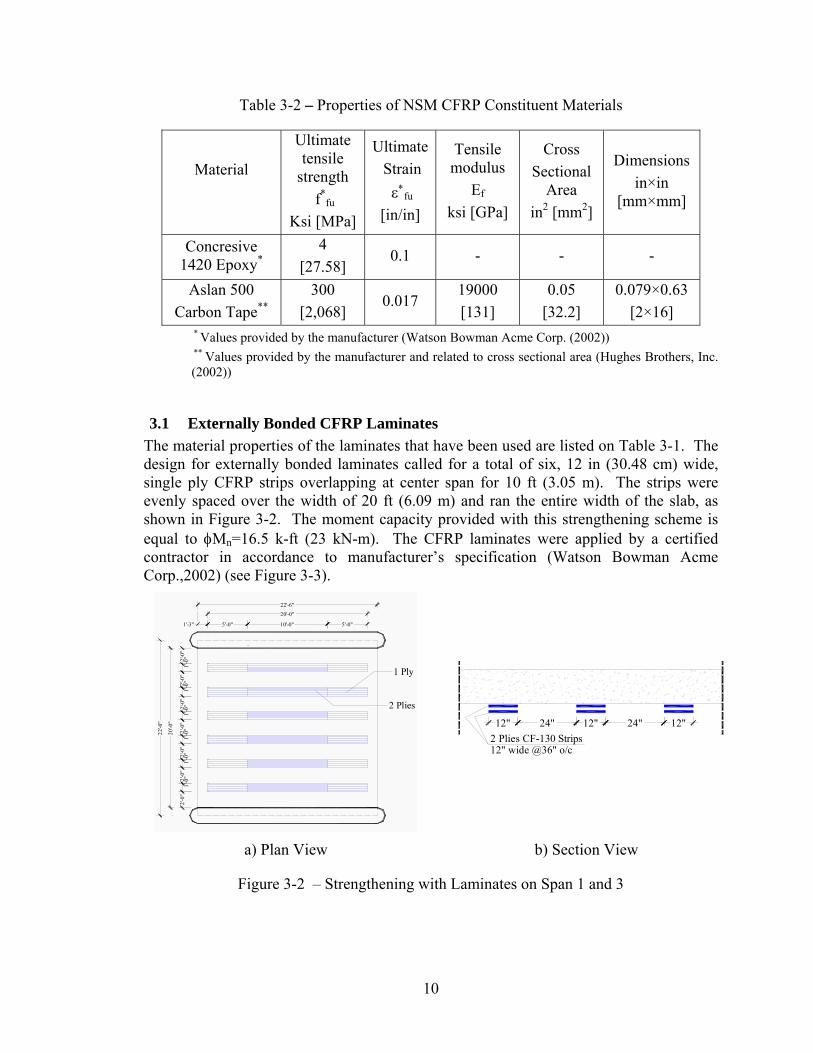
3.1 Externally Bonded CFRP Laminates The material properties of the laminates that have been used are listed on Table 3-1. The design for externally bonded laminates called for a total of six, 12 in (30.48 cm) wide, single ply CFRP strips overlapping at center span for 10 ft (3.05 m). The strips were evenly spaced over the width of 20 ft (6.09 m) and ran the entire width of the slab, as shown in Figure 3-2. The moment capacity provided with this strengthening scheme is equal to φMn=16.5 k-ft (23 kN-m). The CFRP laminates were applied by a certified contractor in accordance to manufacturer’s specification (Watson Bowman Acme Corp.,2002) (see Figure 3-3).
10'-0"
20'-0"22'-6"
1'-0
"2'-0
"
20'-0
"
22'-0
"
2'-0
"2'
-0"
1'-0
"1'
-0"2'-0
"2'
-0"
1'-0
"2'
-0"
1'-0
"1'
-0"
5'-0"1'-3"
2'-0
"
1 Ply
2 Plies
5'-0"
12" wide @36" o/c2 Plies CF-130 Strips
24"12" 24"12" 12"
a) Plan View b) Section View
Figure 3-2 – Strengthening with Laminates on Span 1 and 3
11
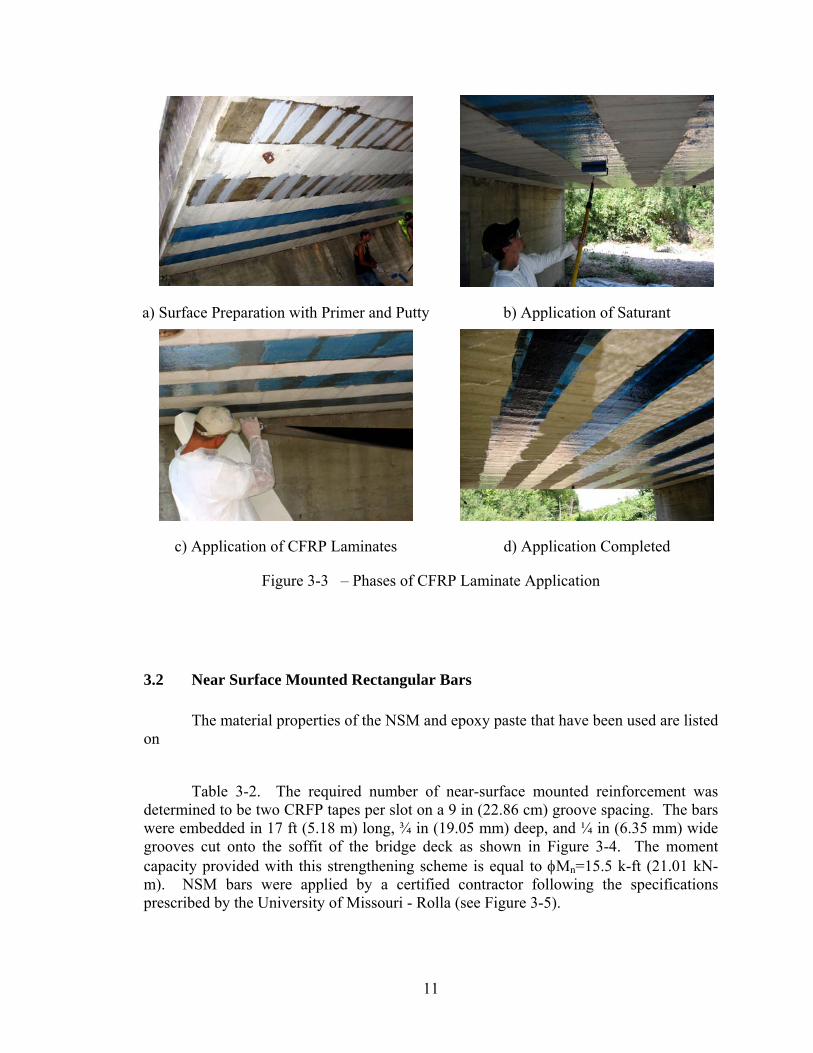
a) Surface Preparation with Primer and Putty b) Application of Saturant
c) Application of CFRP Laminates d) Application Completed
Figure 3-3 – Phases of CFRP Laminate Application
3.2 Near Surface Mounted Rectangular Bars
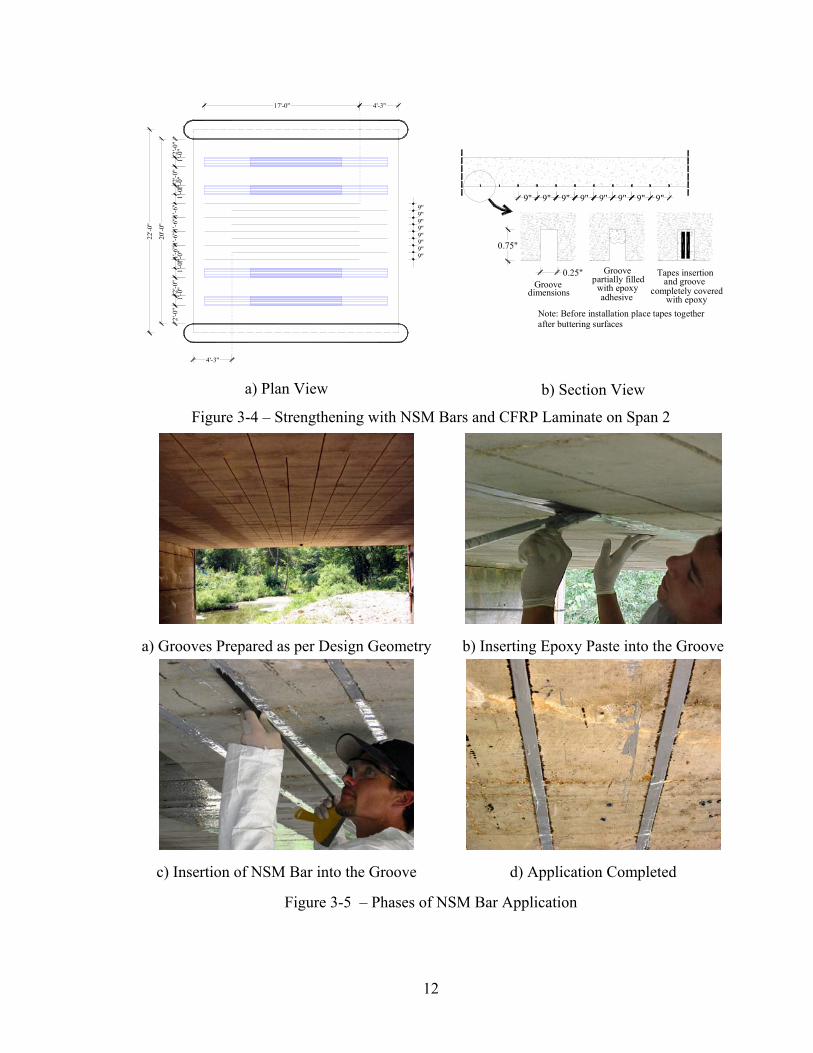
The material properties of the NSM and epoxy paste that have been used are listed on
Table 3-2. The required number of near-surface mounted reinforcement was determined to be two CRFP tapes per slot on a 9 in (22.86 cm) groove spacing. The bars were embedded in 17 ft (5.18 m) long, ¾ in (19.05 mm) deep, and ¼ in (6.35 mm) wide grooves cut onto the soffit of the bridge deck as shown in Figure 3-4. The moment capacity provided with this strengthening scheme is equal to φMn=15.5 k-ft (21.01 kN-m). NSM bars were applied by a certified contractor following the specifications prescribed by the University of Missouri - Rolla (see Figure 3-5).
12
9"1'-6
"
22'-0
"
20'-0
"
2'-0
"
4'-3"
2'-0
"1'
-0"
1'-0
"1'
-0"1'
-6" 9"
9"
4'-3"
2'-0
"1'
-0"
1'-6
"1'
-0"
1'-6
"1'
-0"
17'-0"
2'-0
"
9"9"9"
9"
9"
0.75"
dimensionsGroove
Note: Before installation place tapes togetherwith epoxy
completely coveredand groove
Tapes insertion
after buttering surfaces
adhesivewith epoxy
partially filledGroove0.25"
9" 9"9"9"9" 9" 9"9"
a) Plan View b) Section View
Figure 3-4 – Strengthening with NSM Bars and CFRP Laminate on Span 2
a) Grooves Prepared as per Design Geometry b) Inserting Epoxy Paste into the Groove
c) Insertion of NSM Bar into the Groove d) Application Completed
Figure 3-5 – Phases of NSM Bar Application
13
4. FIELD EVALUATION
Although in-situ bridge load testing is recommended by the AASHTO (2002) Specification as an “effective means of evaluating the structural performance of a bridge,” no guidelines currently exist for bridge load test protocols. In each case the load test objectives, load configuration, instrumentation type and placement, and analysis techniques are to be determined by the organization conducting the test.
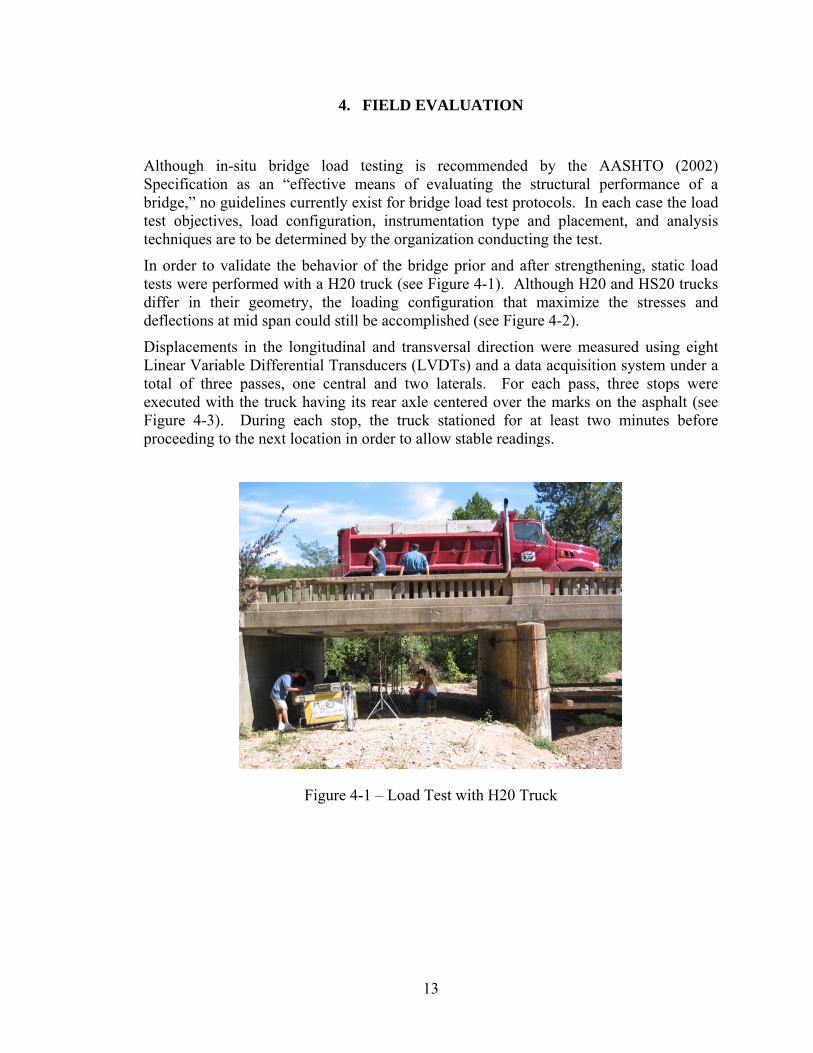
In order to validate the behavior of the bridge prior and after strengthening, static load tests were performed with a H20 truck (see Figure 4-1). Although H20 and HS20 trucks differ in their geometry, the loading configuration that maximize the stresses and deflections at mid span could still be accomplished (see Figure 4-2).
Displacements in the longitudinal and transversal direction were measured using eight Linear Variable Differential Transducers (LVDTs) and a data acquisition system under a total of three passes, one central and two laterals. For each pass, three stops were executed with the truck having its rear axle centered over the marks on the asphalt (see Figure 4-3). During each stop, the truck stationed for at least two minutes before proceeding to the next location in order to allow stable readings.
Figure 4-1 – Load Test with H20 Truck
14
22'-0"x
l=14'-0"P2
1PdωP2
3'-10" P =8k1P =16k2
Figure 4-2 – H20 Legal Truck
LVDT 4
LVDT 2
Rolla
LVDT 9
LVDT 3
LVDT 10
1'-6"
5'-7"
0'-6"
LVDT 5
11'-0"
LVDT 1
0'-6"
LVDT 6
0 L/4 L/2 L
Stops Locations of Rear Axle
Left Pass
Right Pass
Central Pass
1 2 3
Figure 4-3 – LVDTs Positions and Truck Stops
The instrumentation layout was designed to gain the maximum amount of information about the structure. It was assumed that the bridge acted symmetrically, therefore instrumentation was concentrated on one half of the bridge.
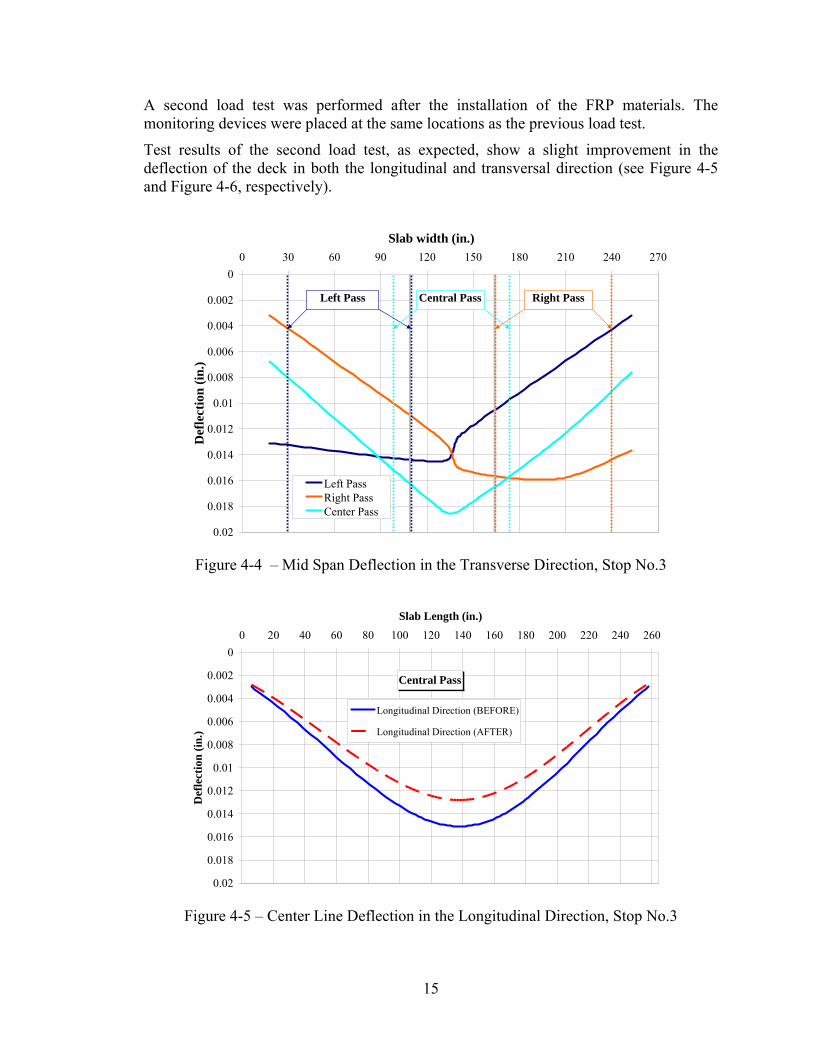
The results of the first load test, relative to the stop No.3, are reported in Figure 4-4. All diagrams show the discontinuity caused by the longitudinal crack. The bridge performed well in terms of overall deflection. In fact, the maximum deflection measured during the load test is below the allowable deflection prescribed by AASHTO, 2002 Section 8.9.3 (δmax≤ L/800 =0.33in (8.38mm)).
15
A second load test was performed after the installation of the FRP materials. The monitoring devices were placed at the same locations as the previous load test.
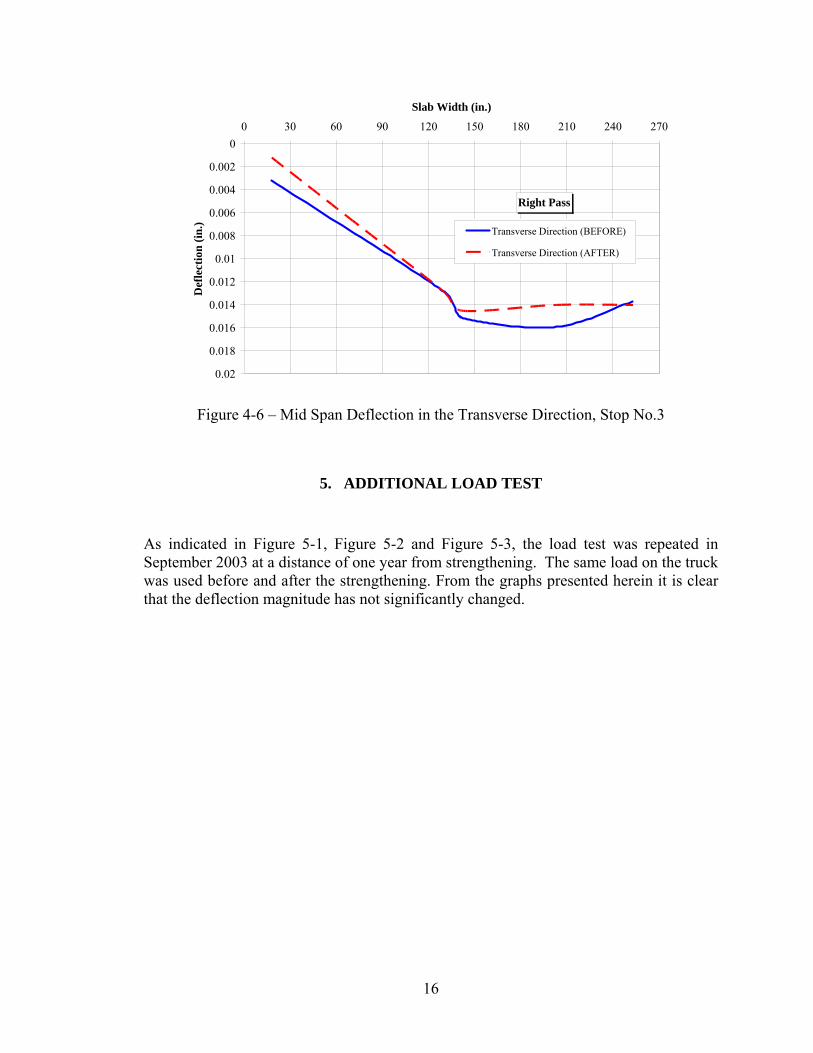
Test results of the second load test, as expected, show a slight improvement in the deflection of the deck in both the longitudinal and transversal direction (see Figure 4-5 and Figure 4-6, respectively).
Slab width (in.)
0
0.002
0.004
0.006
0.008
0.01
0.012
0.014
0.016
0.018
0.02
0 30 60 90 120 150 180 210 240 270
Def
lect
ion
(in.)
Left PassRight PassCenter Pass
Left Pass Central Pass Right Pass
Figure 4-4 – Mid Span Deflection in the Transverse Direction, Stop No.3
Central Pass
0
0.002
0.004
0.006
0.008
0.01
0.012
0.014
0.016
0.018
0.02
0 20 40 60 80 100 120 140 160 180 200 220 240 260Slab Length (in.)
Def
lect
ion
(in.)
Longitudinal Direction (BEFORE)
Longitudinal Direction (AFTER)
Figure 4-5 – Center Line Deflection in the Longitudinal Direction, Stop No.3
16
Right Pass
0
0.002
0.004
0.006
0.008
0.01
0.012
0.014
0.016
0.018
0.02
0 30 60 90 120 150 180 210 240 270
Slab Width (in.)
Def
lect
ion
(in.) Transverse Direction (BEFORE)
Transverse Direction (AFTER)
Figure 4-6 – Mid Span Deflection in the Transverse Direction, Stop No.3
5. ADDITIONAL LOAD TEST
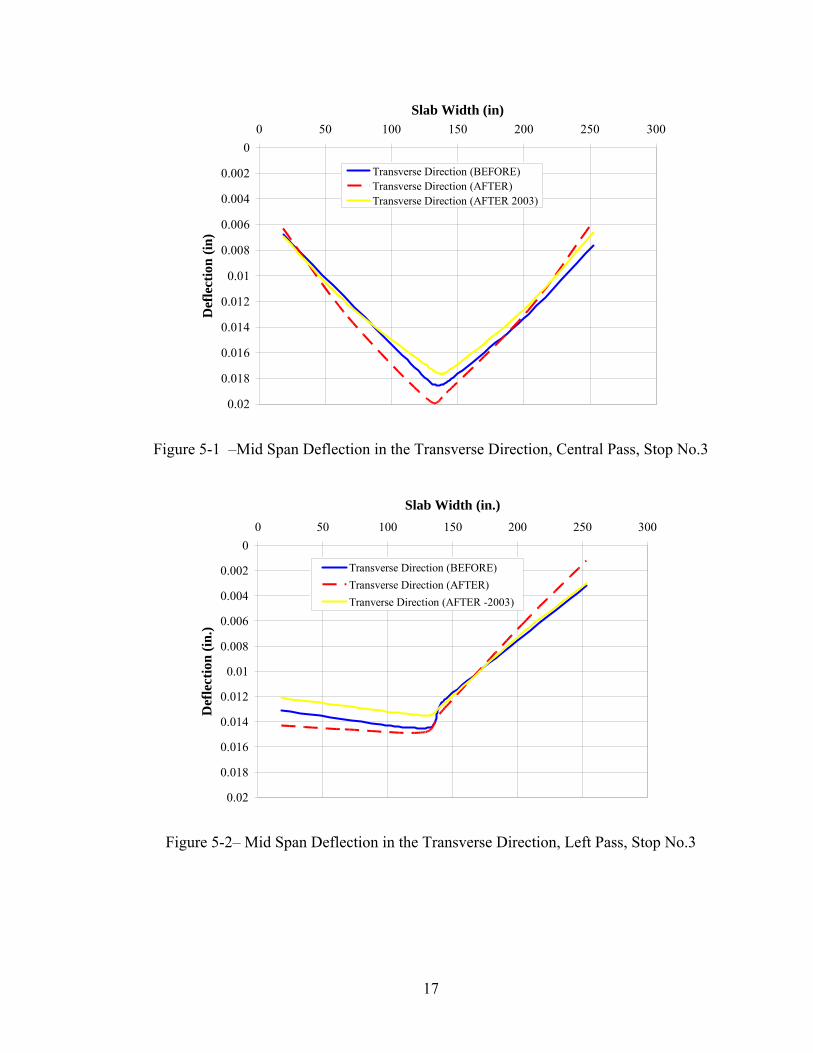
As indicated in Figure 5-1, Figure 5-2 and Figure 5-3, the load test was repeated in September 2003 at a distance of one year from strengthening. The same load on the truck was used before and after the strengthening. From the graphs presented herein it is clear that the deflection magnitude has not significantly changed.
17
0
0.002
0.004
0.006
0.008
0.01
0.012
0.014
0.016
0.018
0.02
0 50 100 150 200 250 300Slab Width (in)
Def
lect
ion
(in)
Transverse Direction (BEFORE)Transverse Direction (AFTER)Transverse Direction (AFTER 2003)
Figure 5-1 –Mid Span Deflection in the Transverse Direction, Central Pass, Stop No.3
0
0.002
0.004
0.006
0.008
0.01
0.012
0.014
0.016
0.018
0.02
0 50 100 150 200 250 300
Slab Width (in.)
Def
lect
ion
(in.)
Transverse Direction (BEFORE)Transverse Direction (AFTER)Tranverse Direction (AFTER -2003)
Figure 5-2– Mid Span Deflection in the Transverse Direction, Left Pass, Stop No.3
18
0
0.002
0.004
0.006
0.008
0.01
0.012
0.014
0.016
0.018
0.02
0 30 60 90 120 150 180 210 240 270Slab Width (in.)
Def
lect
ion
(in.)
Transverse Direction (BEFORE)
Transverse Direction (AFTER)
Transverse DIrection (AFTER 2003)
Figure 5-3 – Mid Span Deflection in the Transverse Direction, Right Pass, Stop No.3
6. FEM ANALYSIS
To validate the data obtained from the load tests, a linear elastic FEM analysis was conducted. For this purpose a commercially available finite element program ANSYS 7.0 was used.
The element SOLID65 was chosen to model the concrete. SOLID65 is used for the three-dimensional modeling of solids with or without reinforcing bars. The solid is capable of cracking in tension and crushing in compression. In concrete applications, for example, the solid capability of the element may be used to model the concrete while the rebar capability is available for modeling reinforcement behavior. The element is defined by eight nodes having three degrees of freedom at each node: translations in the nodal x, y, and z directions. Up to three different rebar specifications may be defined.
SOLID65 is subject to the following assumption and restrictions:
1. Cracking is permitted in three orthogonal directions at each integration point; 2. If cracking occurs at an integration point, the cracking is modeled through an
adjustment of material properties which effectively treats the cracking as a “smeared band” of cracks, rather than discrete cracks;
3. The concrete material is assumed to be initially isotropic; 4. Whenever the reinforcement capability of the element is used, the reinforcement is
assumed to be “smeared” throughout the element;
19
5. In addition to cracking and crushing, the concrete may also undergo plasticity, with the Drucker-Prager failure surface being most commonly used. In this case, the plasticity is done before the cracking and crushing checks.
For this project, the material properties of concrete were assumed to be isotropic and linear elastic, since the applied load was relatively low. The modulus of elasticity of the concrete was based on the measured compressive strength of the cores obtained from the slab according to the standard equation ACI 318-02 Section 8.5.1:
' 657000 3.6 10 (24.8 )c cE f psi GPa= ≈ × (6.1)
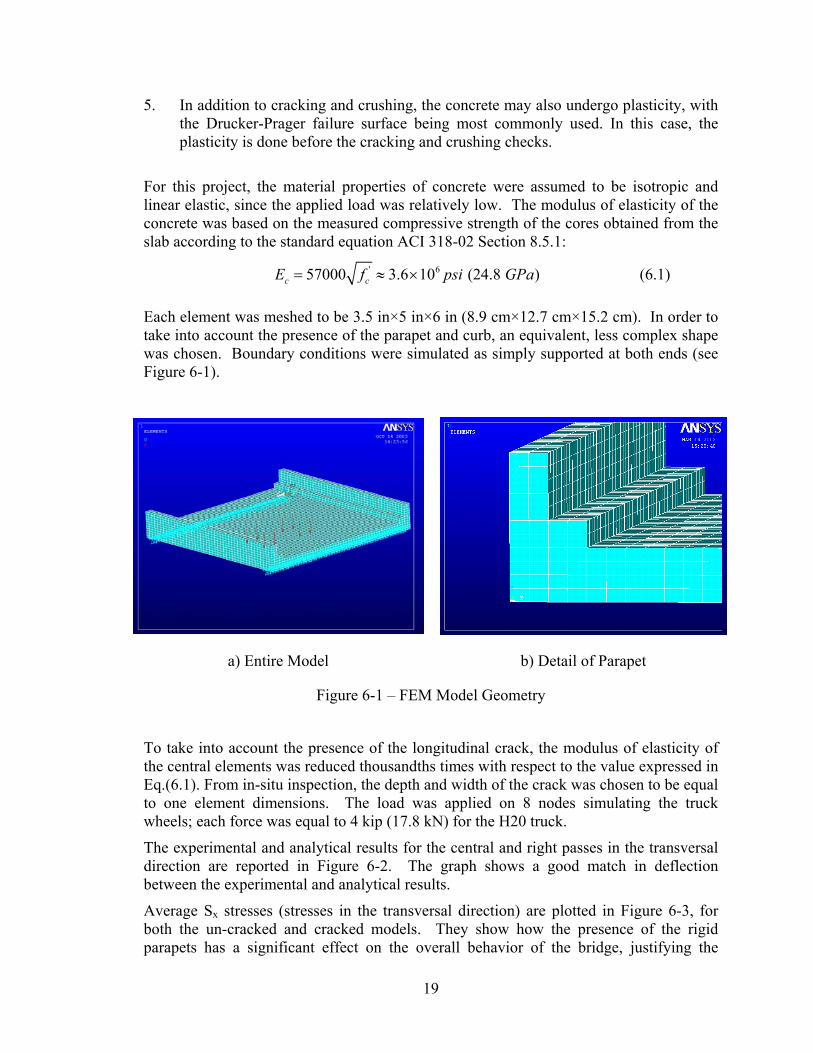
Each element was meshed to be 3.5 in×5 in×6 in (8.9 cm×12.7 cm×15.2 cm). In order to take into account the presence of the parapet and curb, an equivalent, less complex shape was chosen. Boundary conditions were simulated as simply supported at both ends (see Figure 6-1).
a) Entire Model b) Detail of Parapet
Figure 6-1 – FEM Model Geometry
To take into account the presence of the longitudinal crack, the modulus of elasticity of the central elements was reduced thousandths times with respect to the value expressed in Eq.(6.1). From in-situ inspection, the depth and width of the crack was chosen to be equal to one element dimensions. The load was applied on 8 nodes simulating the truck wheels; each force was equal to 4 kip (17.8 kN) for the H20 truck.
The experimental and analytical results for the central and right passes in the transversal direction are reported in Figure 6-2. The graph shows a good match in deflection between the experimental and analytical results.
Average Sx stresses (stresses in the transversal direction) are plotted in Figure 6-3, for both the un-cracked and cracked models. They show how the presence of the rigid parapets has a significant effect on the overall behavior of the bridge, justifying the

20
presence of peak horizontal stresses along the slab centerline (tensile stresses are positive) which caused the formation of the crack. The strengthening with FRP can overcome these stresses and guarantee a flexural capacity in the transversal direction higher then the cracking moment, blocking new crack’s opening.
0
0.002
0.004
0.006
0.008
0.01
0.012
0.014
0.016
0.018
0.02
0 30 60 90 120 150 180 210 240 270Slab Width (in.)
Def
lect
ion
(in.)
Center Pass Experimental
Center Pass Analytical
Right Pass Experimental
Right Pass Analytical
Truck's axlefor center pass
Truck's axlefor right pass
Figure 6-2 – Comparison of Experimental and Analytical Results in the Transversal Direction
a) Sx in Model Slab with no Crack b) Sx in Model Slab with Crack
Figure 6-3 – FEM Results of Sx Average Stresses for Axle Position at Stop 3
21
7. LOAD RATING
Bridge load rating calculations provide a basis for determining the safe load carrying capacity of a bridge. According to the Missouri Department of Transportation (MoDOT), anytime a bridge is built, rehabilitated, or reevaluated for any reason, inventory and operating ratings are required using the Load Factor rating. All bridges should be rated at two load levels, the maximum load level called the Operating Rating and a lower load level called the Inventory Rating. The Operating Rating is the maximum permissible load that should be allowed on the bridge. Exceeding this level could damage the bridge. The Inventory Rating is the load level the bridge can carry on a daily basis without damaging the bridge.
In Missouri, for the Load Factor Method, the Operating Rating is based on the appropriate ultimate capacity using current AASHTO specifications (AASHTO, 1996). The Inventory Rating is taken as 60% of the Operating Rating.
The vehicle used for the live load calculations in the Load Factor Method is the HS20 truck. If the stress levels produced by this vehicle configuration are exceeded, load posting may be required.
The tables below show the Rating Factor and Load Rating for this bridge. The method for determining the rating factor is that outlined by AASHTO in the Manual for Condition Evaluation of Bridges (AASHTO, 1994). Equation (7.1) was used:
( )
1
2 1C A DRF
A L I−
=+
(7.1)
where: RF is the Rating Factor, C is the capacity of the member, D is the dead load effect on the member, L is the live load effect on the member, I is the impact factor to be used with the live load effect, A1 is the factor for dead loads, and A2 is the factor for live loads. Since the load factor method is being used, A1 is taken as 1.3 and A2 varies depending on the desired rating level. For Inventory rating, A2 = 2.17, and for Operating Rating, A2 = 1.3.
To determine the rating (RT) of the bridge Equation (7.1) was used:
( )RT RF W= (7.1)
In the above equation, W is the weight of the nominal truck used to determine the live load effect.
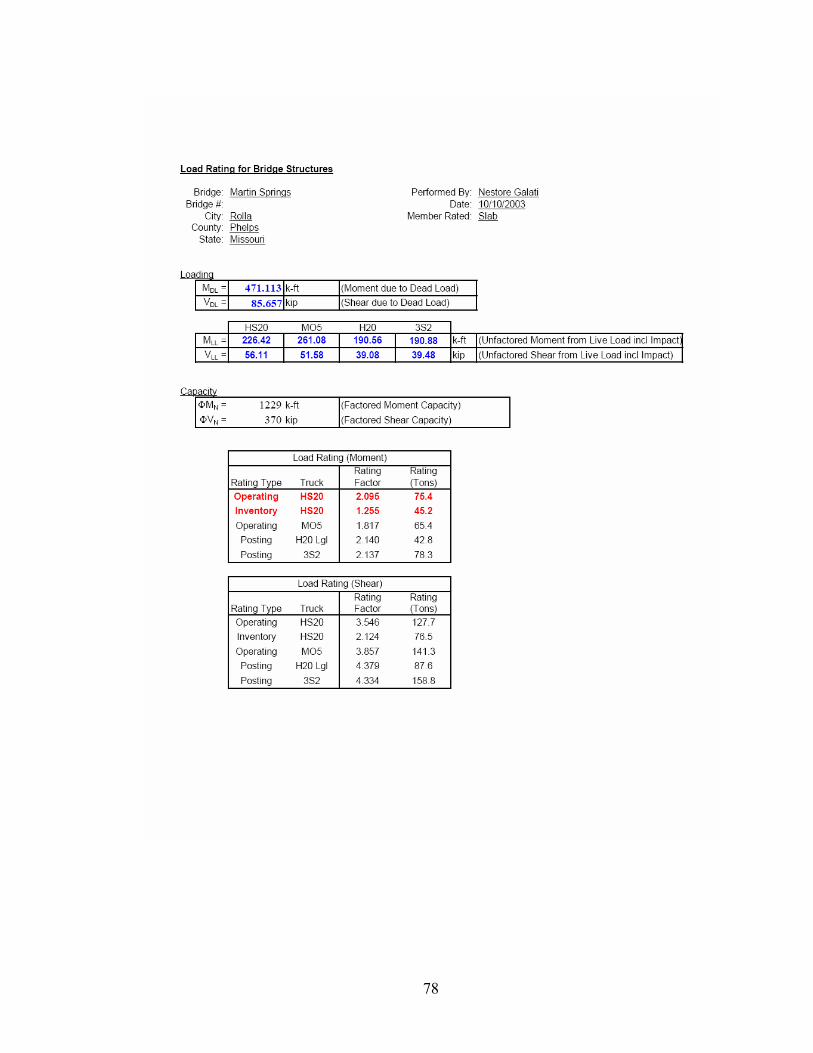
For the Martin Springs Bridge, the Load Rating was calculated for a number of different trucks, HS20, H20, 3S2, and MO5. The different ratings are used for different purposes by the bridge owner. For each of the different loading conditions, the maximum shear

22
and maximum moment were calculated. Impact factors are also taken into account for Load Ratings. This value is 30% for the Martin Springs Bridge. The shear and moment values for the deck are shown below in Table 7-1.
Table 7-1 - Maximum Shear and Moment due to Live Load
Truck Maximum Shear (kip)
Maximum Moment
(k-ft.)
Maximum Shear with Impact
(kip)
Maximum Moment with Impact (k-ft.)
HS20 43.16 174.17 56.11 226.42 MO5 30.06 200.83 39.08 261.08 H20 39.68 146.58 51.58 190.56 3S2 30.37 146.83 39.48 190.88
Table 7-2 below gives the results of the Load Rating pertaining to moment and Table 7-3 shows the results for shear. All calculations for the load rating are located in Appendix II.
Table 7-2 - Rating Factor for the Slab (Bending Moment)
Truck Rating Factor (RF)
Rating (RT) (Tons)
Rating Type
HS20 2.095 75.4 Operating HS20 1.255 45.2 Inventory MO5 1.817 65.4 Operating H20 2.140 42.8 Posting 3S2 2.137 78.3 Posting
* All Units Expressed in English System
Table 7-3 - Rating Factor for the Slab (Shear)
Truck Rating Factor (RF)
Rating (RT) (Tons)
Rating Type
HS20 3.546 127.7 Operating HS20 2.124 76.5 Inventory MO5 3.857 141.3 Operating H20 4.379 87.6 Posting 3S2 4.334 158.8 Posting
* All Units Expressed in English System
Since the factors RF are greater than 1 then the bridge does not need to be load posted. In addition, from Table 7-2 and Table 7-3 the maximum operating and inventory load can be found as 75T and 45T respectively.
23
8. REPORT BY INDIPENDENT CONSULTANT
Based on the results provided by UMR, a Bridge Engineering Assistance Program (BEAP) report on the structure was prepared by an independent consultant in the summer 2003. The consultant, based on given information` regarding the condition of the structure, quantity and location of existing steel reinforcement, and on load test results conducted by UMR, rated the structure to demonstrate that the posting could be removed. The strengthening of the bridge in the transversal direction was necessary to the removal of the load posting. In fact, as proved by the load testing prior to strengthening, even though the bridge performed well in terms of overall deflection, all diagrams showed the discontinuity caused by the longitudinal crack. Without such strengthening, the increased loads, resulting from removal of the load posting, could possibly cause an increment of the longitudinal crack width and therefore compromise the serviceability of the structure.
9. CONCLUSIONS
Conclusions based on the retrofitting of the bridge utilizing FRP materials can be summarized as follows:
• FRP systems, either in the form of externally bonded laminates and near surface mounted bars, showed to be a feasible solution for the strengthening of the concrete bridge
• There is great appeal in the short timeline for installation. In addition, the retrofitting of the bridge can be obtained without interrupting the traffic
• As a result of FRP strengthening, load posting of the bridge was removed • In situ load testing has proven to be useful and convincing • The FEM analysis has shown good match with experimental results demonstrating
the effectiveness of the strengthening technique.
24
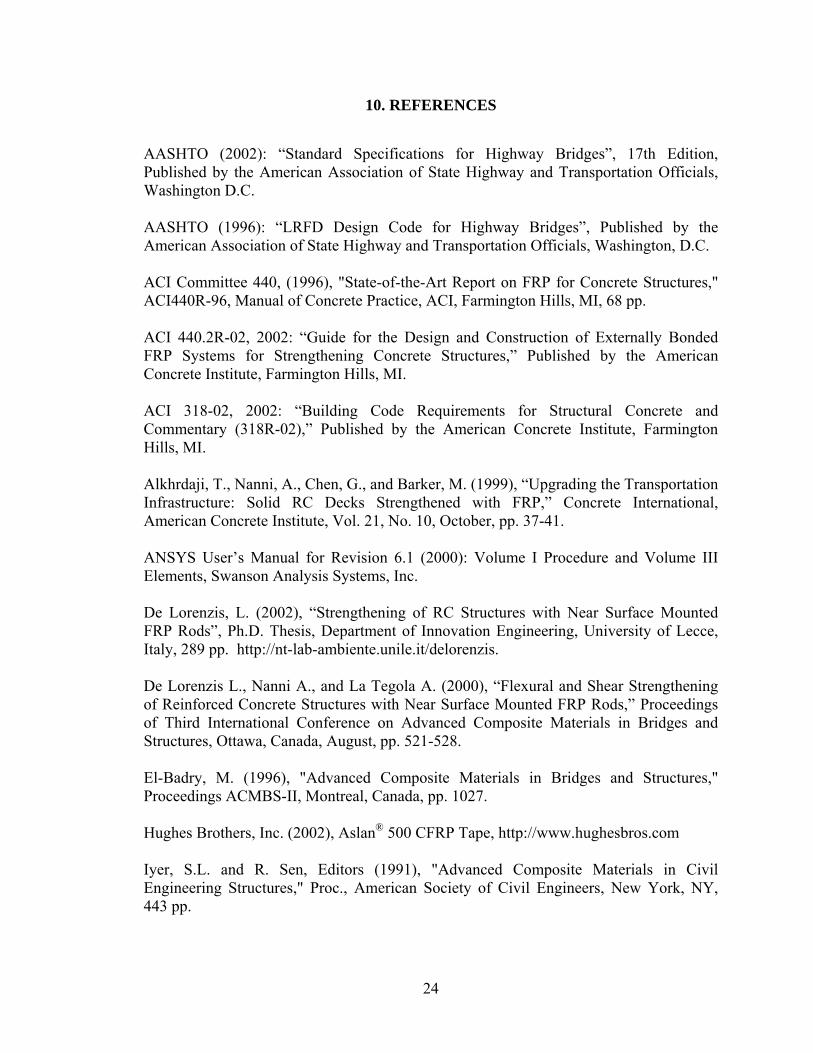
10. REFERENCES
AASHTO (2002): “Standard Specifications for Highway Bridges”, 17th Edition, Published by the American Association of State Highway and Transportation Officials, Washington D.C. AASHTO (1996): “LRFD Design Code for Highway Bridges”, Published by the American Association of State Highway and Transportation Officials, Washington, D.C. ACI Committee 440, (1996), "State-of-the-Art Report on FRP for Concrete Structures," ACI440R-96, Manual of Concrete Practice, ACI, Farmington Hills, MI, 68 pp. ACI 440.2R-02, 2002: “Guide for the Design and Construction of Externally Bonded FRP Systems for Strengthening Concrete Structures,” Published by the American Concrete Institute, Farmington Hills, MI. ACI 318-02, 2002: “Building Code Requirements for Structural Concrete and Commentary (318R-02),” Published by the American Concrete Institute, Farmington Hills, MI. Alkhrdaji, T., Nanni, A., Chen, G., and Barker, M. (1999), “Upgrading the Transportation Infrastructure: Solid RC Decks Strengthened with FRP,” Concrete International, American Concrete Institute, Vol. 21, No. 10, October, pp. 37-41. ANSYS User’s Manual for Revision 6.1 (2000): Volume I Procedure and Volume III Elements, Swanson Analysis Systems, Inc. De Lorenzis, L. (2002), “Strengthening of RC Structures with Near Surface Mounted FRP Rods”, Ph.D. Thesis, Department of Innovation Engineering, University of Lecce, Italy, 289 pp. http://nt-lab-ambiente.unile.it/delorenzis. De Lorenzis L., Nanni A., and La Tegola A. (2000), “Flexural and Shear Strengthening of Reinforced Concrete Structures with Near Surface Mounted FRP Rods,” Proceedings of Third International Conference on Advanced Composite Materials in Bridges and Structures, Ottawa, Canada, August, pp. 521-528. El-Badry, M. (1996), "Advanced Composite Materials in Bridges and Structures," Proceedings ACMBS-II, Montreal, Canada, pp. 1027. Hughes Brothers, Inc. (2002), Aslan® 500 CFRP Tape, http://www.hughesbros.com Iyer, S.L. and R. Sen, Editors (1991), "Advanced Composite Materials in Civil Engineering Structures," Proc., American Society of Civil Engineers, New York, NY, 443 pp.

25
JSCE Sub-Committee on Continuous Fiber Reinforcement (1992), "Utilization of FRP-Rods for Concrete Reinforcement," Proc., Japan Society of Civil Engineers, Tokyo, Japan, 314 pp. Nanni, A., Ed. (1993), Fiber-Reinforced-Plastic (FRP) Reinforcement for Concrete Structures: Properties and Applications, Developments in Civil Engineering, Vol. 42, Elsevier, Amsterdam, The Netherlands, pp. 450. Nanni, A. and Dolan, C.W., Eds. (1993), "FRP Reinforcement for Concrete Structures," Proc., ACI SP-138, American Concrete Institute, Detroit, MI, pp. 977. Nanni, A., (1995)."Concrete Repair with Externally Bonded FRP Reinforcement: Examples from Japan," Concrete International: Design and Construction, Vol. 17, No. 6, June 1995, pp. 22-25. Nanni, A., (1997), "Carbon FRP Strengthening: New Technology Becomes Mainstream," Concrete International: Design and Construction, V. 19, No. 6, pp. 19-23 Nanni, A. (2001), “Relevant Applications of FRP Composites in Concrete Structures,” Proc., CCC 2001, Composites in Construction, Porto, Portugal, Oct. 10-12, 2001, J Figueiras, L. Juvandes and R. Furia, Eds., (invited), pp. 661-670. Neale, K.W. and Labossiere, P., Editors (1992), "Advanced Composite Materials in Bridges and Structures," Proc., Canadian Society for Civil Engineering, Montreal, Canada, 705 pp. Stone, D.K., Tumialan, J.G., Parretti, R., and Nanni, A., (2002). “Near-Surface Mounted FRP Reinforcement: Application of an Emerging Technology”, Concrete UK, V. 36, No. 5, pp. 42-44. Watson Bowman Acme Corp. (2002), Wabo®MBrace Composite Strengthening System Design Guide, Third Edition, Amherst, New York. White, T.D., Editor (1992), "Composite Materials and Structural Plastics in Civil Engineering Construction," in Proc. of The Materials Engineering Congress, American Society of Civil Engineers, New York, NY, pp. 532-718. Yang, X. (2001), " The engineering of construction specifications for externally bonded FRP composites” Doctoral Dissertation, Department of Civil Engineering, University of Missouri-Rolla, Rolla, Missouri, 166 pp.

26
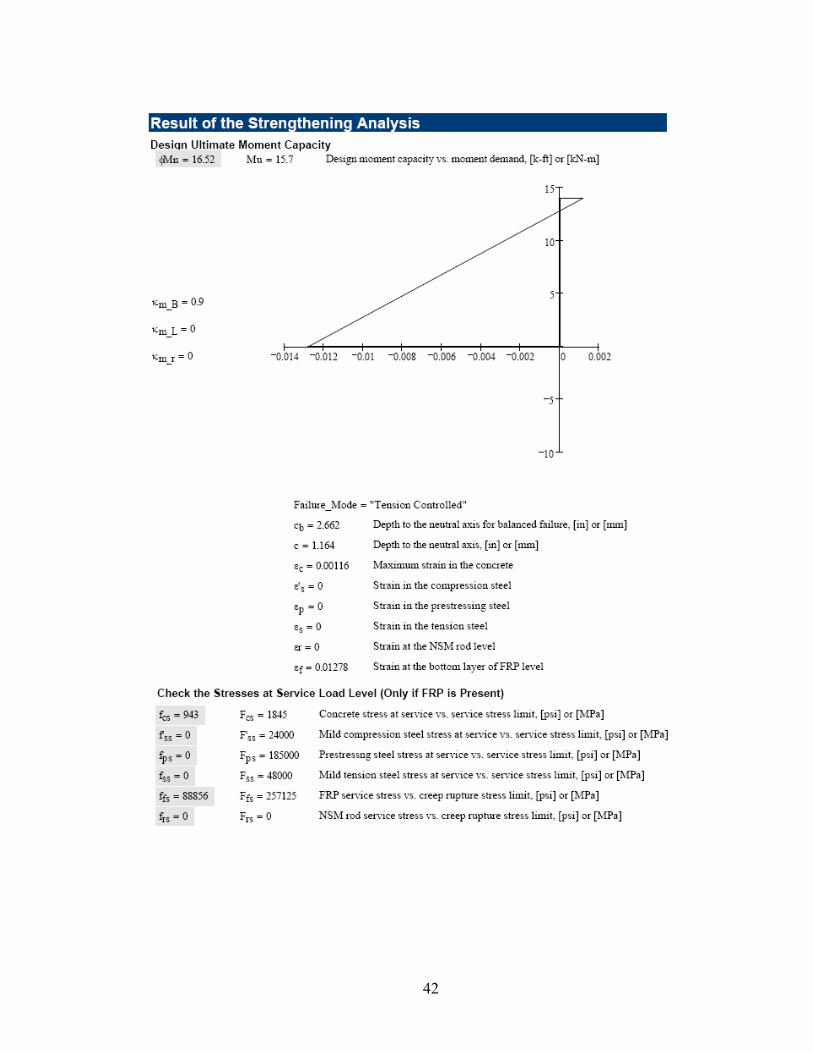
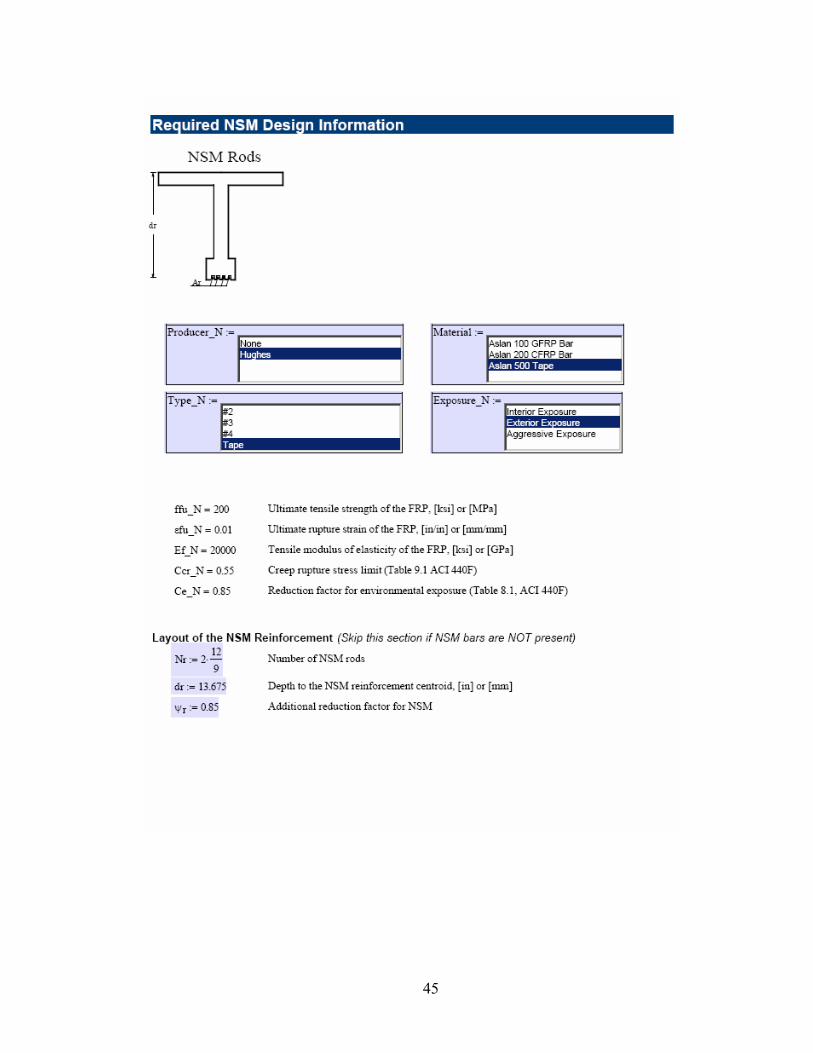
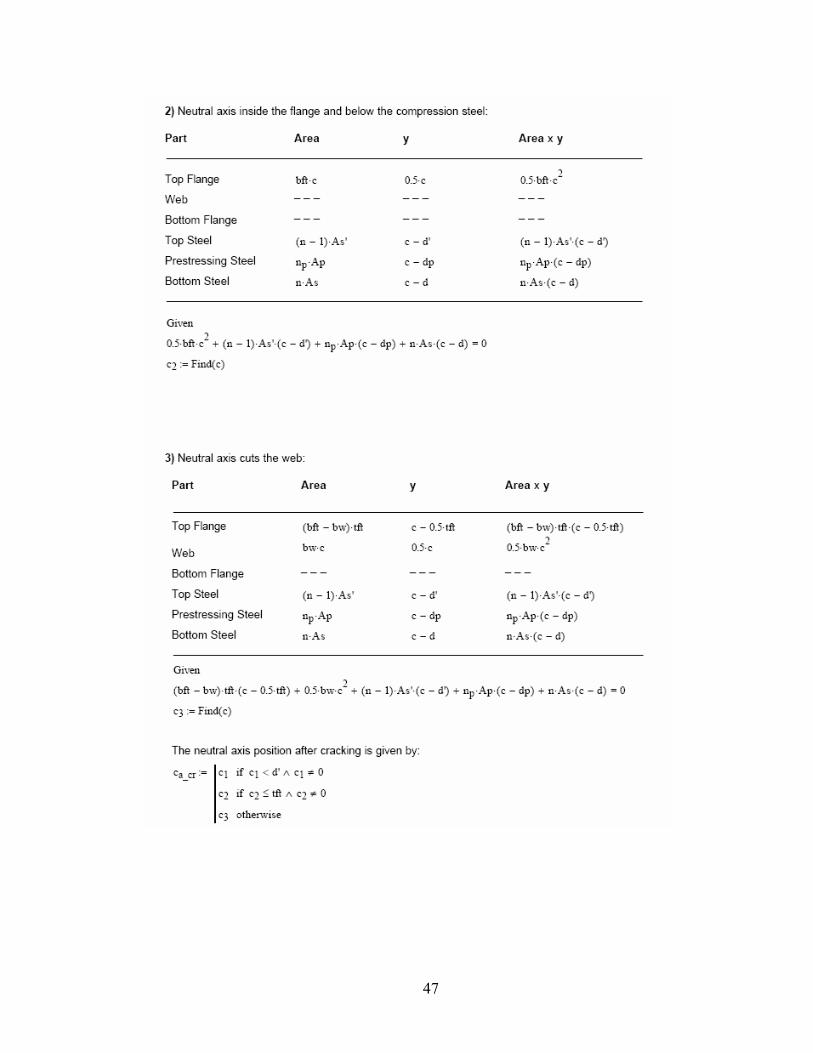
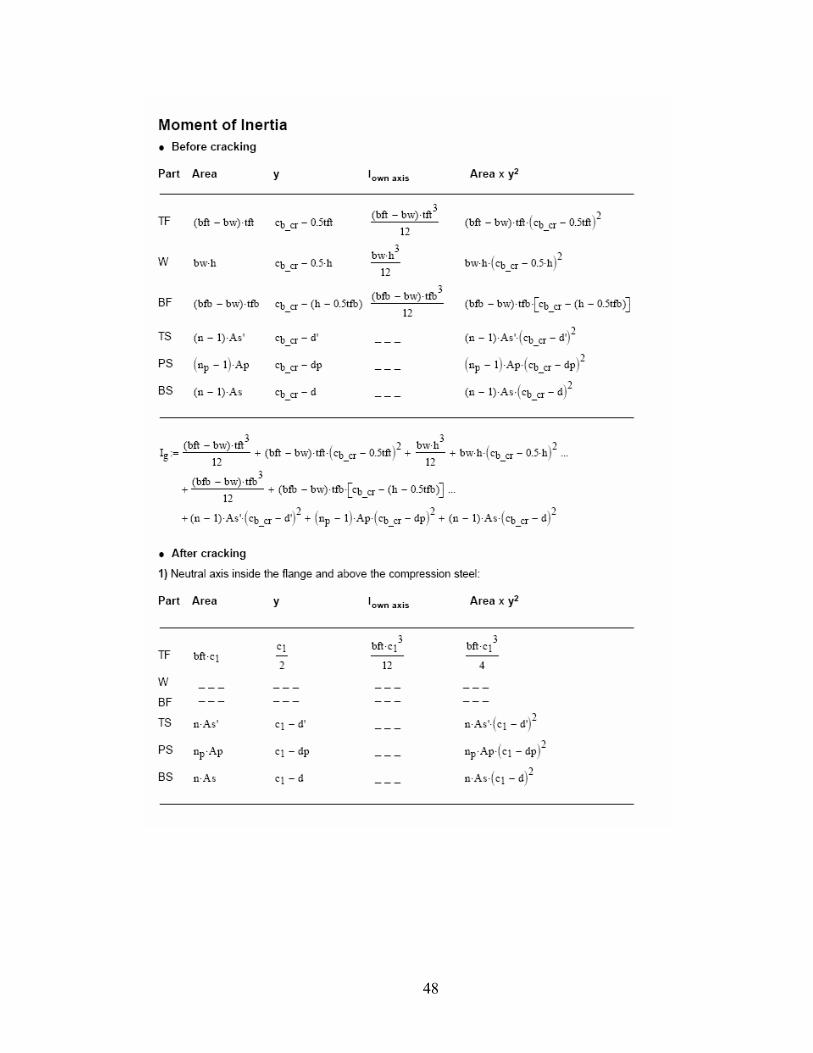
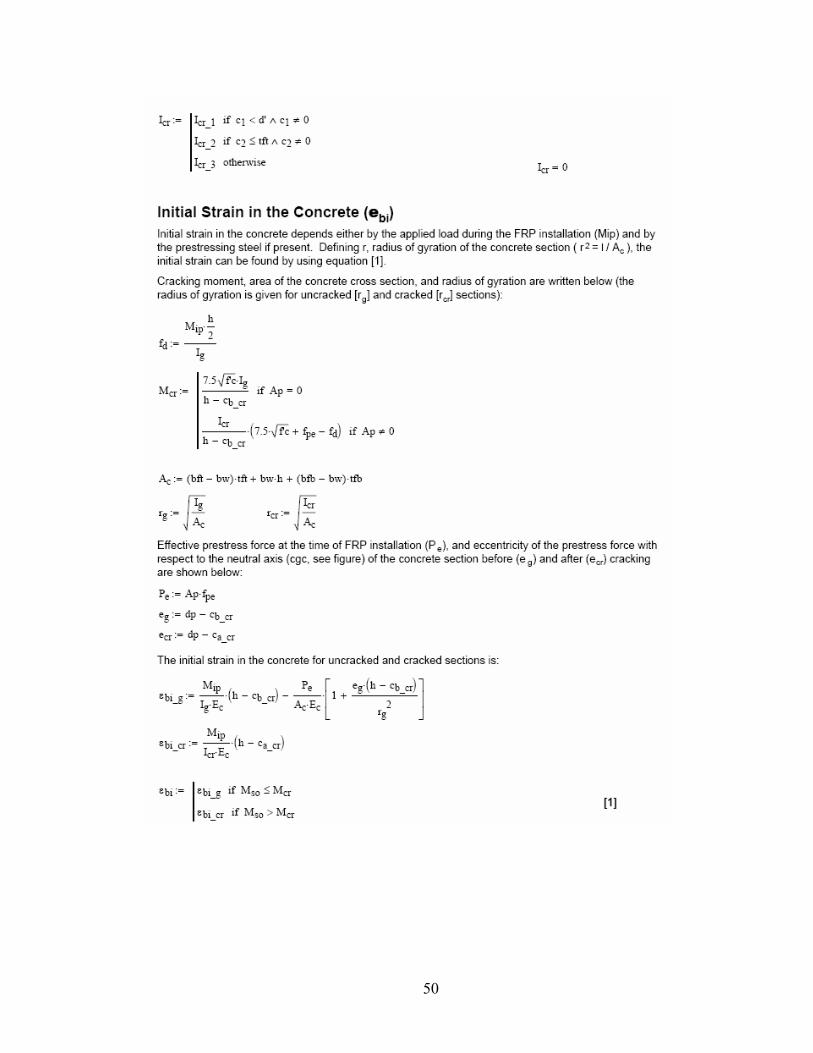
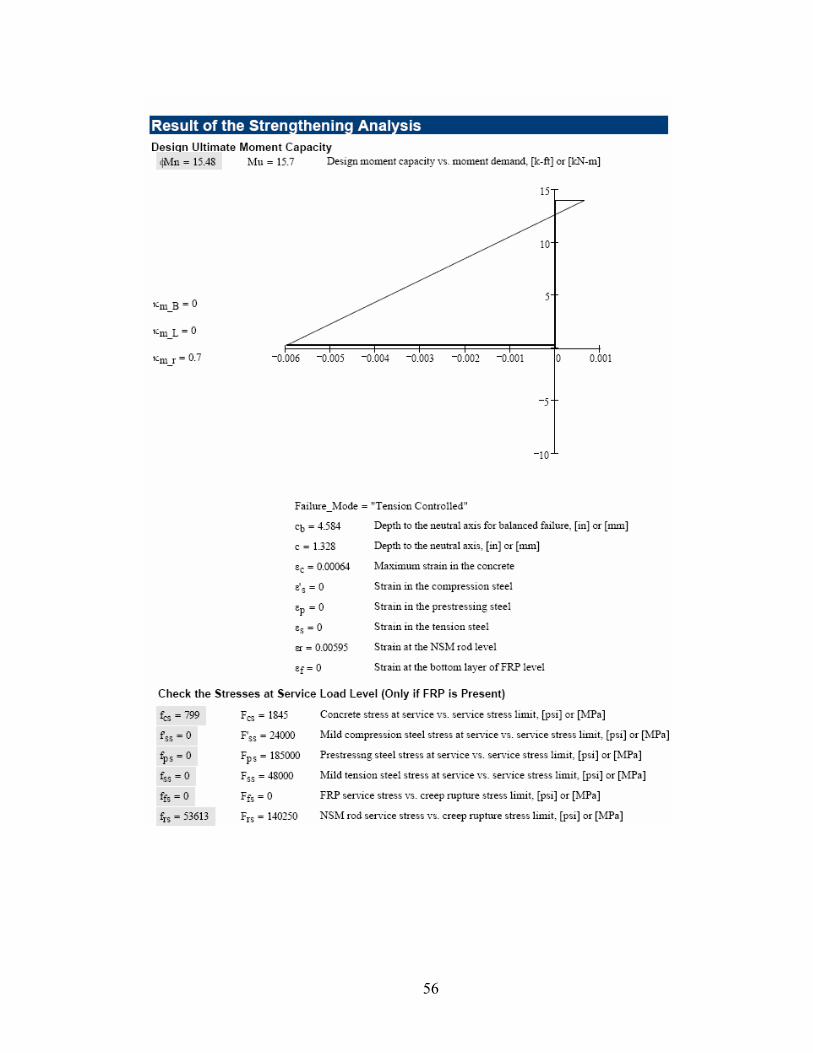
APPENDIX I
27
28

29

30
31

32

33
34

35

36
37

38

39
40
41
42

43

44
45

46
47
48

49
50

51

52

53

54

55
56

57
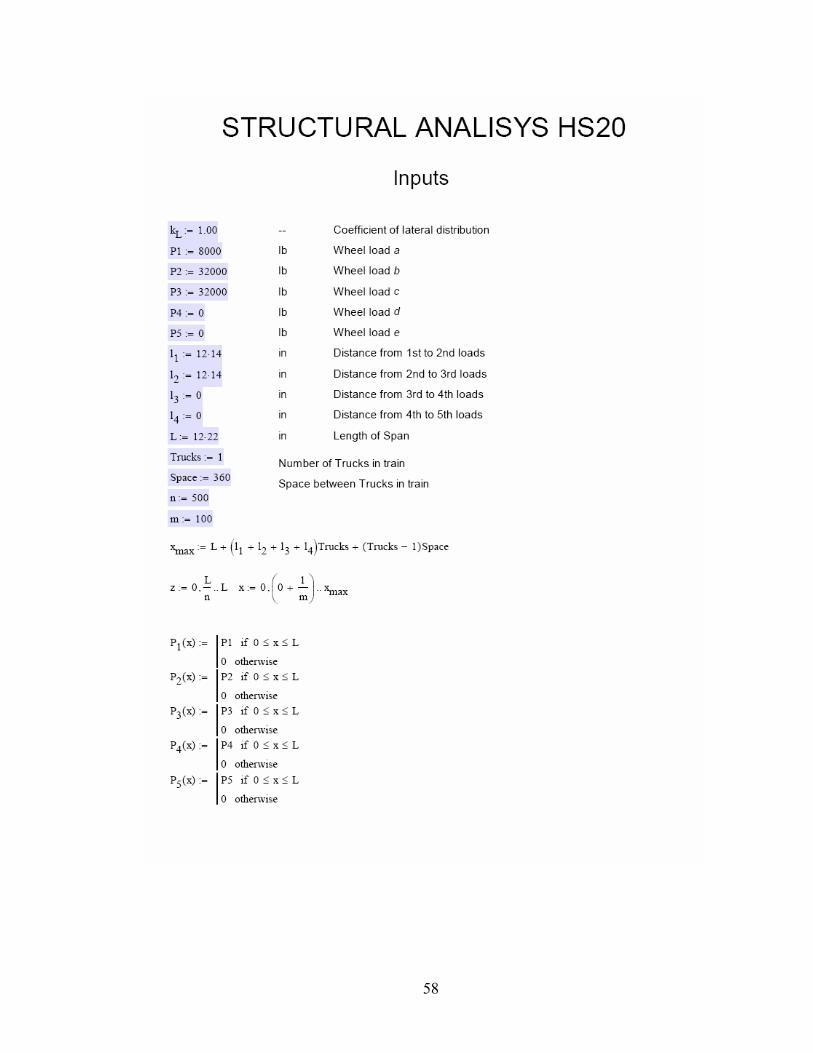
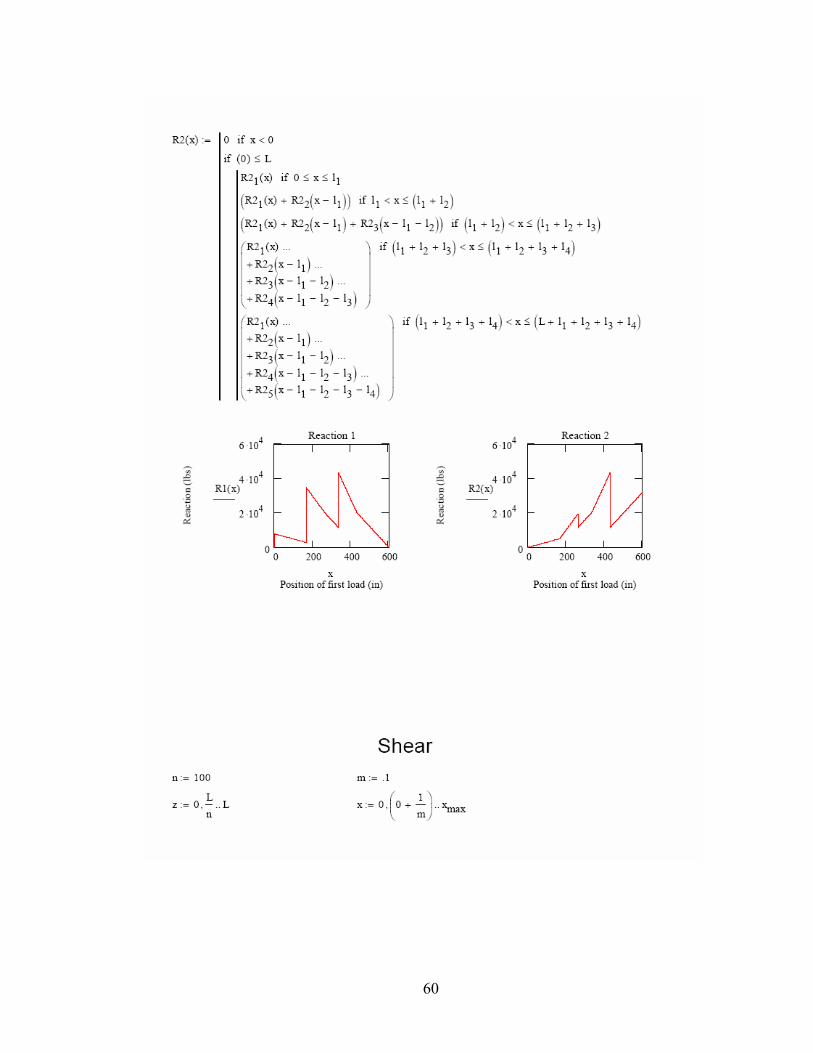
APPENDIX II
58

59
60

61
62
63

64
65

66

67
68

69
70

71
72
73
74
75

76
77
78