Embed Size (px)
Citation preview
Ž .Ecotoxicology 8, 351]368 1999Q 2000 Kluwer Academic Publishers, Boston. Manufactured in the Netherlands.
( )Stress proteins HSP’s : Methods of Detection and Their Use as anEnvironmental Biomarker
S. LEWIS, R. D. HANDY,U B. CORDI, Z. BILLINGHURST AND M. H. DEPLEDGEPlymouth En¨ironmental Research Centre, Uni ersity of Plymouth, Drake Circus, Plymouth,
De¨on PL4 8AA. e-mail: [email protected]
Abstract. This paper briefly reviews the nomenclature and application of stress proteins as biomarkers,then gives a step by step description of the popular methodologies used to measure stress protein in plantand animal tissues together with a critic of each approach and trouble shooting tips. Stress proteinsŽ .previously termed ‘‘heat shock proteins’’ are induced by many environmental stresses includingexposure to trace metals or organic pollutants, changes in temperature or osmolarity, hypoxiaranoxia,and exposure to ultraviolet radiation. Stress proteins, especially hsp70 and hsp60, have been used asbiomarkers in a range of algae, invertebrates, fish, and higher vertebrates. Several suggestions are madeto improve the utility of stress proteins as a biomarker of exposure e.g., consideration of the kinetics ofstress protein induction relative to the pharmacokinetics of pollutant accumulation in the organism ofconcern, and selection of the type of stress protein for biomonitoring. The methodologies describedinclude sample preparation, western blotting, slot blotting, and antibody detection methods, especially forhsp70. Western blotting has been the most widely applied technique for assaying stress proteins butdotrslot blotting with the inclusion of an internal standard in each gel improves the approach bysimplifying the technique}saving time and materials and producing a more quantitative result.
Keywords: stress protein, heat shock protein, HSP70, HSP60, HSP90, biomarker, detection method
CONTENTS
1. INTRODUCTION1.1. Nomenclature1.2. Suitability of stress proteins as biomarkers
2. METHODS FOR STRESS PROTEIN DETERMINATION2.1. Objective
2.1.1. Equipment for protein preparation2.2. Substrate for hsp70 assay2.3. Tissue preparation
2.3.1. Method A2.3.2. Method B
2.4. Total protein detection2.4.1. Chemical list for protein assay2.4.2. Equipment for protein assay
* Corresponding author: [email protected]
Lewis et al.352
2.5. Western blotting2.5.1. Equipment for Western blotting2.5.2. Protocol for Western blotting2.5.3. Immunoblotting2.5.4. Western transfer
2.6. Slot blotting2.6.1. Equipment list for slot blot2.6.2. Preparation2.6.3. Slot blot
3. STAINS3.1. Amido Black3.2. Ponceau S
4. ANTIBODIES4.1. Antibody preparation4.2. Example of antibodies used in hsp70 detection
5. DATA ANALYSIS-FOLLOWING DENSITOMETRY6. TROUBLE SHOOTING7. REFERENCES
1. Introduction
Many organisms are able to synthesize proteinswhich offer some protection from cellular damageŽHightower et al., 1985; Hightower, 1993; Mori-
.moto et al., 1995a; 1995b; Hartl, 1996 . Theseproteins were first described in cells fromDrosophila melanogaster during exposures to high
Ž .temperature Ritossa, 1962 , and so the termŽ .‘‘heat shock protein’’ hsp was coined. Since then,
a range of environmental stresses have beenshown to induce heat shock proteins, and theterm ‘‘Stress Protein’’ has subsequently been usedto describe these proteins. The environmentalstresses which can induce these proteins include,
Žtrace metal exposure Sanders et al., 1991; Bau-.man et al., 1993; Williams et al., 1996 , organic
Ž .pollutants Sanders, 1990 , changes in tempera-Žture Schlesinger, 1990a; Dietz, 1994; Currie and
. Ž .Tufts, 1997 or osmolarity Kultz, 1996 , hypoxiarŽ .anoxia Mestril et al., 1994; Myrmel et al., 1994 ,
Žand exposure to ultraviolet radiation Nepple and.Bachofen, 1997 . Some authors use the term
‘‘Stress Protein’’ to cover all the products of stressŽ .inducible genes Goering, 1993 such as cy-
tochrome P450’s, metallothioneins, heat-shockproteins, the heme biosynthesis pathway, hemeoxygenase, p53 and jun & fos oncogenes. Thischapter, however, will consider only heat shockproteins, we include homologous glucose regu-lated proteins, found in the endoplasmic reticu-
lum because their production is slightly inducedŽ .by heat shock Schlesinger, 1990a .
There are several families of heat shock pro-teins, largely classified by molecular weight. Theseinclude; hsp90, hsp70, Chaperonin, and those with
Ž .Low Molecular Weights LMW’s . Heat shockproteins are involved in normal biochemical pro-cesses such as ensuring the correct spatial and
Žfolding arrangements of cellular proteins Hartl,.1996 . It is therefore not surprising that hsp’s are
found in a wide variety of organisms from bacte-ria to humans. For example, hsp90 is expressed inzebra fish, Xenopus, and chick embryo’s and ap-pears to have a critical role in normal embryonic
Ždevelopment Ali et al., 1996; Sass and Krone,.1997 . Hsp70 is the most highly conserved of the
heat shock proteins, and has been identified inarcheobacteria, several species of algae, manymarine invertebrates, and all the classes of chor-
Ždates Hightower et al., 1985; Hightower, 1993;Yu et al., 1994; Trent, 1996; Williams et al., 1996;
.Currie and Tufts, 1997 . Hsp60 is also highlyconserved. The lower molecular weight proteinsare the least conserved, and relatively little is
Žknown about their function Stringham and Can-.dido, 1994 .
Hsp70 has the largest specific activity out ofthe stress proteins, and thus may be easier todetect. This specific activity probably comprises ofhsp70 variants which are induced by pollutantexposure and those which are not. Thus any
Stress Proteins 353
change in the specific activity of hsp70 duringpollutant exposure will be related to the induciblevariants. Nonetheless, an increase in the totalspecific activity of hsp70 within a biological sys-tem can be used as a nonspecific indicator ofstress. In some circumstances the induction ofhsp70 shows a clear response where ‘‘present’’and ‘‘absent’’ may serve as a biomarker. However,it is likely that a more gradual increase in theamount of hsp70 may need to be measured. Inorder to quantify the amount of hsp70 within asample a reliable standard to be used as a baseline must be available}total protein content isgenerally used. Levels of stress proteins are gen-erally cited per mg protein e.g., mg hsp70rmg
Ž .total protein see 2. .The approaches most frequently used to quan-
tify stress proteins include metabolic labeling fol-lowed by autoradiography and immunoassays withprotein-specific antibodies or cDNA probes. It isapparent that it will be the actual stress proteinconcentration that will be most reflective of thecell’s physiological state in organisms exposed tomoderate contamination over long periods. Themethodology we describe here has been used toassess physiological and environmental stress ininvertebrate, fish, and algae cells. This methodol-ogy is fundamentally similar to that used for avian
Žand mammalian tissues Hightower et al., 1985;Sanders, 1990; Schlesinger, 1990a; McCarthy andShugart, 1990; Huggett et al., 1992; Sanders et al.,1992; Bradley, 1993; Dyer et al., 1993a; Witzmannet al., 1995; Yamane et al., 1995; Pearson et al.,
.1996; Werner and Nagel, 1997 , but we have notused our method with tissues from the highervertebrates.
Western blotting, slot blotting, radioimmuno-Ž .assays RIAs and enzyme linked immunosorbantŽ .assay ELISAs are all methodologies which have
been used to detect and quantify stress proteinsŽe.g., Currie and Tufts, 1997; Werner and Nagel,
.1997 . These methods rely on the availability ofcross reactive antibodies for the proteins underinvestigation. Fortunately, the highly conservednature of heat shock proteins means that manyantibodies are species cross reactive. Westernblotting has been the most widely applied tech-nique for assaying stress proteins but dotrslotblotting with the inclusion of an internal standardin each gel improves the approach by simplifying
the technique}saving time and materials andproducing a more quantitative result. More quan-titative techniques are ELISAs and RIAs, buttheir development requires a high level of exper-tise and experience.
1.1. Nomenclature
There are three major families of proteins: hsp90,with variants between 80 and 100 KDaltons;hsp70, with variants between 65 and 75 KDaltons,hsp60 and the small hsp’s ranging from 16 to 40KDaltons. In addition there is a highly conservedubiquitin around 8 KDaltons. There are several
Žexcellent reviews Hightower et al., 1985; High-tower, 1993; Morimoto et al., 1995a; 1995b;
.Schlesinger, 1990a .hsp90}also referred to as hsp83 or hsp89
depending on the species concerned. This proteinis found in association with several cellular pro-teins. Association with hsp90 either enhances orinhibits the normal function of these proteins.The normal abundance of hsp90 may limit theextent to which its synthesis may be induced onexposure to stress.
hsp70}The hsp70 family accounts for a ma-jority of the translational activity in cells in re-
Žsponse to environmental perturbations hsp73 andhsp72 are two of at least 21 proteins in this
.group . Cross hybridization occurs with hsp70 andRNA from mammals, fish, nematodes, and mol-luscs indicating a high degree of gene conserva-tion.
hsp60 or chaperonin}also referred to as Gro-EL, is found in Escherichia coli and in otherrelated bacteria. It is also found in the mitochon-dria and chloroplasts of eukaryotic cells. Theseproteins facilitate the cellular translocation, andthen assemblage of oligomeric proteins withinorganelles. The synthesis of chaperonin increasesunder adverse environmental conditions thatcause an increase in the denaturation of protein.Chaperonin is highly conserved, has low back-ground levels and its synthesis is induced by stress.
hsp40}this protein has been identified inmammalian cells. hsp40 forms a cytoplasmic com-plex with hsp70, and functions co-operatively inrefolding denatured proteins after heat shockŽ .Tamane et al., 1995 . A hsp47 has been identi-fied in mammalian, avian, and fish cells which has
Lewis et al.354
a specific role in the processing of procollagenŽ .Pearson et al., 1996 .
hsp20]30}LMW stress proteins. These pro-teins are more species specific than the largerstress proteins and less conserved, with significantvariation occurring within the same class of or-ganism. These proteins appear to be homologousto a-crystalline and are not synthesized undernormal conditions. Their synthesis is regulatedduring development and differentiation is modi-fied by environmental factors.
Ubiquitin}involved in the nonlysosomal de-gradation of intracellular proteins in all eukary-otes. Its synthesis is increased with increase intemperature and during exposure to xenobiotics.Ubiquitin could have a complementary role tohsp70 involved in resolubizing and stabilizing pro-teins by targeting denatured proteins for degrada-
Ž .tion and removal Schlesinger, 1990b .Other stress proteins}other stress proteins have
been reported. Little is known about their struc-ture and function.
1.2. Suitability of stress proteins as biomarkers
Stress proteins play a primary role in protectingcells from injuries caused by a variety of pollu-tants, and stress protein levels have a potential
Žuse in environmental monitoring McCarthy andShuggart, 1990; Sanders, 1990; Huggett et al.,
.1993; Sanders, 1993 .There have been numerous studies of stress
Ž .proteins hsp70 and hsp60 in particular asbiomarkers and stress protein induction has beenshown to be caused by many pollutants at envi-
Žronmentally realistic levels Sanders, 1990; San-.ders et al., 1991; Bradley, 1993; Dyer et al., 1993a .
Some of the chemical contaminants that induceŽstress proteins and the organisms excluding hu-
.mans that have been studied for the induction ofstress proteins are summarized in Table 1.
The stress protein response persists during heatstress e.g., in mussels hsp70 and 60 remain high
Žover eight weeks of temperature stress Sanders.et al., 1992 . However, the kinetics of stress pro-
Table 1. Selected chemicals and environmental effects that induce stress proteins
Environmental stress Species studied and authors
a b, cŽ . Ž .Copper Mussel Mytilus edulis algae Enteromorpha compressa ,dŽ . ŽShore crab Carcinus maenas , Nematode Caenorhabditis
e.elegansf gŽ .Arsenite Xenopus , Fathead minnow Pimephales promelas ,
h eŽ .Tetrahymena pyriformis , Nematode Caenorhabditis elegansi jŽ .Mixtures of toxic metals Rainbow trout Oncorhynchus mykiss , Shore crab
k, 1 mŽ .Thermal stress Teleost fish Gillichthys miribalis , rainbowtrout ,n o Žsalamanders &freshwater turtles , rat , Mussel Mytilus
p.trossulusqŽ .Ultra-violet radiation Bacteria Rhodobacter sphaeroidese rŽ .Lead Nematode Caenorhabditis elegans , RateŽ . ŽCadmium Nematode Caenorhabditis elegans , Amphipods A. abdita,
s t u.R. abronius, H. azteca , rat , fish cell linessŽ .Organo-phosphate pesticides Amphipods A. abdita, R. abronius, H. azteca
Ž . Ž .sFluorothane PAH Amphipods A. abdita, R. abronius, H. aztecav, wŽ .Tributyl tin Mussel Mytilus edulis
eŽ .Mercury Nematode Caenorhabditis elegansxSilver Daphnia magna
a Sanders et al., 1990; bReed and Moffat, 1983; c Lewis et al., 1998; d Vedel and Depledge, 1995;eStringham and Candido, 1994; fAli et al., 1996; g Dyer et al., 1993a; hAmaral et al., 1988; i Williams etal., 1996; jPedersen and Lundebye, 1996; k Dietz, 1994; l Kultz, 1996; m Currie and Tufts, 1997; n Yu etal., 1994; o Mestril et al., 1994; pHofmann and Somero, 1995; q Nepple and Bachofen, 1997; rGoering,1993; s Werner and Nagel, 1997; tGoering et al., 1993; u Ryan et al., 1995; v Lundebye et al., 1996;wSteinert and Pickwell, 1993; x Bradley, 1993.
Stress Proteins 355
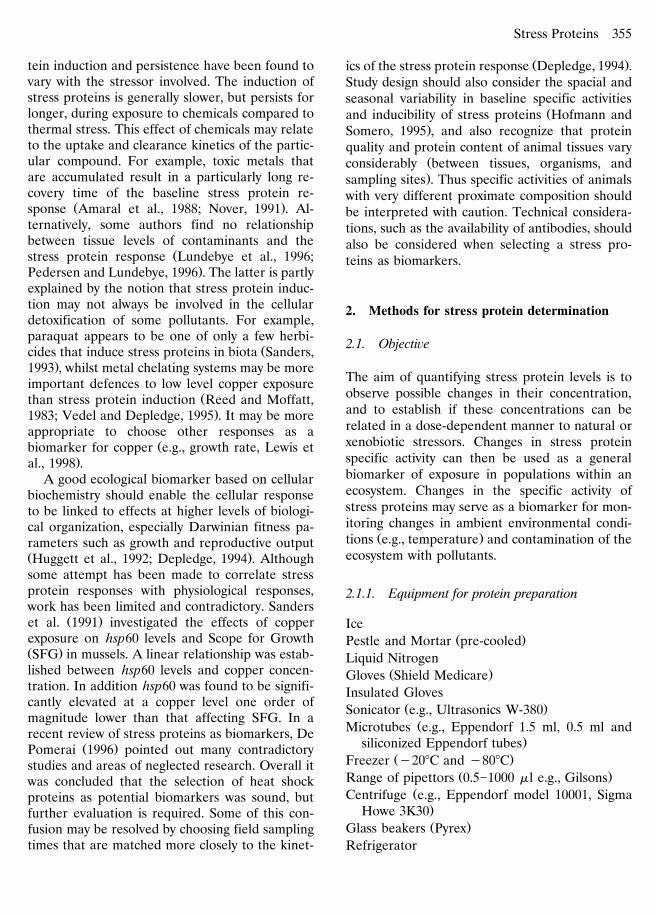
tein induction and persistence have been found tovary with the stressor involved. The induction ofstress proteins is generally slower, but persists forlonger, during exposure to chemicals compared tothermal stress. This effect of chemicals may relateto the uptake and clearance kinetics of the partic-ular compound. For example, toxic metals thatare accumulated result in a particularly long re-covery time of the baseline stress protein re-
Ž .sponse Amaral et al., 1988; Nover, 1991 . Al-ternatively, some authors find no relationshipbetween tissue levels of contaminants and the
Žstress protein response Lundebye et al., 1996;.Pedersen and Lundebye, 1996 . The latter is partly
explained by the notion that stress protein induc-tion may not always be involved in the cellulardetoxification of some pollutants. For example,paraquat appears to be one of only a few herbi-
Žcides that induce stress proteins in biota Sanders,.1993 , whilst metal chelating systems may be more
important defences to low level copper exposureŽthan stress protein induction Reed and Moffatt,.1983; Vedel and Depledge, 1995 . It may be more
appropriate to choose other responses as aŽbiomarker for copper e.g., growth rate, Lewis et
.al., 1998 .A good ecological biomarker based on cellular
biochemistry should enable the cellular responseto be linked to effects at higher levels of biologi-cal organization, especially Darwinian fitness pa-rameters such as growth and reproductive outputŽ .Huggett et al., 1992; Depledge, 1994 . Althoughsome attempt has been made to correlate stressprotein responses with physiological responses,work has been limited and contradictory. Sanders
Ž .et al. 1991 investigated the effects of copperexposure on hsp60 levels and Scope for GrowthŽ .SFG in mussels. A linear relationship was estab-lished between hsp60 levels and copper concen-tration. In addition hsp60 was found to be signifi-cantly elevated at a copper level one order ofmagnitude lower than that affecting SFG. In arecent review of stress proteins as biomarkers, De
Ž .Pomerai 1996 pointed out many contradictorystudies and areas of neglected research. Overall itwas concluded that the selection of heat shockproteins as potential biomarkers was sound, butfurther evaluation is required. Some of this con-fusion may be resolved by choosing field samplingtimes that are matched more closely to the kinet-
Ž .ics of the stress protein response Depledge, 1994 .Study design should also consider the spacial andseasonal variability in baseline specific activities
Žand inducibility of stress proteins Hofmann and.Somero, 1995 , and also recognize that protein
quality and protein content of animal tissues varyŽconsiderably between tissues, organisms, and.sampling sites . Thus specific activities of animals
with very different proximate composition shouldbe interpreted with caution. Technical considera-tions, such as the availability of antibodies, shouldalso be considered when selecting a stress pro-teins as biomarkers.
2. Methods for stress protein determination
2.1. Objecti e
The aim of quantifying stress protein levels is toobserve possible changes in their concentration,and to establish if these concentrations can berelated in a dose-dependent manner to natural orxenobiotic stressors. Changes in stress proteinspecific activity can then be used as a generalbiomarker of exposure in populations within anecosystem. Changes in the specific activity ofstress proteins may serve as a biomarker for mon-itoring changes in ambient environmental condi-
Ž .tions e.g., temperature and contamination of theecosystem with pollutants.
2.1.1. Equipment for protein preparation
IceŽ .Pestle and Mortar pre-cooled
Liquid NitrogenŽ .Gloves Shield Medicare
Insulated GlovesŽ .Sonicator e.g., Ultrasonics W-380ŽMicrotubes e.g., Eppendorf 1.5 ml, 0.5 ml and
.siliconized Eppendorf tubesŽ .Freezer y208C and y808C
Ž .Range of pipettors 0.5]1000 ml e.g., GilsonsŽCentrifuge e.g., Eppendorf model 10001, Sigma
.Howe 3K30Ž .Glass beakers Pyrex
Refrigerator
Lewis et al.356
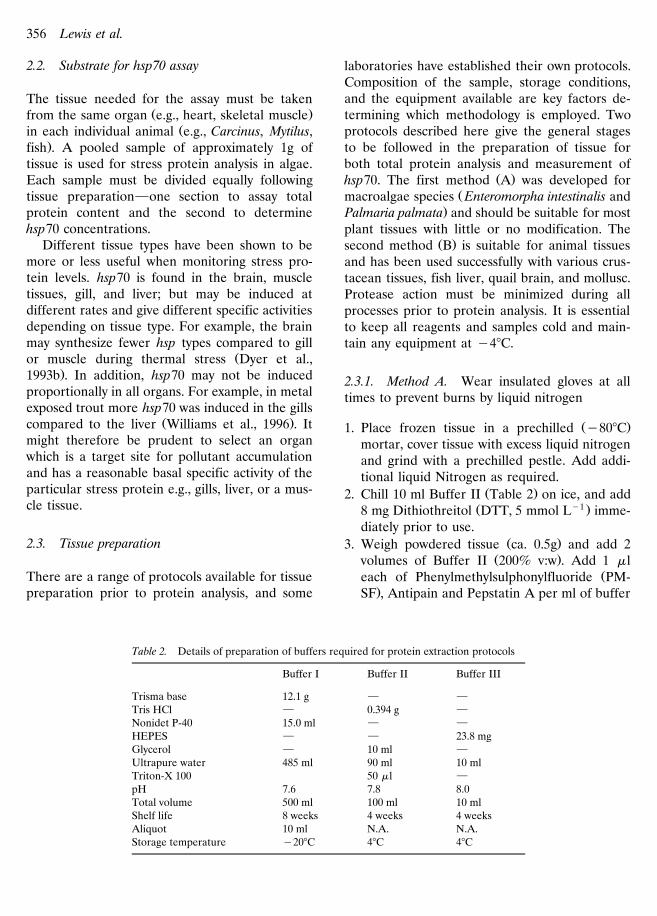
2.2. Substrate for hsp70 assay
The tissue needed for the assay must be takenŽ .from the same organ e.g., heart, skeletal muscle
Žin each individual animal e.g., Carcinus, Mytilus,.fish . A pooled sample of approximately 1g of
tissue is used for stress protein analysis in algae.Each sample must be divided equally followingtissue preparation}one section to assay totalprotein content and the second to determinehsp70 concentrations.
Different tissue types have been shown to bemore or less useful when monitoring stress pro-tein levels. hsp70 is found in the brain, muscletissues, gill, and liver; but may be induced atdifferent rates and give different specific activitiesdepending on tissue type. For example, the brainmay synthesize fewer hsp types compared to gill
Žor muscle during thermal stress Dyer et al.,.1993b . In addition, hsp70 may not be induced
proportionally in all organs. For example, in metalexposed trout more hsp70 was induced in the gills
Ž .compared to the liver Williams et al., 1996 . Itmight therefore be prudent to select an organwhich is a target site for pollutant accumulationand has a reasonable basal specific activity of theparticular stress protein e.g., gills, liver, or a mus-cle tissue.
2.3. Tissue preparation
There are a range of protocols available for tissuepreparation prior to protein analysis, and some
laboratories have established their own protocols.Composition of the sample, storage conditions,and the equipment available are key factors de-termining which methodology is employed. Twoprotocols described here give the general stagesto be followed in the preparation of tissue forboth total protein analysis and measurement of
Ž .hsp70. The first method A was developed forŽmacroalgae species Enteromorpha intestinalis and
.Palmaria palmata and should be suitable for mostplant tissues with little or no modification. The
Ž .second method B is suitable for animal tissuesand has been used successfully with various crus-tacean tissues, fish liver, quail brain, and mollusc.Protease action must be minimized during allprocesses prior to protein analysis. It is essentialto keep all reagents and samples cold and main-tain any equipment at y48C.
2.3.1. Method A. Wear insulated gloves at alltimes to prevent burns by liquid nitrogen
Ž .1. Place frozen tissue in a prechilled y808Cmortar, cover tissue with excess liquid nitrogenand grind with a prechilled pestle. Add addi-tional liquid Nitrogen as required.
Ž .2. Chill 10 ml Buffer II Table 2 on ice, and addŽ y1 .8 mg Dithiothreitol DTT, 5 mmol L imme-
diately prior to use.Ž .3. Weigh powdered tissue ca. 0.5g and add 2
Ž .volumes of Buffer II 200% v:w . Add 1 mlŽeach of Phenylmethylsulphonylfluoride PM-
.SF , Antipain and Pepstatin A per ml of buffer
Table 2. Details of preparation of buffers required for protein extraction protocols
Buffer I Buffer II Buffer III
Trisma base 12.1 g } }
Tris HCl } 0.394 g }
Nonidet P-40 15.0 ml } }
HEPES } } 23.8 mgGlycerol } 10 ml }
Ultrapure water 485 ml 90 ml 10 mlTriton-X 100 50 ml }
pH 7.6 7.8 8.0Total volume 500 ml 100 ml 10 mlShelf life 8 weeks 4 weeks 4 weeksAliquot 10 ml N.A. N.A.Storage temperature y208C 48C 48C
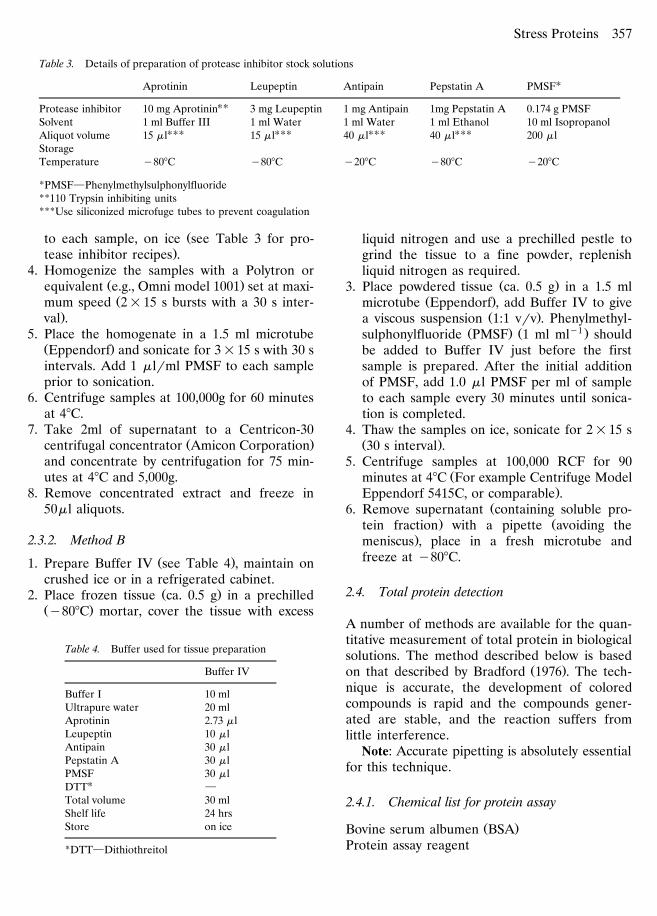
Stress Proteins 357
Table 3. Details of preparation of protease inhibitor stock solutions
UAprotinin Leupeptin Antipain Pepstatin A PMSF
UUProtease inhibitor 10 mg Aprotinin 3 mg Leupeptin 1 mg Antipain 1mg Pepstatin A 0.174 g PMSFSolvent 1 ml Buffer III 1 ml Water 1 ml Water 1 ml Ethanol 10 ml Isopropanol
UUU UUU UUU UUUAliquot volume 15 ml 15 ml 40 ml 40 ml 200 mlStorageTemperature y808C y808C y208C y808C y208C
*PMSF}Phenylmethylsulphonylfluoride**110 Trypsin inhibiting units***Use siliconized microfuge tubes to prevent coagulation
Žto each sample, on ice see Table 3 for pro-.tease inhibitor recipes .
4. Homogenize the samples with a Polytron orŽ .equivalent e.g., Omni model 1001 set at maxi-Žmum speed 2=15 s bursts with a 30 s inter-
.val .5. Place the homogenate in a 1.5 ml microtube
Ž .Eppendorf and sonicate for 3=15 s with 30 sintervals. Add 1 mlrml PMSF to each sampleprior to sonication.
6. Centrifuge samples at 100,000g for 60 minutesat 48C.
7. Take 2ml of supernatant to a Centricon-30Ž .centrifugal concentrator Amicon Corporation
and concentrate by centrifugation for 75 min-utes at 48C and 5,000g.
8. Remove concentrated extract and freeze in50ml aliquots.
2.3.2. Method B
Ž .1. Prepare Buffer IV see Table 4 , maintain oncrushed ice or in a refrigerated cabinet.
Ž .2. Place frozen tissue ca. 0.5 g in a prechilledŽ .y808C mortar, cover the tissue with excess
Table 4. Buffer used for tissue preparation
Buffer IV
Buffer I 10 mlUltrapure water 20 mlAprotinin 2.73 mlLeupeptin 10 mlAntipain 30 mlPepstatin A 30 mlPMSF 30 ml
UDTT }
Total volume 30 mlShelf life 24 hrsStore on ice
*DTT}Dithiothreitol
liquid nitrogen and use a prechilled pestle togrind the tissue to a fine powder, replenishliquid nitrogen as required.
Ž .3. Place powdered tissue ca. 0.5 g in a 1.5 mlŽ .microtube Eppendorf , add Buffer IV to give
Ž .a viscous suspension 1:1 vrv . Phenylmethyl-Ž . Ž y1 .sulphonylfluoride PMSF 1 ml ml should
be added to Buffer IV just before the firstsample is prepared. After the initial additionof PMSF, add 1.0 ml PMSF per ml of sampleto each sample every 30 minutes until sonica-tion is completed.
4. Thaw the samples on ice, sonicate for 2=15 sŽ .30 s interval .
5. Centrifuge samples at 100,000 RCF for 90Žminutes at 48C For example Centrifuge Model
.Eppendorf 5415C, or comparable .Ž6. Remove supernatant containing soluble pro-
. Žtein fraction with a pipette avoiding the.meniscus , place in a fresh microtube and
freeze at y808C.
2.4. Total protein detection
A number of methods are available for the quan-titative measurement of total protein in biologicalsolutions. The method described below is based
Ž .on that described by Bradford 1976 . The tech-nique is accurate, the development of coloredcompounds is rapid and the compounds gener-ated are stable, and the reaction suffers fromlittle interference.
Note: Accurate pipetting is absolutely essentialfor this technique.
2.4.1. Chemical list for protein assay
Ž .Bovine serum albumen BSAProtein assay reagent
Lewis et al.358
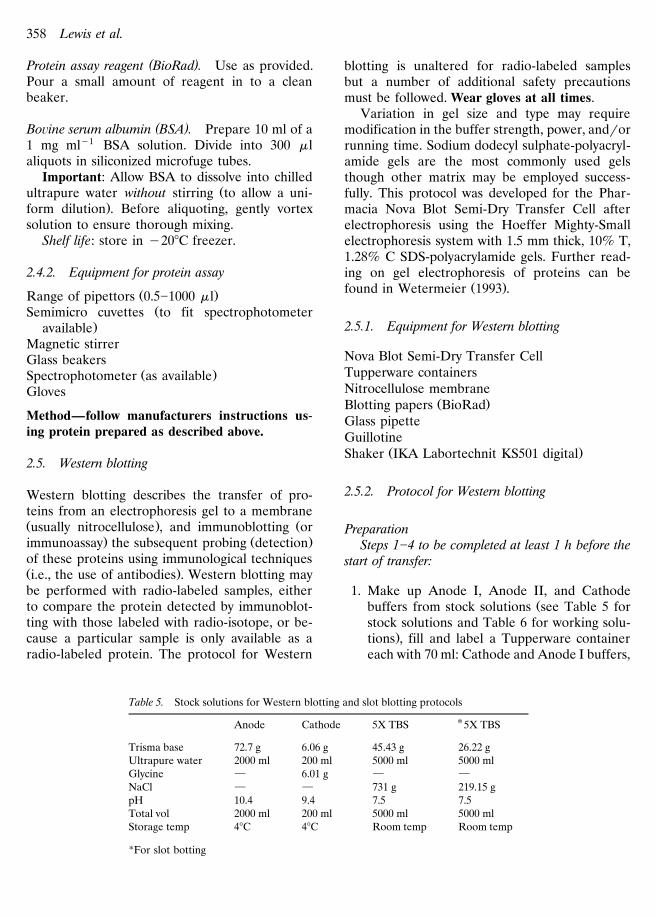
( )Protein assay reagent BioRad . Use as provided.Pour a small amount of reagent in to a cleanbeaker.
( )Bo¨ine serum albumin BSA . Prepare 10 ml of a1 mg mly1 BSA solution. Divide into 300 mlaliquots in siliconized microfuge tubes.
Important: Allow BSA to dissolve into chilledŽultrapure water without stirring to allow a uni-
.form dilution . Before aliquoting, gently vortexsolution to ensure thorough mixing.
Shelf life: store in y208C freezer.
2.4.2. Equipment for protein assay
Ž .Range of pipettors 0.5]1000 mlŽSemimicro cuvettes to fit spectrophotometer
.availableMagnetic stirrerGlass beakers
Ž .Spectrophotometer as availableGloves
Method—follow manufacturers instructions us-ing protein prepared as described above.
2.5. Western blotting
Western blotting describes the transfer of pro-teins from an electrophoresis gel to a membraneŽ . Žusually nitrocellulose , and immunoblotting or
. Ž .immunoassay the subsequent probing detectionof these proteins using immunological techniquesŽ .i.e., the use of antibodies . Western blotting maybe performed with radio-labeled samples, eitherto compare the protein detected by immunoblot-ting with those labeled with radio-isotope, or be-cause a particular sample is only available as aradio-labeled protein. The protocol for Western
blotting is unaltered for radio-labeled samplesbut a number of additional safety precautionsmust be followed. Wear gloves at all times.
Variation in gel size and type may requiremodification in the buffer strength, power, androrrunning time. Sodium dodecyl sulphate-polyacryl-amide gels are the most commonly used gelsthough other matrix may be employed success-fully. This protocol was developed for the Phar-macia Nova Blot Semi-Dry Transfer Cell afterelectrophoresis using the Hoeffer Mighty-Smallelectrophoresis system with 1.5 mm thick, 10% T,1.28% C SDS-polyacrylamide gels. Further read-ing on gel electrophoresis of proteins can be
Ž .found in Wetermeier 1993 .
2.5.1. Equipment for Western blotting
Nova Blot Semi-Dry Transfer CellTupperware containersNitrocellulose membrane
Ž .Blotting papers BioRadGlass pipetteGuillotine
Ž .Shaker IKA Labortechnit KS501 digital
2.5.2. Protocol for Western blotting
PreparationSteps 1]4 to be completed at least 1 h before the
start of transfer:
1. Make up Anode I, Anode II, and CathodeŽbuffers from stock solutions see Table 5 for
stock solutions and Table 6 for working solu-.tions , fill and label a Tupperware container
each with 70 ml: Cathode and Anode I buffers,
Table 5. Stock solutions for Western blotting and slot blotting protocols
UAnode Cathode 5X TBS 5X TBS
Trisma base 72.7 g 6.06 g 45.43 g 26.22 gUltrapure water 2000 ml 200 ml 5000 ml 5000 mlGlycine } 6.01 g } }
NaCl } } 731 g 219.15 gpH 10.4 9.4 7.5 7.5Total vol 2000 ml 200 ml 5000 ml 5000 mlStorage temp 48C 48C Room temp Room temp
*For slot botting
Stress Proteins 359
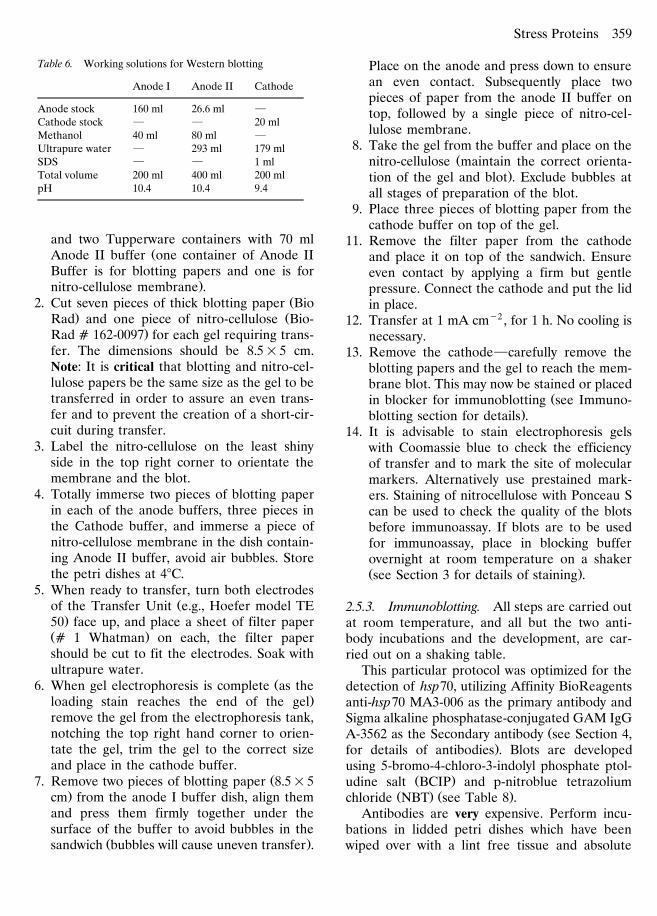
Table 6. Working solutions for Western blotting
Anode I Anode II Cathode
Anode stock 160 ml 26.6 ml }
Cathode stock } } 20 mlMethanol 40 ml 80 ml }
Ultrapure water } 293 ml 179 mlSDS } } 1 mlTotal volume 200 ml 400 ml 200 mlpH 10.4 10.4 9.4
and two Tupperware containers with 70 mlŽAnode II buffer one container of Anode II
Buffer is for blotting papers and one is for.nitro-cellulose membrane .
Ž2. Cut seven pieces of thick blotting paper Bio. ŽRad and one piece of nitro-cellulose Bio-
.Rad a 162-0097 for each gel requiring trans-fer. The dimensions should be 8.5=5 cm.Note: It is critical that blotting and nitro-cel-lulose papers be the same size as the gel to betransferred in order to assure an even trans-fer and to prevent the creation of a short-cir-cuit during transfer.
3. Label the nitro-cellulose on the least shinyside in the top right corner to orientate themembrane and the blot.
4. Totally immerse two pieces of blotting paperin each of the anode buffers, three pieces inthe Cathode buffer, and immerse a piece ofnitro-cellulose membrane in the dish contain-ing Anode II buffer, avoid air bubbles. Storethe petri dishes at 48C.
5. When ready to transfer, turn both electrodesŽof the Transfer Unit e.g., Hoefer model TE
.50 face up, and place a sheet of filter paperŽ .a 1 Whatman on each, the filter papershould be cut to fit the electrodes. Soak withultrapure water.
Ž6. When gel electrophoresis is complete as the.loading stain reaches the end of the gel
remove the gel from the electrophoresis tank,notching the top right hand corner to orien-tate the gel, trim the gel to the correct sizeand place in the cathode buffer.
Ž7. Remove two pieces of blotting paper 8.5=5.cm from the anode I buffer dish, align them
and press them firmly together under thesurface of the buffer to avoid bubbles in the
Ž .sandwich bubbles will cause uneven transfer .
Place on the anode and press down to ensurean even contact. Subsequently place twopieces of paper from the anode II buffer ontop, followed by a single piece of nitro-cel-lulose membrane.
8. Take the gel from the buffer and place on theŽnitro-cellulose maintain the correct orienta-
.tion of the gel and blot . Exclude bubbles atall stages of preparation of the blot.
9. Place three pieces of blotting paper from thecathode buffer on top of the gel.
11. Remove the filter paper from the cathodeand place it on top of the sandwich. Ensureeven contact by applying a firm but gentlepressure. Connect the cathode and put the lidin place.
12. Transfer at 1 mA cmy2 , for 1 h. No cooling isnecessary.
13. Remove the cathode}carefully remove theblotting papers and the gel to reach the mem-brane blot. This may now be stained or placed
Žin blocker for immunoblotting see Immuno-.blotting section for details .
14. It is advisable to stain electrophoresis gelswith Coomassie blue to check the efficiencyof transfer and to mark the site of molecularmarkers. Alternatively use prestained mark-ers. Staining of nitrocellulose with Ponceau Scan be used to check the quality of the blotsbefore immunoassay. If blots are to be usedfor immunoassay, place in blocking bufferovernight at room temperature on a shakerŽ .see Section 3 for details of staining .
2.5.3. Immunoblotting. All steps are carried outat room temperature, and all but the two anti-body incubations and the development, are car-ried out on a shaking table.
This particular protocol was optimized for thedetection of hsp70, utilizing Affinity BioReagentsanti-hsp70 MA3-006 as the primary antibody andSigma alkaline phosphatase-conjugated GAM IgG
ŽA-3562 as the Secondary antibody see Section 4,.for details of antibodies . Blots are developed
using 5-bromo-4-chloro-3-indolyl phosphate ptol-Ž .udine salt BCIP and p-nitroblue tetrazolium
Ž . Ž .chloride NBT see Table 8 .Antibodies are very expensive. Perform incu-
bations in lidded petri dishes which have beenwiped over with a lint free tissue and absolute
Lewis et al.360
ethanol. Lay the blots face up inside the dishesand use a glass Pasteur pipette to put on justenough antibody to cover the surface of the blot.Collect the antibody with a glass pipette after use.The antibody can be re-used several times.
Overnight blocking is recommended, followedŽ .by 2=5 min rinses in TBS see Table 8 . The blot
can then be dried between pieces of filter paperand stored in a, cool, and dark place. It is possibleto store these blots in a sealed, labeled ziplockbag for long periods before immunoassay. Tocomplete the procedure, resoak the blot in TBSfor 30 min and join in the protocol at the 15 min
Ž .rinse in TBS Step 3 .
2.5.4. Western transfer. See Tables 7 and 8 fordetails of solutions. The protocol is as follows:
1. Overnight in Blocker}place the gel in aŽsandwich box in 5% Blocker solution Table
. Ž8 overnight on a shaking table. The mini-.mum time for blocking is two hours.
2. Rinse the gel in TBS for 5 min3. Place the gel in TBS for 15 min while agitat-
ing gently4. Place the gel in primary Antibody for 1.5
hours, agitating gently5. Remove the gel from the antibody and place
in 5% Blocker solution for 45 min
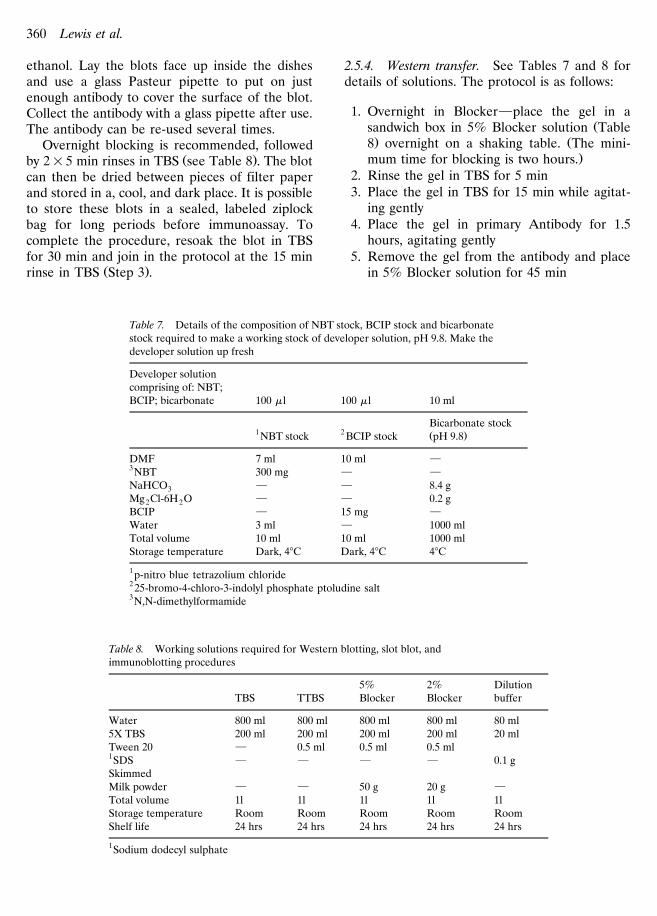
Table 7. Details of the composition of NBT stock, BCIP stock and bicarbonatestock required to make a working stock of developer solution, pH 9.8. Make thedeveloper solution up fresh
Developer solutioncomprising of: NBT;BCIP; bicarbonate 100 ml 100 ml 10 ml
Bicarbonate stock1 2 Ž .NBT stock BCIP stock pH 9.8
DMF 7 ml 10 ml }3NBT 300 mg } }
NaHCO } } 8.4 g3Mg Cl-6H O } } 0.2 g2 2BCIP } 15 mg }
Water 3 ml } 1000 mlTotal volume 10 ml 10 ml 1000 mlStorage temperature Dark, 48C Dark, 48C 48C
1 p-nitro blue tetrazolium chloride2 25-bromo-4-chloro-3-indolyl phosphate ptoludine salt3N,N-dimethylformamide
Table 8. Working solutions required for Western blotting, slot blot, andimmunoblotting procedures
5% 2% DilutionTBS TTBS Blocker Blocker buffer
Water 800 ml 800 ml 800 ml 800 ml 80 ml5X TBS 200 ml 200 ml 200 ml 200 ml 20 mlTween 20 } 0.5 ml 0.5 ml 0.5 ml1SDS } } } } 0.1 gSkimmedMilk powder } } 50 g 20 g }
Total volume 1l 1l 1l 1l 1lStorage temperature Room Room Room Room RoomShelf life 24 hrs 24 hrs 24 hrs 24 hrs 24 hrs
1Sodium dodecyl sulphate
Stress Proteins 361
6. Rinse the gel in two washes of TTBS, for 5min each time
7. Rinse the gel in two washes of TBS, for 5 mineach time
8. Place the gel in secondary Antibody for 2Žhours. If using Biotinylated SDS PAGE
Standards, incubate with an appropriate vol-ume of Avidin-AP as per suppliers instruc-
.tions. Ensure that the antibody is coveringthe blot all the time.
9. Rinse the gel in two washes of TTBS, for 5min each time
10. Rinse the gel in two washes of TBS, for 5 mineach time
11. Place the gel in Developer for 1 hour, Opti-mal developing time usually lies between30]60 min. This is influenced by the quantityof antigen, the age and quality of the antibod-ies, and the quality of the blot. Blots shouldbe developed until there is a clear and strongsignal then rinsed for 10 mins in ultrapurewater.
12. Once washed, dry blots between filter papersŽ .Whatman a1 .
2.6. Slot blotting
Slot-blotting is a simpler protocol than Westernblotting which facilitates a more rapid and quan-titative method for the detection of stress pro-teins. Initially however it is necessary to confirmthat the antibodies being employed only crossreact with the stress protein being monitored andno nonspecific staining is apparent. Western blot-ting is therefore required as an initial validationtechnique prior to the use of slot-blotting to assaystress proteins. Wear powderless gloves at alltimes.
2.6.1. Equipment list for slot blot
Dark roomŽ .Petri dish FalconŽ .Microtubes 1.5 ml, 0.5 ml Eppendorf
pH meterŽFilter tips for syringe Whatman 25 mm syringe
.filter, 0.2 um polysulfone membraneŽ .25 mm syringes Whatman
Overhead transparency filmŽ .Fiber free tissue Kim Wipes
Ž .Gloves powder free, Shield MedicareIce box, ice4.5 mm membrane
Ž .2= plastic box TupperwareHeat blockrwater bath
Ž .Vortex Rota Mixer, HATIGuillotineVacuum pump
Ž .Shaker IKA Labortechnit, KS501 digitalScissors
Ž .Range of pipettors 0.5]1000 mlŽ .Octopipette Gilson
ŽNitro-cellulose membrane 9 cm=12 cm,.0.45 mm
Ž . Ž3= blotting paper 9 cm=12 cm Bio Dot SF,.BioRad
Detection kit
ECL Amersham life scienceHyperfilm ECL}Amersham life science
Slot blotter
Bio-dot SF Microfiltration apparatus BioRad
Antibodies
Monoclonal anti heat shock protein 70 antibodyŽ .IgG , MA3-006 Affinity Bioreagents
Antimouse peroxidase linked with whole antibodyfrom sheep, NA-931 Amersham Life Science
2.6.2. Preparation
1. Prepare protein samples}as described aboveŽ .Section 2.3 . Plug in the heat block or waterbath and heat to 1008C.
2. Clean two plastic lunch boxes by wiping overwith absolute ethanol and fiber free tissue
3. Prepare:1.5 l TBS1 l TTBS250 ml of 2% blocker solution250 ml of 5% blocker solutionŽ .see Table 8 .
4. Soak 1 = precut nitro-cellulose membraneŽ . Ž .BioRad 9 cm=12 cm and 3 blotting papersŽ . Ž .BioRad 9 cm=12 cm in 40 ml TBS for 30
Ž .min note actual room temperature , in theplastic boxes while gently agitating on a shaker.Use a guillotine to cut the papers, it is critical
Lewis et al.362
that that they are the same size to ensure aneven transfer. Label the nitro-cellulose on thematte side with a pencil. Always labeling in thesame corner will assist you to orientate the gel.
5. Thaw protein samples on ice, in microtubesŽ .Eppendorf , ensure the samples are clearlylabeled.
Ž .6. Take 25 ml of Dilution buffer Table 8 andy1 Ž .add 1.6 mgrml DTT totals40 mg , on ice
ŽDTT is an antioxidizing agent which helps to.maintain the proteins in a functional form .
ŽSerially dilute the standards the standards arepreprepared isolates of Stress-70, Lundebye et
.al., 1995 , in duplicate. If possible use purifiedhsp70 available from the antibody supplier.
7. Dilute the protein samples with dilution buffer,Žas required use results from the protein assay
to ensure that an equal amount of protein is.contained within each 250 ml sample . A good
range for the protein content to be loaded isbetween 5]10 mg for plant and 50]100 mg foranimal samples respectively.
8. Prior to boiling the samples ensure the caps ofŽ .the tubes 1.5 ml, eppendorf are either se-
cured to prevent evaporation and the caps‘‘popping’’ open, which may result in a loss ofsample volume or have holes pierced in themto allow gas to escape. Boil the protein sam-
Ž . Žples 1008C and the standards purified heat.shock protein in the heat blockrwater bath
for 3 min.
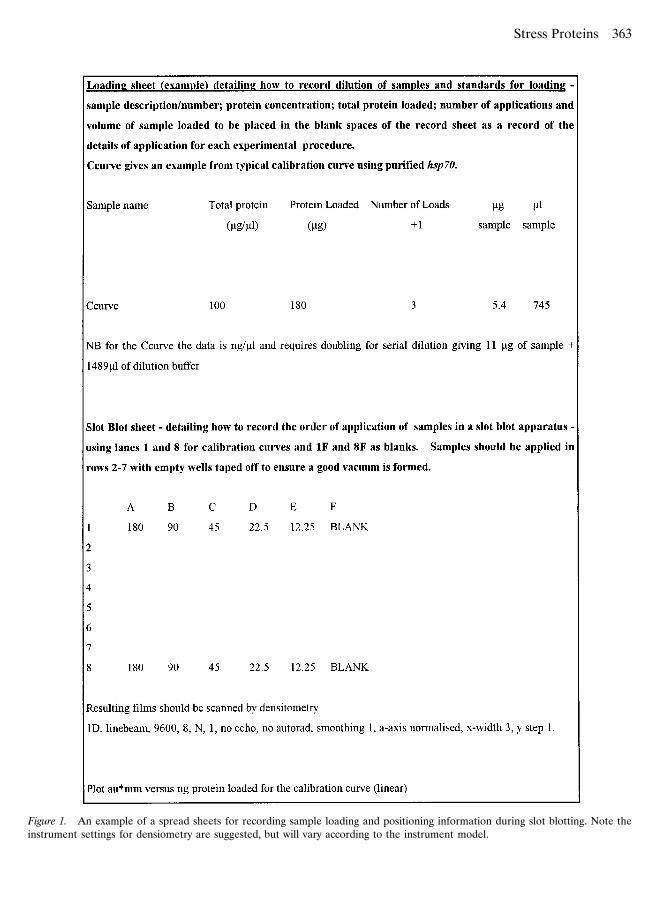
2.6.3. Slot blot. The following protocol for slotblotting has been used for algae tissue and mayneed optimization for animal tissue. An exampleof spread sheet illustrating how to keep a recordof the sample loading and positioning during slotblotting is illustrated in Figure 1.
1. Assemble the slot blot apparatus}follow theinstructions given by the manufacturer. At-tach the slot blot apparatus to a vacuumpump: turn the vacuum on to tighten thescrews on the Slot Blot apparatus and thenturn the pump off when the screws are se-cure. Block off any wells which will not be
Ž .used with tape any make to ensure that avacuum is formed within the slot blot.
Ž .2. Put on a second pair of gloves powder freeand place the 3 blotting papers and then the
membrane, from the plastic boxes, on the slotblot base. Finally, place the lid of the slot blotin position and tighten the screws on the slot
Žblot turn the vacuum on, then tighten the.screws and finally turn the vacuum off .
Ž3. Load 250 ml of the appropriate TBS see.Table 5 into each well of the slot blot appa-
Ž .ratus, with the octopipette Gilsons subse-quently, turn on the vacuum to draw the TBSthrough the membrane.
4. Vortex each boiled protein sample and load250 ml into each well of the slot blot appara-tus using a Gilsons pipette, avoid bubbles.Leave the samples to rest in the wells of theslot blot apparatus for 1 min. Load standardsin the top and bottom row, following a serialdilution, and load all samples in duplicate.
5. Draw samples onto the membrane by turningthe vacuum on. Draw through slowly to evenlyload proteins on to the nitrocellulose.
6. Load 250 ml TBS into each well, on top ofthe protein sample, with the octopipette andturn on the vacuum to draw the TBS into themembrane, this will ensure that all of thesample has been drawn into the membrane.
Immunoblotting
7. Remove the lid of the slot blot apparatus andplace the membrane in a clean plastic lunchbox in 70 ml 5% Blocker for 60 min, shaking
Žat 45 rpm NB when removing the membranenotch the top right hand corner to orientate
.membrane .8. Discard the 5% blocker and rinse the mem-
brane in 70 ml TBS in the plastic box, discardthe TBS, subsequently wash the membranetwice for 5 min each time in 70 ml TTBS, and
Ž . Žtwice for 5 min each time in TBS discard.the TBS and TTBS after each wash . For both
sets of washes use 70 rpm on the shaker andensure the membrane is completely immersedin the TBSrTTBS.
9. Use sharp scissors to trim the membrane to7 cm=10 cm, thoroughly drain the TBS tominimise uneven dilution of the antibody,place the membrane in a large Petri dish andcover with 1:1500 primary antibody in 2%
Ž Ž .blocker 4 ml of antibody stored at y208C
Stress Proteins 363
Figure 1. An example of a spread sheets for recording sample loading and positioning information during slot blotting. Note theinstrument settings for densiometry are suggested, but will vary according to the instrument model.
Lewis et al.364
.in 6 ml of 2% blocker for 90 min with the lidon at room temperature.
10. Remove the membrane from the Petri dishand discard the primary antibody, place themembrane in a plastic lunch box and block in3% blocker for 30 min, constantly shaking at45 rpm. Discard the blocking solution.
11. Wash the membrane twice for 5 min in 70 mlŽTTBS and twice for 5 min in 70 ml TBS both
.washes at 70 rpm , in the lunch box.12. Place the membrane in a second large Petri
dish and incubate in 1:1000 secondary anti-Ž Ž .body in 2% blocker 6 ml antibody 48C in
.6 ml 2% blocker for 60 min.13. Repeat step 11 above.
Visualization. The following steps should be per-formed in a dark room.
14. Drip dry the membrane carefully to avoidtearing}using tissue to absorb the excessliquid, place the blot face up in a large petridish.
Ž15. Mix chemicals AqB ECL detection kit,Amersham life sciences, as labeled by manu-
.facturer, store in the refrigerator and pourover the membrane blot, leave for 1 min.
16. Drip dry the blot and lay face down on anoverhead transparency, cover with secondoverhead transparency and place all threesheets into the cassette face upper most.Avoid any formation of bubbles, as this candisrupt the quality of the transfer.
Ž17. Turn the lights out infra-red safety light is. Žfine }place Hyperfilm ECL Amersham Life
.sciences over the blot and close the cassette.18. Expose the film to the membrane for 5 min,
remove the film and replace with a secondwhich is exposed for 10 min.
20. Place films in the Developing solution for 2m i n , s t o p s o l u t i o n f o r2 min and the fix solution for 45 seconds.Note, these times may vary between species.
21. Resulting films should be scanned by densito-Ž .metry according to the equipment available .
3. Stains
The stains covered in this section are primarilyfor checking the efficiency of transfer. They can
also be used to screen for banding patterns ofinterest. These are preferable to the use of anti-bodies because information is about all of theproteins within the sample.
3.1. Amido Black
This is a good general purpose stain to visualizeprotein bands on nitro-cellulose for optimizationand validation studies. It is moderately sensitive.
Ž .The stain can be reused ca. 8]10 times , howeverthe destain can not.
Method
1. Cover blots with stain in a large petri dish andplace on a shaker for 3]5 min.
2. Remove from stain, rinse with ultrapure water,and place in destain on a shaker for another3]5 min. If background stain is still too dark,replace with fresh destain for another 3]5 min.
3. Rinse with ultrapure water. Pour stain backinto bottle for re-use.
Amido Black Stain. Use Sigma Amido BlackStaining Solution. Dilute in bottle as per manu-facturers instructions. Make sure to mark on thebottle that it has been diluted.
Amido Black Destain
Ž .5 ml Glacial acetic acid 5%Ž .250 ml methanol 50%
Make up to 500 ml with ultrapure water
3.2 Ponceau S
Ponceau S is a stain of moderate sensitivity, how-ever it does have the advantage of being re-versible. This makes it possible for a blot to bestained to determine the transfer efficiency andthe overall banding pattern before blocking andimmunoassay.
Method
1. To stain blot after transfer, cover with Pon-ceau S staining solution in a large petri dishand place on a shaker for 30 s.
2. Remove blot from stain and place in anotherpetri dish with 1= TBS. Place on shaker for
Stress Proteins 365
10]30 s until bands can be distinguished overthe background.
3. Pour used stain into a separate labeled anddated jar.
4. To destain the protein bands, simply leave bloton shaker in TBS until all stain is rinsed away.
Ponceau S staining solution. Use Sigma PonceauS Staining Solution. Dilute in bottle as per manu-facturers instructions. Make sure to mark on thebottle that it has been diluted.
4. Antibodies
When antibody is received e.g., from AffinityBioReagents or Sigma Immunochemicals, use theproduct data sheet to record the date received,lot number, and expiration date of the antibodybatch. To simplify labeling of the antibody, assigneach new tube a sequential batch number andrecord this. When the antibody is aliquoted, re-move the label and attach to the data sheet tosignify that the batch is in use, and record thedate on the sheet. Aliquots should be labeledwith antibody type, batch number, and volume ofaliquot.
When blots are assayed, it is prudent to recordthe batch number of antibody used, age of dilutedantibody, and the number of times it has beenused in your experimental record. Between batchvariability is observed, it is therefore advisable touse the same batch number for a single experi-mentrsample set to avoid variation.
4.1. Antibody preparation
Antibodies are typically transported in bufferedsaline and lyophilized. Instructions for resuspen-sion accompany each antibody. Once resus-pended, pipette 5 to 10 ml aliquots of antibodysolution into the bottom of a micro test tubes andfreeze at y208. Label Tubes
Antibody dilution. The Technical Specificationsthat accompany each antibody will suggest aninitial dilution or working concentration for thatantibody. Protein visualization will vary depend-ing on a number of factors: the immunochemicalassay performed, the degree of cross-reactivity
between the antibody and stress protein and thequantity of protein to be probed. It is usuallynecessary to find an optimum concentration ofantibody for your experimental conditions.
To obtain a working concentration thaw analiquot of antibody and dilute with the appropri-
Žate volume of tris buffered saline TBS as used in.Immunoblotting in a 20 ml screw cap siliconized
Ž .or Sigmacote-ed plastic vial or equivalent. Add 2Ž .ml 10% wrv Sodium Azide per ml of TBS as a
Žpreservative only if visualizing by NBTrBCIP,azide interferes with ECL or other horseradishperoxidase systems. When the antibody’s shelf lifehas been exceeded, discard all diluted antibody atone time. Do not dilute a new antibody until it isneeded.
Shelf life. Once diluted in TBS antibodies shouldŽ .be refrigerated 48C and may be used for up to 1
month. Do not refreeze.
4.2. Example of antibodies used in hsp70 detection
MA3-006Description: Anti-hsp70Supplier: Affinity BioReagents
Žthrough Cambridge Bio-.science
Catalog number: MA3-006Specificity: MonoclonalClass: IgG1Species Information: Recombinant mouse anti -
humanWorking Dilution: 1:1000
Notes: Highly cross-reactive, yet specific to theŽ .stress-70 family Sanders and Dyer, 1994 . Does
not distinguish between constitutive or inducibleforms. Has been used successfully in Carcinusmaenas, Carcinus mediterraneus, Mytilus edulis,Crangon crangon, quail brain, Enteromorpha in-testinalis, and Palmaria palmata. Working dilutionoptimized for Western Blots using BCIPrNBTdevelopment of Sigma Immunochemicals AP con-jugated GAM IgG, cat.a a-3562, at a 1:1000working dilution.
SIGMA GAM IgGDescription: Alkaline Phosphatase con-
jugated anti-IgG second-ary antibody
Lewis et al.366
Supplier: Affinity BioReagentsCatalog number: A-3562Specificity: Affinity isolated to whole
moleculeClass: Not listedSpecies Information: Goat antimouseWorking Dilution: 1:1000
Notes: Working dilution has been optimized forWestern Blots using BCIPrNBT development inconjunction with MA3-006 at a 1:1000 workingdilution as the primary antibody.
5. Data analysis—Following densitometry
Once signal intensities have been measured, theycan then be related to the calibration curves andmore precisely compared with one another. Thefollowing method is a summary of that in Lunde-
Ž .bye et al. 1995 .
1. Plot calibration curves as absorbance units ver-sus relative protein amounts. For example, if acalibration curve consisted of lanes loaded with10, 25, 40, 55, and 70 mg protein, 5 mg couldbe chosen as the base unit. Since the abovecorresponds to a relative increase in analyteamounts, the points on the curve are trans-lated into 2, 5, 8, 11, and 14 relative analyte
Ž .amounts e.g., relative amount of hsp70 .Log both axes. The curve should be linear. If itis not, the next time samples are run a newrange for the calibration curve should be cho-sen. It is also advisable to check the quality ofthe sample material used for calibration.
2. Obtain the equation that describes the curveand use to calculate the relative analyteamounts for each sample using their ab-sorbance values. The calibrated value thus ob-tained can then be used for statistical analysis.Statistical methods chosen will depend on theexperiments performed.
6. Trouble shooting
Acclimation and acquired tolerance have beenobserved in aquatic species in the productionand amount of Stress proteins with they have intheir tissues. These processes may be due toadaptation to changes in environmental condi-tions and should be considered when comparing
Žorganisms from different sites e.g., Collisella,.Sanders et al., 1991 .
1. Always check reagent shelf life prior to use,old reagents will cause a wide range of prob-lems with the protocols including inaccurateand variable results, if any.
2. Contamination is a major problem when look-ing at stress proteins}always wear glove andensure all equipment is clean.
3. To ensure good transfer it is critical that eachtime a new layer of the transfer sandwich isformed the analyst remembers to smoothdown the new layer, removing trapped airbubbles and ensuring an even contact be-tween the layers. Failure to do so will resultin uneven blots due to the unequal distribu-tion of current through the transfer sand-wiches. It is also crucial that all layers of thestack are carefully aligned with one another.
4. With any electrophoresis system ensure thatthe current is on by checking the productionof bubbles at the cathode. Proteins will notmigrate during electrophoresis and transferwill not occur in western blotting without acurrent.
5. Care should also be taken to avoid a shortcircuit when making the transfer sandwich.
6. Proteins will be denatured if the samples arenot maintained at y48C, or below.
7. Inaccurate pipetting will cause inaccurate andinconsistant results}ensure all pipettes arecalibrated.
8. Bad or no transfer can result from the mem-brane being placed upside down on the blot,or on the film}use the notch in the left handtop corner to orientate the gel and mem-brane.
9. Poor transfer of protein can result if the gelpercentage is too high; transfer time is tooshort, power is too low, charge to mass ratio
Žis incorrect try a more acidic transfer buffer.to increase mobility , protein is precipitating
Ž .in the gel use SDS in the buffer , powersupply is tripped or methanol in the transferbuffer is restricting elution of proteins fromthe gel.
10. Swirls or missing patterns on blot}contactbetween the membrane and the gel is poor.Air bubbles or excess moisture remain be-tween the blot and the gel, the gel is not
Stress Proteins 367
completely equilibriated in the transfer bufferor power conditions are too high.
11. Gel cassette pattern is transfered to the blot}contaminated or thin blotting paper used,excessive amounts of protein loaded on to thegel, or too much SDS used in the trans-fer buffer. Proteins can pass through themembrane without binding, and recirculatethrough the system.
12. Poor binding to nitrocellulose membrane}nitrocellulose requires 20% methanol in thetransfer buffer for optimal binding, proteinscan be removed from the membrane by SDS,NP-40 and several other detergents, SDS inthe transfer buffer will reduce the binding ofproteins.
13. High background after incubation with anti-bodies}blocking conditions are not appro-
Ž .priate increase concentration of blocker ,monoclonal antibodies may react nonspecifi-cally or not at all with SDS denatured pro-teins, second antibody is impure, either anti-body is too concentrated, either antibody iscontaminated with nonspecific or species crossreactive IgG, washes are insufficient or reac-tion time in the substrate is insufficient.
14. Poor sensitivity}antigen binding is incom-plete, antigen may require special temper-ature regulation to prevent denaturation,monoclonal antibodies may no recognize adenatured antigen, antibody incubation timeis not sufficient or sample load is not suffi-cient.
7. References
Ž .Ali, A., Krone, P.H., Pearson, D.S. and Heikkila, J.J. 1996 .Evaluation of stress-inducible hsp90 gene expression as apotential molecular biomarker in Xenopus lae¨is. Cell Stress& Chaperones 1, 62]9.
Ž .Amaral, M.D., Galego, L. and Rodrigues-Pousada, C. 1988 .Stress response of Tetrahymena pyriformis to arsenite andheat shock: differences and similarities. European. Journalof Biochemistry 177, 463]70.
Ž .Bauman, J.W., Liu, J. and Klaassen, C.D. 1993 . Productionof metallothionein and heat-shock proteins in response tometals. Fundamental & Applied Toxicology 21, 15]22.
Ž .Bradford, M.M. 1976 . A rapid and sensitive method for thequantitation of microgram quantities of protein utilizingthe principle of protein dye binding. Analytical Biochem-istry 72, 248]54.
Ž .Bradley, B.P. 1993 . Are the stress proteins indicators ofexposure or effect? Marine En¨ironmental Research 35,85]8.
Ž .Currie, S. and Tufts, B. 1997 . Synthesis of stress protein 70Ž . Ž .Hsp70 in rainbow trout Oncorhynchus mykiss red bloodcells. Journal of Experimental Biology 200, 607]14.
Ž .De Pomerai, D.I. 1996 . Heat-shock proteins as biomarkersof pollution. Human and Experimental Toxicology 15, 279]
85.Ž .Depledge, M.H. 1994 . The rational basis for the use of
biomarkers as ecotoxicological tools. In M.C. Fossi and C.Ž .Leonzio eds Nondestructive Biomarkers in Vertebrates,
pp. 261]85. Boca Raton, Florida: Lewis Publishers.Ž .Dietz, T. 1994 . Acclimation of the threshold induction tem-
peratures for 70-kDa and 90-kDa heat shock proteins inthe fish Gillichthys miribalis. Journal of Experimental Biol-ogy 188, 333]8.
Dyer, S.D., Brooks, G.L., Dickson, K.L., Sanders, B.M. andŽ .Zimmerman, E.G. 1993a . Synthesis and accumulation of
stress proteins in tissues of arsenite-exposed fathead min-Ž .nows Pimephales promelas . En¨ironmental Toxicology &
Chemistry 12, 913]24.Dyer, S.D., Dickson, K.L., Zimmerman, E.G. and Sanders,
Ž .B.M. 1993b . Tissue specific patterns of heat shock pro-teins and thermal tolerance of the fathead minnow.Pimephales promelas. Canadian Journal of Zoology 69,2021]7.
Ž .Goering, P.L. 1993 . Lead-protein interactions as a basis forlead toxicity. Neurotoxicology 14, 45]60.
Ž .Georing, P.L., Kish, C.L., Fisher, B.R. 1993 . Stress proteinsynthesis induced by cadmium-cysteine in rat-kidney. Toxi-cology 85, 25]39.
Ž .Hartl, F.U. 1996 . Molecular chaperones in cellular proteinfolding. Nature 381, 571]80.
Ž .Hightower, L.E. 1993 . A brief perspective on the heat-shockresponse and stress proteins. Marine En¨ironmental Re-search 35, 79]83.
Hightower, L.E., Guidon, P.T., Whelan, S.A. and White, C.N.Ž .1985 . Stress responses in avian and mammalian cells. In
Ž .B.D. Atkinson and D.B. Waldens eds Changes in Eukary-otic Gene Expression in Response to En¨ironmental Stress,pp. 197]210. New York: Academic Press.
Ž .Hofmann, G.E. and Somero, G.N. 1995 . Evidence of proteindamage at environmental temperatures-seasonal changesin levels of ubiquitin conjugates and HSP70 in the inter-tidal mussel Mytilus Trossulus. Journal of ExperimentalBiology 198, 1509]18.
Huggett, R.J., Kimerie, R.A., Mehrle, Jr., P.M. and Bergman,Ž .H.L. 1992 . Biomarkers}Biochemical, Physiological and
Histological Markers of Anthropogenic Stress. Boca Raton,Florida: Lewis Publishers.
Ž .Kultz, D. 1996 . Plasticity and stressor specificity of osmoticand heat-shock responses of Gillichthys mirabilis gill cells.American Journal of Physiology. Cell Physiology 40, C1181]
93.Ž .Lewis, S., May, S., Donkin, M.E. and Depledge, M.H. 1998 .
The influence of copper and heatshock on the physiologyand cellular stress response of Enteromorpha intestinalis.Marine En¨ironmental Research 46, 421]4.
Lundebye, A.-K., Vedel, G.R., Krogsdam Christensen, A.M.,Ž .Kristiansen, K., Hunter, D. and Depledge, M.H. 1995 .
Improved quantification of stress proteins by western blot-ting. Analytica Chimica Acta 311, 109]14.
Lewis et al.368
Ž .Lundebye, A.-K., Langston, W.J. and Depledge, M.H. 1996 .Stress proteins and condition index as biomarkers of trib-utyltin exposure and effect in mussels. Ecotoxicology 5,1]10.
Ž .McCarthy, J.F. and Shugart, L. R. 1990 . Biomarkers of En¨i-ronmental Contamination. Boca Raton, Florida: Lewis Pub-lishers.
Ž .Mestril, R., Chi, S.-H., Sayen, R. and Dillman, W. H. 1994 .Isolation of a novel inducible rat heat-shock proteinŽ .HSP70 gene and its expression during ischemiarhypoxiaand heat shock. Biochemical Journal 298, 561]9.
Morimoto, R.I., Jurivich, D.A., Kroeger, P.E., Mathur, S.K.,Murphy, S.P., Nakai, Asarge, K., Abravaya, K. and Sisto-
Ž .nen, L.T. 1995a . Regulation of heat shock gene transcrip-tion by a family of heat shock factors. In R.I. Morimoto, A.
Ž .Tissieres and C. Georgopoulos eds The Biology of Heatshock Proteins and Molecular Chaperones, pp. 417]55. NewYork: Cold Spring Harbor Laboratory Press.
Ž .Morimoto, R.I., Tissiers, A. and Georgopoulos, C. 1995b .Progress and perspectives on the biology of heat shockproteins and molecular chaperones. In R.I. Morimoto, A.
Ž .Tissieres and C. Georgopoulos eds The Biology of Heatshock Proteins and Molecular Chaperones, pp. 1]30. NewYork: Cold Spring Harbor Laboratory Press.
Myrmel, T., McCully, J.D., Malkin, L., Krukenkamp, I.B. andŽ .Levitsky, S. 1994 . Heat shock protein 70 mRNA is in-
duced by anaerobic metabolism in rat hearts. Circulation90, 299]305.
Ž .Nepple, B.B. and Bachofen, R. 1997 . Induction of stressproteins in the phototrophic bacterium Rhodobactersphaeroides. FEMS Microbiology Letters 153, 173]80.
Ž .Nover, L. 1991 . The Heat Shock Response. Boca Raton,Florida: CRC Press.
Pearson, D.S., Kulyk, W.M., Kelly, G.M. and Krone, P.H.Ž .1996 . Cloning and characterization of a cDNA-encodingthe collagen-binding stress protein HSP47 in zebrafish.DNA and Cell Biology 15, 263]72.
Ž .Pedersen, S.N. and Lundebye, A.-K. 1996 . MetallothioneinŽ .and stress protein levels in shore crabs Carcinus maenus
along a trace metal gradient in the Fal Estuary SystemŽ .UK . Marine En¨ironmental Research 42, 241]6.
Ž .Reed, R.H. and Moffat, L. 1983 . Copper toxicity and coppertolerance in Enteromorpha compressa. Journal of Experi-mental Marine Biology and Ecology 69, 85]103.
Ž .Ritossa, F. 1962 . A new puffing pattern induced by tempera-ture shock and DNP in Drosophila. Experientia 18, 571]3.
Ž .Ryan, J.A. and Hightower, L.E. 1994 . Evaluation of heavy-metal ion toxicity in fish cells using a combined stressprotein and cytotoxicity assay. En¨ironmental Toxicology &Chemistry 13, 1231]40.
Ž .Sanders, B.M. 1990 . Stress-proteins: Potential as multitieredŽ .biomarkers. In L. Shugart and J. McCarthy eds En¨iron-
mental Biomarkers, pp. 165]91. Boca Raton, Florida: LewisPublishers.
Ž .Sanders, B.M. 1993 . Stress proteins in aquatic organisms: Anenvironmental perspective. Critical Re¨iews in Toxicology23, 49]75.
Sanders, B.M., Martin, L.S., Nelson, W.G., Phelps, D.K. andŽ .Welch, W. 1991 . Relationships between accumulation of
a 60 kDa stress protein and scope for growth in Mytilusedulis exposed to a range of copper concentrations. MarineEn¨ironmental Research 31, 81]97.
Sanders, B.M., Pascoe, V.M., Nakagawa, P.A. and Martin, L.S.Ž .1992 . Persistence of the heat-shock response over time ina common Mytilus mussel. Molecular Marine Biology and
Ž .Biotechnology 1 2 , 147]54.Ž .Sanders, B.M. and Dyer, S.D. 1994 . Cellular stress response.
En¨ironmental Toxicology & Chemistry 13, 1209]10.Ž .Sass, J.B. and Krone, P.H. 1997 . HSP90 alpha gene expres-
sion may be a conserved feature of vertebrate somitogene-sis. Experimental Cell Research 233, 391]4.
Ž .Schlesinger, M.J. 1990a . Heat-shock proteins: A mini review.Journal of Biological Chemistry 265, 12111]4.
Ž .Schlesinger, M.J. 1990b . The ubiquitin system and the heatshock response. In M.J. Schlesinger, M.G. Santoro and E.
Ž .Garaci eds Stress Proteins Induction and Function, pp.81]8. Springer-Verlag.
Ž .Steinert, S.A. and Pickwell, G.V. 1993 . Induction of HSP70proteins in mussels by ingestion of tributyltin. MarineEn¨ironmental Research 35, 89]93.
Ž .Stringham, E.G. and Candido, E.P.M. 1994 . Transgenichsp16-lacZ strains of the soil nematode Caenorhabditiselegans as biological monitors of environmental stress. En-¨ironmental Toxicology & Chemistry 13, 1211]20.
Ž .Trent, J.D. 1996 . A review of acquired thermotolerance, heatshock proteins, and molecular chaperones in Archea.FEMS Microbiology Re¨iews 18, 249]58.
Ž .Vedel, G.R. and Depledge, M.H. 1995 . Stress-70 levels ingills of Carcinus maenus exposed to copper. Marine Pollu-
Ž .tion Bulletin 31 1]3 , 84]6.Ž .Werner, I. and Nagel, R. 1997 . Stress proteins HSP60 and
HSP70 in three species of amphipods exposed to cadmium,diazinon, dieldrin, and fluoranthene. En¨ironmental Toxi-cology & Chemistry 16, 2393]403.
Ž .Wetermeier, R. 1993 . Electrophoresis in Practice: A Guide toTheory and Practice, pp. 277. New York: VCH Weinheim.
Williams, J.H., Farag, A.M., Stansbury, M.A., Young, P.A.,Ž .Bergman, H.L. and Petersen, N.S. 1996 . Accumulation of
HSP70 in juvenile and adult rainbow trout gill exposed tometal-contaminated water andror diet. En¨ironmentalToxicology & Chemistry 15, 1324]8.
Ž .Witzmann, F.A., Fultz, C. and Lipscomb, J. 1995 . Compara-tive 2D-electrophoretic mapping of human and rodenthepatic stress proteins as potential biomarkers. Appliedand Theoretical Electrophoresis 5, 113]7.
Ž .Witzmann, F., Clack, J., Fultz, C. and Jarnot, B. 1995 .2-Dimensional electrophoretic mapping of hepatic and re-nal stress proteins. Electrophoresis 16, 451]9.
Yamane, M., Hattori, H., Sugito, K., Hayashi, Y., Tohnai, I.,Ž .Ueda, M., Nishizawa, K. and Ohtsuka, K. 1995 . Co-
Ž .translocation and colocalization of HSP40 DNA J withŽ .HSP70 DNAk in mammalian cells. Cell Structure and
Function 20, 157]66.Ž .Yu, Z.M., Magee, W.E. and Spotila, J.R. 1994 . Monoclonal-
antibody ELISA test indicates that large amounts of con-stitutive HSP-70 are present in salamanders, turtles andfish. Journal of Thermal Biology 19, 41]53.


![INTERNATIONAL JOURNAL OF SCIENTIFIC & TECHNOLOGY … · to as either ‗‗Heat-shock proteins‘‘, ‗‗Stress-induced proteins‘‘ or ‗‗Stress proteins‘‘ [2, 11]. Almost](https://img.pdfslide.net/doc/110x75/6051975d216f365a1c1d7c49/international-journal-of-scientific-technology-to-as-either-aaheat-shock.jpg)


![Stress Proteins[1]](https://img.pdfslide.net/doc/110x75/577d26891a28ab4e1ea1800a/stress-proteins1.jpg)


