Embed Size (px)
Citation preview
UNITED STATES DEPARTMENT OF LABORFrances Perkins, Secretary
BUREAU OF LABOR STATISTICSIsador Lubin, Commissioner
MI.•••••••••■••4
Serial No. R. 1282
STRIKES IN 1940
From the MONTHLY LABOR REVIEWof the Bureau of Labor StatisticsUnited States Department of LaborMAY 1941 issue
UNITED STATES GOVERNMENT PRINTING OFFICE • WASHINGTON • 1941

STRIKES IN 1940 1
IN SPITE of the widespread industrial expansion and increased em-ployment in 1940, strike activity during the year, as measured bythe number of workers involved, was at a comparatively low level.This is particularly evident when comparison is made over a periodof years between the number of workers involved in strikes and thetotal working population, excluding, of course, such groups as domes-tic servants, teachers, and supervisory persons, among whom strikesrarely if ever occur.' Such a comparison shows that the number ofworkers involved in strikes in 1940 constituted 2.3 percent of thetotal workers in the country (as above defined) as compared with4.7 percent in 1939, more than 7 percent in 1934 and 1937, and (goingback to the period of the World War) with 8.4 percent in 1916 andmore than 6 percent in 1917 and 1918. (See chart 2.)
According to final figures compiled by the Bureau of Labor Statis-tics, 2,508 strikes began in 1940 in which 576,988 workers were in-volved.' The number of man-days of idleness caused by strikesduring the year was 6,700,872. The number of strikes in 1940 waspractically the same (96 percent as great) as in 1939; less than half(49 percent) as many workers were involved as in 1939 and theamount of idleness resulting from strikes in 1940 was less than two-fifths (38 percent) as great as in the preceding year.' The generalbituminous-coal stoppage in April and May of 1939 was a majorfactor in raising the number of workers and man-days of idlenessduring that year. However, the 1940 strikes involved only a littlemore than three-fifths as many workers and man-days as did the 1939strikes other than the general coal stoppage.
As compared with the respective averages for the 5 years precedingthe beginning of the national-defense program (1935-39) there were12 percent fewer strikes in 1940; 51 percent as many workers wereinvolved and 40 percent as much idleness occurred during the strikesof 1940.
I Prepared in the Industrial Relations Division of the Bureau of Labor Statistics.2 It may be noted, however, that a comparison with all employed persons would not change appreciably
the trend indicated by the percentages given here or in table 1.It is believed that this represents a substantially complete coverage of all strikes in which as many as 6
workers were involved and which lasted for as long as 1 working day or shift. It is possible that a fewminor disputes escaped attention. The Bureau obtains its notices or "leads" concerning strikes and lock-outs from the public press, labor and trade papers and journals, and from the various city, State, andFederal Government agencies having to do with labor disputes. Detailed reports on each strike are solic-ited and received from representatives of the union and employer(s) involved. The term "strike" is usedto cover all stoppages of work due to labor disputes whether these are called strikes or lock-outs.
(1)

CHART I.
TREND OF STRIKES, 1881-1940INDEX 1935-39=100 INDEX400
350
300
250
200
ISO
100
50
400
350
300
250
200
150
100
50
0C....-NErt0
.-WORKERS „MAN-DAYS IDLE
STRIKES t \ / I/A\
'./'
\
1
.0" -
1 1 1 1 I 1
I \_.. 1 I .)'
I ,
\ x,,
1 1 1 1
.......-,
1 1 1 1
ir/- /1 1 1 I
,--
1 1 1 1 1 11 / I I 11 1 1 1 1 1 I 1 1 I"0 01881 1885 1890 1895 1900 1905 1914 1920 1925 1930 1935 1940 1944
UNITED STATES DEPARTMENT OF LABORBUREAU OF LABOR STATISTICS

3
TABLE 1.-Strikes in the United States, 1881 to 1940
Year
Number of- Index (1935-39=100) Percent oftotal
workers 2involvedin strIkesStrikes Workers
involved IMan-days
idle Strikes Workersinvolved
Man-days idle
1881 477 130, 176 (3) 17 12 (3)1882 476 158,802 (3) 17 14 (3)1883 506 170, 275 (3) 18 15 (3)1884 485 165,175 (3) 17 15 (3)1885 695 258, 129 (9 24 23 (3)1886 1, 572 610, 024 (3) 55 54 (3)
1887 1,503 439,306 (3) 53 39 (8)1888 946 162,880 (3) 33 14 (3)1889 1, 111 260, 290 (3) 39 23 (3)1890 1,897 373,499 (3) 66 33 4.21891 1,786 329,953 (3) 62 29 3.61892 1,359 238,685 (3) 47 21 2.5
1893 1,375 287,756 (3) 48 26 3. 21894 1, 404 690, 044 (3) 49 61 8.31895 1,255 407,188 (3) 44 36 4. 41896 1, 066 248, 838 (3) 37 22 2.81897 1,110 416,154 (3) 39 37 4.31898 1, 098 263, 219 (3) 38 23 2.6
1899 1,838 431,889 (8) 64 38 3.91900 1,839 567,719 (3) 64 50 4. 91901 3, 012 563, 843 (3) 105 50 4.61902 3,240 691,507 (3) 113 61 5.41903 3,648 787,834 (3) 127 70 5. 91904 2, 419 573, 815 (3) 85 51 4.3
1905 2,186 302,434 (3) 76 27 2. 11906-13 (3) (3) (3) (8) (3) (3)1914 1,204 (3) (3) 42 (3) (3)1915 1,593 (3) (3) 56 (3) (3)1916 1 3,789 1,599,917 (3) 132 142 8.41917 4,450 1,227,254 (3) 155 109 6.3
1918 3,353 1,239,989 (3) 117 110 6. 21919 3, 630 4, 160, 348 (3) 127 370 20. 81920 3, 411 1, 463, 054 (3) 119 130 7.21921 • 2,385 1,099,247 (3) 83 98 6.41922 1,112 1,612,562 (3) 39 143 8.71923 1,553 756,584 (3) 54 67 3.5
1924 1,249 654,641 (8) 44 58 3.11925 1,301 428,416 (3) 45 38 2.01926 1, 035 329, 592 (3) 36 29 1.51927 707 329,939 26,218,628 25 29 155 1. 41928 604 314, 210 12, 631, 863 21 28 75 1. 31929 921 288, 572 5, 351, 540 32 26 32 1. 2
1930 637 182, 075 3, 316, 808 22 16 20 .81931 810 341, 817 6, 893, 244 28 30 41 1.01932 841 324,210 10, 502, 033 29 29 62 1.81933 1, 695 1, 168, 272 16, 872, 128 59 104 100 6. 31934 1, 856 1, 466, 695 19, 591, 949 65 130 116 7. 21935 2, 014 1, 117, 213 15, 456, 337 70 99 91 5. 2
1936 2, 172 788, 648 13, 901, 956 76 70 82 3. 11937 4, 740 1, 860, 621 28, 424, 857 166 165 168 7. 21938 2, 772 688, 376 9, 148, 273 97 61 54 2. 81939 2, 613 1, 170, 962 17, 812, 219 91 104 105 4. 71940 2, 508 576, 988 6, 700, 872 88 51 40 2. 3
1 The number of workers involved in some strikes which occurred between 1916 and 1926 is not known.However, the missing information is for the smaller disputes and it is believed that the total here given isfairly accurate.
2 "Total workers" as used here includes all workers except those in occupations and professions wherestrikes rarely if ever occur. In general, the term "total workers" includes all employees except the follow-ing groups: government workers, agricultural wage earners on farms employing less than 6, managerial andsupervisory employees, and certain groups which because of the nature of their work cannot or do not strike,such as college professors, commercial travelers, clergymen, and domestic servants. Self-employed andunemployed persons are, of course, excluded.
3 No information available.
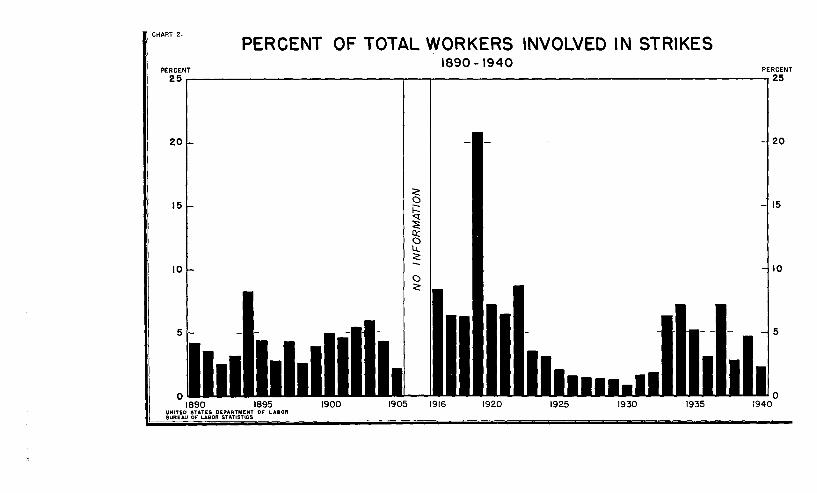
CHART 2.
PERCENT25
20
15
I0
PERCENT OF TOTAL WORKERS INVOLVED IN STRIKES1890-1940
PERCENT25
01111 11111111111 1111900 1905 1916
5 -
1890 1895UNITED STATES DEPARTMENT OF LABORBUREAU OF LABOR STATISTICS
20
15
10
5
1935 140°
5
There were no extremely large strikes in 1940. The three largeststrikes involved about 15,000 each-a 2-day stoppage in the New Yorkclothing industry in July, a 2-day stoppage of St. Louis building-tradesworkers in October, and a month's stoppage of New York paintersbeginning in August. A fourth large strike, taking place in December,involved nearly 12,000 workers in the Pacific Northwest lumberindustry. The New York clothing stoppage resulted from the union'sattempt to stabilize the industry by limiting the number of contractorsto whom each jobber could give work; the establishment of union con-ditions on all construction projects was the major issue in the St. Louisbuilding-trades strike; the painters' dispute involved the question ofincreased wages and a reduction in hours; and the lumber disputeinvolved issues of wage increases and vacations with pay.
Strikes by MonthsStrike activity in 1940 was at a lower level during the first 8 months
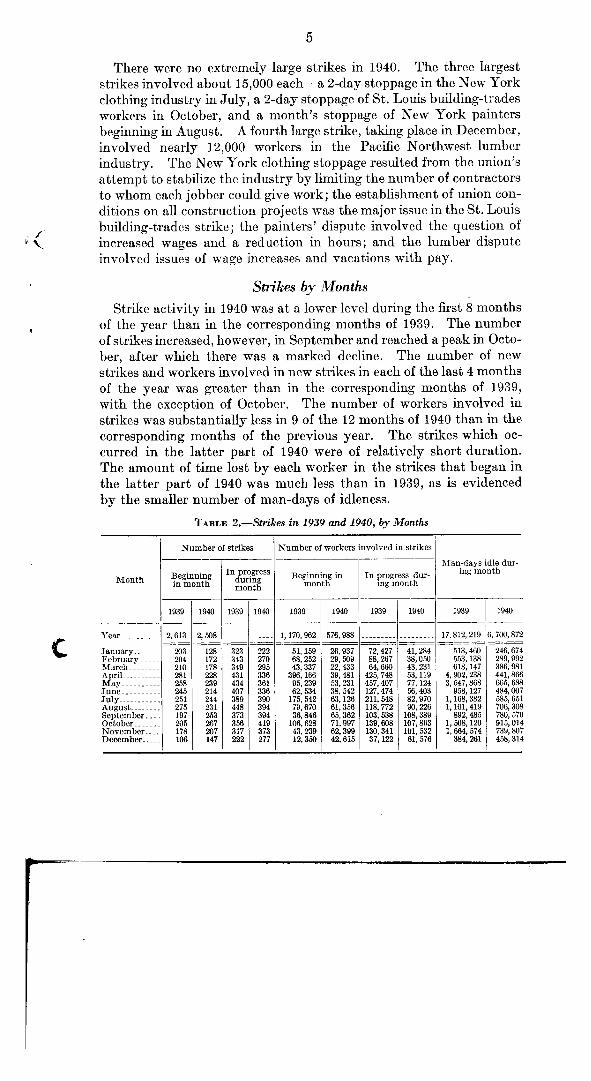
of the year than in the corresponding months of 1939. The numberof strikes increased, however, in September and reached a peak in Octo-ber, after which there was a marked decline. The number of newstrikes and workers involved in new strikes in each of the last 4 monthsof the year was greater than in the corresponding months of 1939,with the exception of October. The number of workers involved instrikes was substantially less in 9 of the 12 months of 1940 than in thecorresponding months of the previous year. The strikes which oc-curred in the latter part of 1940 were of relatively short duration.The amount of time lost by each worker in the strikes that began inthe latter part of 1940 was much less than in 1939, as is evidencedby the smaller number of man-days of idleness.
TABLE 2.-Strikes in 1939 and 1940, by Months
Number of strikes Number of workers involved in strikes
Man-days idle dur-In progress ing month
Month Beginningin month during
monthBeginning in
monthIn progress dur-
ing month
1939 1940 1939 1940 1939 1940 1939 1940 1939 1940
Year 2, 613 2, 508 1, 170, 962 576, 988 17, 812, 219 6, 700, 872
January 203 128 323 222 51, 159 26, 937 72, 427 41,284 513, 460 246, 674February 204 172 343 270 68,252 29, 509 88, 267 38, 050 553, 138 289, 992March 210 178 349 295 43, 337 22, 433 64, 660 43, 231 618, 147 386, 981April 281 228 431 336 396, 166 39, 481 425, 748 53, 119 4, 902, 238 441, 866May 258 239 434 361 95, 239 53, 231 457, 407 77, 124 3, 547, 868 665, 688June 245 214 407 336 62, 534 38, 542 127, 474 56, 403 958, 127 484, 007July 251 244 389 390 175, 542 63, 126 211, 548 82, 970 1, 168, 382 585, 651August 275 231 448 394 79, 670 356 118, 772 90, 226 1, 101, 419 706, 308September_ 197 253 373 394 36,846 65,362 103,538 108,389 892,485 780,570October 205 267 356 419 106,628 71, 997 139,608 107, 863 1, 508, 120 915, 014November__ _ . 178 207 317 373 43, 239 399 130, 341 101,532 1, 664, 574 739, 807December 106 147 222 277 12, 350 42, 615 37, 122 61, 576 384, 261 458, 314
7
C

MAN -DAYS IDLE MILLIONS
\i
\i \ X1939
i ‘5 YEAR
1935-1939AVERAGE
...•
_
, I•.
• ._
. ..
_ • ....o.................\..X1940
IJAN. FEB. MAR APR MAY JUN. JUL. AUG. SEPT. OCT. NOV. DEC.
U.S DEPT.OF LABOR, BUREAU OF LABOR STATISTICS
MILLIONS5
0
5
4
3
2
""" STRIKES EACH MONTH IN 1939 AND 1940COMPARED WITH THE PRECEDING
5 YEAR AVERAGESNUMBER STRIKES NUMBER400 400
0THOUSANDS
400
300
200
200
300
100
100
0 0
5 YEAR AVERAGE1935-1939
1
--ao..***1
/ .
---940 1939/ \
I1
%i
I
11939
5 YEAR1935-1939
AVERAGEiI1.
."---1
i \
••••••\
9 40
1•. •
WORKERS INVOLVED0
THOUSANDS400
300
200
100
300
200
100
4
3
2
0
6
The number of strikes, workers involved, and man-days idlenesswas considerably less during most of 1940 than the average numberfor corresponding months during the preceding 5 years. There weremore new strikes, however, during the months September to Decemberin 1940 than the 5-year average for comparable months. Only in thelast 2 months of 1940 was the number of workers greater than the5-year average for November and December. During every monthof 1940 the number of man-days of idleness was considerably less thanthe 5-year average for comparable months.
Industries Affected
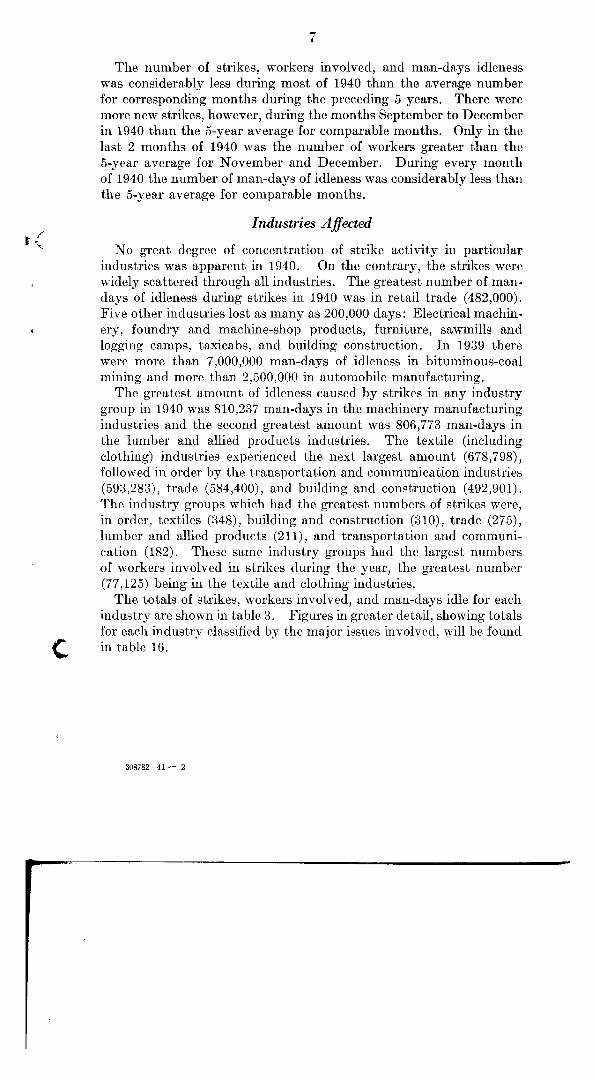
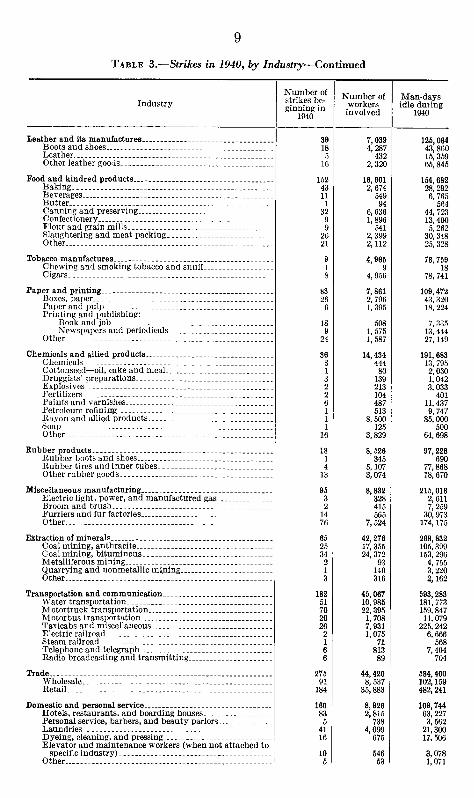
No great degree of concentration of strike activity in particularindustries was apparent in 1940. On the contrary, the strikes werewidely scattered through all industries. The greatest number of man-days of idleness during strikes in 1940 was in retail trade (482,000).Five other industries lost as many as 200,000 days: Electrical machin-ery, foundry and machine-shop products, furniture, sawmills andlogging camps, taxicabs, and building construction. In 1939 therewere more than 7,000,000 man-days of idleness in bituminous-coalmining and more than 2,500,000 in automobile manufacturing.
The greatest amount of idleness caused by strikes in any industrygroup in 1940 was 810,237 man-days in the machinery manufacturingindustries and the second greatest amount was 806,773 man-days inthe lumber and allied products industries. The textile (includingclothing) industries experienced the next largest amount (678,798),followed in order by the transportation and communication industries(593,283), trade (584,400), and building and construction (492,901).The industry groups which had the greatest numbers of strikes were,in order, textiles (348), building and construction (310), trade (275),lumber and allied products (211), and transportation and communi-cation (182). These same industry groups had the largest numbersof workers involved in strikes during the year, the greatest number(77,125) being in the textile and clothing industries.
The totals of strikes, workers involved, and man-days idle for eachindustry are shown in table 3. Figures in greater detail, showing totalsfor each industry classified by the major issues involved, will be foundin table 16.
308782 - 41-- 2
8
TABLE 3.-Strikes in 1940, by Industry
IndustryNumber ofstrikes be-ginning in
1940
Number ofworkersinvolved
Man-daysidle during
1940
All industries 2, 608 576, 988 6, 700, 872
Iron and steel and their products, not including machinery__ _ _ 121 39, 968 402, 904Blast furnaces, steel works and rolling mills 25 20, 580 134, 769Bolts, nuts, washers, and rivets 2 39 249Cast-iron pipe and fittings 7 1, 069 39, 002Cutlery (not including silver and plated cutlery) and
edge tools 2 80 864Forgings, iron and steel 4 506 4,090Hardware________________________________________________ 5 425 6, 879Plumbers' supplies and fixtures 8 2, 393 28, 876Steam and hot-water heating apparatus ands team fittings 4 700 22, 593Stoves 17 3, 770 32, 249Structural and ornamental metal work 12 2,052 17,142Tin cans and other tinware 5 1, 360 19, 840Tools (not including edge tools, machine tools, files, and saws) 3 128 5, 045Wire and wire products 10 869 9, 204Other 17 5, 997 82, 102
Machinery, not including transportation equipment 130 35, 617 810, 237Agricultural implements 6 1, 063 18, 667Cash registers, adding machines, and typewriters 1 36Electrical machinery, apparatus, and supplies 34 8,906 393,572Engines, turbines, tractors and water wheels 1 531 7, 434Foundry and machine-shop products 51 17, 595 257, 971Machine tools (power driven) 6 677 11, 736Radios and phonographs 9 2, 383 20, 192Other 23 4, 462 100, 629
Transportation equipment 51 49,638 270,490Aircraft 3 6, 270 36, 402Automobiles, bodies and parts 29 25, 579 104, 377Cars, electric- and steam-railroad 5 2, 986 73, 582Shipbuilding 13 14, 531 48, 241Other 1 272 7,888
Nonferrous metals and their products 52 15,990 253, 269Aluminum manufactures 4 9, 064 30, 866Brass, bronze, and copper products 4 292 2, 598Clocks, watches, and time-recording devices 1 11 132Jewelry. 1 405 9, 954Lighting equipment 8 443 6,384Silverware and plated ware 2 575 40, 000Smelting and refining-copper, lead, and zinc 7 1, 908 51, 762Stamped and enameled ware 14 2, 176 50, 807Other 11 1,116 60, 766
Lumber and allied products 211 52, 293 806, 773Furniture 92 12, 203 234, 503Millwork and planing 34 7, 282 67, 021Sawmills and logging camps 50 28, 206 364, 909Other 35 4, 602 140, 340
Stone, clay, and glass products 65 12, 604 205,919Brick, tile, and terra cotta 20 3,175 71,962Cement 6 972 26, 182Glass 11 5, 804 55, 206Marble, granite, slate, and other products 3 75 866Pottery 5 953 15, 062Other 20 1, 625 36, 641
Textiles and their products 348 77,125 678,798Fabrics 91 26, 150 272, 726
Carpets and rugs 1 1, 200 2, 538Cotton goods 30 12, 791 134, 542Cotton small wares 1 18 250Dyeing and finishing textiles 13 743 20, 324Silk and rayon goods 17 042 63, 685Woolen and worsted goods 10 2, 206 10, 546Other 19 2, 150 40, 841
Wearing apparel 257 50, 975 406, 072Clothing, men's 15 4, 054 30, 730Clothing, women's 177 33, 467 189, 710Corsets and allied garments 3 183 1, 530Men's furnishings 5 908 1, 225Hats, caps, and millinery 13 3, 567 47, 044Shirts and collars 2 195 1,845Hosiery 13 2, 633 78, 745Knit goods 21 5, 213 32, 495Other 8 755 22,748
1 Man-days of idleness resulting from a strike which began in the preceding year.
9TABLE 3.-Strikes in 1940, by Industry-Continued
IndustryNumber ofstrikes be-ginning in
1940
Number ofworkersinvolved
Man-daysidle during
1940
Leather and its manufactures 39 7,039 125,084Boots and shoes 18 4, 287 43, 860Leather 5 432 15,359Other leather goods 16 2,320 65,845
Food and kindred products 152 16,901 154,682Baking 43 2,674 28,292Beverages 11 549 6,765Butter 1 94 564Canning and preserving 32 6, 636 44, 723Confectionery 9 1,896 13,400Flour and grain mills 9 541 5, 262Slaughtering and meat packing 26 2, 399 30, 348Other 21 2,112 25,328
Tobacco manufactures 9 4, 965 78, 759Chewing and smoking tobacco and snuff 1 9 18Cigars 8 4,956 78,741
Paper and printing 83 7,881 109,472Boxes, paper 26 2,796 43,320Paper and pulp 6 1,395 18,224Printing and publishing:
Book and job 18 508 7,335Newspapers and periodicals 9 1,575 13,444
Other 24 1,587 27,149Chemicals and allied products 38 14,434 191,683
Chemicals 3 444 13,795Cottonseed-oil, cake and meal 1 80 2, 030Druggists' preparations 3 139 1, 042Explosives 2 213 3, 033Fertilizers 2 104 401Paints and varnishes 6 487 11,437Petroleum refining 1 513 9,747Rayon and allied products 1 8,500 85,000Soap 1 125 500Other 16 3, 829 64, 698
Rubber products 18 8, 528 97, 228Rubber boots and shoes 1 345 690Rubber tires and inner tubes 4 5,107 77,868Other rubber goods 13 3, 074 18, 670
Miscellaneous manufacturing 95 8, 832 215, 018Electric light, power, and manufactured gas 3 328 2, 611Broom and brush 2 415 7, 259Furriers and fur factories 14 565 30, 973Other 76 7, 524 174, 175
Extraction of minerals 65 42, 276 268, 832Coal mining, anthracite 25 17,355 105,399Coal mining, bituminous 34 24, 372 153, 296Metalliferous mining 2 93 4, 755Quarrying and nonmetallic mining 1 140 3, 220Other 3 316 2, 162
Transportation and communication 182 45,087 593,283Water transportation 51 10, 985 181, 773Motortruck transportation 70 22,395 159,847Motorbus transportation 20 1,708 11,079Taxicabs and miscellaneous 26 7, 931 225, 242Electric railroad 2 1, 075 6, 666Steam railroad 1 71 568Telephone and telegraph 6 813 7,404Radio broadcasting and transmitting 6 89 704
Trade 275 44, 420 564,400Wholesale 91 8, 537 102, 159Retail 184 35, 883 482, 241
Domestic and personal service 160 8,926 109,744Hotels, restaurants, and boarding houses 83 2,815 63,227Personal service, barbers, and beauty parlors 5 738 3, 562Laundries 41 4, 099 21,300Dyeing, cleaning, and pressing 16 675 17,506Elevator and maintenance workers (when not attached to
specific industry) 10 546 3,078Other 5 53 1,071
PERCENT OF TOTAL WORKERS INVOLVED IN STRIKES1940
CHART 4
ID LESS THAN I%0 I% AND LESS THAN 2%
2% AND LESS THAN 3%la 3% AND LESS THAN 4%la 4% AND LESS THAN 9% U S DEPT. OF LABOR, BUREAU OF LABOR STATISTICS
(9292)
10
TABLE 3.—Strikes in 1940, by Industry—Continued
IndustryNumber ofstrikes be-
19n in
Number ofworkersinvolved
Man-daysidle during
1940
Professional service 29 1, 411 21, 881Recreation and amusement 24 1, 230 17, 250Professional 3 140 1,436Semiprofessional, attendants, and helpers 2 41 2, 975
Building and construction 310 71, 318 492, 901Buildings, inclusive of PWA 218 58, 117 403, 142All other construction (bridges, docks, etc., and PW A
buildings) _ _ _ _ _ ________ 92 13, 199 89, 759
Agriculture and fishing 24 5, 838 173, 841Agriculture 14 2, 130 37, 359Fishing 10 3,708 136, 482
WPA, relief, and resettlement projects 4 735 4, 819Other nonmanufacturing industries 49 5, 208 51, 295
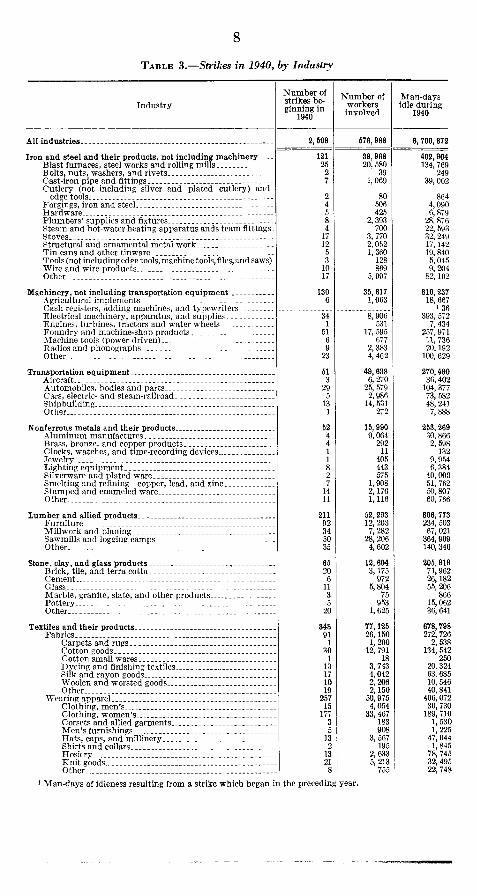
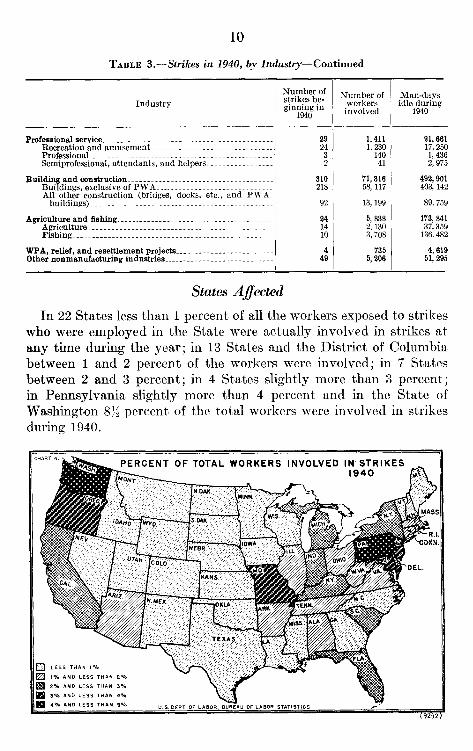
States AffectedIn 22 States less than 1 percent of all the workers exposed to strikes
who were employed in the State were actually involved in strikes atany time during the year; in 13 States and the District of Columbiabetween 1 and 2 percent of the workers were involved; in 7 Statesbetween 2 and 3 percent; in 4 States slightly more than 3 percent;in Pennsylvania slightly more than 4 percent and in the State ofWashington 8;(2 percent of the total workers were involved in strikesduring 1940.

11
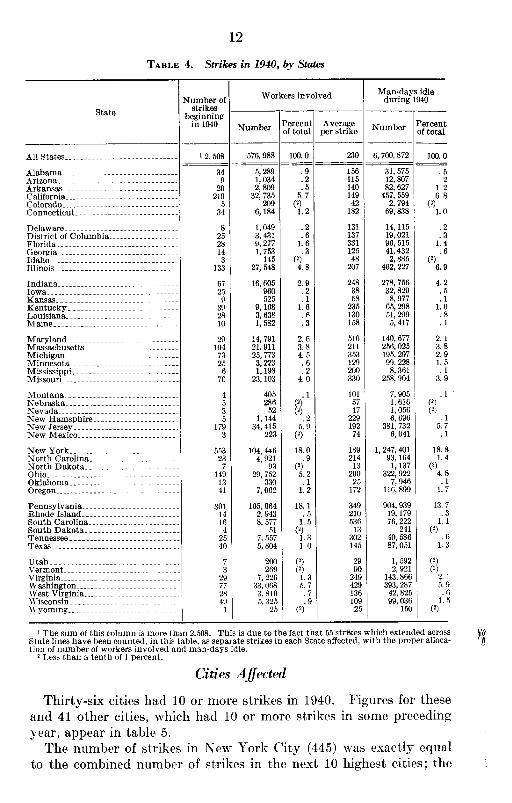
New York experienced the greatest number of strikes and the largestamount of idleness because of strikes in 1940. Pennsylvania had afew more workers involved in strikes than New York, but came secondin number of strikes and number of man-days of idleness. TenStates during 1940 had 70 or more strikes. In these States also werethe largest numbers of workers involved and the greatest amount ofidleness because of strikes.
In general these are the leading industrial States with the largestnumber of workers. Five of the 10 States had a ratio of workersinvolved in strikes lower than the national average. The rank ofthe first 10 States with respect to the number of strikes, workers, andman-days was as follows:
Strikes Workers involved Man-days idleNew York 553 Pennsylvania_ _ 105, 064 New York_ _ _ _ 1, 247, 401Pennsylvania 301 New York_ _ _ 104, 446 Pennsylvania_ 904, 939California 219 New Jersey 34, 415 Illinois 462, 227New Jersey 179 Washington_ 33, 068 California 457, 559Ohio 149 California 32, 735 Washington _ _ 393, 287Illinois 133 Ohio 29, 752 New Jersey 381, 732Massachusetts 104 Illinois 27, 548 Ohio 322, 922Washington 77 Michigan 25, 773 Missouri 258, 904Michigan 73 Missouri 23, 103 Massachusetts 256, 025Missouri 70 Massachusetts_ 21, 911 Michigan_ _ _ _ 195, 297
About 76 percent of the total workers involved in strikes in theUnited States and 73 percent of the total man-days of idleness causedby strikes in 1940 were in the above 10 States. Among the strikes inNew York the largest were two that have been mentioned: the shortJuly stoppage in the clothing industry and the August-Septemberstrike of painters. Each of these strikes involved about 15,000workers. Washington's largest strike was the lumber dispute inDecember which involved nearly 12,000 workers as noted earlier.In Missouri there was a short strike in October of about 15,000building-trades workers in and around St. Louis. The other Stateshad no individual strikes which involved as many as 10,000 workers.
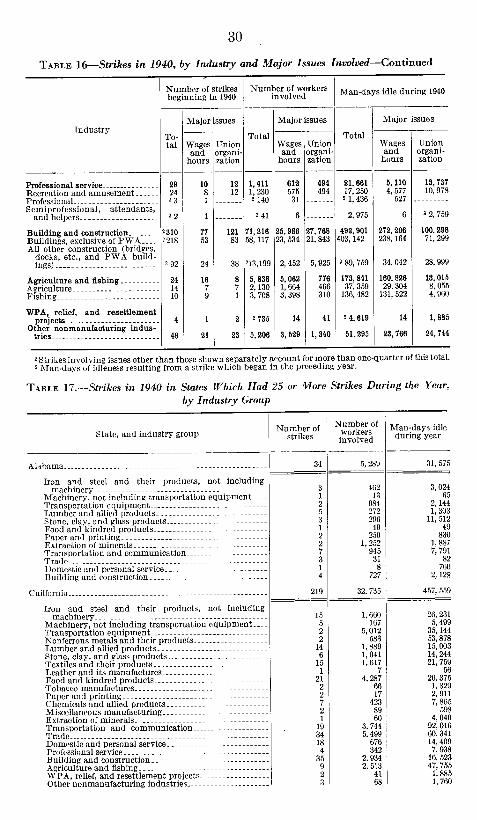
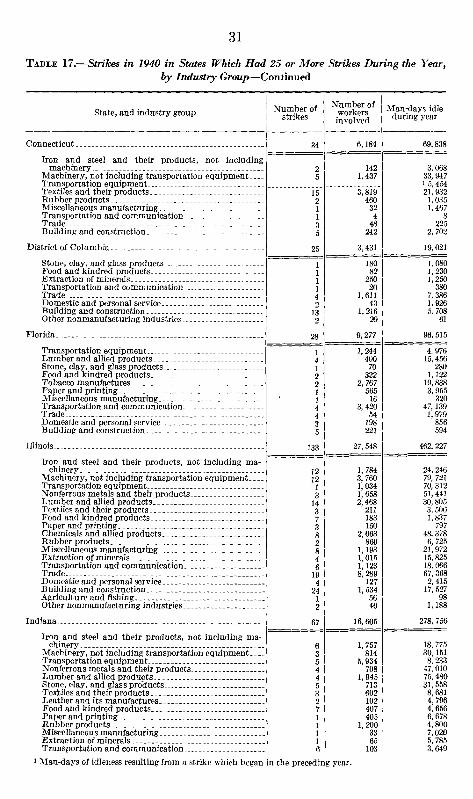
In table 4 which shows by States the number of strikes, workersinvolved, and days lost, interstate strikes are counted as separatestrikes in each State affected, with the proper division of workersinvolved and man-days idle between the respective States. In table17 (p. 30) the data are given for each industry group in each Statewhich had as many as 25 strikes during 1940.
12
TABLE 4.—Strikes in 1940, by States
StateNumber of
strikesbeginning
in 1940
Workers involved Man-days idleduring 1940
Number Percentof total
Averageper strike Number Percentof total
All States 1 2, 508 576, 988 100. 0 230 6, 700, 872 100. 0
Alabama 34 5, 289 .9 156 31, 575 . 5Arizona 9 1,034 .2 115 12, 807 .2Arkansas 20 2,809 .5 140 82, 627 1. 2California 219 32, 735 5. 7 149 457, 559 6. 8Colorado 5 209 (2) 42 2, 794 (2)Connecticut 34 6, 184 1. 2 182 69, 838 1. 0
Delaware 8 1, 049 .2 131 14, 115 .2District of Columbia 25 3, 431 . 6 137 19, 021 . 3Florida 28 9, 277 1. 6 331 96, 515 1. 4Georgia 14 1, 753 .3 125 41.432 .6Idaho 3 145 (2) 48 2, 885 (2)Illinois 133 27, 548 4. 8 207 462, 227 6. 9
Indiana 67 16, 605 2.9 248 278, 756 4. 2Iowa 25 960 .2 38 32, 829 . 5Kansas 9 525 . 1 58 8, 977 . 1Kentucky 39 9, 168 1. 6 235 65, 298 1. 0Louisiana 28 3, 638 . s 130 51, 299 . 8Maine 10 1,582 .3 158 5,417 .1
Maryland 29 14, 791 2. 6 510 140, 677 2. 1Massachusetts 104 21, 911 8 211 256, 025 3. 8Michigan 73 25, 773 5 353 195, 297 2. 9Minnesota 25 3, 223 . 6 129 99, 228 1. 5Mississippi 6 1, 198 . 2 200 8, 361 . 1Missouri 70 23, 103 4. 0 330 258, 904 3. 9
Montana 4 405 .1 101 7,905 .1Nebraska 5 286 (2) 57 1, 616 (2)Nevada 3 52 (2) 17 1, 056 (2)New Hamsphire 5 1, 144 .2 229 6, 696 . 1New Jersey 179 34, 415 5. 9 192 381, 732 5. 7New Mexico 3 223 (2) 74 6, 041 . 1
New York 553 104, 446 18.0 189 1, 247, 401 18. 8North Carolina 23 4, 921 .9 214 93, 164 1. 4North Dakota 7 93 (2) 13 1, 137 (2)Ohio 149 29, 752 5. 2 200 322, 922 4. 8Oklahoma 13 330 . 1 25 7, 946 . 1Oregon 41 7,062 1. 2 172 116, 899 1. 7
Pennsylvania 301 105, 064 18. 1 349 904, 939 13. 7Rhode Island 14 2, 943 . 5 210 19, 179 . 3South Carolina 16 8, 577 1. 5 536 76, 222 1. 1South Dakota 4 51 (2) 13 241 (2)Tennessee 25 7, 557 1. 3 302 40, 586 . fTexas 40 5, 804 1. 0 145 87, 051 1.12
Utah 7 200 (2) 29 592 (2)Vermont 3 269 (2) 90 921 (2)Virginia 29 7, 226 1. 3 249 143, 866 2. 1Washington 77 33, 068 5. 7 429 393, 287 5.1West Virginia 28 3, 810 . 7 136 42, 825 . fWisconsin 49 5, 325 .9 109 99, 036 1.1Wyoming 1 25 (2) 25 150 (2)
1 The sum of this column is more than 2,508. This is due to the fact that 55 strikes which extended acrossState lines have been counted, in this table, as separate strikes in each State affected, with the proper alloca-tion of number of workers involved and man-days idle.
2 Less than a tenth of 1 percent.
Cities Affected
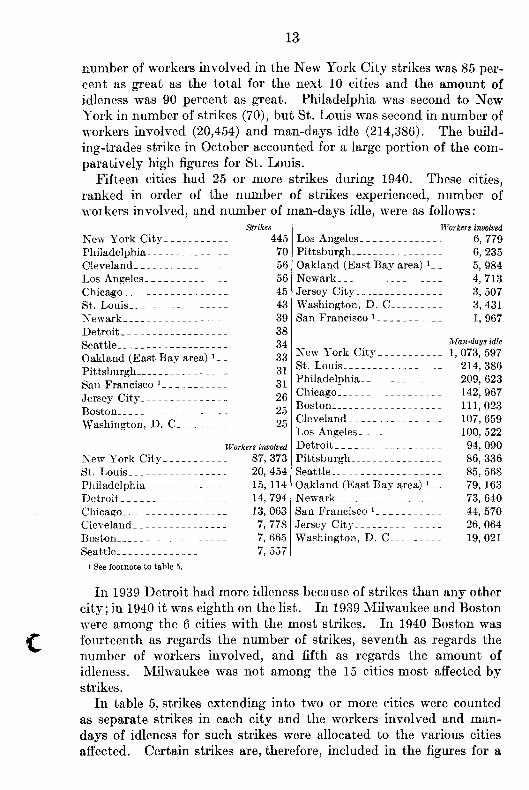
Thirty-six cities had 10 or more strikes in 1940. Figures for theseand 41 other cities, which had 10 or more strikes in some precedingyear, appear in table 5.
The number of strikes in New York City (445) was exactly equalto the combined number of strikes in the next 10 highest cities; the
13
number of workers involved in the New York City strikes was 85 per-cent as great as the total for the next 10 cities and the amount ofidleness was 90 percent as great. Philadelphia was second to NewYork in number of strikes (70), but St. Louis was second in number ofworkers involved (20,454) and man-days idle (214,386). The build-ing-trades strike in October accounted for a large portion of the com-paratively high figures for St. Louis.
Fifteen cities had 25 or more strikes during 1940. These cities,ranked in order of the number of strikes experienced, number of
hers involved, and number of man-days idle, were as follows:Strikes Workers involved
New York City 445 Los Angeles 6, 779Philadelphia 70 Pittsburgh 6, 235Cleveland 56 Oakland (East Bay area) 1 _ _ 5, 984Los Angeles 56 Newark 4, 713Chicago 45 Jersey City 3, 507St. Louis 43 Washington, D. C 3, 431Newark 39 San Francisco 1 1, 967Detroit 38Seattle 34 Man•days idle
Oakland (East Bay area) 1 _ _ 33 New York City 1, 073, 597Pittsburgh 31 St. Louis 214, 386San Francisco 1 31 Philadelphia 209, 623Jersey City 26 Chicago 142, 967Boston 25 Boston 111, 023Washington, D. C 25 Cleveland 107, 659
Los Angeles 100, 522Workers involved Detroit 94, 090
New York City_ 87, 373 Pittsburgh 86, 336St. Louis 20, 454 Seattle 85, 568Philadelphia 15, 114 Oakland (East Bay area) 1 _ _ 79, 163Detroit 14, 794 Newark 73, 640Chicago 13, 063 San Francisco ' 44, 570Cleveland 7, 778 Jersey City 26,064Boston 7, 665 Washington, D. C 19, 021Seattle 7, 557
/ See footnote to table 5.
In 1939 Detroit had more idleness because of strikes than any othercity; in 1940 it was eighth on the list. In 1939 Milwaukee and Bostonwere among the 6 cities with the most strikes. In 1940 Boston wasfourteenth as regards the number of strikes, seventh as regards thenumber of workers involved, and fifth as regards the amount ofidleness. Milwaukee was not among the 15 cities most affected bystrikes.
In table 5, strikes extending into two or more cities were countedas separate strikes in each city and the workers involved and man-days of idleness for such strikes were allocated to the various citiesaffected. Certain strikes are, therefore, included in the figures for a

14
given city although they may have been only parts of larger inter-city strikes.TABLE 5.-Strikes in 1940 in Cities Which Had 10 or More Strikes in Any Year from
1927 to 1940
City
Num-ber ofstrikesbegin-ning in
1940
Num-ber of
workers.in-volved
Man-daysidle.during1940
City
Num-ber ofstrikesbegin-ning -1940
fn
Num-ber of
workers
volved
Man-daysidle
during1940
Akron, Ohio 5 1, 965 70, 186 New Haven, Conn 10 579 5, 874Allentown, Pa 4 499 9, 387 New Orleans, La 17 2, 304 30, 864Atlanta, Ga 8 657 23, 992 New York (Greater) 445 87, 373 1,073,597Baltimore, Md 21 2, 670 32, 035 Norfolk, Va 4 89 429Birmingham, Ala 13 1,177 5,006 Oakland, Calif. (EastBoston, Mass 25 7, 665 111, 023 Bay area) i 33 5, 984 79, 163
Passaic, N. I 10 713 3, 593Buffalo, N. Y 14 767 7, 604Chattanooga, Tenn 8 4, 083 20, 625 Paterson, N. J 20 1, 257 9, 804Chicago, Ill 45 13, 063 142, 967 Pawtucket, R. I 1 200 600Cincinnati, Ohio 10 538 7,831 Peoria, Ill________________ 5 1,231 6,923Cleveland, Ohio _ 56 7, 778 107, 659 Philadelphia, Pa_________ 70 15,114 209, 623Columbus, Ohio 3 784 5, 745 Pittsburgh, Pa 31 6, 235 86, 336
Denver, Colo 3 80 2, 200 Portland, Oreg 19 3, 186 60, 044Des Moines, Iowa 4 191 1, 478 Providence, R. I 8 985 11, 814Detroit, Mich 38 14, 794 94, 090 Reading, Pa 9 1, 071 9, 308Duluth, Minn 3 565 14, 539 Richmond, Va 9 3, 112 67, 858Easton, Pa 5 675 8, 484 Rochester, N. Y 10 1, 257 13, 770East St. Louis, Ill 10 1, 834 47, 541 Rockford, Ill 4 1, 338 3, 084
Elizabeth, N. J 11 1,180 15, 302 Saginaw, Mich 6 645 10, 934Erie, Pa 5 821 18, 685 St. Louis, Mo _ __________ 43 20, 454 214, 386Evansville, Ind 3 1, 365 20, 955 St. Paul, Minn 6 1, 298 41, 541Fall River, Mass 11 1, 589 19, 315 San Francisco, Calif.' 31 1, 967 44, 570Flint, Mich 5 6,819 14,207 Scranton, Pa 8 1,294 36,925Fort Smith, Ark 10 963 14, 270 Seattle, Wash 34 7, 557 85, 568Haverhill, Mass 3 122 1, 510 Shamokin, Pa ________ _ __ 1 35 1, 410
Houston, Texas 10 1, 427 40, 383 South Bend, Ind 4 336 1, 632Indianapolis, Ind 12 2, 776 61, 562 Springfield, Ill 7 1, 295 2, 353Jersey City, N. J 26 3,507 26,064 Springfield, Mass 5 438 3,106Kansas City, Mo 9 593 8, 584 Tacoma, Wash 12 8, 422 92, 406Lancaster, Pa 4 489 10,338 Terre Haute, Ind 3 67 634Los Angeles, Calif 56 6, 779 100, 522 Toledo, Ohio 12 3, 242 21, 178Louisville, Ky 21 2, 239 37, 332 Trenton, N. J 6 1, 982 28, 431
Lowell, Mass 8 1, 190 10, 583 Washington, D. C 25 3, 431 19, 021Lynn, Mass 6 303 3,043 Waterbury, C onn 1 21 126Memphis, Tenn _ 8 2,620 12,310 Wausau, W is ___________ 2 938 21,602Milwaukee, Wis 17 1,135 15, 268 Wilkes-Barre, Pa 3 131 1, 360Minneapolis, Minn 12 989 30,439 Woonsocket, R. I 2 246 1.914Newark, N. J 39 4,713 73, 640 Worcester, Mass 3 61 164New Bedford, Mass 5 805 23, 666 York, Pa 5 788 10, 205
I For the first time in the Bureau s reports, strike figures are shown separately for San Francisco and theOakland-East Bay areas. In preceding years combined figures for these areas have been given under theheading "San Francisco (bay area ."
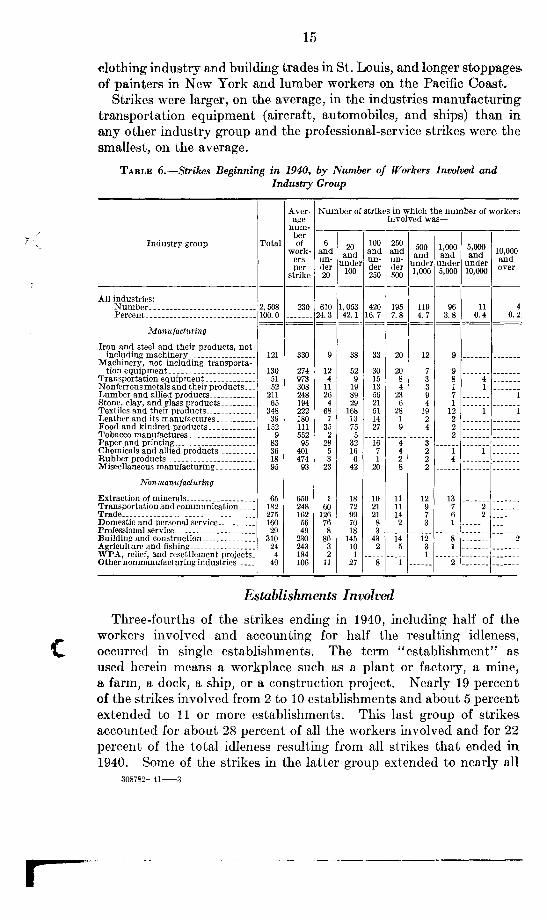
Workers InvolvedThe average number of workers involved in the 2,508 strikes which
began in 1940 was 230 per strike. Half of the strikes involved fewerthan 50 workers. Approximately one-fourth of the strikes involvedfewer than 20 workers each and two-thirds of the total involved fewerthan 100 workers each. About one-fourth of the strikes ranged insize from 100 up to 500 workers each and only about 9 percent of thetotal strikes involved 500 or more workers each. Among the latterwere four strikes, previously mentioned, in each of which more than10,000 workers were involved-2-day stoppages in the New York
15
clothing industry and building trades in St. Louis, and longer stoppagesof painters in New York and lumber workers on the Pacific Coast.
Strikes were larger, on the average, in the industries manufacturingtransportation equipment (aircraft, automobiles, and ships) than inany other industry group and the professional-service strikes were thesmallest, on the average.
TABLE 6.—Strikes Beginning in 1940, by Number of Workers Involved andIndustry Group
Industry group Total
Aver-age
num-berof
work-ersper
strike
Number of strikes in which the number of workersinvolved was—
6andun-der20
20and
under100
100andun-der250
250andun-der500
500andd
under1 '000
1,000an d
under5,000
5,000and
under10,000
, r, „,,'''''''andover
All industries:Number 2, 508 230 610 1, 053 420 195 119 96 11 4Percent 100. 0 24. 3 42. 1 16. 7 7. 8 4. 7 3. 8 0. 4 0. 2
Manufacturing
Iron and steel and their products, notincluding machinery 121 330 9 38 33 20 12 9
Machinery, not including transporta-tion equipment 130 274 12 52 30 20 7 9
Transportation equipment 51 973 4 9 15 8 3 8 4 Nonferrous metals and their products_ __ 52 308 11 19 13 4 3 1 1 Lumber and allied products 211 248 26 89 56 23 9 7 1Stone, clay, and glass products 65 194 4 29 21 6 4 1 Textiles and their products 348 222 68 168 51 28 19 12 1 1Leather and its manufactures 39 180 7 13 14 1 2 2 Food and kindred products 152 111 35 75 27 9 4 2 Tobacco manufactures 9 552 2 5 2 Paper and printing 83 95 28 32 16 4 3 Chemicals and allied products 36 401 5 16 7 4 2 1 1 Rubber products 18 474 3 6 1 2 2 4 Miscellaneous manufacturing 95 93 23 42 20 8 2
Noninanufacturing
Extraction of minerals 65 650 1 18 10 11 12 13 Transportation and communication_ ___ 182 248 60 72 21 11 9 7 2 Trade 275 162 126 99 21 14 7 6 2 Domestic and personal service 160 56 76 70 8 2 3 1 Professional service 29 49 8 18 3 Building and construction 310 230 86 145 43 14 12 8 2Agriculture and fishing 24 243 3 10 2 5 3 1 WPA, relief, and resettlement projects_ 4 184 2 1 1 Other nonmanufacturing industries 49 106 11 27 8 1 2
Establishments InvolvedThree-fourths of the strikes ending in 1940, including half of the
workers involved and accounting for half the resulting idleness,occurred in single establishments. The term "establishment" asused herein means a workplace such as a plant or factory, a mine,a farm, a dock, a ship, or a construction project. Nearly 19 percentof the strikes involved from 2 to 10 establishments and about 5 percentextended to 11 or more establishments. This last group of strikesaccounted for about 28 percent of all the workers involved and for 22percent of the total idleness resulting from all strikes that ended in1940. Some of the strikes in the latter group extended to nearly all
308782-41-3
16
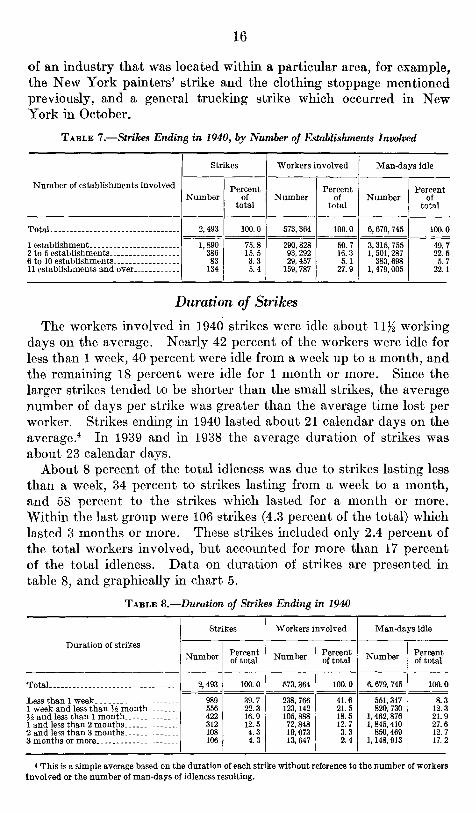
of an industry that was located within a particular area, for example,the New York painters' strike and the clothing stoppage mentionedpreviously, and a general trucking strike which occurred in NewYork in October.
TABLE 7.—Strikes Ending in 1940, by Number of Establishments Involved
Strikes Workers involved Man-days idle
Number of establishments involved Percent Percent PercentNumber of
totalNumber of
totalNumber of
total
Total 2,493 100.0 573, 364 100.0 6, 679, 745 100.0
1 establishment 1, 890 75. 8 290, 828 50. 7 3, 315, 755 49. 72 to 5 establishments 386 15. 5 93, 292 16. 3 1, 501, 287 22. 56 to 10 establishments 83 3. 3 29, 457 5.1 383, 698 5. 711 establishments and over 134 5.4 159, 787 27. 9 1, 479, 005 22. 1
Duration of StrikesThe workers involved in 1940 strikes were idle about 1132 working
days on the average. Nearly 42 percent of the workers were idle forless than 1 week, 40 percent were idle from a week up to a month, andthe remaining 18 percent were idle for 1 month or more. Since thelarger strikes tended to be shorter than the small strikes, the averagenumber of days per strike was greater than the average time lost perworker. Strikes ending in 1940 lasted about 21 calendar days on theaverage. 4 In 1939 and in 1938 the average duration of strikes wasabout 23 calendar days.
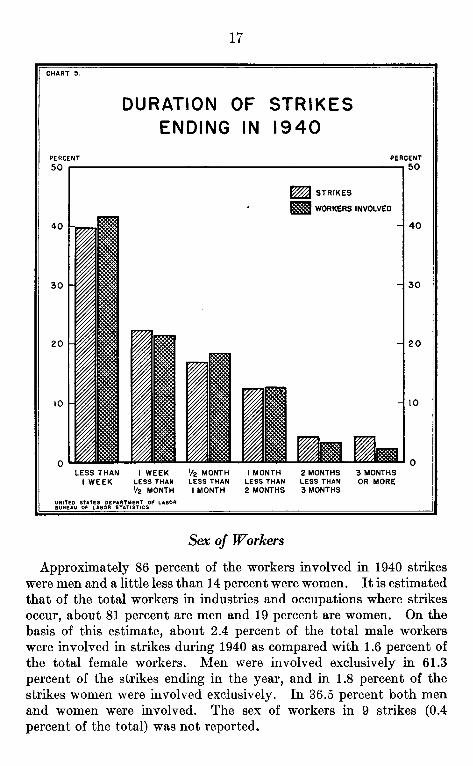
About 8 percent of the total idleness was due to strikes lasting lessthan a week, 34 percent to strikes lasting from a week to a month,and 58 percent to the strikes which lasted for a month or more.Within the last group were 106 strikes (4.3 percent of the total) whichlasted 3 months or more. These strikes included only 2.4 percent ofthe total workers involved, but accounted for more than 17 percentof the total idleness. Data on duration of strikes are presented intable 8, and graphically in chart 5.
TABLE 8.—Duration of Strikes Ending in 1940
Strikes Workers involved Man-days idle
Duration of strikesNumber Percent
of total Number Percentof total Number Percent
of total
Total 2, 493 100. 0 573, 364 100. 0 6, 679, 745 100. 0
Less than 1 week 989 39. 7 238, 766 41.6 551, 347 8.31 week and less than 3h month 556 22. 3 123, 142 21. 5 820, 730 12. 3V2 and less than 1 month 422 16.9 105, 888 18.5 1, 462, 876 21.91 and less than 2 months 312 12. 5 72, 848 12. 7 1, 845, 410 27.62 and less than 3 months 108 4.3 19, 073 3. 3 850, 469 12. 73 months or more 106 4. 3 13, 647 2. 4 1, 148, 913 17. 2
4 This is a simple average based on the duration of each strike without reference to the number of workersinvolved or the number of man-days of idleness resulting.
I CHART 5.
DURATION OF STRIKESENDING IN 1940
PERCENT PERCENT50 50
LESS THAN I WEEK
1/2 MONTH I MONTH 2 MONTHS 3 MONTHSI WEEK LESS THAN
LESS THAN
LESS THAN LESS THAN OR MORE
1/2 MONTH I MONTH 2 MONTHS 3 MONTHSUNITED STATES DEPARTMENT OF LABORBUREAU OF LABOR STATISTICS
40
30
20
I0
0
40
30
20
10
0
17
Sex of Workers
Approximately 86 percent of the workers involved in 1940 strikeswere men and a little less than 14 percent were women. It is estimatedthat of the total workers in industries and occupations where strikesoccur, about 81 percent are men and 19 percent are women. On thebasis of this estimate, about 2.4 percent of the total male workerswere involved in strikes during 1940 as compared with 1.6 percent ofthe total female workers. Men were involved exclusively in 61.3percent of the strikes ending in the year, and in 1.8 percent of thestrikes women were involved exclusively. In 36.5 percent both menand women were involved. The sex of workers in 9 strikes (0.4percent of the total) was not reported.
18
Labor Organizations Involved
In table 9 the affiliations of the unions involved in 1940 strikes areindicated. In the majority of cases the unions regarded as involvedin the strikes were the initiators and provided the leadership andguidance for the workers throughout the disputes and the settlementnegotiations. Sometimes, however, strikes occurred among unor-ganized workers who later received leadership and assistance fromunion officials in negotiating settlements, with the result in some casesthat the workers joined the unions and obtained union agreements toembody the terms of settlement. In such cases the union giving suchassistance was regarded as involved in the strike.
Unions affiliated with the American Federation of Labor wereinvolved in 62 percent of the strikes ending in 1940, which included53% percent of the total workers involved and 54% percent of thetotal man-days of idleness. Nearly 20 percent of the A. F. of L.strikes were among the building trades, 14 percent were in retail andwholesale trade, 10 percent were in the textile and clothing industries,(8 percent of which were in the ladies' garment industry subsequent tothe union's reaffiliation with the A. F. of L. in June), 8 percent were inthe domestic and personal service industries (mostly hotels, restaurants,and laundries), 8 percent were in the food industries, and 4% percentwere in the motortruck transportation industry.
Affiliates of the Congress of Industrial Organizations were involvedin 28 percent of the total strikes. C. I. 0. strikes were larger on theaverage than A. F. of L. strikes and included almost 40 percentof the total workers and man-days of idleness. The largest C. I. 0.strikes during the year were in automobile manufacturing and in thesteel, rayon, aluminum, shipbuilding, and aircraft industries.
Unions affiliated with neither the A. F. of L. nor the C. I. 0. wereinvolved in 5% percent of the strikes. The International Ladies'Garment Workers' Union before reaffiliation with the A. F. of L.accounted for a large proportion of these Among other unaffiliatedunions involved were the Mechanics Educational Society of America,involved in 6 strikes. In 3 percent of the strikes two rival unions wereinvolved, most of these were A. F. of L. and C. I. 0. unions, but in a fewcases there were disputes between either an A. F. of L. or C. I. 0. unionand unaffiliated organizations. These rival union disputes includedless than 3 percent of the total workers involved and accounted foronly 2 percent of the total idleness. Unions confined to one companyengaged in only 3 small strikes. In 45 small strikes no union wasinvolved.

19
TABLE 9.—Strikes Ending in 1940, by Affiliations of Labor Organizations Involved
Strikes Workers involved Man-days idle
Labor organization involvedNumber Percent
of total Number Percentof total Number Percent
of total
Total 2, 493 100. 0 573, 364 100.0 6, 679, 745 100. 0
American Federation of Labor 1, 541 61. 9 306, 541 53.5 3, 631, 899 54. 5Congress of Industrial Organizations 689 27. 6 222, 858 38.9 2, 668,149 39. 9Unaffiliated unions 138 5. 5 21, 972 3.8 212 435 3. 2Railroad brotherhoods 3 .1 360 .1 2, 758 (I)2 rival unions 74 3.0 15, 013 2. 6 134, 681 2. 0Company unions 3 .1 174 (1) 956 (1)No organization 45 1.8 6, 446 1. 1 28, 867 A
Less than a tenth of 1 percent.
Causes of Strikes
Half of the strikes ending in 1940, including a third of the totalworkers involved and accounting for 41 percent of the total man-days of idleness, were primarily over the issues of union recognition,closed or union shop, discrimination, or other union-organizationmatters. In two-fifths of these strikes (one-fifth of the total number)demands for increased wages or decreased hours or protests againstwage decreases were also in dispute, but these matters were secondaryto the issue of union recognition.
Wage or hour issues were the primary cause of about 30 percent ofthe strikes, which included 41 percent of the total workers involvedand accounted for 46 percent of the total idleness. The remainingstrikes (20 percent), which included 26 percent of the total workersand accounted for 13 percent of the total idleness, were due to suchissues as grievances over physical working conditions, supervision,job assignments, work loads, pay methods, and a multitude of itemsother than wages and hours or union-organization matters.
The difficulty in classifying strikes according to causes is apparentto anyone familiar with the complexities of employer-employee rela-tionships. Although a single grievance or demand is the cause of afew strikes, in most disputes which result in stoppages of work thereare numerous diversified grievances or demands. The Bureau ob-tains the facts, so far as possible, from all the parties directly involved,as well as from any outside impartial persons who have knowledge ofthe situation, such as those who assist in negotiating settlements byconciliation or arbitration methods. Each complex situation, wheremany grievances or demands may be involved, must necessarily beclassified according to what are judged to be the most important or"major" issues.
20
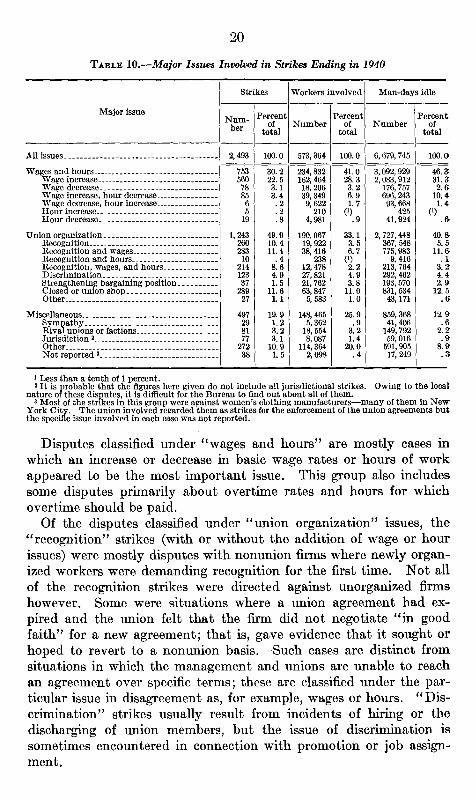
TABLE 10.—Major Issues Involved in Strikes Ending in 1940
Major issue
Strikes Workers involved Man-days idle
Num-ber
Percentof
totalNumber
Percentof
totalNumber
Percentof
total
All issues 2, 493 100.0 573, 364 100. 0 6, 679, 745 100. 0
Wages and hours 753 30. 2 234, 832 41.0 3, 092, 929 46.3Wage increase 560 22. 5 162, 464 28. 3 2, 083, 912 31.3Wage decrease 78 3. 1 18, 206 3. 2 176, 757 2. 6Wage increase, hour decrease 85 3. 4 39, 349 6. 9 696, 243 10. 4Wage decrease, hour increase 6 . 2 9, 622 1. 7 93, 668 1. 4Hour increase 5 .2 210 (1) 425 (1)Hour decrease 19 .8 4,981 .9 41,924 .6
Union organization 1, 243 49.9 190, 067 33. 1 2, 727, 448 40.8Recognition 260 10. 4 19, 922 3. 5 367, 548 5. 1Recognition and wages 283 11.4 38, 416 6. 7 775, 983 11.6Recognition and hours 10 .4 238 (I) 9, 416 . 1Recognition, wages, and hours 214 8. 6 12, 478 2. 2 213, 764 3. 2Discrimination 123 4. 9 27, 821 4.9 292, 462 4.4Strengthening bargaining position 37 1. 5 21,762 3. 8 193,570 2. 9Closed or union shop 289 11. 6 63, 847 11.0 831, 534 12. 5Other 27 1. 1 5, 583 1. 0 43, 171 . 9
Miscellaneous 497 19. 9 148, 465 25. 9 859, 368 12. 9Sympathy 29 1.2 5, 362 .9 41, 406 .6Rival unions or factions 81 3. 2 18, 554 3. 2 149, 792 2. 2Jurisdiction 2 77 3. 1 8, 087 1. 4 59, 016 . 9Other 272 10. 9 114, 364 20.0 591, 905 8.9Not reported 3 38 1. 5 2, 098 .4 17, 249 .3
I Less than a tenth of 1 percent.2 It is probable that the figures here given do not include all jurisdictional strikes. Owing to the local
nature of these disputes, it is difficult for the Bureau to find out about all of them.3 Most of the strikes in this group were against women's clothing manufacturers—many of them in New
York City. The union involved regarded them as strikes for the enforcement of the union agreements butthe specific issue involved in each case was not reported.
Disputes classified under "wages and hours" are mostly cases inwhich an increase or decrease in basic wage rates or hours of workappeared to be the most important issue. This group also includessome disputes primarily about overtime rates and hours for whichovertime should be paid.
Of the disputes classified under "union organization" issues, the"recognition" strikes (with or without the addition of wage or hourissues) were mostly disputes with nonunion firms where newly organ-ized workers were demanding recognition for the first time. Not allof the recognition strikes were directed against unorganized firmshowever. Some were situations where a union agreement had ex-pired and the union felt that the firm did not negotiate "in goodfaith" for a new agreement; that is, gave evidence that it sought orhoped to revert to a nonunion basis. Such cases are distinct fromsituations in which the management and unions are unable to reachan agreement over specific terms; these are classified under the par-ticular issue in disagreement as, for example, wages or hours. "Dis-crimination" strikes usually result from incidents of hiring or thedischarging of union members, but the issue of discrimination issometimes encountered in connection with promotion or job assign-ment.
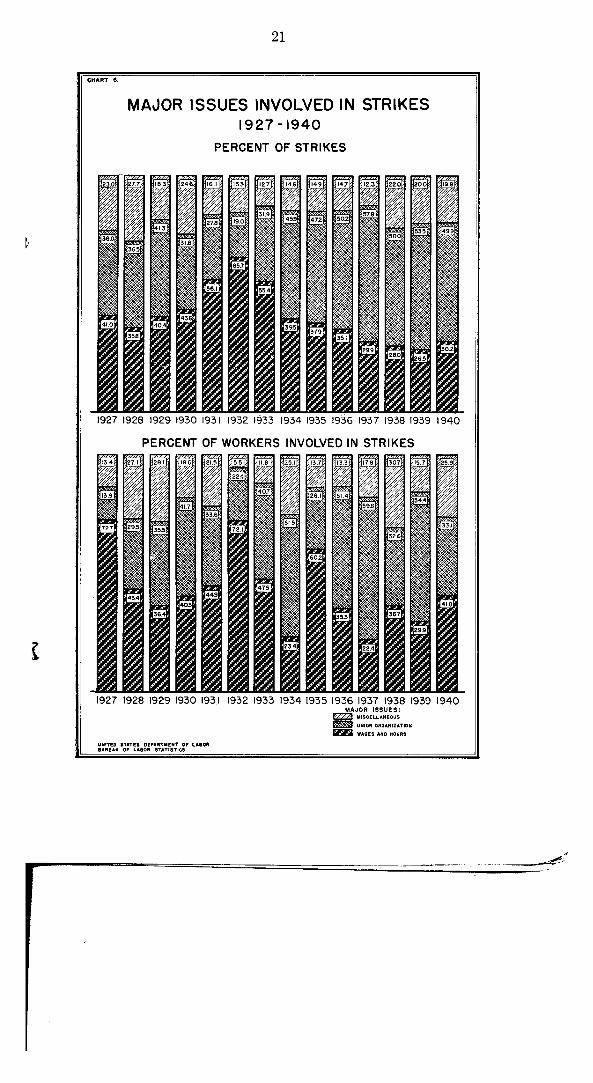
CHART 6.
MAJOR ISSUES INVOLVED IN STRIKES1927 -1940
PERCENT OF STRIKES
I
1927 1928 1929 1930 1931 1932 1933 1934 1935 1936 193 7 1938 1939 1940
PERCENT OF WORKERS INVOLVED IN STRIKESre,
1927 1928 1929 1930 1931 1932 1933 1934 1935 1936 1937 1938 1939 1940MAJOR ISSUES:
223 MISCELLANEOUS
UNION ORGANIZATIONEa WAGES AND HOURS
UNITED STATES DEPARTMENT Of LABORBUREAU Of LABOR STATISTICS
21

22
"Strengthening bargaining position" refers to disputes in which aunion endeavors to extend the scope of its representation and bargain-ing, usually by attempting to represent a greater proportion of theworkers or to extend the subject matter about which it can bargainfor its members. In most of these cases formal recognition has beengranted previously. In some of the disputes classified under "closedor union shop" the union demanded the check-off as a means ofobtaining or stabilizing the closed-shop condition.
The disputes classified as "other" under the union-organizationstrikes centered in some union organization difficulty which did notfall under the preceding headings An example of such disputeswas one under a closed-shop agreement, where there was an issue asto whether a firm must select its new employees from the union'slist of eligibles. Another case coming under this classification wasone in which the union charged the firm with failing or refusing totake up and settle grievances under the procedure provided for intheir agreement.
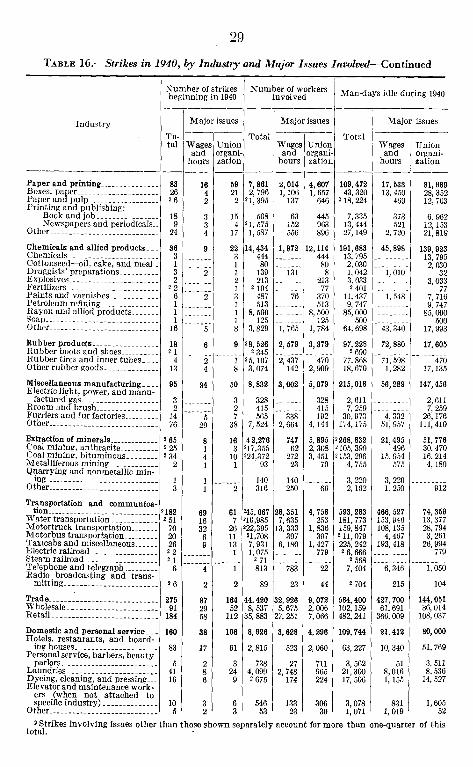
Table 16 (p. 27) shows the major issues involved in the strikes thatoccurred in each industry and each industry group. The number ofstrikes, the number of workers involved, and the man-days of idlenessare shown for each class of strike.
Results of Strikes
The Bureau classifies the results of strikes to show whether theworkers won substantially all they demanded, gained a part of whatthey sought, or were largely unsuccessful either in gaining theirdemands or in defeating changes demanded by the employer whichthey did not want. A strike that is "substantially won," or theso-called successful strike, does not in all cases result in an advanceor improvement in working conditions; it may mean merely that theworkers have been successful in warding off an attempted worseningof their condition, as in a case where they maintained their formerwages by defeating a proposal for a wage decrease.
The results of strikes must necessarily be based on the terms ofsettlement in relation to the issues which caused the strikes as revealedat their termination. The apparent results at the close of a strike,however, may not indicate the final outcome. A strike apparentlywon may be only a temporary victory for the workers if the firm latergoes out of business or decides to move to another locality. Like-wise a strike apparently lost may serve to convince an employerthat he must improve conditions for his workers in order to avoidfuture stoppages and interruptions to production. Nevertheless, astatistical classification must for practical reasons be based on theapparent results at the termination of the strikes.
23
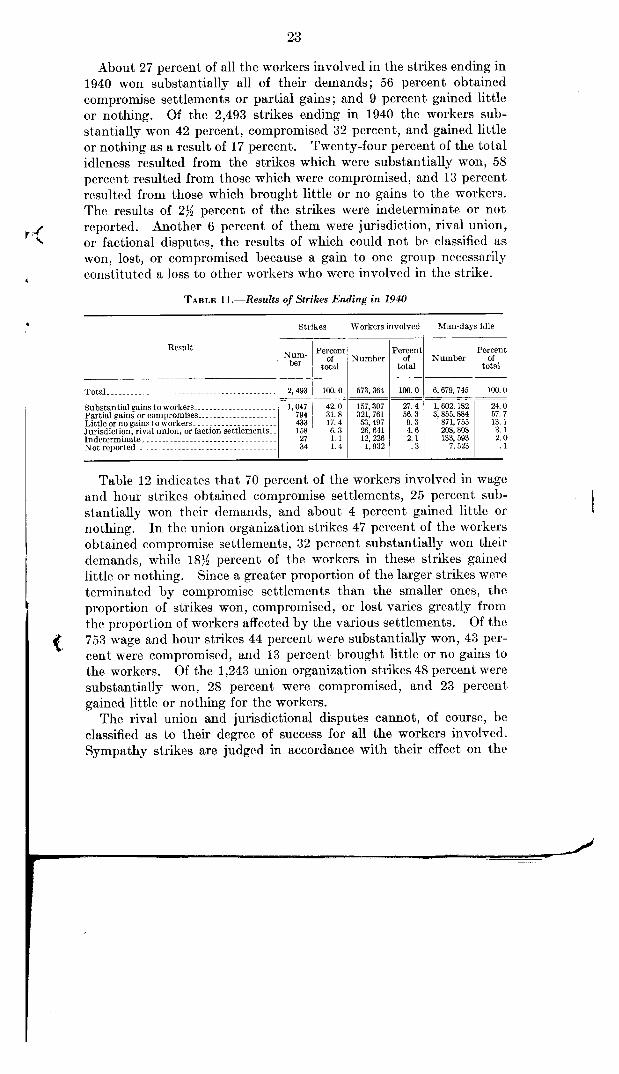
About 27 percent of all the workers involved in the strikes ending in1940 won substantially all of their demands; 56 percent obtainedcompromise settlements or partial gains; and 9 percent gained littleor nothing. Of the 2,493 strikes ending in 1940 the workers sub-stantially won 42 percent, compromised 32 percent, and gained littleor nothing as a result of 17 percent. Twenty-four percent of the totalidleness resulted from the strikes which were substantially won, 58percent resulted from those which were compromised, and 13 percentresulted from those which brought little or no gains to the workers.The results of 2 1/2 percent of the strikes were indeterminate or notreported. Another 6 percent of them were jurisdiction, rival union,or factional disputes, the results of which could not be classified aswon, lost, or compromised because a gain to one group necessarilyconstituted a loss to other workers who were involved in the strike.
TABLE 11.—Results of Strikes Ending in 1940
Strikes Workers involved Man-days idle
Result Percent Percent PercentNum- of Number of Number ofber total total total
Total 2, 493 100.0 573, 364 100.0 6, 679, 745 100.0
Substantial gains to workers 1, 047 42. 0 157, 307 27. 4 1, 602, 182 24. 0Partial gains or compromises __ 794 31.8 321, 761 56.3 3, 855, 884 57.7Little or no gains to workers 433 17.4 53, 497 9.3 871, 755 13. 1Jurisdiction, rival union, or faction settlements 158 6. 3 26, 641 4.6 208, 808 3. 1Indeterminate 27 1. 1 12, 226 2. 1 133, 593 2. 0Not reported 34 I.4 1, 932 . 3 7, 523 . 1
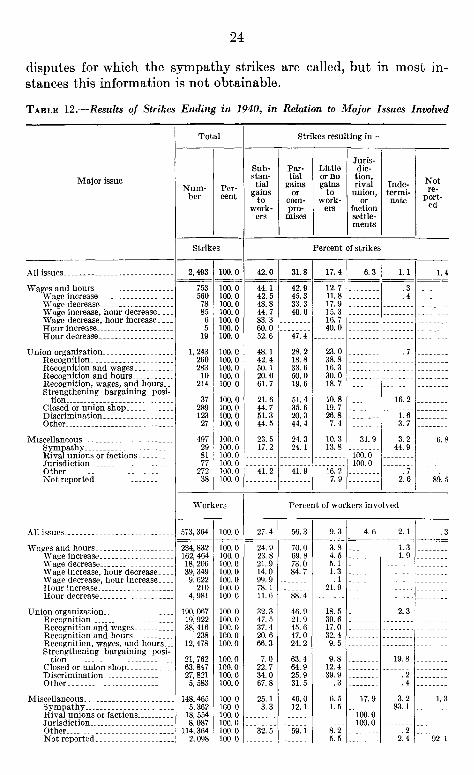
Table 12 indicates that 70 percent of the workers involved in wageand hour strikes obtained compromise settlements, 25 percent sub-stantially won their demands, and about 4 percent gained little ornothing. In the union organization strikes 47 percent of the workersobtained compromise settlements, 32 percent substantially won theirdemands, while 18% percent of the workers in these strikes gainedlittle or nothing. Since a greater proportion of the larger strikes wereterminated by compromise settlements than the smaller ones, theproportion of strikes won, compromised, or lost varies greatly fromthe proportion of workers affected by the various settlements. Of the753 wage and hour strikes 44 percent were substantially won, 43 per-cent were compromised, and 13 percent brought little or no gains tothe workers. Of the 1,243 union organization strikes 48 percent weresubstantially won, 28 percent were compromised, and 23 percentgained little or nothing for the workers.
The rival union and jurisdictional disputes cannot, of course, beclassified as to their degree of success for all the workers involved.Sympathy strikes are judged in accordance with their effect on the
4
24
disputes for which the sympathy strikes are called, but in most in-stances this information is not obtainable.
TABLE 12.-Results of Strikes Ending in 1940, in Relation to Major Issues Involved
Major issue
Total
Num-ber
Per-cent
Strikes
All issues 2, 493 100. 0
Wages and hours 753 100. 0Wage increase 560 100. 0Wage decrease 78 100. 0Wage increase, hour decrease 85 100. 0Wage decrease, hour increase 6 100. 0Hour increase 5 100. 0Hour decrease 19 100. 0
Union organization 1, 243 100. 0Recognition 260 100. 0Recognition and wages 283 100. 0Recognition and hours 10 100. 0Recognition, wages, and hours 214 100. 0Strengthening bargaining posi-
tion 37 100. 0Closed or union shop 289 100. 0Discrimination 123 100. 0Other 27 100. 0
Miscellaneous 497 100. 0Sympathy 29 100. 0Rival unions or factions 81 100. 0Jurisdiction 77 100. 0Other 272 100. 0Not reported 38 100. 0
Workers
All issues 573,364 100. 0
Wages and hours 234,832 100. 0Wage increase 162,464 100. 0Wage decrease 18,206 100. 0Wage increase, hour decrease 39,349 100. 0Wage decrease, hour increase_ _ 9,622 100. 0Hour increase _ _ 210 100. 0Hour decrease 4,981 100. 0
Union organization 190, 067 100. 0Recognition 19, 922 100.0Recognition and wages 38, 416 100. 0Recognition and hours 238 100. 0Recognition, wages, and hours 12,478 100.0Strengthening bargaining posi-
tion 21,762 100. 0Closed or union shop 63.847 100.0Discrimination 27,821 100. 0Other 5,583 100.0
Miscellaneous 148, 465 100. 0Sympathy 5, 362 100. 0Rival unions or factions 18, 554 100. 0Jurisdiction 8, 087 100. 0Other 114, 364 100.0Not reported 2. 098 100.0
Strikes resulting in-
Sub- Par-stan- tialtial gains
gains orto corn-
work- pro-ers wises
Percent of strikes
42. 0 31. 8 17. 4 6.3 1. 1 1. 4
44. 142. 5
42.945.3
12. 7
11. 8 .3.4
48. 8 33. 3 17.9 44. 7 40. 0 3 83. 3 7 60. 0 40. 0 52. 6 47. 4
48. 1 28. 2 23. 0 .7 42. 4 18. 8 38. 8 50. 1 33. 6 16. 320. 0 50. 0 30. 0 61. 7 19. 6 18. 7
21. 6 51. 4 10. 8 16. 2 44.7 35. 6 19. 7 51.3 20. 3 26. 8 1.6 44.5 44. 4 7. 4 3. 7
23. 5 24. 3 10. 3 31. 9 3. 2 6. 817. 2 24. 1 13. 8 44. 9
100. 0100. 0
41.2 41. 9 16. 2 .7 7. 9 2. 6 89. 5
Percent of workers involved
27. 4 56. 3 9. 3 4. 6 2. 1 .3
24. 9 70. 0 3.8 1.3 23. 8 69. 8 4. 5 1.9 21. 9 73. 0 5. 1 14.0 84. 7 1.3 99. 9 .1 78. 1 21.9 11. 6 88. 4
32.3 46. 9 18. 5 2. 3 47.5 21. 9 30. 6 37.4 45. 6 17.0 20.6 47. 0 32. 4 66.3 24. 2 9. 5
7.0 63.4 9. 8 19. 8 22. 7 64.9 12. 4 34. 0 25.9 39.9 .2 67.8 31.5 .3 .4
25. 1 46. 0 6. 5 17.9 3. 2 I. 33. 3 12. 1 1.5 83. 1
100. 0 100. 0
32. 5 59. 1 8. 2 .2 5. 5 2. 4 92. 1
Littleor nogains
towork-
ers
Juris-dic-tion,rival
union,Or
factionsettle-ments
Inde-termi-nate
Notre-
port-ed
25
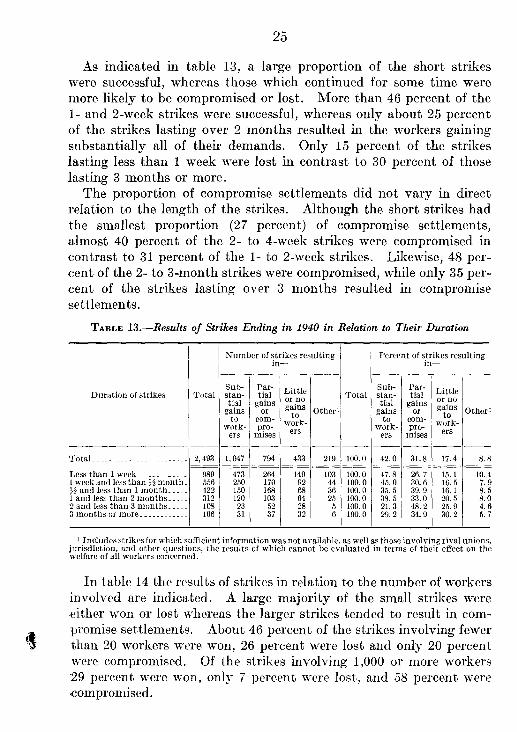
As indicated in table 13, a large proportion of the short strikeswere successful, whereas those which continued for some time weremore likely to be compromised or lost. More than 46 percent of the1- and 2-week strikes were successful, whereas only about 25 percentof the strikes lasting over 2 months resulted in the workers gainingsubstantially all of their demands. Only 15 percent of the strikeslasting less than 1 week were lost in contrast to 30 percent of thoselasting 3 months or more.
The proportion of compromise settlements did not vary in directrelation to the length of the strikes. Although the short strikes hadthe smallest proportion (27 percent) of compromise settlements,almost 40 percent of the 2- to 4-week strikes were compromised incontrast to 31 percent of the 1- to 2-week strikes. Likewise, 48 per-cent of the 2- to 3-month strikes were compromised, while only 35 per-cent of the strikes lasting over 3 months resulted in compromisesettlements.
TABLE 13.-Results of Strikes Ending in 1940 in Relation to Their Duration
Number of strikes resulting Percent of strikes resultingin- in-
Duration of strikes Total stan- tial Little Total stan- tialtial gains gains tial gains •
Sub- Par-Sub- Par- Littleor no or noD
gains or 8at;T' Other , gains to corn- work-work- pro- R, work- pro- R.,ers raises ers ers raises ers
gains orto corn- .OL
to,
Total 2,493 1,047 794 433 219 100.0 42.0 31.8 17.4 8.8
Less than 1 week 989 473 264 149 103 100.0 47.8 26.7 15.1 10.41 week and less than 44 month_ 556 250 170 92 44 100.0 45.0 30.6 16.5 7. t44 and less than 1 month_ _ _ _ _ 422 150 168 68 36 100.0 35.5 39.9 16.1 8.51 and less than 2 months_ _ _ _ _ 312 120 103 64 25 100.0 38.5 33.0 20.5 8.02 and less than 3 months_ _ _ _ _ 108 23 52 28 5 100.0 21.3 48.2 25.9 4. C3 months or more 106 31 37 32 6 100.0 29.2 34.9 30.2 5.7
I Includes strikes for which sufficient information was not ailable, as well as those involving rival unions,jurisdiction, and other questions, the results of which cannot be evaluated in terms of their effect on thewelfare of all workers concerned.
In table 14 the results of strikes in relation to the number of workersinvolved are indicated. A large majority of the small strikes wereeither won or lost whereas the larger strikes tended to result in com-promise settlements. About 46 percent of the strikes involving fewerthan 20 workers were won, 26 percent were lost and only 20 percentwere compromised. Of the strikes involving 1,000 or more workers29 percent were won, only 7 percent were lost, and 58 percent were•compromised.

26
TABLE 14.-Results of Strikes Ending in 1940 in Relation to Number of Workers Involved
Number of strikes resultingin-
Percent of strikes resultingin-
Sub- Par- Little' Sub- Par- LittleNumber of workers involved Total stan-tial
tial•gams Or 110.gains
Total stan-tial
tialgains or no.
gainsto
work-ers
orcoin-pro-
mises
Other' gainsto
work-ers
orcoin-pro-
mises
gainsto
work-ers
Other'towork-
ers
Total 2, 493 1, 047 794 433 219 100. 0 42.0 31. 8 17. 4 8. 8
6 and under 20 610 283 122 159 46 100. 0 46.4 20. 0 26. 1 7. 520 and under 100 1, 039 457 278 197 107 100.0 43. 9 26. 8 19. 0 10. 3100 and under 250 425 171 179 42 33 100. 0 40. 2 42. 1 9. 9 7. 8250 and under 500 193 75 84 17 17 100.0 38.9 43.5 8.8 8.8500 and under 1,000 116 29 67 10 10 100. 0 25. 0 57. 8 8. 6 8. 61,000 and under 5,000 95 30 53 7 5 100.0 31. 6 55. 7 7.4 5. 35,000 and under 10,000 11 2 7 1 1 100. 0 18. 2 63.6 9. 1 9. 110,000 and over 4 4 100. 0 100. 0
Includes strikes for which sufficient information was not available, as well as those involving rival unions,jurisdiction, and other questions, the results of which cannot be evaluated in terms of their effect on thewelfare of all workers concerned.
Methods of Negotiating Settlements
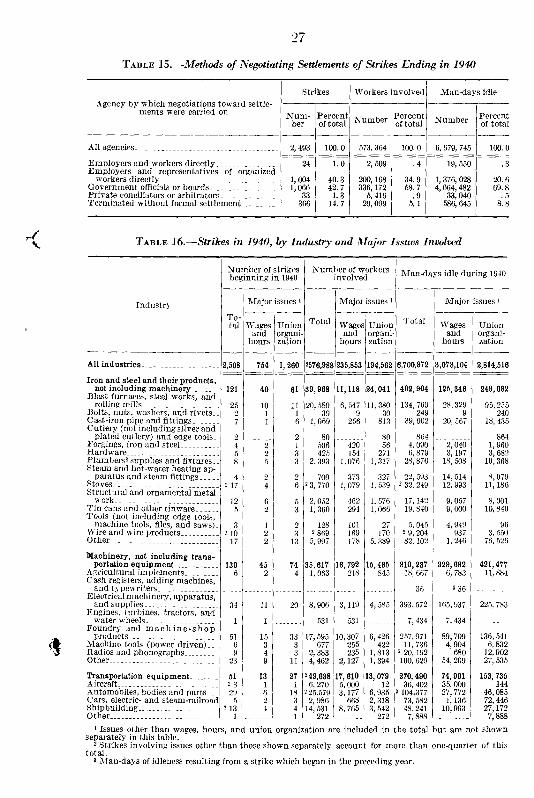
Nearly 43 percent of the strikes ending in 1940 were settled withthe assistance of Government officials or boards. On the averagethese were the larger and more prolonged strikes, as is evidenced bythe fact that they included about 59 percent of the total workersinvolved in all strikes and accounted for 70 percent of the total idle-ness. Approximately 40 percent of the strikes, which included 35percent of the total workers and accounted for 21 percent of the totalidleness, were settled directly between employers and union officials.Private conciliators or arbitrators assisted in settling 33 strikes (1.3percent of the total) during the year. Nearly 15 percent of the strikes,which included 5 percent of the total workers and accounted for 9 per-cent of the total idleness, were terminated without formal settlements.In most of these cases the strikers discontinued their strikes andreturned to work on the employers' terms or they lost their jobsentirely when the management replaced them with new workers,moved to other localities, or went out of business.
Of the 1,066 strikes settled with the assistance of Governmentofficials or boards, 1,021 were settled through conciliation or media-tion. Arbitration was used in 45 cases. Of the 33 settled with theaid of private conciliators or arbitrators, conciliation methods wereused in 11 and arbitration in 22. In 67 out of 2,493 strikes endingduring 1940, work was resumed when both parties agreed to turn oversome or all of the matters in dispute to a neutral person for finalsettlement.
Industry
All industries_
Iron and steel and their products,not including machinery
Blast furnaces, steel works, androlling mills
Bolts, nuts, washers, and rivets Cast-iron pipe and fittings Cutlery (not including silver and
plated cutlery) and edge tools_Forgings, iron and steel Hardware
Plumbers° supplies and fixtures Steam and hot-water heating ap-
paratus and steam fittings Stoves Structural and ornamental metal
work Tin cans and other tinware Tools (not including edge tools,
machine tools, files, and saws)_Wire and wire products Other
Machinery, not including trans-portation equipment
Agricultural implements C ash registers, adding machines,
and typewriters Electrical machinery, apparatus,
and supplies Engines, turbines, tractors, and
water wheels Foundry and mach ine-shop
products Machine tools (power driven)_ _ _Radios and phonographs Other
Transportation equipment Aircraft Automobiles, bodies and parts_ _Cars, electric- and steam-railroadShipbuilding Other
97
TABLE 15.-Methods of Negotiating Settlements of Strikes Ending in 1940
Agency by which negotiations toward settle-ments were carried on
Strikes Workers involved Man-days idle
Num-ber
Percentof total Number
I Percentof total Number Percent
of total
All agencies
Employers and workers directly Employers and representatives of organized
workers directly Government officials or boards Private conciliators or arbitrators Terminated without formal settlement
2, 493 100. 0 573, 364 100. 0 6, 679, 745 100. 0
24
1, 0041, 066
33366
1. 0
40. 342. 7
1. 314. 7
2, 509
200, 168336, 172
5, 41629, 099
. 4
34. 958. 7
.95. 1
19, 550
1, 376, 0284, 664, 482
33, 040586, 645
. 3
20. 669. 8
. 58. 8
7( TABLE 16.-Strikes in 1940, by Industry and Major Issues Involved
Number of strikesbeginning in 1940
Number of workersinvolved ' Man-days idle during 1940
Major issues I Major issues I Major issues I
TOtal Wages Union Total Wages Union Total Wages Unionand organi- and organi- and organi-
hours zation hours zation hours cation
2,508 754 1, 260 2576,988 235,853 194,562 6,700,872 3,078,104 2,814,516
121 40 61 39,968 11,118 24,041 402,904 125,346 249,082
25 10 11 20, 580 6, 547 11, 380 134, 769 28, 329 95, 2552 1 1 39 9 30 249 9 2407 1 6 1,069 256 813 39,002 20,567 18, 435
2 2 80 80 864 8644 2 1 506 420 56 4,090 2,040 1,9605 2 3 425 154 271 6, 879 3, 197 3,6828 5 3 2, 393 1,076 1,317 28, 876 18,508 10,368
4 2 2 700 373 327 22,593 14,514 8,0792 17 4 6 2 3, 770 1, 079 1, 539 2 32, 249 12, 993 11, 186
12 6 5 2, 052 462 1. 576 17, 142 9, 057 8, 0015 2 3 1, 360 294 1, 066 19, 840 9, 000 10, 840
3 1 2 128 101 27 5,045 4,949 962 10 2 3 2 869 169 170 2 9, 204 937 3, 550
17 2 13 5, 997 178 5, 389 82, 102 1, 246 76, 526
130 45 74 35,617 16,792 15,485 810,237 329,692 421,4776 2 4 1, 063 218 845 18, 667 6, 783 11, 884
36 2 36
34 11 20 8,906 3,119 4,585 393,572 165,937 225, 783
1 1 531 531 7,434 7,434
51 15 33 17, 595 10,307 6,426 257,971 89, 709 136, 5416 3 3 677 255 422 11,736 4,904 6,8329 4 3 2, 383 235 1, 813 2 20, 192 680 12,902
23 9 11 4, 462 2, 127 1, 394 100, 629 54, 209 27, 535
51 13 27 2 49,638 17, 610 13, 079 270, 490 74, 901 153, 7352 3 1 1 6,270 5, 000 12 36, 402 35,000 14429 6 18 2 25,579 3,177 6, 935 2 104,377 27, 772 46,085
5 2 3 2, 986 668 2, 318 73, 582 1, 136 72, 4462 13 4 4 14, 531 8,765 3, 542 48, 241 10,993 27,172
i 1 I 272 272 7 RFN 7. 858
I Issues other than wages, hours, and union organization are included in the total but are not shownseparately in this table.
2 Strikes involving issues other than those shown separately account for more than one-quarter of thistotal.
2 Man-days of idleness resulting from a strike which began in the preceding year.

28
TABLE 16.-Strikes in 1940, by Industry and Major Issues Involved-Continued
beginning in 1940 involvedNumber of strikes Number of workers Man-days idle during 1940
Industry Major issues Major issues Major issues
To- Total Totaltal Wages Union Wages Union Wages Union
and organi- and organi- and organ i-hours zation hours zation hours zation
nferrous metals and theirroducts 52 22 27 15, 990 3,701 11,738 253, 269 119, 038 131, 945
ss, bronze, and copper prod-
cks, watches, and time-re-
minum manufactures 4 4 9, 064 9, 064 30, 866 30,866
rts 4 1 2 2 292 45 127 2, 598 135 2, 343
arding devices 1 1 11 11 132 132elry 1 1 405 405 9, 954 9.954hting equipment 8 4 3 443 103 329 6, 384 543 5, 771
siting and refining-copper,ad, and zinc 7 4 2 1,908 1, 224 264 51, 762 41, 838 7, 821erware and plated ware 2 2 575 575 40, 000 40, 00(
roped and enameled ware 14 9 5 2, 176 1, 576 600 50, 807 20, 493 30, 311her 11 4 7 I, 116 753 363 60, 766 56, 029 4, 737
tuber and allied products 211 69 106 52, 293 29, 977 17, 789 806, 773 397, 738 364, 279tniture 92 30 51 12, 203 5, 449 5,904 234, 503 91, 586 124, 62;work and planing 34 10 17 7,282 4,345 1,880 67, 021 29, 714 29,927mills and logging camps 50 21 17 28, 206 18, 624 7, 467 364, 909 205, 295 142, 421
her 35 8 21 4, 602 1, 559 2, 538 140, 340 71, 143 67, 29£
te, clay, and glass products__ _ 65 21 36 12, 604 8,484 4, 501 205, 919 89, 991 102,854ck, tile, and terra cotta 20 4 14 3, 175 529 2, 405 71, 962 24, 692 45, 561nent 6 1 5 972 160 812 26, 182 3, 520 22,66:ss 11 8 1 5,804 4,823 26 55,206 48,260 1,71(Ale, granite, slate, and otherroducts 2 3 1 2 75 29 2 866 52)tery 2 5 1 2 2 953 236 340 2 15, 062 2, 360 6, 901ter 20 7 13 1,625 736 889 36, 641 11, 159 25,481
tiles and their products 2 348 81 177 277,125 22, 962 19, 584 678,798 153, 018 357, 931)rics: 2 91 27 37 226,150 7, 516 7, 555 2 272,726 41, 714 143, 90(Carpets and rugs 1 1 I, 200 1, 200 2, 538 2, 538 Cotton goods 2 30 6 6 212,791 1, 065 2, 568 2 134,542 11, 080 50, 04:Cotton small wares 1 1 18 18 2 250 90 Dyeing and finishing textiles_ 13 4 8 3, 743 1, 493 1, 533 20, 324 4, 046 14, 12;Silk and rayon goods 2 17 5 5 2 4,042 1,384 1,484 63, 685 10,717 41, 6 , )Woolen and worsted goods 10 7 3 2,206 1,833 373 10,546 6,862 3. 68,Other 19 3 15 2, 150 523 1, 597 40, 841 6, 381 34, 431aring apparel: 257 54 140 2 50,975 15, 446 12, 029 406, 072 111, 304 214, 03;Clothing, men's 2 15 3 7 4, 054 173 3, 366 2 30, 730 657 22, 381Clothing, women's 2 177 33 99 233,467 11, 344 4, 473 2 189,710 40, 762 91, 07;Corsets and allied garments 2 3 2 2 183 33 1, 530 1, 23(Alen3s furnishings 5 3 1 908 872 13 1, 225 1, 140 3,Hats, caps, and millinery_ _ _ _ 13 6 7 3, 567 2, 105 1, 462 47, 044 11, 867 35, 17;Shirts and collars 2 2 195 195 1, 845 1, 84.Hosiery 2 13 5 4 2, 633 778 1, 207 78, 745 54, 567 23, 04:Knit goods 21 3 13 2 5,213 167 666 2 32, 495 2, 290 17, 991Other 8 1 5 755 7 614 22, 748 21 21,24!
,ther and its manufactures ___ _ 39 16 18 7, 039 4, 462 2, 023 125, 084 94, 867 24, 211ots and shoes 18 6 9 4, 287 2, 481 1, 443 43, 860 26, 038 15, 13!ather 5 2 2 432 309 62 15, 359 11, 688 2, 45,ler leather goods 16 8 7 2, 320 1, 672 518 65, 845 57, 141 6, 62
d and kindred products 152 52 78 16,901 9, 508 4,871 154,882 81, 919 60,741king 43 14 22 2, 674 1,800 701 28, 292 14, 168 12,12'verages 11 3 6 2 549 264 110 2 6, 765 1, 404 1, 81:tter 1 1 94 94 564 56nning and preserving 32 15 13 6, 636 4, 016 1,245 44,723 38, 364 4,83'nfectionery 2 9 3 2 2 1,896 987 71 2 13, 400 8, 306 49)ur and grain mills 9 2 6 541 259 261 5, 262 1, 554 3, 66'ughtering and meat packing_ _ 26 9 16 2, 399 1,039 1, 290 30, 348 8,851 21,42'her 21 6 12 2, 112 1, 143 899 25, 328 9, 272 15,81;
awing and smoking tobacco)acco manufactures 2 9 3 3 4, 965 2, 817 2, 032 78, 759 19, 938 57, 41'
nd snuff 2-1 2 9 2 18 TATC iI 3 3 4. 956 2. 817 I 2. 032 78, 741 19, 938 57, 41'
2 Strikes involving issues other than those shown separately account for more than one-quarter of thistotal.
No
AluBra
C lo
JewLigSilSm
IsStaOt
LuFuMilSax0 t
StorBriCeGIMa
pPotOtt
TexFal
LeBoLeOt
ForBaBeBuCaCoFlSlaOti
ToCl
Ci
,tr
29
TABLE 16.-Strikes in 1940, by Industry and Major Issues Involved-Continued
beginning in 1940 involvedNumber of strikes Number of workers
Industry
Man-days idle during 1940
Major issues Major issues Major issues
To- Total Totaltal Wages Union Wages Union Wages Union
and organi- and organi- and organi-hours zation hours zation hours zation
er and printing 83 18 59 7, 861 2,014 4,607 109, 472 17, 533 81, 989es, paper 26 4 21 2, 796 1, 106 1, 657 43, 320 13, 450 28, 352sting and publishing:er and pulp 2 6 2 2 2 1, 395 137 646 218,224 469 12, 703Book and job 18 3 15 508 63 445 7,335 373 6, 962Newspapers and periodicals 9 3 4 1, 575 152 963 13, 444 521 12, 153Br 24 4 17 1, 587 556 896 27, 149 2, 720 21, 819micals and allied products _ _ _ 38 9 22 14,434 1,972 12,114 191, 683 45, 898 139,923micals 3 3 444 444 13, 795 13, 795tonseed-oil, cake, and meal _ 1 1 80 80 2, 030 2, 030ggists' preparations 3 1 139 131 8 1, 042 1, 010 32
plosives 2 2 213 213 3, 033 3, 0334lizers 2 2 1 2 104 77 2 401 77its and varnishes 6 2 3 487 76 370 11, 437 1,548 7, 716•oleum refining 1 1 513 513 9, 747 9, 747on and allied products 1 1 8, 500 8, 500 85, 000 85, 000) 1 1 125 125 500 500er 16 5 8 3, 829 1, 765 1, 784 64, 698 43, 340 17, 993ber products 18 6 9 8, 526 2, 579 1,379 97, 228 72, 880 17, 605ber boots and shoes 2 1 _____ _ _____ _ _ 2 345 2 690 her tires and inner tubes_ _ _ _ 4 2 1 2 5, 107 2,437 470 77, 868 71, 598 470er rubber goods 13 4 8 3, 074 142 2,909 18, 670 1, 282 17, 135
iellaneous manufacturing_ _ _. 95 34 50 8,832 3,002 5,079 215,018 58, 289 147,456Inc light, power, and manu-)tured gas 3 3 328 328 2,611 2,611DD1 and brush 2 2 415 415 7,259 _ _ 7,259riers and fur factories 14 5 7 565 338 192 30,973 4, 332 26, 176er 76 29 38 7,524 2,664 4,144 174, 175 51, 957 111,410action of minerals 2 65 8 18 42,276 747 5,895 2 268, 832 21, 495 51, 778I mining, anthracite 2 25 1 3 2 17,355 62 2,308 2 105, 399 496 30, 470I mining, bituminous 2 34 4 10 224,372 272 3,451 2 153, 296 15, 954 16.214
rrying and nonmetallic min-alliferous mining 2 1 1 93 23 70 4, 755 575 4, 180g 1 1 140 140 3, 220 3, 220
isportation and communica-
Br 3 1 2 316 250 66 2,162 1,250 912
n 2182 89 61 245, 087 28, 351 4, 758 593, 283 486,527 74, 359er transportation 2 51 16 7 210,985 7,635 253 181, 773 153, 946 13, 377,ortruck transportation 70 32 26 222,395 13, 333 1, 836 159, 847 108, 135 28, 794,orbus transportation 20 6 11 2 1,708 397 397 211,079 4,467 3,261[cabs and miscellaneous 26 9 13 7, 931 6, 180 1, 427 225, 242 193, 418 26, 994trio railroad 2 2 1 1,075 779 2 6,666 779m railroad 2 I 2 71 2 568 io broadcasting and trans-phone and telegraph 6 4 1 813 783 22 7,404 6, 346 1,050
itting 2 6 2 2 89 23 44 2 704 215 104
le 275 87 164 44, 420 32, 926 9, 072 584,400 427, 700 144, 051)1esale 91 29 52 8, 537 5, 675 2, 006 102, 159 61, 691 36, 014ill 184 58 112 35, 883 27, 251 7,066 482, 241 366, 009 108, 037
Lestic and personal service_ _ _ 160 38 108 8, 926 3, 828 4,298 109, 744 21, 412 80, 000Bls, restaurants, and board-
anal service, barbers, beautyg houses 83 17 61 2, 815 523 2,066 63, 227 10, 340 51, 769rlors 5 2 3 738 27 711 3,562 51 3,511
rator and maintenance work-s (when not attached toOr 2 0 a KR 0R Qn 1 n71 1 ma
ndries 41 8 24 4,099 2, 748 965 21, 300 8,016 8,536111 g , cleaning, and pressing 16 6 9 2 675 174 224 17, 506 1, 155 14, 527
ecific industry) 10 3 6 546 133 306 3,078 831 1,605
PapBoxPapPri
0th
CheCheCotDruExFerPaiPetRaSoa0th
RubRuRu0th
MisE le
faRroFur0th
ExtrC oaCoaMeQua
inOth
Trado
WaMoMoTaxEleSteaTelRad
TraWhRet
DoHot
inPer
LauDyFla
er
Oth2 Strikes involving issues other than those shown separately account for more than one-quarter of this
total. •
30
TABLE 16-Strikes in 1940, by Industry and Major Issues Involved-Continued
Industry
Number of strikesbeginning in 1940
Number of workersinvolved Man-days idle during 1940
To-tal
Major issues
Total
Major issues
Total
Major issues
Wagesand
hours
Unionorgani-zation
Wagesand
hours
Unionorgani-zation
Wagesand
hours
Unionorgani-zation
Professional service 29 10 12 1,411 612 494 21,661 5,110 13,737Recreation and amusement 24 8 12 1,230 575 494 17,250 4,577 10, 978Professional 2 3 1 2 140 31 21,436 527 Semiprofessional, attendants,
and helpers
Building and construction
2 2
310 77
1
121
2 41
71,316 25,986
6
27,768
2,975
492,901
6
272,206
2 2, 759
100, 298Buildings, exclusive of PWA__ 2218 53 83 58,117 23,534 21,843 403,142 238,164 71, 299All other construction (bridges,
docks, etc., and PWA build-ings) 292 24 38 213,199 2, 452 5, 925 2 89, 759 34, 042 28,999
Agriculture and fishing 24 16 8 5,838 5,062 776 173,841 160,826 13, 015Agriculture Fishing
1410
79
71
2,1303,708
1, 6643, 398
466310
37,359136,482
29, 304131, 522
8, 0554, 960
WPA, relief, and resettlementprojects 4 1 2 2 735 14 41 2 4, 619 14 1, 885
Other nonmanufacturing indus-tries 49 21 23 5, 206 3, 529 1, 340 51,295 23,766 24,744
2 S trikes involving issues other than those shown separately account for more than one-quarter of this total.Man-days of idleness resulting from a strike which began in the preceding year.
TABLE 17.-Strikes in 1940 in States Which Had 25 or More Strikes During the Year,by Industry Group
State, and industry group Number ofstrikes
Number ofworkersinvolved
Man-days idleduring year
Alabama
Iron and steel and their products, not including
34 5, 289 31,575
machinery 3 462 3, 024Machinery, not including transportation equipment _ _ _ 1 13 65Transportation equipment 2 984 2.144Lumber and allied products 5 272 1,303Stone, clay, and glass products 3 296 11,512Food and kindred products 1 49 49Paper and printing 2 250 830Extraction of minerals 2 1,252 1,887Transportation and communication 7 945 7,791Trade 3 31 82Domestic and personal service 1 8 760Building and construction 4 727 2, 128
California 219 32,735 457,559
Iron and steel and their products, not includingmachinery 15 1, 660 26, 231
Machinery, not including transportation equipment _ _ 5 167 5, 499Transportation equipment 2 5,012 35,144Nonferrous metals and their products 2 583 53, 878Lumber and allied products 14 1, 889 15, 003Stone, clay, and glass products 6 1, 041 14, 244Textiles and their products 15 1, 617 21, 759Leather and its manufactures 1 7 56Food and kindred products 21 4,287 26,375Tobacco manufactures 2 66 1,329Paper and printing 2 17 2,911Chemicals and allied products 7 423 7,865Miscellaneous manufacturing 2 89 598Extraction of minerals 1 60 4,040Transportation and communication 19 3, 744 92, 016Trade 34 5, 499 60, 341Domestic and personal service 18 676 14, 409Professional service 4 342 7, 938Building and construction 35 2, 934 16, 523Agriculture and fishing 9 2,513 47,755WPA, relief, and resettlement projects 2 41 1,885Other nonmanufacturing industries 3 68 1,760
31
TABLE 17.-Strikes in 1940 in States Which Had 25 or More Strikes During the Year,by Industry Group-Continued
State, and industry group Number ofstrikes
Number ofworkersinvolved
Man-days idleduring year
Connecticut 34 6, 184 69,838
Iron and steel and their products, not includingmachinery 2 142 3, 068
Machinery, not including transportation equipment_ _ _ _ 5 1, 437 33, 947Transportation equipment I 5, 454Textiles and their products 15 3,819 21,932Rubber products 2 460 1,035Miscellaneous manufacturing 1 32 1,467Transportation and communication 1 4 8Trade 3 48 225Building and construction 5 242 2,702
District of Columbia 25 3,431 19,021
Stone, clay, and glass products 1 180 1, 080Food and kindred products 1 82 1, 230Extraction of minerals 1 250 1,250Transportation and communication 1 20 380Trade 4 1,611 7,386Domestic and personal service 2 43 1,926Building and construction 13 1,216 5,708Other nonmanufacturing industries 2 29 61
Florida 28 9,277 96,515
Transportation equipment 1 1,244 4,976Lumber and allied products 4 400 15,456Stone, clay, and glass products 1 70 280Food and kindred products 2 322 1,122Tobacco manufactures 2 2,767 19,838Paper and printing 1 565 3,955Miscellaneous manufacturing 1 16 320Transportation and communication 4 3,420 47,139Trade 4 54 1,979Domestic and personal service 3 198 856Building and construction 5 221 594
Illinois 133 27,548 462,227
Iron and steel and their products, not including ma-chinery 12 1, 784 24, 246
Machinery, not including transportation equipment_ _ _ _ 12 3, 760 79, 721Transportation equipment 1 1, 034 70, 312Nonferrous metals and their products 3 1, 658 51, 441Lumber and allied products 14 2, 468 30, 805Textiles and their products 3 211 3,506Food and kindred products 7 183 1, 837Paper and printing 3 150 797Chemicals and allied products 8 2, 063 48, 378Rubber products 2 860 6, 725Miscellaneous manufacturing 8 1,193 21,972Extraction of minerals 4 1, 015 15, 825Transportation and communication 6 1,123 18,066Trade 19 8, 289 67, 368Domestic and personal service 4 127 2, 415Building and construction 24 1, 534 17, 527Agriculture and fishing 1 56 98Other nonmanufacturing industries 2 40 1,188
Indiana 67 16, 605 278, 756====
Iron and steel and their products, not including ma-chinery 6 1,757 18,775
Machinery, not including transportation equipment __ _ _ 3 814 30,151Transportation equipment 5 5, 934 8, 233Nonferrous metals and their products 4 708 47, 010Lumber and allied products 4 1, 945 75, 480Stone, clay, and glass products 5 713 31,558Textiles and their products 3 602 8,681Leather and its manufactures 2 102 4,796Food and kindred products 7 407 4,656Paper and printing 1 405 6,678Rubber products 1 1,200 4,800Miscellaneous manufacturing 1 33 7, 029Extraction of minerals 1 65 5, 785Transportation and communication 6 103 3, 649
Man-days of idleness resulting from a strike which began in the preceding year.
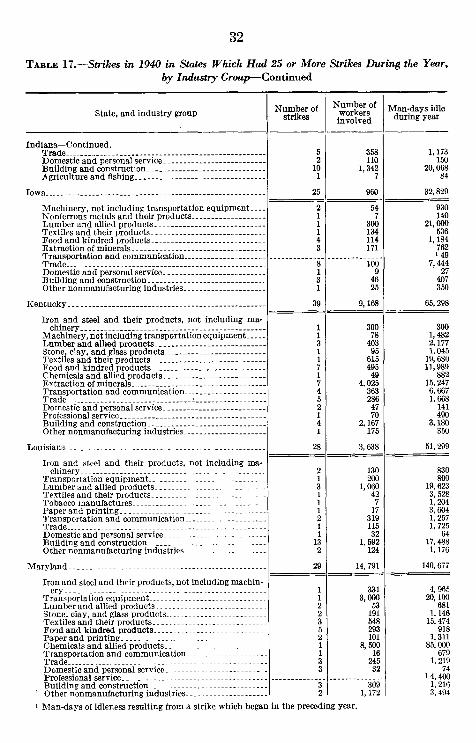
32
TABLE 17.-Strikes in 1940 in States Which Had 25 or More Strikes During the Year,by Industry Group-Continued
State, and industry group Number ofstrikes
Number ofworkersinvolved
Man-days idleduring year
Indiana-Continued.Trade 5 358 1,173Domestic and personal service 2 110 150Building and construction 10 1,342 20,068Agriculture and fishing 1 7 84
Iowa 25 960 32,829
Machinery, not including transportation equipment __ 2 54 930Nonferrous metals and their products 1 7 140Lumber and allied products 1 300 21, 000Textiles and their products 1 134 536Food and kindred products 4 114 1,184Extraction of minerals 3 171 762Transportation and communication 1 49Trade 8 100 7, 444Domestic and personal service 1 9 27Building and construction 3 46 407Other nonmanufacturing industries 1 25 350
Kentucky 39 9,168 65,298
Iron and steel and their products, not including ma-chinery 300 300
Machinery, not including transportation equipment 78 1, 482Lumber and allied products 3 403 2, 177Stone, clay, and glass products 1 95 1, 045Textiles and their products 1 615 19, 680Food and kindred products 7 495 11, 989Chemicals and allied products 1 49 882Extraction of minerals 7 4, 025 15, 247Transportation and communication 4 363 6, 667Trade 5 286 1, 668Domestic and personal service 2 47 141Professional service 1 70 490Building and construction 4 2, 167 3, 180Other nonmanufacturing industries 175 350
Louisiana 28 3, 638 51,299
Iron and steel and their products, not including ma-chinery 2 130 830
Transportation equipment 1 200 800Lumber and allied products 3 1, 060 19, 623Textiles and their products 1 42 3, 528Tobacco manufactures 1 7 1, 204Paper and printing 1 17 3, 604Transportation and communication 2 319 1, 257Trade 1 115 1, 725Domestic and personal service 1 32 64Building and construction 13 1, 592 17, 488Other nonmanufacturing industries 2 124 1, 176
Maryland 29 14, 791 140,677
Iron and steel and their products, not including machin-ery 331 4, 965
Transportation equipment 1 3, 000 20, 100Lumber and allied products 2 53 681Stone, clay, and glass products 2 191 1, 146Textiles and their products 3 548 15, 474Food and kindred products 5 293 918Paper and printing 2 101 1, 311Chemicals and allied products 1 8, 500 85, 000Transportation and communication 1 16 679Trade 3 245 1, 219Domestic and personal service 3 32 74Professional service 1 4, 400Building and construction 3 309 1, 216Other nonmanufacturing industries 2 1, 172 3, 494
1 Man-days of idleness resulting from a strike which began in the preceding year.
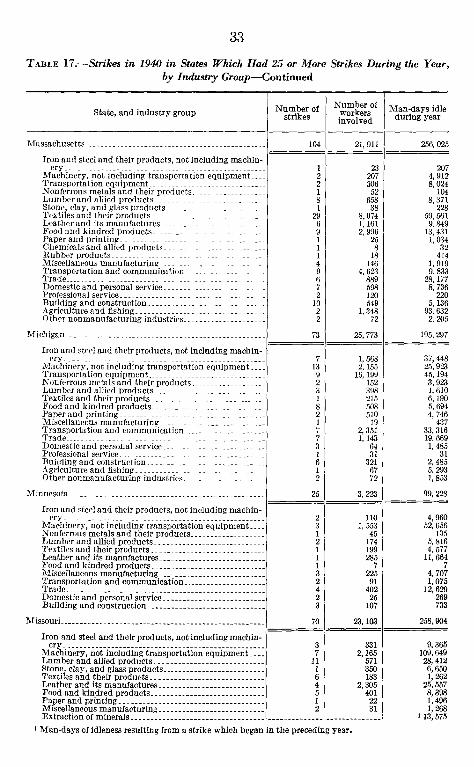
33
TABLE 17.-Strikes in 1940 in States Which Had 25 or More Strikes During the Year,by Industry Group-Continued
State, and industry group Number ofstrikes
Number ofworkersinvolved
Man-days idleduring year
Massachusetts 104 21, 911 256, 025
Iron and steel and their products, not including machin-ery 1 23 207
Machinery, not including transportation equipment_ _ _ _ 2 207 4,912Transportation equipment 2 306 8, 024Nonferrous metals and their products. 1 52 104Lumber and allied products - 8 658 8,371Stone, clay, and glass products 1 38 228Textiles and their products 29 8,074 59,561Leather and its manufactures 6 1, 161 9, 849Food and kindred products 9 2,996 13,431Paper and printing 1 25 1, 034Chemicals and allied products 1 8 32Rubber products 1 18 414Miscellaneous manufacturing 4 146 1,919Transportation and communication 9 4,623 9,833Trade - - - - 6 889 28,177Domestic and personal service - 7 598 8,736Professional service - 2 120 220Building and construction 10 549 5,136Agriculture and fishing 2 1,348 93,632Other nonmanufacturing industries 2 72 2, 205
Michigan 73 25,773 195,297
Iron and steel and their products, not including machin-ery 7 568 37,448
Machinery, not including transportation equipment _ _ _ _ 13 155 25,923Transportation equipment 9 16, 199 45,194Nonferrous metals and their products 2 152 3,923Lumber and allied products 3 398 1,610Textiles and their products 1 215 6,190Food and kindred products 8 508 5,694Paper and printing 2 5I0 4,746Miscellaneous manufacturing 1 19 437Transportation and communication 7 2,351 33,316Trade 7 1,143 19,669Domestic and personal service 3 64 1,485Professional service 1 31 31Building and construction 6 321 2,485Agriculture and fishing 1 67 5,293Other nonmanufacturing industries 2 72 1,853
Minnesota 25 3, 223 99,228
Iron and steel and their products, not including machin-ery 2 110 4, 960
Machinery, not including transportation equipment__ _ _ 3 1, 553 52, 656Nonferrous metals and their products 1 45 135Lumber and allied products 2 174 5, 816Textiles and their products 1 199 4, 577Leather and its manufactures 1 285 11, 664Food and kindred products 1 7 7Miscellaneous manufacturing 3 225 4, 707Transportation and communication 2 91 1, 075Trade 4 402 12, 629Domestic and personal service 2 25 269Building and construction 3 107 733
Missouri 70 23,103 258, 904
Iron and steel and their products, not including machin-ery 3 331 9, 365
Machinery, not including transportation equipment _ 7 2,165 109,649Lumber and allied products 11 571 28, 412Stone, clay, and glass products 1 350 6, 650Textiles and their products 6 183 1, 262Leather and its manufactures 4 2,305 25,557Food and kindred products 5 401 8, 398Paper and printing 1 22 1,496Miscellaneous manufacturing 2 31 1, 268Extraction of minerals l 13, 575
Man-days of idleness resulting from a strike which began in the preceding year.
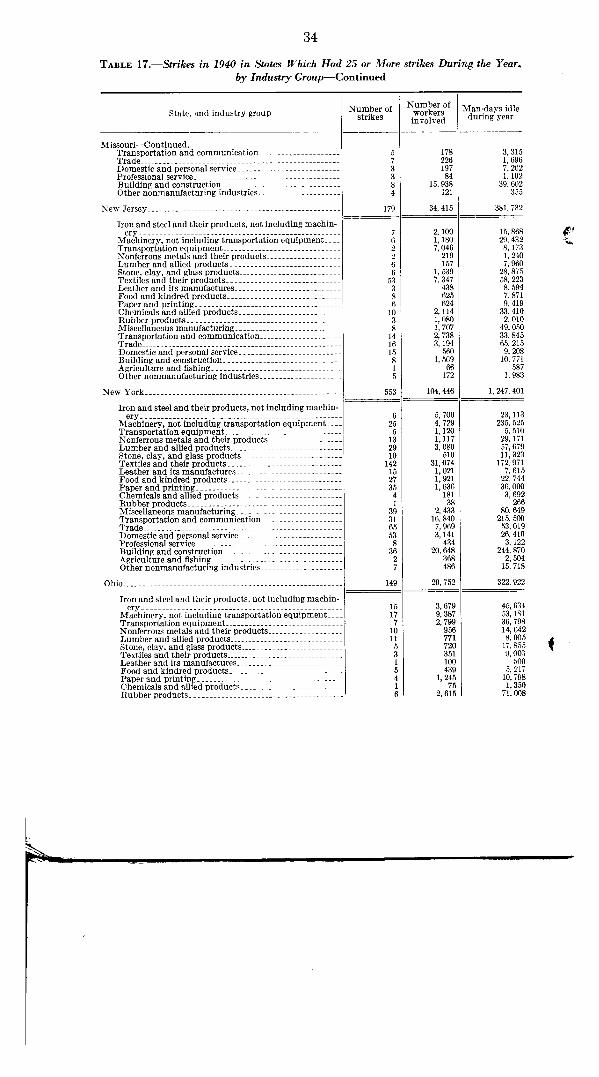
34
TABLE 17.-Strikes in 1940 in States Which Had 25 or More strikes During the Year,by Industry Group-Continued
State, and industry group Number ofstrikes
Number ofworkersinvolved
Man-days idleduring year
Missouri-Continued.Transportation and communication 5 178 3, 315Trade 7 226 1, 696Domestic and personal service 3 197 7, 202Professional service 3 84 1,102Building and construction 8 15,938 39,602Other nonmanufacturing industries 4 121 355
New Jersey 179 34,415 381,732
Iron and steel and their products, not including machin-ery 7 2,100 15, 868
Machinery, not including transportation equipment_ _ _ _ 6 1, 180 29, 432Transportation equipment 2 7, 046 8, 173Nonferrous metals and their products 2 219 1,240Lumber and allied products 6 157 7, 960Stone, clay, and glass products 6 1,539 28,875Textiles and their products 53 7,347 58,223Leather and its manufactures 3 438 8, 594Food and kindred products 8 625 7,871Paper and printing 6 624 9,419Chemicals and allied products 10 2,114 33,410Rubber products 3 1, 080 2, 010Miscellaneous manufacturing 8 1, 707 49, 050Transportation and communication 14 2, 738 33, 845Trade 16 3, 194 65, 215Domestic and personal service 15 560 9,208Building and construction 8 1,509 10,771Agriculture and fishing 1 66 587Other nonmanufacturing industries 5 172 1, 983
New York 553 104, 446 1, 247, 401
Iron and steel and their products, not including machin-ery 6 5, 700 23,113
Machinery, not including transportation equipment __ 25 4, 729 235, 525Transportation equipment 5 1,120 5,510Nonferrous metals and their products 13 1,117 29, 171Lumber and allied products 29 3, 080 57, 679Stone, clay, and glass products 10 510 11,323Textiles and their products 142 31,074 172,971Leather and its manufactures 15 1,021 7,615Food and kindred products 27 1,921 22, 744Paper and printing 35 1, 636 36, 000Chemicals and allied products 4 181 3, 692Rubber products 1 38 266Miscellaneous manufacturing 39 2, 433 80, 649Transportation and communication 31 16, 840 215, 500Trade 65 7, 969 53, 019Domestic and personal service 53 3,141 26,410Professional service 8 434 3, 122Building and construction 36 20, 648 244. 870Agriculture and fishing 2 368 2, 504Other nonmanufacturing industries 7 486 15, 718
Ohio 149 29, 752 322, 922
Iron and steel and their products, not including machin-ery 15 3,679 45, 634
Machinery, not including transportation equipment __ _ _ 17 9, 387 53,181Transportation equipment 7 2, 799 36, 798Nonferrous metals and their products 10 956 14,642Lumber and allied products 11 771 8, 005Stone, clay, and glass products 5 720 17, 855Textiles and their products 3 351 9, 003Leather and its manufactures 1 100 500Food and kindred products 5 439 5, 217Paper and printing 4 1,245 10, 798Chemicals and allied products 1 75 1, 350Rubber products 6 2, 615 71, 008

35
TABLE 17.-Strikes in 1940 in States Which Had 25 or More Strikes During the Year,by Industry Group-Continued
State, and industry group Number ofstrikes
ofNumber o Man-daysworkersinvolved
idleduring year
Ohio-Continued .Miscellaneous manufacturing 10 1,058 16,311Transportation and communication 15 982 6,629Trade 10 302 3,768Domestic and personal service 4 165 359Building and construction 17 3,023 15. 340WPA, relief, and resettlement projects 1 680 2.720Other nonmanufacturing industries 7 405 3, 804
Oregon 41 7, 062 116, 898Transportation equipment 1 200 200Lumber and allied products 20 4, 038 83.026Stone, clay, and glass products 1 75 525Textiles and their products 1 147 1,470Food and kindred products 1 20 60Miscellaneous manufacturing 2 258 2,274Transportation and communication 11 590 15,676Trade 2 1,325 11,950Building and construction 1 9 117Agriculture and fishing 1 400 1,600
Pennsylvania 301 105, 064 904, 939Iron and steel and their products, not including machin-
ery 29 18,128 159.443Machinery, not including transportation equipment _ _ _ 14 3, 239 50, 953Transportation equipment 4 1, 805 4,130Nonferrous metals and their products 9 9, 865 i 40, 343Lumber and allied products 5 1, 023 3, 814Stone, clay, and glass products 14 3, 717 32, 358Textiles and their products 40 6,494 67, 568Leather and its manufactures 1 122 462Food and kindred products 13 2,381 18, 518Paper and printing 15 1,936 21,646Chemicals and allied products 2 271 4, 924Rubber products 1 55 5, 170Miscellaneous manufacturing 10 1, 411 26, 527Extraction of minerals 41 35, 083 203, 902Transportation and communication 16 924 8, 471Trade 30 9, 263 182, 807Domestic and personal service 18 2, 013 29, 517Professional service 5 212 4. 150Building and construction 25 5, 160 22, 551Agriculture and fishing 2 202 1, 538Other nonmanufacturing industries 1, 760 16,147
Tennessee 25 7, 557 40, 586Iron and steel and their products, not including machin-
ery 1 1, 006 10, 013Transportation equipment 1 48 3, 744Nonferrus metals and their products_ 1 10 200Lumber and allied products 2 467 2, 066Textiles and their products 84 1, 292Leather and its manufactures 208 1, 248Paper and printing 2 160 160Rubber products 1 2, 200 5, 800Transportation and communication 4 339 2,602Trade 2 99 3, 074Domestic and personal service 92 552Building and construction 8 2, 844 6, 835
Texas 40 5, 804 87, 051Transportation equipment 1 327 5,232Lumber and allied products 2 303 2, 178Food and kindred products 3 44 8,197Transportation and communication 6 511 16, 008Trade 6 681 14,517Domestic and personal service 4 215 3, 042Professional service 1 10 30Building and construction 14 2,753 17, 237Agriculture and fishing 2 660 20, 010Other nonmanufacturing industries 1 300 600
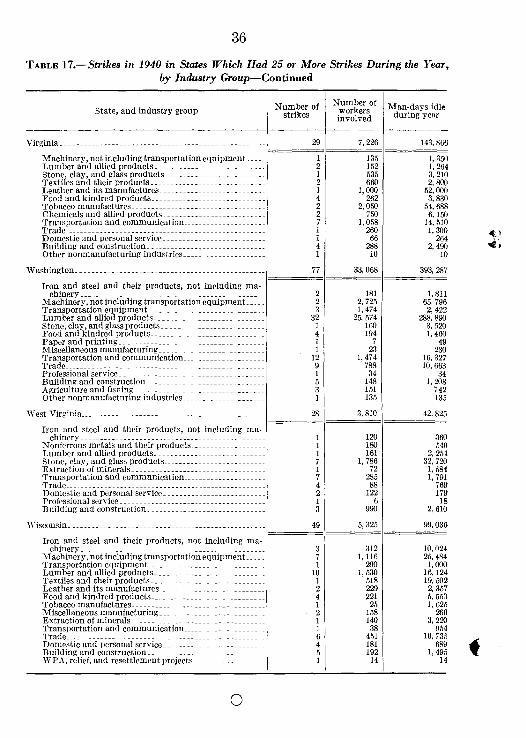
36
TABLE 17.-Strikes in 1940 in States Which Had 25 or More Strikes During the Year,by Industry Group-Continued
State, and industry group Number ofstrikes
Number ofcorkersinvolved
Man-days idleduring year
Virginia 29 7, 226 143, 866
Machinery, not ir eluding transportation equipment 1 135 1,350Lumber and allied products 2 152 1,264Stone, clay, and glass products 1 535 3, 210Textiles and their products 2 660 2, 800Leather and its manufactures 1 1,000 52,000Food and kindred products 4 262 3, 830Tobacco manufactures 2 2, 050 54, 688Chemicals and allied products 2 750 6, 150Transportation and communication 7 1,058 14,510Trade 1 260 1,300Domestic and personal service 1 66 264Building and construction 4 288 2,490Other nonmanufacturing industries 1 10 10
Washington 77 33, 068 393, 287
Iron and steel and their products, not including ma-chinery 2 181 1, 811
Machinery, not including transportation equipment 2 2, 725 65, 796Transportation equipment 3 1, 474 2, 422Lumber and allied products 32 25, 574 288, 890Stone, clay, and glass products 1 160 3,520Food and kindred products 4 194 1,460Paper and printing 1 7 49Miscellaneous manufacturing 1 23 230Transportation and communication 12 1,474 16,327Trade 9 788 10, 663Professional service 1 34 34Building and construction 5 148 1,208Agriculture and fisning 3 151 742Other nonmanufacturing industries 1 135 135
West Virginia 28 3,810 42,825
Iron and steel and their products, not including ma-chinery 1 120 360
Nonferrous metals and their products 1 180 540Lumber and allied products 1 161 2,254Stone, clay, and glass products 7 1,786 32,720Extraction of mineral s 1 72 1,584Transportation and communication 7 285 1,791Trade 4 88 769Domestic and personal service 2 122 179Professional service 1 6 18Building and construction 3 990 2,610
Wisconsin 49 5, 325 99,036
Iron and steel and their products, not including ma-chinery 3 312 10, 024
Machinery, not including transportation equipment 7 1, 116 25, 484Transportation equipment 1 200 1,000Lumber and allied products 10 1, 530 16, 124Textiles and their products 1 518 19, 502Leather and its manufactures 2 229 2, 357Food and kindred products 4 221 5, 553Tobacco manufactures 1 25 1, 625Miscellaneous manufacturing 2 158 260Extraction of minerals 1 140 3, 220Transportation and communication 1 38 954Trade 6 451 10, 735Domestic and personal service 4 181 689Building and construction 5 192 1, 495WPA, relief, and resettlement projects 1 14 14
I.
O