Embed Size (px)
Citation preview

MARKETVIEW
24.7 Megawatts
Strong Q3 lines up a record
breaking year
QUARTERLY REVIEW
European Data Centres, Q3 2016
Q3 2016 CBRE Research © 2016 | CBRE Limited 1
1.7% 2.4%
Q3 SNAPSHOT
•
•
•
0
20
40
60
80
100
120
0
100
200
300
400
500
600
700
800
900
1,000
2006 2007 2008 2009 2010 2011 2012 2013 2014 2015 2016
Tak
e-u
p M
W
Sup
ply
MW
Supply Take-up
Figure 1: European Colocation Supply & Take-up as at Q3 2016
Source: CBRE Research, Q3 2016
MARKETVIEW
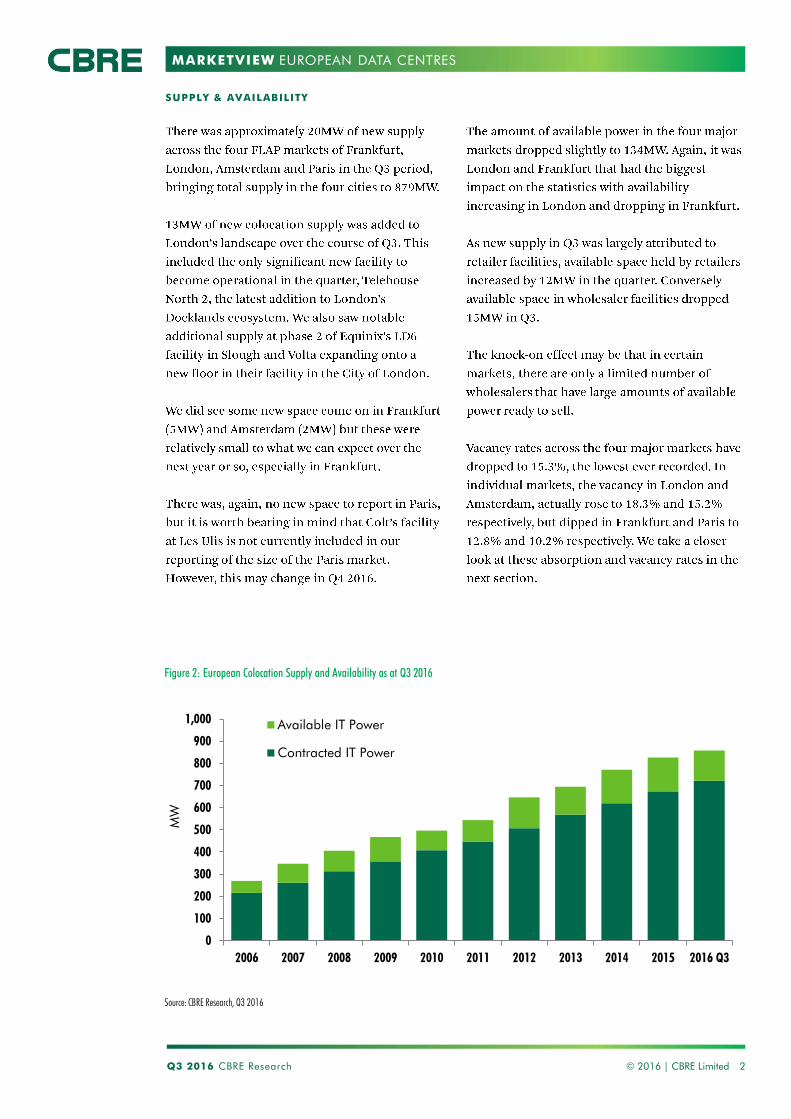
SUPPLY & AVAILABILITY
EUROPEAN DATA CENTRES
Q3 2016 CBRE Research 2 © 2016 | CBRE Limited
Source: CBRE Research, Q3 2016
Figure 2: European Colocation Supply and Availability as at Q3 2016
0
100
200
300
400
500
600
700
800
900
1,000
2006 2007 2008 2009 2010 2011 2012 2013 2014 2015 2016 Q3
MW
Available IT Power
Contracted IT Power

MARKETVIEW
Q3 2016 CBRE Research © 2016 | CBRE Limited 3
EUROPEAN DATA CENTRES
Figure 3: Market Absorption Based on Average Take-up of Previous 5 Years
Source: CBRE Research, Q3 2016
Source: CBRE Research, Q3 2016
MARKET ABSORPTION & VACANCY RATES
Figure 4 Vacancy Rates, as at Q3 2016
0.0
1.0
2.0
3.0
4.0
5.0
6.0
7.0
0%
5%
10%
15%
20%
25%
30%
35%
40%

MARKETVIEW
0
10
20
30
40
50
60
70
80
90
2006 2007 2008 2009 2010 2011 2012 2013 2014 2015 2016
MW
Paris London Frankfurt Amsterdam
TAKE-UP & DEMAND
Q3 2016 CBRE Research © 2016 | CBRE Limited 4
EUROPEAN DATA CENTRES
Source: CBRE Research, Q3 2016
Figure 5: European Colocation Take-up as at Q3 2016

MARKETVIEW
LONDON
EUROPEAN DATA CENTRES
Q3 2016 CBRE Research 5
Figure 6: London Supply and Take-up 2006-2016 Q3
© 2016, CBRE Limited
FRANKFURT Figure 7: Frankfurt Supply and Take-up 2006-2016 Q3
Source: CBRE Research, Q3 2016
Source: CBRE Research, Q3 2016
0
5
10
15
20
25
30
35
0
50
100
150
200
250
300
350
400
2006
2007
2008
2009
2010
2011
2012
2013
2014
2015
2016
Thousa
nds
Supply (MW) Take-up (MW)
0
5
10
15
20
25
30
35
0
50
100
150
200
250
2006
2007
2008
2009
2010
2011
2012
2013
2014
2015
2016
Thousa
nds
Supply (MW) Take-up (MW)

MARKETVIEW
AMSTERDAM
EUROPEAN DATA CENTRES
Q3 2016 CBRE Research 6 © 2016, CBRE Limited
PARIS
Figure 8: Amsterdam Supply and Take-up 2006-2016 Q3
Figure 9: Paris Supply and Take-up 2006-2016 Q3
Source: CBRE Research, Q3 2016
Source: CBRE Research, Q3 2016
0
5
10
15
20
25
020406080
100120140160180
2006
2007
2008
2009
2010
2011
2012
2013
2014
2015
2016
Thousa
nds
Supply (MW) Take-up (MW)
0
5
10
15
20
25
0
20
40
60
80
100
120
140
2006
2007
2008
2009
2010
2011
2012
2013
2014
2015
2016
Thousa
nds
Supply (MW) Take-up (MW)

MARKETVIEW
DEFINITIONS
SUPPLY
AVAILABILITY
VACANCY RATE
COLOCATION TAKE-UP
EUROPEAN DATA CENTRES
SPACE TYPE
ABSORPTION
Q2 2016 CBRE Research © 2016 | CBRE Limited 7
EUROPEAN DATA CENTRES
Supply Availability Colocation take-up
(quarterly) Colocation take-up
(year to date)
Amsterdam Q3 2016 166 25 4.8 9.6
Q3 2015 153 27 1.0 9.0
Frankfurt Q3 2016 199 25 11.5 30.3
Q3 2015 181 38 3.5 14.6
London Q3 2016 384 70 7.0 28.7
Q3 2015 354 81 4.8 16.1
Paris Q3 2016 129 13 1.3 11.0
Q3 2015 127 16 0.6 2.0
European Tier 1 Total Q3 2016 879 134 24.7 79.6
Q3 2015 816 162 9.9 41.7
Q3 2016 KEY STATISTICS
Figure 10: Key Statistics – year on year comparison (MW)
Source: CBRE Research, Q3 2016

MARKETVIEW
Disclaimer: information contained herein, including projections, has been obtained from sources believed to be reliable. While we do not doubt its accuracy, we have not verified it and make no guarantee, warranty or representation about it. It is your responsibility to confirm independently its accuracy and completeness. This information is presented exclusively for use by CBRE clients and professionals and all rights to the material are reserved and cannot be reproduced without prior written permission of CBRE.
CONTACTS
EUROPEAN DATA CENTRES
CBRE DATA CENTRE SOLUTIONS
•
•
•
•
•
•
•