Embed Size (px)
Citation preview
Strong spatial embedding of social networksgenerates nonstandard epidemic dynamicsindependent of degree distribution and clusteringDavid J. Hawa,1 , Rachael Punga,1, Jonathan M. Readb, and Steven Rileya,2
aMedical Research Council Centre for Global Infectious Disease Analysis, Department of Infectious Disease Epidemiology, School of Public Health, ImperialCollege London, London W2 1PG, United Kingdom; and bCentre for Health Informatics Computing and Statistics, Lancaster Medical School, LancasterUniversity, Lancaster LA1 4YW, United Kingdom
Edited by Alan Hastings, University of California, Davis, CA, and approved August 5, 2020 (received for review July 31, 2019)
Some directly transmitted human pathogens, such as influenzaand measles, generate sustained exponential growth in inci-dence and have a high peak incidence consistent with the rapiddepletion of susceptible individuals. Many do not. While a pro-longed exponential phase typically arises in traditional disease-dynamic models, current quantitative descriptions of nonstan-dard epidemic profiles are either abstract, phenomenological,or rely on highly skewed offspring distributions in networkmodels. Here, we create large socio-spatial networks to repre-sent contact behavior using human population-density data, apreviously developed fitting algorithm, and gravity-like mobil-ity kernels. We define a basic reproductive number R0 for thissystem, analogous to that used for compartmental models. Con-trolling for R0, we then explore networks with a household–workplace structure in which between-household contacts canbe formed with varying degrees of spatial correlation, deter-mined by a single parameter from the gravity-like kernel. Byvarying this single parameter and simulating epidemic spread,we are able to identify how more frequent local movementcan lead to strong spatial correlation and, thus, induce subex-ponential outbreak dynamics with lower, later epidemic peaks.Also, the ratio of peak height to final size was much smallerwhen movement was highly spatially correlated. We investigatethe topological properties of our networks via a generalizedclustering coefficient that extends beyond immediate neighbor-hoods, identifying very strong correlations between fourth-orderclustering and nonstandard epidemic dynamics. Our results moti-vate the observation of both incidence and socio-spatial humanbehavior during epidemics that exhibit nonstandard incidencepatterns.
networks | epidemics | subexponential | clustering
Epidemics are frequently conceptualized as resulting fromthe transmission of a pathogen across a network. Directly
transmitted pathogens propagate through susceptible humanpopulations and create directed infection trees with an offspring-like process (1). Each node may be a different type [e.g., childrenmay be more infectious than adults (2)], and individuals withmany contacts are more likely to cause infection than thosewith fewer contacts (3). Although difficult to observe, infectiontrees describe a real biological process: These pathogens do notreproduce outside of a human host, so the founding pathogenpopulation for an infectee comes directly from their infector.Further, we can conceptualize that infection trees occur whena true offspring process is constrained to pass through a socialnetwork (4, 5), with infection occurring according to a specifiedprobability when an edge exists between a susceptible and aninfectious individual.
The properties of different contact network types can bedescribed by distributions associated with their topology (5).First-order network properties are associated with first-orderconnections, as defined by the degree distribution. For finite
random networks of reasonable size, the degree distributionis well-approximated by a Poisson in which variance is equalto the square of the mean. In contrast, for finite, scale-freenetworks, the offspring distribution is power-law-like, with amuch higher variance. Further, distributions of second-orderphenomena describe connections of length two. For exam-ple, the local clustering coefficient is a second-order property,defined to be the neighborhood density of a given node (5).For a limited set of network types, we can use analyticalexpressions for higher moments of the degree distribution tocalculate key properties of their potential epidemics, such asthe probability of epidemic establishment and cumulative inci-dence (6, 7). Although these higher-order moments are tractablefor some special cases, they are seldom the primary targetof theoretical studies. Semi-empirical networks that arise fromdetailed simulations (8) may have complex higher moments;however, their impact on epidemic dynamics is obscured bythe variance of their offspring distribution (e.g., ref. 9). Here,we explicitly control our network-generation algorithm so asto have nontrivial higher-order structure, while maintaininga Poisson degree distribution and a prespecified clusteringcoefficient.
Epidemics can also be understood in terms of compartmentalmodels, which are more tractable mathematically and are equiv-alent to large network models with very simple topologies (10).Key features of epidemic incidence curves are often explainedby dynamics associated with these models (11, 12). Numericalsolutions to multitype susceptible–infectious–removed-like com-partmental models are easier to obtain than for many topologiesof network and can explain the initial growth phase (13), the
Significance
Epidemics are typically described using a standard set of math-ematical models that do not capture social interactions or theway those interactions are determined by geography. Here,we propose a model that can reflect social networks influ-enced strongly by the way people travel, and we show thatthey lead to very different epidemic profiles. This type ofmodel will likely be useful for forecasting.
Author contributions: D.J.H., J.M.R., and S.R. designed research; D.J.H., R.P., and S.R. per-formed research; D.J.H., R.P., and S.R. contributed new analytic tools; D.J.H., R.P., and S.R.analyzed data; and D.J.H., R.P., J.M.R., and S.R. wrote the paper.y
The authors declare no competing interest.y
This article is a PNAS Direct Submission.y
This open access article is distributed under Creative Commons Attribution License 4.0(CC BY).y1 D.J.H. and R.P contributed equally to this work.y2 To whom correspondence may be addressed. Email: [email protected]
This article contains supporting information online at https://www.pnas.org/lookup/suppl/doi:10.1073/pnas.1910181117/-/DCSupplemental.y
First published September 8, 2020.
23636–23642 | PNAS | September 22, 2020 | vol. 117 | no. 38 www.pnas.org/cgi/doi/10.1073/pnas.1910181117
Dow
nloa
ded
by g
uest
on
Dec
embe
r 26
, 202
1
ECO
LOG
Y
timing and amplitude of the peak (14), the epidemic duration(15), and the total number of cases (16). These models canefficiently describe many different types of complexity, such asage-specific susceptibility and transmissibility (17), behavioralrisk groups (18), and, with increasing frequency, geographicallocation (19).
The basic reproductive number has been defined for bothcompartmental models and network models. For compartmentalmodels, the reproduction number is conditional on the systemhaving a well-defined period of exponential growth (20) andis defined as the average number of new infections generatedby a typically infectious individual in an otherwise infectiouspopulation (20). The word “typically” is somewhat overloadedin this definition: During the exponential phase, a system withheterogeneous population will reach a steady-state distributionof infectives, corresponding to the eigenstate of the renewalprocess.
For network models, the basic reproduction number is mostfrequently defined as the expected ratio of cases between thefirst (seed) and second generations of infection. In homogeneousnetworks, this is equal to the product of the average degree andthe probability of transmission per link per generation. However,many studies of epidemics on networks involve high-variancedegree distributions (9, 21), and so this quantity must be mod-ified to account for excess degree (21, 22). Here, we use R∗ todenote the expected first-generation ratio if a network is homo-geneous, defined to be the expected number of cases in thesecond generation divided by the number in the first genera-tion. Our R∗ is therefore consistent with ρ0, as defined in ref. 21,although we choose not to adjust for overdispersion, because wecondition our network construction on this distribution havinglow variance.
The reproduction number for networks has also been definedto be more consistent with its definition for compartmental mod-els. In ref. 23, R∗ was defined as an asymptotic property ofepidemics that were guaranteed to have an exponential phasewhen they occurred on infinitely large networks. We defineour R0 to be a finite-network approximation to this R∗ inref. 23. This R0 is well-defined during periods of exponentialgrowth.
Both compartmental and network models can be embeddedin space (19). Each node can have a location in space, whileeach compartment can refer to a single unit of space. Nodedensity can be assigned according to known population densi-ties, and compartments can be assigned equal spatial areas, butdifferent numbers of hosts. In general, the risk of infection pass-ing between two people decreases as the distance between theirhome location increases. The propensity of nodes to form linksacross space or for infection to spread between compartmentscan be quantified by using mobility models borrowed from geog-raphy (24), such as the gravity and radiation models. Here, we arespecifically interested in how the overall topology of a spatiallyembedded network model can be driven by different movementassumptions and, thus, drive the gross features of the epidemicsthat occur on the network.
ResultsWe used an existing variant of the Metropolis–Hastings algo-rithm (10) to create a spatially embedded bipartite network ofhomes and workplaces consistent with the population density ofMonrovia, Liberia, and with three illustrative movement scenar-ios (SI Appendix, Fig. S1). An individual’s propensity to choosea given workplace was determined by the distance betweentheir home and workplace and parameters of a gravity-like ker-nel. The kernel was inversely proportional to distance raisedto the power α, with movement scenarios generated solely bychanging the value of α: a control value α=0 that removedthe embedding and produced a nonspatial model; a wide ker-
nel with α=3 typical of developed populations (10, 25); and ahighly local kernel with α=6 representing less-developed popu-lations (SI Appendix, Fig. S1C compared with rural Huangshanin ref. 26). The resulting distributions of distances from hometo work were driven strongly by our choice of α, with 95% of
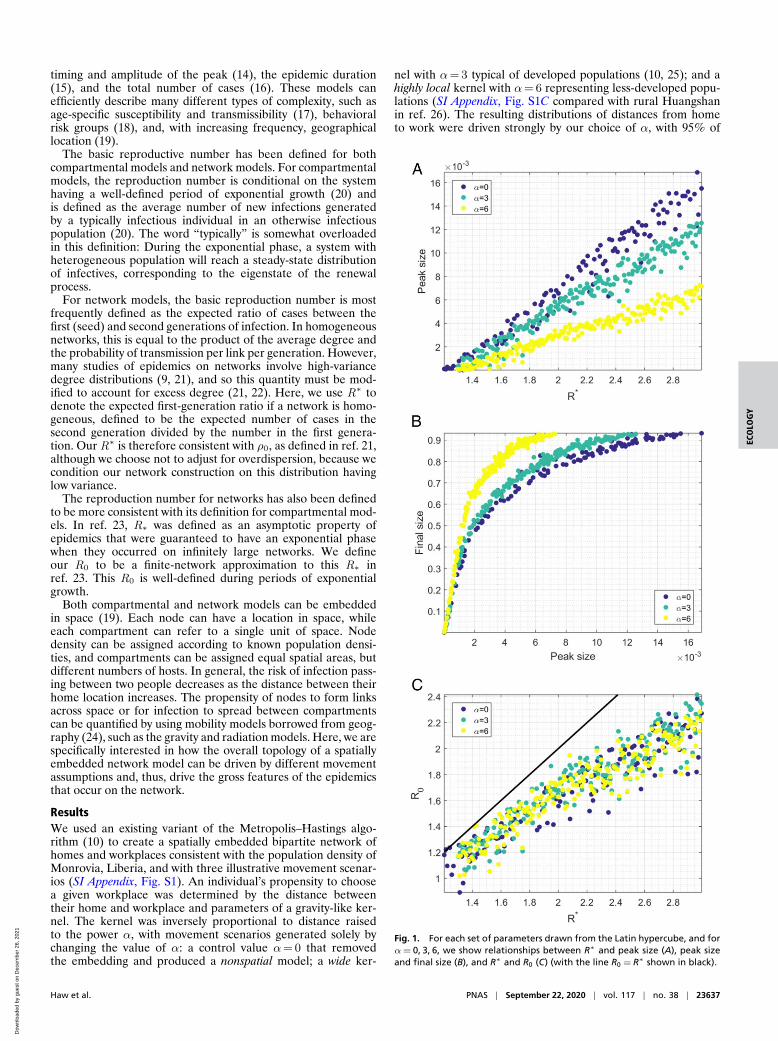
Fig. 1. For each set of parameters drawn from the Latin hypercube, and forα= 0, 3, 6, we show relationships between R∗ and peak size (A), peak sizeand final size (B), and R∗ and R0 (C) (with the line R0 = R∗ shown in black).
Haw et al. PNAS | September 22, 2020 | vol. 117 | no. 38 | 23637
Dow
nloa
ded
by g
uest
on
Dec
embe
r 26
, 202
1
journeys less than 24.12 km for α=0; less than 12.91 km forα=3; and less than 6.68 km for α=6. Workplace links weredissolved into links between individuals in different households,resulting in a network of cliques (households) that were linkedaccording to α.
The choice of movement kernel used to create the household–workplace networks affected gross features of simulated epi-demics, even when controlling for other aspects of the net-work topology (Fig. 1). Unipartite contact networks betweenhouseholds were obtained from the bipartite network of house-holds and workplaces and were dependent on three parameters:mean household size h , mean number of workplace links v ,and probability of forming a link in the workplace pw . Themean workplace size w and mean degree of the network weredetermined by these parameters: w = v/pw +1, 〈k〉= h − 1+ v .Across a broad range of plausible values for h , v , and pw ,very local movement (α=6) produced later epidemics thandid typical developed-population movement (α=3) or spatiallyrandom mixing (α=0; Fig. 1A). Similarly, time to extinction
was later for very local movement (α=6) compared with morefrequent, longer-distance movement (α=3) or the absence ofspatial embedding (α=0). We calculated the coefficient of vari-ation of the degree distribution C 2
V = 〈k2〉/〈k〉− 1∼ 0.1 for eachnetwork, independently of α (21).
Each simulation was assigned a value of R∗, the averagenumber of cases in the first generation per seed infection. Formoderate to high values of the first-generation ratio R∗, therewas very little difference in the final size of the outbreak forthe different movement assumptions. However, for low values ofR∗< 1.8, the average final size of the outbreak was substantiallysmaller for more local kernels. This was driven by a higher proba-bility of extinction when more local movement was assumed. Thedifference in final size driven by α was no longer present whenwe controlled for extinction (SI Appendix, Fig. S2).
The choice of movement scenario had a substantial impacton peak incidence, even when R∗ was high and there was lit-tle difference in the final sizes (Figs. 1B and 2, rows 1 and 2).For example, for parameters with first-generation ratios in the
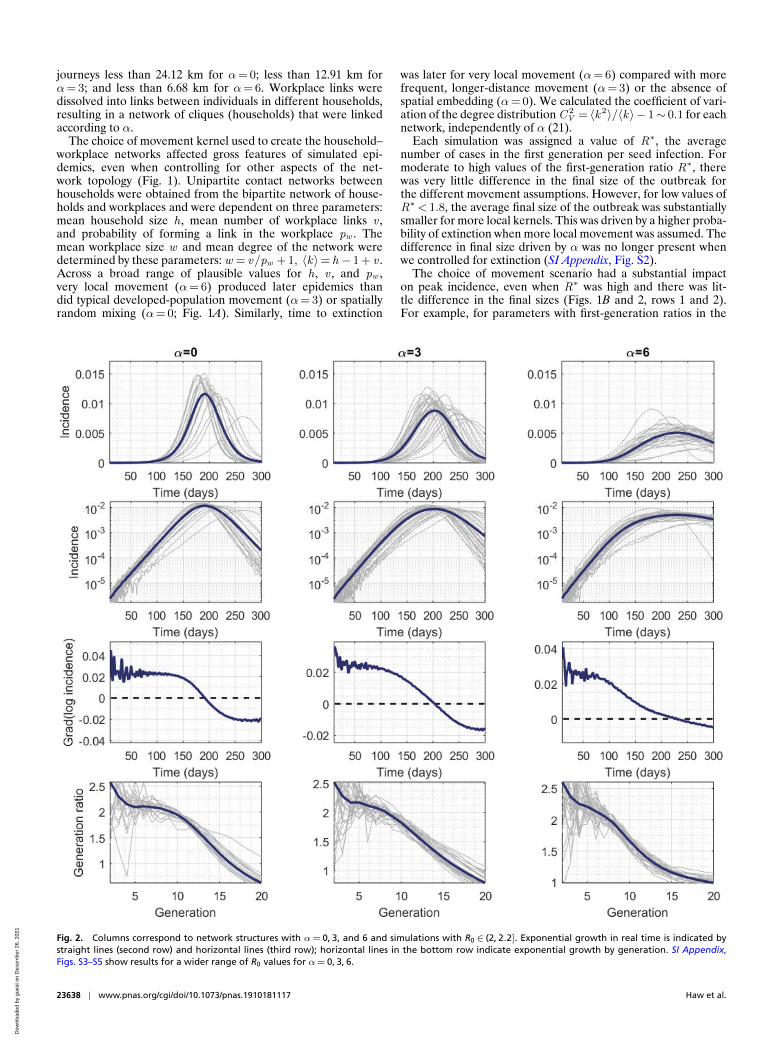
Fig. 2. Columns correspond to network structures with α= 0, 3, and 6 and simulations with R0 ∈ (2, 2.2]. Exponential growth in real time is indicated bystraight lines (second row) and horizontal lines (third row); horizontal lines in the bottom row indicate exponential growth by generation. SI Appendix,Figs. S3–S5 show results for a wider range of R0 values for α= 0, 3, 6.
23638 | www.pnas.org/cgi/doi/10.1073/pnas.1910181117 Haw et al.
Dow
nloa
ded
by g
uest
on
Dec
embe
r 26
, 202
1
ECO
LOG
Y
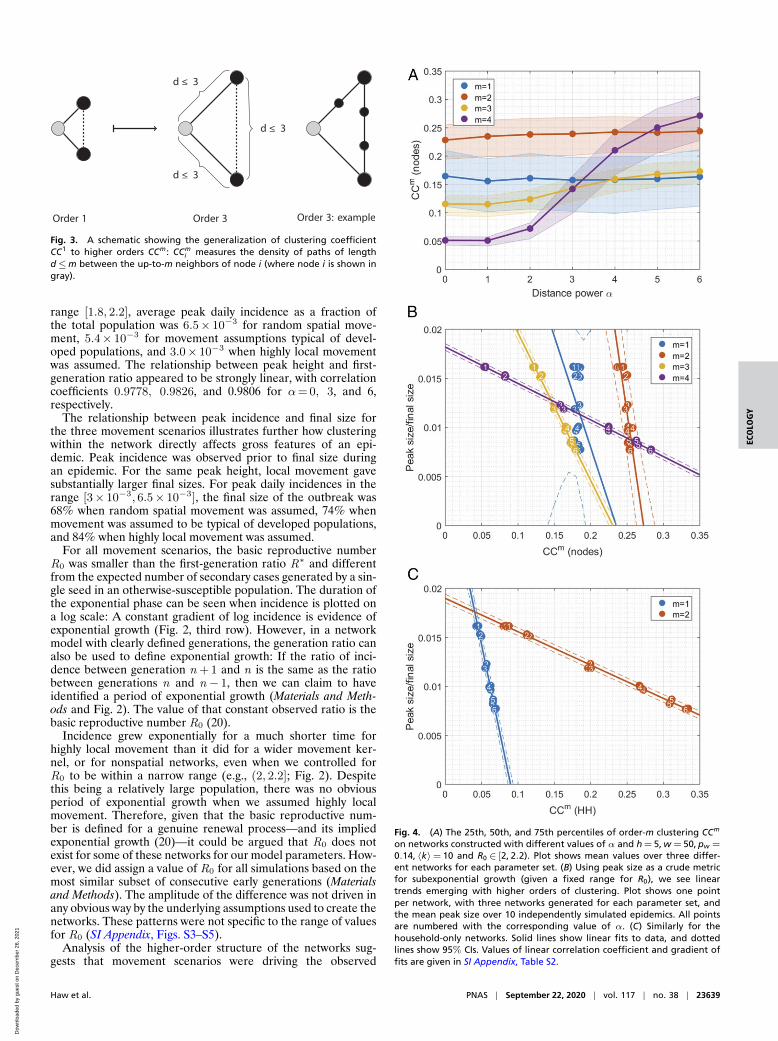
Fig. 3. A schematic showing the generalization of clustering coefficientCC1 to higher orders CCm: CCm
i measures the density of paths of lengthd≤m between the up-to-m neighbors of node i (where node i is shown ingray).
range [1.8, 2.2], average peak daily incidence as a fraction ofthe total population was 6.5× 10⁻³ for random spatial move-ment, 5.4× 10⁻³ for movement assumptions typical of devel-oped populations, and 3.0× 10⁻³ when highly local movementwas assumed. The relationship between peak height and first-generation ratio appeared to be strongly linear, with correlationcoefficients 0.9778, 0.9826, and 0.9806 for α=0, 3, and 6,respectively.
The relationship between peak incidence and final size forthe three movement scenarios illustrates further how clusteringwithin the network directly affects gross features of an epi-demic. Peak incidence was observed prior to final size duringan epidemic. For the same peak height, local movement gavesubstantially larger final sizes. For peak daily incidences in therange [3× 10⁻³, 6.5× 10⁻³], the final size of the outbreak was68% when random spatial movement was assumed, 74% whenmovement was assumed to be typical of developed populations,and 84% when highly local movement was assumed.
For all movement scenarios, the basic reproductive numberR0 was smaller than the first-generation ratio R∗ and differentfrom the expected number of secondary cases generated by a sin-gle seed in an otherwise-susceptible population. The duration ofthe exponential phase can be seen when incidence is plotted ona log scale: A constant gradient of log incidence is evidence ofexponential growth (Fig. 2, third row). However, in a networkmodel with clearly defined generations, the generation ratio canalso be used to define exponential growth: If the ratio of inci-dence between generation n +1 and n is the same as the ratiobetween generations n and n − 1, then we can claim to haveidentified a period of exponential growth (Materials and Meth-ods and Fig. 2). The value of that constant observed ratio is thebasic reproductive number R0 (20).
Incidence grew exponentially for a much shorter time forhighly local movement than it did for a wider movement ker-nel, or for nonspatial networks, even when we controlled forR0 to be within a narrow range (e.g., (2, 2.2]; Fig. 2). Despitethis being a relatively large population, there was no obviousperiod of exponential growth when we assumed highly localmovement. Therefore, given that the basic reproductive num-ber is defined for a genuine renewal process—and its impliedexponential growth (20)—it could be argued that R0 does notexist for some of these networks for our model parameters. How-ever, we did assign a value of R0 for all simulations based on themost similar subset of consecutive early generations (Materialsand Methods). The amplitude of the difference was not driven inany obvious way by the underlying assumptions used to create thenetworks. These patterns were not specific to the range of valuesfor R0 (SI Appendix, Figs. S3–S5).
Analysis of the higher-order structure of the networks sug-gests that movement scenarios were driving the observed
Fig. 4. (A) The 25th, 50th, and 75th percentiles of order-m clustering CCm
on networks constructed with different values of α and h = 5, w = 50, pw =
0.14, 〈k〉= 10 and R0 ∈ [2, 2.2). Plot shows mean values over three differ-ent networks for each parameter set. (B) Using peak size as a crude metricfor subexponential growth (given a fixed range for R0), we see lineartrends emerging with higher orders of clustering. Plot shows one pointper network, with three networks generated for each parameter set, andthe mean peak size over 10 independently simulated epidemics. All pointsare numbered with the corresponding value of α. (C) Similarly for thehousehold-only networks. Solid lines show linear fits to data, and dottedlines show 95% CIs. Values of linear correlation coefficient and gradient offits are given in SI Appendix, Table S2.
Haw et al. PNAS | September 22, 2020 | vol. 117 | no. 38 | 23639
Dow
nloa
ded
by g
uest
on
Dec
embe
r 26
, 202
1

Fig. 5. Mean-field approximation with R0 = 2.2, 〈k〉= 10, h = 4, using a100× 100 grid of uniformly spaced households. (A) Seeding in 10 randomlyselected households (the same households are used in each simulation). (B)Seeding in the center only. Incidence is given as a proportion of the totalpopulation for α ranging from two to six. SI Appendix, Fig. S10 shows timeof peak incidence in the case α= 6 seeded as above.
characteristics of epidemics, such as peak timing and attackrate via increased fourth-order clustering. We use the termfirst-order clustering for the quantity typically described as thelocal clustering coefficient (5): the link density of the imme-diate neighborhood of a given node. By extension, we definedorder-m clustering coefficient to be the expected proportionof neighbors within m steps on the network who were alsoneighbors of each other within m steps (Fig. 3). We found norelationship between our assumed pattern of movement (α)and first- or second-order clustering coefficients. There was aweak relationship between α and third-order clustering and thena very strong relationship between α and fourth-order clus-tering. Patterns between epidemic properties and fourth-orderclustering for individuals were similar to those between epi-demic properties and second-order clustering of households, aswould be expected, given the bipartite algorithm used to createindividual-level networks.
Final size increased with spatial correlation, despite peak sizedisplaying the opposite trend for controlled R∗ or R0. There wasa strong linear relationship between order-m clustering and peak
size/final size that could be explained by α, the strength of spatialembedding, when we control for R0 (Fig. 4B). The gradient ofthe relationship decreased with order of clustering. Second-orderhousehold clustering showed the same relationship with peaksize as did fourth-order individual clustering (Fig. 4C). Thesestrong linear relationships only existed when we effectively con-trolled for R0, rather than R∗, and became less noisy when wereduced the interval used to define R0.
We conducted a number of sensitivity analyses for thesenetwork-simulation results. Analytic approximations for degreedistribution P(K = k) and expected first-order clustering 〈CC 1〉in our networks are given in SI Appendix, Protocol S1 andare independent of α. We confirmed these relationships in SIAppendix, Fig. S6 by computing these quantities on a set of net-works that differ in α. SI Appendix, Fig. S7 shows the relationshipbetween α and clustering order 1 to 4 on networks generated byusing a uniform population density. SI Appendix, Fig. S8 showsthe relationship between order-m clustering CCm and peak sizefor different values of R0. SI Appendix, Fig. S9 shows cluster-ing orders 1 to 4 on networks with different h, w and pw , andSI Appendix, Fig. S10 provides an illustration of the relation-ship between higher-order clustering and rewiring probability ona commonly used network model with spatial embedding: theWatts–Strogatz Small World Network (5).
Finally, we mapped our network model onto a deterministicmetapopulation framework so as to relate our simulations ofincidence to prior analytic approximations of traveling spatialwaves (see SI Appendix, Protocol S1 for analytic construction).Fig. 5 shows the results of simulating on a grid of evenly spacedhouseholds of size h =4, where a single continuous variabledescribes prevalence in each household, and spatial couplingbetween households used in the force of infection is exactly thekernel used in the construction of our spatially embedded net-works. We simulate with randomly spaced seeds (as above) andwith a central seed (the center-most four households), trackingglobal incidence and local time of peak incidence. The formercase yielded global incidence curves similar to those generatedin our network model (which was seeded similarly). The lattercase allowed us to identify four distinct stages in the propaga-tion of spatial waves that contribute to observed subexponentialoutbreak dynamics in more complex, network-based systems. SIAppendix, Fig. S11 shows local peak timing in each case, and SIAppendix, Fig. S12 shows simulation results in one spatial dimen-sion with α=6 and α=12, alongside statistical properties ofprevalence, which further clarify these growth phases (cf. figurelegends for details and SI Appendix, Protocol S1 for mathematicalanalysis).
DiscussionWe have shown that nonstandard epidemic dynamics can arisefrom strongly spatially embedded social networks. Using a flex-ible algorithm of assigning individuals to households and thencreating social networks with widely varying topologies, wecan explain the absence of exponential growth and increasedattack rate for a given peak height in terms of higher-ordersocial structure, while maintaining a standard low-variance off-spring distribution. We observed consistent patterns when wecontrolled for the basic reproductive number, as measured asdirectly as possible from a constant ratio of incidence betweengenerations.
The algorithm we used (10) captures the key social contextsof home and workplace while using few parameters, which hasallowed us to isolate specific relationships within the epidemicdynamics, across a broad range of network topologies. However,its simplicity is a potential limitation. Specifically, an individ-ual only belongs to a single workplace (which may represent aschool or social club). In reality, people will gather nonhouse-hold contacts from a variety of sources. Also, our networks are
23640 | www.pnas.org/cgi/doi/10.1073/pnas.1910181117 Haw et al.
Dow
nloa
ded
by g
uest
on
Dec
embe
r 26
, 202
1
ECO
LOG
Y
not dynamic, which may limit the generalizability of the resultsto short-generation-time pathogens.
Accurate empirical data about higher-order social contactswould allow us to address some of these issues. There area number of different approaches to gathering social-contactdata, including contact diaries, mobile phone applications, andtag-based location tracking (27). Diary methods and currentanalytical approaches can provide accurate estimates of first-order moments [degree distribution (28)] and valuable insightsinto second-order moments [clustering (29)]. However, thesedata and current analytical approaches are limited for the esti-mation of higher-order moments. It seems likely that eitherhigh-resolution mobile-phone location data (30) or very-high-coverage tag-based studies will be needed to reveal these pat-terns (31). In addition, further work is needed on the use ofalgorithms similar to that used here to explicitly fit fully enumer-ated social networks to egocentric sample data from a subset ofthe population (or low-coverage nonegocentric data) (32).
Our results can be compared with other disease-dynamicmodels that produce nonstandard incidence profiles. Differentfunctional forms have been suggested for the force-of-infectionterm in compartmental models that give polynomial growth inthe early stages of an epidemic (20, 33). However, the key fea-tures of these model structures may be captured by a morestraightforward underlying process (34). Faster-than-exponentialgrowth can be achieved with very-high-variance offspring dis-tributions, which have been inferred by diary studies of socialcontacts (9). There is also an extensive literature of much moreabstract grid-based models of infectious disease that producenonstandard epidemic dynamic because of very local spatial pro-cesses [cellular automata (35)]. We note that short periods ofsuper-exponential growth were observed in our results for thesimplified two-dimensional metapopulation example (Fig. 5B),arising from accelerating spatial waves of incidence, not drivenby the variance of the offspring distribution.
Prospective forecasting of infectious-disease incidence duringoutbreaks (36) and seasonal epidemics (37) is an active area ofpublic health research. Although nonmechanistic (38) and sim-ple compartmental models (39, 40) have proven most reliable upto now, modern computing capacity enables studies to explorethe possibility that incidence forecasts can be improved by theincorporation of realistic social-network topology (41, 42). Forexample, incidence of Ebola in West Africa in 2013 to 2016and currently in Central Africa exhibits strong spatial clusteringand highly nonstandard incidence dynamic, with short periods ofexponential growth followed by low sustained peaks in incidence(43). Future forecasting studies should explore the possibilitythat
that sparse population density and short distances between con-tacts result in higher-order clustering in the social networks andthe resulting nonstandard incidence profiles.
Materials and MethodsThe Model. We simulated 10 independent epidemics for each of 200 param-eter sets (h, v, pw , R∗) drawn from a Latin hypercube, each seeded in 10randomly selected individuals, and for each α= 0, 3, 6. The ranges of valuesused in the Latin hypercube are given in SI Appendix, Table S1, and com-plete parameter sets for all networks are given in SI Appendix, Table S1. Oursimulations allowed us to track disease incidence and disease generation ofeach infection.
We simulated an epidemic on the network to reflect the natural historyof Ebola, with a latent period of 9.7 d and a serial interval of 15.3 d. Thegeneration time was calibrated by varying the relative infectiousness of ashort period before the onset of symptoms. Global transmissibility β wastuned to the value of R∗ drawn from the Latin hypercube. For each timestep, the probability of infection was calculated for each edge in the net-work. The algorithm progresses in real time with small time steps, so thatit can be compared with results from compartmental models. Details of thenetwork-simulation algorithm are given in ref. 10.Assigning R0 to each Simulation. For each simulation output, we calculatedthe mean reproductive ratio for each generation. For generations one tonine and for each possible consecutive string of three, four, or five values,we performed a linear regression fit. We defined R0 as the mean reproduc-tive ratio over the set of values for which the gradient of this fit was closestto zero (and all values that remained larger than one). This allowed us toassign a value R0 to every simulation output.
Higher-Order Clustering. We computed our higher-order clustering coeffi-cients on a subset of 1,000 nodes in each network, chosen at random. Thealgorithm involved storing the network structure as lists of neighbors foreach node and performing an effective contact-tracing procedure. Thoughit is possible to compute these metrics for all nodes via successive multi-plication of adjacency matrices, this procedure becomes computationallyexpensive in higher orders as networks become large.
Data Availability. The code to produce networks, the networks them-selves, and code to analyze the networks have been deposited at Zenodo,https://doi.org/10.5281/zenodo.3999974 (44), with more recent versions ofthe code available at GitHub, https://github.com/c97sr/id spatial sim.
ACKNOWLEDGMENTS. We thank Derek Cummings for useful discussions.This work was supported by the UK Medical Research Council (MRC) and theUK Department for International Development (DFID) under the MRC/DFIDConcordat agreement, also part of the EDCTP2 program supported by theEuropean Union (Center MR/R015600/1) (to D.J.H. and S.R.); Wellcome TrustInvestigator Award 200861/Z/16/Z (to S.R.); Wellcome Trust CollaboratorAward 200187/Z/15/Z (to S.R.); National Institute for General Medical Sci-ences Grant MIDAS U01 GM110721-01 (to D.J.H. and S.R.); the NationalInstitute for Health Research (UK, for Health Protection Research Unitfunding) (S.R.); and the Centers for Disease Control and Prevention (D.J.H.).
1. N. C. Grassly, C. Fraser, Mathematical models of infectious disease transmission. Nat.Rev. Microbiol. 6, 477–487 (2008).
2. WHO Ebola Response Team et al., Ebola virus disease among children in West Africa.N. Engl. J. Med. 372, 1274–1277 (2015).
3. K. O. Kwok et al., Social contacts and the locations in which they occur as risk factorsfor influenza infection. Proc. R. Soc. B Biol. Sci. 281, 20140709 (2014).
4. S. P. Blythe, C. Castillo-Chavez, J. S. Palmer, M. Cheng, Toward a unified theory ofsexual mixing and pair formation. Math. Biosci. 107, 379–405 (1991).
5. D. J. Watts, S. H. Strogatz, Collective dynamics of ‘small-world’ networks. Nature 393,440–442 (1998).
6. M. J. Keeling, The effects of local spatial structure on epidemiological invasions. Proc.R. Soc. London Ser. B Biol. Sci. 266, 859–867 (1999).
7. J. C. Miller, Bounding the size and probability of epidemics on networks. J. Appl.Probab. 45, 498–512 (2008).
8. S. Eubank et al., Modelling disease outbreaks in realistic urban social networks.Nature 429, 180–184 (2004).
9. Q. H. Liu et al., Measurability of the epidemic reproduction number in data-drivencontact networks. Proc. Natl. Acad. Sci. U.S.A. 115, 12680–12685 (2018).
10. S. Riley, N. M. Ferguson, Smallpox transmission and control: Spatial dynamics in GreatBritain. Proc. Natl. Acad. Sci. U.S.A. 103, 12637–12642 (2006).
11. R. M. Anderson, R. M. May, B. Anderson, Infectious Diseases of Humans: Dynamicsand Control (Wiley Online Library, New York, NY, 1992), Vol. 28.
12. H. W. Hethcote, The mathematics of infectious diseases. SIAM Rev. 42, 599–653(2000).
13. H. Nishiura, G. Chowell, M. Safan, C. Castillo-Chavez, Pros and cons of estimating thereproduction number from early epidemic growth rate of influenza a (H1N1) 2009.Theor. Biol. Med. Model. 7, 1 (2010).
14. J. T. Wu, S. Riley, C. Fraser, G. M. Leung, Reducing the impact of the next influenzapandemic using household-based public health interventions. PLoS Med. 3, e361(2006).
15. M. Jesse, P. Ezanno, S. Davis, J. A. P. Heesterbeek, A fully coupled, mechanisticmodel for infectious disease dynamics in a metapopulation: Movement and epidemicduration. J. Theor. Biol. 254, 331–338 (2008).
16. D. J. Haw et al., Differential mobility and local variation in infection attack rate. PLoSComput. Biol. 22, e1006600 (2019).
17. J. Griffiths, D. Lowrie, J. Williams, Age-structured model for the AIDS epidemic. Eur.J. Oper. Res. 124, 1–14 (2000).
18. M. C. Boily, C. Lowndes, M. Alary, The impact of HIV epidemic phases on the effec-tiveness of core group interventions: Insights from mathematical models. Sex. Transm.Infect. 78, i78–i90 (2002).
19. S. Riley, K. Eames, V. Isham, D. Mollison, P. Trapman, Five challenges for spatialepidemic models. Epidemics 10, 68–71 (2015).
20. J. A. P. Heesterbeek, A brief history of R0 and a recipe for its calculation. ActaBiotheor. 50, 189–204 (2001).
21. R. M. May, A. L. Lloyd, Infection dynamics on scale-free networks. Phys. Rev. E 64,066112 (2001).
22. L. A. Meyers, Contact network epidemiology: Bond percolation applied to infectiousdisease prediction and control 44, 63–86 (2007).
Haw et al. PNAS | September 22, 2020 | vol. 117 | no. 38 | 23641
Dow
nloa
ded
by g
uest
on
Dec
embe
r 26
, 202
1
23. P. Trapman, On analytical approaches to epidemics on networks. Theor. Popul. Biol.71, 160–173 (2007).
24. P. Expert, T. S. Evans, V. D. Blondel, R. Lambiotte, Uncovering space-independentcommunities in spatial networks. Proc. Natl. Acad. Sci. U.S.A. 108, 7663–7668(2011).
25. J. Truscott, N. M. Ferguson, Evaluating the adequacy of gravity models as a descrip-tion of human mobility for epidemic modelling. PLoS Comput. Biol. 8, e1002699(2012).
26. T. Garske et al., Travel patterns in China. PLoS One 6, e16364 (2011).27. J. M. Read, K. T. D. Eames, W. J. Edmunds, Dynamic social networks and the impli-
cations for the spread of infectious disease. J. R. Soc. Interface 5, 1001–1007(2008).
28. J. M. Read et al., Social mixing patterns in rural and urban areas of southern China.Proc. R. Soc. B Biol. Sci. 281, 20140268 (2014).
29. X. Xiao, A. J. van Hoek, M. G. Kenward, A. Melegaro, M. Jit, Clustering of contactsrelevant to the spread of infectious disease. Epidemics 17, 1–9 (2016).
30. E. Cho, S. A. Myers, J. Leskovec, “Friendship and mobility: User movement in location-based social networks” in Proceedings of the 17th ACM SIGKDD InternationalConference on Knowledge Discovery and Data Mining, KDD ’11 (Association forComputing Machinery, New York, NY, 2011), pp. 1082–1090.
31. C. Cattuto et al., Dynamics of person-to-person interactions from distributed RFIDsensor networks. PLoS One 5, e11596 (2010).
32. P. N. Krivitsky, M. Morris, Inference for social network models from egocentricallysampled data, with application to understanding persistent racial disparities in HIVprevalence in the US. Ann. Appl. Stat. 11, 427–455 (2017).
33. G. Chowell, L. Sattenspiel, S. Bansal, C. Viboud, Mathematical models to characterizeearly epidemic growth: A review. Phys. Life Rev. 18, 66–97 (2016).
34. T. House, A general theory of early growth?: Comment on: “Mathematical models tocharacterize early epidemic growth: A review” by Gerardo Chowell et al. Phys. LifeRev. 18, 109–111 (2016).
35. S. H. White, A. M. del Rey, G. R. Sanchez, Modeling epidemics using cellularautomata. Appl. Math. Comput. 186, 193–202 (2007).
36. M. I. Nelson et al., Fogarty International Center collaborative networks in infectiousdisease modeling: Lessons learnt in research and capacity building. Epidemics 26, 116–127 (2018).
37. M. Biggerstaff et al., Results from the second year of a collaborative effortto forecast influenza seasons in the United States. Epidemics 24, 26–33(2018).
38. D. C. Farrow et al., A human judgment approach to epidemiological forecasting. PLoSComput. Biol. 13, e1005248 (2017).
39. N. G. Reich et al., A collaborative multiyear, multimodel assessment of seasonalinfluenza forecasting in the United States. Proc. Natl. Acad. Sci. U.S.A. 116, 3146–3154(2019).
40. C. Viboud et al., The RAPIDD Ebola forecasting challenge: Synthesis and lessons learnt.Epidemics. 22, 13–21 (2017)
41. M. Tizzoni et al., Real-time numerical forecast of global epidemic spreading: Casestudy of 2009 A/H1N1pdm. BMC Med. 10, 165 (2012).
42. J. M. Drake et al., Ebola cases and health system demand in Liberia. PLoS Biol. 13,e1002056 (2015).
43. Ebola Outbreak Epidemiology Team, Outbreak of Ebola virus disease in the demo-cratic republic of the Congo, April-May, 2018: An epidemiological study. Lancet 392,213–221 (2018).
44. D. J. Haw, R. Pung, J. M. Read, S. Riley, id spatial sim. Zenodo. https://doi.org/10.5281/zenodo.3999974. Deposited 25 August 2020.
23642 | www.pnas.org/cgi/doi/10.1073/pnas.1910181117 Haw et al.
Dow
nloa
ded
by g
uest
on
Dec
embe
r 26
, 202
1


![I2T2I: LEARNING TEXT TO IMAGE SYNTHESIS WITH TEXTUAL … · Visual-semantic embedding generates vector representation that embeds images and sentences into a common space [14]. A](https://img.pdfslide.net/doc/110x75/5f5416f530ac453a3a0faeb1/i2t2i-learning-text-to-image-synthesis-with-textual-visual-semantic-embedding-generates.jpg)


![Self-Supervised Generation of Spatial Audio for 360 Videomorgado/spatialaudiogen/spatialaudiogen.pdf · guitar using for example canonical correlation analysis [24, 25], joint embedding](https://img.pdfslide.net/doc/110x75/5e4cc3964439152e954d0988/self-supervised-generation-of-spatial-audio-for-360-morgadospatialaudiogenspatialaudiogenpdf.jpg)