Embed Size (px)
Citation preview

Strongly non-linear waves in lakes:generation, transformation and
meromixis (project INTAS–03-51-3728)
Northern Water Problems Institute (NWPI), Karelian Scientific Centre, Russian Academy of Sciences,
Petrozavodsk, Russia

Task 1. Data collection and analysis.
Further development
Source of data:
• field measurements in Bol’shoe Onego Bay, Lake Onega (July 2005)
• field measurements in the Bol’shoe Onego Bay (Osetrovskaya Bank), Lake Onega (May-September 1977)
• field measurements in Lizhemskaya Guba, Bol’shoe Onego Bay, Lake Onega (August-September 1987)

Red box: 1-5 – stations of field measurements in 2004-2005; 6 – RCM (1977), 7 – TR (1977)
Blue box: 1, 2, 4, 5 – TRs; 3 – RCM; 6 – АЦИТТ [ADCTM]; 7 – БПВ [LPCM] (АЦИТТ – Autonomic Digital Current & Temperature Meter; БПВ – Letter-Printing Current Meter)
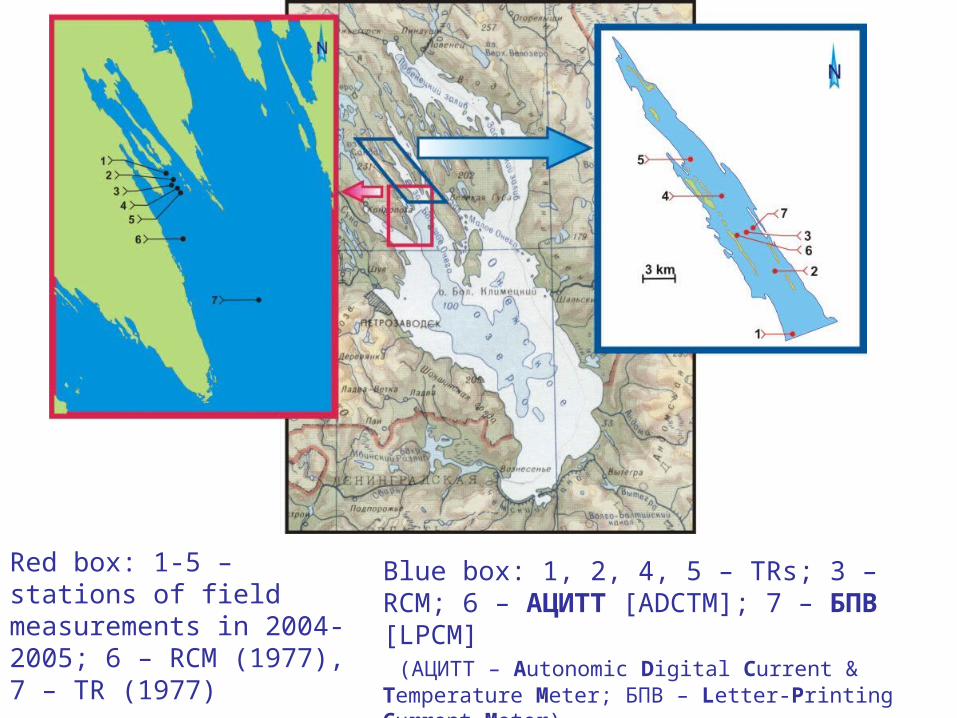
Performing field work.

Win
d s
pe
ed
, m
·s-1
0
2
4
6
8
10
12
13.0
7.0
5
14.0
7.0
5
15.0
7.0
5
16.0
7.0
5
17.0
7.0
5
18.0
7.0
5
19.0
7.0
5
20.0
7.0
5
21.0
7.0
5
22.0
7.0
5
23.0
7.0
5
24.0
7.0
5
Win
d D
ire
ctio
n,
de
g
0
60
120
180
240
300
360
Wind speed and direction during the field campaign 2005
a
13.0
7.05
14.0
7.05
15.0
7.05
16.0
7.05
17.0
7.05
18.0
7.05
19.0
7.05
20.0
7.05
21.0
7.05
22.0
7.05
23.0
7.05
24.0
7.05
Te
mp
era
ture
, 0 C
4
6
8
10
12
14
16
18
20
22
24
1.5 m 3.5 m 5.5 m 7.5 m 9.5 m 11.5 m 13.5 m 15.5 m 17.5 m 19.5 m
b
13.0
7.05
14.0
7.05
15.0
7.05
16.0
7.05
17.0
7.05
18.0
7.05
19.0
7.05
20.0
7.05
21.0
7.05
22.0
7.05
23.0
7.05
24.0
7.05
De
pth
, m
0
5
10
15
20
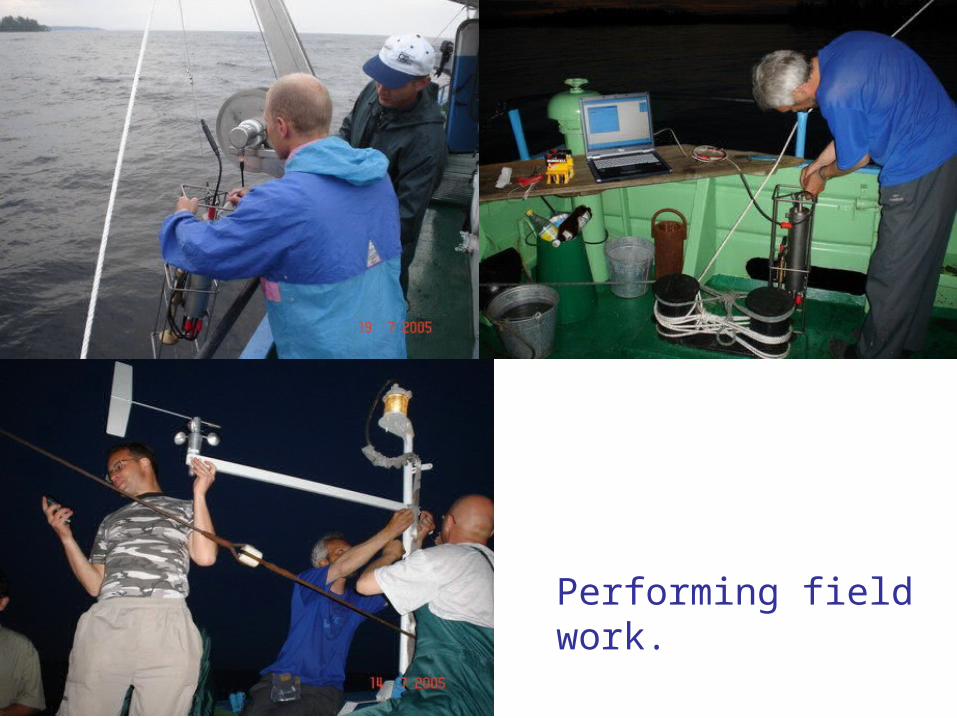
Development of the water temperature in time at st. 2: 13 July 2005, 19:50 - 23 July 2005, 09:50 (a); depth of 14C isotherm location calculated from thermistor chain data for the same period (b).

a
13.0
7.05
14.0
7.05
15.0
7.05
16.0
7.05
17.0
7.05
18.0
7.05
19.0
7.05
20.0
7.05
21.0
7.05
22.0
7.05
23.0
7.05
24.0
7.05
Te
mp
era
ture
, 0 C
2
4
6
8
10
12
14
16
18
20
22
243.4 m 4.4 m 5.4 m 6.4 m 7.4 m 8.4 m 9.4 m 11.3 m 13.3 m 15.3 m 17.3 m 19.3 m 21.3 m 23.3 m 25.3 m 27.3 m 29.3 m 31.3 m
b
13.0
7.05
14.0
7.05
15.0
7.05
16.0
7.05
17.0
7.05
18.0
7.05
19.0
7.05
20.0
7.05
21.0
7.05
22.0
7.05
23.0
7.05
24.0
7.05
De
pth
, m
0
5
10
15
20
25
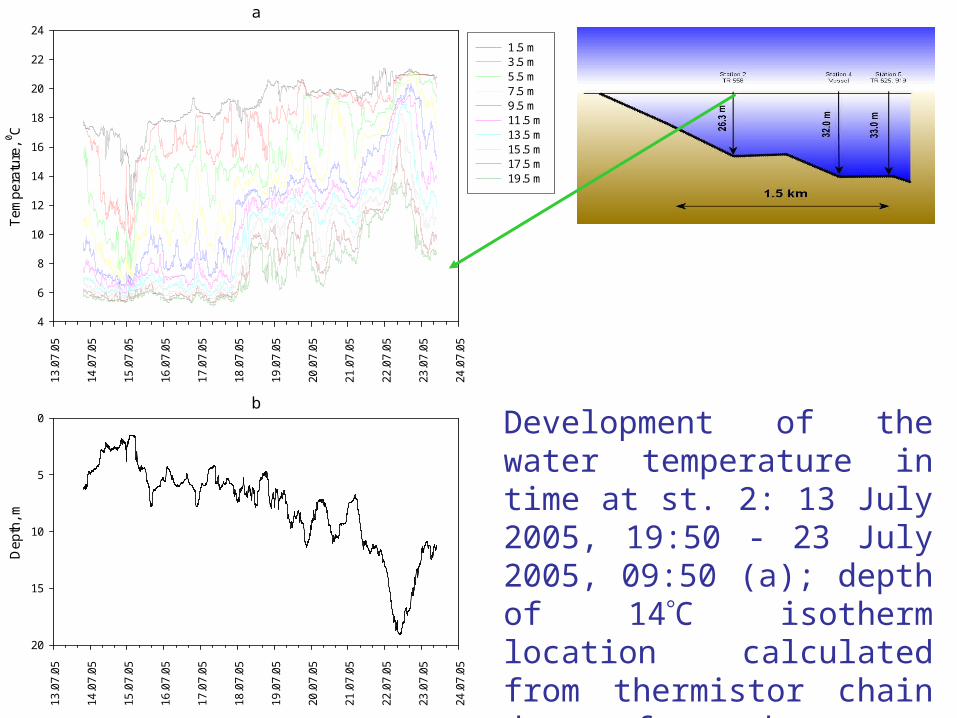
Development of the water temperature in time at st. 5: 13 July 2005, 22:20 - 23 July 2005, 09:20 (a); location of 12C isotherm calculated from thermistor chain data for the same period (b).
13.0
7.05
14.0
7.05
15.0
7.05
16.0
7.05
17.0
7.05
18.0
7.05
19.0
7.05
20.0
7.05
21.0
7.05
22.0
7.05
23.0
7.05
24.0
7.05
Dep
th, m
0
5
10
15
20
25
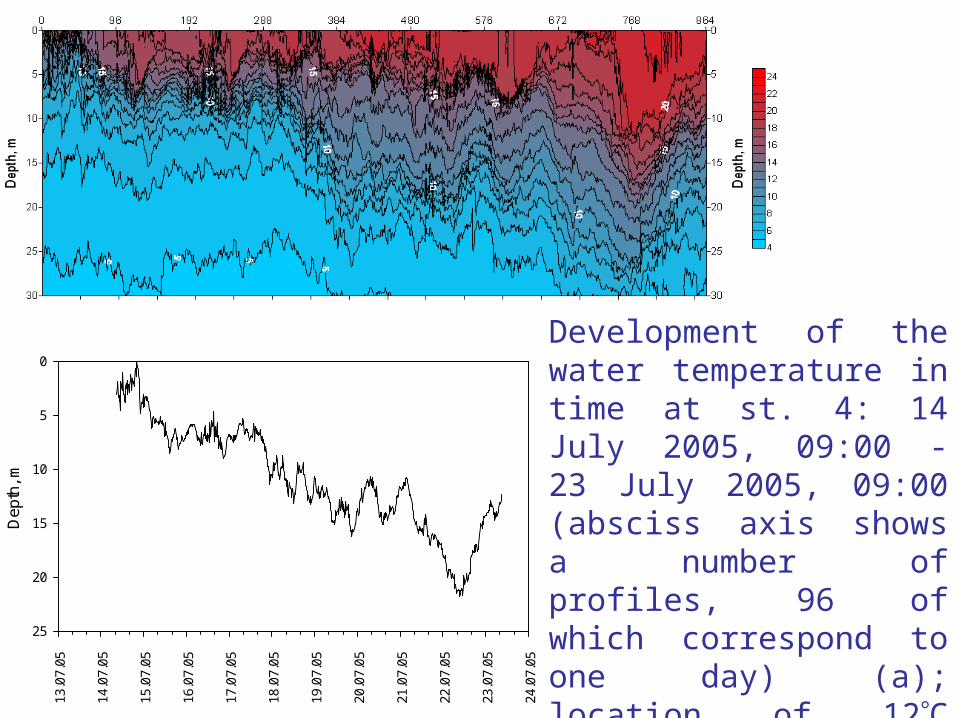
Development of the water temperature in time at st. 4: 14 July 2005, 09:00 - 23 July 2005, 09:00 (absciss axis shows a number of profiles, 96 of which correspond to one day) (a); location of 12C isotherm calculated from vertical profiling data for the same period (b).

The development of the Väisäla-Brent frequency in time at station 4, 14 July 2005, 09:00 - 23 July 2005, 09:00.

Rank 2 Eqn 6870 Chebyshev=>Std Polynomial Order 20r^2=0.94915981 DF Adj r^2=0.94877002 FitStdErr=0.8750996 Fstat=2557.7185
0 2e+05 4e+05 6e+05 8e+05Time index
0
2.5
5
7.5
10
12.5
15
17.5
20
De
pth
, m
0
2.5
5
7.5
10
12.5
15
17.5
20
De
pth
, m
Rank 2 Eqn 6870 Chebyshev=>Std Polynomial Order 20r^2=0.94915981 DF Adj r^2=0.94877002 FitStdErr=0.8750996 Fstat=2557.7185
0 2e+05 4e+05 6e+05 8e+05Time index
-3
-2
-1
0
1
2
3
Resid
uals
-3
-2
-1
0
1
2
3
Resid
uals
5090959999.9
9.425e-06
1.239e-05
1.5496e-05
1.8891e-05
2.2085e-05
2.3882e-05
2.6716e-05
3.0105e-05
3.2529e-05
3.5997e-05
4.2355e-05
0 1e-05 2e-05 3e-05 4e-05 5e-05Frequency, Hz
0
50
100
150
200
250
300
350
PS
D S
SA
, m
2 /H
z
0
50
100
150
200
250
300
350
Frequency, Hz Period, h PSD SSA
9,43E-06 29,5 187,14
1,24E-05 22,4 319,44
1,55E-05 17,9 346,95
1,89E-05 14,7 38,71
2,21E-05 12,6 92,99
2,39E-05 11,6 121,08
2,67E-05 10,4 25,23
3,01E-05 9,2 39,89
3,25E-05 8,5 20,99
3,60E-05 7,7 36,67
4,24E-05 6,6 19,30
PSD calculated for 14C DIL, st. 2: the Curve-Fit Graph (a), the residuals (b), and the Fourier spectrum (c). Horizontal lines mark five significance levels (50%, 90%, 95%, 99%, and 99.9%). The table presents corresponding periods.

Temporal evolution of the vertical thermal structure and currents at the Osetrovskaya Banka [shoal] during the period 27 May – 11 October 1977 (data from thermistor chain registrations). Depth of location 30 m.

0
2
4
6
8
10
12
14
16
18
20
22
24
26
09
.07
.19
77
00
:00
10
.07
.19
77
00
:00
11
.07
.19
77
00
:00
12
.07
.19
77
00
:00
13
.07
.19
77
00
:00
14
.07
.19
77
00
:00
15
.07
.19
77
00
:00
16
.07
.19
77
00
:00
17
.07
.19
77
00
:00
18
.07
.19
77
00
:00
19
.07
.19
77
00
:00
20
.07
.19
77
00
:00
21
.07
.19
77
00
:00
22
.07
.19
77
00
:00
23
.07
.19
77
00
:00
24
.07
.19
77
00
:00
25
.07
.19
77
00
:00
26
.07
.19
77
00
:00
27
.07
.19
77
00
:00
28
.07
.19
77
00
:00
29
.07
.19
77
00
:00
30
.07
.19
77
00
:00
Dep
th, m
15
16
17
18
19
20
21
22
23
19
.07
.19
77
00
:00
19
.07
.19
77
06
:00
19
.07
.19
77
12
:00
19
.07
.19
77
18
:00
20
.07
.19
77
00
:00
20
.07
.19
77
06
:00
Dep
th, m
Izo_11,5Detrend Data
0 20000 40000 60000 80000Time index
17
18
19
20
21
22
23
17
18
19
20
21
22
23
Izo_11,5Fourier Frequency Spectrum
50
90
95
99
99.9
3.5484e-05
9.7472e-05 0.00018197 0.00020506
0 0.0002 0.0004 0.0006 0.0008Frequency
0
5
10
15
20
25
PS
D S
SA
0
5
10
15
20
25
Frequency, Hz
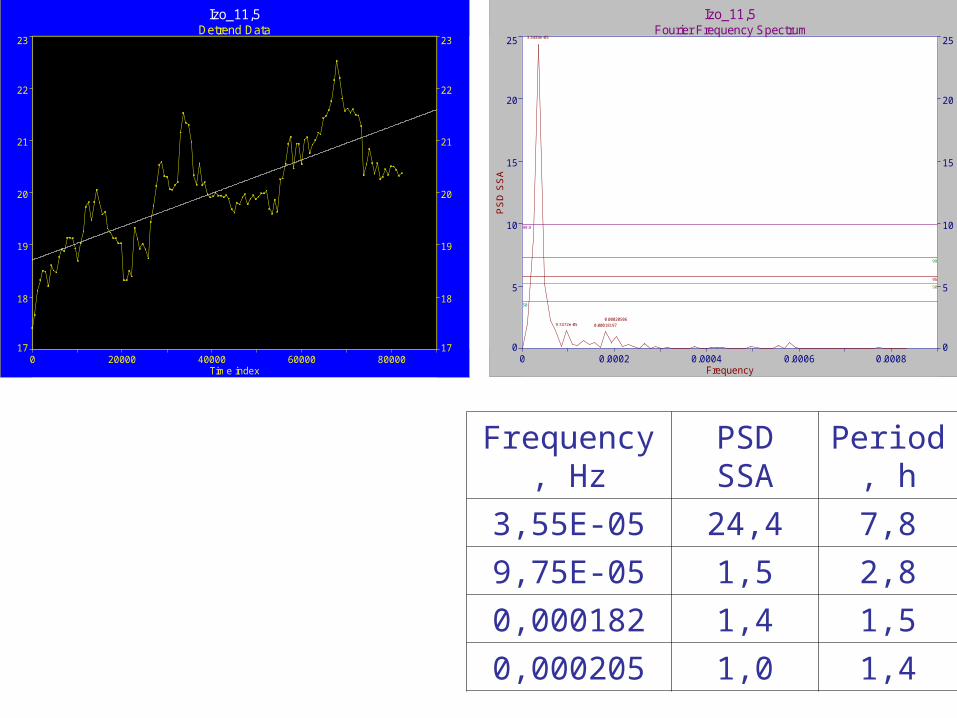
PSD SSA Period, h
3,55E-05 24,4 7,8
9,75E-05 1,5 2,8
0,000182 1,4 1,5
0,000205 1,0 1,4
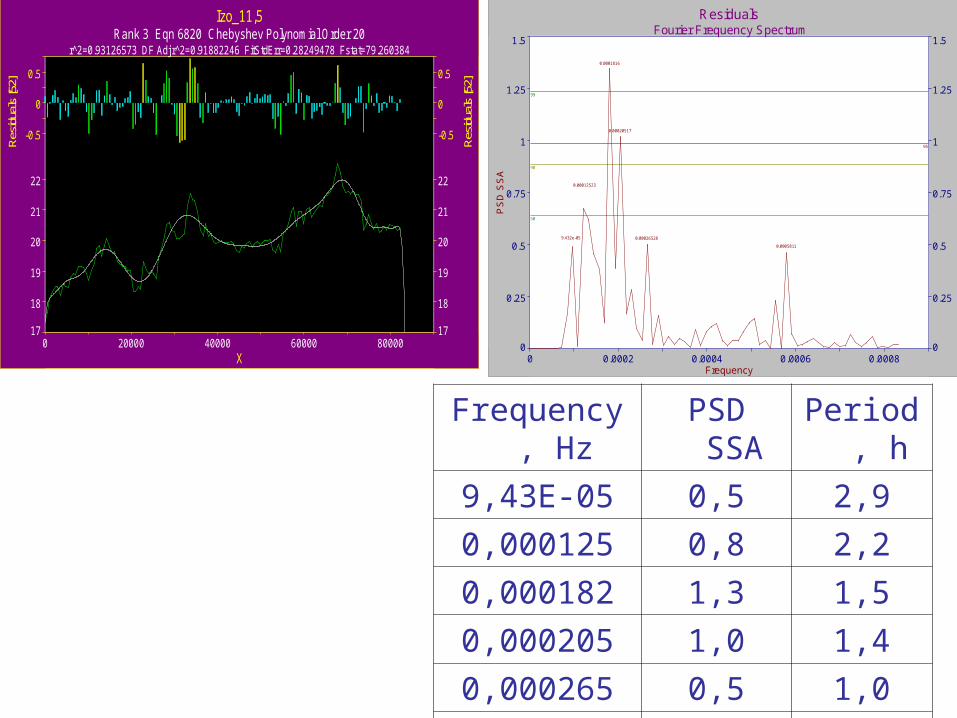
Izo_11,5Rank 3 Eqn 6820 Chebyshev Polynomial Order 20
r^2=0.93126573 DF Adj r^2=0.91882246 FitStdErr=0.28249478 Fstat=79.260384
0 20000 40000 60000 80000X
17
18
19
20
21
22
17
18
19
20
21
22
-0.5
0
0.5
Res
idua
ls [5
2]
-0.5
0
0.5
Res
idua
ls [5
2]Residuals
Fourier Frequency Spectrum
50
90
95
99
9.432e-05
0.00012523
0.0001816
0.00020517
0.00026528
0.0005811
0 0.0002 0.0004 0.0006 0.0008Frequency
0
0.25
0.5
0.75
1
1.25
1.5
PS
D S
SA
0
0.25
0.5
0.75
1
1.25
1.5
Frequency, Hz PSD SSA Period, h
9,43E-05 0,5 2,9
0,000125 0,8 2,2
0,000182 1,3 1,5
0,000205 1,0 1,4
0,000265 0,5 1,0
0,000581 0,5 0,5

0
2
4
6
8
10
12
14
16
18
20
22
24
26
09
.07
.19
77
00
:00
10
.07
.19
77
00
:00
11
.07
.19
77
00
:00
12
.07
.19
77
00
:00
13
.07
.19
77
00
:00
14
.07
.19
77
00
:00
15
.07
.19
77
00
:00
16
.07
.19
77
00
:00
17
.07
.19
77
00
:00
18
.07
.19
77
00
:00
19
.07
.19
77
00
:00
20
.07
.19
77
00
:00
21
.07
.19
77
00
:00
22
.07
.19
77
00
:00
23
.07
.19
77
00
:00
24
.07
.19
77
00
:00
25
.07
.19
77
00
:00
26
.07
.19
77
00
:00
27
.07
.19
77
00
:00
28
.07
.19
77
00
:00
29
.07
.19
77
00
:00
30
.07
.19
77
00
:00
Dep
th, m
18,5
19,0
19,5
20,0
20,5
21,0
21,5
22,0
20
.07
.19
77
00
:00
20
.07
.19
77
06
:00
20
.07
.19
77
12
:00
20
.07
.19
77
18
:00
21
.07
.19
77
00
:00
21
.07
.19
77
06
:00
Dep
th, m

Izo_11,5Detrend Data
0 20000 40000 60000 80000 1e+05Time index
18.5
19
19.5
20
20.5
21
21.5
22
18.5
19
19.5
20
20.5
21
21.5
22
Izo_11,5Fourier Frequency Spectrum
50
90
95
99
99.9
2.1633e-05
6.2746e-05
9.2459e-05
0.00014277
0 0.0002 0.0004 0.0006 0.0008Frequency
0
0.5
1
1.5
2
2.5
3
3.5
4
4.5
5
PS
D S
SA
0
0.5
1
1.5
2
2.5
3
3.5
4
4.5
5
Frequency, Hz
PSD SSA
Period, h
2,16E-05 4,7 12,8
6,27E-05 2,0 4,4
9,25E-05 0,5 3,0
0,000143 1,1 1,9

Izo_11,5Rank 3 Eqn 6820 Chebyshev Polynomial Order 20
r^2=0.87470349 DF Adj r^2=0.85604231 FitStdErr=0.21409614 Fstat=49.565585
0 20000 40000 60000 80000 1e+05X
18.5
19
19.5
20
20.5
21
21.5
18.5
19
19.5
20
20.5
21
21.5
-0.5
0
0.5
Res
idua
ls [5
3]
-0.5
0
0.5
Res
idua
ls [5
3]Residuals
Fourier Frequency Spectrum with tapering window
50
90
95
99
99.9
8.875e-05
0.00014256
0.00019435
0.000243 0.00034703
0 0.0002 0.0004 0.0006 0.0008Frequency
0
0.25
0.5
0.75
1
1.25
1.5
PS
D S
SA
0
0.25
0.5
0.75
1
1.25
1.5
PS
D S
SA
Frequency, Hz PSD SSA Period, h
8,88E-05 0,2 3,1
0,000143 1,3 1,9
0,000194 0,3 1,4
0,000243 0,2 1,1
0,000347 0,3 0,8

August-September 1987: Development of water temperature in Lizhemskaya Guba, Bol’shoe Onego Bay, Lake Onega
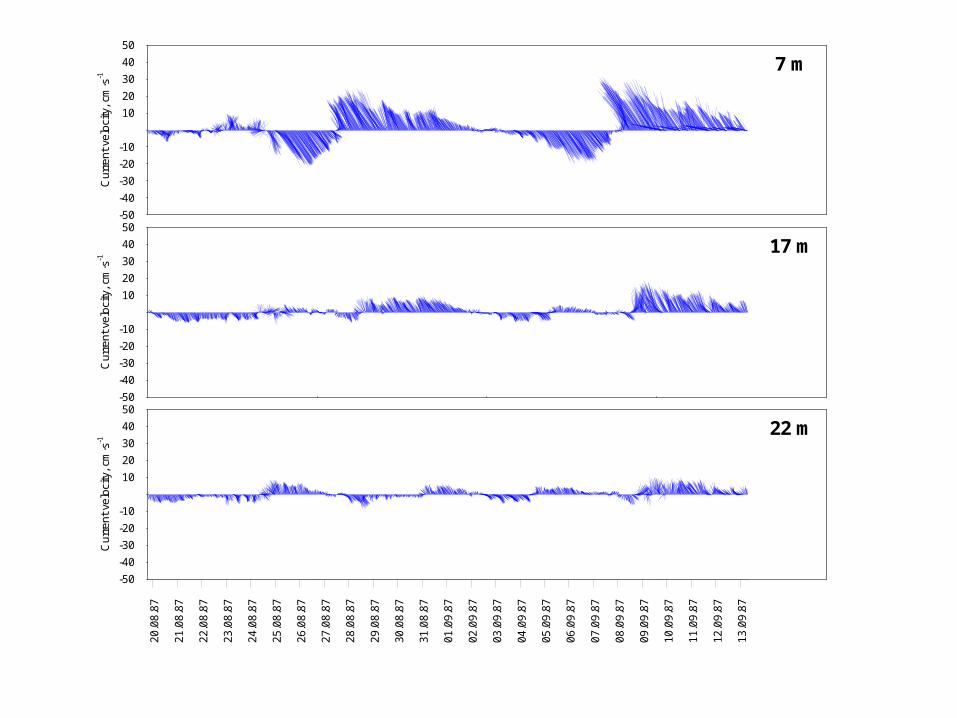
7 m
Cur
rent
vel
ocity
, cm
·s-1
-500
-400
-300
-200
-100
0
100
200
300
400
500
17 m
Cur
rent
vel
ocity
, cm
·s-1
-500
-400
-300
-200
-100
0
100
200
300
400
500
22 m
Cur
rent
vel
ocity
, cm
·s-1
-500
-400
-300
-200
-100
0
100
200
300
400
500
20.0
8.8
7
21.0
8.8
7
22.0
8.8
7
23.0
8.8
7
24.0
8.8
7
25.0
8.8
7
26.0
8.8
7
27.0
8.8
7
28.0
8.8
7
29.0
8.8
7
30.0
8.8
7
31.0
8.8
7
01.0
9.8
7
02.0
9.8
7
03.0
9.8
7
04.0
9.8
7
05.0
9.8
7
06.0
9.8
7
07.0
9.8
7
08.0
9.8
7
09.0
9.8
7
10.0
9.8
7
11.0
9.8
7
12.0
9.8
7
13.0
9.8
7

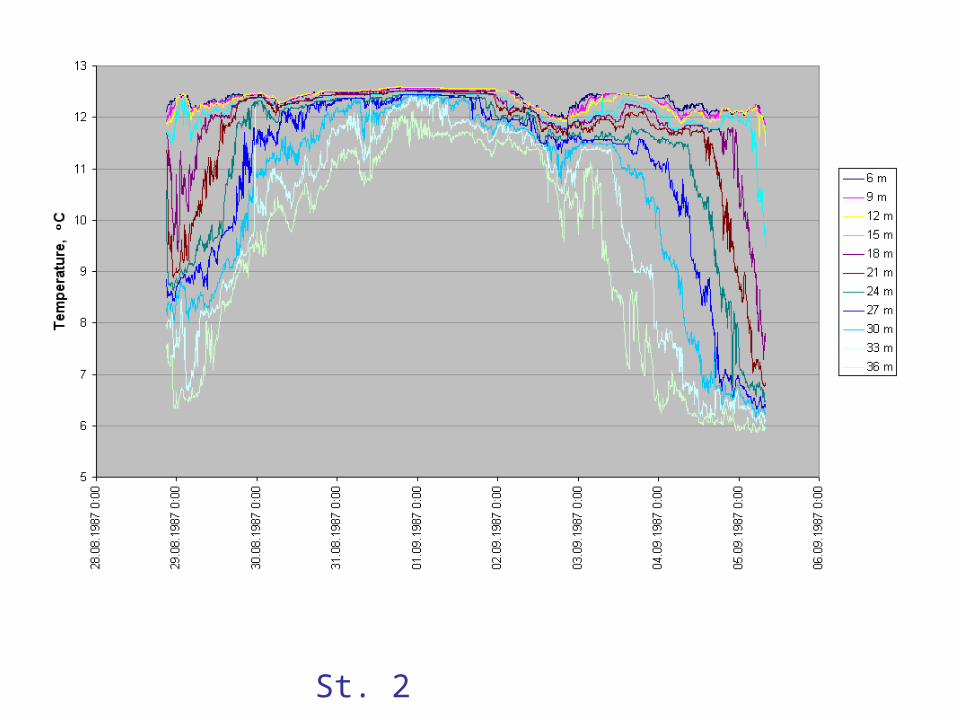
The water temperature development at Station 2, depth 58 m.
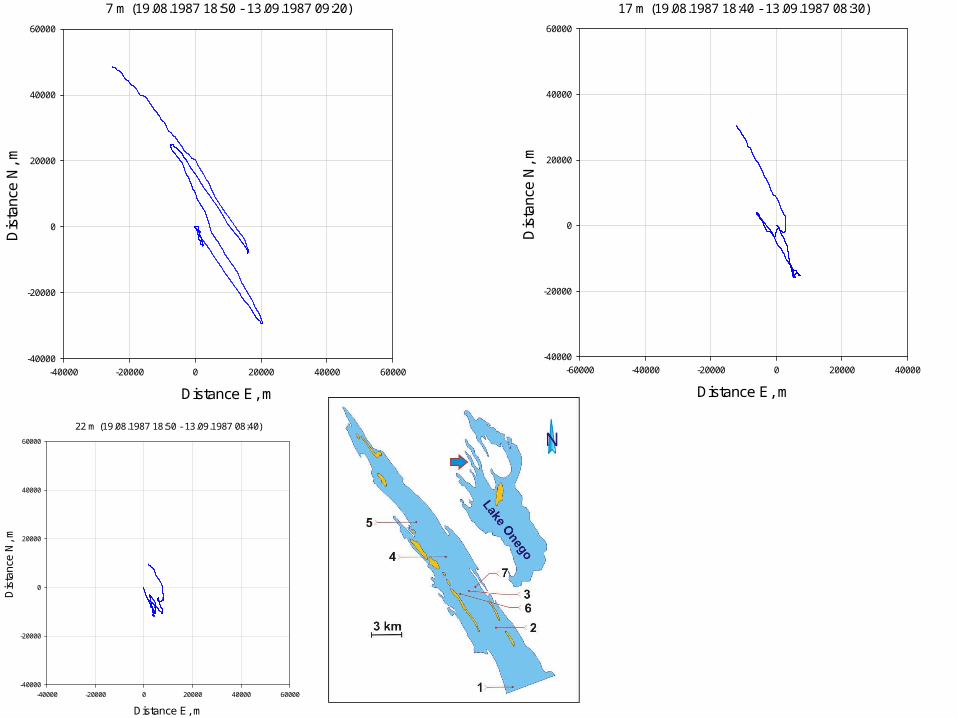
7 m (19.08.1987 18:50 - 13.09.1987 09:20)
Distance E, m
-40000 -20000 0 20000 40000 60000
Dis
tanc
e N
, m
-40000
-20000
0
20000
40000
60000
17 m (19.08.1987 18:40 - 13.09.1987 08:30)
Distance E, m
-60000 -40000 -20000 0 20000 40000
Dis
tanc
e N
, m
-40000
-20000
0
20000
40000
60000
22 m (19.08.1987 18:50 - 13.09.1987 08:40)
Distance E, m
-40000 -20000 0 20000 40000 60000
Dis
tanc
e N
, m
-40000
-20000
0
20000
40000
60000

St. 1
St. 2

28.0
8.87
29.0
8.87
30.0
8.87
31.0
8.87
01.0
9.87
02.0
9.87
03.0
9.87
04.0
9.87
05.0
9.87
06.0
9.87
Dep
th, m
0
5
10
15
20
25
30
35
40
station 1 station 2
Depth of 11.85°C location at stations 1 and 2.
st1_11,85Rank 3 Eqn 6820 Chebyshev Polynomial Order 20
r^2=0.98069403 DF Adj r^2=0.98018148 FitStdErr=0.59347182 Fstat=2011.5791
0 50000 1e+05 1.5e+05 2e+05 2.5e+05X
5
10
15
20
5
10
15
20
-2
-1
0
1
2
Resid
uals
[128
]
-2
-1
0
1
2
Resid
uals
[128
]Residuals
Fourier Frequency Spectrum (Chebyshev data tapeirng window)
50
909599
99.9
3.3632e-05
9.4737e-05
0.00012424
0 0.0001 0.0002 0.0003 0.0004 0.0005Frequency
0
10
20
30
40
50
60
PS
D S
SA
0
10
20
30
40
50
60
PS
D S
SA
Frequency, Hz
PSD SSA
Period, h
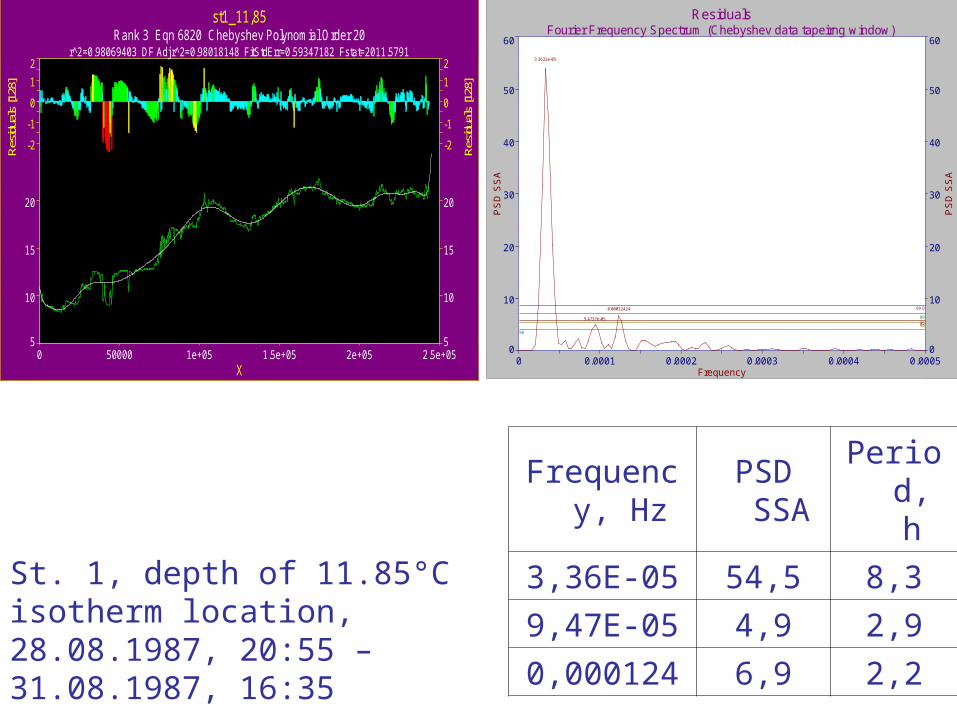
3,36E-05 54,5 8,3
9,47E-05 4,9 2,9
0,000124 6,9 2,2
St. 1, depth of 11.85°C isotherm location, 28.08.1987, 20:55 – 31.08.1987, 16:35

st2_11,85Rank 3 Eqn 6820 Chebyshev Polynomial Order 20
r^2=0.98922225 DF Adj r^2=0.98893612 FitStdErr=0.66393226 Fstat=3634.6379
0 50000 1e+05 1.5e+05 2e+05 2.5e+05X
10
15
20
25
30
35
10
15
20
25
30
35
-1.5
-0.5
0.5
1.5
2.5
Res
idua
ls [1
77]
-1.5
-0.5
0.5
1.5
2.5
Res
idua
ls [1
77]
ResidualsFourier Frequency Spectrum (Chebyshev data tapeirng window)
50
9095
99
99.9
3.8741e-05
6.4692e-05
9.1599e-05
0.00017587
0 0.0001 0.0002 0.0003 0.0004 0.0005Frequency
0
5
10
15
20
25
30
35
40
45
PS
D S
SA
0
5
10
15
20
25
30
35
40
45
PS
D S
SA
Frequency, Hz
PSD SSA
Period, h
3,87E-05 43,2 7,2
6,47E-05 13,9 4,3
9,16E-05 8,3 3,0
0,000176 3,2 1,6
St. 2, depth of 11.85°C isotherm location, 28.08.1987, 20:55 – 31.08.1987, 16:35

st1_11,85Rank 3 Eqn 6820 Chebyshev Polynomial Order 20
r^2=0.93803767 DF Adj r^2=0.93694146 FitStdErr=0.85027248 Fstat=899.247
0 1e+05 2e+05 3e+05 4e+05X
10
12.5
15
17.5
20
22.5
10
12.5
15
17.5
20
22.5
-2
0
2
Resid
uals
[142
]
-2
0
2
Resid
uals
[142
]Residuals
Fourier Frequency Spectrum (Chebyshev data tapeirng window)
50909599
99.9
2.146e-05
3.1365e-05
4.2728e-05
5.4242e-05
0 0.0001 0.0002 0.0003 0.0004 0.0005Frequency
0
25
50
75
100
125
150
PS
D S
SA
0
25
50
75
100
125
150
PS
D S
SA
Frequency, Hz
PSD SSA
Period, h
2,15E-05 130,5 12,9
3,14E-05 48,6 8,9
4,27E-05 74,8 6,5
5,42E-05 18,3 5,1
0,000117 8,5 2,4
St. 1, depth of 11.85°C isotherm location, 01.09.1987, 3:25 – 05.09.1987, 8:05

11,85 gradRank 3 Eqn 6820 Chebyshev Polynomial Order 20
r^2=0.97142287 DF Adj r^2=0.9709173 FitStdErr=1.2092816 Fstat=2019.1855
0 1e+05 2e+05 3e+05 4e+05X
5
10
15
20
25
30
35
5
10
15
20
25
30
35
-2
0
2
4
Res
idua
ls [1
04]
-2
0
2
4
Res
idua
ls [1
04]
ResidialFourier Frequency Spectrum (Chebyshev data tapering window)
50
9095
99
99.9
3.3295e-05
3.9081e-05
4.9086e-05
7.9725e-05
0 0.0001 0.0002 0.0003 0.0004 0.0005Frequency
0
50
100
150
200
250
PS
D S
SA
0
50
100
150
200
250
PS
D S
SA
Frequency, Hz
PSD SSA
Period, h
3,34E-05 240,7 8,3
4,92E-05 57,5 5,6
7,95E-05 16,1 3,5
0,000181 10,2 1,5
St. 2, depth of 11.85°C isotherm location, 01.09.1987, 3:25 – 05.09.1987, 8:05
29/08/1987 08:00
Temperature, 0C
5 6 7 8 9 10 11 12 13 14
Dep
th, m
0
5
10
15
20
25
30
35
4029/08/1987 09:00
Temperature, 0C
5 6 7 8 9 10 11 12 13 14
Dep
th, m
0
5
10
15
20
25
30
35
40
29/08/1987 10:00
Temperature, 0C
5 6 7 8 9 10 11 12 13 14
Dep
th, m
0
5
10
15
20
25
30
35
4029/08/1987 11:00
Temperature, 0C
5 6 7 8 9 10 11 12 13 14
Dep
th, m
0
5
10
15
20
25
30
35
40
29/08/1987 12:00
Temperature, 0C
5 6 7 8 9 10 11 12 13 14
Dep
th, m
0
5
10
15
20
25
30
35
4029/08/1987 13:00
Temperature, 0C
5 6 7 8 9 10 11 12 13 14
Dep
th, m
0
5
10
15
20
25
30
35
40
29/08/1987 14:00
Temperature, 0C
5 6 7 8 9 10 11 12 13 14
Dep
th, m
0
5
10
15
20
25
30
35
4029/08/1987 15:00
Temperature, 0C
5 6 7 8 9 10 11 12 13 14
Dep
th, m
0
5
10
15
20
25
30
35
40
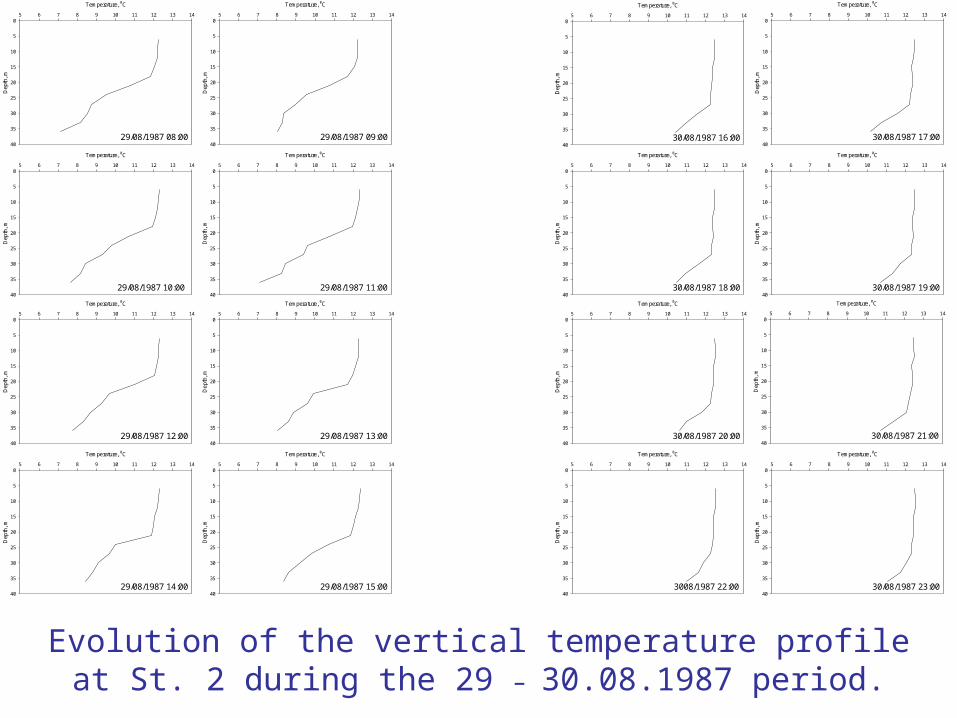
Evolution of the vertical temperature profile at St. 2 during the 29 –
30.08.1987 period.
30/08/1987 16:00
Temperature, 0C
5 6 7 8 9 10 11 12 13 14
Dep
th, m
0
5
10
15
20
25
30
35
4030/08/1987 17:00
Temperature, 0C
5 6 7 8 9 10 11 12 13 14
Dep
th, m
0
5
10
15
20
25
30
35
40
30/08/1987 18:00
Temperature, 0C
5 6 7 8 9 10 11 12 13 14
Dep
th, m
0
5
10
15
20
25
30
35
4030/08/1987 19:00
Temperature, 0C
5 6 7 8 9 10 11 12 13 14
Dep
th, m
0
5
10
15
20
25
30
35
40
30/08/1987 20:00
Temperature, 0C
5 6 7 8 9 10 11 12 13 14
Dep
th, m
0
5
10
15
20
25
30
35
40
3008/1987 22:00
Temperature, 0C
5 6 7 8 9 10 11 12 13 14
Dep
th, m
0
5
10
15
20
25
30
35
4030/08/1987 23:00
Temperature, 0C
5 6 7 8 9 10 11 12 13 14
Dep
th, m
0
5
10
15
20
25
30
35
40
30/08/1987 21:00
Temperature, 0C
5 6 7 8 9 10 11 12 13 14
Dep
th, m
0
5
10
15
20
25
30
35
40

01/09/1987 00:00
Temperature, 0C
5 6 7 8 9 10 11 12 13 14
Dep
th, m
0
5
10
15
20
25
30
35
4001/09/1987 01:00
Temperature, 0C
5 6 7 8 9 10 11 12 13 14
Dep
th, m
0
5
10
15
20
25
30
35
40
01/09/1987 02:00
Temperature, 0C
5 6 7 8 9 10 11 12 13 14
Dep
th, m
0
5
10
15
20
25
30
35
4001/09/1987 03:00
Temperature, 0C
5 6 7 8 9 10 11 12 13 14
Dep
th, m
0
5
10
15
20
25
30
35
40
01/09/1987 04:00
Temperature, 0C
5 6 7 8 9 10 11 12 13 14
Dep
th, m
0
5
10
15
20
25
30
35
4001/09/1987 05:00
Temperature, 0C
5 6 7 8 9 10 11 12 13 14
Dep
th, m
0
5
10
15
20
25
30
35
40
01/09/1987 06:00
Temperature, 0C
5 6 7 8 9 10 11 12 13 14
Dep
th, m
0
5
10
15
20
25
30
35
4001/09/1987 07:00
Temperature, 0C
5 6 7 8 9 10 11 12 13 14
Dep
th, m
0
5
10
15
20
25
30
35
40
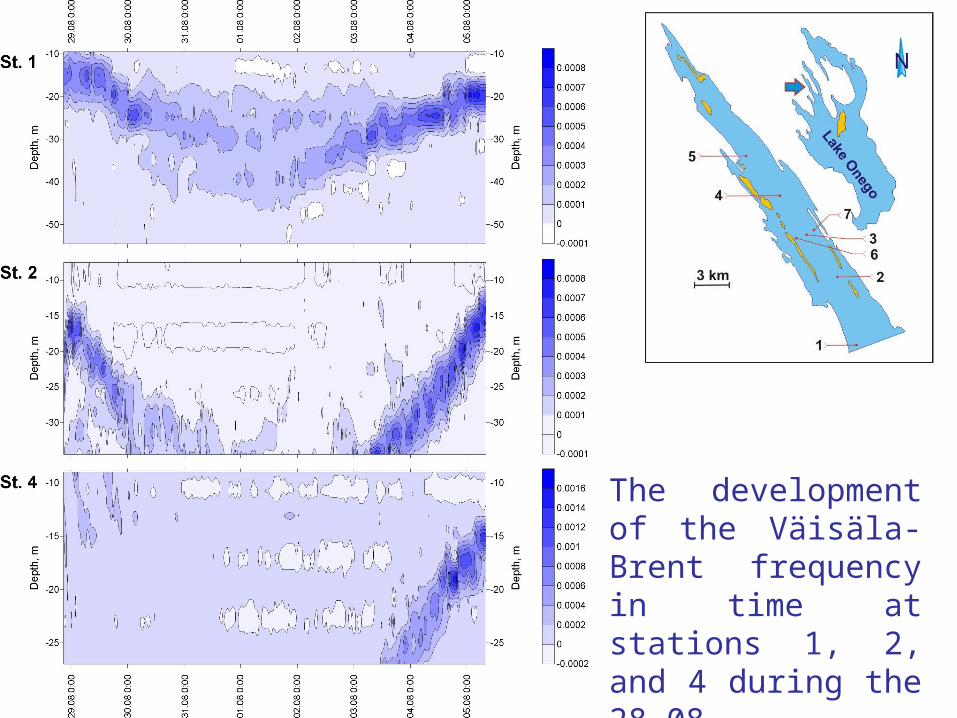
The development of the Väisäla-Brent frequency in time at stations 1, 2, and 4 during the 28.08 – 05.09.1987 period.
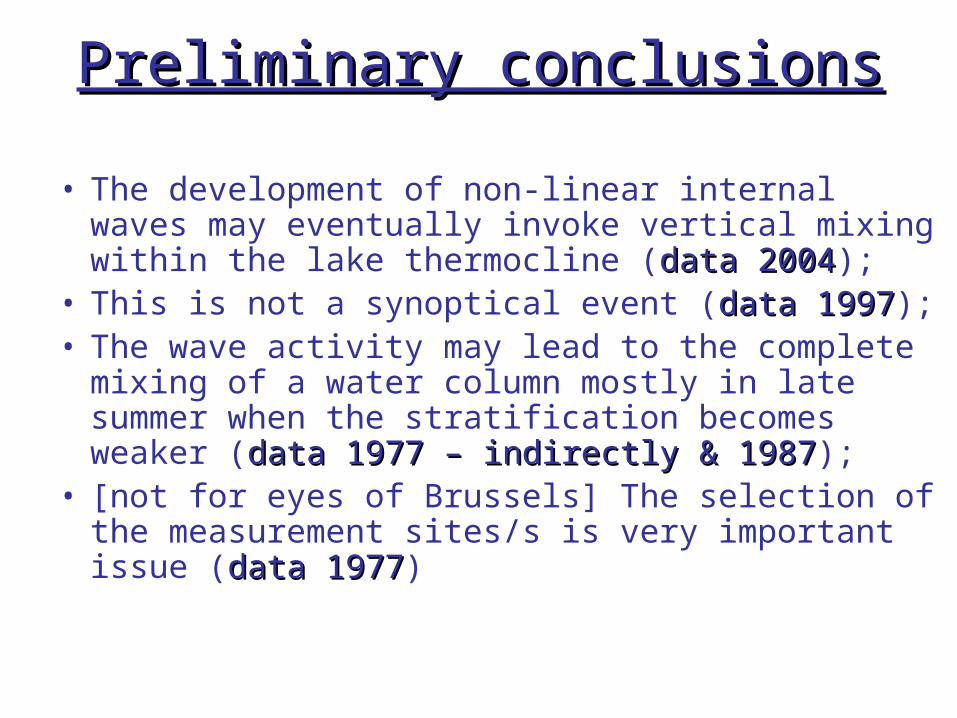
Preliminary conclusionsPreliminary conclusions
• The development of non-linear internal waves may eventually invoke vertical mixing within the lake thermocline (data 2004data 2004);
• This is not a synoptical event (data 1997data 1997);• The wave activity may lead to the complete mixing of a
water column mostly in late summer when the stratification becomes weaker (data 1977 – indirectly & data 1977 – indirectly & 19871987);
• [not for eyes of Brussels] The selection of the measurement sites/s is very important issue (data 1977data 1977)

Thanks for your attention!