Embed Size (px)
Citation preview

American Institute of Aeronautics and Astronautics
1
STRUCTURAL ANALYSIS OF AN INFLATION-DEPLOYED SOLAR SAIL WITH EXPERIMENTAL
VALIDATION
David W. Sleight* NASA Langley Research Center, Hampton, VA 23681
Yuki Michii†, David Lichodziejewski†, and Billy Derbès† L’Garde, Inc., Tustin, CA 92780
Troy O. Mann‡ Swales Aerospace, Hampton, VA 23681
Under the direction of the NASA In-Space Propulsion Technology Office, the team of L’Garde, NASA Jet Propulsion Laboratory, Ball Aerospace, and NASA Langley Research Center has been developing a scalable solar sail configuration to address NASA’s future space propulsion needs. Prior to a flight experiment of a full-scale solar sail, a comprehensive phased test plan is currently being implemented to advance the technology readiness level of the solar sail design. These tests consist of solar sail component, subsystem, and sub-scale system ground tests that simulate the vacuum and thermal conditions of the space environment. Recently, two solar sail test articles, a 7.4-m beam assembly subsystem test article and a 10-m four-quadrant solar sail system test article, were tested in vacuum conditions with a gravity-offload system to mitigate the effects of gravity. This paper presents the structural analyses simulating the ground tests and the correlation of the analyses with the test results. For programmatic risk reduction, a two-prong analysis approach was undertaken in which two separate teams independently developed computational models of the solar sail test articles using the finite element analysis software packages: NEiNastran and ABAQUS. This paper compares the pre-test and post-test analysis predictions from both software packages with the test data including load-deflection curves from static load tests, and vibration frequencies and mode shapes from structural dynamics tests. The analysis predictions were in reasonable agreement with the test data. Factors that precluded better correlation of the analyses and the tests were uncertainties in the material properties, test conditions, and modeling assumptions used in the analyses.
I. Introduction Solar sails are examples of ultra-low mass and deployable space structures called gossamer structures. Solar sails
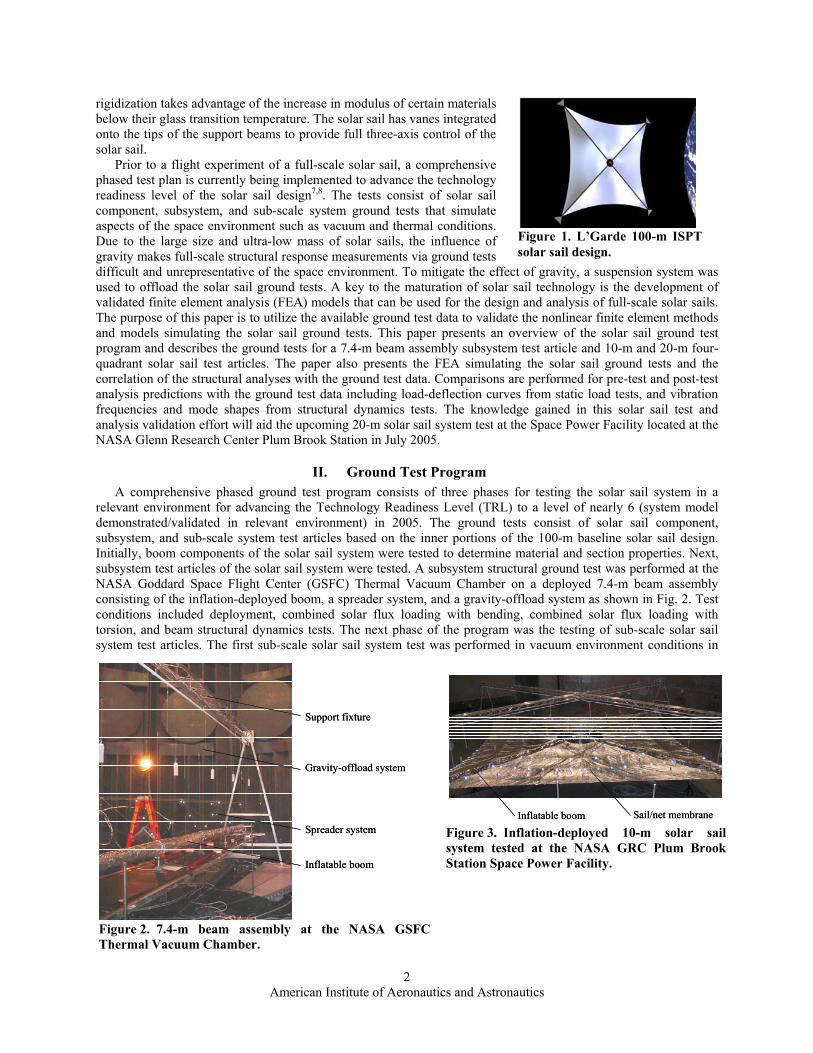
have been proposed for a variety of future space exploration missions because they are a cost effective source of propellantless propulsion. Solar sails span very large areas to capture and reflect photons from the Sun and are propelled through space by the transfer of momentum from the photons to the solar sail1,2,3,4. Recent advances in gossamer structures will enable a host of useful space exploration missions utilizing solar sail propulsion. Under the direction of the NASA In-Space Propulsion Technology (ISPT) Office, the team of L’Garde, NASA Jet Propulsion Laboratory (JPL), Ball Aerospace, and NASA Langley Research Center (LaRC) has been developing a scalable solar sail configuration to address NASA’s future space propulsion needs. The 100-m baseline solar sail concept shown in Fig. 1 was optimized around the one astronomical unit (AU) Geostorm mission5,6; and features a sail net/membrane with a striped sail suspension architecture with inflation-deployed beams consisting of inflatable sub-Tg (glass transition temperature) rigidizable semi-monocoque booms and a spreader system7,8. Sub-Tg or cold * Aerospace Engineers, Computational Structures and Methods Branch/Research & Technology Directorate, MS 155, AIAA Members. † Aerospace Engineers, Engineer/Manager/Engineer, AIAA Members. ‡ Aerospace Engineers, Structural Dynamics Branch/Research & Technology Directorate, MS 230, AIAA Members.
American Institute of Aeronautics and Astronautics
2
Figure 1. L’Garde 100-m ISPT solar sail design.
rigidization takes advantage of the increase in modulus of certain materials below their glass transition temperature. The solar sail has vanes integrated onto the tips of the support beams to provide full three-axis control of the solar sail.
Prior to a flight experiment of a full-scale solar sail, a comprehensive phased test plan is currently being implemented to advance the technology readiness level of the solar sail design7,8. The tests consist of solar sail component, subsystem, and sub-scale system ground tests that simulate aspects of the space environment such as vacuum and thermal conditions. Due to the large size and ultra-low mass of solar sails, the influence of gravity makes full-scale structural response measurements via ground tests difficult and unrepresentative of the space environment. To mitigate the effect of gravity, a suspension system was used to offload the solar sail ground tests. A key to the maturation of solar sail technology is the development of validated finite element analysis (FEA) models that can be used for the design and analysis of full-scale solar sails. The purpose of this paper is to utilize the available ground test data to validate the nonlinear finite element methods and models simulating the solar sail ground tests. This paper presents an overview of the solar sail ground test program and describes the ground tests for a 7.4-m beam assembly subsystem test article and 10-m and 20-m four-quadrant solar sail test articles. The paper also presents the FEA simulating the solar sail ground tests and the correlation of the structural analyses with the ground test data. Comparisons are performed for pre-test and post-test analysis predictions with the ground test data including load-deflection curves from static load tests, and vibration frequencies and mode shapes from structural dynamics tests. The knowledge gained in this solar sail test and analysis validation effort will aid the upcoming 20-m solar sail system test at the Space Power Facility located at the NASA Glenn Research Center Plum Brook Station in July 2005.
II. Ground Test Program A comprehensive phased ground test program consists of three phases for testing the solar sail system in a
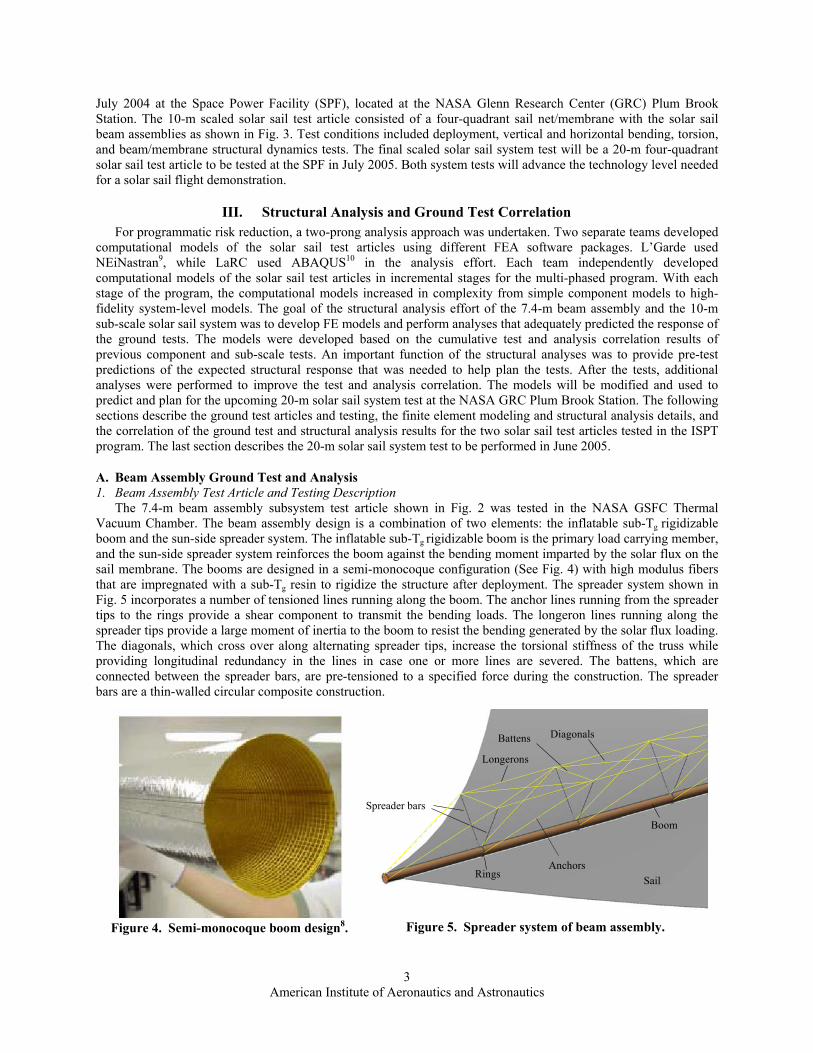
relevant environment for advancing the Technology Readiness Level (TRL) to a level of nearly 6 (system model demonstrated/validated in relevant environment) in 2005. The ground tests consist of solar sail component, subsystem, and sub-scale system test articles based on the inner portions of the 100-m baseline solar sail design. Initially, boom components of the solar sail system were tested to determine material and section properties. Next, subsystem test articles of the solar sail system were tested. A subsystem structural ground test was performed at the NASA Goddard Space Flight Center (GSFC) Thermal Vacuum Chamber on a deployed 7.4-m beam assembly consisting of the inflation-deployed boom, a spreader system, and a gravity-offload system as shown in Fig. 2. Test conditions included deployment, combined solar flux loading with bending, combined solar flux loading with torsion, and beam structural dynamics tests. The next phase of the program was the testing of sub-scale solar sail system test articles. The first sub-scale solar sail system test was performed in vacuum environment conditions in
Inflatable boom
Gravity-offload system
Spreader system
Support fixture
Inflatable boom
Gravity-offload system
Spreader system
Support fixture
Figure 2. 7.4-m beam assembly at the NASA GSFC Thermal Vacuum Chamber.
Sail/net membraneInflatable boom Sail/net membraneInflatable boom Figure 3. Inflation-deployed 10-m solar sail system tested at the NASA GRC Plum Brook Station Space Power Facility.
American Institute of Aeronautics and Astronautics
3
July 2004 at the Space Power Facility (SPF), located at the NASA Glenn Research Center (GRC) Plum Brook Station. The 10-m scaled solar sail test article consisted of a four-quadrant sail net/membrane with the solar sail beam assemblies as shown in Fig. 3. Test conditions included deployment, vertical and horizontal bending, torsion, and beam/membrane structural dynamics tests. The final scaled solar sail system test will be a 20-m four-quadrant solar sail test article to be tested at the SPF in July 2005. Both system tests will advance the technology level needed for a solar sail flight demonstration.
III. Structural Analysis and Ground Test Correlation For programmatic risk reduction, a two-prong analysis approach was undertaken. Two separate teams developed
computational models of the solar sail test articles using different FEA software packages. L’Garde used NEiNastran9, while LaRC used ABAQUS10 in the analysis effort. Each team independently developed computational models of the solar sail test articles in incremental stages for the multi-phased program. With each stage of the program, the computational models increased in complexity from simple component models to high-fidelity system-level models. The goal of the structural analysis effort of the 7.4-m beam assembly and the 10-m sub-scale solar sail system was to develop FE models and perform analyses that adequately predicted the response of the ground tests. The models were developed based on the cumulative test and analysis correlation results of previous component and sub-scale tests. An important function of the structural analyses was to provide pre-test predictions of the expected structural response that was needed to help plan the tests. After the tests, additional analyses were performed to improve the test and analysis correlation. The models will be modified and used to predict and plan for the upcoming 20-m solar sail system test at the NASA GRC Plum Brook Station. The following sections describe the ground test articles and testing, the finite element modeling and structural analysis details, and the correlation of the ground test and structural analysis results for the two solar sail test articles tested in the ISPT program. The last section describes the 20-m solar sail system test to be performed in June 2005.
A. Beam Assembly Ground Test and Analysis 1. Beam Assembly Test Article and Testing Description
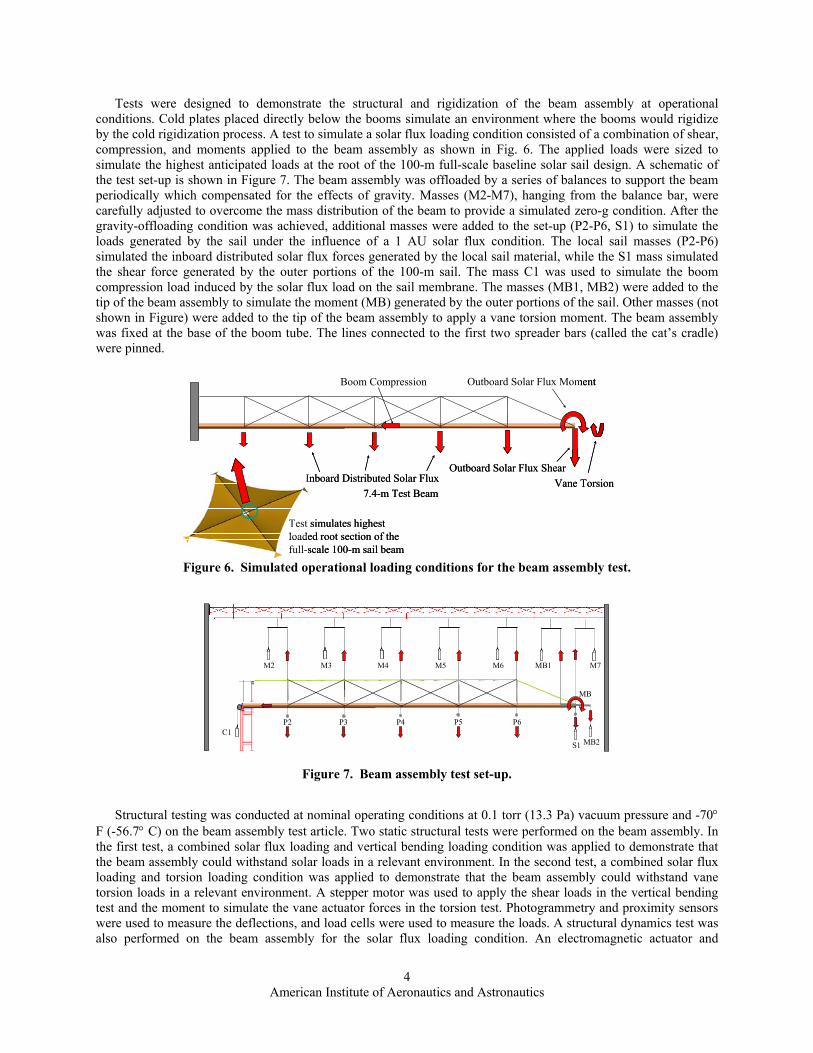
The 7.4-m beam assembly subsystem test article shown in Fig. 2 was tested in the NASA GSFC Thermal Vacuum Chamber. The beam assembly design is a combination of two elements: the inflatable sub-Tg rigidizable boom and the sun-side spreader system. The inflatable sub-Tg rigidizable boom is the primary load carrying member, and the sun-side spreader system reinforces the boom against the bending moment imparted by the solar flux on the sail membrane. The booms are designed in a semi-monocoque configuration (See Fig. 4) with high modulus fibers that are impregnated with a sub-Tg resin to rigidize the structure after deployment. The spreader system shown in Fig. 5 incorporates a number of tensioned lines running along the boom. The anchor lines running from the spreader tips to the rings provide a shear component to transmit the bending loads. The longeron lines running along the spreader tips provide a large moment of inertia to the boom to resist the bending generated by the solar flux loading. The diagonals, which cross over along alternating spreader tips, increase the torsional stiffness of the truss while providing longitudinal redundancy in the lines in case one or more lines are severed. The battens, which are connected between the spreader bars, are pre-tensioned to a specified force during the construction. The spreader bars are a thin-walled circular composite construction.
Longerons
Diagonals Battens
Boom
Rings
Spreader bars
SailAnchors
Longerons
Diagonals Battens
Boom
Rings
Spreader bars
SailAnchors
Figure 5. Spreader system of beam assembly.
Figure 4. Semi-monocoque boom design8.
American Institute of Aeronautics and Astronautics
4
Tests were designed to demonstrate the structural and rigidization of the beam assembly at operational conditions. Cold plates placed directly below the booms simulate an environment where the booms would rigidize by the cold rigidization process. A test to simulate a solar flux loading condition consisted of a combination of shear, compression, and moments applied to the beam assembly as shown in Fig. 6. The applied loads were sized to simulate the highest anticipated loads at the root of the 100-m full-scale baseline solar sail design. A schematic of the test set-up is shown in Figure 7. The beam assembly was offloaded by a series of balances to support the beam periodically which compensated for the effects of gravity. Masses (M2-M7), hanging from the balance bar, were carefully adjusted to overcome the mass distribution of the beam to provide a simulated zero-g condition. After the gravity-offloading condition was achieved, additional masses were added to the set-up (P2-P6, S1) to simulate the loads generated by the sail under the influence of a 1 AU solar flux condition. The local sail masses (P2-P6) simulated the inboard distributed solar flux forces generated by the local sail material, while the S1 mass simulated the shear force generated by the outer portions of the 100-m sail. The mass C1 was used to simulate the boom compression load induced by the solar flux load on the sail membrane. The masses (MB1, MB2) were added to the tip of the beam assembly to simulate the moment (MB) generated by the outer portions of the sail. Other masses (not shown in Figure) were added to the tip of the beam assembly to apply a vane torsion moment. The beam assembly was fixed at the base of the boom tube. The lines connected to the first two spreader bars (called the cat’s cradle) were pinned.
Structural testing was conducted at nominal operating conditions at 0.1 torr (13.3 Pa) vacuum pressure and -70°
F (-56.7° C) on the beam assembly test article. Two static structural tests were performed on the beam assembly. In the first test, a combined solar flux loading and vertical bending loading condition was applied to demonstrate that the beam assembly could withstand solar loads in a relevant environment. In the second test, a combined solar flux loading and torsion loading condition was applied to demonstrate that the beam assembly could withstand vane torsion loads in a relevant environment. A stepper motor was used to apply the shear loads in the vertical bending test and the moment to simulate the vane actuator forces in the torsion test. Photogrammetry and proximity sensors were used to measure the deflections, and load cells were used to measure the loads. A structural dynamics test was also performed on the beam assembly for the solar flux loading condition. An electromagnetic actuator and
Inboard Distributed Solar Flux
Boom Compression Outboard Solar Flux Moment
Outboard Solar Flux ShearVane Torsion
7.4-m Test Beam
Test simulates highest loaded root section of the full-scale 100-m sail beam
Inboard Distributed Solar Flux
Boom Compression Outboard Solar Flux Moment
Outboard Solar Flux ShearVane Torsion
7.4-m Test Beam
Test simulates highest loaded root section of the full-scale 100-m sail beam
Figure 6. Simulated operational loading conditions for the beam assembly test.
MB2S1C1
P2 P3 P4 P5 P6
MB
M2 M3 M4 M5 M6 MB1 M7
MB2S1C1
P2 P3 P4 P5 P6
MB
M2 M3 M4 M5 M6 MB1 M7
Figure 7. Beam assembly test set-up.
American Institute of Aeronautics and Astronautics
5
controller excited the modes of the beam assembly. An accelerometer was mounted to the beam assembly to measure the vibration frequencies. Unfortunately, data were not collected due to equipment failure during testing. Video data were used to alternatively determine the frequencies. The test and analysis results are presented in the following section.
2. Beam Assembly Modeling and Test/Analysis Correlation
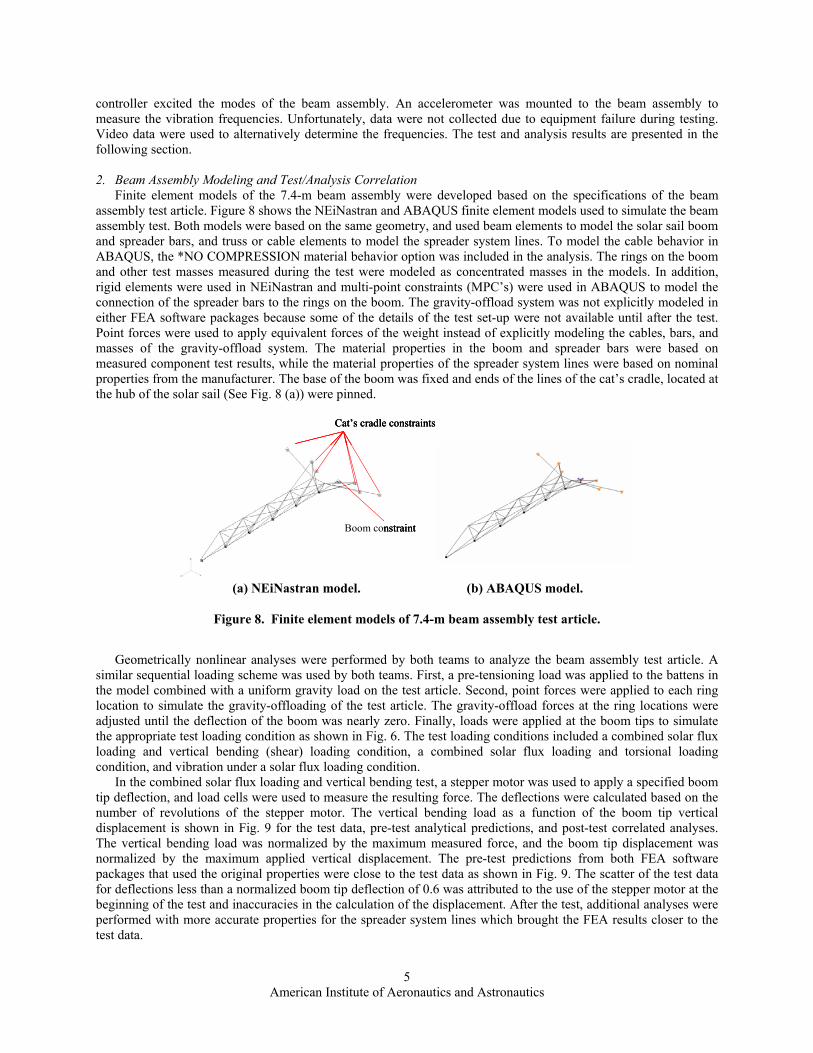
Finite element models of the 7.4-m beam assembly were developed based on the specifications of the beam assembly test article. Figure 8 shows the NEiNastran and ABAQUS finite element models used to simulate the beam assembly test. Both models were based on the same geometry, and used beam elements to model the solar sail boom and spreader bars, and truss or cable elements to model the spreader system lines. To model the cable behavior in ABAQUS, the *NO COMPRESSION material behavior option was included in the analysis. The rings on the boom and other test masses measured during the test were modeled as concentrated masses in the models. In addition, rigid elements were used in NEiNastran and multi-point constraints (MPC’s) were used in ABAQUS to model the connection of the spreader bars to the rings on the boom. The gravity-offload system was not explicitly modeled in either FEA software packages because some of the details of the test set-up were not available until after the test. Point forces were used to apply equivalent forces of the weight instead of explicitly modeling the cables, bars, and masses of the gravity-offload system. The material properties in the boom and spreader bars were based on measured component test results, while the material properties of the spreader system lines were based on nominal properties from the manufacturer. The base of the boom was fixed and ends of the lines of the cat’s cradle, located at the hub of the solar sail (See Fig. 8 (a)) were pinned.
Geometrically nonlinear analyses were performed by both teams to analyze the beam assembly test article. A
similar sequential loading scheme was used by both teams. First, a pre-tensioning load was applied to the battens in the model combined with a uniform gravity load on the test article. Second, point forces were applied to each ring location to simulate the gravity-offloading of the test article. The gravity-offload forces at the ring locations were adjusted until the deflection of the boom was nearly zero. Finally, loads were applied at the boom tips to simulate the appropriate test loading condition as shown in Fig. 6. The test loading conditions included a combined solar flux loading and vertical bending (shear) loading condition, a combined solar flux loading and torsional loading condition, and vibration under a solar flux loading condition.
In the combined solar flux loading and vertical bending test, a stepper motor was used to apply a specified boom tip deflection, and load cells were used to measure the resulting force. The deflections were calculated based on the number of revolutions of the stepper motor. The vertical bending load as a function of the boom tip vertical displacement is shown in Fig. 9 for the test data, pre-test analytical predictions, and post-test correlated analyses. The vertical bending load was normalized by the maximum measured force, and the boom tip displacement was normalized by the maximum applied vertical displacement. The pre-test predictions from both FEA software packages that used the original properties were close to the test data as shown in Fig. 9. The scatter of the test data for deflections less than a normalized boom tip deflection of 0.6 was attributed to the use of the stepper motor at the beginning of the test and inaccuracies in the calculation of the displacement. After the test, additional analyses were performed with more accurate properties for the spreader system lines which brought the FEA results closer to the test data.
Cat’s cradle constraints
Boom constraint
Cat’s cradle constraints
Boom constraint
Cat’s cradle constraints
Boom constraint
(a) NEiNastran model. (b) ABAQUS model.
Figure 8. Finite element models of 7.4-m beam assembly test article.

American Institute of Aeronautics and Astronautics
6
In the combined solar flux loading and torsion test, the rotation of the boom tip from the test data was much greater than the FEA predictions. However, the boom tip test data included a small deflection in the vertical direction. This vertical deflection indicated that a combined vertical loading and torsional loading condition may have been applied in the test. A comparison of the test data and FEA predictions is not included in the paper. The test data for the torsion test is currently being investigated. Nevertheless, the results from both FEA software packages compared well to each other in pre-test and post-test analyses for the pure torsion loading condition.
A structural dynamics test was also performed on the beam assembly to determine the frequencies and mode
shapes for the lateral and vertical bending modes. The mode shapes predicted by both FEA software packages showed qualitative agreement with the lateral and vertical bending modes of the test based on observations of videos of the test. The lateral and vertical bending mode shapes predicted by the ABAQUS FEA are shown in Fig. 10. The mode shapes from the NEiNastran analysis were similar to the ABAQUS analysis results. A comparison of the frequencies for the test data and analyses are listed in Table 1. The frequencies were estimated using videos of the structural dynamics test because the accelerometer debonded from the beam assembly. This debonding was attributed to the low temperatures of the test. The frequency predictions for both FEA software packages compared well with each other, but both analyses over-predicted the test frequencies. Examination of the strain energies in the analyses indicated that the tensioned lines of the cat’s cradle region were the biggest contributor to the vibration modes. Conditions from the test set-up that were not explicitly modeled may have contributed to differences between the FEA predictions and the test results. For example, the amount of slackness or tension in the spreader system lines was unknown in the test, and was neglected in the models. Moreover, ignoring the gravity-offload system in the models also contributed to the discrepancies between the test and predicted frequencies. An analysis
0.0
0.2
0.4
0.6
0.8
1.0
0.0 0.2 0.4 0.6 0.8 1.0 1.2 1.4
Normalized boom tip vertical deflection
Nor
mal
ized
ben
ding
load
Test DataNEiNastran (Pre-Test)NEiNastran (Post-Test)ABAQUS (Pre-Test)ABAQUS (Post-Test)
Figure 9. Load vs. deflection curve for beam assembly vertical bending test.
Black: DeformedRed: UndeformedBlack: DeformedRed: Undeformed
(a) Mode 1: Lateral bending mode (b) Mode 2: Vertical bending mode
Figure 10. Mode shapes predicted by ABAQUS for beam assembly test article.

American Institute of Aeronautics and Astronautics
7
was later performed in ABAQUS with the gravity-offload system included in the model. The analysis predicted the same first frequency as the previous analysis; however, the second frequency decreased from 1.99 Hz to 1.42 Hz, which is in closer agreement with the test data.
B. Ten-Meter Four-Quadrant Solar Sail System Test and Analysis 1. Ten-Meter Solar Sail System Test Article and Testing Description
A 10-m four-quadrant solar sail system test article, fixed at the center for all translations (X, Y, Z) and rotations (Rx, Ry, Rz), was tested in two configurations in the SPF in vacuum conditions at the NASA Glenn Plum Brook Station in July 200411. The first test configuration, shown in Fig. 3, was a sail membrane configuration with four sail/net membrane quadrants attached to the rings on the booms. The sail membrane quadrants were fabricated from 2µ-thick metalized Mylar. A similar gravity-offloading scheme employed in the beam assembly subsystem test was used for the 10-m sail membrane assembly configuration. Cold plates beneath the booms were used to rigidize the booms. This configuration was used to measure the static sail membrane shape and vibration frequencies under a combined simulated solar flux loading and gravity loading condition as shown in Fig. 11. The simulated solar flux loading was applied to the tips of all four beams by adding masses to the gravity-offload system to apply solar flux forces denoted as F1 and F2 in Fig. 11. The static sail membrane shape was measured by photogrammetry. The targets used in the photogrammetry can be seen in Fig. 3 as the illuminated dots on the sail membrane. For the sail membrane structural dynamics test, the excitation was provided by two electromagnets placed at the beam tips, where one magnet excited the structure laterally, and the other one excited the structure vertically. The natural frequencies and mode shapes of the sail membrane were measured by laser vibrometry.
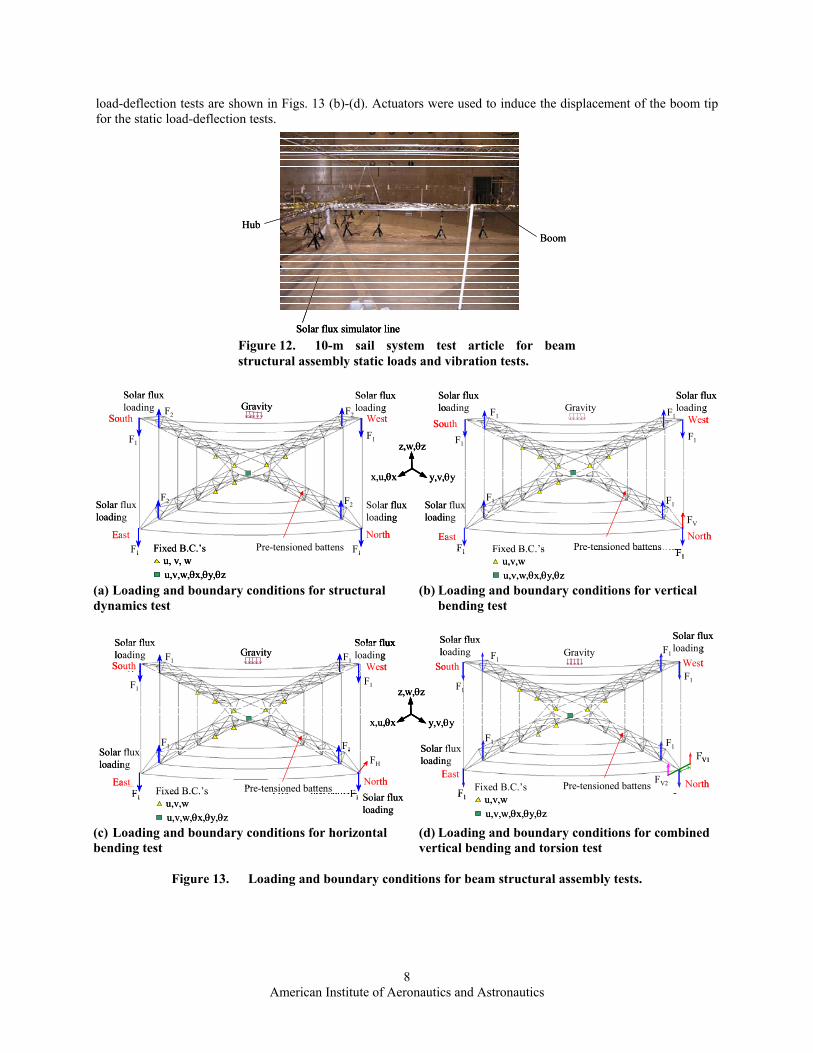
The second configuration tested in the SPF was the beam structural assembly with the sail membrane quadrants
replaced with lightweight strings located between the last four ring stations on the beam assemblies as shown in Fig. 12. The strings were chosen such that the weight of the strings in a 1-g gravity field would represent the solar pressure imparted on the sail during operation. The test article was also gravity-offloaded in this configuration. A structural dynamics test and three static load-deflection tests were performed in vacuum conditions. The structural dynamics test measured the natural frequencies and mode shapes about a solar flux and gravity loading condition with accelerometers placed along the length of the booms. The loading and boundary conditions for the structural dynamics test are given in Fig. 13 (a). Several of the ring locations on the booms were tied to the cold plates to introduce fixed boundary conditions at these locations as denoted by the triangles in the figure. As stated earlier, the center of the solar sail was fixed in all directions. The static load-deflection tests were performed on the North boom of the structure (see Fig. 11) in the SPF to measure the deflection of the boom in horizontal and vertical bending and torsion along with the solar flux and gravity loading condition. The loading and boundary conditions for the static
Gravity
Pre-tensioned battens
Solar fluxloading
F1
F2
F
F2
F2
F1
F
F2
Gravity
Pre-tensioned battens
Solar fluxloading
F1
F2
F2
F2
F2
NorthEast
South West
Solar fluxloading
Solar fluxloading
Solar fluxloading
F1
F1
F1
F1
Fixed B.C.’s
u,v,w,θx,θy,θz
z,w,θz
y,v,θyx,u,θx
Gravity
Pre-tensioned battens
Solar fluxloading
F1
F2
F
F2
F2
F1
F
F2
Gravity
Pre-tensioned battens
Solar fluxloading
F1
F2
F2
F2
F2
NorthEast
South West
Solar fluxloading
Solar fluxloading
Solar fluxloading
F1
F1
F1
F1
Fixed B.C.’s
u,v,w,θx,θy,θz
Gravity
Pre-tensioned battens
Solar fluxloading
F1
F2
F
F2
F2
F1
F
F2
Gravity
Pre-tensioned battens
Solar fluxloading
F1
F2
F2
F2
F2
NorthEast
South West
Solar fluxloading
Solar fluxloading
Solar fluxloading
F1
F1
F1
F1
Gravity
Pre-tensioned battens
Solar fluxloading
F1
F2
F
F2
F2
F1
F
F2
Gravity
Pre-tensioned battens
Solar fluxloading
F1
F2
F2
F2
F2
NorthEast
South West
Solar fluxloading
Solar fluxloading
Solar fluxloading
F1
F1
F1
F1
Fixed B.C.’s
u,v,w,θx,θy,θz
z,w,θz
y,v,θyx,u,θx
z,w,θz
y,v,θyx,u,θx
Figure 11. Loading condition for sail membrane configuration test.
Table 1. Comparison of test and FEA frequencies for beam assembly structural vibration test.
Mode Test Frequency (Hz)
NEiNastran Frequency (Hz)
ABAQUS Frequency (Hz)
1 0.60 0.86 (+43.3%) 0.92 (+53.3%) 2 0.80 1.79 (+123.8%) 1.99 (+146.8%)
American Institute of Aeronautics and Astronautics
8
Solar flux simulator line
BoomHub
Solar flux simulator lineSolar flux simulator line
BoomHub
Figure 12. 10-m sail system test article for beam structural assembly static loads and vibration tests.
load-deflection tests are shown in Figs. 13 (b)-(d). Actuators were used to induce the displacement of the boom tip for the static load-deflection tests.
FV
Gravity
Pre-tensioned battens
Solar fluxloading
F1
F1
F
F1
F1
F1
F
F1
N
S
E
W
FV
Gravity
Pre-tensioned battens
F1
F1
F1
F1
F1
F1
F1
F1
North
South
East
West
Solar fluxloading
Solar fluxloading
Fixed B.C.’su,v,wu,v,w,θx,θy,θz
Gravity
Pre-tensioned battens
Solar fluxloading
F1
F2
F
F2
F2
F1
F
F2
N
S
E
WGravityGravity
Pre-tensioned battens
Solar fluxloading
Solar fluxloading
F1
F2
F1
F2
F2
F1
F1
F2
North
South
East
West
Solar fluxloading
Solar fluxloading
Fixed B.C.’su, v, wu,v,w,θx,θy,θz
Solar fluxloading
z,w,θz
y,v,θyx,u,θx
FV
Gravity
Pre-tensioned battens
Solar fluxloading
F1
F1
F
F1
F1
F1
F
F1
N
S
E
W
FV
Gravity
Pre-tensioned battens
F1
F1
F1
F1
F1
F1
F1
F1
North
South
East
West
Solar fluxloading
Solar fluxloading
Fixed B.C.’su,v,wu,v,w,θx,θy,θz
GravityGravity
Pre-tensioned battens
Solar fluxloading
F1
F2
F
F2
F2
F1
F
F2
N
S
E
WGravityGravity
Pre-tensioned battens
Solar fluxloading
Solar fluxloading
F1
F2
F1
F2
F2
F1
F1
F2
North
South
East
West
Solar fluxloading
Solar fluxloading
Fixed B.C.’su, v, wu,v,w,θx,θy,θz
Fixed B.C.’su, v, wu,v,w,θx,θy,θz
Solar fluxloading
z,w,θz
y,v,θyx,u,θx
z,w,θz
y,v,θyx,u,θx
(a) Loading and boundary conditions for structural (b) Loading and boundary conditions for vertical dynamics test bending test
110
Gravity
Pre-tensioned battens
loading
F1
F1
F
F1
F1
F1
F1
N
S W
E
FFV
F
Gravity
F1
F1
F1
F1
F1
F1
North
South West
East
FV1
FV2
±
Gravity
Pre-tensioned battens
Solar fluxloading
Solar flux
F
F1
F
F1
F1
F1
F
F1
N
S
E
WGravityGravity
Pre-tensioned battens
Solar fluxloading
F1
F1
F1
F1
F1
F1
F1
F1
North
South
East
West
Solar fluxloading
Solar fluxloading FH
F1
Solar fluxloading
Solar fluxloading
Solar fluxloading
Pre-tensioned battensFixed B.C.’su,v,wu,v,w,θx,θy,θz
Fixed B.C.’su,v,wu,v,w,θx,θy,θz
Solar fluxloading
z,w,θz
y,v,θyx,u,θx
110
Gravity
Pre-tensioned battens
loading
F1
F1
F
F1
F1
F1
F1
N
S W
E
FFV
F
Gravity
F1
F1
F1
F1
F1
F1
North
South West
East
FV1
FV2
±
GravityGravity
Pre-tensioned battens
Solar fluxloading
Solar flux
F
F1
F
F1
F1
F1
F
F1
N
S
E
WGravityGravity
Pre-tensioned battens
Solar fluxloading
F1
F1
F1
F1
F1
F1
F1
F1
North
South
East
West
Solar fluxloading
Solar fluxloading FH
F1
Solar fluxloading
Solar fluxloading
Solar fluxloading
Pre-tensioned battensFixed B.C.’su,v,wu,v,w,θx,θy,θz
Fixed B.C.’su,v,wu,v,w,θx,θy,θz
Solar fluxloading
z,w,θz
y,v,θyx,u,θx
z,w,θz
y,v,θyx,u,θx
(c) Loading and boundary conditions for horizontal (d) Loading and boundary conditions for combined bending test vertical bending and torsion test
Figure 13. Loading and boundary conditions for beam structural assembly tests.
American Institute of Aeronautics and Astronautics
9
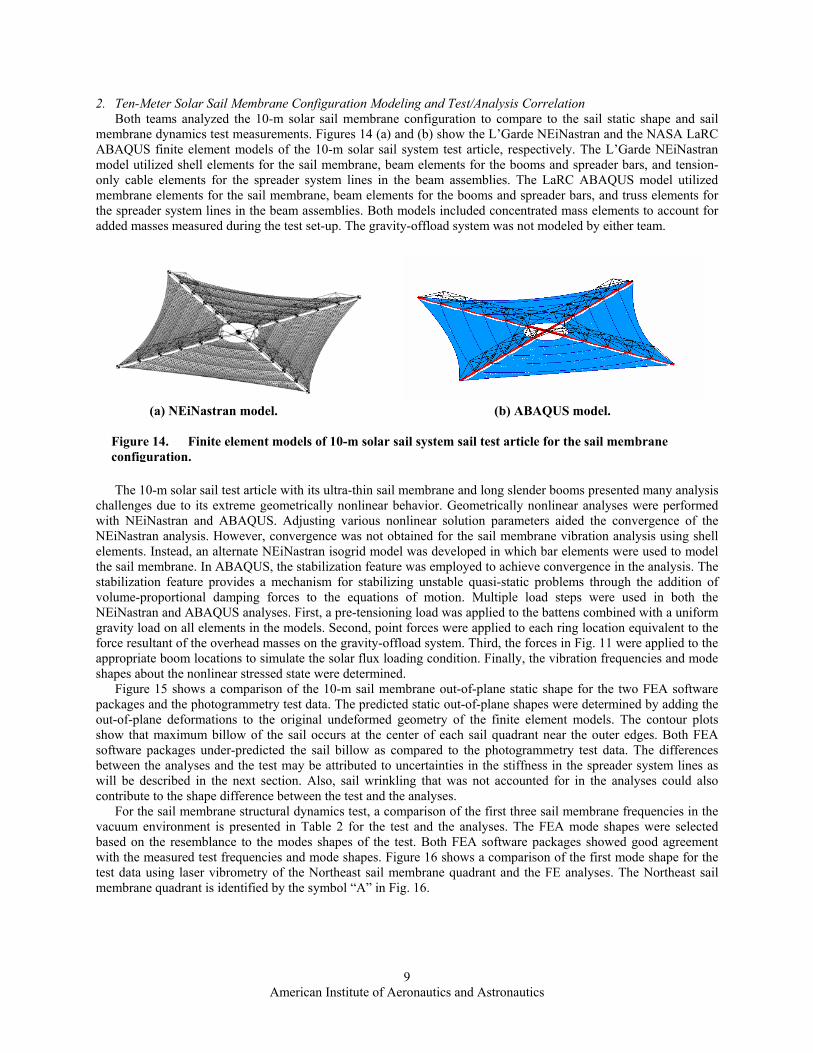
2. Ten-Meter Solar Sail Membrane Configuration Modeling and Test/Analysis Correlation Both teams analyzed the 10-m solar sail membrane configuration to compare to the sail static shape and sail
membrane dynamics test measurements. Figures 14 (a) and (b) show the L’Garde NEiNastran and the NASA LaRC ABAQUS finite element models of the 10-m solar sail system test article, respectively. The L’Garde NEiNastran model utilized shell elements for the sail membrane, beam elements for the booms and spreader bars, and tension-only cable elements for the spreader system lines in the beam assemblies. The LaRC ABAQUS model utilized membrane elements for the sail membrane, beam elements for the booms and spreader bars, and truss elements for the spreader system lines in the beam assemblies. Both models included concentrated mass elements to account for added masses measured during the test set-up. The gravity-offload system was not modeled by either team.
The 10-m solar sail test article with its ultra-thin sail membrane and long slender booms presented many analysis
challenges due to its extreme geometrically nonlinear behavior. Geometrically nonlinear analyses were performed with NEiNastran and ABAQUS. Adjusting various nonlinear solution parameters aided the convergence of the NEiNastran analysis. However, convergence was not obtained for the sail membrane vibration analysis using shell elements. Instead, an alternate NEiNastran isogrid model was developed in which bar elements were used to model the sail membrane. In ABAQUS, the stabilization feature was employed to achieve convergence in the analysis. The stabilization feature provides a mechanism for stabilizing unstable quasi-static problems through the addition of volume-proportional damping forces to the equations of motion. Multiple load steps were used in both the NEiNastran and ABAQUS analyses. First, a pre-tensioning load was applied to the battens combined with a uniform gravity load on all elements in the models. Second, point forces were applied to each ring location equivalent to the force resultant of the overhead masses on the gravity-offload system. Third, the forces in Fig. 11 were applied to the appropriate boom locations to simulate the solar flux loading condition. Finally, the vibration frequencies and mode shapes about the nonlinear stressed state were determined.
Figure 15 shows a comparison of the 10-m sail membrane out-of-plane static shape for the two FEA software packages and the photogrammetry test data. The predicted static out-of-plane shapes were determined by adding the out-of-plane deformations to the original undeformed geometry of the finite element models. The contour plots show that maximum billow of the sail occurs at the center of each sail quadrant near the outer edges. Both FEA software packages under-predicted the sail billow as compared to the photogrammetry test data. The differences between the analyses and the test may be attributed to uncertainties in the stiffness in the spreader system lines as will be described in the next section. Also, sail wrinkling that was not accounted for in the analyses could also contribute to the shape difference between the test and the analyses.
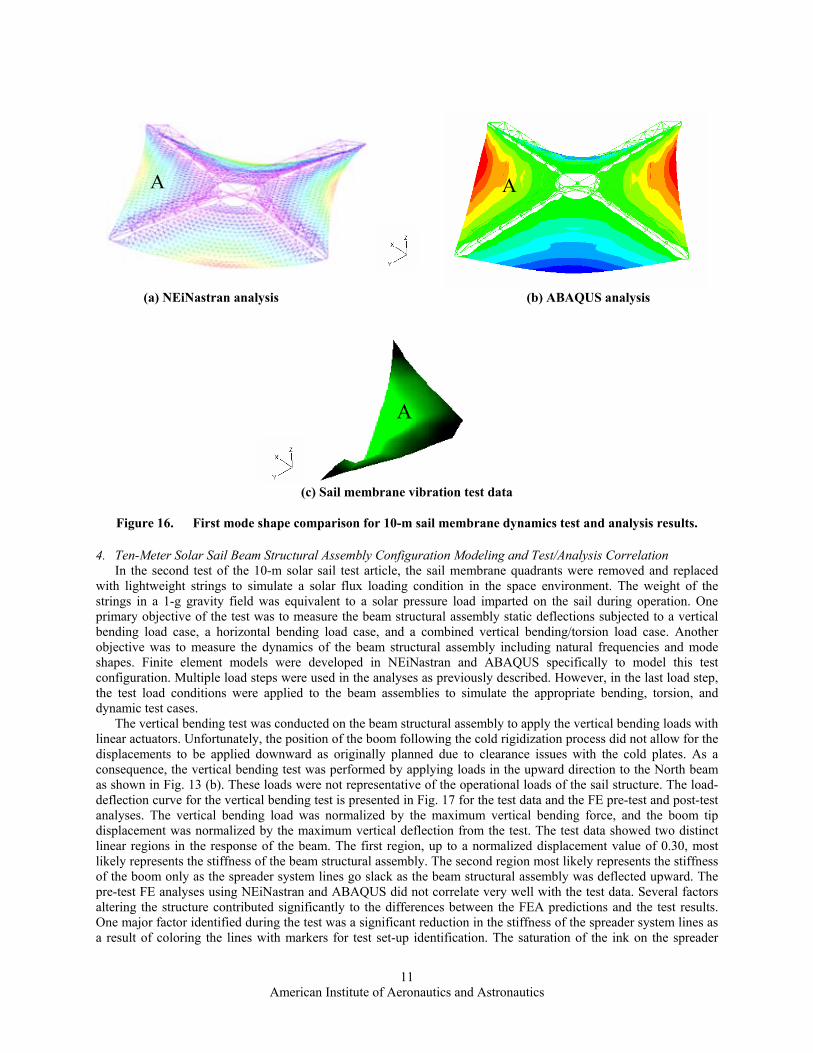
For the sail membrane structural dynamics test, a comparison of the first three sail membrane frequencies in the vacuum environment is presented in Table 2 for the test and the analyses. The FEA mode shapes were selected based on the resemblance to the modes shapes of the test. Both FEA software packages showed good agreement with the measured test frequencies and mode shapes. Figure 16 shows a comparison of the first mode shape for the test data using laser vibrometry of the Northeast sail membrane quadrant and the FE analyses. The Northeast sail membrane quadrant is identified by the symbol “A” in Fig. 16.
(a) NEiNastran model. (b) ABAQUS model.
Figure 14. Finite element models of 10-m solar sail system sail test article for the sail membrane configuration.

American Institute of Aeronautics and Astronautics
10
(a) NEiNastran analysis (b) ABAQUS analysis
Z-Position, mZ-Position, m
(c) Photogrammetry test data
Figure 15. 10-m sail membrane static shape comparison for FEA and test results.
Table 2. Comparison of test and FEA frequencies for 10-m sail membrane structural dynamics test. Mode Test Frequency (Hz) NEiNastran Frequency (Hz) ABAQUS Frequency (Hz)
1 1.10 1.31 (+19.1%) 1.25 (+13.6%) 2 3.25 3.29 (+1.2%) 2.85 (-12.3%) 3 7.55 7.22 (-4.4%) 7.33 (-2.9%)
American Institute of Aeronautics and Astronautics
11
4. Ten-Meter Solar Sail Beam Structural Assembly Configuration Modeling and Test/Analysis Correlation
In the second test of the 10-m solar sail test article, the sail membrane quadrants were removed and replaced with lightweight strings to simulate a solar flux loading condition in the space environment. The weight of the strings in a 1-g gravity field was equivalent to a solar pressure load imparted on the sail during operation. One primary objective of the test was to measure the beam structural assembly static deflections subjected to a vertical bending load case, a horizontal bending load case, and a combined vertical bending/torsion load case. Another objective was to measure the dynamics of the beam structural assembly including natural frequencies and mode shapes. Finite element models were developed in NEiNastran and ABAQUS specifically to model this test configuration. Multiple load steps were used in the analyses as previously described. However, in the last load step, the test load conditions were applied to the beam assemblies to simulate the appropriate bending, torsion, and dynamic test cases.
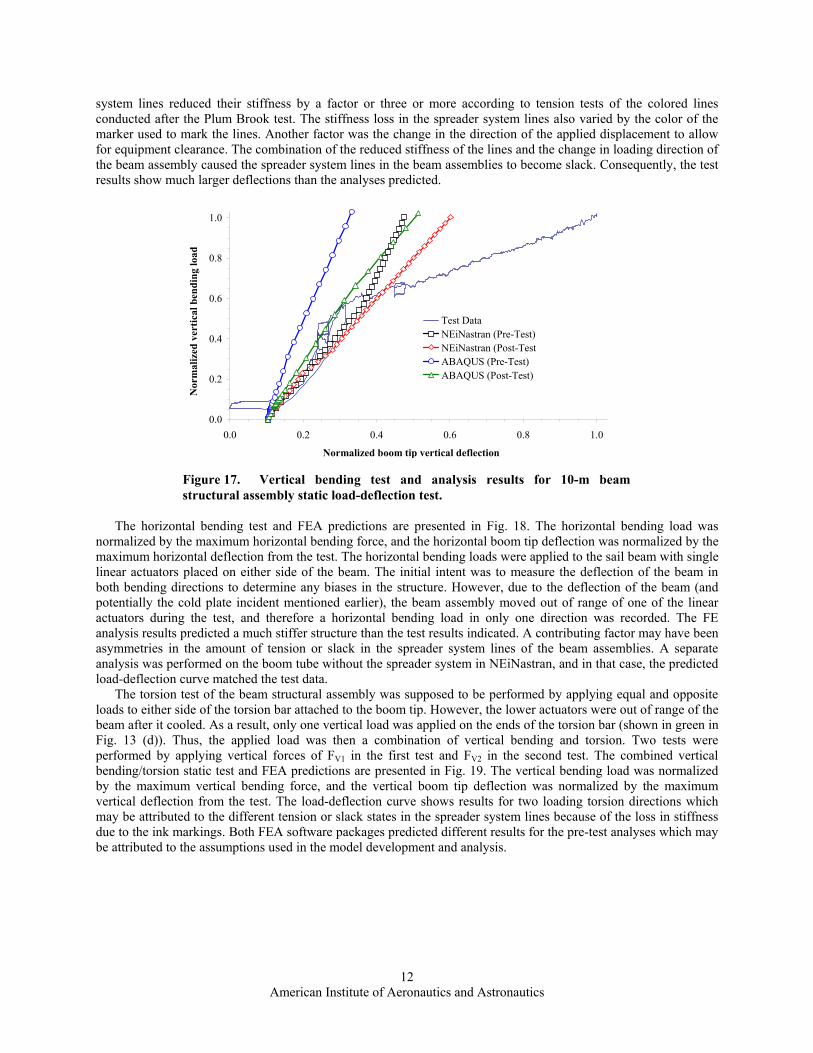
The vertical bending test was conducted on the beam structural assembly to apply the vertical bending loads with linear actuators. Unfortunately, the position of the boom following the cold rigidization process did not allow for the displacements to be applied downward as originally planned due to clearance issues with the cold plates. As a consequence, the vertical bending test was performed by applying loads in the upward direction to the North beam as shown in Fig. 13 (b). These loads were not representative of the operational loads of the sail structure. The load-deflection curve for the vertical bending test is presented in Fig. 17 for the test data and the FE pre-test and post-test analyses. The vertical bending load was normalized by the maximum vertical bending force, and the boom tip displacement was normalized by the maximum vertical deflection from the test. The test data showed two distinct linear regions in the response of the beam. The first region, up to a normalized displacement value of 0.30, most likely represents the stiffness of the beam structural assembly. The second region most likely represents the stiffness of the boom only as the spreader system lines go slack as the beam structural assembly was deflected upward. The pre-test FE analyses using NEiNastran and ABAQUS did not correlate very well with the test data. Several factors altering the structure contributed significantly to the differences between the FEA predictions and the test results. One major factor identified during the test was a significant reduction in the stiffness of the spreader system lines as a result of coloring the lines with markers for test set-up identification. The saturation of the ink on the spreader
AA AAA
(a) NEiNastran analysis (b) ABAQUS analysis
AA
(c) Sail membrane vibration test data
Figure 16. First mode shape comparison for 10-m sail membrane dynamics test and analysis results.
American Institute of Aeronautics and Astronautics
12
system lines reduced their stiffness by a factor or three or more according to tension tests of the colored lines conducted after the Plum Brook test. The stiffness loss in the spreader system lines also varied by the color of the marker used to mark the lines. Another factor was the change in the direction of the applied displacement to allow for equipment clearance. The combination of the reduced stiffness of the lines and the change in loading direction of the beam assembly caused the spreader system lines in the beam assemblies to become slack. Consequently, the test results show much larger deflections than the analyses predicted.
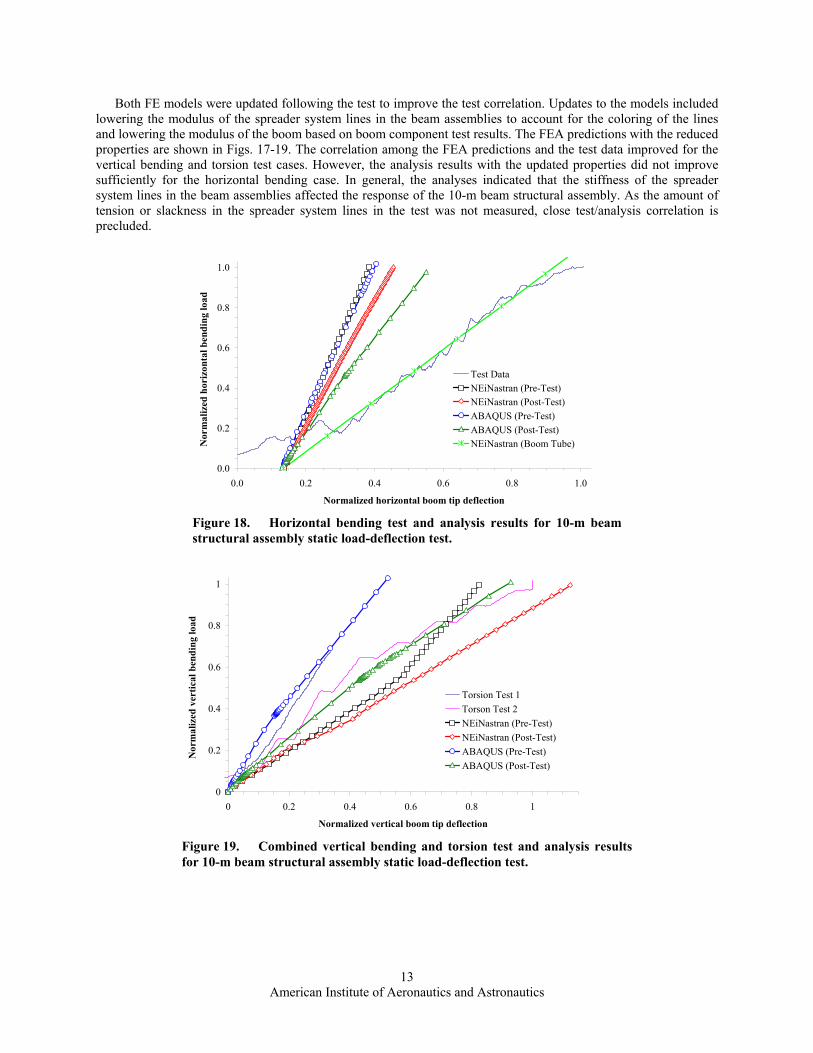
The horizontal bending test and FEA predictions are presented in Fig. 18. The horizontal bending load was
normalized by the maximum horizontal bending force, and the horizontal boom tip deflection was normalized by the maximum horizontal deflection from the test. The horizontal bending loads were applied to the sail beam with single linear actuators placed on either side of the beam. The initial intent was to measure the deflection of the beam in both bending directions to determine any biases in the structure. However, due to the deflection of the beam (and potentially the cold plate incident mentioned earlier), the beam assembly moved out of range of one of the linear actuators during the test, and therefore a horizontal bending load in only one direction was recorded. The FE analysis results predicted a much stiffer structure than the test results indicated. A contributing factor may have been asymmetries in the amount of tension or slack in the spreader system lines of the beam assemblies. A separate analysis was performed on the boom tube without the spreader system in NEiNastran, and in that case, the predicted load-deflection curve matched the test data.
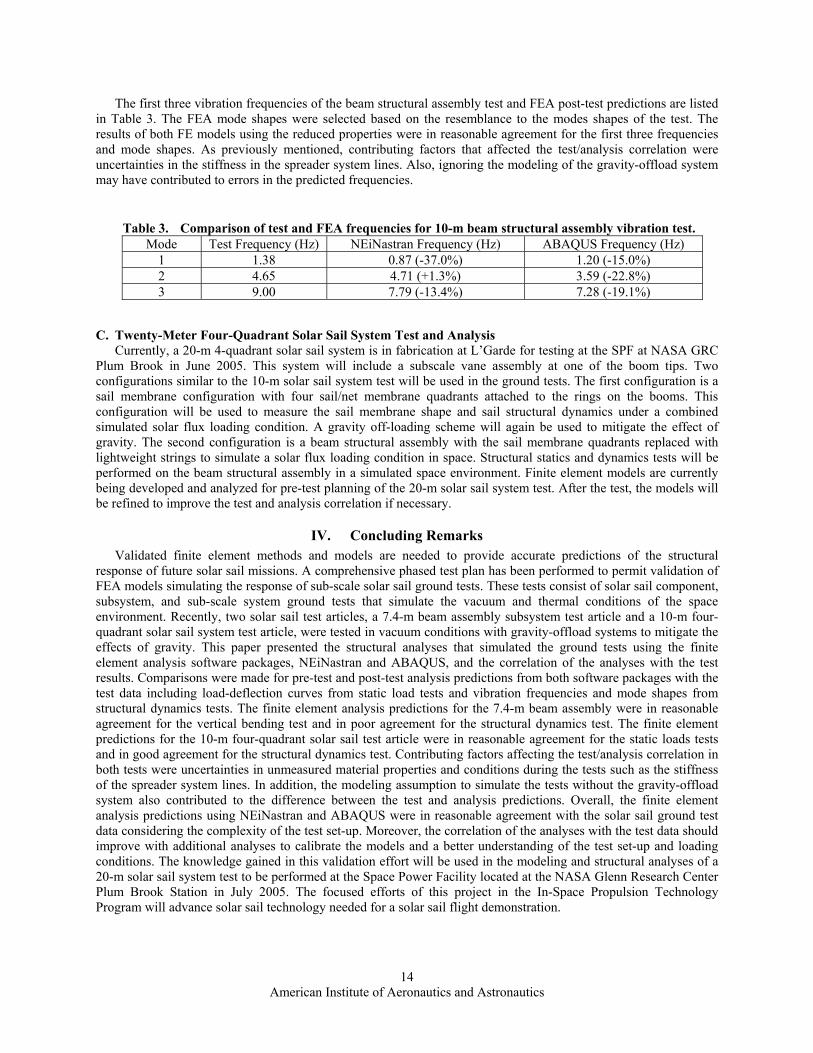
The torsion test of the beam structural assembly was supposed to be performed by applying equal and opposite loads to either side of the torsion bar attached to the boom tip. However, the lower actuators were out of range of the beam after it cooled. As a result, only one vertical load was applied on the ends of the torsion bar (shown in green in Fig. 13 (d)). Thus, the applied load was then a combination of vertical bending and torsion. Two tests were performed by applying vertical forces of FV1 in the first test and FV2 in the second test. The combined vertical bending/torsion static test and FEA predictions are presented in Fig. 19. The vertical bending load was normalized by the maximum vertical bending force, and the vertical boom tip deflection was normalized by the maximum vertical deflection from the test. The load-deflection curve shows results for two loading torsion directions which may be attributed to the different tension or slack states in the spreader system lines because of the loss in stiffness due to the ink markings. Both FEA software packages predicted different results for the pre-test analyses which may be attributed to the assumptions used in the model development and analysis.
0.0
0.2
0.4
0.6
0.8
1.0
0.0 0.2 0.4 0.6 0.8 1.0
Normalized boom tip vertical deflection
Nor
mal
ized
ver
tical
ben
ding
load
Test DataNEiNastran (Pre-Test)NEiNastran (Post-TestABAQUS (Pre-Test)ABAQUS (Post-Test)
Figure 17. Vertical bending test and analysis results for 10-m beam structural assembly static load-deflection test.
American Institute of Aeronautics and Astronautics
13
Both FE models were updated following the test to improve the test correlation. Updates to the models included lowering the modulus of the spreader system lines in the beam assemblies to account for the coloring of the lines and lowering the modulus of the boom based on boom component test results. The FEA predictions with the reduced properties are shown in Figs. 17-19. The correlation among the FEA predictions and the test data improved for the vertical bending and torsion test cases. However, the analysis results with the updated properties did not improve sufficiently for the horizontal bending case. In general, the analyses indicated that the stiffness of the spreader system lines in the beam assemblies affected the response of the 10-m beam structural assembly. As the amount of tension or slackness in the spreader system lines in the test was not measured, close test/analysis correlation is precluded.
0.0
0.2
0.4
0.6
0.8
1.0
0.0 0.2 0.4 0.6 0.8 1.0
Normalized horizontal boom tip deflection
Nor
mal
ized
hor
izon
tal b
endi
ng lo
ad
Test DataNEiNastran (Pre-Test)NEiNastran (Post-Test)ABAQUS (Pre-Test)ABAQUS (Post-Test)NEiNastran (Boom Tube)
Figure 18. Horizontal bending test and analysis results for 10-m beam structural assembly static load-deflection test.
0
0.2
0.4
0.6
0.8
1
0 0.2 0.4 0.6 0.8 1
Normalized vertical boom tip deflection
Nor
mal
ized
ver
tical
ben
ding
load
Torsion Test 1Torson Test 2NEiNastran (Pre-Test)NEiNastran (Post-Test)ABAQUS (Pre-Test)ABAQUS (Post-Test)
Figure 19. Combined vertical bending and torsion test and analysis results for 10-m beam structural assembly static load-deflection test.
American Institute of Aeronautics and Astronautics
14
The first three vibration frequencies of the beam structural assembly test and FEA post-test predictions are listed in Table 3. The FEA mode shapes were selected based on the resemblance to the modes shapes of the test. The results of both FE models using the reduced properties were in reasonable agreement for the first three frequencies and mode shapes. As previously mentioned, contributing factors that affected the test/analysis correlation were uncertainties in the stiffness in the spreader system lines. Also, ignoring the modeling of the gravity-offload system may have contributed to errors in the predicted frequencies.
C. Twenty-Meter Four-Quadrant Solar Sail System Test and Analysis Currently, a 20-m 4-quadrant solar sail system is in fabrication at L’Garde for testing at the SPF at NASA GRC
Plum Brook in June 2005. This system will include a subscale vane assembly at one of the boom tips. Two configurations similar to the 10-m solar sail system test will be used in the ground tests. The first configuration is a sail membrane configuration with four sail/net membrane quadrants attached to the rings on the booms. This configuration will be used to measure the sail membrane shape and sail structural dynamics under a combined simulated solar flux loading condition. A gravity off-loading scheme will again be used to mitigate the effect of gravity. The second configuration is a beam structural assembly with the sail membrane quadrants replaced with lightweight strings to simulate a solar flux loading condition in space. Structural statics and dynamics tests will be performed on the beam structural assembly in a simulated space environment. Finite element models are currently being developed and analyzed for pre-test planning of the 20-m solar sail system test. After the test, the models will be refined to improve the test and analysis correlation if necessary.
IV. Concluding Remarks Validated finite element methods and models are needed to provide accurate predictions of the structural
response of future solar sail missions. A comprehensive phased test plan has been performed to permit validation of FEA models simulating the response of sub-scale solar sail ground tests. These tests consist of solar sail component, subsystem, and sub-scale system ground tests that simulate the vacuum and thermal conditions of the space environment. Recently, two solar sail test articles, a 7.4-m beam assembly subsystem test article and a 10-m four-quadrant solar sail system test article, were tested in vacuum conditions with gravity-offload systems to mitigate the effects of gravity. This paper presented the structural analyses that simulated the ground tests using the finite element analysis software packages, NEiNastran and ABAQUS, and the correlation of the analyses with the test results. Comparisons were made for pre-test and post-test analysis predictions from both software packages with the test data including load-deflection curves from static load tests and vibration frequencies and mode shapes from structural dynamics tests. The finite element analysis predictions for the 7.4-m beam assembly were in reasonable agreement for the vertical bending test and in poor agreement for the structural dynamics test. The finite element predictions for the 10-m four-quadrant solar sail test article were in reasonable agreement for the static loads tests and in good agreement for the structural dynamics test. Contributing factors affecting the test/analysis correlation in both tests were uncertainties in unmeasured material properties and conditions during the tests such as the stiffness of the spreader system lines. In addition, the modeling assumption to simulate the tests without the gravity-offload system also contributed to the difference between the test and analysis predictions. Overall, the finite element analysis predictions using NEiNastran and ABAQUS were in reasonable agreement with the solar sail ground test data considering the complexity of the test set-up. Moreover, the correlation of the analyses with the test data should improve with additional analyses to calibrate the models and a better understanding of the test set-up and loading conditions. The knowledge gained in this validation effort will be used in the modeling and structural analyses of a 20-m solar sail system test to be performed at the Space Power Facility located at the NASA Glenn Research Center Plum Brook Station in July 2005. The focused efforts of this project in the In-Space Propulsion Technology Program will advance solar sail technology needed for a solar sail flight demonstration.
Table 3. Comparison of test and FEA frequencies for 10-m beam structural assembly vibration test. Mode Test Frequency (Hz) NEiNastran Frequency (Hz) ABAQUS Frequency (Hz)
1 1.38 0.87 (-37.0%) 1.20 (-15.0%) 2 4.65 4.71 (+1.3%) 3.59 (-22.8%) 3 9.00 7.79 (-13.4%) 7.28 (-19.1%)

American Institute of Aeronautics and Astronautics
15
Acknowledgments The work described in this paper was funded in whole or in part by the In-Space Propulsion Technology
Program, which is managed by NASA's Science Mission Directorate in Washington, D.C., and implemented by the In-Space Propulsion Technology Office at Marshall Space Flight Center in Huntsville, Alabama. The program objective is to develop in-space propulsion technologies that can enable or benefit near and mid-term NASA space science missions by significantly reducing cost, mass or travel times.
References
1Wright, J., Space Sailing, Taylor and Francis Publishers, 1992. 2McInnes, C. R., Solar Sailing: Technology, Dynamics, and Mission Applications, Springer-Praxis Series in Space Science
and Technology, 1999. 3Chmielewski, A. B., “Advanced Concepts,” Gossamer Spacecraft: Membrane and Inflatable Structures Technology for
Space Applications, Edited by C.H.M. Jenkins, Progress in Astronautics and Aeronautics, Vol. 191, American Institute of Aeronautics and Astronautics, Reston, VA, 2001.
4Salama, M., McInnes, C. R., and Mulligan, P., “Gossamer Spacecraft Technology,” Gossamer Spacecraft: Membrane and Inflatable Structures Technology for Space Applications, Edited by C.H.M. Jenkins, Progress in Astronautics and Aeronautics, Vol. 191, American Institute of Aeronautics and Astronautics, Reston, VA, 2001.
5West, J. L. and Derbès, B., “Solar Sail Vehicle System Design for the Geostorm Warning Mission,” 41st AIAA/ASME/ASCE/AHS/ASC Structures, Structural Dynamics & Materials Conference, AIAA-2000-5326, 2000.
6West, J. L., “The Geostorm Warning Mission: Enhanced Opportunity Based on New Technology,” 14th AAS/AIAA Space Flight Mechanics Conference, AAS 2004-102, 2004.
7Lichodziejewski, D., Derbès, B., West, J., Reinert, R., Belvin, K., and Pappa, R., “Bringing an Effective Solar Sail Design Toward TRL 6,” 39th AIAA/ASME/SAE/ASEE Joint Propulsion Conference and Exhibit, AIAA 2003-4659, 2003.
8Lichodziejewski, D., Derbès, B., Reinert, R., Belvin, K., Slade, K., and Mann, T., “Development and Ground Testing of a Compactly Stowed Scalable Inflatably Deployed Solar Sail,” 45th AIAA/ASME/ASCE/AHS/ASC Structures, Structural Dynamics & Materials Conference, AIAA-2004-1507, 2004.
9NEiNastran User's and Reference Manual, Version 8.3, Noran Engineering, Inc, 2004. 10ABAQUS/Standard User's Manual, Version 6.4-2, ABAQUS, Inc., 2004. 11Lichodziejewski, D., Derbès, B., Slade, K., and Mann, T., “Vacuum Deployment and Testing of a 4-Quadrant Scalable
Inflatable Rigidizable Solar Sail System,” 46th AIAA/ASME/ASCE/AHS/ASC Structures, Structural Dynamics & Materials Conference, AIAA 2005-2122, 2005.