Embed Size (px)
Citation preview
Structural and electrical properties of
composites of polymer-iron carbide
nanoparticle embedded in carbon
S. Shekhar ∗ V. Prasad, S. V. Subramanyam
Department of Physics, Indian Institute of Science, Bangalore, 560 012, India.
Abstract
The electrical transport properties of composites of polymer and iron carbide nanopar-ticle embedded in carbon have been studied from 300K to 1.3K. The compos-ites show percolative type behavior with a low threshold value. The XRD showsamorphous nature of the composite. The temperature dependence of conductiv-ity follows two different Efros-Shklovskii variable range hopping mechanisms (σ =σ0exp[−(TES/T )1/2]) with different pre-exponential factors (ρ0) and different TES
values in range 300K-6K. Thermogravimetric analysis shows that the thermal sta-bility of composites does not depend on filler content to a large extent.
Key words: Polymer composites; Pyrolysis; Transport properties; Nanostructures;Transmission electron microscopy
1 Introduction
Polymer-composites incorporating metal, semiconductor, carbon black, nano-materials and magnetic materials have been widely used and studied as multi-functional materials with inherent polymer properties. Composites of polymerand magnetic nanoparticles are the subject of extensive research in view oftechnological importance which varies from high density data storage, electro-magnetic shielding, electronic circuitry, switch, sensor to biomedicine [1–3].Nanoparticles (magnetic) renewed the interest in polymer composites. Theproperties of nanoparticles differ from those of the same material in bulkdue to quantum size effect. The macroscopic properties of composites exhibit
∗ Corresponding author. Tel.: +91-80-2293-2313; fax: +91-80-2360-2602Email address: [email protected] (S. Shekhar).
Preprint submitted to Elsevier Science 18 May 2006
novel properties due to the combined action of quantum size effects, inter-face between nanostructures and matrix, matrix properties and morphologiesof nanoparticle. Polymer embedded with magnetic nanoparticle behaves likean usual magnet without loosing the inherent polymer characteristics of lightweight, flexibility and corrosion resistance. These materials have attracted theattention of physicists due to giant Hall effect and giant magnetoresistance[4].
The conductivity of insulating materials like polymers can be enhanced byseveral orders of magnitude by incorporating some conducting filler in it.The conducting particles make infinitely connected percolative network af-ter a threshold concentration resulting in an enhancement in conductivity byseveral order of magnitude (6 to 10 order). Above the threshold value (pc), theconductivity follows the relation σ = σ0(p − pc)
t [5]. The percolation theorypredicts the threshold value (pc) close to 17% for spherical particle systems.Monte Carlo Simulation in three dimensions shows a universal value for crit-ical exponent t (=2). But both universal and non-universal value of t hasbeen observed experimentally and reported theoretically [7,11,13]. The lowpercolation threshold can be achieved in the case where the fillers have highaspect ratio such as fibres, nanotubes and flakes. The nanomaterials also helpin bringing down the threshold value due to its large surface to volume ratio.The threshold value as low as 1 weight% has been reported [12]. The temper-ature dependence of conductivity of polymer-conductor composites show widerange of conduction mechanism depending on matrix, filler and interaction be-tween filler and matrix. The most common conduction mechanism observed inpolymer-conductor composites is variable range hopping (ρ = ρ0exp[T0/T ]n;n<1) [14,15]. If the filler particle is relatively bigger in size thermal fluctuationinduced tunneling governs the transport properties (ρ = ρ0exp[T1/(T0 + T ])[16,17].
2 Experimental
The filler material which contains iron carbide nanoparticles embedded incarbon matrix are prepared by pyrolysis of maleic anhydride (C4H2O3) andferrocene [(C5H5)2Fe)] in 2:1 molecular weight ratio. The pyrolysis is carriedout in double zone furnace at 9800C for 51
2hours in a quartz tube and the
yield after the pyrolysis is fine black color soot which contains iron carbidenanoparticles and graphitized carbon (We designate this powder as filler forall future reference in text) [6]. The thin layers of carbon coating over ironcarbide has been observed in TEM micrograph (fig.4). The polymer compositesare obtained by mixing the filler in different proportions with poly(vinyl)chloride (PVC). The PVC is first dissolved in tetrahydrofuran (THF) andthe appropriate proportion of filler is ultrasonicated in PVC for 2 hours to get
2
0 20 40 60 800
150
300
450
600
750
0 20 40 60 80 100
0
75
150
225
300
tq r sn pml
kji
Intensity
(a.
u.)
Diffraction angle (2q)
o
f
e
dcba
Inte
nsity
(a.u
.)
Diffraction angle (2q)
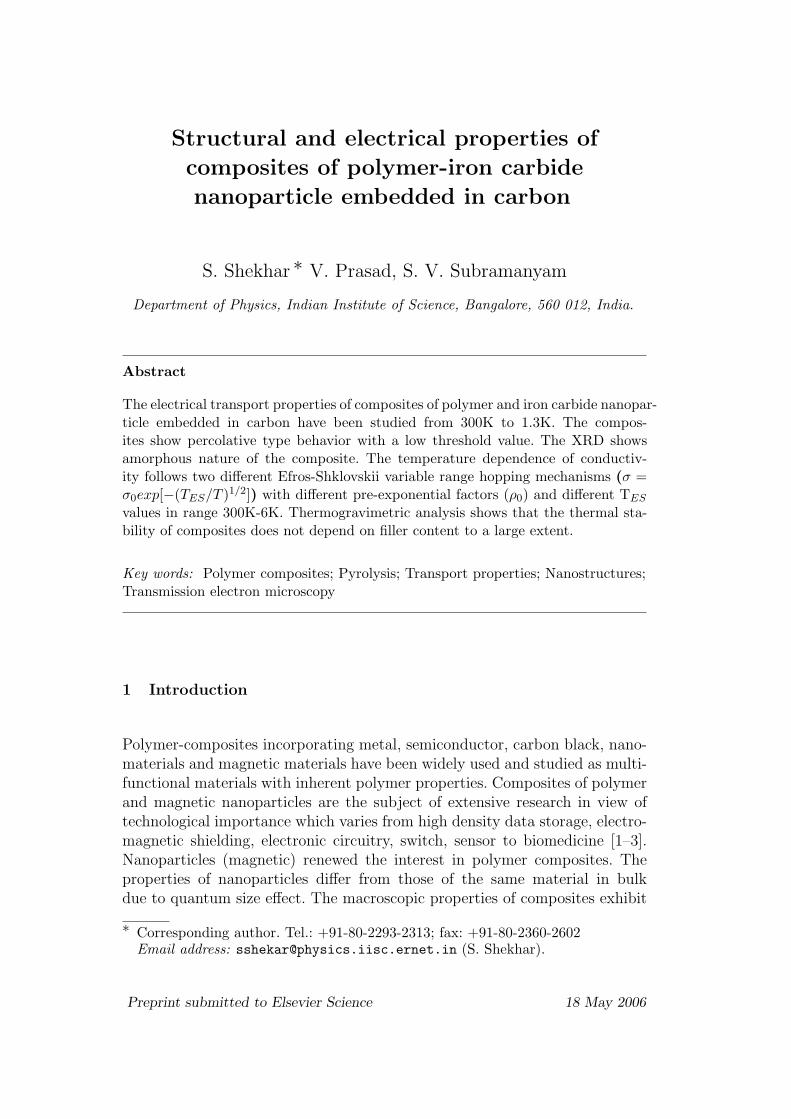
Fig. 1. shows XRD patterns of composites having different proportions of filler. Theamount of filler in different composites: (a) has 0 % of filler (pure pvc), (b) 3.2%, (c) 15.5%, (d) 23.1%, (e)25%, (f) 34.8%. Inset shows the XRD patterns of filler(pyrolyzed maleic anhydride and ferrocene at 9800C). The o peak correspond tographite 002 plane. The other peaks i (37.76◦,112); j (40.99◦,120); k (43.91◦, 210);l (45.07◦, 103); m (46.03◦, 211); n (49.2 ◦, 211); p (54.6◦, 004); q (58.06◦, 123); r(77.7 ◦, 401); s (83.1◦, 332); t (86.2◦, 303); correspond to different planes of ironcarbide (Fe3C). Source JCPDS references.
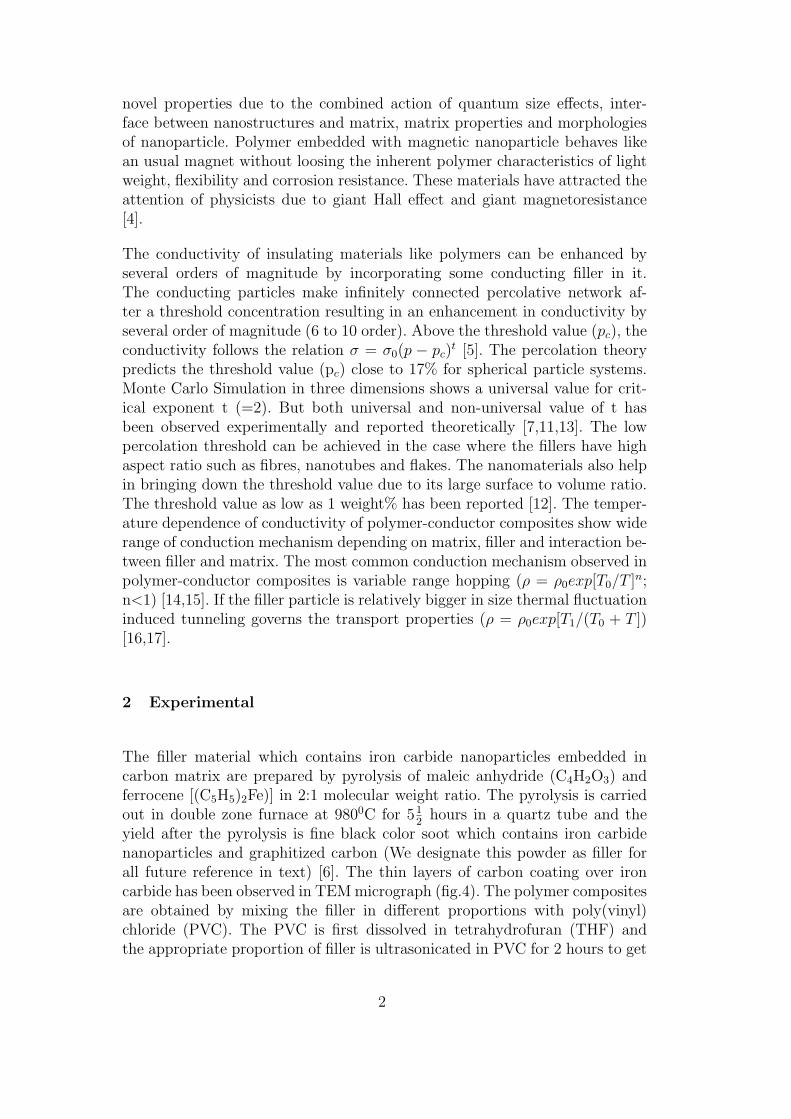
Fig. 2. SEM micrograph of filler. The round shaped particle is carbon coated ironcarbide nanoparticle. They are clustered together.
homogeneous dispersion and the solution is allowed to settle in an optically flatbeaker [7]. The film thickness is found to be of the order of 100 micrometer.For measurement of resistance four probe method has been used and thecontacts have been made by silver paint. Janis liquid Helium cryostat hasbeen used for low temperature transport measurements. Thermal stability ofcomposites are analyzed by PYRIS EXSTAR-6000 thermal analyzer in N2
3
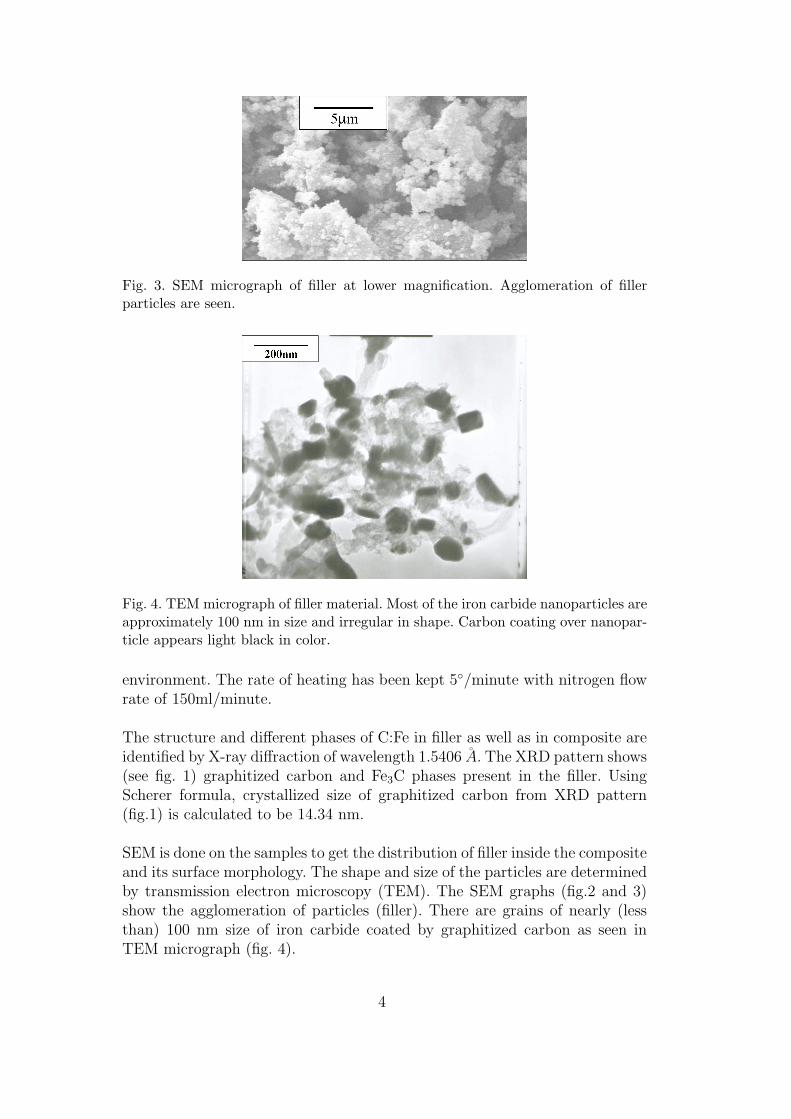
Fig. 3. SEM micrograph of filler at lower magnification. Agglomeration of fillerparticles are seen.
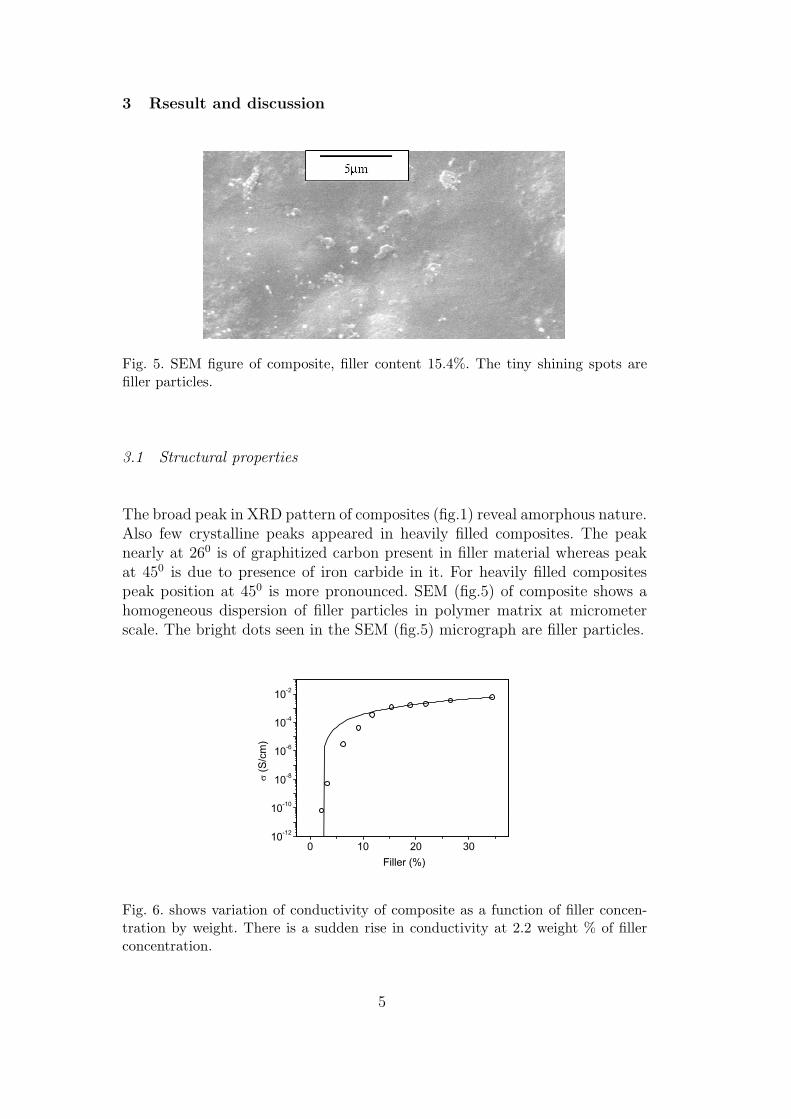
Fig. 4. TEM micrograph of filler material. Most of the iron carbide nanoparticles areapproximately 100 nm in size and irregular in shape. Carbon coating over nanopar-ticle appears light black in color.
environment. The rate of heating has been kept 5◦/minute with nitrogen flowrate of 150ml/minute.
The structure and different phases of C:Fe in filler as well as in composite areidentified by X-ray diffraction of wavelength 1.5406 A. The XRD pattern shows(see fig. 1) graphitized carbon and Fe3C phases present in the filler. UsingScherer formula, crystallized size of graphitized carbon from XRD pattern(fig.1) is calculated to be 14.34 nm.
SEM is done on the samples to get the distribution of filler inside the compositeand its surface morphology. The shape and size of the particles are determinedby transmission electron microscopy (TEM). The SEM graphs (fig.2 and 3)show the agglomeration of particles (filler). There are grains of nearly (lessthan) 100 nm size of iron carbide coated by graphitized carbon as seen inTEM micrograph (fig. 4).
4
3 Rsesult and discussion
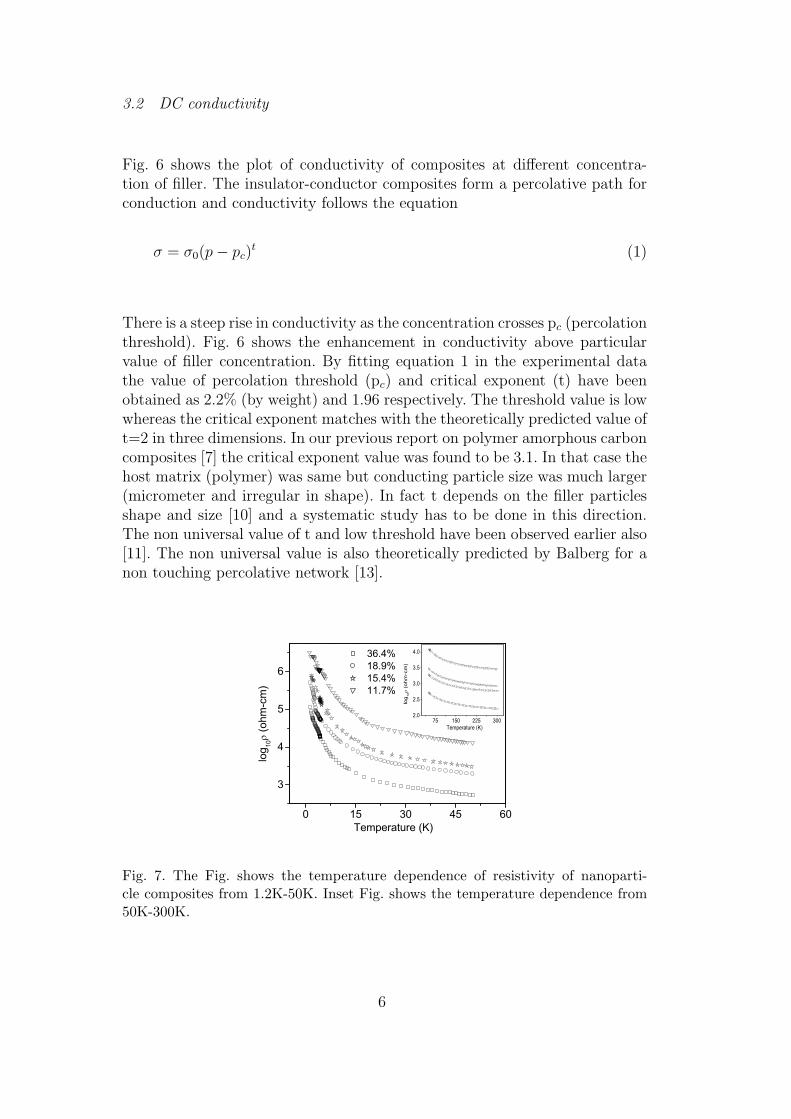
Fig. 5. SEM figure of composite, filler content 15.4%. The tiny shining spots arefiller particles.
3.1 Structural properties
The broad peak in XRD pattern of composites (fig.1) reveal amorphous nature.Also few crystalline peaks appeared in heavily filled composites. The peaknearly at 260 is of graphitized carbon present in filler material whereas peakat 450 is due to presence of iron carbide in it. For heavily filled compositespeak position at 450 is more pronounced. SEM (fig.5) of composite shows ahomogeneous dispersion of filler particles in polymer matrix at micrometerscale. The bright dots seen in the SEM (fig.5) micrograph are filler particles.
0 10 20 3010-12
10-10
10-8
10-6
10-4
10-2
s (S
/cm
)
Filler (%)
Fig. 6. shows variation of conductivity of composite as a function of filler concen-tration by weight. There is a sudden rise in conductivity at 2.2 weight % of fillerconcentration.
5
3.2 DC conductivity
Fig. 6 shows the plot of conductivity of composites at different concentra-tion of filler. The insulator-conductor composites form a percolative path forconduction and conductivity follows the equation
σ = σ0(p− pc)t (1)
There is a steep rise in conductivity as the concentration crosses pc (percolationthreshold). Fig. 6 shows the enhancement in conductivity above particularvalue of filler concentration. By fitting equation 1 in the experimental datathe value of percolation threshold (pc) and critical exponent (t) have beenobtained as 2.2% (by weight) and 1.96 respectively. The threshold value is lowwhereas the critical exponent matches with the theoretically predicted value oft=2 in three dimensions. In our previous report on polymer amorphous carboncomposites [7] the critical exponent value was found to be 3.1. In that case thehost matrix (polymer) was same but conducting particle size was much larger(micrometer and irregular in shape). In fact t depends on the filler particlesshape and size [10] and a systematic study has to be done in this direction.The non universal value of t and low threshold have been observed earlier also[11]. The non universal value is also theoretically predicted by Balberg for anon touching percolative network [13].
0 15 30 45 60
3
4
5
6
75 150 225 3002.0
2.5
3.0
3.5
4.0
log 10
r (
ohm
-cm
)
Temperature (K)
log 10
r (o
hm-c
m)
Temperature (K)
36.4% 18.9% 15.4% 11.7%
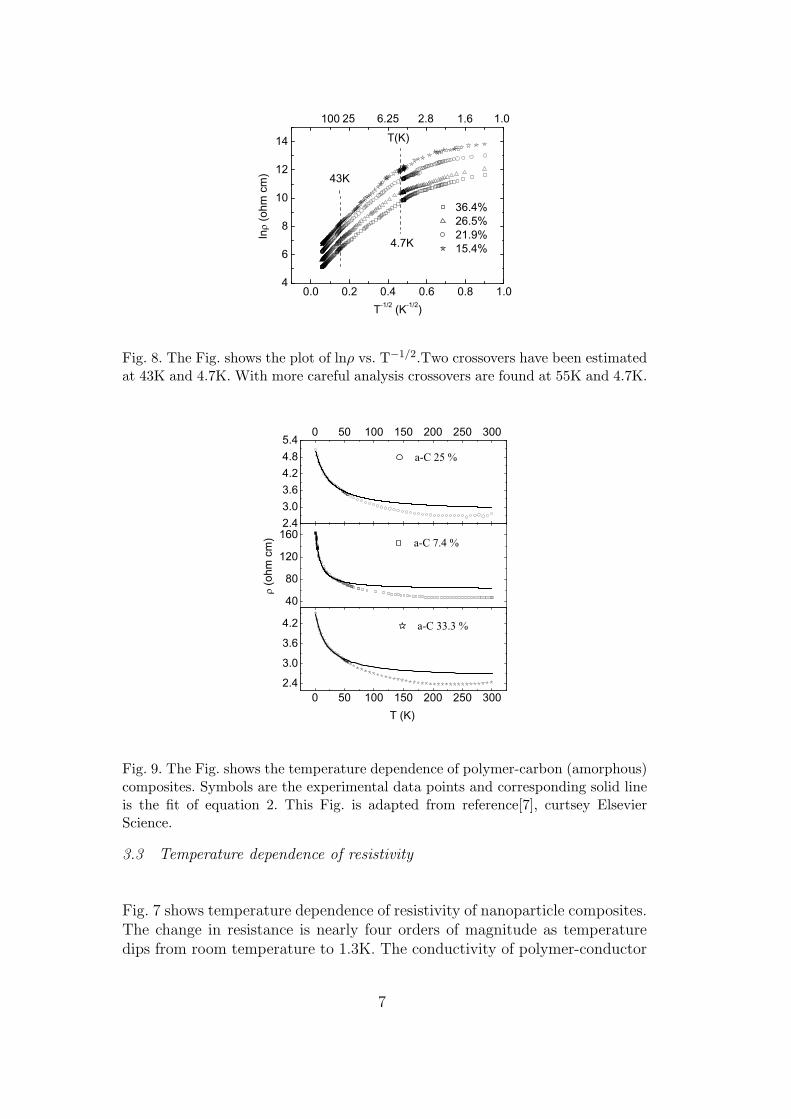
Fig. 7. The Fig. shows the temperature dependence of resistivity of nanoparti-cle composites from 1.2K-50K. Inset Fig. shows the temperature dependence from50K-300K.
6
0.0 0.2 0.4 0.6 0.8 1.04
6
8
10
12
14
43K
4.7K
36.4%26.5%21.9%15.4%
T(K)100 25 6.25 2.8 1.6 1.0
lnr
(ohm
cm
)
T-1/2 (K-1/2)
Fig. 8. The Fig. shows the plot of lnρ vs. T−1/2.Two crossovers have been estimatedat 43K and 4.7K. With more careful analysis crossovers are found at 55K and 4.7K.
0 50 100 150 200 250 3002.4
3.0
3.6
4.2
40
80
120
1602.43.03.64.24.85.4
0 50 100 150 200 250 300
a-C 33.3 %
r (o
hm c
m)
T (K)
a-C 7.4 %
a-C 25 %
Fig. 9. The Fig. shows the temperature dependence of polymer-carbon (amorphous)composites. Symbols are the experimental data points and corresponding solid lineis the fit of equation 2. This Fig. is adapted from reference[7], curtsey ElsevierScience.
3.3 Temperature dependence of resistivity
Fig. 7 shows temperature dependence of resistivity of nanoparticle composites.The change in resistance is nearly four orders of magnitude as temperaturedips from room temperature to 1.3K. The conductivity of polymer-conductor
7
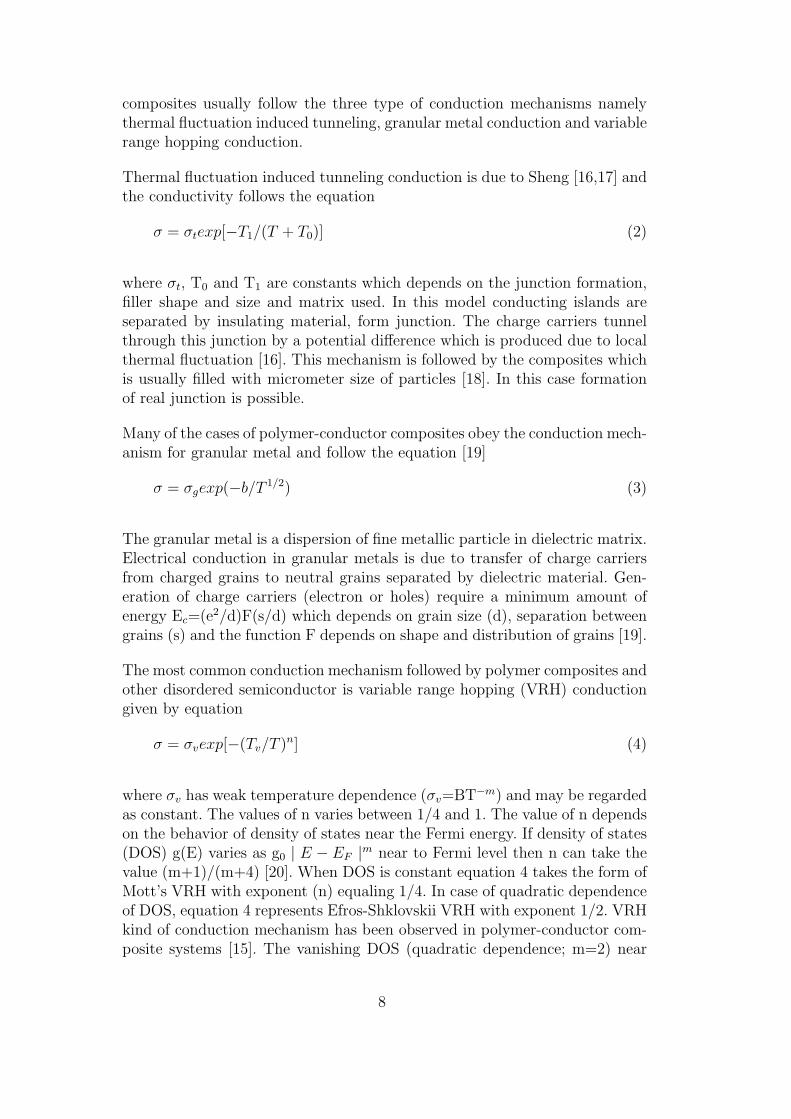
composites usually follow the three type of conduction mechanisms namelythermal fluctuation induced tunneling, granular metal conduction and variablerange hopping conduction.
Thermal fluctuation induced tunneling conduction is due to Sheng [16,17] andthe conductivity follows the equation
σ = σtexp[−T1/(T + T0)] (2)
where σt, T0 and T1 are constants which depends on the junction formation,filler shape and size and matrix used. In this model conducting islands areseparated by insulating material, form junction. The charge carriers tunnelthrough this junction by a potential difference which is produced due to localthermal fluctuation [16]. This mechanism is followed by the composites whichis usually filled with micrometer size of particles [18]. In this case formationof real junction is possible.
Many of the cases of polymer-conductor composites obey the conduction mech-anism for granular metal and follow the equation [19]
σ = σgexp(−b/T 1/2) (3)
The granular metal is a dispersion of fine metallic particle in dielectric matrix.Electrical conduction in granular metals is due to transfer of charge carriersfrom charged grains to neutral grains separated by dielectric material. Gen-eration of charge carriers (electron or holes) require a minimum amount ofenergy Ec=(e2/d)F(s/d) which depends on grain size (d), separation betweengrains (s) and the function F depends on shape and distribution of grains [19].
The most common conduction mechanism followed by polymer composites andother disordered semiconductor is variable range hopping (VRH) conductiongiven by equation
σ = σvexp[−(Tv/T )n] (4)
where σv has weak temperature dependence (σv=BT−m) and may be regardedas constant. The values of n varies between 1/4 and 1. The value of n dependson the behavior of density of states near the Fermi energy. If density of states(DOS) g(E) varies as g0 | E − EF |m near to Fermi level then n can take thevalue (m+1)/(m+4) [20]. When DOS is constant equation 4 takes the form ofMott’s VRH with exponent (n) equaling 1/4. In case of quadratic dependenceof DOS, equation 4 represents Efros-Shklovskii VRH with exponent 1/2. VRHkind of conduction mechanism has been observed in polymer-conductor com-posite systems [15]. The vanishing DOS (quadratic dependence; m=2) near
8
to Fermi level is produced due to coulomb interaction between the hoppedelectron and hole created at hopped site. This gives rise to a coulomb gapnear to Fermi level and the systems obey ES-VRH [14].
The disordered metallic behavior have been also observed in few of the highlyconducting composites having large fraction of filler material [21]. In the car-bon black-polymer composite studied by Dawson et. al.[21] the conductivityshows the characteristic of two dimensional disordered metal and at low tem-peratures it follows the relation σα lnT.
The temperature dependence of resistivity of the composites follows Efros-Shklovskii variable range hopping (ES-VRH) from 300K-55K and 34K-6Kwith different coulomb gaps (see fig. 8) (The fig. shows transition at 43K and4.7K but with more careful analysis the range was found to be 300K-55K and34K-6K) [8]. Below this temperature another crossover occurs and resistivityshows linear dependence on temperature [8]. The conductivity of compos-ites differ from the filler even at 36.4% of filler concentration. The filler hereshows semiconducting behavior and resistance depends linearly on logarith-mic (natural) of temperature [9]. Previously we have reported the transportproperties of polymer-carbon (amorphous) composites [7] and found that ther-mal fluctuation induced tunneling (eq.2) governs the conduction mechanismat low temperatures. In that case the filler (carbon particles) of micrometersize (∼ 40µ) were dispersed in PVC. The conduction mechanism in amor-phous carbon composites and nanoparticle composites differ completely. Inamorphous carbon polymer composites thermal fluctuation induced tunneling(eq.2) is followed from 1.3K to 50K-60K. Due to different thermal expansioncoefficient between carbon and polymer, the gap between conducting carbonincreases that suppresses tunneling conduction. At higher temperature twoeffects act simultaneously; the differential thermal expansion between carbonand polymer which reduces the tunneling conduction and higher thermal en-ergy which provides more tunneling current. Due to these combined effects inlarge temperature range (150K-250K) not much change in resistance has beenobserved (see fig. 9) [7]. Finally near to room temperature resistance startedincreasing because differential thermal expansion overcomes tunneling conduc-tion (positive temperature coefficient of resistivity). This behavior is absent innanoparticle composites. There is no such effect of positive temperature coef-ficient at room temperature is observed. In nanoparticle-polymer compositesfiller is very fine (soot) and so they are very large in number. The separationbetween particles are very less. So the effect of differential thermal expansionis minimal and conduction mechanism is solely variable range hopping. Thechange in resistance (ρ(1.3K)/ρ(300K)) for nanoparticle composites is foundto be few orders of magnitude whereas in amorphous carbon composites thechange observed is nearly an order and less. Quantitatively the nanoparticlecomposites are more disordered.
9
0 200 400 600 800
0
20
40
60
80
100
dcbaM
ass
(%)
Temperature (0C)
Filler Fraction:a) 0% (PVC)b) 6.3%c) 21.9%d) 34.8%
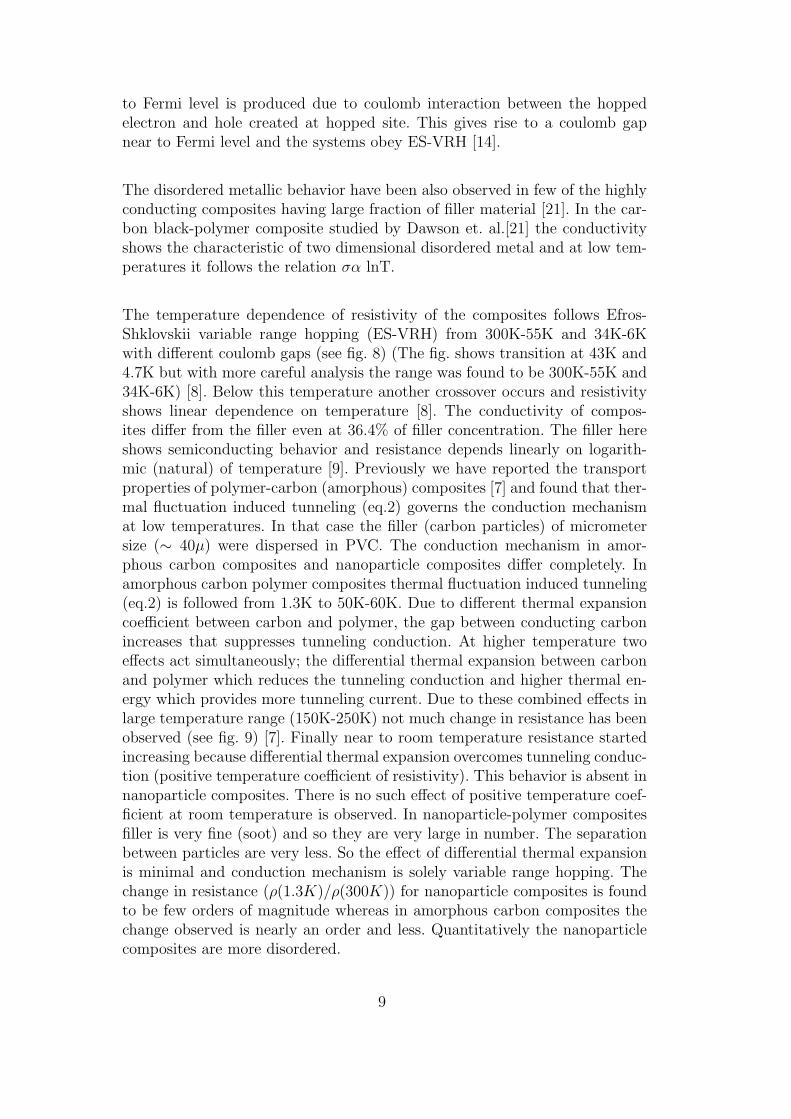
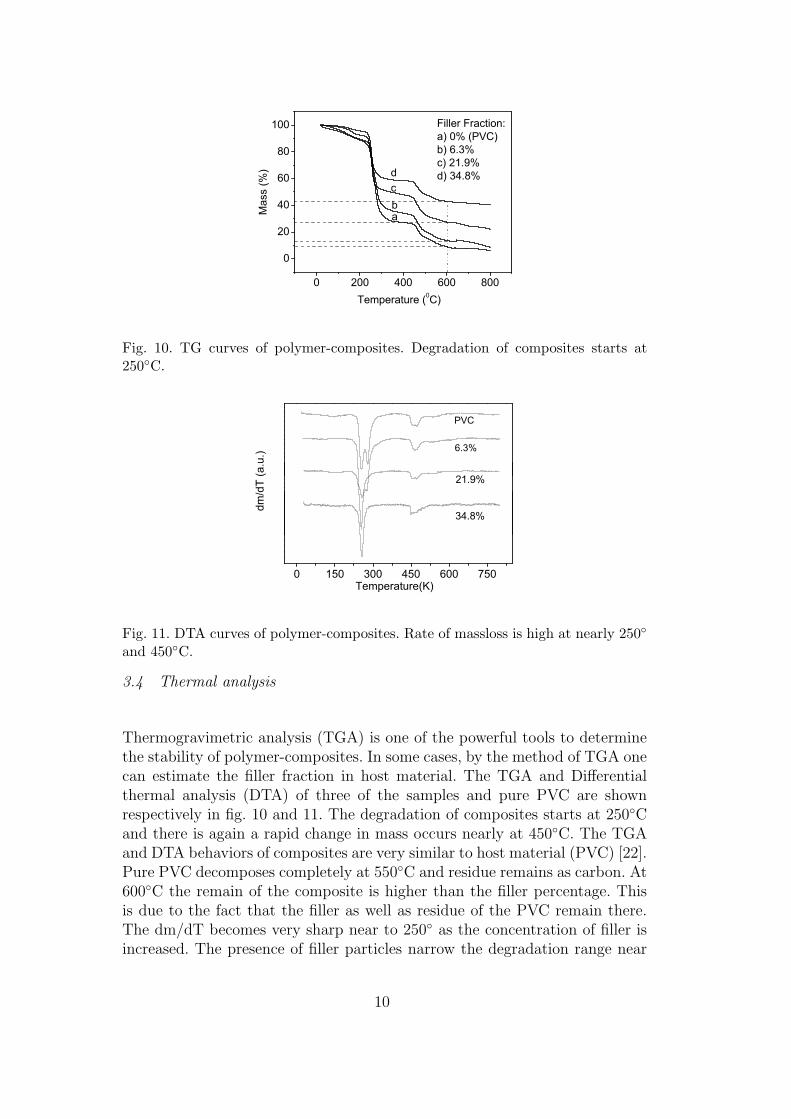
Fig. 10. TG curves of polymer-composites. Degradation of composites starts at250◦C.
0 150 300 450 600 750
dm/d
T (a
.u.)
Temperature(K)
34.8%
21.9%
6.3%
PVC
Fig. 11. DTA curves of polymer-composites. Rate of massloss is high at nearly 250◦
and 450◦C.
3.4 Thermal analysis
Thermogravimetric analysis (TGA) is one of the powerful tools to determinethe stability of polymer-composites. In some cases, by the method of TGA onecan estimate the filler fraction in host material. The TGA and Differentialthermal analysis (DTA) of three of the samples and pure PVC are shownrespectively in fig. 10 and 11. The degradation of composites starts at 250◦Cand there is again a rapid change in mass occurs nearly at 450◦C. The TGAand DTA behaviors of composites are very similar to host material (PVC) [22].Pure PVC decomposes completely at 550◦C and residue remains as carbon. At600◦C the remain of the composite is higher than the filler percentage. Thisis due to the fact that the filler as well as residue of the PVC remain there.The dm/dT becomes very sharp near to 250◦ as the concentration of filler isincreased. The presence of filler particles narrow the degradation range near
10
to 250◦C.
4 Summary and Conclusions
The low temperature (300K-1.3K) transport properties of composites of polymer-iron carbide nanoparticle embedded in carbon have been studied. The com-posite establishes a percolative path when filler concentration crosses 2.2%by weight and dc conductivity follows the scaling law σ=σ0(p-pc)
t. The XRDpattern shows disordered nature of the materials. ES-VRH mechanism of con-duction is followed in two different temperature segments (300K-55K and 34K-6K). It has been found that low temperature electrical transport depends onparticle size. If particle size is large (micrometer) thermal fluctuation inducedtunneling is the conduction mechanism whereas in nanoparticle compositesVRH mechanism is followed. The thermogravimetric analysis shows that thereis not much effect on the stability of the host by the inclusion of filler.
Acknowledgements: We wish to acknowledge the Sophisticated AnalyticalInstrument Facility (SAIF) and Ms. Bharati, I.I.T. Bombay for doing TEM.Department of Science of Technology, New Delhi is acknowledged for providingthe National Low Temperature and High Magnetic Facility at I.I.Sc. Bangalorewhere this work has been performed. Authors would like to acknowledge allthe lab-mates for their constant support. We are thankful to Ms.E.P.Sajithafor some fruitful discussions. One of us (S.S.) is grateful to CSIR, New Delhifor granting the scholarship.
References
[1] J. L. Wilson, P. Poddar, N. A. Frey, H. Srikanth, K. Mohomed, J. P. Harmon,S. Kotha,J. Wachsmuth, J Appl. Phys. 95 (2004) 1439.
[2] Q. A. Pankhurst, J. Connoly, S. K. Jones, J. Dobson, J. Phys. D 36 (2003)R167.
[3] N. Guskos, E. A. Anagnostakis, V. Likodimos, T. Bodziony, J. Typek, M.Marynaik, U. Narkiewicz, Kucharewicz, J. Appl. Phys. 97 (2005) 0243041.
[4] A. E. Varfolomeev, D. Y. Godovskii, G. A. Kapustin, A. V. Volkov, M. A.Moskvina, JETP Lett. 67 (1998) 39.
[5] S. Kirkpatrick, Rev. Mod. Phys. 45 (1973) 574.
[6] E. P. Sajitha, V. Prasad, S. V. Subramanyam, S. Eto, K. Takai, T. Enoki,Carbon 42 (2004) 2815.
11
[7] S. Shekhar, V. Prasad, S. V. Subramanyam, Carbon 44 (2006) 334.
[8] S. Shekhar, V. Prasad, S. V. Subramanyam, (submitted).
[9] E. P. Sajitha, V. Prasad, S. V. Subramanyam, (submitted).
[10] F. Carmona, P. Prudhon, F. Barreau, Solid State Comm. 51 (1984) 255.
[11] S. I. Lee, Y. Song, T. W. Noh, X. Chen, G. R. Gaines, Phys. Rev. B 34 (1986)6719.
[12] P. Mandal, A. Neumann, A. G. M. Jansen, P. Wyder, R. Deltour, Phys. Rev.B 55 (1997) 452.
[13] I. Balberg, Phys. Rev. Lett. 59 (1987) 1305.
[14] B. I. Shklovskii, A. L. Efros, Electronic Properties of Doped Semiconductors,Springer-Verlag, Berlin, 1984.
[15] D. vanderPutten, J. T. Moonen, H. B. Brom, J. C. M. Brokken-Zijp, M. A. J.Michels, Phys. Rev. Lett. 69 ( 1992) 494.
[16] P. Sheng, E. K. Sichel, J. I. Gittleman, Phys. Rev. Lett. 40 (1978) 1197.
[17] P. Sheng, Phys. Rev. B 21 (1980) 2180.
[18] F. Carmona, Physica A 157 (1989) 461.
[19] P. Sheng, B. Abeles, Y. Arie, Phys. Rev. Lett. 31 (1973) 44.
[20] E. M. Hamilton, Philos. Mag. 26 (1972) 1043.
[21] J. C. Dawson, C. J. Adkins, J. Phys.: Condens. Matter 8 (1996) 8321.
[22] D. A. Skoog, F. J. Holler, T. A. Nieman, Principle of Instrumental Analysis,5th Ed., Harcourt Asia Pte Ltd., Singapore, 1998.
12