Embed Size (px)
Citation preview

a
85rpee | Série III | n.º 15 | março de 2021
Structural behavior of Pracana dam 30 years after rehabilitation due to severe ISR-ASR damage
Comportamento estrutural da barragem de Pracana 30 anos após as obras de reabilitação devidas às graves deteriorações provocadas pela RSI-RAS
José Piteira GomesDomingos Silva MatosAntónio Lopes Batista
José Ilídio Ferreira
ResumoA barragem de Pracana é uma estrutura de contrafortes com 60 m de altura, concluída em 1951, construída com betão de agregados quartzíticos e graníticos. Desde o primeiro enchimento da albufeira observou-se um comportamento anormal, caracterizado por deslocamentos verticais e horizontais progressivos e intensa fendilhação, devidos à RSI-RAS. A evolução das deteriorações e a insuficiente capacidade do descarregador de cheias conduziram à decisão de esvaziar a albufeira em 1980.
Entre 1988 e 1992 foram realizadas, pelo concessionário da barragem, a EDP – Energias de Portugal, obras de reabilitação de grande envergadura, que incluíram a impermeabilização do paramento de montante com uma geomembrana, a regeneração do betão, a construção de dois alinhamentos de escoras de betão ligando a base das almas dos contrafortes e a modernização e o reforço do sistema de observação.
Neste artigo apresentam-se os resultados da análise do comportamento observado desde o reenchimento da albufeira, em dezembro de 1992, que mostram o impacto das obras de reabilitação no comportamento da obra, nomeadamente a diminuição muito significativa da taxa de desenvolvimento das reações, embora de forma não uniforme em toda a estrutura.
AbstractThe Pracana dam is a 60 m high buttress structure, completed in 1951, built with a concrete mix including quartzite and granite aggregates. Since the first filling of the reservoir, an abnormal behavior has been observed, characterized by progressive vertical and horizontal displacements and intense cracking, due to RSI-RAS. The evolution of deteriorations and the insufficient capacity of the spillway led to the decision to empty the reservoir in 1980.
Between 1988 and 1992, the dam owner, EDP – Energias de Portugal, carried out major rehabilitation works, which included the waterproofing of the upstream surface with a geomembrane, the regeneration of the concrete, the construction of two alignments of concrete struts connecting the base of the buttress webs and the modernization and reinforcement of the monitoring system.
This paper presents the results of the analysis of the behavior observed since the refilling of the reservoir, in December 1992, which shows the impact of the rehabilitation works on the dam’s behavior, namely the very significant decrease in the rate of the reactions development, although of non-uniform shape throughout the structure.
Palavras-chave: Barragem de Pracana / Dano RSI-RAS / Reabilitação / / Monitorização / Avaliação estrutural.
Keywords: Pracana dam / ISR-ASR damage / Rehabilitation / Monitoring / /Structural condition

86
Structural behavior of Pracana dam 30 years after rehabilitation due to severe ISR-ASR damageJosé Piteira Gomes, Domingos Silva Matos, António Lopes Batista, José Ilídio Ferreira
rpee | Série III | n.º 15 | março de 2021
Aviso legal
As opiniões manifestadas na Revista Portuguesa de Engenharia de Estruturas são da exclusiva responsabilidade dos seus autores.
Legal notice
The views expressed in the Portuguese Journal of Structural Engineering are the sole responsibility of the authors.
GOMES, J. [et al.] – Structural behavior of Pracana dam 30 years after rehabilitation due to severe ISR-ASR damage. Revista Portuguesa de Engenharia de Estruturas. Ed. LNEC. Série III. n.º 16. ISSN 2183-8488. (março 2021) 85-94.
José Piteira Gomes
National Laboratory for Civil Engineering (LNEC)Lisbon, [email protected]
Domingos Silva Matos
EDP Gestão da Produção de Energia S.A.Porto, [email protected]
António Lopes Batista
National Laboratory for Civil Engineering (LNEC)Lisbon, [email protected]
José Ilídio Ferreira
EDP Gestão da Produção de Energia S.A.Porto, [email protected]
1 IntroductionPracana dam is a worldwide well-known case of a successful rehabilitation related with damage due to concrete swelling [1-4]. In fact, an abnormal behavior of the dam was observed since the first filling of its reservoir in 1951, characterized by progressive vertical and axial horizontal displacements (upstream-downstream direction) and extensive cracking, due to an intense ISR-ASR process, which led to empty the reservoir in 1980. The reservoir remained empty for 12 years. During this period several studies were developed, which culminated with the execution of large rehabilitation works of the dam, which take place from 1988 to 1992. This rehabilitation included the waterproofing of the upstream face by a geomembrane, the foundation and concrete dam body treatments by the grouting of cement and epoxy resins, the construction of two alignments of concrete struts to link the buttresses webs at the foundation level, one of them at the downstream toe, and the construction of a new spillway. An update of the monitoring system, including additional devices, was also implemented.
Since the refill of the reservoir in December 1992, the swelling rate declined, although not in an uniform way throughout the structure. It is therefore important to evaluate regularly the swelling evolution, as well as its possible recovery signs in different sections of the structure, and to reassess the structural safety conditions of the dam. In this context, the paper presents the most recent and relevant monitoring results and its statistical treatment, in order to assess the condition of the dam structural elements.
2 Pracana dam history
2.1 Dam’s characteristics and history
The Pracana dam is a buttress structure, 60 m high (Figure 1), founded on a rock mass of phyllite and greywacke alternations. It was completed in 1951. Quartzite and granite aggregates were used in the concrete mix. An abnormal behavior was observed since the entry into service of the dam, characterized by progressive vertical and horizontal U-D displacements, and intense cracking. Physical and chemical tests were performed, on samples taken from the dam´s body, which confirmed the existence of ISR-ASR of moderate magnitude. At the end of the eighties of the last century the reservoir remained empty for a long period, to allow large scale rehabilitation works.
Figure 1 Downstream view of Pracana dam in 1992, after the rehabilitation works
87
Structural behavior of Pracana dam 30 years after rehabilitation due to severe ISR-ASR damageJosé Piteira Gomes, Domingos Silva Matos, António Lopes Batista, José Ilídio Ferreira
rpee | Série III | n.º 15 | março de 2021
The main events related to the dam are the followings: 1948/1951 – Construction of the schemeSince 1952 – Several anomalies in the dam were detected, which
have continuously increased1971 – Restrictions to operation (limiting the reservoir level)1972/1973 – Unsuccessful repair works1977 – The scheme was owned by EDP1978 – The reservoir was emptied due to insufficient capacity
of the spillway and progressive deterioration of the dam’s structure (fast decrease of the structural safety factor)
1985 – Conclusion of the rehabilitation studies1988 – Beginning of the site works1992 – Conclusion of the civil engineering works and refilling
of the reservoir
The reservoir has been empty for 12 years (1980-1992).
2.2 Brief description of the dam’s rehabilitation
The rehabilitation investigation and design was concluded in 1985. The site works started in 1988 and have consisted of dam structural rehabilitation and the execution of complementary works, namely the construction of an auxiliary frontal spillway and the updating of the powerhouse, including the construction, in the dam body, of the intake for the new generation unit.
The structural rehabilitation of the dam included the following works: i) general treatment of concrete, to its regeneration; ii) placement of an impermeable membrane on the upstream surface, including the construction of an upstream foundation plinth; ii) construction of two sets of concrete struts for locking the buttress webs at the foundation level, one next to the downstream toe and the other in an intermediate position; and iii) consolidation of the foundation and execution of new waterproofing and drainage curtains, being the last ones executed form the top of a plinth built along the dam upstream toe. The improvement of the monitoring system was also done.
The buttress concrete regeneration was made by: i) the treatment of cracks with an opening greater than 5 mm by injection of cement stabilized grout; and ii) the mass treatment by injection of epoxy resin. The execution and control of these treatments have been supported by direct ultrasonic tests.
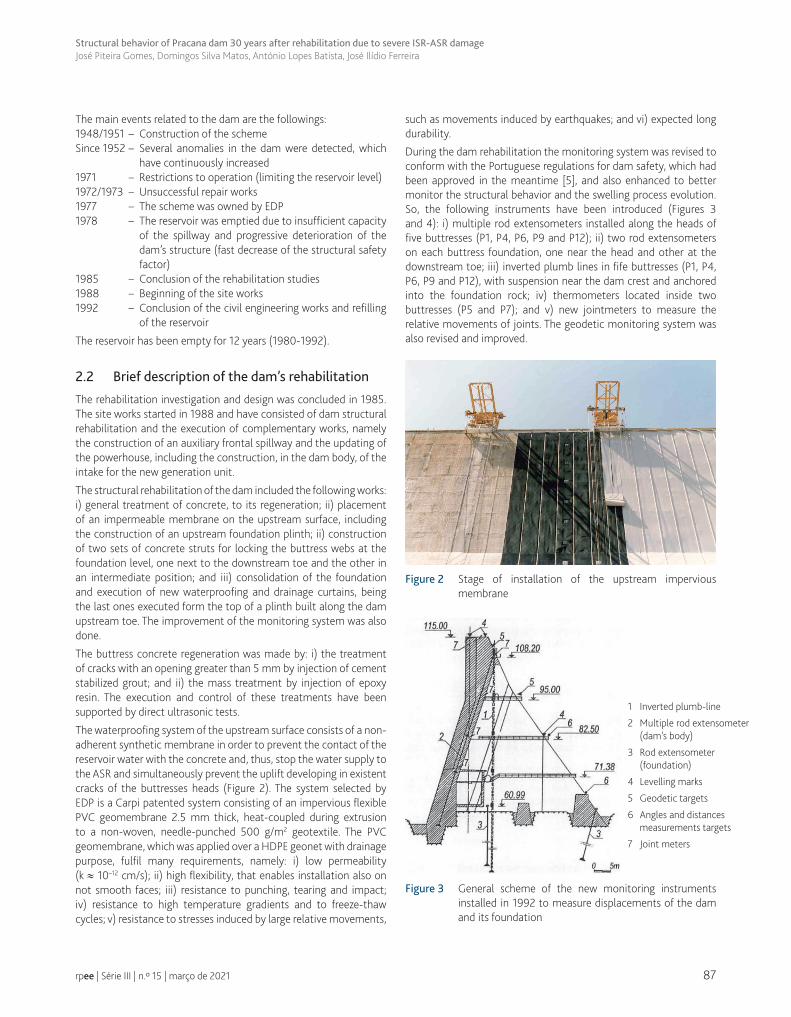
The waterproofing system of the upstream surface consists of a non-adherent synthetic membrane in order to prevent the contact of the reservoir water with the concrete and, thus, stop the water supply to the ASR and simultaneously prevent the uplift developing in existent cracks of the buttresses heads (Figure 2). The system selected by EDP is a Carpi patented system consisting of an impervious flexible PVC geomembrane 2.5 mm thick, heat-coupled during extrusion to a non-woven, needle-punched 500 g/m2 geotextile. The PVC geomembrane, which was applied over a HDPE geonet with drainage purpose, fulfil many requirements, namely: i) low permeability (k ≈ 10–12 cm/s); ii) high flexibility, that enables installation also on not smooth faces; iii) resistance to punching, tearing and impact; iv) resistance to high temperature gradients and to freeze-thaw cycles; v) resistance to stresses induced by large relative movements,
such as movements induced by earthquakes; and vi) expected long durability.
During the dam rehabilitation the monitoring system was revised to conform with the Portuguese regulations for dam safety, which had been approved in the meantime [5], and also enhanced to better monitor the structural behavior and the swelling process evolution. So, the following instruments have been introduced (Figures 3 and 4): i) multiple rod extensometers installed along the heads of five buttresses (P1, P4, P6, P9 and P12); ii) two rod extensometers on each buttress foundation, one near the head and other at the downstream toe; iii) inverted plumb lines in fife buttresses (P1, P4, P6, P9 and P12), with suspension near the dam crest and anchored into the foundation rock; iv) thermometers located inside two buttresses (P5 and P7); and v) new jointmeters to measure the relative movements of joints. The geodetic monitoring system was also revised and improved.
Figure 2 Stage of installation of the upstream impervious membrane
Figure 3 General scheme of the new monitoring instruments installed in 1992 to measure displacements of the dam and its foundation
1 Inverted plumb-line
2 Multiple rod extensometer (dam’s body)
3 Rod extensometer (foundation)
4 Levelling marks
5 Geodetic targets
6 Angles and distances measurements targets
7 Joint meters

88
Structural behavior of Pracana dam 30 years after rehabilitation due to severe ISR-ASR damageJosé Piteira Gomes, Domingos Silva Matos, António Lopes Batista, José Ilídio Ferreira
rpee | Série III | n.º 15 | março de 2021
When the dam rehabilitation works were carried out, 63 thermometers were installed inside P5 buttress, at five different elevations, and another 63 thermometers were installed inside P7 buttress with equal distribution. These instruments, installed with the purpose of characterizing the structure's response to thermal action, began to be read in May 1986, about six and a half years before the beginning of the refilling of the reservoir and although many are no longer operational, mainly in the P5 buttress, so it is only possible to extract relevant information in the P7 buttress. Thus, the average temperature of the concrete in the P7 buttress, in the period in which the reservoir was empty, was 18.6 ºC, considering the 63 thermometers, and was 17.2 ºC since the refilling (December 1992) until March 2020, considering only the 47 thermometers that continuous operational. In the upper part of the buttresses’ head, the differences reach more than 6 ºC.
3 Analysys and interpretation of the observed behavior
3.1 Statistical model adopted
The analysis and interpretation of the observed dam’s behaviour was carried out using a statistical model of quantitative interpretation of the displacements measured over time by geodetic methods, rod extensometers and plumb lines. Quantitative interpretation consists of the analysis of a behavior mathematical model by which a functional relationship is established between the quantities or effects observed and the actions that originate them. The principle of superposition is assumed, considering that the actions corresponding to hydrostatic pressures and seasonal variations in temperature cause reversible effects and that the irreversible effects, due to non-elastic phenomena, depend only on time [6]. In the statistical model, a function of the type was adopted,
( )
ntN Mi j
calc i ji j
t́ t́E h,t´,t a h b b c t d e k
−β
= =
π π= + + + + − +
∑ ∑1 2
1 1
2 2cos sin 1
365 365 (1)
where Ecalc represents the calculated response, h is the hydrostatic action usually represented by the upstream water level (when important the downstream level must also be considered), t' is the number of days since the beginning of the year and t is the number of days counted from the initial observation date. The parameters ai, b1, b2, cj, d and k are calculated by linear regression, performed by the least-squares method. N and M represent the degree of the polynomials used to represent the hydrostatic pressure and time effects, respectively, the terms in sine and cosine are intended to represent the effect of the annual thermal wave, it is considered a polynomial expression to reproduce the time effects and an exponential term is used to represent the effects of expansive action.
The differences between the values observed in the prototype and the values calculated by the statistical model are the residuals r, defined by the expression,
( ) ( )obs calr E h,t́ ,t E h,t́ ,t= − (2)
The coefficient of determination R2 of a quantitative interpretation, which assesses the significance of the regression, is expressed by the equation,
( ) ( )( )( ) ( )( )
ncal obsi
nobsobsi
E h,t́ t E h,t́ ,tR
E h,t́ t E h,t́ ,t
=
=
−= −
−
∑∑
2
2 12
1
1 (3)
where n is the number of observations and obsE (h,t́ ,t ) is the average of the observed values. Closer the value of R2 is to 1, more the model adjusts to the observed values.
3.2 Structural behavior interpretation during the first period of operation (1952-1980)
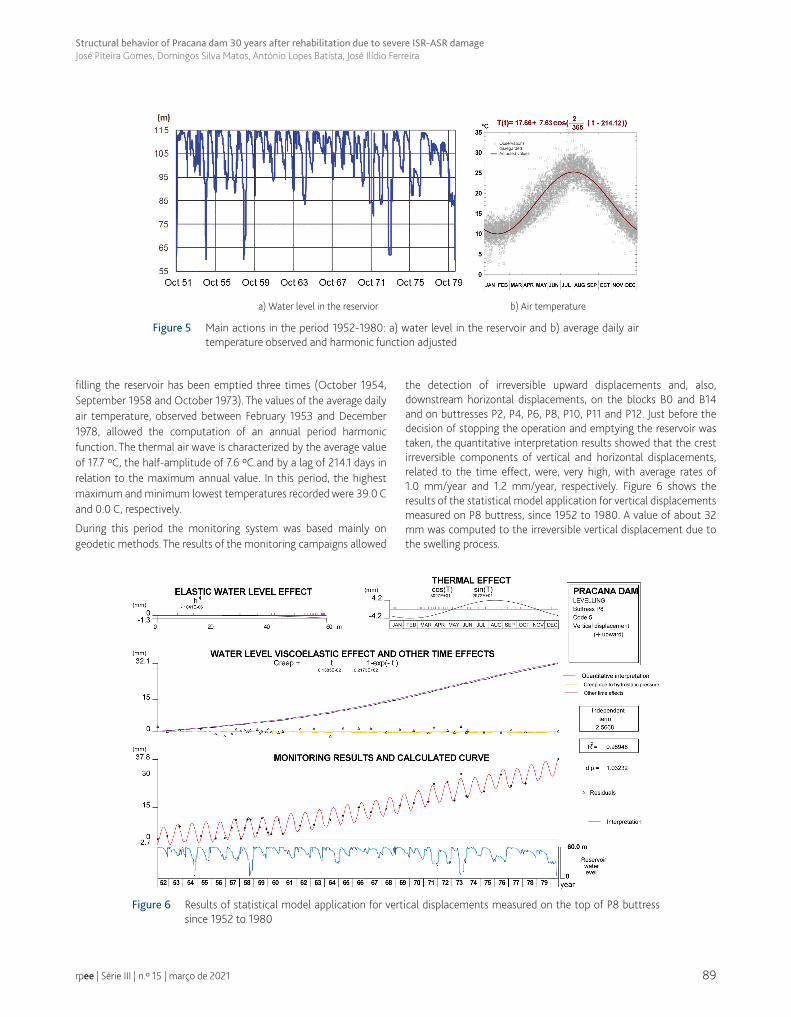
The first period of the dam’s operation started in October 1951 (first filling of the reservoir) and finished in May 1980. In Figure 5 are represented the water level in the reservoir (a) and the air temperature (b) during this period. It can be seen that after the first
Figure 4 Monitoring instruments to measure horizontal and vertical displacements of the dam’s buttresses
89
Structural behavior of Pracana dam 30 years after rehabilitation due to severe ISR-ASR damageJosé Piteira Gomes, Domingos Silva Matos, António Lopes Batista, José Ilídio Ferreira
rpee | Série III | n.º 15 | março de 2021
filling the reservoir has been emptied three times (October 1954, September 1958 and October 1973). The values of the average daily air temperature, observed between February 1953 and December 1978, allowed the computation of an annual period harmonic function. The thermal air wave is characterized by the average value of 17.7 ºC, the half-amplitude of 7.6 ºC and by a lag of 214.1 days in relation to the maximum annual value. In this period, the highest maximum and minimum lowest temperatures recorded were 39.0 C and 0.0 C, respectively.
During this period the monitoring system was based mainly on geodetic methods. The results of the monitoring campaigns allowed
the detection of irreversible upward displacements and, also, downstream horizontal displacements, on the blocks B0 and B14 and on buttresses P2, P4, P6, P8, P10, P11 and P12. Just before the decision of stopping the operation and emptying the reservoir was taken, the quantitative interpretation results showed that the crest irreversible components of vertical and horizontal displacements, related to the time effect, were, very high, with average rates of 1.0 mm/year and 1.2 mm/year, respectively. Figure 6 shows the results of the statistical model application for vertical displacements measured on P8 buttress, since 1952 to 1980. A value of about 32 mm was computed to the irreversible vertical displacement due to the swelling process.
a) Water level in the reservior b) Air temperature
Figure 5 Main actions in the period 1952-1980: a) water level in the reservoir and b) average daily air temperature observed and harmonic function adjusted
Figure 6 Results of statistical model application for vertical displacements measured on the top of P8 buttress since 1952 to 1980
90
Structural behavior of Pracana dam 30 years after rehabilitation due to severe ISR-ASR damageJosé Piteira Gomes, Domingos Silva Matos, António Lopes Batista, José Ilídio Ferreira
rpee | Série III | n.º 15 | março de 2021
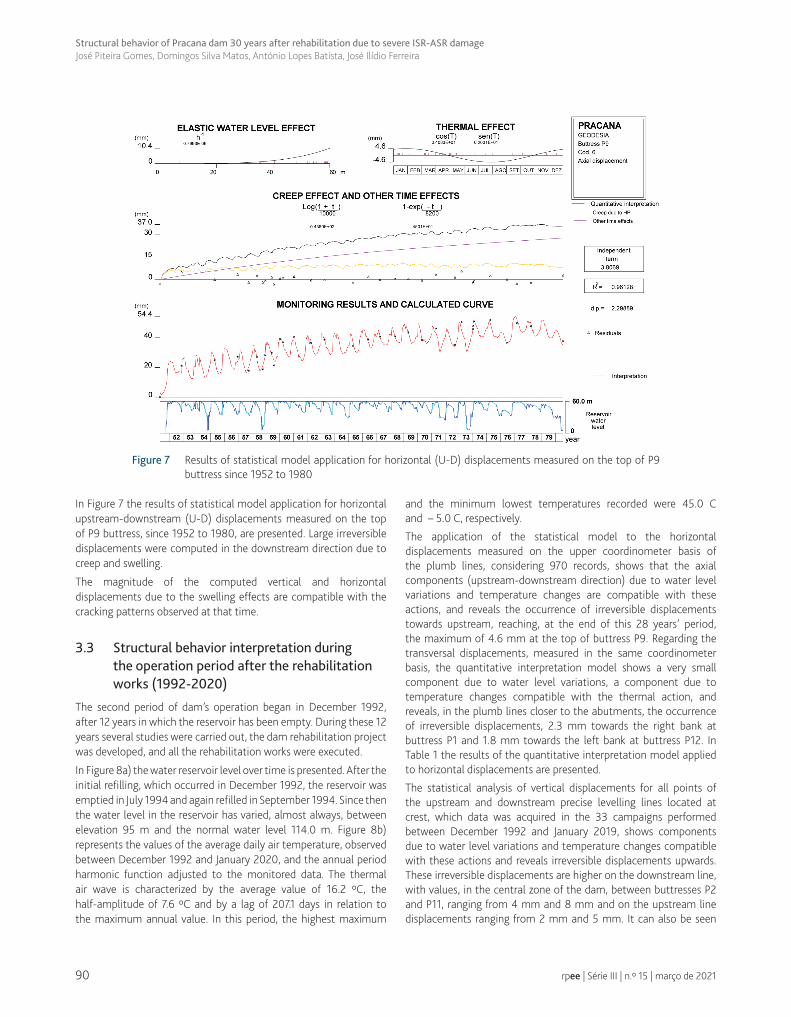
Figure 7 Results of statistical model application for horizontal (U-D) displacements measured on the top of P9 buttress since 1952 to 1980
In Figure 7 the results of statistical model application for horizontal upstream-downstream (U-D) displacements measured on the top of P9 buttress, since 1952 to 1980, are presented. Large irreversible displacements were computed in the downstream direction due to creep and swelling.
The magnitude of the computed vertical and horizontal displacements due to the swelling effects are compatible with the cracking patterns observed at that time.
3.3 Structural behavior interpretation during the operation period after the rehabilitation works (1992-2020)
The second period of dam’s operation began in December 1992, after 12 years in which the reservoir has been empty. During these 12 years several studies were carried out, the dam rehabilitation project was developed, and all the rehabilitation works were executed.
In Figure 8a) the water reservoir level over time is presented. After the initial refilling, which occurred in December 1992, the reservoir was emptied in July 1994 and again refilled in September 1994. Since then the water level in the reservoir has varied, almost always, between elevation 95 m and the normal water level 114.0 m. Figure 8b) represents the values of the average daily air temperature, observed between December 1992 and January 2020, and the annual period harmonic function adjusted to the monitored data. The thermal air wave is characterized by the average value of 16.2 ºC, the half-amplitude of 7.6 ºC and by a lag of 207.1 days in relation to the maximum annual value. In this period, the highest maximum
and the minimum lowest temperatures recorded were 45.0 C and – 5.0 C, respectively.
The application of the statistical model to the horizontal displacements measured on the upper coordinometer basis of the plumb lines, considering 970 records, shows that the axial components (upstream-downstream direction) due to water level variations and temperature changes are compatible with these actions, and reveals the occurrence of irreversible displacements towards upstream, reaching, at the end of this 28 years’ period, the maximum of 4.6 mm at the top of buttress P9. Regarding the transversal displacements, measured in the same coordinometer basis, the quantitative interpretation model shows a very small component due to water level variations, a component due to temperature changes compatible with the thermal action, and reveals, in the plumb lines closer to the abutments, the occurrence of irreversible displacements, 2.3 mm towards the right bank at buttress P1 and 1.8 mm towards the left bank at buttress P12. In Table 1 the results of the quantitative interpretation model applied to horizontal displacements are presented.
The statistical analysis of vertical displacements for all points of the upstream and downstream precise levelling lines located at crest, which data was acquired in the 33 campaigns performed between December 1992 and January 2019, shows components due to water level variations and temperature changes compatible with these actions and reveals irreversible displacements upwards. These irreversible displacements are higher on the downstream line, with values, in the central zone of the dam, between buttresses P2 and P11, ranging from 4 mm and 8 mm and on the upstream line displacements ranging from 2 mm and 5 mm. It can also be seen

91
Structural behavior of Pracana dam 30 years after rehabilitation due to severe ISR-ASR damageJosé Piteira Gomes, Domingos Silva Matos, António Lopes Batista, José Ilídio Ferreira
rpee | Série III | n.º 15 | março de 2021
that in the side blocks B1 and B0 on the right bank and B14 and B15 on the left bank the displacements are very significant. The corresponding calculated irreversible displacements correspond to vertical strain, accumulated during 27 years, that are small in the central zone of the dam, with average values below 100x10-6 and
Table 1 Main results of the quantitative interpretation model applied to horizontal displacements measured on plumb lines
Axial displacements(mm)
Transversal displacements(mm)
ButtressWatereffects
Temperatureeffects
Effectsover time
Watereffects
Temperatureeffects
Effectsover time
P1 2,2 1,0 – 4,3 0,6 1,5 – 2,3
P4 4,9 3,3 – 4,1 0,3 0,8 – 0,9
P6 5,2 4,5 – 3,8 0,0 0,1 – 0,6
P9 5,0 4,8 – 4,6 – 0,1 0,8 1,1
P12 2,3 2,4 – 3,0 – 0,5 1,5 1,8
Axial displacements toward downstream are positive.Transversal displacements toward left bank are positive.
high deformations in the side blocks, mainly on the two blocks close to the left bank, as can be seen in Figure 9.
The application of the statistical model to the displacements measured by the simple and multiple rod extensometers installed in the heads of buttresses P1, P4, P6, P9 and P12, parallel to the
a) Water level in the reservoir b) Air temperature
Figure 8 Main actions in the period 1992-2020: a) water level in the reservoir and b) average daily air temperature observed and harmonic function adjusted
a) b)
Figure 9 a) Irreversible vertical displacements on levelling marks at crest and b) accumulated vertical strains on the buttresses and side blocks

92
Structural behavior of Pracana dam 30 years after rehabilitation due to severe ISR-ASR damageJosé Piteira Gomes, Domingos Silva Matos, António Lopes Batista, José Ilídio Ferreira
rpee | Série III | n.º 15 | março de 2021
upstream face and about 4 m from that surface, with the heads of the instruments on the downstream surface of the buttresses at 110 m elevation and anchors near the foundation, show results compatible with those obtained by levelling. During this period 957 campaigns were carried out. Table 2 shows results related to the irreversible components of the displacements and respective strains, where the last column shows results obtained from levelling analysis.
The quantitative interpretation model has revealed progressive displacements for all the observed rods, showing that the swelling process has continued with upwards crest movements, registering however a small attenuation. For longer rod extensometers the time effect results are compatible to those obtained by levelling. It can also be observed that the shorter rod extensometers have higher accumulated strains.
3.4 Swelling developed before and after the dam rehabilitation
In Table 3, the results of quantitative interpretation of vertical displacements, obtained from the crest levelling before and after the dam rehabilitation, are compared. These two periods have similar duration and the results clearly show that the accumulated swelling and the expansion average annual rates are significantly lower in the second period, with exception of block B1. In all buttresses with monitored results in both periods there were reductions between 5 and 8 times and in block B14, on the left bank, there was a reduction
of 2.5 times. However, in block B1, on the right bank, there was an increase of about 40% in the annual swelling rate.
Block B15, on the left bank, is the one with the greatest irreversible deformations (it was not monitored in the first period of the dam's life).
3.5 Waterproofing geomembrane behavior
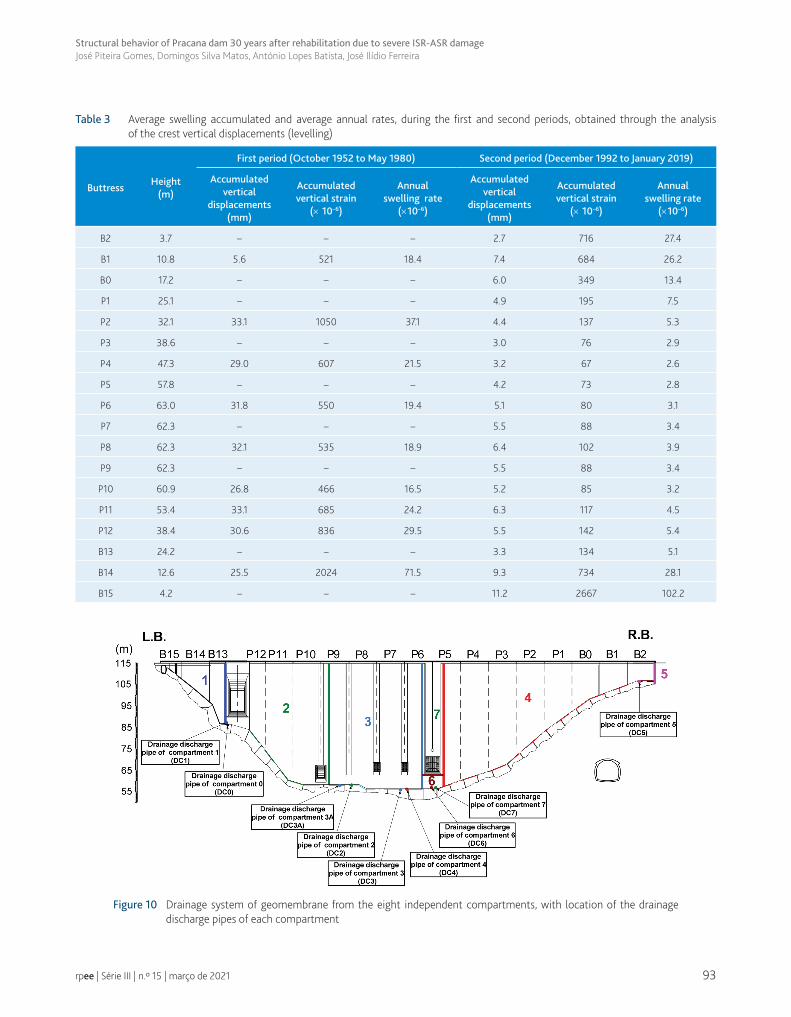
The drainage system, installed between the waterproofing system and the upstream concrete face of the dam, is divided into eight main independent compartments, as shown in Figure 10. The water collected in each compartment is conducted to drains located at the upstream face, immediately above the plinth surface, which are equipped with downstream outlets to enable the measurement of the respective discharges.
Figure 11 shows the discharges evolution in the different geomembrane drainage compartments. As can be seen, in the compartments 1 and 4, where several membrane ruptures have occurred, the discharges were higher. In compartment 1, where the most significant ruptures occurred in 2011, 2018 and very recently (December 2019), the discharges have reached maximum values of about 75 l/min. The discharges from compartment 4 had a first increase between 2000 and 2003, with maximum values of about 65 l/min, but since 2011 to 2016 the increase was higher, reaching a maximum value of 209 l/min in April 2016. In November 2016 there was a geomembrane repair intervention that drastically
Table 2 Main results of the quantitative interpretation model applied to displacements measured on rod extensometers
Buttress
Rod extensometers Levelling accumulated
strains(× 10–6)
Anchorelevation
(m)
Rodlength
(m)
Accumulated displacements
(mm)
Accumulatedstrains
P1 84 27,4 5,6 204 127-263
P4 84 27,4 3,8 139 -
P4 64 48,5 4,5 93 38-95
P6 84 27,4 5,5 201 -
P6 54 59,0 5,3 90 56-105
P9 84 27,4 5,8 212 -
P9 72 39,5 4,9 124 -
P9 54 59,0 7,0 119 56-120
P12 79 32,6 6,2 190 109-174
The shading cells corresponds to rod extensometer showing malfunction.
93
Structural behavior of Pracana dam 30 years after rehabilitation due to severe ISR-ASR damageJosé Piteira Gomes, Domingos Silva Matos, António Lopes Batista, José Ilídio Ferreira
rpee | Série III | n.º 15 | março de 2021
Table 3 Average swelling accumulated and average annual rates, during the first and second periods, obtained through the analysisof the crest vertical displacements (levelling)
ButtressHeight
(m)
First period (October 1952 to May 1980) Second period (December 1992 to January 2019)
Accumulated vertical
displacements(mm)
Accumulated vertical strain
(× 10–6)
Annualswelling rate
(×10–6)
Accumulated vertical
displacements(mm)
Accumulated vertical strain
(× 10–6)
Annualswelling rate
(×10–6)
B2 3.7 – – – 2.7 716 27.4
B1 10.8 5.6 521 18.4 7.4 684 26.2
B0 17.2 – – – 6.0 349 13.4
P1 25.1 – – – 4.9 195 7.5
P2 32.1 33.1 1050 37.1 4.4 137 5.3
P3 38.6 – – – 3.0 76 2.9
P4 47.3 29.0 607 21.5 3.2 67 2.6
P5 57.8 – – – 4.2 73 2.8
P6 63.0 31.8 550 19.4 5.1 80 3.1
P7 62.3 – – – 5.5 88 3.4
P8 62.3 32.1 535 18.9 6.4 102 3.9
P9 62.3 – – – 5.5 88 3.4
P10 60.9 26.8 466 16.5 5.2 85 3.2
P11 53.4 33.1 685 24.2 6.3 117 4.5
P12 38.4 30.6 836 29.5 5.5 142 5.4
B13 24.2 – – – 3.3 134 5.1
B14 12.6 25.5 2024 71.5 9.3 734 28.1
B15 4.2 – – – 11.2 2667 102.2
Figure 10 Drainage system of geomembrane from the eight independent compartments, with location of the drainage discharge pipes of each compartment

94
Structural behavior of Pracana dam 30 years after rehabilitation due to severe ISR-ASR damageJosé Piteira Gomes, Domingos Silva Matos, António Lopes Batista, José Ilídio Ferreira
rpee | Série III | n.º 15 | março de 2021
reduced those discharges. However, in 2019 new rips appear to have occurred.
Figure 11 Discharges evolution in the different geomembrane compartments
It should be noted that the measured values of the water level in the compartments have been systematically zero, which indicates there is no accumulated water between the geomembrane and the upstream surface of the dam, and that the compartment drains have an appropriate discharge capacity. Nevertheless, preventive actions must be taken to remove the solid material that floats in the reservoir, particularly in flooding periods, to avoid its impact on the geomembrane, which has been the cause of the rips that have occurred.
4 ConclusionThe monitoring system installed in Pracana dam indicates progressive upstream horizontal displacements and vertical upwards crest displacements. Interpretation of levelling, plumb lines and rod extensometers displacements by statistical models has shown that the swelling process, although still present, has a significant lower rate in relation to the first period of dam’s operation, before the execution of the rehabilitation works.
In the first period of operation, the average vertical accumulated strain in the central seven monitored buttresses was 680 × 10–6, corresponding to an annual swelling rate of 24 × 10–6/year. In the second period of dam’s operation the average vertical accumulated strain in the central twelve monitored buttresses was 105 × 10–6, with an annual swelling rate of 4 × 10⁻⁶/year. A swelling rate significant reduction of about six times was achieved with the rehabilitation works.
The results for the side blocks B2, B1 and B0, located on the right bank, are similar in the two periods of dam’s operation. In the first period the vertical accumulated strain of block B1 was 520 × 10–6, with an annual swelling rate of 18 × 10–6/year, and in the second period the corresponding values for the three blocks were 580 × 10–6 and 22 × 10–6/year, respectively. However, this last value is five times higher than the correspondent value computed for the central zone.
Regarding the left bank, the comparison is made considering only the block B14 because it is the only one that was monitored in both periods and also because the results obtained in the three blocks
B13, B14 and B15 are very different. Thus, in the first period vertical accumulated strain of block B14 was 2020 × 10–6, with an annual swelling rate of 72 × 10–6/year, and in the second period the average vertical accumulated strain in the same block was 730 × 10–6, with an annual swelling rate of 28 × 10–6/year. However, vertical accumulated strain of block B15 during the second period was 2670 × 10–6, with an annual swelling rate of 100 × 10–6/year. This value is about 25 times higher than the expansions in the central zone, which require further investigation and, if necessary, a medium-term intervention.
Mitigation of the swelling process proportionate by the rehabilitation works is undoubtedly a positive result to which the geomembrane installation on the upstream surface has given an important contribution. However, the long period with the reservoir emptied and the dam weather conditions, relatively warm and dry, may have also contributed to reduce the speed of the swelling process. In view of the results obtained, it is considered that the geomembrane continues to exhibit a good performance and functionality, preventing the upstream water access to the dam body. After 28 years of natural exposure, the evaluation of its physical condition must be checked frequently, which is done by carrying out visual inspections, in order to detect rips usually caused by floating woody material, especially after the occurrence of important floods. These rips are usually repaired in the following dry season.
Finally, it must be recognized that the rehabilitation of the Pracana dam is a successful case, because since that time it has been operating without limitations. However, in addition to the implemented observation plan, which includes the analysis of the monitoring data and of the visual inspections, it is advisable to perform laboratorial tests for assessing the current situation of the swelling process and to predict its evolution, in order to ensure the safety of the dam.
References
[1] Silva Matos, D.; Silva, H.; Pinho, J.; Camelo, A. (1995) – Deterioration of Pracana dam due to ASR. Main features and repair works. 2nd International Conference on Alkali Aggregate Reactions in Hydroelectric Plants and Dams, Chattanooga, Tennessee, USA, October 1995, pp 311-321.
[2] Work Group of the Portuguese National Commission on Large Dams (2003) – Ageing Process and Rehabilitation of Pracana Dam. ICOLD XXI Congress, Q. 82, R 8, Montreal, Canada, June 2003, 18 p.
[3] Work Group of the Portuguese National Commission on Large Dams (2003) – Observed Behavior and Deterioration Assessment of Pracana Dam. ICOLD XXI Congress, Q. 82, R 8, Montreal, Canada, June 2003, 21 p.
[4] Silva Matos, D.; Ferreira, I.; Camelo, A.; Piteira Gomes, J.; Scuero, A.; Vaschetti, G.; Vale, J.M. (2013) – Pracana dam 20 years after rehabilitation – Observed behaviour of the dam and its exposed geomembrane. 81st ICOLD Annual Meeting. International Symposium, Seattle, Washington, USA, August 2013, 10 p.
[5] RSB (1991) – Portuguese Regulation for Safety of Dams. Lisbon.
[6] Batista, A.L.; Mora Ramos, J.; Oliveira, S.B.; Piteira Gomes, J. (2002) – Models for safety control of concrete dams. 3th International Conference on Dam Engineering, Singapore, March 2002, 8 p