Embed Size (px)
Citation preview

1
STRUCTURAL MODIFICATION OF HUMAN CARBONIC ANHYDRASE II (HCAII) AND ITS IMPACT ON CATALYSIS
By
DAYNE MARCO WEST
A DISSERTATION PRESENTED TO THE GRADUATE SCHOOL OF THE UNIVERSITY OF FLORIDA IN PARTIAL FULFILLMENT
OF THE REQUIREMENTS FOR THE DEGREE OF DOCTOR OF PHILOSOPHY
UNIVERSITY OF FLORIDA
2012

2
© 2012 Dayne West

3
To my family

4
ACKNOWLEDGMENTS
I would first like to thank my Lord and Savior, Jesus Christ, because without him,
nothing is possible. I want to especially thank my large and supportive family. My
parents have always been proud and supportive of me. I want to thank you both for
always being one phone call away and pillars of seemingly infinite knowledge. I would
like to thank my grandmother, Senella, who has been the perfect combination of love
and truth, providing wisdom and advice that has significantly helped mold the man I am
today. Finally, to all of my aunts, uncles and cousins, your constant support and
unconditional love keeps me motivated to succeed and make you proud. I would like to
thank Dr. Fatma Helmy and the Minority Access to Research Careers (MARC) office at
Delaware State University. Being a MARC scholar, I was able to participate in very
important research an present my results at annual science meetings, where I met
recruiters for the University of Florida. I would like to thank Dr. Wayne T. McCormack
and the staff in the Biomedical Sciences Office. Dr. McCormack recommended me for
the Bridge to Doctorate Fellowship and convinced me that Gainesville was where I
belonged. I want to Valerie and Theresa: thanks for all the important little things you
have done that made my graduate life much easier to handle. I must also thank Mr.
Earl Wade, Dr. Laurence Alexander and Dr. Frierson. Being a part of the Bridge to
Doctorate program was a fulfilling and enlightening experience that has greatly
prepared me for the next phase of my research career. I would like to acknowledge
those who have closely helped me in my research. Dr. Rose Mikulski, thank you for
training and working so closely with me. Your constantly cheerful demeanor pulled me
out of multiple emotional downward spirals. To Dr. Kat Sippel, thank you for giving me
an example of what a diligent, hard-working scientist is. To Jeanne, thank you for

5
teaching me to be patient and helping me break some bad research habits. To Dr. Art
Robbins, thank you for helping me understand what it means to be a crystallographer; it
was a privilege to work with you. To all my lab mates of the past, present, and future,
we are not just a lab, but a family. I want to thank Dr. Chingkuang Tu who has helped
me on every project I have been a part of and is someone who I aspire to resemble in
the future of my scientific career. I would like to thank all of the friends I have made
while attending graduate school. I have so many memories that will stay with me
forever. I want to say thanks to Kerri, who introduced me to a world that I never knew
existed. I would like to thank the many professors and scientists I have interacted with
over the years. I appreciate the time, motivation and wisdom that you all have given
me. I would like to thank my committee members for all of their valuable advice and
dedication to ensuring my success as a young scientist. I do not believe I could have
assembled a better group of scientists. I want to recognize Dr. David Silverman. It has
been an absolute honor these four years work side by side with a scientist, and a man
of your caliber. Thank you for always being there to talk, whether it concerns research,
or life. Finally I would like to thank my mentor, Dr. Robert McKenna. I do not believe I
will ever have a mentor as amazing as you. The knowledge, time, and effort you have
put in to ensure my success is unbelievable. I look at you and see the scientist I want to
be. There are not enough words to express how much I appreciate you. Thank you Dr.
McKenna, and thank everyone who has made this achievement possible.

6
TABLE OF CONTENTS
page
ACKNOWLEDGMENTS .................................................................................................. 4
LIST OF TABLES ............................................................................................................ 9
LIST OF FIGURES ........................................................................................................ 10
ABSTRACT ................................................................................................................... 13
CHAPTER
1 INTRODUCTION .................................................................................................... 15
Carbonic Anhydrase ............................................................................................... 15 The α-CAs ........................................................................................................ 15
β-CAs ............................................................................................................... 17 The γ-CAs ........................................................................................................ 18 δ and ζ class ..................................................................................................... 19
Structure of HCAII ................................................................................................... 20 CO2 Binding Pocket .......................................................................................... 21
Hydrophilic Region/Proton Transfer ................................................................. 23
2 METHODS .............................................................................................................. 43
Site–directed Mutagenesis/Polymerase Chain Reaction ........................................ 43 PCR Process .................................................................................................... 43 PCR Reaction Materials ................................................................................... 44
DNA Transformation ......................................................................................... 44 Protein Expression .................................................................................................. 45
Affinity Chromatography/Buffer Exchange .............................................................. 46 18O Mass Spectrometry .......................................................................................... 47 Stopped–flow Spectrophotometry ........................................................................... 50
X–Ray Crystallography ........................................................................................... 50 Crystals and X–rays ......................................................................................... 51 The Unit Cell ..................................................................................................... 53
Growing Crystals .............................................................................................. 53
Data Processing ............................................................................................... 55 Phasing ............................................................................................................ 57
3 CAII AND CYANATE BINDING .............................................................................. 65
Anion Binding and Metal Substitution in HCAII ....................................................... 65 Inhibitor Coordination in Active CAs ................................................................. 65
Tetrahedral coordination ............................................................................ 66
7
Penta–coordination .................................................................................... 66
Uncoordinated binding ............................................................................... 67 NMR Experiments Promote Controversy with Cyanate Binding ....................... 67
Structural Data Promotes That Cyanate Is a Zinc–bound Ligand ..................... 67 Materials and Methods............................................................................................ 68
Expression and Purification of Mutants. ........................................................... 68 Crystallization. .................................................................................................. 68 Data Collection. ................................................................................................ 68
Structure Solution and Model Refinement. ....................................................... 69 Enzyme Titration: Inhibitor Affinity. ................................................................... 69
Results .................................................................................................................... 70 Crystal Structures ............................................................................................. 70 Inhibitor Affinity ................................................................................................. 71
Discussion .............................................................................................................. 71
4 CO2 BINDING AND CATALYTIC EFFICIENCY ...................................................... 86
The Hydrophobic Pocket ......................................................................................... 86
Materials and Methods............................................................................................ 87 Expression and Purification of Mutants. ........................................................... 87 Crystallization. .................................................................................................. 88
CO2 Binding. ..................................................................................................... 88 Data Collection. ................................................................................................ 88
Structure Solution and Model Refinement. ....................................................... 89 18O Exchange Mass Spectrometry ................................................................... 89 Stopped-Flow Spectrophotometry .................................................................... 90
Results .................................................................................................................... 90 Catalysis ........................................................................................................... 90
Crystal Structures. ............................................................................................ 91 Substrate and Product Binding in V143I HCAII ................................................ 92
Discussion .............................................................................................................. 93
5 SOLVENT NETWORK, PROTON TRANSFER AND MARCUS THEORY ........... 110
Methods ................................................................................................................ 111
Site–directed Mutagenesis ............................................................................. 111 18O-Exchange ................................................................................................. 111 Stopped-flow Spectrophotometry ................................................................... 111
Crystallography .............................................................................................. 112
Results .................................................................................................................. 113 Catalysis ......................................................................................................... 113 Crystal structures ........................................................................................... 113
Discussion ............................................................................................................ 116 Solvent Network and Proton Transfer ............................................................ 116
Marcus Theory ............................................................................................... 119

8
6 FUTURE STUDIES ............................................................................................... 137
HCAII in Environmental and Artificial Lung Research ........................................... 137 HCAII and Proton Transfer ................................................................................... 138
APPENDIX
A SEQUENCE ALIGNMENT OF MAMMALIAN CAS ............................................... 141
LIST OF REFERENCES ............................................................................................. 146
BIOGRAPHICAL SKETCH .......................................................................................... 156

9
LIST OF TABLES
Table page 1-1 Isoforms of the α class of CA .............................................................................. 26
1-2 Sequence identity for α-CAs. Values are in percentagea ................................... 27
3-1 Data and refinement statistics for cyanate bound to variants of HCAII ............... 75
3-2 Inhibition constants for cyanate bound in HCAII variantsa .................................. 76
4-1 Data processing and refinement statistics for the structures of the HCAII variants ............................................................................................................... 98
4-2 Maximal values of rate constants for the hydration of CO2 and dehydration of bicarbonate catalyzed by variants of HCAII, and related pKa values .................. 99
4-3 Steady-state constants for catalysis of the hydration of CO2 by variants of HCAII obtained by stopped-flow spectrophotometry at 25 °C and pH 8.3 ........ 100
4-4 Interatomic distances in Å for CO2 in HCAII and variants. ................................ 101
5-1 Crystal Structure Data and Refinement Statistics for N67Q and Y7F+N67Q HCAII ................................................................................................................ 124
5-2 Maximal Values of Rate Constants for Hydration of CO2 and Proton Transfer in Dehydration Catalyzed by HCAII and Variants ............................................. 125
5-3 Values of Apparent pKa Obtained by Kinetic Measurements of Catalysis by HCAII and Variants ........................................................................................... 126
5-4 Steady-state constants for the hydration of CO2 and dehydration of bicarbonate catalyzed by wild-type and Y7F-N67Q HCAIIa .............................. 127
5-5 Comparison of Distances (Å) in the Proposed hydrogen Bond Network .......... 128
5-6 Parameters of the Marcus Equation for Activation of H64G HCAII by Exogenous Proton Donors in H2O and D2O (98%)a .......................................... 131
10
LIST OF FIGURES
Figure page 1-1 Full structure of HCAII, a member of the α class of CA.. .................................... 28
1-2 Overlay of cytosolic α-CAs . ............................................................................... 29
1-3 Structure of Human Carbonic Anhydrase Related Protein (CARP) isoform VIII. ..................................................................................................................... 30
1-4 Structure of the catalytic domain of Human Carbonic Anhydrase IX, an example of a membrane associated isoform of CA. ........................................... 31
1-5 A close up of the active site ............................................................................... 32
1-6 structure of Beta Carbonic Anhydrase Cab from Methanobacterium thermoautotrophicum. . ....................................................................................... 33
1-7 Close up of the active site of β – CAs from each subclass. ................................ 34
1-8 Structure of Cam, a member of the γ – CA family. ............................................. 35
1-9 Active site of Zn and Cobalt substituted Cam.. ................................................... 36
1-10 Structure of Zn and Cd ζ – CA CDCA1.. ............................................................. 37
1-11 Stick diagram of the active site of HCAII. ........................................................... 38
1-12 Active site of wild type HCAII with substrate CO2 bound .................................... 39
1-13 Theoretical catalytic mechanism of CAII ............................................................. 40
1-14 Branched water network in the active site of wild type HCAII ............................. 41
1-15 Y7F active site structure ..................................................................................... 42
2-1 Diagram of steps involved in Polymerase Chain Reaction (PCR) ...................... 59
2-2 Site Directed Mutagenesis involves the use of PCR for synthesis of mutant DNA, followed by digestion of nonmutated parental DNA. ................................. 60
2-3 Carbonic Anhydrase catalyzed oxygen-18 exchange at chemical equilibrium. .. 61
2-4 Basic setup of a stopped-flow spectrophotometry experiment ........................... 62
2-5 Schematic diagram of Bragg’s law ..................................................................... 63
2-6 Electron Density Map of V143A .......................................................................... 64
11
3-1 HCAII in complex with bromide ........................................................................... 77
3-2 HCAII in complex with sulfite .............................................................................. 78
3-3 HCAII in complex with azide ............................................................................... 79
3-4 HCAII in complex with formate ........................................................................... 80
3-5 HCAII in complex with cyanate .......................................................................... 81
3-6 V207I HCAII in complex with cyanate ................................................................. 82
3-7 Overlay of wild type and V207I HCAII in complex with cyanate ......................... 83
3-8 Overlay of HCAII/anion complexes ..................................................................... 84
3-9 HCAII with cyanate and carbon dioxide . ............................................................ 85
4-1 pH profiles of kcatex/Keff
CO2 (μM-1s-1) for the hydration of CO2 catalyzed by variants of HCAII.. ............................................................................................ 102
4-2 pH profiles of RH2O/[E] (s-1) for the hydration of CO2 catalyzed by the following variants of HCAII................................................................................ 103
4-3 Crystal structure at the active-site of the V143I HCAII. ..................................... 104
4-4 Stick overlay of position 143 HCAII structures. ................................................. 106
4-5 Stick stereo figure of the active site of V143I HCAII CO2/bicarbonate complex.. .......................................................................................................... 107
4-6 Structure of substrate/product bound in HCAII V143I as observed in the crystal structure. ............................................................................................... 108
4-7 Comparison of HCAII V143I substrate and product binding in HCAII .............. 109
5-1 Structure of the active site of N67Q HCAII ....................................................... 129
5-2 Active-site structures for Y7FY7F-N67Q HCAII crystallized at pH 8.0 .............. 130
5-3 Activation in H2O and D2O (98%) of RH2O/[E] by 4-methylimidazole in catalysis of 18O exchange by H64G HCAII. ...................................................... 132
5-4 The dependence on pH of the rate constant catalyzed by H64G HCAII in the absence of buffer and in the presence of 100 mM 4-methylimidazole. ............. 133
5-5 Dependence on pH of kcatex /Keff
S for the hydration of CO2 catalyzed by () H64G HCAII.. .................................................................................................... 134

12
5-6 Values in H2O and D2O for kB for the activation of catalysis by H64G HCAII versus the difference in pKa values. ................................................................. 135
5-7 Values in H2O for kB for the activation of catalysis by N62L-H64A-N67L HCAII versus the difference in pKa values. ....................................................... 136
6-1 Overlay of wild type HCAII and HCAIX mimc ... ............................................... 140

13
Abstract of Dissertation Presented to the Graduate School of the University of Florida in Partial Fulfillment of the Requirements for the Degree of Doctor of Philosophy
STRUCTURAL MODIFICATION OF HUMAN CARBONIC ANHYDRASE II (HCAII) AND
ITS IMPACT ON CATALYSIS
By
Dayne Marco West
August 2012
Chair: Robert McKenna Major: Medical Sciences – Biochemistry and Molecular Biology
Human Carbonic Anhydrase II (HCAII) is a zinc metalloenzyme that catalyzes the
conversion of carbon dioxide and water to bicarbonate and a proton, a reaction
important for pH regulation, maintenance of CO2 levels and various other physiological
processes. The active site of HCAII is composed a hydrophobic region for CO2 binding
and conversion, as well as a hydrophilic region for proton transfer. Using site directed
mutagenesis, residues in the active site were altered and structural and kinetic effects
were studied. Mutations to residue V143 to isoleucine in the hydrophobic region of the
active site produced a variant with an almost 20 fold decrease in catalytic efficiency.
The structure of this variant was solved with x-ray crystallography and the appearance
of product bicarbonate was seen, an amazing occurrence highly uncommon in structural
enzymology. From these data we propose the appearance of bicarbonate is a result of
disruption in product dissociation due to steric crowding of the transition state from the
larger isoleucine. Analysis of the hydrophilic region through mutagenesis of N67 and
Y7 to glutamine and phenylalanine produced significant structural and catalytic
changes. Kinetic analysis showed that these HCAII mutants have lower pKa values and
faster proton transfer rates, specifically with double mutant Y7F/N67Q with a proton

14
transfer rate nearly ten-fold higher than wild type. These changes were supported
structurally when the crystal structure of Y7F/N67Q showed a more linear solvent
network through the weakening of hydrogen bonds, the removal of a water molecule
from the solvent network, and a shorter distance from His64, the proton shuttle of
HCAII. These results provide data indicating mutations in the active site region that can
induce drastic changes in catalytic behavior, allowing the identification and
acknowledgement of residues important for maximal activity of HCAII.

15
CHAPTER 1 INTRODUCTION
Carbonic Anhydrase
Carbonic Anhydrases (CAs) are a family of enzymes associated with various
diseases and physiological functions. The main reaction mechanism involves the highly
efficient interconversion of carbon dioxide and water into bicarbonate and protons (1).
CAs have been shown to contain an array of metal ions, like zinc, iron, cobalt and
cadmium that are necessary for enzymatic activity (2, 3, 4, 5). As a result, CAs are
referred to as metalloenzymes, and are expressed throughout various species. There
are 5 structurally unrelated classes of CA: α, β, γ, δ, and ζ (17).
The α-CAs
The α class of CAs pertains to the enzymes expressed primarily in mammals
(Figure 1-1). There are 16 isoforms of CA in this family, and are expressed in various
tissues (Table 1-1). The active isoforms in this family contain a zinc atom necessary for
catalytic activity, coordinated by three histidines and a water/hydroxide molecule. The
enzymes of this class are localized throughout the cell (6). Members that are cytosolic
include CA isoforms I-III, VII, VIII, X, XI and III (Figure 1-2). Some members of this
class are expressed in the mitochondria (CAV A&B), or membrane – associated (IV, IX,
XII, XIV and XV (in mice)). While CA IV is anchored to the membrane by a
glycophosphatidylinositol (GPI) tail, isoforms IX (Figure 1-4), XII, and XIV are
transmembrane proteins that contain an N-terminal extracellular catalytic (CA) domain,
a α-helical domain that spans the membrane, and an intracellular C-terminal domain (7,
8). There is also CA VI that is a secretory isoform expressed in saliva and mammary
glands. The various isoforms vary in structure as well as activity. Some isoforms, for

16
example CAII and CA IV are very active, with turnover rates of 106 s-1. However,
isoforms VIII, X, and XI are catalytically inactive, a result of these isoforms lacking zinc
in the active site (6, 9, 11) (Figure 1-3). These CA related proteins (CARPs) lack one
or more histidine residues to stabilize the ion. CARPs are expressed primarily in the
central nervous system (6, 12). Aside from CO2 hydration, this class of CAs has also
been heavily associated with important chemical reactions such as cyanate hydration,
aldehyde hydration and hydrolysis (13).
The α class of CA has been implicated in many important physiological functions.
CAII, the most abundant and most active isoform, is ubiquitously expressed throughout
various cells in the body including cells that make up bone, brain, kidney, eye, liver and
blood (14, 15). One of the most important functions of CA is the assistance in acid–
base homeostasis. This involves CO2 and bicarbonate transport between tissues as
well as excretion and removal.
CA related processes involving isozymes I, II and IV include facilitated CO2
removal in the pulmonary vasculature of lungs, elimination of protons and reabsorption
of bicarbonate by the kidneys (17 ) and acidification of the bone-resorbing compartment
by osteoclasts (16). Medications for glaucoma are typically inhibitors of CAII, as they
inhibit CAII from secreting bicarbonate, lowering intraocular pressure of the bicarbonate
rich aqueous humour within the eye (10). Other functions of CA include cerebrospinal
fluid formation, saliva production, gastric acid production, intestinal ion transport,
gustation and some muscle function (6, 17). Evidence of the importance of CAII is
further implicated by CAII deficiency syndrome, a disease in which the body does not
actively express CAII. People affected with this disease have suffered from renal

17
tubular acidosis, cerebral calcification and osteopetrosis. Some isozymes, like CA IX,
XII, and VIII are highly expressed in tumors, involved in tumor progression (16, 18, 19).
The reaction catalyzed by active α-CAs is a two-stage ping pong mechanism of
the reversible hydration of CO2 to bicarbonate and a proton. In the hydration direction,
the first stage is the conversion of CO2 into bicarbonate via a nucleophilic attack on CO2
by the reactive zinc-bound hydroxide. The resultant bicarbonate is then displaced from
the zinc by a water molecule (eq 1-1). To regenerate the zinc-bound hydroxide, the
active form of the enzyme, a proton transfer reaction occurs (eq 1-2) between the zinc-
bound water and external buffer (B) or solvent. The transfer of protons in and out of the
active site is typically assisted by a proton shuttle such as His64 in HCAII (20, 21).
H2O
CO2 + EZnOH- ⇌ EZnHCO3- ⇌ EZnH2O + HCO3
- (1-1)
EZnH2O + B ⇌ EZnOH- + BH+ (1-2) β-CAs
Beta CAs are expressed in prokaryotes, as well as chloroplasts in plants. In
chloroplasts, CA assists in the regulation of CO2 concentration which is important for
physiological functions in plants (22). One important role is that of photosynthesis, in
which CA operates in numerous roles. The rapid interconversion of HCO3- and CO2 by
CA permits efficient fixation for Rubisco and Phosphoenylpyruvate (PEP) carboxylase.
Rubisco converts CO2 to a usable energy source in plants, and PEP carboxylase
catalyzes the addition of HCO3- to PEP. Both carbon fixation reactions are important for
photosynthesis, and the two substrates, CO2 and bicarbonate, are products of CA. CA
also plays a role in CO2 uptake in aquatic phototrophs, as well as a specialized role of
facilitated diffusion of CO2 (22). This class of enzymes is also seen as a target for drug
18
design to prevent infection from pathogenic species of bacteria like Helicobacter pylori
and Mycobacterium tuberculosis (17).
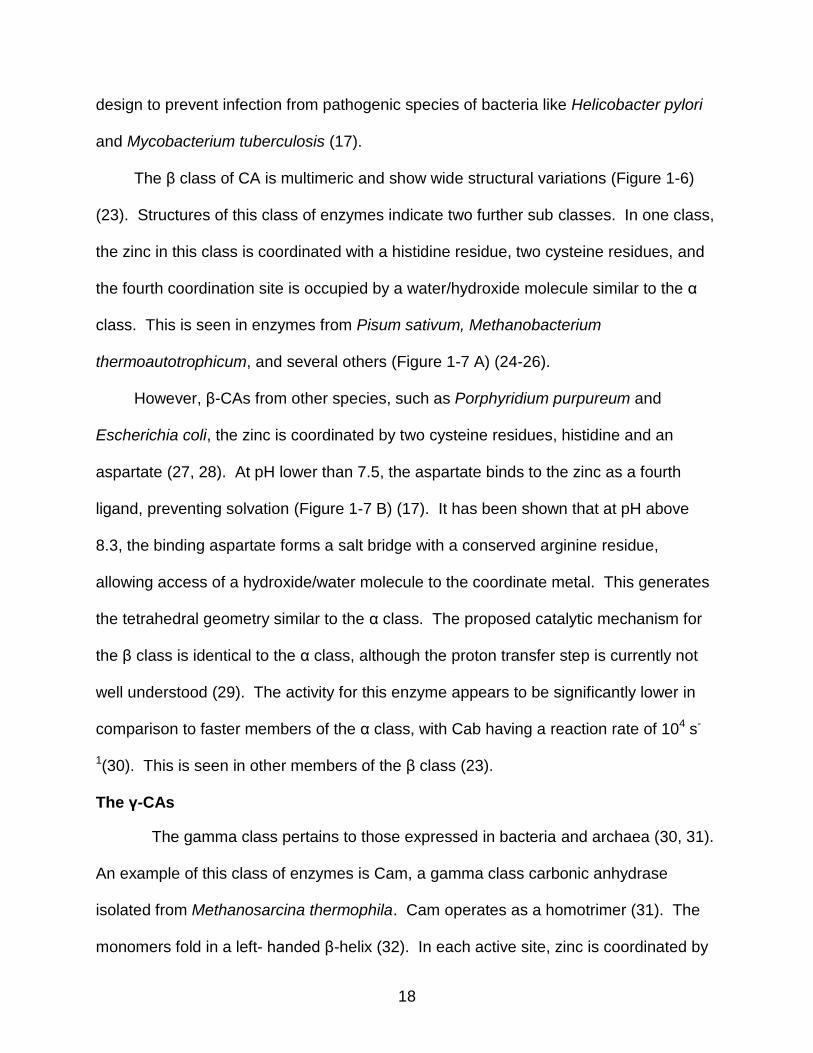
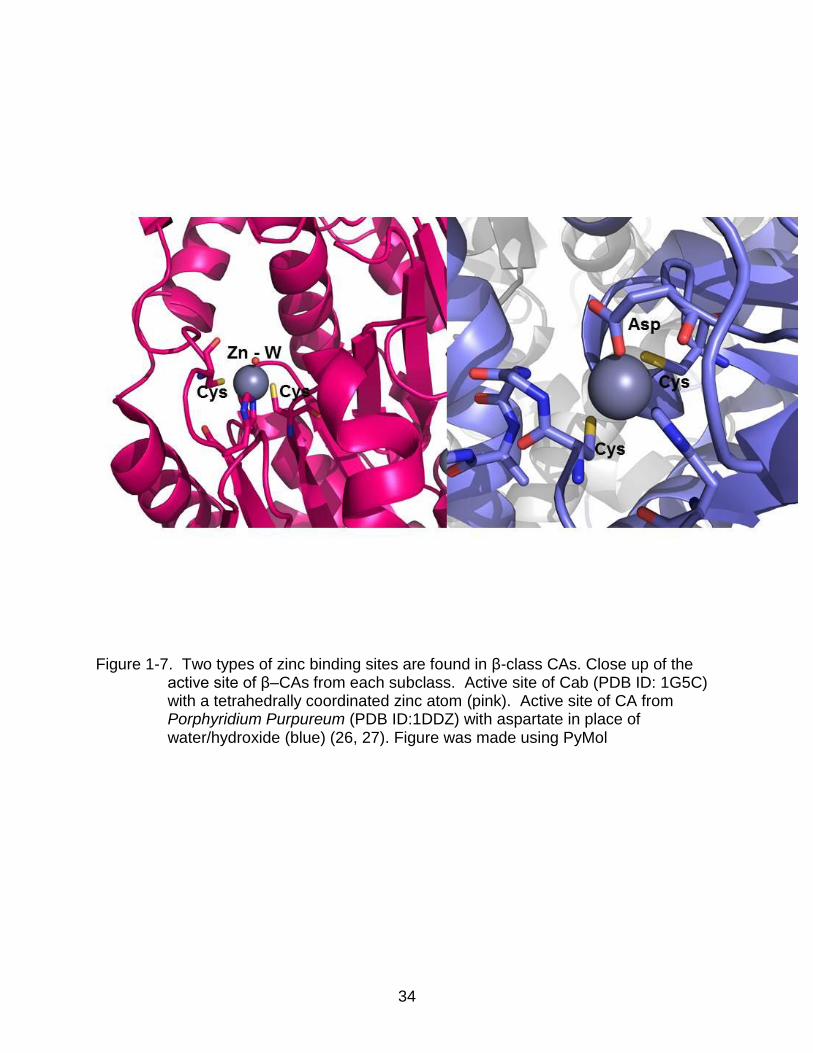
The β class of CA is multimeric and show wide structural variations (Figure 1-6)
(23). Structures of this class of enzymes indicate two further sub classes. In one class,
the zinc in this class is coordinated with a histidine residue, two cysteine residues, and
the fourth coordination site is occupied by a water/hydroxide molecule similar to the α
class. This is seen in enzymes from Pisum sativum, Methanobacterium
thermoautotrophicum, and several others (Figure 1-7 A) (24-26).
However, β-CAs from other species, such as Porphyridium purpureum and
Escherichia coli, the zinc is coordinated by two cysteine residues, histidine and an
aspartate (27, 28). At pH lower than 7.5, the aspartate binds to the zinc as a fourth
ligand, preventing solvation (Figure 1-7 B) (17). It has been shown that at pH above
8.3, the binding aspartate forms a salt bridge with a conserved arginine residue,
allowing access of a hydroxide/water molecule to the coordinate metal. This generates
the tetrahedral geometry similar to the α class. The proposed catalytic mechanism for
the β class is identical to the α class, although the proton transfer step is currently not
well understood (29). The activity for this enzyme appears to be significantly lower in
comparison to faster members of the α class, with Cab having a reaction rate of 104 s-
1(30). This is seen in other members of the β class (23).
The γ-CAs
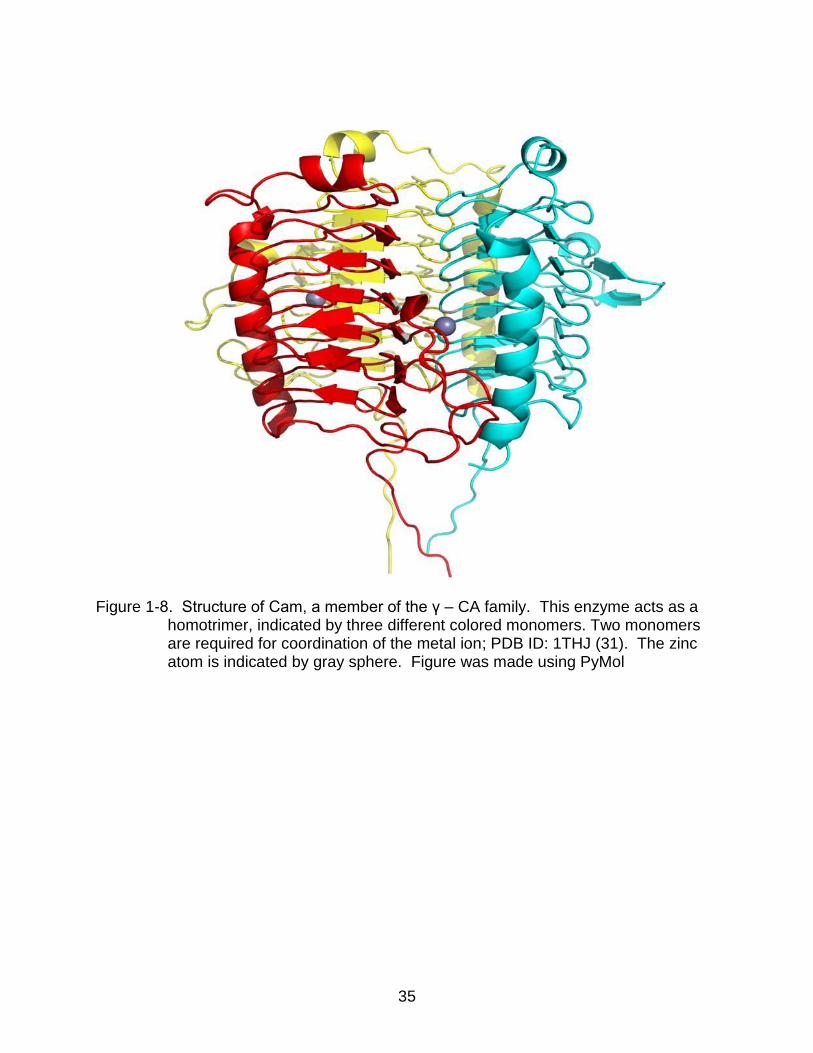
The gamma class pertains to those expressed in bacteria and archaea (30, 31).
An example of this class of enzymes is Cam, a gamma class carbonic anhydrase
isolated from Methanosarcina thermophila. Cam operates as a homotrimer (31). The
monomers fold in a left- handed β-helix (32). In each active site, zinc is coordinated by
19
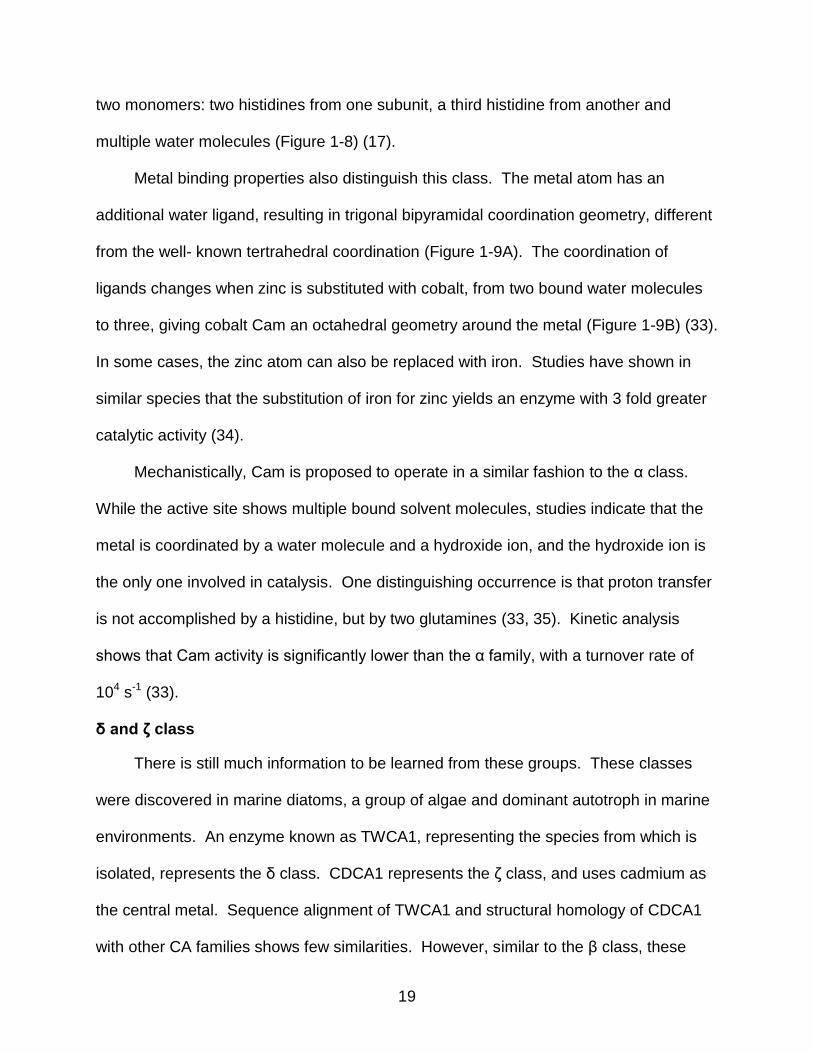
two monomers: two histidines from one subunit, a third histidine from another and
multiple water molecules (Figure 1-8) (17).
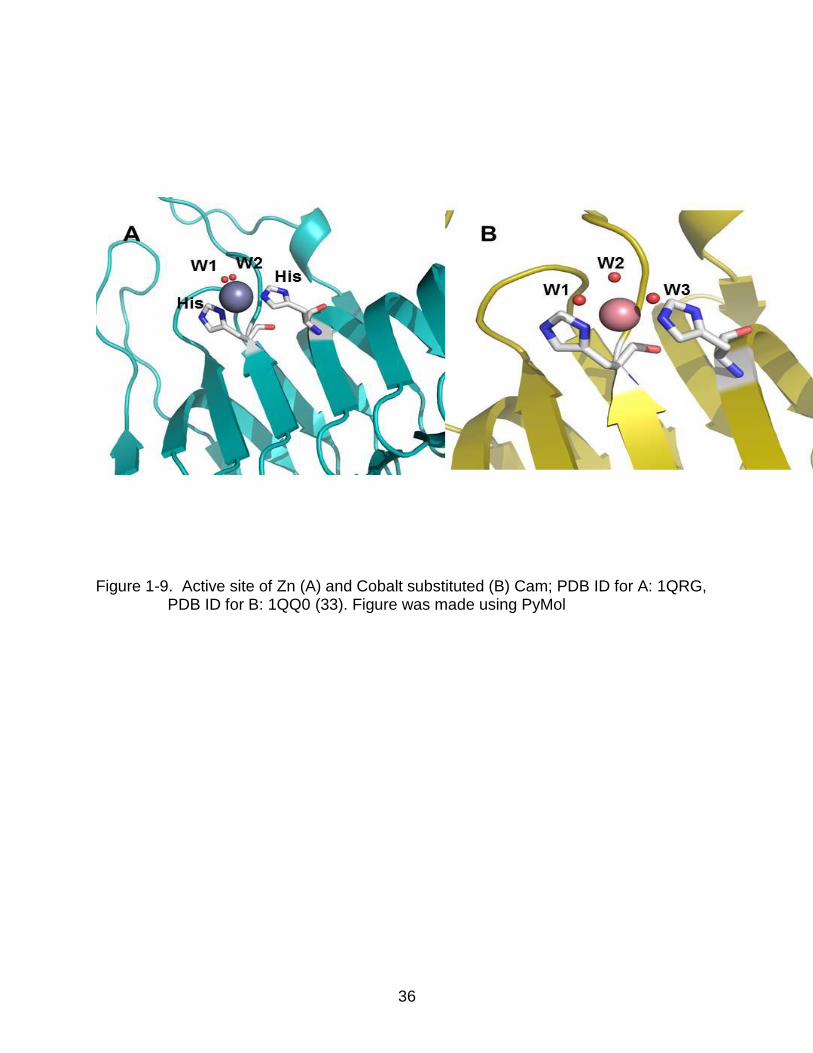
Metal binding properties also distinguish this class. The metal atom has an
additional water ligand, resulting in trigonal bipyramidal coordination geometry, different
from the well- known tertrahedral coordination (Figure 1-9A). The coordination of
ligands changes when zinc is substituted with cobalt, from two bound water molecules
to three, giving cobalt Cam an octahedral geometry around the metal (Figure 1-9B) (33).
In some cases, the zinc atom can also be replaced with iron. Studies have shown in
similar species that the substitution of iron for zinc yields an enzyme with 3 fold greater
catalytic activity (34).
Mechanistically, Cam is proposed to operate in a similar fashion to the α class.
While the active site shows multiple bound solvent molecules, studies indicate that the
metal is coordinated by a water molecule and a hydroxide ion, and the hydroxide ion is
the only one involved in catalysis. One distinguishing occurrence is that proton transfer
is not accomplished by a histidine, but by two glutamines (33, 35). Kinetic analysis
shows that Cam activity is significantly lower than the α family, with a turnover rate of
104 s-1 (33).
δ and ζ class
There is still much information to be learned from these groups. These classes
were discovered in marine diatoms, a group of algae and dominant autotroph in marine
environments. An enzyme known as TWCA1, representing the species from which is
isolated, represents the δ class. CDCA1 represents the ζ class, and uses cadmium as
the central metal. Sequence alignment of TWCA1 and structural homology of CDCA1
with other CA families shows few similarities. However, similar to the β class, these

20
classes work to produce CO2 and HCO3- for carbon fixation and photosynthesis (36,
37).
These classes also show ambiguity in regards to metal binding. Studies have
shown that TWCA1 maintains activity with zinc, or the substitution of cobalt. This is
considered an evolutionary tactic due to concentrations around 2 pM of trace metals in
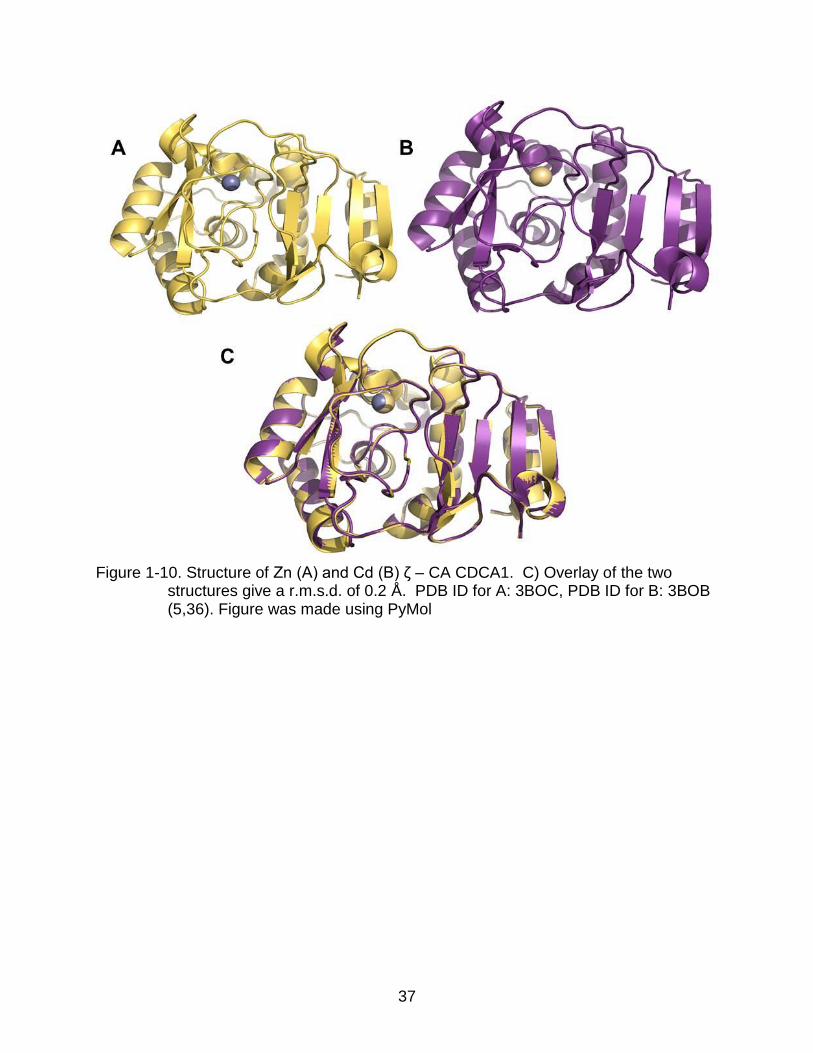
certain parts of the ocean inhabited by diatoms (36). In regards to CDCA1, it has the
ability to equally use and exchange zinc and cadmium (Figure 1-10). The activity of
CDCA1 is very high. With a kcat/Km of 8.7x10⁸M-1s-1, the catalytic efficiency closely
approaches the diffusion limit of 109M-1s-1. Although having low sequence homology,
CDCA1 superimposes over the β-CA dimer from Pisum sativum with a r.m.s.d. of 1.93 Å
over 102 Cα atoms (37).
Structure of HCAII
HCAII is a monomeric metalloenzyme 260 residues in length. The dimensions of
the enzyme are approximately 5x4x4 nm3. It can be considered a mixed α/β globular
protein. The center motif is a ten strand β twisted sheet flanked by seven α helices.
The active site is a conical cleft 15 Å deep with a zinc atom in the interior. The metal is
tetrahedral, coordinated by three histidine residues (His94, His96, His119) and a
water/hydroxyl group (1, 19, 38).
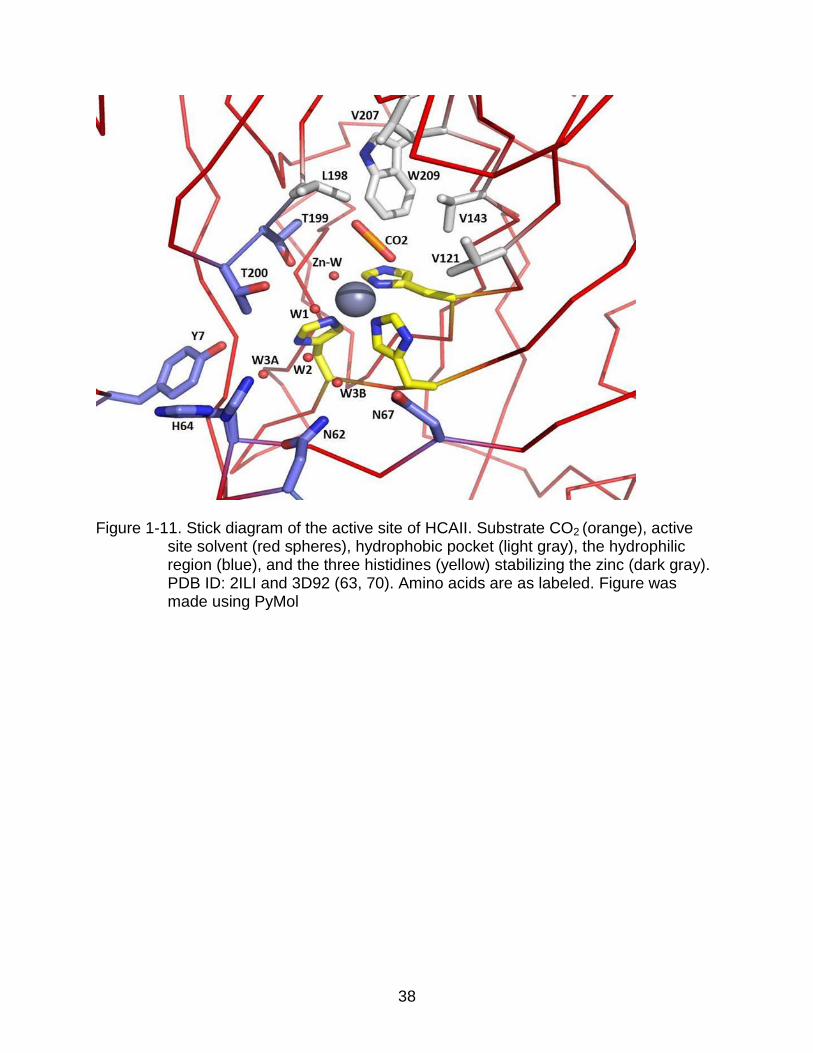
The HCAII active site is partitioned into two distinctly different surfaces on each
side of the zinc ion. On one side is a surface of nonpolar amino acids that form the
hydrophobic pocket in which CO2 positions for the hydration step. Structural studies
have mapped out the active site of HCAII and identified a water molecule in the
hydrophobic pocket 2.4 Å away from the zinc – bound hydroxide. This water molecule,
termed deep water is displaced upon binding of CO2 (38) implicating a placeholder role.

21
The other side of the active site is a region lined with hydrophilic amino acids primarily
responsible for forming the solvent network regulating the proton transfer step (Figure 1-
11). Additional structural studies have shown that the hydrophilic portion of the active
site contains a well ordered, hydrogen-bonded solvent network. This network includes
five water molecules. This network allows for movement of protons from the zinc bound
solvent to W2, placing it in close proximity to His64 for fast proton transfer (39, 97,102).
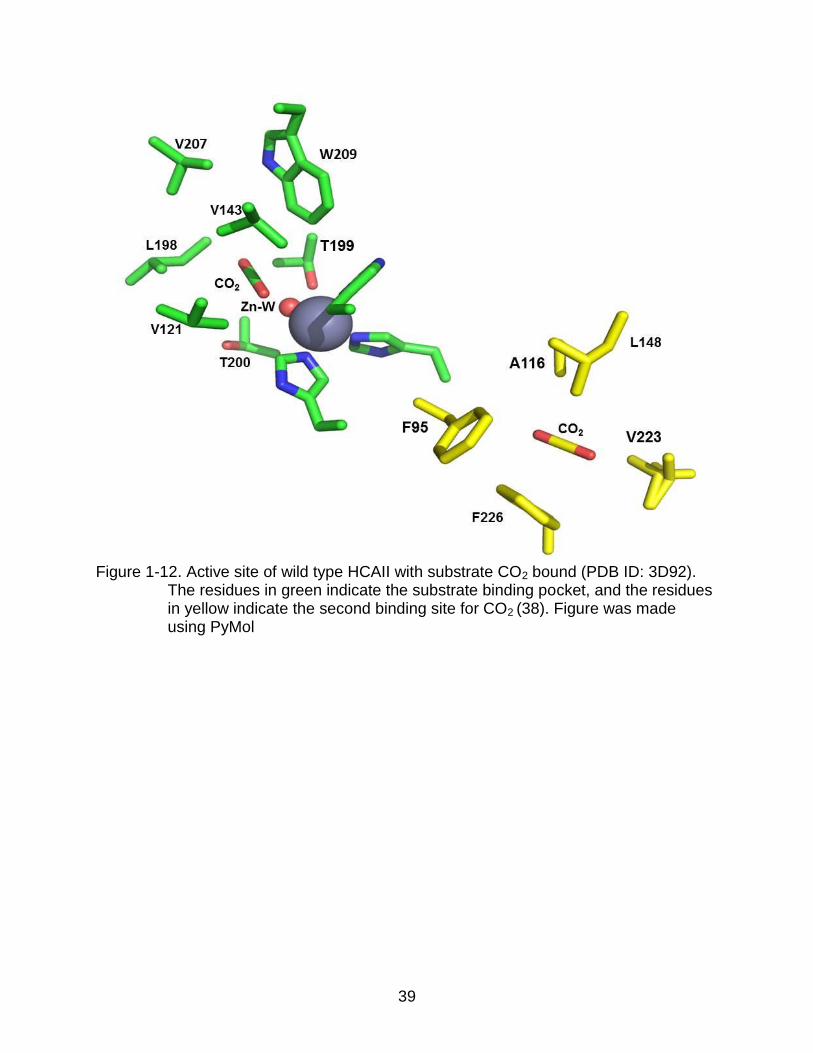
CO2 Binding Pocket
The CO2 binding pocket is composed of residues Val121, Va1143, Leu198,
Val207, the amide group of Thr199, and Trp209. Figure 1-12 shows the substrate
binding pocket as well as a secondary CO2 binding site discussed later. The
arrangement of CO2 in hydrophobic pocket is such that it places the central carbon at a
distance of 2.8 Å from the zinc-bound hydroxide. This position permits the nucleophilic
attack by the lone pair electrons of the zinc-bound hydroxyl oxygen (Figure 1-11) (1,
39). To this point, methods for accurate kinetic measurements of CO2 hydration
reactions are not available. However, much work has been done to develop theories on
the role of binding pocket residues.
Studies have shown that position 143 is very sensitive to changes in activity.
When valine is mutated to a bulky residue, such as phenylalanine or tryptophan, CO2
hydration decreases approximately 3000 fold (40). It is theorized that these mutations
introduce a bulky side chain that protrudes into the hydrophobic cavity, inhibiting proper
substrate binding. Smaller yet still significant changes also appear to provide catalytic
disturbance. The V143I mutation shows a decrease in catalytic efficiency approximately
17 fold. The reasons for this change are harder to deduce, as the increase in molecular
size is likely not significant, however structural analysis by x-ray crystallography has

22
shown that there may be a decrease in product dissociation, likely the result of
isoleucine crowding an unstable transition state. Similar tendencies are seen in
Leu143, implicating important roles for valines in CO2 conversion (41).
Another residue shown to promote changes in activity is T199. Work by Liang
shows reduction in CO2 hydration and bicarbonate dehydration to ~1% the activity of
wild type when T199 is mutated to alanine (3). When ions bind to the zinc atom, they
donate a hydrogen bond to the hydroxyl of T199. This is a result of Glu106 accepting a
hydrogen bond from the hydroxyl of T199. These two residues together are known as
the doorkeeper, a bonding network to promote stable complex formation (3). Proper
tetrahedral coordination exhibited by zinc-bound water/hydroxide is accomplished by
the stability of its hydrogen bond with T199.
X-ray crystallography has been very helpful in the analysis of ligand binding and
theoretical determinations of binding properties. The structure of HCAII with CO2 bound
in the active site has been solved structurally to high resolution. CO2 binds
approximately 2.8 Å away from the zinc bound water/hydroxide. In wild type, this linear
molecule takes a “side on” conformation with both oxygens, O1 and O2, equidistant
from the solvent. The unshared electrons are in an optimal position to react with the
CO2, producing zinc – bound bicarbonate (38, 41).
Structures of substrate bound HCAII also verify other previous notions. Merz et
al predicted using molecular dynamics that there was a second CO2 binding site (42).
Crystal structures of these complexes show that there is a second CO2 binding site.
This site is not considered a second active site, but possibly a strong hydrophobic
region that can behave like a vacuum and pull in CO2, especially under high pressure

23
conditions. This second site is also significantly further away from the active CO2
binding site, with no current implications on CO2 hydration (38, 42)
While there is significant structural data regarding CO2 binding in HCAII, a similar
claim can be made for bicarbonate. Structures of HCAII/HCO3- complexes are also
available and provide interesting structural insight. Structures of bicarbonate – bound
HCAII confirms experimental and theoretical results that bicarbonate binds directly to
zinc, implying a conversion of CO2 and zinc – bound hydroxide to zinc – bound
bicarbonate (43).
Hydrophilic Region/Proton Transfer
Carbonic anhydrase II, along with a hydrophobic region, also contains several
polar molecules in its active site. These residues are Thr199, Thr200, Tyr7, Asn62,
Asn67, and His64, and they make up the hydrophilic region of the active site. Each
residue is in proximity to form hydrogen bonds with ordered water molecules that are
also present in the active site (101). Thr199 is bonded to the zinc – bound solvent, and
this interaction stabilizes the solvent and orients the free electrons on the oxygen in a
position optimal for reaction with CO2 (44). The zinc bound solvent is also hydrogen
bonded to another water, W1, which forms a hydrogen bond with Thr200, and a second
water in the solvent chain, W2. W2 hydrogen bonds to two branched water molecules,
W3A and W3B, each of which interact with Tyr7 (W3A) and Asn62 and Asn67 (W3B
interacts with both) via hydrogen bond (Figure 1-14). Various MD simulations plotting
solvent occurrences in the active site of HCAII indicated four regions with substantially
higher occupancies than other waters. These regions correlated with the location of the
zinc-bound solvent, W1, W3a and W3b (45). This network is conserved over a wide pH
range, with waters W2, W3A and W3B located 2.6 to 3.2 Å from His64 (39). The
24
distance between the zinc-bound solvent and His64 is ~8 Å, which makes direct transfer
unfavorable. This provides merit for the idea of a water network facilitating the
movement of protons out of the active site.
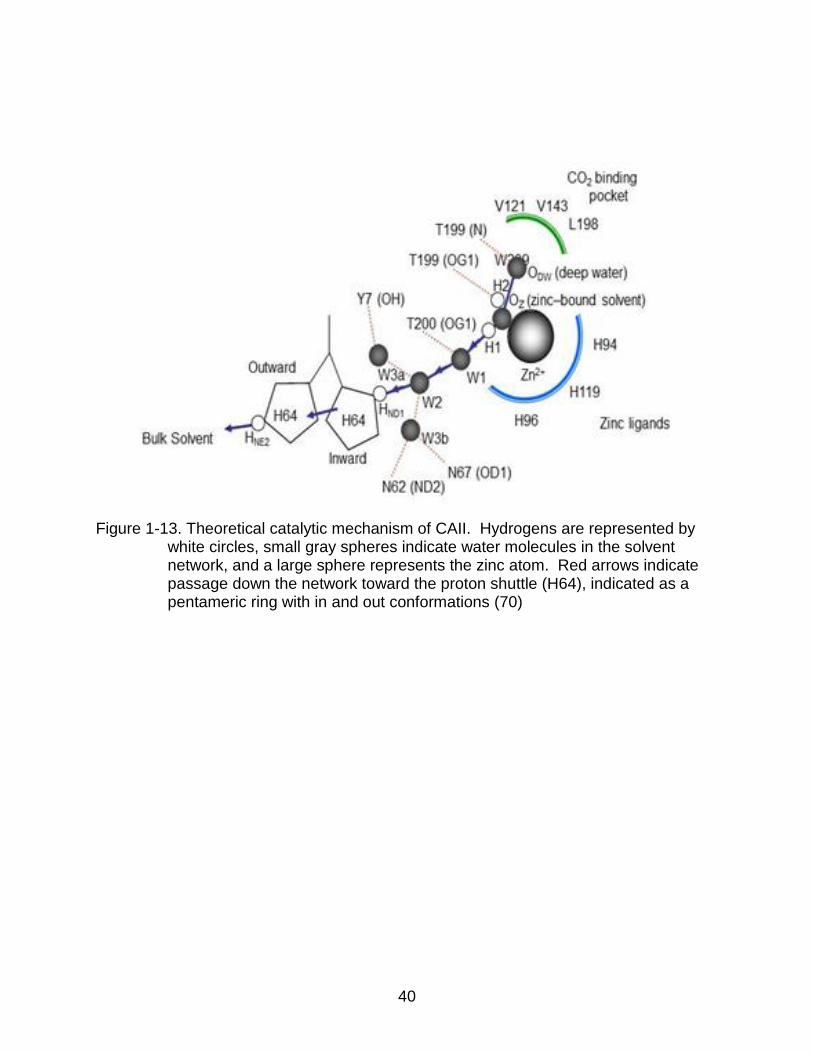
A hypothesis has been developed to incorporate the water network into the proton
transfer mechanism. It proposes that the proton travels via the water network using the
Grotthuss mechanism, in which protons descend a hydrogen bond network of solvent
molecules through covalent bonds (46). It has been postulated that the proton travels
down the solvent network forming hydronium ions, until it reaches W2 which is in close
enough proximity to transfer to His64. The proton then proceeds to bind to ND1 on the
imidazole ring of His64 and is released when the ring flips outward exposing it to the
bulk solvent. This theory is shown as a diagram in Figure 1-13.
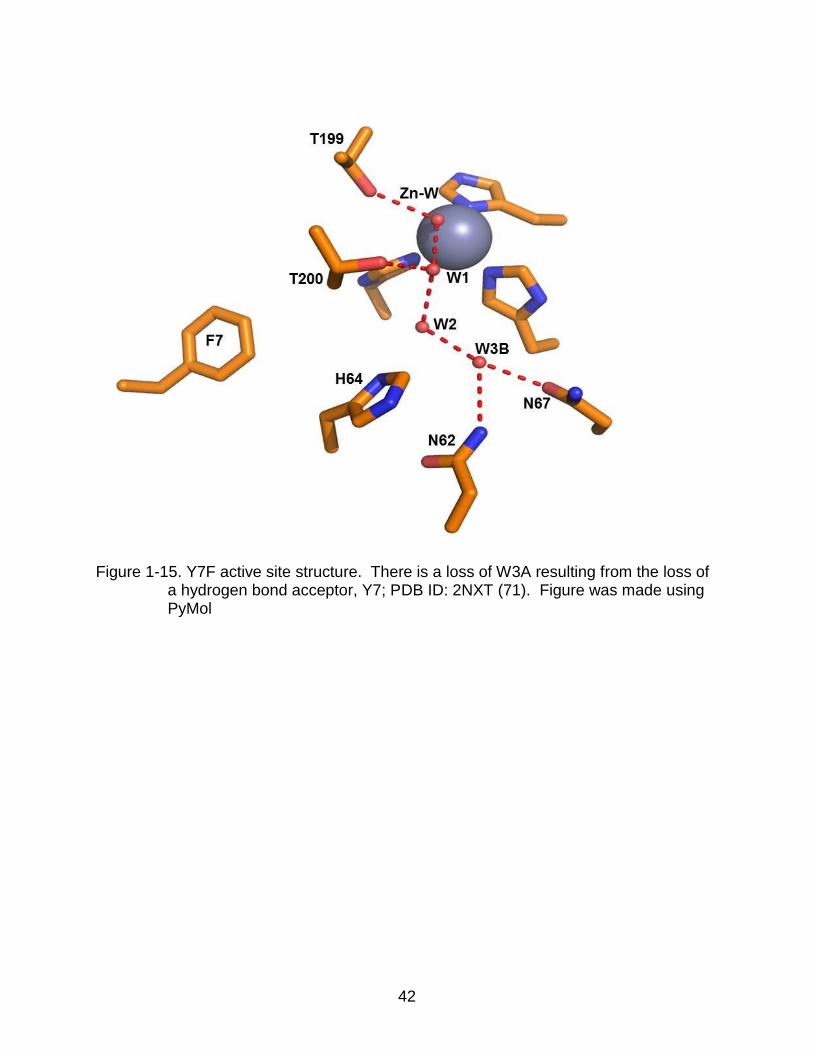
A major discovery in regards to proton transfer and an associated solvent
network arose from the development of Y7F HCAII mutant in which Tyr7 is mutated to
phenylalanine. Kinetics showed a 7-fold increase in intramolecular proton transfer. The
x-ray crystal structure shows that the Y7F mutant loses W3A from the network, likely
because of the loss of a hydroxyl group preventing hydrogen bond formation, shown in
Figure 1-15. A very strong hypothesis is that removal of the branched waters in the
solvent network increases proton transfer. Studies have shown that an unbranched
water network increases transfer as a result of loss of waters preventing formation of
H9O4+, a complex involving W2, W3A and W3B known as an Eigen cation (Figure 1-14).
Although a faster enzyme, the Y7F mutant is less stable, providing an explanation why
this enzyme is never seen in nature (1, 39).
25
Kinetic assays and site directed mutagenesis in CAII has shown that the removal
of His64 results in a 20-50 fold decrease in CA activity (47). The structure of HCAII has
been solved and illustrates that His64 has dual conformations directing the indole ring
into and out of the active site, strengthening the hypothesis that His64 flips in to accept
a proton, and out to release to bulk solvent (45). Proton transfer is rapid due to zinc-
bound hydroxide and His64 each having pKa values around 7. Studies show however
that removal of His 64 does not completely inhibit proton transfer, indicating another
possible mechanism for this reaction (48, 49). It has been shown by Duda et al. that
proton transfer can be rescued in mutants lacking His64 by various pyrimidine buffers
(50).

26
Table 1-1. Isoforms of the α class of CA
Isoform kB
(µs-1) kcat/Km
(µM-1s-1) Cellular
Localization Tissue expression
HCAI HCAII HCAIII HCAIV HCAVA HCAVB HCAVI HCAVII HCAVIII HCAIX HCAX HCAXI HCAXII HCAXIII HCAXIV mCAXV
0.2 1.4
0.01 1.1 0.3 1.0 0.3 1 -
0.4 - -
0.4 0.2 0.3 0.5
50 120 0.3 51 29 98 49 83 -
55 - -
35 11 39 33
Cytosol Cytosol Cytosol
Membrane Mitochondria Mitochondria
Saliva Cytosol Cytosol
Membrane Cytosol Cytosol
Membrane Cytosol
Membrane membrane
Erythrocytes, GI tract Erythrocytes, eye, bone,
Skeletal, adipocytes Kidney, lung, colon, heart
Liver Cardiac, skeletal, pancreas Salivary, mammary glands
CNS CNS
Tumors, GI tract CNS CNS
tumor, intestine, reproductive
Kidney, brain, lung, gut, Kidney, brain, liver
Kidney

27
Table 1-2. Sequence identity for α-CAs. Values are in percentagea
CA 1 2 3 4 5A 5B 6 7 8 9 10 11 12 13 14 15
1 61 54 29 48 48 32 51 38 30 28 26 34 59 33 31
2 58 31 54 53 32 56 38 31 30 31 33 60 34 32
3 30 46 44 30 50 34 30 27 28 33 59 32 29
4 31 30 34 31 27 31 24 22 35 30 35 35
5A 65 31 52 38 32 29 31 33 50 32 30
5B 26 47 35 30 26 26 30 49 27 28
6 33 29 39 21 21 38 32 35 31
7 36 33 27 26 36 53 32 31
8 31 26 28 29 36 25 28
9 25 25 38 32 42 34
10 52 27 28 22 21
11 25 29 24 22
12 35 46 35
13 35 33
14 31
15 aNumbers indicate specific isoform of CA. Isoform 15 is mCA15, expressed in mice.

28
Figure 1-1. Full structure of HCAII, a member of the α class of CA. The zinc atom is represented by a gray sphere 15 Å in the interior; PDB ID: 2ILI (70). Figure was made using PyMol

29
Figure 1-2. Overlay of cytosolic α – CAs HCAI (blue), HCAII (salmon, PDB ID: 2ILI),
HCAIII (red, PDB ID: 1Z93), HCAVII (green, PDB ID: 3MDZ), HCAVIII (pink, PDB ID: 2W2J), and HCAXIII (yellow, PDB ID: 3D0N). The members of the α family share a mixed α/β structural motif. R.M.S.D. values range between 0.8 and 1.5 Å. The strong overlay indicates high structural similarity among the cytosolic members. Figure was made using PyMol
30
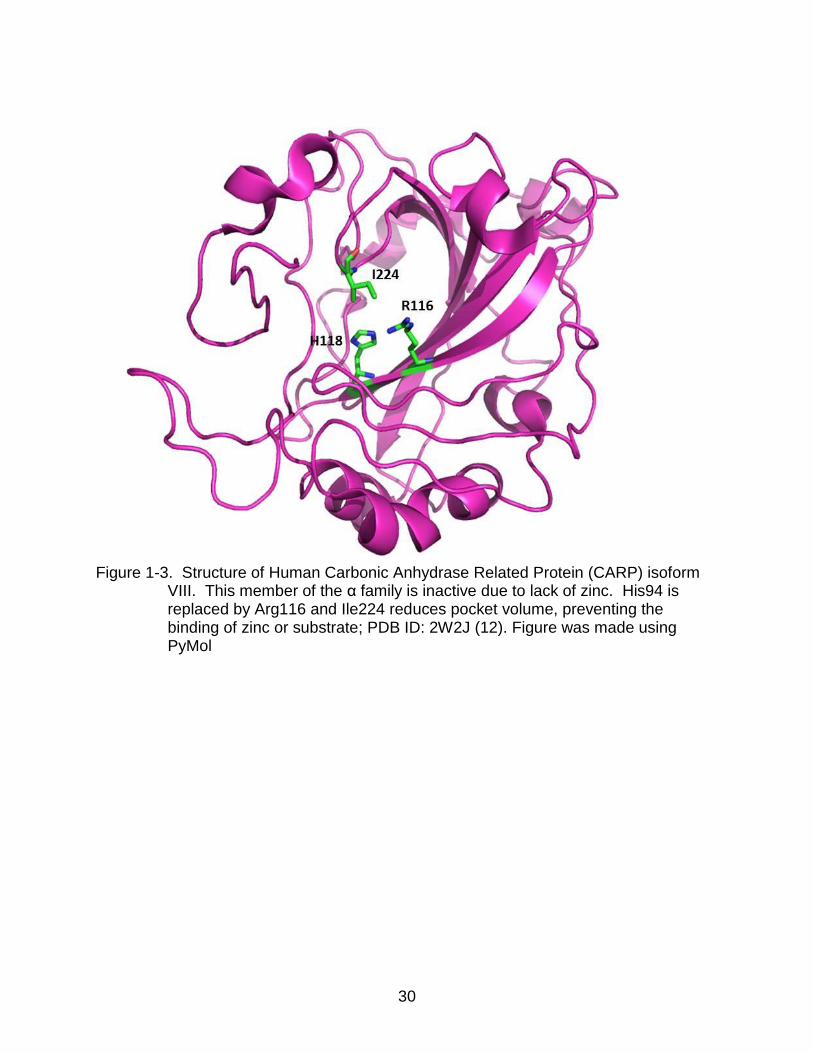
Figure 1-3. Structure of Human Carbonic Anhydrase Related Protein (CARP) isoform
VIII. This member of the α family is inactive due to lack of zinc. His94 is replaced by Arg116 and Ile224 reduces pocket volume, preventing the binding of zinc or substrate; PDB ID: 2W2J (12). Figure was made using PyMol

31
Figure 1-4. Structure of the catalytic domain of Human Carbonic Anhydrase IX, an
example of a membrane associated isoform of CA; PDB ID: 3IAI. Figure was made using PyMol

32
Figure 1-5. A close up of the active site shows three histidines that help coordinate the zinc atom (gray sphere). The active members of the α family maintain the zinc atom in the active site through tetrahedral coordination involving the zinc bound solvent and three histidines residues illustrated; PDB ID: 3IAI. Figure was made using PyMol

33
Figure 1-6. An example of a β-CA. Structure of Beta Carbonic Anhydrase Cab from
Methanobacterium thermoautotrophicum. This enzyme is composed of three dimers, with zinc atom indicated by gray spheres; PDB ID: 1G5C (26). Figure was made using PyMol
34
Figure 1-7. Two types of zinc binding sites are found in β-class CAs. Close up of the
active site of β–CAs from each subclass. Active site of Cab (PDB ID: 1G5C) with a tetrahedrally coordinated zinc atom (pink). Active site of CA from Porphyridium Purpureum (PDB ID:1DDZ) with aspartate in place of water/hydroxide (blue) (26, 27). Figure was made using PyMol
35
Figure 1-8. Structure of Cam, a member of the γ – CA family. This enzyme acts as a
homotrimer, indicated by three different colored monomers. Two monomers are required for coordination of the metal ion; PDB ID: 1THJ (31). The zinc atom is indicated by gray sphere. Figure was made using PyMol
36
Figure 1-9. Active site of Zn (A) and Cobalt substituted (B) Cam; PDB ID for A: 1QRG,
PDB ID for B: 1QQ0 (33). Figure was made using PyMol
37
Figure 1-10. Structure of Zn (A) and Cd (B) ζ – CA CDCA1. C) Overlay of the two
structures give a r.m.s.d. of 0.2 Å. PDB ID for A: 3BOC, PDB ID for B: 3BOB (5,36). Figure was made using PyMol
38
Figure 1-11. Stick diagram of the active site of HCAII. Substrate CO2 (orange), active site solvent (red spheres), hydrophobic pocket (light gray), the hydrophilic region (blue), and the three histidines (yellow) stabilizing the zinc (dark gray). PDB ID: 2ILI and 3D92 (63, 70). Amino acids are as labeled. Figure was made using PyMol
39
Figure 1-12. Active site of wild type HCAII with substrate CO2 bound (PDB ID: 3D92).
The residues in green indicate the substrate binding pocket, and the residues in yellow indicate the second binding site for CO2 (38). Figure was made using PyMol
40
Figure 1-13. Theoretical catalytic mechanism of CAII. Hydrogens are represented by
white circles, small gray spheres indicate water molecules in the solvent network, and a large sphere represents the zinc atom. Red arrows indicate passage down the network toward the proton shuttle (H64), indicated as a pentameric ring with in and out conformations (70)

41
Figure 1-14. Branched water network in the active site of wild type HCAII. The water
molecules are represented by red spheres. The dashed lines indicate distances in the range of hydrogen bond interactions (2.6 to 3.5 Å) between waters forming the theoretical solvent network for proton transfer. Water molecules W1, W2, W3A and W3B form the proposed Eigen Cation complex (1); PDB ID: 2ILI (70). Figure was made using PyMol
42
Figure 1-15. Y7F active site structure. There is a loss of W3A resulting from the loss of
a hydrogen bond acceptor, Y7; PDB ID: 2NXT (71). Figure was made using PyMol
43
CHAPTER 2 METHODS
This chapter provides details of the methods used for the presented doctoral
work. The mutagenesis were performed in conjunction with Polymerase Chain
Reaction (PCR). The kinetic data were obtained using the Stopped – Flow
Spectrophotometry and Mass Spectrometry. Finally, all structural work presented here
were the result of X- ray Crystallography.
Site–directed Mutagenesis/Polymerase Chain Reaction
Polymerase Chain Reaction (PCR) is a method of analyzing and amplifying short
sequences of DNA. Amplification of DNA sections involves the use of primers, two
small single stranded DNA sequences synthesized with the purpose of binding to the
DNA section of interest. This reaction behaves similar to those seen in nature involving
DNA replication. The reaction takes place in a thermal cycler, a machine that quickly
cycles through various temperatures for varying stages of the process (39, 51).
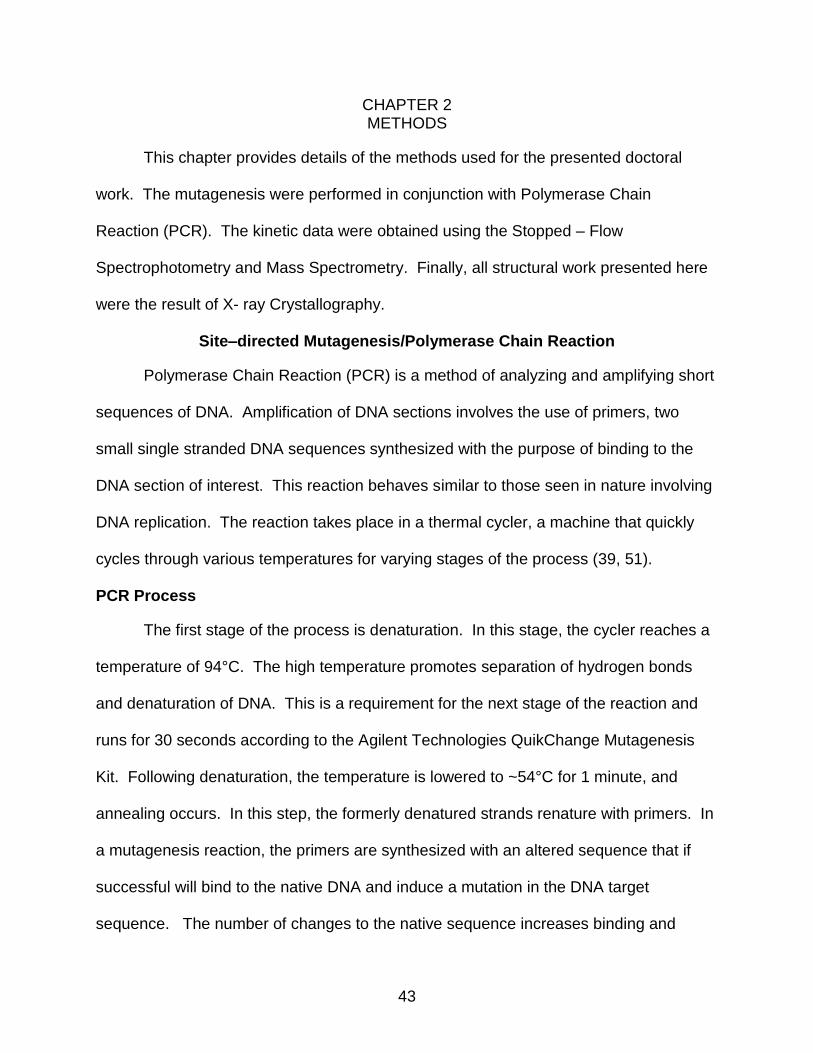
PCR Process
The first stage of the process is denaturation. In this stage, the cycler reaches a
temperature of 94°C. The high temperature promotes separation of hydrogen bonds
and denaturation of DNA. This is a requirement for the next stage of the reaction and
runs for 30 seconds according to the Agilent Technologies QuikChange Mutagenesis
Kit. Following denaturation, the temperature is lowered to ~54°C for 1 minute, and
annealing occurs. In this step, the formerly denatured strands renature with primers. In
a mutagenesis reaction, the primers are synthesized with an altered sequence that if
successful will bind to the native DNA and induce a mutation in the DNA target
sequence. The number of changes to the native sequence increases binding and

44
annealing difficulty. Following proper annealing of primers, the final step of the reaction
is elongation. In this step, the temperature is raised to 72°C, an optimal reaction
temperature for DNA polymerase. The enzyme then extends the primer sequence to
generate a new double stranded DNA molecule. This step goes for 5 minutes and
finalizes the first cycle and introduces a newly mutated DNA sequence. This process is
recycled to amplify the DNA section of interest (Figure 2-1). Following the cycles, the
PCR reaction is then incubated with DpnI, an enzyme that digests native DNA (Figure
2-2) (53, 56). All mutants were developed using the QuickChange site-directed
mutagenesis kit with reaction mixture listed below.
PCR Reaction Materials
5 μl of 10× reaction buffer
X μl (5–50 ng) of dsDNA template
X μl (125 ng) of oligonucleotide primer #1
X μl (125 ng) of oligonucleotide primer #2
1 μl of dNTP mix
ddH2O to a final volume of 50 μl
1 μl of Pfu Ultra HF DNA polymerase (2.5 U/μl) DNA Transformation
Following successful mutagenesis, the PCR reaction containing newly
synthesized DNA is transformed into cells. For this work two cell lines were used: XL1
Blue and DH5α competent cells. The first step involves the mixing of the PCR product
with the cells, and allowing incubation on ice for about 30 min. This step stiffens the
pores of the cell. Following incubation, cells are heat shocked in a 42°C water bath for
45 seconds to open the pores and permit entrance of DNA into the cell. The cells are
next placed on ice for 5 min to close the pores. To promote cell growth, media is added
to the cell mix and incubated at 37°C for 1 hour. The final step is the spreading of the
45
cell/media solution on ampicillin agar plates and incubated overnight at 37°C.
Successful transformation results in the appearance of cell colonies on the plates. Cell
colonies are then picked and mixed with LB media and incubated overnight with
agitation (a shaking incubator) to promote cell growth. Working with ampicillin resistant
plasmids, ampicillin at a concentration of 100 mg/mL is added to prevent growth of
unwanted bacteria. DNA was extracted using Eppendorf and Prime plasmid miniprep
kits (54) and sequenced by the UF Interdisciplinary Center for Biotechnology Research.
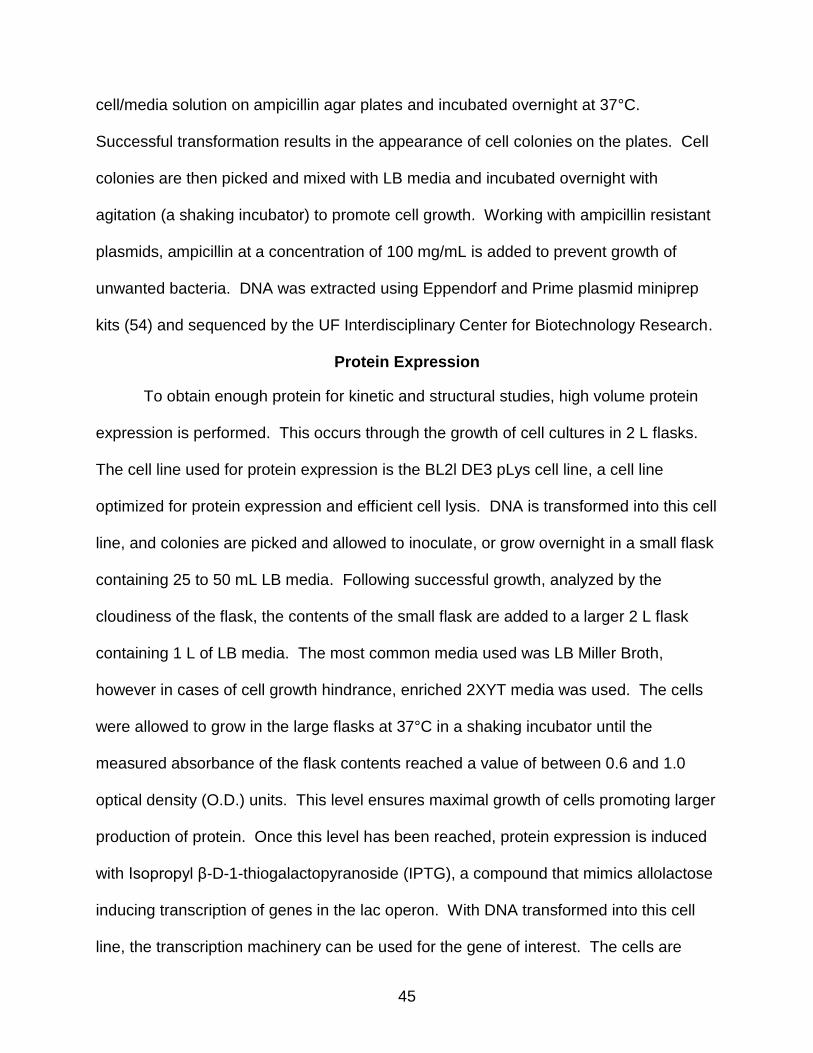
Protein Expression
To obtain enough protein for kinetic and structural studies, high volume protein
expression is performed. This occurs through the growth of cell cultures in 2 L flasks.
The cell line used for protein expression is the BL2l DE3 pLys cell line, a cell line
optimized for protein expression and efficient cell lysis. DNA is transformed into this cell
line, and colonies are picked and allowed to inoculate, or grow overnight in a small flask
containing 25 to 50 mL LB media. Following successful growth, analyzed by the
cloudiness of the flask, the contents of the small flask are added to a larger 2 L flask
containing 1 L of LB media. The most common media used was LB Miller Broth,
however in cases of cell growth hindrance, enriched 2XYT media was used. The cells
were allowed to grow in the large flasks at 37°C in a shaking incubator until the
measured absorbance of the flask contents reached a value of between 0.6 and 1.0
optical density (O.D.) units. This level ensures maximal growth of cells promoting larger
production of protein. Once this level has been reached, protein expression is induced
with Isopropyl β-D-1-thiogalactopyranoside (IPTG), a compound that mimics allolactose
inducing transcription of genes in the lac operon. With DNA transformed into this cell
line, the transcription machinery can be used for the gene of interest. The cells are
46
allowed to incubate at 37°C with agitation. The cells are finally spun down at 5000 rpm
to pellet the cells. The supernatant, or used media, is discarded and the pellets are
stored at -80°C. To extract protein, frozen pellets are mixed with buffer, lysozyme for
cell lysis and deoxyribonuclease for non-transcribed DNA degradation (55).
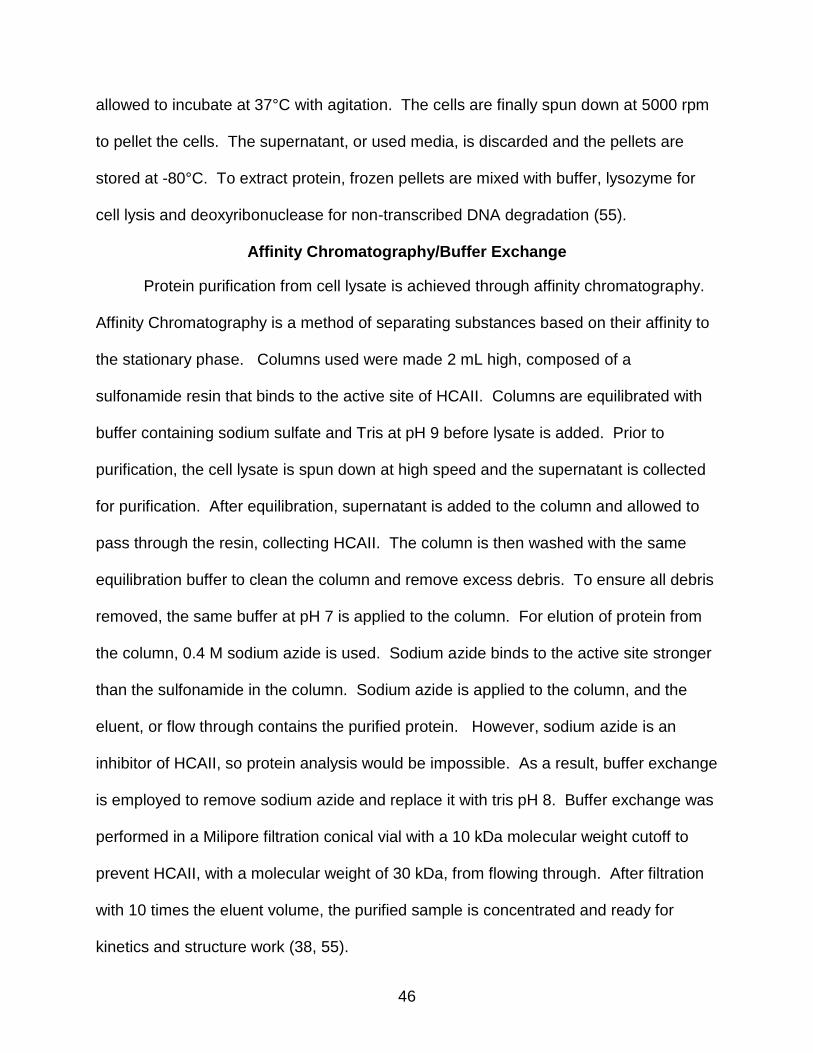
Affinity Chromatography/Buffer Exchange
Protein purification from cell lysate is achieved through affinity chromatography.
Affinity Chromatography is a method of separating substances based on their affinity to
the stationary phase. Columns used were made 2 mL high, composed of a
sulfonamide resin that binds to the active site of HCAII. Columns are equilibrated with
buffer containing sodium sulfate and Tris at pH 9 before lysate is added. Prior to
purification, the cell lysate is spun down at high speed and the supernatant is collected
for purification. After equilibration, supernatant is added to the column and allowed to
pass through the resin, collecting HCAII. The column is then washed with the same
equilibration buffer to clean the column and remove excess debris. To ensure all debris
removed, the same buffer at pH 7 is applied to the column. For elution of protein from
the column, 0.4 M sodium azide is used. Sodium azide binds to the active site stronger
than the sulfonamide in the column. Sodium azide is applied to the column, and the
eluent, or flow through contains the purified protein. However, sodium azide is an
inhibitor of HCAII, so protein analysis would be impossible. As a result, buffer exchange
is employed to remove sodium azide and replace it with tris pH 8. Buffer exchange was
performed in a Milipore filtration conical vial with a 10 kDa molecular weight cutoff to
prevent HCAII, with a molecular weight of 30 kDa, from flowing through. After filtration
with 10 times the eluent volume, the purified sample is concentrated and ready for
kinetics and structure work (38, 55).
47
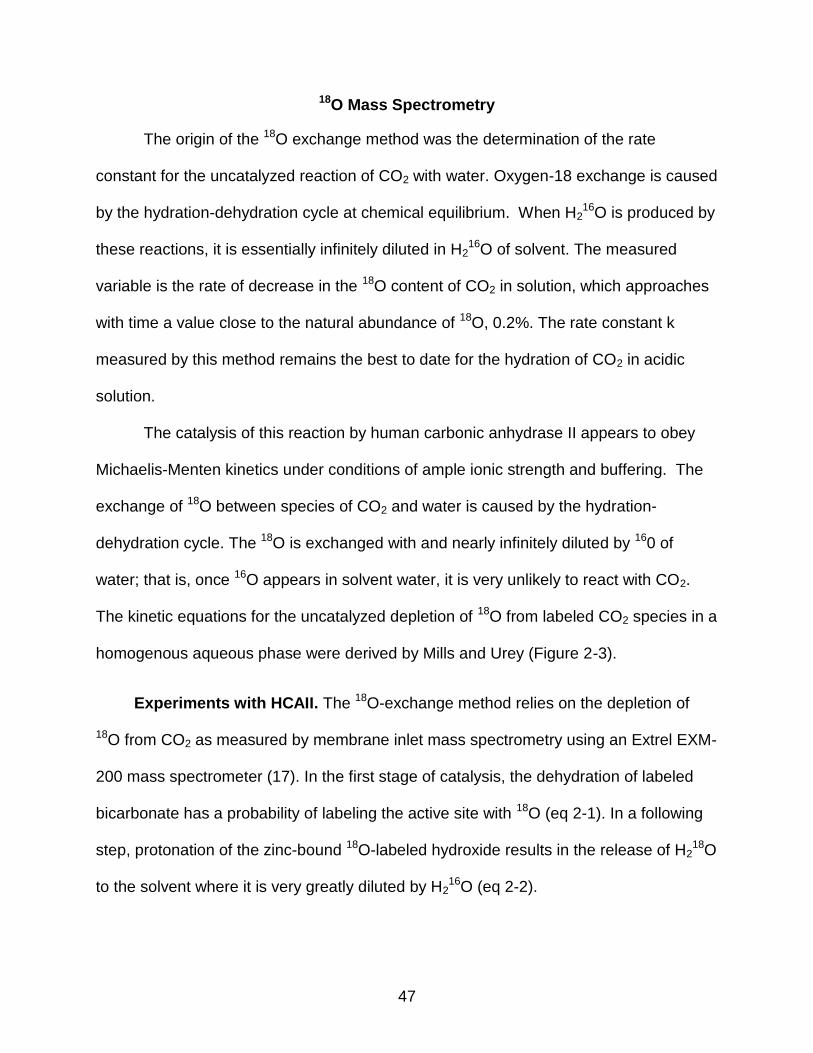
18O Mass Spectrometry
The origin of the 18O exchange method was the determination of the rate
constant for the uncatalyzed reaction of CO2 with water. Oxygen-18 exchange is caused
by the hydration-dehydration cycle at chemical equilibrium. When H216O is produced by
these reactions, it is essentially infinitely diluted in H216O of solvent. The measured
variable is the rate of decrease in the 18O content of CO2 in solution, which approaches
with time a value close to the natural abundance of 18O, 0.2%. The rate constant k
measured by this method remains the best to date for the hydration of CO2 in acidic
solution.
The catalysis of this reaction by human carbonic anhydrase II appears to obey
Michaelis-Menten kinetics under conditions of ample ionic strength and buffering. The
exchange of 18O between species of CO2 and water is caused by the hydration-
dehydration cycle. The 18O is exchanged with and nearly infinitely diluted by 160 of
water; that is, once 16O appears in solvent water, it is very unlikely to react with CO2.
The kinetic equations for the uncatalyzed depletion of 18O from labeled CO2 species in a
homogenous aqueous phase were derived by Mills and Urey (Figure 2-3).
Experiments with HCAII. The 18O-exchange method relies on the depletion of
18O from CO2 as measured by membrane inlet mass spectrometry using an Extrel EXM-
200 mass spectrometer (17). In the first stage of catalysis, the dehydration of labeled
bicarbonate has a probability of labeling the active site with 18O (eq 2-1). In a following
step, protonation of the zinc-bound 18O-labeled hydroxide results in the release of H218O
to the solvent where it is very greatly diluted by H216O (eq 2-2).

48
-H2O
HCOO18O- + EZnH2O ⇄ EZnHCOO18O- ⇄ COO + EZn18OH- (2-1)
H2O
H+His64-EZn18OH- ⇄ His64-EZnH218O → His64-EZnH2O + H2
18º (2-2)
This approach yields two rates: The R1, the rate of CO2 and HCO3-
interconversion at chemical equilibrium (eq 2-1), as shown in eq 2-3, and RH2O, the
rate of release from the enzyme of water with labeled substrate oxygen (eq 2-2).
R1/[E] = kcatexch [CO2]/( Keff
CO2 + [CO2]) (2-3)
In eq 5, kcatexch is a rate constant for maximal interconversion of CO2 and HCO3
-,
KeffCO2 represents a binding constant for the substrate to enzyme. The ratio
kcatexch/Keff
CO2 is considered equivalent in value to kcat/Km from steady state experiments,
and is a measure of the successful binding and interconversion of substrate and
product.
The second rate, RH2O, is the component of the 18O exchange that is dependent
upon the donation of protons to the 18O-labeled zinc-bound hydroxide. In such a step,
His64 is a predominant proton donor (eq 2-2) and the value of RH2O can be determined
as the rate constant for proton transfer from His64 to the zinc-bound hydroxide (48)
according eq 2-4. Here kB is the rate constant for proton transfer to the zinc-bound
hydroxide and (Ka)donor and (Ka)ZnH2O are ionization constants of the proton donor,
His64, and zinc-bound water. The least-squares determination of kinetic constants of
eqs 2-3 and 2-4 was carried out by using Enzfitter (Biosoft).
RH2O/[E] = kB/([1 + (Ka)donor /[H+]][1 + [H+]/(Ka)ZnH2O]) (2-4)
49
The uncatalyzed and carbonic-anhydrase-catalyzed exchanges of 18O between
CO2 and water at chemical equilibrium were measured in the absence of buffer (to
prevent interference from intermolecular proton transfer reaction) at a total substrate
concentration (all species of CO2) of 25 mM and 25°C.
The pH dependence of RH2O/[E] at saturating levels of exogenous proton donor is
often bell shaped consistent with the transfer of a proton from a single predominant
donor, in this case an exogenous donor, to the zinc-bound hydroxide in the dehydration
direction. In these cases the pH profile is adequately fit by eq 2-5 in which kB is a pH-
independent rate constant for proton transfer, and (Ka)donor and (Ka)ZnH2O are the
non-interacting ionization constants of the exogenous proton donor of eq 2-2 and the
zinc-bound water.
RH2O/[E] = kB/[(1 + (Ka)donor/[H+])(1 + [H+]/(Ka)ZnH2O)] (2-5)
With the addition of derivatives of imidazole and pyridine at concentrations up to
200 mM, we have observed a weak inhibition of both R1 and RH2O. This is probably
due to binding at or in the vicinity of the zinc in the manner found for the binding of
imidazole to carbonic anhydrase I (22) or 4-MI to a mutant of HCAII (23). The binding
constant Ki for this inhibition is generally greater than 100 mM, indicating weak binding
at the inhibitory site. Some exogenous donors exhibited no inhibition. In each case of
inhibition, a single value Ki described inhibition of both R1 and RH2O, as determined by
these equations: R1obs = R1/(1+[B]/Ki) and RH2Oobs = RH2O/(1+[B]/Ki). (2-6)
An Extrel EXM-200 mass spectrometer with a membrane-inlet probe (20) was
used to measure the isotopic content of CO2. Solutions contained 25 mM total
concentration of all species of CO2 unless otherwise indicated. All experiments were

50
performed at 25°C and in all experiments ionic strength was held at a minimum of 0.2 M
by addition of sodium sulfate. Several experiments were carried out in 98% D2O, and in
such cases the values of pD used were uncorrected pH meter readings. The correction
of a pH meter reading in 100% D2O [pD = (meter reading) + 0.4] is approximately offset
by the change in ionization constant of acidic groups in D2O (pKD – pKH = 0.5 ± 0.1) for
almost all acids with pK values between 3 and 10 (54, 57-59,60).
Stopped–flow Spectrophotometry
A frequently used rapid kinetics techniques is stopped-flow. Small volumes of
solutions are rapidly driven from syringes into a high efficiency mixer to initiate a fast
reaction. The resultant reaction volume then displaces the contents of an observation
cell thus filling it with freshly mixed reagents. The volume injected is limited by the stop
syringe which provides the “stopped-flow”. Just prior to stopping, a steady state flow is
achieved. The mixture entering the flow cell is only milliseconds old. The time of this
reaction volume is also known as the dead time of the stopped-flow system. As the
solution fills the stopping syringe, the plunger hits a block, causing the flow to be
stopped instantaneously. Using appropriate techniques, the kinetics of the reaction can
be measured in the cell (Figure 2-4) (61,62).
X–Ray Crystallography
X-ray crystallography is a method of macromolecular structure determination using
the arrangement of atoms within a crystal, in which a beam of X-rays strikes a crystal
and causes the beam of light to disperse into many specific directions. From the angles
and intensities of these diffracted beams, a three-dimensional picture of the density of
electrons within the crystal can be produced. From this electron density, the mean
51
positions of the atoms in the crystal can be calculated, as well as their chemical bonds,
structural disorder and other information.
In an X-ray diffraction measurement, a crystal is mounted on a goniometer and
gradually rotated while being bombarded with X-rays, producing a diffraction pattern of
regularly spaced spots known as reflections. The reflections give insight into atomic
position and wave intensity. The two-dimensional images taken at different rotations are
converted into a three-dimensional model of electron density using the mathematical
method of Fourier transforms, combined with chemical data known for the sample. Poor
resolution or even errors may result if the crystals are too small, or not uniform enough
in their internal makeup.
Crystals and X–rays
Crystals are regular arrays of atoms, and X-rays can be considered waves of
electromagnetic radiation. Atoms scatter X-ray waves, primarily through the atoms'
electrons. An X-ray striking an electron produces secondary spherical waves
emanating from the electron. This phenomenon is known as elastic scattering, and the
electron is known as the scatterer, responsible for the diffraction, or scattering of the x-
rays. A regular array of scatterers produces a regular array of spherical waves. These
waves often cancel one another out in most directions through destructive interference,
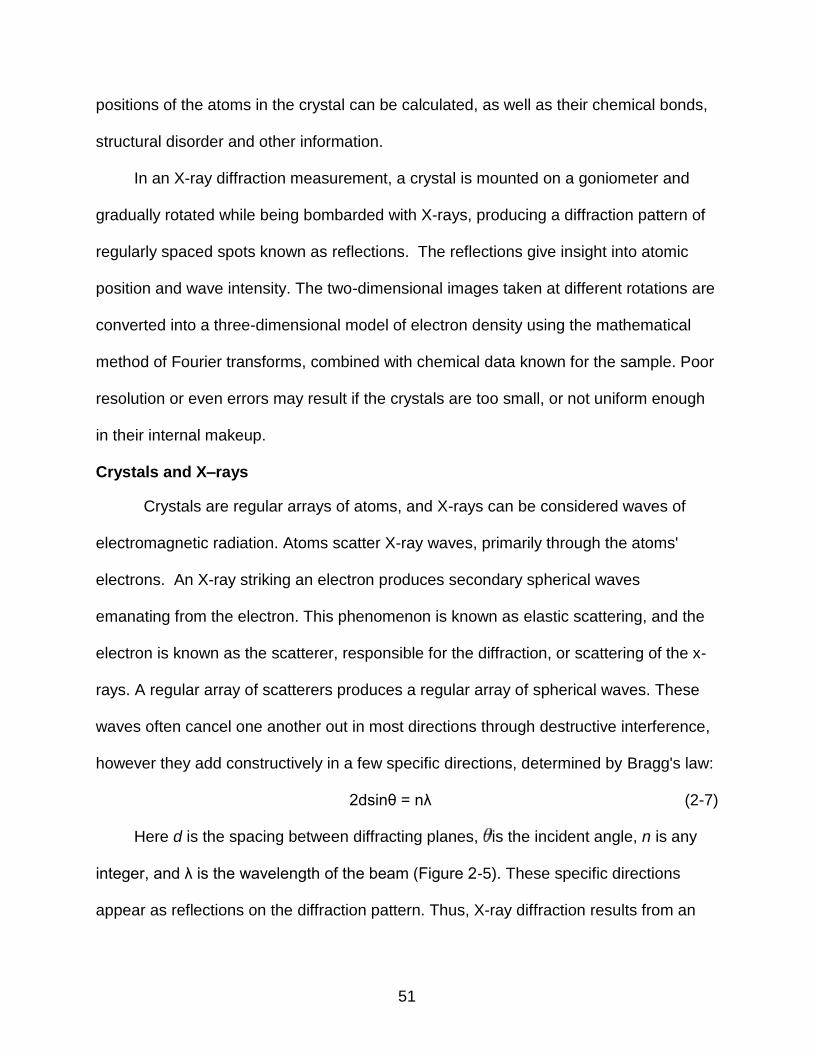
however they add constructively in a few specific directions, determined by Bragg's law:
2dsinθ = nλ (2-7)
Here d is the spacing between diffracting planes, is the incident angle, n is any
integer, and λ is the wavelength of the beam (Figure 2-5). These specific directions
appear as reflections on the diffraction pattern. Thus, X-ray diffraction results from an
52
electromagnetic wave, an x – ray, colliding with a regular array of scatterers (the
repeating arrangement of atoms within the crystal).
X-rays are used to produce the diffraction pattern because their wavelength λ is
typically the same order of magnitude as typical chemical bond lengths, allowing for
visualization, or resolution of atomic structures. The technique of single-crystal X-ray
crystallography has three basic steps: crystallization, data processing and refinement.
The first—and often most difficult—step is to obtain an adequate crystal of the
material under study. It is beneficial for the crystal to be large (typically larger than
0.1 mm in all dimensions), pure in composition and regular in structure, with no
significant internal imperfections such as cracks or twinning. A rule of thumb for optimal
crystallization success is to produce a sample of high concentration, approximately 10
mg/mL.
In the second step, the crystal is placed in an intense beam of X-rays producing a
regular pattern of reflections known as a diffraction pattern. As the crystal is gradually
rotated, previous reflections disappear and new ones appear. The intensity of every
spot is recorded at every orientation of the crystal. Multiple data sets may have to be
collected, with each set covering slightly more than half a full rotation of the crystal. The
number of images required for the final step can also vary, depending on the symmetry
of the molecule in the unit cell.
In the third step, these data are combined computationally with complementary
chemical information to produce a model of the arrangement of atoms within the crystal.
The final, refined model of the atomic arrangement is known as the crystal structure.

53
The Unit Cell
The theory of crystallography centers on the idea that a crystal contains an
ordered arrangements of molecules. To simplify mathematics, the unit cell has been
proposed. The unit cell is a philosophical box containing a single repeating unit of a
crystal. When determining a crystal structure, the structure obtained is that of the
contents of the unit cell. The idea of the unit cell has proved to be very useful in this
field in regards to data processing, calculations and data collection time.
With protein molecules containing thousands of diffracting atoms, determining
reflections becomes challenging. To further simplify the mathematics, the Miller index
system was developed. This proposes that the diffraction of a wave is the result of
collision with a theoretical plane that goes through the unit cell. These lattice planes
also go through specific atoms from where the diffraction occurs. Each reflection is
given a set of indices (H, K, and L) that denote the coordinates of lattice planes that
made that reflection.
Growing Crystals
Protein crystals are typically grown in solution. A common approach is to lower the
solubility of its component molecules gradually; if this is done too quickly, uncontrolled
aggregation and precipitation occurs. Crystal growth in solution is characterized by two
steps. The first step is the development of a crystallite, or small aggregate of protein
molecules, known as nucleation. The following step is subsequent growth into a
hopefully larger crystal. The solution conditions that favor nucleation are not always the
same conditions that favor the subsequent crystal growth. The goal is to identify
conditions that favor the development of large crystals that offers improved resolution of
the molecule. Two methods for growing crystals are the hanging drop and sitting drop

54
methods. These methods promote nucleation through vapor diffusion. If nucleation is
favored too much, small crystallites will form in the droplet, rather than one large crystal;
if favored too little, crystal formation will not occur.
Several factors are known to inhibit crystallization. The growing crystals are
generally held at a constant temperature and protected from shocks or vibrations that
might disturb their crystallization. Impurities in the molecules or in the crystallization
solutions are often detrimental to crystallization. Conformational flexibility in the
molecule also tends to make crystallization thermodynamically unfavorable. Ironically,
molecules that tend to self-assemble into regular helices are often unwilling to assemble
into crystals. Crystals can be marred by twinning, which can occur when a unit cell can
pack equally favorably in multiple orientations. The inability to crystallize a target
molecule may require a modified version of the molecule; even small changes in
molecular properties can lead to large differences in crystallization behavior. It is
important however to be cautious of the impact the modifications may have.
Another concern with crystal growth is crystal packing. Crystal packing occurs
when protein molecules approach positions or orientations resulting from the crystal
formation, not natural conformation. These unnatural orientations are known as crystal
artifacts. Protein molecules can also endure crystal contacts, in which protein
molecules interact with each other (make contact) as a result of crystal packing. When
performing crystallography in collaboration with other techniques, or when a certain
macromolecule is studied in numerous forms through crystallography, artifacts and
crystal contacts can be deduced to prevent errors in structural diagnoses.

55
Data Processing
When a crystal is exposed to an intense beam of X-rays, the electrons surrounding
the atoms of the proteins in the crystal scatter the X-rays into a pattern of reflections
that can be observed on a screen behind the crystal. The relative intensities of these
spots provide the information needed to determine the arrangement of molecules within
the crystal in atomic detail. The intensities of these reflections may be recorded with
image plates, an area detector or with a charge-coupled device (CCD) image sensor.
The peaks at small angles correspond to low-resolution data, whereas those at high
angles represent high-resolution data; thus, an upper limit on the eventual resolution of
the structure can be determined from the first few images.
One image of reflections is insufficient to determine the entire structure; it
represents only a small slice of the full Fourier transform. To collect all the necessary
information, the crystal must be rotated step-by-step through 180 degrees, with an
image recorded at every step. If the crystal has a higher symmetry, a smaller angular
range such as 90 or 45 degrees may be recorded.
The recorded series of two-dimensional diffraction patterns, each corresponding
to a different crystal orientation, is converted into a three-dimensional model of the
electron density; the conversion uses the mathematical technique of Fourier transforms,
which is explained below. Each spot corresponds to a different type of variation in the
electron density; the crystallographer must determine which variation corresponds to
which spot (indexing), the relative strengths of the spots in different images (merging
and scaling) and how the variations should be combined to yield the total electron
density (phasing).

56
Data processing begins with indexing the reflections. This means identifying the
dimensions of the unit cell and which image peak corresponds to which position in
reciprocal space. A byproduct of indexing is to determine the symmetry of the crystal,
i.e., its space group. Having assigned symmetry, the data is then integrated. This
converts the hundreds of images containing the thousands of reflections into a single
file, consisting of records of each reflection, and an intensity measurement for each
reflection. At this state the file often also includes error estimates and measures of
partiality, which is a parameter indicating reflections that were not fully recorded and
what part of a given reflection was recorded on that image.
A full data set may consist of hundreds of separate images taken at different
positions of the crystal. The objective now is to identify which peaks appear in two or
more images (merging) and to scale the relative images so that they have a consistent
intensity scale. Optimizing the intensity scale is critical because the relative intensity of
the peaks is the key information from which the structure is determined. The repetitive
technique of crystallographic data collection and the often high symmetry of crystalline
materials cause the diffractometer to record many symmetry-equivalent reflections
multiple times. This allows calculating the symmetry-related R-factor, a reliability index
based upon how similar are the measured intensities of symmetry-equivalent
reflections, thus assessing the quality of the data.
The recorded series of two-dimensional diffraction patterns, each corresponding to
a different crystal orientation, is converted into a three-dimensional model of the
electron density using the mathematical technique of Fourier transforms. Each spot
corresponds to a different type of diffracted atom, adding variation to the electron
57
density; the crystallographer must determine which atomic variation corresponds to
which spot, the relative strengths of the spots in different images and how the variations
should be combined to yield the total electron density.
Phasing
The data collected from a diffraction experiment is a reciprocal space
representation of the crystal lattice. The position of each reflection is governed by the
size and shape of the unit cell, and the inherent symmetry. The intensity of each
reflection (spot) is recorded, and this intensity is proportional to the square of the
structure factor amplitude:
I = F2 = Fexp(iαhkl) (2-8)
Here I represents the intensity, and F is the structure factor amplitude. The
structure factor is a complex number containing information relating to both the
amplitude and phase (α) of a wave. In order to obtain an interpretable electron density
map, both amplitude and phase must be known. This is vital because an electron
density map allows a crystallographer to build a starting model of the molecule. The
phase cannot be directly recorded during a diffraction experiment, so methods of
determining Initial phase estimates have been developed.
A popular method for phase determination is molecular replacement. If a related
structure is known, it can be used as a search model in molecular replacement to
determine the orientation and position of the molecules within the unit cell. The phases
obtained this way can be used to generate electron density maps:
ρ = (1/V)ΣhΣkΣl Fhkl exp(2πi(hx + ky + lz) + iϕ(hkl)) (2-9)
This equation states that the electron density ρ is a function of the unit cell volume
V the structure factor amplitude Fhkl, positions x, y, z of reflections, the phase of the

58
wave and the Miller indices of lattice planes h, k, l. Having obtained initial phases, an
initial model can be built. This model can be used to refine the phases, leading to an
improved model. Given a model of some atomic positions, these positions and their
respective B factors (temperature factors accounting for the thermal motion of the atom)
can be refined to fit the observed diffraction data, ideally yielding a better set of phases.
A new model can then be fit to the new electron density map and a further round of
refinement is carried out. This continues until the correlation between the diffraction
data and the model is maximized. The agreement is measured by an R-factor defined
as the agreement between the crystallographic template model and the x ray diffraction
data. While Rwork measures agreement between observed data and a refined
structure, a similar quality criterion is Rfree, which is calculated from a subset (~5 to
10%) of reflections that were not included in the structure refinement. Both R factors
depend on the resolution of the data. As a rule of thumb, Rfree should be approximately
the resolution in angstroms divided by 10; thus, a data-set with 1.5 Å resolution should
yield ~ 0.15 for the final Rfree value. Phase bias is a serious problem in such iterative
model building. Omit maps are a common technique used to check for this. It may not
be possible to observe every atom of the crystallized molecule. Electron density is an
average of all the molecules within the crystal, and the electron density for atoms
existing in multiple conformations is smeared to such an extent that it is no longer
detectable in the electron density map. Weakly scattering atoms such as hydrogen are
routinely invisible. An example of an electron density map around a refined model is
shown in Figure 2-6(63-65).

59
Figure 2-1. Diagram of steps involved in Polymerase Chain Reaction (PCR). Figure
made from Pulst et al (56)
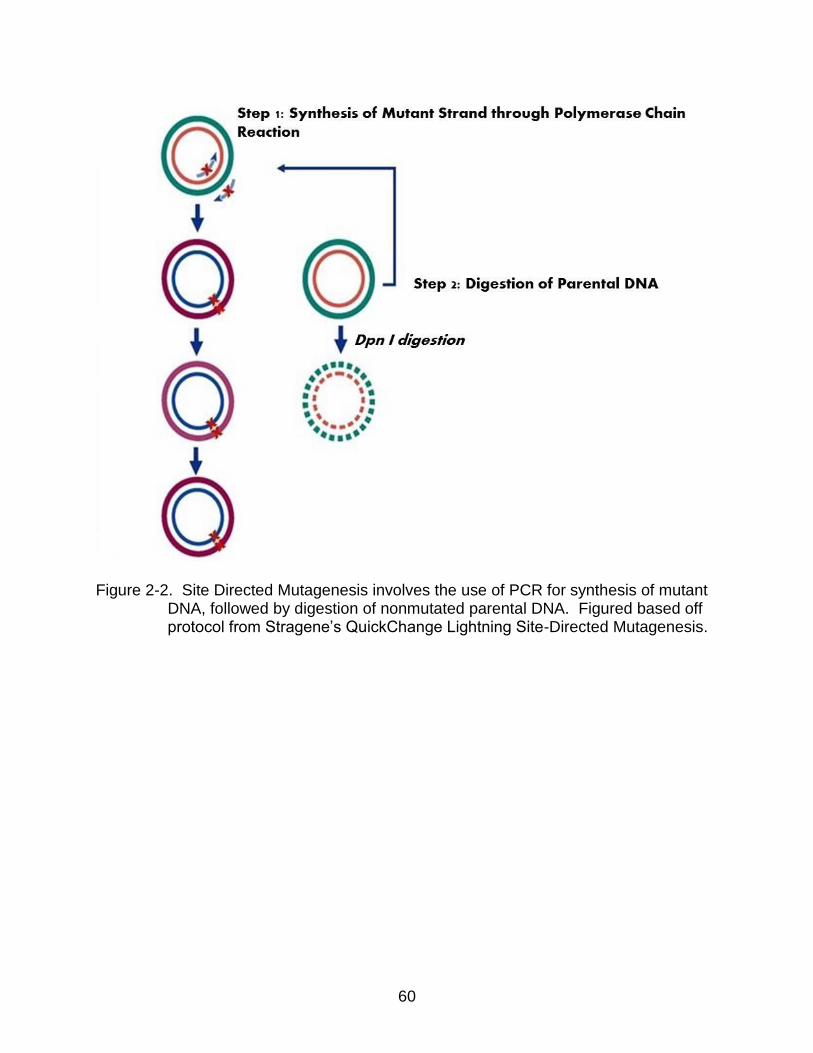
60
Figure 2-2. Site Directed Mutagenesis involves the use of PCR for synthesis of mutant DNA, followed by digestion of nonmutated parental DNA. Figured based off protocol from Stragene’s QuickChange Lightning Site-Directed Mutagenesis.

61
Figure 2-3. Carbonic Anhydrase catalyzed oxygen-18 exchange at chemical equilibrium

62
Figure 2-4. Basic setup of a stopped-flow spectrophotometry experiment. Two driving
syringes push reactants into a mixing chamber. The reaction causes an effect analyzed by the spectrometer. Figure generated from Department of Chemistry at the University of Malta. Available from http://staff.um.edu.mt/jgri1/teaching/ch237 (66)

63
Figure 2-5. Schematic diagram of Bragg’s law. The extra distance traveled by rays 2
and 3 equals a full wavelength of 1λ, and 2 full wavelengths 2λ, indicated by waves inscribed in the scatterers (spots). Thus, constructive interference occurs, resulting in a strong reflection. Figure based off of work from W.L. Bragg (67)

64
Figure 2-6. Electron Density Map of V143A. PDB ID: 3U45 (unpublished). Figure was
made using PyMol
65
CHAPTER 3 CAII AND CYANATE BINDING
Anion Binding and Metal Substitution in HCAII
The binding of anions in the active site of CA has been well studied. HCAII is
inhibited by a wide array of molecules, many of them anionic in nature (72,74). The
affinities of anions for the active site of HCAII have been attributed to their interaction
with the central metal atom. This has been shown by studies of CAII with the
substituted metals, for example CA where zinc was replaced with cobalt, manganese,
nickel, and copper, all in a +2 ionization state (3). The main reason for finding a metal to
substitute for zinc is to find a metal in which ligand binding can be studied by absorption
spectroscopy and NMR. Zinc has a very weak nuclear magnetic moment and is
diamagnetic (creates magnetic fields and repelled by externally applied magnetic
fields)(68) which would hinder many spectroscopic experiments. There are few metals
that can replace zinc in CA and yield an active enzyme. Cobalt is the only metal that
provides the enzyme with activity closest to the level of wild type (3).
Inhibitor Coordination in Active CAs
Structurally it has been shown that many CA inhibitors (CAIs) bind near the
amine group of T199 between the metal and hydrophobic region (substrate binding
pocket) of the active site (69). The hydrophobic region is essential to the binding of
substrate CO2 (40,41,70) and as a result, this site is highly conserved throughout
various isozymes and is resistant to changes in activity aside from mutations resulting in
the introduction of a charged or bulky residue (40). Similarly, it is also proposed that the
hydrophobic region is responsible for the reduction of binding and inhibition strength of
anions due to the lack of hydrogen bond interaction (71). In regards to coordination with
66
wild type HCAII, various binding modes have been observed: tetrahedral coordination,
distorted tetrahedral coordination, penta-coordination, and competitive binding
(inhibition without binding to the metal, but near the vicinity of substrate binding) (3).
Tetrahedral coordination
Tetrahedral coordination is seen in CAII involving the three stabilizing histidines
and a zinc-bound solvent (Chapter 1). Anions known for this coordination are
sulfonamides, a well-known class of CAIs. Single atom anions, including iodide and
bromide, illustrated in Figure 3-1, show similar coordination. Another class is sulfites (3)
as well as substrate bicarbonate (43). The protonated oxygen (the hydroxyl group) of
sulfites and acetate (Figure 3-2) bind in the same position as the amine group in
sulfonamides: hydrogen bonded to T199.
Studies show that azide binds to the zinc tetrahedrally in HCAII (72), but with a
distorted conformation (Figure 3-3). This leads to the other binding mode: distorted
tetra – coordination. There are cases in which anions are unable to donate hydrogen
bonds to T199. This means that they are only able to bind to the metal, leading to a
distorted position. They are also able to displace the deep water molecule and occupy
the hydrophobic cavity. The anions that promote this type of binding are likely high in
polarity (3).
Penta-coordination
This coordination is seen occasionally with zinc and frequently with Co-CAs. In
this binding mode, the anion typically contains a carboxyl group that can accept a
hydrogen bond from the amine group of T199, while the carboxyl oxygen of T199 binds
closely to the metal bound water. The position of the zinc-bound solvent is moved
almost 1 Å from its natural position, resulting in both the zinc-bound water and inhibitor

67
“coordinated” simultaneously to the zinc, resulting in 5 bonds on the zinc atom. HCAII
in complex with formate forms a penta-coordinated complex (Figure 3-4) (3, 23, 74).
Uncoordinated binding
This is the binding mode for anions that have a very weak affinity for the zinc
atom, or any coordinated metal in the active site. They still bind in the hydrophobic
region of the active site but do not perturb the tetra-coordination or displace the zinc-
bound water. However, they typically can form hydrogen bonds with T199. Examples
of these inhibitors include nitrate (74), cyanide, and cyanate (75), an anion which will be
discussed in further detail.
NMR Experiments Promote Controversy with Cyanate Binding
NMR experiments on cobalt substituted and wild type CA have been used to
study binding affinity of anions (76,77). In studies with bovine CAII, NMR spectra
suggest that cyanate and cyanide bind to the zinc atom forming a tetrahedral complex,
thereby replacing the water molecule. Similar attempts with cyanide and cyanate were
performed when crystal structures showed that these anions do not bind directly to the
zinc . These spectra indicate tetrahedral adduct formation of cyanate and cyanide,
even in isotopic and natural zinc CA (3).
Structural Data Promotes That Cyanate Is a Zinc–bound Ligand
The work presented here outlines the behavior of cyanate in the active site of
(HCAII). Results presented focus on HCAII crystal structures wtHCAII and V207I
HCAII, each enzyme with cyanate bound in the active site. Affinity measurements for
these two mutants as well as V143I, a mutation known to impact binding in the
hydrophobic patch of the active site, are presented. The results show that cyanate can
in fact act as an inhibitor binding directly to the zinc in place of zinc bound solvent for

68
both structures. Affinity constant measurements show similar binding affinity for
wtHCAII and V207I HCAII, and a decrease for V143I HCAII. This data provides
powerful insight into cyanate as an inhibitor for HCAII. Comparisons with other
structures containing anions in various conformations are made to further illustrate the
position and coordination of cyanate as well draw possible explanations to the
inconsistency of various binding studies, and the possibility of multiple coordination
states. These data will hopefully shed light on the binding behavior of cyanate, and
possibly similar anions.
Materials and Methods
Expression and Purification of Mutants.
Please see Chapter 2 sections Site-Directed Mutagenesis, Protein Expression,
and Affinity Chromatography for more information.
Crystallization.
Crystals of the HCAII mutants were obtained using the hanging drop vapor
diffusion method. The drops were prepared by mixing 5 µL of protein at a concentration
of 10 mg/mL in 50mM Tris-HCl (pH 8.0) with 5 µL of the precipitant solution containing
50 mM Tris-HCl (pH 8) and 1.4 M sodium citrate against 1 mL of the precipitant solution.
The drops were allowed to equilibrate at room temperature. Crystals were stored in
polystyrene containers and allowed to sit undisturbed. Useful crystals were observed
three days after setup.
Data Collection.
The X-ray diffraction data sets for the HCAII mutant crystals were obtained using
the oscillation method in house at -120°C, using a Rigaku RU-H3R Cu rotating anode
operating at 50 kV and 100 mA. Diffraction was detected using an R-AXIS IV++ image

69
plate system. The crystal – detector distance was set to 80 mm. The crystals were
soaked in a 0.01M solution of Sodium Cyanate, followed by cryoprotectant solution of
glycerol (30%) and 1M Tris-HCl (70%) and mounted on cryo loops. The oscillation
steps were 1° with a 5 min exposure time.
Structure Solution and Model Refinement.
The HCAII variant structures were solved using the program phenix.refine in
PHENIX. Preceding refinement, random test sets of ~10% were flagged for Rfree
calculations. The method of structure determination was molecular substitution (phaser)
with wtHCAII (PDB ID: 2ILI). The wt structure, stripped of the zinc, solvent and amino
acid Val 207 replaced with Ala, was used as the initial model for phase calculations in
phenix.refine. The cyanate ligand was designed using ProDrug, and cif files needed for
refinement were made using PHENIX. Following 3 cycles in PHENIX, the refined
structure was visually inspected using the molecular imaging system Coot for display of
model and electron density. The zinc, the amino acid substitution at position 207, as
well as improperly positioned side chains, were manually placed in their respectively
density. This refined model was then submitted for subsequent rounds of refinement
and solvent placement. During the final stages of refinement in conjunction with COOT,
the models were viewed and solvent with little or no 2F0-FC density were deleted, until
the Rwork and Rfree values had converged (Table 3-1)
Enzyme Titration: Inhibitor Affinity.
For strong binding anions like cyanate, when Ki >> [E], it obeys the equation of A =
Ao /(1+[I]/ Ki) where A is activity at various Inhibitor concentrations and Ao is the initial
activity without inhibitor. Inhibitor affinity was measured by enzyme titration using an
Extrel EXM-200 mass spectrometer. The uncatalyzed and carbonic-anhydrase-

70
catalyzed exchanges of 18O between CO2 and water at chemical equilibrium (a flat line
of current for all CO2 species) were measured at room temperature in the absence of
buffer at a total substrate concentration of 25 mM. HCAII was added to the solution.
After 2 minutes, cyanate was added to the reaction until the reaction regained
equilibrium indicating the inhibition of HCAII. Calculations of affinity from experimental
data were performed using Enzfitter (Biosoft).
Results
Crystal Structures
The binding site of cyanate in three variants of HCAII was determined by X-ray
crystallography refined to below 1.8 Å resolution with final Rfactors of 17.2 and 13.9
(See Table 3-1). Each structure clearly shows cyanate bound directly to the zinc with
oxygen interacting with the metal ion. The cyanate ion, labeled OCN-, faces into the
hydrophobic pocket, approximately 2 Å from the zinc atom. The zinc – bound solvent is
not present in any of the crystal structures indicating that the cyanate has replaced it.
There appears to be no changes in side chain conformation caused by inhibitor binding
or mutations. Low r.m.s.d. values for bond lengths and angles shows that there are
negligible perturbations in the structure and the bond lengths and angles are highly
accurate (Table 3-1). Each structure shows cyanate in its natural linear conformation.
Both cyanate structures show that the amine group of the anion is in hydrogen bonding
distance (2.6 to 3.5 Å) with the hydroxyl group of T199, similar to other tetrahedral-
coordinated anions (Figure 3-5 and Figure 3-6). The overlay of all variants shows that
the cyanate is bound in the same proximity of the zinc atom for each structure (Figure 3-
7). The binding of cyanate is further illustrated when compared to anions hydrogen
71
sulfide, azide and bisulfite that also form tetrahedral complexes with three histidines
stabilizing the zinc atom (Figure 3-8).
Inhibitor Affinity
The tightness of binding of cyanate to each variant of HCAII was examined by 18O-
exchange between CO2 and water measured by mass spectrometry. The inhibition in
18O –exchange rates are shown in Figure 3, with resulting values of Ki given in Table 2.
The binding of cyanate to V143I HCAII is lower than for wt and V207I HCAII (Table 3-2).
These values are compared to previously determined inhibition constants for wtHCAII
as well as cobalt substituted CAII. While the cobalt CAII is the lowest at 7 µM, all of the
variants listed have values in the µM range possibly making their differences
insignificant as they are all very strong inhibitors.
Discussion
The work with cyanate bound structures of HCAII was done initially as a method
to study the possible change in substrate conformation dependent upon mutations of
specific residues in the CO2 binding pocket. This was a strategy to screen for mutants
(V143I and V121I) that had interesting results that would be further studied with CO2
entrapment. When the structure of each mutant was solved, it appeared that cyanate
did not bind near CO2 but rather it bound directly to the zinc (Figure 3-9). The cyanate
is oriented approximately 2 Å away from the zinc, similar to the natural hydroxide.
Interesting is the fact that these mutations were developed in the theory that they would
impact substrate binding and the most significant deviation from wild type in regards to
affinity for cyanate came from V143I, showing binding affinity can be altered due to
mutations.

72
Structurally, it appears that cyanate can bind to zinc forming a tetrahedral
coordination complex. Superimposition of CA inhibitors with similar behaviors verifies
this claim (Figure 3-8). This anion appears to be in hydrogen bond distance with T199,
a common factor in regular tetrahedral coordination. However, if the oxygen is bound to
the zinc, the nitrogen, with a full shell of valence electrons, would make an unlikely
hydrogen bond acceptor. The coordination of cyanate appears to be a distorted
tetrahedral.
The affinities of our CA variants for cyanate correlate closely with other data
documenting Ki of similar metal oxides with various other carbonic anhydrases (80), as
well as with previous work that shows I143 having an impact on ligand binding in the
active site(40). Inhibitor constants for cyanate were determined by Lindskog et al. for
cobalt substituted CA (79). The values of the inhibition constants for cyanate match
closely to the ones obtained by Supuran et al. (78) as well as measured for wt, V143I,
and V207I HCAII variants from this current study (Table 3-2). The affinity of cyanate for
cobalt CAII was measured to be about 7 µM, while the previously mentioned variants
were measured to be around 36 µM. This is a promising finding, as low affinity for the
central metal was a proposed reason for uncoordinated binding in the active site, the
mode of binding that was proclaimed for cyanate in regards to zinc CAII (3). With cobalt
and zinc CAs having similar values for affinity constants, it is likely that their binding
tendencies are similar as well. Since it has been shown through NMR that cyanate
binds cobalt, it is possible that it also binds zinc as well.
The question that still remains is the binding position of cyanate. Is the oxygen or
nitrogen coordinated to the zinc? Structures of many CAIs indicate that nitrogen indeed

73
has the ability to bind to zinc. It is postulated that cyanate binds to the zinc in HCAII
with the oxygen directly coordinated to the metal. When comparing the ionization states
of cyanate and hydroxide, there are similarities, primarily the number of electrons for the
oxygen atom. Both atoms have 7 electrons, adding the negative charge to the
molecule. The oxygen in hydroxide binds directly to the metal, and it is proposed that
the same occurs for cyanate.
While the data indicates an alternate binding mode for cyanate in CAII, it does not
necessarily disprove previous work. It is possible that cyanate can have multiple
coordination possibilities. Some structures of CA with bicarbonate indicate that it can
form a penta-coordination complex with water still attached (3,74). However it has also
been shown that that bicarbonate binds in place of water as well (43). The goal of this
study was to use crystallography to see if cyanate can bind directly to zinc, providing
more structural evidence to the nature of this anion. Cyanate has the ability to bind
directly to the zinc atom, replacing the water, however it is not a disproval of previous
works, as our experiments were not set up to match previous crystallographic
approaches.
Based on data presented here, it appears that binding of cyanate in the active site
of HCAII is that of a solvent-displacing ligand rather than a weak substrate bound in the
mode of CO2. The kinetic data on these mutants designed to disrupt substrate binding
shows change in affinity of cyanate at the metal, however the structures of cyanate
bound to HCAII all show the same conformation, bound to the zinc (Figure 3-7). The
interaction may be similar to that between zinc and hydroxide/water: a dipolar bond.
Like hydroxide, the oxygen molecule in cyanate has two unshared electrons. This anion
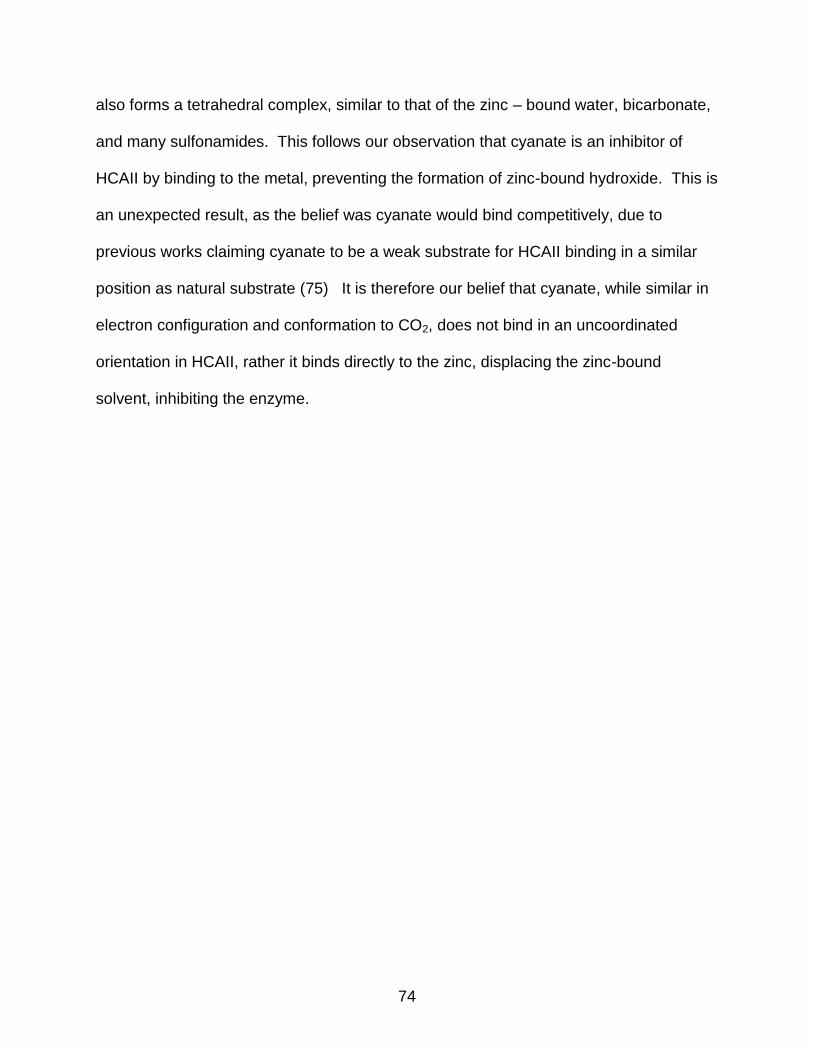
74
also forms a tetrahedral complex, similar to that of the zinc – bound water, bicarbonate,
and many sulfonamides. This follows our observation that cyanate is an inhibitor of
HCAII by binding to the metal, preventing the formation of zinc-bound hydroxide. This is
an unexpected result, as the belief was cyanate would bind competitively, due to
previous works claiming cyanate to be a weak substrate for HCAII binding in a similar
position as natural substrate (75) It is therefore our belief that cyanate, while similar in
electron configuration and conformation to CO2, does not bind in an uncoordinated
orientation in HCAII, rather it binds directly to the zinc, displacing the zinc-bound
solvent, inhibiting the enzyme.

75
Table 3-1. Data and refinement statistics for cyanate bound to variants of HCAII
Parameter Wild Type V207I
PDB code 4E5Q n/a Space group P21 P21 Unit-cell parameters a,b,c (Å),β(°) 42.2,41.0,71.5; 104.5, 42.4,41.5,72.5;104.4
Resolution (Å) 20 -1.7 (1.76-1.70) 35 -1.5 (1.55-1.5)
Rsym a (%) 8.8 (5.5) 4.4 (2.5)
I/(σ)I 16.5 (4.0) 28.1 (5.2) Completeness (%) 91.1 (89.2) 92.2 (87.9) Average Redundancy 6.8 (7.0) 3.8 (3.7) Number of unique reflections 23,839 38,496
Rcryst b/Rfree
c (%) 17.2/20.0 13.9 / 17.1 No. atoms – Protein 2,090 2,073 Water 287 320 B-factors (Å2) main/side, solvent 13.2/17.4, 24.8 13.8/17.4, 25.4
R.M.S.D. (bond (Å) /angle(˚)) 0.006/1.092 0.010/1.3 Ramachandran plot (%)
Most favored, allowed, outlier 88.4, 11.6, 0.0 88.0, 12.0, 0.0 aRsym = Σ |I-<I>|/ Σ <I>. bRcryst = (Σ |Fo|-|Fc|/ Σ |Fobs| ) x 100 . cRfree is calculated in same manner as bRcryst, except that it uses 5% of the reflection data omitted from refinement. *Values in parenthesis represent highest resolution bin.

76
Table 3-2. Inhibition constants for cyanate bound in HCAII variantsa
Variant of HCAII Affinity Coefficient (Ki) (µM)
Cobalt CAIIb 7
Wild typec 20
Wild type 37 + 3
V143I 28 + 1
V207I 42 + 3 aThe constants were measured at 25 °C in solutions containing 25 mM CO2.
bThis data comes from Lindskog et al. (79) cThis data comes from Lindahl et al. (75)

77
Figure 3-1. HCAII in complex with bromide. Many anionic inhibitors, like bromide form
a tetrahedral coordination complex with the zinc atom, like hydroxide/water (PDB ID: 1RAZ). This model was made using PyMol (72)

78
Figure 3-2. HCAII in complex with sulfite (SO3, PDB ID: 2CBD) and acetate (ACT, PDB
ID: 1XEG). Anionic CA inhibitors with tetrahedral coordination are stabilized by hydrogen bonding with T199. This model was made using PyMol (74,81)

79
Figure 3-3. HCAII in complex with azide. The binding mode for azide (N3) is distorted
tetrahedral since is unable to donate a hydrogen bond to the hydroxyl group of T199 (PDB ID: 1RAY). This model was made using PyMol (72)

80
Figure 3-4. HCAII in complex with formate. The binding of formate (FMT) is not strong
enough to impede the water/hydroxide bound to zinc. As a result formate and water bind to form a penta-coordination complex. Dotted red lines indicate bonds in the range of hydrogen bond distance (2.6 to 3.5 Å). PDB ID: 2CBC. This model was made using PyMol (74)

81
Figure 3-5. HCAII in complex with cyanate. In comparison with other tetra-coordination
complexes, cyanate (OCN-) in CAII binds directly to the zinc, and is in hydrogen bond distance with T199. PDB ID: 4E5Q. This model was made using PyMol

82
Figure 3-6. V207I HCAII in complex with cyanate. This model was made using PyMol
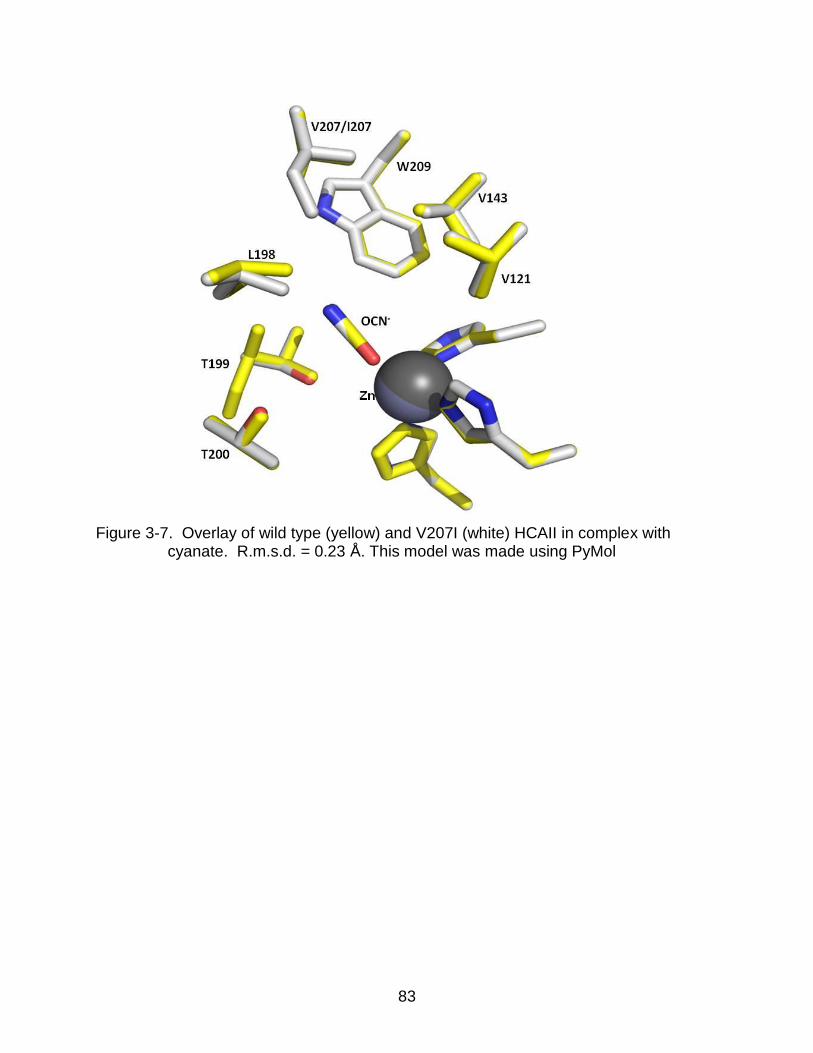
83
Figure 3-7. Overlay of wild type (yellow) and V207I (white) HCAII in complex with
cyanate. R.m.s.d. = 0.23 Å. This model was made using PyMol
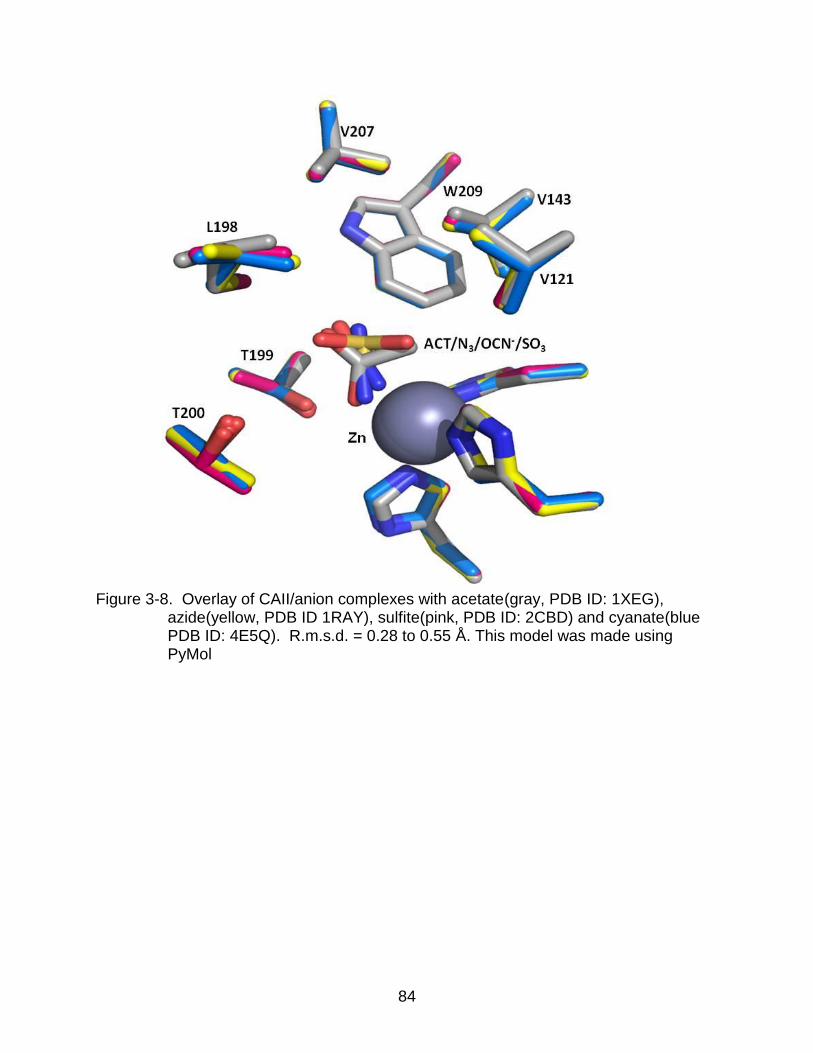
84
Figure 3-8. Overlay of CAII/anion complexes with acetate(gray, PDB ID: 1XEG),
azide(yellow, PDB ID 1RAY), sulfite(pink, PDB ID: 2CBD) and cyanate(blue PDB ID: 4E5Q). R.m.s.d. = 0.28 to 0.55 Å. This model was made using PyMol
85
Figure 3-9. HCAII with cyanate and carbon dioxide. The positions of inhibitor cyanate
(green, PDB ID 4E5Q) and substrate carbon dioxide (blue) from Domsic et al (PDB ID: 3D92). This model was made using PyMol

86
CHAPTER 4 CO2 BINDING AND CATALYTIC EFFICIENCY
This chapter focuses on binding of carbon dioxide in the active site of HCAII. As
previously mentioned, the binding pocket of HCAII is composed of hydrophobic
residues: three valines (Val121, 143 and 207), Ile198, Trp209, and the amide group of
Thr199. This is the region in which CO2 binds and the first stage of catalysis takes
place (9, 38). This chapter places emphasis on structural and kinetic studies of the
binding pocket residues of HCAII.
The Hydrophobic Pocket
Studies on amino acid substitutions of hydrophobic pocket residues in the active
site of HCAII have presented the hypothesis that increasing hydrophobicity decreases
catalytic efficiency and decreasing hydrophobicity promotes no significant effect.
However, this may not be the case for all residues in the binding pocket of HCAII. Much
work has been done categorizing these hydrophobic residues in relation to their effect
on CO2 binding and conversion to bicarbonate. This is likely a result of a well-accepted
notion that the two stages of the reaction catalyzed by HCAII are separate and do not
affect each other. As a result, much work focused on structural modifications of the
hydrophobic region is correlated with changes in catalytic efficiency (similar tendencies
occur for the hydrophilic region and proton transfer). This notion however is not without
its validation, as our data has shown that mutations in the hydrophobic pocket deliver no
significant changes in proton transfer. However these changes, albeit minor illustrate
that the reaction rates have the ability to be altered when the hydrophobic pocket is
manipulated (40). It has been shown that mutations in the binding pocket affect
substrate conversion, while mutations altering the water network impact proton transfer

87
(82,). However, the inverse is not thoroughly considered: can mutations in the CO2
binding pocket significantly affect proton transfer? Can mutations in the hydrophilic
region impact the dynamics of catalytic efficiency?
Although the binding of CO2 in the active site of HCAII has been examined by X-
ray crystallography (38, 43), the relevance to the catalysis of its position in the enzyme-
substrate complex is not well understood. Little is known about the relationship between
catalytic efficiency and substrate orientation, a relationship difficult to elucidate
experimentally. The work presented here focuses on catalysis by variants of HCAII and
examines using X-ray crystallography the binding of CO2 and bicarbonate in the active
site of V143I HCAII. The presence of CO2 at high pressure lowers pH and promotes
zinc-bound water which is not reactive with CO2. The variant V143I HCAII had catalysis
decreased about 17-fold compared with wild type. This is a change unseen by other
binding pocket mutants. The larger side chain of Ile143 in V143I decreases the size of
the active-site cavity and forces bound CO2 closer to the zinc by 0.3 Å. This implies a
perturbed, crowded transition state and an impeded formation of developing charge on
product bicarbonate by increased hydrophobicity of Ile143. There is no significant effect
on the structure of ordered water in the active-site cavity in V143I HCAII, and there are
only small effects on rate constants for proton transfer. These structural and kinetic
studies elucidate the significance of Val143 and the CO2 binding site in maximizing
catalysis.
Materials and Methods
Expression and Purification of Mutants.
Please see Chapter 2 Section on Protein Expression Site-Directed Mutagenesis
and Affinity Chromatography.
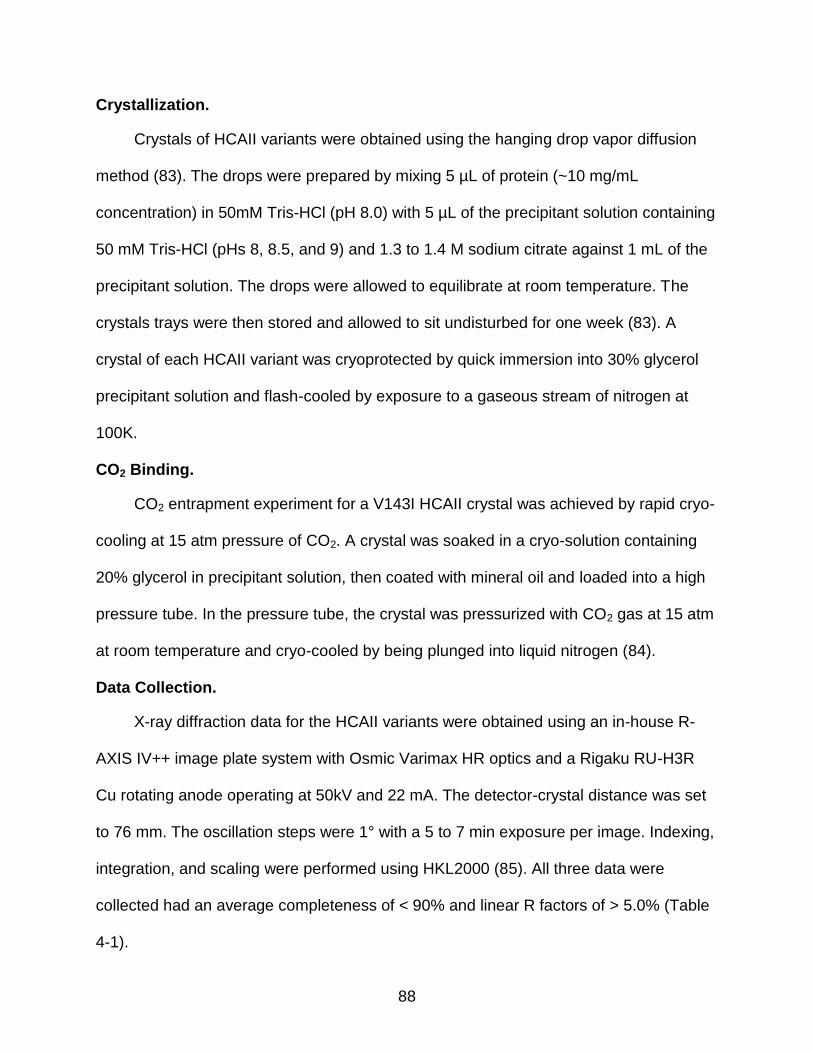
88
Crystallization.
Crystals of HCAII variants were obtained using the hanging drop vapor diffusion
method (83). The drops were prepared by mixing 5 µL of protein (~10 mg/mL
concentration) in 50mM Tris-HCl (pH 8.0) with 5 µL of the precipitant solution containing
50 mM Tris-HCl (pHs 8, 8.5, and 9) and 1.3 to 1.4 M sodium citrate against 1 mL of the
precipitant solution. The drops were allowed to equilibrate at room temperature. The
crystals trays were then stored and allowed to sit undisturbed for one week (83). A
crystal of each HCAII variant was cryoprotected by quick immersion into 30% glycerol
precipitant solution and flash-cooled by exposure to a gaseous stream of nitrogen at
100K.
CO2 Binding.
CO2 entrapment experiment for a V143I HCAII crystal was achieved by rapid cryo-
cooling at 15 atm pressure of CO2. A crystal was soaked in a cryo-solution containing
20% glycerol in precipitant solution, then coated with mineral oil and loaded into a high
pressure tube. In the pressure tube, the crystal was pressurized with CO2 gas at 15 atm
at room temperature and cryo-cooled by being plunged into liquid nitrogen (84).
Data Collection.
X-ray diffraction data for the HCAII variants were obtained using an in-house R-
AXIS IV++ image plate system with Osmic Varimax HR optics and a Rigaku RU-H3R
Cu rotating anode operating at 50kV and 22 mA. The detector-crystal distance was set
to 76 mm. The oscillation steps were 1° with a 5 to 7 min exposure per image. Indexing,
integration, and scaling were performed using HKL2000 (85). All three data were
collected had an average completeness of < 90% and linear R factors of > 5.0% (Table
4-1).

89
Diffraction data for the CO2 bound V143I HCAII crystal was collected at Cornell
High Energy Synchrotron Source (CHESS) using a wavelength of 0.9772 Å. Data were
collected in 1° oscillation steps with a 2 s on an ADSC Quantum 210 CCD detector
(Area Detector Systems Corp.), with a crystal to detector distance of 65 mm. The data
collected had average completeness of 92.3% and linear R factors of 8.2% (Table 4-1)
Structure Solution and Model Refinement.
All three in house HCAII variants structures were solved using the programs
phaser and phenix.refine in PHENIX (86). Preceding refinement, random test sets of
~5% were flagged for Rfree calculations. The method of structure determination was
molecular substitution (phaser) with wild type HCAII (PDB ID: 2ILI). The wild type
structure, stripped of the zinc, solvent and amino acid Val 143 replaced with Ala, was
used as the initial model for phase calculations in phenix.refine. Following 3 cycles in
PHENIX, the refined structure was visually inspected using the molecular imaging
system Coot for display of model and electron density. The zinc, the amino acid
substitution at position 143, as well as improperly positioned side chains, were manually
placed in their respectively density. This refined model was then submitted for
subsequent rounds of refinement and solvent placement. During the final stages of
refinement in conjunction with COOT, the models were viewed and solvent with little or
no significant 2F0-FC density were deleted, until the Rwork and Rfree values had
converged (Table 4-1).
The CO2 V143I HCAII structure was similarly refined, but with the addition of dual
occupancy refinement of the both bound CO2 and bicarbonate (Table 4-1).
18O Exchange Mass Spectrometry
See Chapter 2 Mass Spectrometry with HCAII.

90
Stopped-Flow Spectrophotometry
Initial rates of CO2 hydration were determined by measuring the change in
absorbance of a pH indicator on an Applied Photophysics SX.18MV stopped-flow
spectrophotometer using the method of Khalifah (61). The pKa value and wavelength for
the pH indicator−buffer pair used were m-cresol purple (pKa = 8.3), λ = 578 nm and
TAPS. Final buffer concentrations were 25 mM and the pH was 8.3. CO2 solutions were
prepared by bubbling CO2 into water at room temperature (25°C) at varying CO2
concentrations. The mean initial rates were measured from 5 to 8 reaction traces
comprising the initial 10% of the reaction. Uncatalyzed rates were determined similarly
and subtracted from the total observed rates. Determinations of the constants k cat and k
cat/Km were carried out using Enzfitter (Biosoft).
Results
Catalysis
Catalysis by HCAII variants of the exchange of 18O between CO2 and water was
measured by membrane inlet mass spectrometry. Compared with wild-type HCAII, each
of the variants had decreased catalytic efficiency as measured by k catexch/Keff
CO2 (Table
4-2). Both mutants V143I and V143L showed sizable decreases in maximal, pH-
independent value of k catexch/Keff
CO2 by as much as 17-fold. The variant V143A
decreased this efficiency about two-fold compared with wild type. Changes in the rate
constant for proton transfer kB were two-fold at most (Table 4-2). The values of the pKa
of the zinc-bound water molecule obtained from the pH profiles of k catexch/Keff
CO2 (Figure
2) and RH2O/[E] (Supporting Information, Figure 4-1) were not significantly altered
compared with wild type (Table 4-2). However, the values of the pKa of the imidazole
side chain of His 64 obtained from pH profiles of RH2O/[E] were decreased slightly for

91
the mutants (Table 4-2), an effect seen previously in variants of HCAII in which the
orientation of the side chain of His64 was inward (87).
The maximal values of the steady-state catalytic constants for hydration of CO2
were also measured for these variants by stopped-flow spectrophotometry at pH 8.3.
These data show the same trend as the 18O exchange data, with kcat/Km for V143I and
V143L decreased up to 20-fold compared with wild type, while the decrease for V143A
is near three-fold (Table 4-3). The values of kcat/Km determined by stopped-flow should
in principle be the same as kcatexch/Keff
CO2 determined in the 18O-exchange experiments.
Comparison of these values in Tables 4-2 and 4-3 show values which are similar.
Crystal Structures.
Using X-ray crystallography, structures of HCAII variants V143A, V143L and
V143I, were solved at 1.7, 1.6, and 1.55 Å resolution, respectively. The structures were
refined with final R factors of < 18% (Table 4-1). The side chains of each of the
substituted amino acids at position 143 faced into the active site, in a manner similar to
wtHCAII (Figure 4-3). When comparing the overall structures of the three variants with
wtHCAII (PDB: 2ILI) (10), only very minor alterations were noticed based on the
structural overlay, which showed an average r.m.s.d. of 0.19 Å between Cα atoms in the
four superimposed models (Figure 4-4). For the variant V143A HCAII, the size of the
CO2 binding pocket was increased, and two additional ordered solvent molecules
(labeled WA and WB in Figure 4-3A) were observed. These water molecules are not
observed in wild type or in the other two variants (Figure 4-3B,C). In addition to these
extra solvent molecules in V143A HCAII, and most likely as a consequence of their
presence, the solvent molecule termed “deep water” (DW in Figure 4-3) appears 2.7 Å
away from the oxygen atom of the zinc-bound solvent compared to 2.4 Å for wtHCAII. In

92
the variant V143L, the deep water appears to have dual occupancy and is shifted 1.0 Å
from the zinc (shown as two red spheres labeled DW in Figure 4-3C).
Substrate and Product Binding in V143I HCAII
Following the procedures of Domsic et al, (38) for the entrapment of CO2 in
wtHCAII, we examined substrate binding in V143I HCAII at a resolution of 1.3 Å. With
an r.m.s.d. of 0.17 Å between all Cα atoms in wild type and the V143I variant,
superimposition shows good structural agreement. Interestingly, both the substrate CO2
and product bicarbonate were observed in the active site (Figure 4-5), this is in contrast
to the wild type structure where only CO2 was observed under these conditions. Hence,
careful refinement was performed to determine occupancy of the CO2 (0.33), the zinc-
bound solvent (0.33), and bicarbonate (0.67). Similar to the wild type structure by
Domsic et al, His64 has a dual inward and outward conformation (38), an unpredictable
state when alterations to HCAII have been introduced. Figure 4-5A and 4-5B show the
calculated omit Fo-Fc electron density map when the CO2 or bicarbonate were not
incorporated into the respective models. This clearly demonstrates the occupancy of
both substrate and product.
The CO2 molecule bound in V143I HCAII is oriented in a side-on conformation
similar to that observed by Domsic et al (38) (Figure 4-6A,C). The CO2 molecule shows
similar spatial orientations in both wt and V143I HCAII, but with the CO2 slightly tilted
~10° in the direction of O2. The central carbon atom of CO2 is noticeably closer to the
oxygen atom of the zinc-bound water, now 2.5 Å away compared to 2.8 Å for wtHCAII
(Figure 4-7A, Table 4-4).
The bicarbonate is positioned with O1 and O3 proximal to the CO2, 1.2 Å away
from corresponding oxygen atoms of bound CO2 (Figure 4-6B). The other oxygen of the
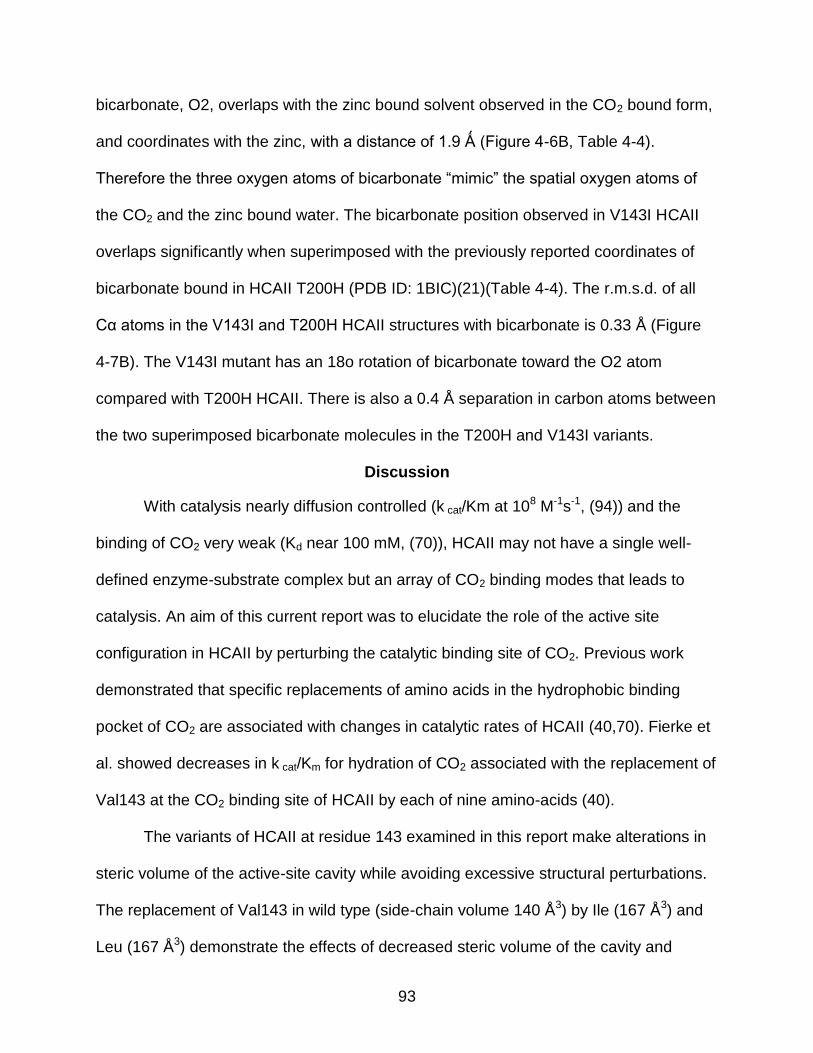
93
bicarbonate, O2, overlaps with the zinc bound solvent observed in the CO2 bound form,
and coordinates with the zinc, with a distance of 1.9 Ǻ (Figure 4-6B, Table 4-4).
Therefore the three oxygen atoms of bicarbonate “mimic” the spatial oxygen atoms of
the CO2 and the zinc bound water. The bicarbonate position observed in V143I HCAII
overlaps significantly when superimposed with the previously reported coordinates of
bicarbonate bound in HCAII T200H (PDB ID: 1BIC)(21)(Table 4-4). The r.m.s.d. of all
Cα atoms in the V143I and T200H HCAII structures with bicarbonate is 0.33 Å (Figure
4-7B). The V143I mutant has an 18o rotation of bicarbonate toward the O2 atom
compared with T200H HCAII. There is also a 0.4 Å separation in carbon atoms between
the two superimposed bicarbonate molecules in the T200H and V143I variants.
Discussion
With catalysis nearly diffusion controlled (k cat/Km at 108 M-1s-1, (94)) and the
binding of CO2 very weak (Kd near 100 mM, (70)), HCAII may not have a single well-
defined enzyme-substrate complex but an array of CO2 binding modes that leads to
catalysis. An aim of this current report was to elucidate the role of the active site
configuration in HCAII by perturbing the catalytic binding site of CO2. Previous work
demonstrated that specific replacements of amino acids in the hydrophobic binding
pocket of CO2 are associated with changes in catalytic rates of HCAII (40,70). Fierke et
al. showed decreases in k cat/Km for hydration of CO2 associated with the replacement of
Val143 at the CO2 binding site of HCAII by each of nine amino-acids (40).
The variants of HCAII at residue 143 examined in this report make alterations in
steric volume of the active-site cavity while avoiding excessive structural perturbations.
The replacement of Val143 in wild type (side-chain volume 140 Å3) by Ile (167 Å3) and
Leu (167 Å3) demonstrate the effects of decreased steric volume of the cavity and

94
increased hydrophobicity. Val143 was also replaced by Ala (89 Å3) increasing the
volume of the cavity. An overlay of crystal structures of all variants examined in this
work showed a superposition of side chain conformations at position 143 with strong
side chain overlap in the residues of the active-site cavity, indicating that the unaltered
residues in the hydrophobic pocket were not significantly affected by the changes in the
volume of the active site (Figure 4-4). Since these replacements do not impinge on the
proposed proton transfer pathway (1), there were rather minor effects on rate constants
kB and kcat that contain contributions of proton transfer between the active site and
solvent (Tables 4-2, 4-3)(1, 6).
The catalytic efficiency, measured by kcatexch/Keff
CO2 (Table 4-2) and kcat/Km (Table
4-3), was decreased as much as 20-fold for the replacements of Val143 by side chains
of larger size (Leu, Ile), and to a much lesser extent with the smaller size (Ala). These
data are in rather close agreement with the stopped-flow results of Fierke et al. (40) It is
interesting that even increasing the volume of the active-site cavity in V143A HCAII
caused a decrease in catalytic activity (Tables 4-2, 4-3).
In the active site, the hydrogen bond between the zinc-bound hydroxide and side-
chain hydroxyl of Thr199 orients the lone pair electrons of the zinc-bound hydroxyl
towards the carbon of CO2, promoting nucleophilic attack and avoiding an entropic
penalty by immobilizing the rotation of the zinc-bound hydroxide about the Zn-O axis
(42,44,45). In the crystal structure of CO2 bound in V143I HCAII the solvent ligand of
the zinc must be a water molecule or reaction would occur. In this structure, the larger
side-chain volume of Ile143 compared with Val has forced the carbon atom of bound
CO2 closer to the zinc-bound solvent oxygen by a distance of 0.3 Å (Figure 4-7A, Table

95
4-4), and this is associated with a 13- to 17-fold decrease in kcat/Km and kcatexch/Keff
CO2
for hydration when V143I is compared with wild type (Tables 4-2, 4-3). This is most
likely due to a stereoelectronic effect, one that has sterically crowded the transition state
due to the increased volume of Ile143; this could be accompanied by the effects of
increased hydrophobicity of Ile143 compared with Val143 (estimated at 0.5 kcal/mol
based on side chain burial (92)). The overall effect on V143I HCAII is to increase by
about 1.7 kcal/mol an energy barrier for catalysis that in wild-type is near 10 kcal/mol.
This effect is also the case for V143L which shows similar catalytic rates as V143I
HCAII (Tables 4-2, 4-3).
These explanations must be viewed in the context of the decrease, although
smaller in magnitude, of catalytic activity when the active-site cavity is increased in
volume in the variant V143A HCAII. Presumably here the position of bound CO2 is more
distant from the zinc-bound solvent than in wild type, reducing the interaction between
the unpaired electrons of the oxygen atom of the zinc-hydroxide and CO2. Work on the
binding of CO2 to V143A HCAII is in progress.
In the crystal structure of V143I HCAII we observed the superimposed occupancy
of bicarbonate as well as CO2 (Figure 4-5 and 4-6). There are significant changes in the
interatomic distances for the three oxygens of bicarbonate when comparing binding in
V143I HCAII (Table 4-4) and other reports of bound bicarbonate. It is possible that the
shifts are due to the larger side chain of isoleucine in V143I HCAII; however, these
changes may be indicative of the influence of the experiment. Previous structures of
HCAII variants with bicarbonate bound diffused bicarbonate into crystals (111), while
our data show the appearance of bicarbonate after the reaction of CO2 and at the active

96
site. Of course, the various replacements in the variants of Table 4 each could promote
a change in binding that would explain the observed differences in position.
Nevertheless, the bicarbonate molecules in each variant bind directly to the zinc,
correlating with the catalytic mechanism of direct nucleophilic attack of zinc-bound
hydroxide on CO2.
Using conditions very similar to those reported here, Domsic et al. (38) did not
observe bicarbonate in the crystal structure of wild-type HCAII. However, Sjoblom et al.
(43) using repeated X-ray exposure did identify bicarbonate bound in HCAII and
suggested that bicarbonate formation was a result of enzyme activation due to radiation
induced events. This implies that increasing X-ray dose led to enzyme activation
perhaps producing active hydroxyl radicals, which would allow for reaction with CO2
leading to the formation of bicarbonate, as discussed by Sjoblom et al. (43). Radiation
damage is a common issue known to impact macromolecular structures under
crystallographic conditions, so this behavior between electrons and water molecules is
not unlikely (88-91). The absorbed dose at which Sjoblom et al. observed bicarbonate
was approximately 6 x 10⁶ Gy, and the occupancies were 65% CO2 and 35%
bicarbonate. In the experiment presented here, the data collection for V143I HCAII
maintained a constant radiation dose (estimated radiation dose absorbed at the x-ray
beam line used (0.97 Å wavelength) was 106 to 107 Gy.), and only one set of data was
collected for substrate binding analysis.
The occupancy levels of substrate and product described by Sjoblom et al. are
reversed in this study which found 67% bicarbonate and 33% CO2 at the active site.
The higher occupancy of bicarbonate in this study could indicate a change in the

97
product dissociation rate for V143I HCAII. A decrease in the rate of bicarbonate
dissociation would explain the higher occupancy of bicarbonate as well as the decrease
in kcat/Km compared with wild type.
Work reported here demonstrates a role for Val143 in the hydrophobic wall
providing a productive binding site for CO2 in HCAII. Replacement of Val143 with Ile
resulted in a decrease in the volume of the active site cavity and a resulting shift in
which the position of the carbon in bound CO2 was 0.3 Å closer to the zinc-bound
solvent. This was accompanied by a 17-fold drop in catalysis compared with wild type.
These results are consistent with the binding of CO2 to the hydrophobic wall including
Val143 as productive in catalysis and with the idea that the enzyme has evolved at
residue 143 to its most efficient state (19,40). These data help to develop a possible
structure-function relationship between the position of substrate in the enzyme-
substrate complex and the catalytic efficiency. Observing specific changes in the
binding of substrate related to catalytic activity provides insight into the catalysis and
may provide pathways to variants of carbonic anhydrase with specifically engineered
catalytic activity for industrial and environmental uses.
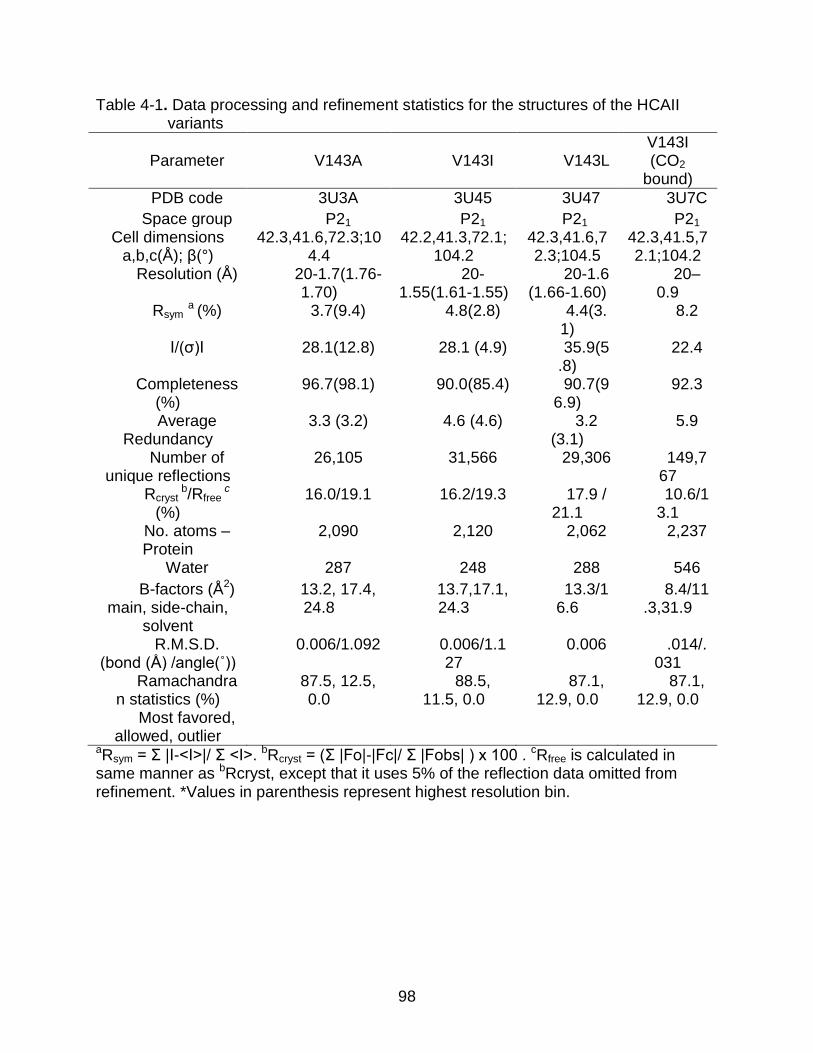
98
Table 4-1. Data processing and refinement statistics for the structures of the HCAII variants
Parameter V143A V143I V143L V143I (CO2
bound)
PDB code 3U3A 3U45 3U47 3U7C
Space group P21 P21 P21 P21
Cell dimensions a,b,c(Å); β(°)
42.3,41.6,72.3;104.4
42.2,41.3,72.1;104.2
42.3,41.6,72.3;104.5
42.3,41.5,72.1;104.2
Resolution (Å) 20-1.7(1.76-1.70)
20-1.55(1.61-1.55)
20-1.6 (1.66-1.60)
20–0.9
Rsym a (%) 3.7(9.4) 4.8(2.8) 4.4(3.1)
8.2
I/(σ)I 28.1(12.8) 28.1 (4.9) 35.9(5.8)
22.4
Completeness (%)
96.7(98.1) 90.0(85.4) 90.7(96.9)
92.3
Average Redundancy
3.3 (3.2) 4.6 (4.6) 3.2 (3.1)
5.9
Number of unique reflections
26,105 31,566 29,306 149,767
Rcryst b/Rfree
c
(%) 16.0/19.1 16.2/19.3 17.9 /
21.1 10.6/1
3.1 No. atoms – Protein
2,090 2,120 2,062 2,237
Water 287 248 288 546
B-factors (Å2) main, side-chain,
solvent
13.2, 17.4, 24.8
13.7,17.1, 24.3
13.3/16.6
8.4/11.3,31.9
R.M.S.D. (bond (Å) /angle(˚))
0.006/1.092 0.006/1.127
0.006 .014/.031
Ramachandran statistics (%)
Most favored, allowed, outlier
87.5, 12.5, 0.0
88.5, 11.5, 0.0
87.1, 12.9, 0.0
87.1, 12.9, 0.0
aRsym = Σ |I-<I>|/ Σ <I>. bRcryst = (Σ |Fo|-|Fc|/ Σ |Fobs| ) x 100 . cRfree is calculated in same manner as bRcryst, except that it uses 5% of the reflection data omitted from refinement. *Values in parenthesis represent highest resolution bin.

99
Table 4-2. Maximal values of rate constants for the hydration of CO2 and dehydration of bicarbonate catalyzed by variants of HCAII, and related pKa values, obtained by 18O exchange at 25 °C
Variant kcat
exch/KeffCO2(μ
M-1s-1) pKZnH2O a kB
(μs-1) pKZnH2O
b pK donor b
Wild-type c 120 6.9 0.8 6.8 7.2
V143A 65 ± 6d 6.8 1.4 ± 0.3d 6.6 6.6
V143I 7.1 ± 0.2 6.6 0.4 ± 0.1 6.4 6.7 V143L 14 ± 1 6.7 0.7 ± .04 6.5 6.5
a Obtained from the pH profile of kcatexch/Keff
CO2. The standard errors here are ± 0.1. b Obtained from the pH profiles of RH2O. The standard errors here are ± 0.1 to ±0.2. c From Fisher et al. (39) d Standard errors were determined from 18O-exchange data
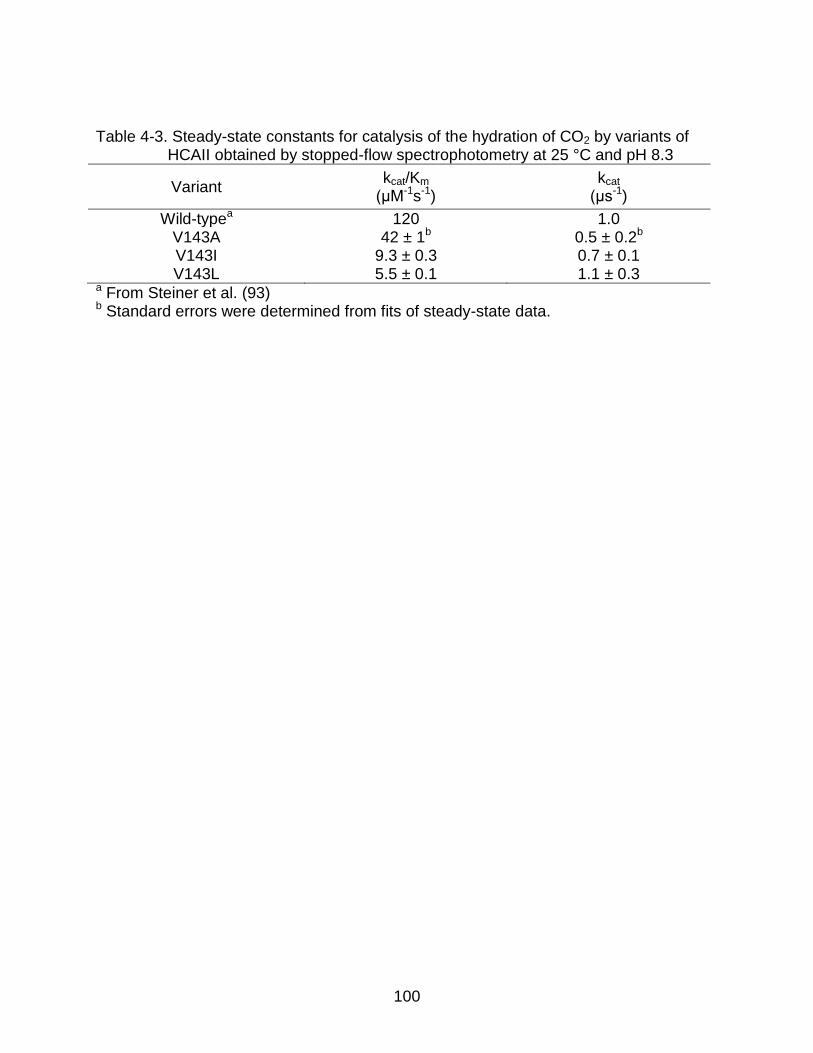
100
Table 4-3. Steady-state constants for catalysis of the hydration of CO2 by variants of HCAII obtained by stopped-flow spectrophotometry at 25 °C and pH 8.3
Variant kcat/Km
(μM-1s-1) kcat
(μs-1)
Wild-typea 120 1.0 V143A 42 ± 1b 0.5 ± 0.2b V143I 9.3 ± 0.3 0.7 ± 0.1 V143L 5.5 ± 0.1 1.1 ± 0.3
a From Steiner et al. (93) b Standard errors were determined from fits of steady-state data.

101
Table 4-4. Interatomic distances in Å for CO2 in HCAII and variants. Distances for CO2 atoms are measured from substrate atoms to the oxygen atom of the zinc-bound solvent
Atoms of CO2 Wild type a Wild type b V143Ic
C 2.8 2.8 2.5
O1 3 2.8 2.8
O2 3.1 3.1 2.7
a From Domsic et al. (38) b From Sjoblom et al. (43) c This work. The uncertainty in these distances is 0.1 Å.
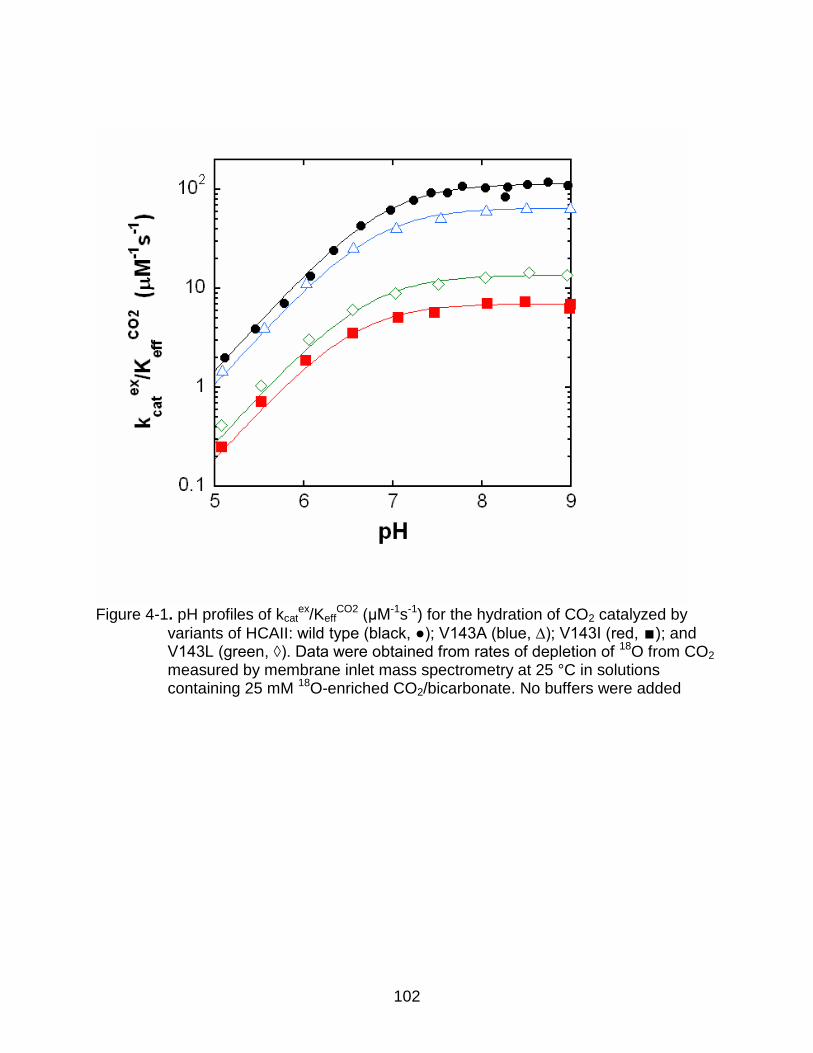
102
Figure 4-1. pH profiles of kcat
ex/KeffCO2 (μM-1s-1) for the hydration of CO2 catalyzed by
variants of HCAII: wild type (black, ●); V143A (blue, ∆); V143I (red, ∎); and V143L (green, ◊). Data were obtained from rates of depletion of 18O from CO2 measured by membrane inlet mass spectrometry at 25 °C in solutions containing 25 mM 18O-enriched CO2/bicarbonate. No buffers were added

103
Figure 4-2. pH profiles of RH2O/[E] (s-1) for the hydration of CO2 catalyzed by the
following variants of HCAII: wild type (black, ●); V143A (blue, ∆); V143I (red,
∎); and V143L (green, ◊). Data were obtained from rates of depletion of 18O from CO2 measured by membrane inlet mass spectrometry at 25 °C in solutions containing 25 mM 18O-enriched CO2/bicarbonate. No buffers were added

104
A
B
Figure 4-3. Crystal structure at the active-site of the A) V143I, B) V143A and C) V143L HCAII variants. Amino acids are as labeled. Only Fo-Fc electron density map (blue) are shown for the 143 position. Solvent molecules are depicted as red spheres and the three histidines coordinating the zinc (dark gray). Figure was made using PyMol

105
C
Figure 4-3. Continued

106
Figure 4-4. Stick overlay of position 143 HCAII structures. Wild type (orange), V143A
(pink), V143L (yellow), and V143I HCAII (white). Amino acids are as labeled. In addition the three histidines coordinating the zinc (dark gray) are shown. R.M.S.D. was 0.2 Å. Figure was made using PyMol

107
Figure 4-5. Stick stereo figure of the active site of V143I HCAII CO2/bicarbonate
complex. Shown are the calculated omit Fo-Fc electron density map, contoured at 3σ (green), when the A) CO2 and B) bicarbonate were not incorporated into the respective models. Amino acids are as labeled. This figure was made using PyMol
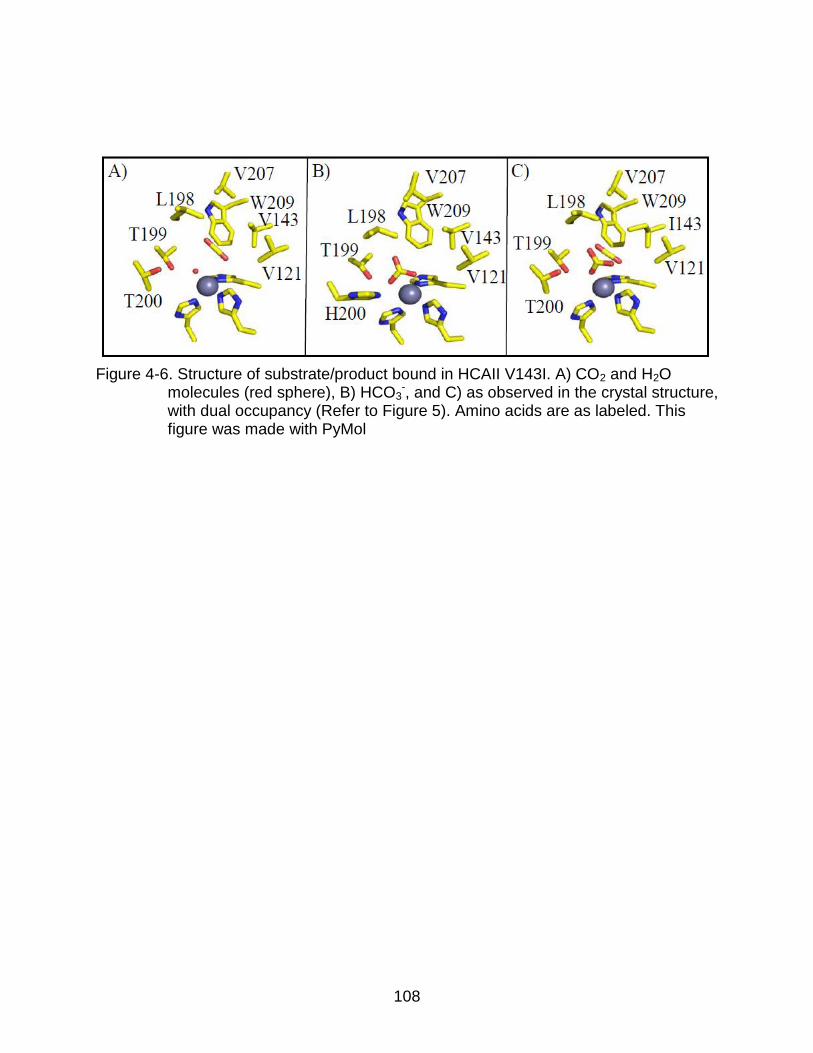
108
Figure 4-6. Structure of substrate/product bound in HCAII V143I. A) CO2 and H2O
molecules (red sphere), B) HCO3-, and C) as observed in the crystal structure,
with dual occupancy (Refer to Figure 5). Amino acids are as labeled. This figure was made with PyMol

109
Figure 4-7. Comparison of HCAII V143I substrate and product binding in HCAII.
Structural overlay A) of CO2 binding in wild type (green) (6) and V143I (yellow) HCAII, B) of bicarbonate binding in H200T (green) (117) and V143I (yellow). Amino acids are as labeled. This figure was made with PyMol

110
CHAPTER 5 SOLVENT NETWORK, PROTON TRANSFER AND MARCUS THEORY
In this chapter a variant Y7F-N67Q HCAII that has an unbranched water network
and in addition a shorter distance between His64 and the zinc-bound solvent
determined from the crystal structure at 1.6 Å resolution is discussed. For this double
mutant the rate constant for intramolecular proton transfer at 9.0 μs-1 is ten-fold greater
than wild type measured by 18O exchange. This allows a more complete understanding
of the factors that influence proton transfer through water chains in a protein
environment. HCAII serves as a simple model for examining such proton transfers in
more complex systems such as the photosynthetic reaction center, bacteriorhodopsin,
and ATP-synthase.
This chapter also discusses HCAII as it applies to Marcus Theory to understand
catalytic proton transfer in the biophysical context of other work. Although devised for
electron transfer, this approach has been applied to proton transfers (19,93) and
specifically to proton transfer during catalysis by carbonic anhydrase (98). The proton
transfer in catalysis by HCAII is characterized by highly curved Marcus (free energy)
plots suggestive of an inverted region, a region in which the rate constant for proton
transfer decreases as ΔpKa (difference between donor and acceptor pKa) becomes
more favorable (increases, as ΔG° becomes more negative). In this report, we present
an extension of previous work (1,6,93) to studies examining deuteron transfer and to a
new variant of HCAII that suggests an inverted region in the free energy plot. Inverted
regions in proton transfer reactions have been reported previously (11,94). The
The work presented on proton transfer and the solvent network is in strong collaboration with Dr. Rose Mikulski
111
theoretical basis for these observations of inverted regions of a free energy plot has
undergone much discussion; the interpretation of such an inverted region in catalysis by
carbonic anhydrase implies a rapid, nearly barrierless, proton transfer through a
preformed solvent network.
Methods
Site–directed Mutagenesis
Please see Chapter 2 sections Site-Directed Mutagenesis, Protein Expression,
and Affinity Chromatography for more information.
18O-Exchange
Oxygen – 18 experiments were performed as described in Chapter 2. With the
addition of derivatives of imidazole and pyridine for Marcus Theory experiments at
concentrations up to 200 mM, we have observed a weak inhibition of both R1 and
RH2O. This is probably due to binding at or in the vicinity of the zinc in the manner
found for the binding of imidazole to carbonic anhydrase I (49) or 4-MI to a mutant of
HCAII (95). The binding constant Ki for this inhibition is generally greater than 100 mM,
indicating weak binding at the inhibitory site. Some exogenous donors exhibited no
inhibition. In each case of inhibition, a single value Ki described inhibition of both R1 and
RH2O, as determined by these equations: R1obs = R1/(1+[B]/Ki) and RH2Oobs =
RH2O/(1+[B]/Ki).
Stopped-flow Spectrophotometry
Measurements of initial velocity in the hydration of CO2 and dehydration of
bicarbonate were carried out on a stopped-flow spectrophotometer (Applied
Photophysics SX18.MV) using the initial 5% to 10% of the progress curve using the
method of Khalifah (61). The hydration experiments were performed at pH 8.4 using 0.1

112
to 0.2 μM enzyme, 25 mM of CHES buffer, and 70 μM thymol blue at 25 °C. The
dehydration experiments were performed at pH 6.0 using 0.6 to 1.1 μM enzyme, 25 mM
MES buffer, and 100 μM chlorophenol red at 10 °C. In all experiments, the ionic
strength was maintained at 0.2 M using sodium sulfate. Saturated solutions of CO2 were
prepared by bubbling CO2 gas into water at 25.0 °C (saturating concentration 33.8 mM)
and diluting using two coupled, air-tight syringes.
Crystallography
Crystals of the mutants N67Q and Y7F-N67Q HCAII were obtained using the
hanging drop method (83). The crystallization drops were prepared by mixing 5 μL of
protein [concentration ~15 mg/mL in 100 mM Tris-HCl (pH 8.0)] with 5 μL of the
precipitant solution [1.25 M sodium citrate 100 mM Tris-Cl (pH 8.0)] against a well of
1000 μL precipitant solution at 20 °C. Crystals were observed within a week of the
crystallization setup at 293K.
The N67Q and Y7F-N67Q HCAII crystals were flash cooled using a 30% glycerol
cryo-protectant precipitant solution before mounting. The x-ray data obtained at 100K,
using an R-AXIS V++ optic system from Varimax HR a Rigaku RU-H3R Cu rotating
anode operating at 50 kV and 100 mA. The detector to crystal distance was set to 80
mm. The oscillation steps were 1 with a 6 min exposure per image for 360 degrees.
Data set statistics for the crystals are given in Table 1.
The model building was done manually with the program Coot and refinement was
carried out with PHENIX suite (86). The wild-type HCAII structure, Fisher et al. (96)
(PDB code: 1TBT) with the waters removed and both His64 and Asn 67 residues
mutated to Ala, was used as the starting phasing model.

113
Results
Catalysis
The pH dependence of catalysis of the hydration of CO2 determined by 18O
exchange was determined for each of the variants of HCAII in Table 5-2. The data for
Y7F HCAII were reported previously (57). These values are similar with values
between 50 and 120 μM-1s-1. The values of the pKa of the zinc-bound water, pKa ZnH2O,
(Table 5-3, column 2) are also quite similar. These similarities reflect the large distance
7 to 10 Å between these side chains of residues 7 and 67 from the catalytic zinc. The
range in values of kB was nearly ten-fold (Table 5-2).
Catalysis by Y7F-N67Q HCAII was measured by stopped-flow
spectrophotometry in the hydration and dehydration directions and compared with
values for wild type. The steady-state constants for these two enzymes were rather
equivalent (Table 5-4). The solvent H/D kinetic isotope effect was determined for the
turnover number for hydration, designated D(kcat)hydration, catalyzed by Y7F-N67Q HCAII.
This value determined at pH 8.4 and 25 °C was D(kcat)hydration = 3.1 ± 0.3.
Crystal structures
The crystal structures of the variants N67Q and Y7F-N67Q of HCAII were solved
to 1.5-1.6Å resolution (Figures 5-1, 5-2). The final statistics of the structures including
are listed in Table 5-1. No major structural perturbations were observed; the r.m.s.d. for
Cα atoms was 0.1 Å for both variants when compared to wild-type HCAII (PDB code 2ILI
(45)). In HCAII, His64 occupies an inward and outward conformation with respect to
orientation in the active-site cavity (97,98). The outward conformation was dominant in
N67Q HCAII while the inward conformation was observed in Y7F-N67Q HCAII, similar
to the Y7F variant previously published (57).

114
The hydrogen-bonded solvent network in the active site cavity depicted in
Figures 5-1 and 5-2 was conserved when compared with wild type. In the case of Y7F-
N67Q HCAII, which has the most efficient rate constant for proton transfer, the apparent
hydrogen bond between W2 and W3A, as well as that between W2 and W3B is longer
in comparison with wild type (Table 5-5). However, the distance between W2 and Nδ of
His64 is shorter (Table 5-5). The carboxamide group of the glutamine substitution at
residue 67 extended further into the active site cavity than the Asn residue it replaced.
An associated effect was an increase by about 0.5 Å compared with wild type in the
distance from the zinc-bound solvent to the Nδ of His64 the proton shuttle residue in its
out conformation in N67Q (Table 5-5).
The rate constant RH2O/[E] describes the release of H218O from the enzyme in the
dehydration direction (eq 4) and is the component of the 18O exchange that is
dependent on proton transfer. For the site-specific mutants H64G HCAII and N62L-
H64A-N67L HCAII, derivatives of imidazole and pyridine activated catalysis as
measured by the exchange of 18O between CO2 and water. These exogenous proton
donors were found to increase RH2O/[E] in a saturable manner, shown for the activation
of H64G HCAII by 4-methylimidazole (4-MI) in Figure 5-3. Such activation by 4-MI has
been reported earlier for H64A HCAII (95) and for H64W HCAII (99). The fit of these
data to the Michaelis form of eq 6 allowed estimates of the maximal rate constant for
activation kBobs. Data for activation of H64G HCAII by 4-MI demonstrate the greater
enhancement of catalysis in H2O compared with (98%) D2O (Figure 5-3). These
activations typically showed a solvent H/D isotope effect near 2.5 (see legend to Figure
5-3). The values of RH2O/[E] had not reached saturation at 200 mM of some proton
115
donors and had to be determined by extrapolation of activation plots to larger
concentrations of proton donors. Also, in some cases this required that we take account
of inhibition which was observed at higher levels of the derivatives of imidazole and
pyridine.
The pH profiles of RH2O/[E] catalyzed by these variants are typically bell shaped
reflecting proton transfer from the exogenous donor to the zinc-bound hydroxide in the
dehydration direction (eqs 2,4). Typical data are shown in Figure 5-4 for the activation
of H64G HCAII in the presence of a saturating level, 100 mM, of the activator 4-MI. The
data in Figure 5-4 for the values of RH2O/[E] in the presence 4-MI can be fit by eq 7
which describes activation as a single proton transfer between non-interacting donor
and acceptor groups. This fit provides estimates of the maximal, pH-independent value
of kB, the rate constant for proton transfer, and estimates of the values of the pKa of the
donor and acceptor. This fit of the activation of H64G HCAII by 4-MI yields values given
in the legend to Figure 2 including a pKa of 6.8 ± 0.1 for the zinc-bound water and 8.4 ±
0.1 for 4-methylimidazole. This is to be compared with the pKa of 7.2 ± 0.1 measured
for the zinc-bound water determined from the pH profile of kcatexch/Keff
CO2 catalyzed by
H64G HCAII (Figure 5-5), and with the solution pKa of 7.9 for 4-MI. For many of the
exogenous proton donors used here, the value of kB was determined using kBobs from
activation data as in Figure 5-3, and inserting into eq 7 the solution value of (Ka)donor and
the value of (Ka)ZnH2O obtained from the pH profile of kcatex /Keff
CO2.
The pH profiles of kcatex /Keff
CO2 for hydration of CO2 catalyzed by H64G HCAII and
the triple mutant N62L-H64A-N67L HCAII (Figure 5-5) give an estimate of the pKa for
the zinc-bound water molecule. Values of kcatex/Keff
CO2 are as great at 108 M-1s-1, close

116
to diffusion control. We sometimes observed a weak inhibition in kcatex/Keff
CO2 and
RH2O/]E] caused by addition of imidazole and pyridine derivatives with values of the
inhibition constant Ki between 150 mM and 250 mM (data not shown). This effect has
been described for H64A HCAII for the binding of 4-MI as a second sphere ligand of the
zinc (100) and in Methods.
Free energy plots. Free energy plots were constructed for kB in catalysis by H64G
HCAII in H2O and (98%) D2O (Figure 5-6), and for the triple mutant (Figure 5-7). These
free energy plots show curvature of kB, especially for the triple mutant in which the pKa
of the zinc-bound water is low at 6.1. This is lower than in wild type or H64G HCAII for
which the pKa is near 7. What is notable about these data is that the lower pKa of the
zinc-bound water for N62L-H64A-N67L HCAII in effect shifts the free energy plot to the
left (Figure 5-7); this allows a more complete view of the curvature of the free energy
plot and reveals an inverted region for the triple mutant (at ΔpKa > -0.5 in Figure 5-7).
Discussion
Solvent Network and Proton Transfer
These catalytic and structural results on variants of HCAII with amino-acid
replacements at residues in contact with water molecules in the active-site cavity
provide insight into the proton transfer rates in this protein environment. The rate
constant for proton transfer kB for N67Q-Y7F HCAII of 9 μs-1 (Table 5-2) is the fastest
measured for a variant of this isozyme, is derived from the 18O exchange data, and
represents proton transfer to the zinc-bound hydroxide, presumably from the proton
shuttle His64. The previously studied Y7F HCAII was also found to have rapid proton
transfer at kB of 4 μs-1 (57). The value for wild-type HCAII is kB = 0.8 μs-1 (Table 5-2)
(38).

117
These high kB values observed for Y7F and N67Q-Y7F HCAII were not explained
by differences in the values of the pKa of the proton donor (His64) and acceptor (zinc-
bound hydroxide). This is shown in Table 3 in which the values of pKa are similar for
these variants. Previous reports showed that the pH dependence of kB is rather flat in
the vicinity of ∆pKa (pKa ZnH2O–pKa His64) near zero (1,6).
When catalysis was measured by stopped-flow spectrophotometry, the steady-
state constants kcat did not show the magnitude of differences between wild type and
Y7F-N67Q HCAII observed with kB from the 18O exchange method (Table 5-4). The
turnover number kcat for wild type HCAII is limited in rate by proton transfer at steady
state, as determined in part from the solvent H/D kinetic isotope effect D(kcat)hydration of
3.8 (93, 101). When we measured D(kcat)hydration for Y7F-N67Q HCAII we obtained the
somewhat lower value of 3.1 ± 0.3. This is consistent with rate contributing steps for kcat
in Y7F-N67Q that do not involve proton transfer and are not present in kB, which
contains fewer steps of the catalysis. That is, the magnitude of kB is determined
predominantly by proton transfer for both variants, while kcat involves steps from the
enzyme-substrate complex to the completion of the catalysis and may contain other
steps which do not involve proton transfer such as product dissociation. Hence, we
suggest that kB is the best measure of proton transfer in this work.
In the cases of Y7F and N67Q-Y7F HCAII the enhanced rate constants are
associated with an appreciable inward orientation of the His64 side chain (Figure 5-2).
However, the orientation of His64 has not been shown to affect the rate constant for
proton transfer according to the following data. The variant N62L has His64
predominantly inward and N67L predominantly outward with other aspects of their

118
protein structure nearly identical, yet their values of kB are the same at 0.2 μs-1 (39). The
same conclusion was reached using the mutant T200S (24). This is supported by
computational studies which suggest that the orientation of His64 does not influence
this intramolecular proton transfer rate (87).
Although low energy networks of ordered water are observed in crystal structures
and are considered significant to understanding the proton transfer pathway, clusters of
hydrogen bonded water in the active-site cavity in solution have lifetimes typically in the
picosecond range (108). The destruction of the water network caused by bulky,
hydrophobic residues in the active site cavity is associated with substantial decrease in
rate of proton transfer (39,102). Comparison of the crystal structures of the variants of
Table 5-1 shows that the two most efficient enzymes in proton transfer Y7F and Y7F-
N67Q HCAII have less branched water structure, specifically water molecule W3A is not
observed in Y7F and is not within hydrogen bond distance of the chain in Y7F-N67Q
(Figure 5 -2; Table 5-5). Computations show that proton transfer through an
unbranched, hydrogen-bonded water network is more rapid than through a branched
pathway (47,103). This feature of a more direct pathway in the structures of Y7F and
Y7F-N67Q HCAII appears to be the most relevant to explaining the proton transfer
efficiencies of these variants. We also point out that this double mutant has the smallest
distance among the variants examined here between the zinc-bound solvent and Nδ of
His64 (Table 5-5).
We attempted to demonstrate the enhanced proton transfer capacity of Y7F-N67Q
HCAII compared with wild type using stopped flow spectrophotometry in a steady state
experiment. However, we were not able to demonstrate this due to the difficulties with

119
buffers which are required to measure catalysis in the stopped-flow experiment. We are
constrained to use buffers that do not enter the active site cavity and exchange protons,
buffers such as imidazole derivatives. We used buffers Ches and Mes which have a
very limited capacity to enter the active site cavity but promote catalysis by exchange of
buffers with His64. However, in order to demonstrate the enhance intramolecular rate of
proton transfer in Y7F-N67Q HCAII, we need to enhance buffer to the extent that this
intramolecular step is strongly rate contributing. This means using substantial
concentrations of the these buffers, say 100 mM, under which conditions the pH change
during catalysis is small and rates are difficult to measure.
This study with the greatly enhanced proton transfer of Y7F-N67Q HCAII provides
the clearest example to date of the relevance of the ordered water structure to rate
constants for proton transfer. The complement of these studies with the pertinent
computational results of rapid proton transfer through unbranched water chains
(103,104) is gratifying. It appears that this water structure as observed in crystal
structures is a better predictor of efficient proton transfer than the orientation of the side
chain of His 64.
Marcus Theory
To quantitate the extent of curvature of the free energy plots (Figure 4,5) and the
observation of an inverted region, we use the Marcus theory for proton transfer (105) as
applied to catalysis by carbonic anhydrase as described in earlier work (11). The
observed activation barriers are obtained from the pH independent, maximal values kB,
as in ΔG‡obs = -RTln(hkB/kT), where h is the Planck constant and k is the Boltzmann
constant. The observed free energy of reaction is obtained from ΔpKa of the reactants,
ΔGo = RTln[(Ka)acceptor/(Ka)donor]. In the Marcus approach, the observed overall activation
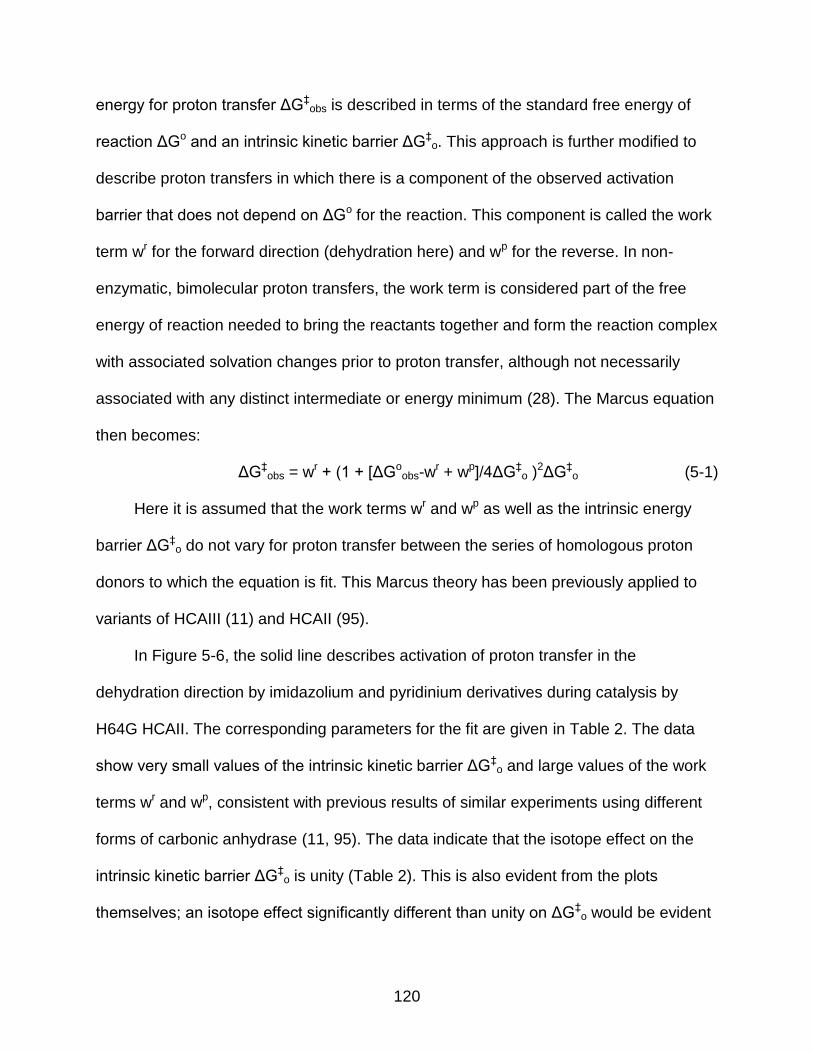
120
energy for proton transfer ΔG‡obs is described in terms of the standard free energy of
reaction ΔGo and an intrinsic kinetic barrier ΔG‡o. This approach is further modified to
describe proton transfers in which there is a component of the observed activation
barrier that does not depend on ΔGo for the reaction. This component is called the work
term wr for the forward direction (dehydration here) and wp for the reverse. In non-
enzymatic, bimolecular proton transfers, the work term is considered part of the free
energy of reaction needed to bring the reactants together and form the reaction complex
with associated solvation changes prior to proton transfer, although not necessarily
associated with any distinct intermediate or energy minimum (28). The Marcus equation
then becomes:
ΔG‡obs = wr + (1 + [ΔGo
obs-wr + wp]/4ΔG‡
o )2ΔG‡
o (5-1)
Here it is assumed that the work terms wr and wp as well as the intrinsic energy
barrier ΔG‡o do not vary for proton transfer between the series of homologous proton
donors to which the equation is fit. This Marcus theory has been previously applied to
variants of HCAIII (11) and HCAII (95).
In Figure 5-6, the solid line describes activation of proton transfer in the
dehydration direction by imidazolium and pyridinium derivatives during catalysis by
H64G HCAII. The corresponding parameters for the fit are given in Table 2. The data
show very small values of the intrinsic kinetic barrier ΔG‡o and large values of the work
terms wr and wp, consistent with previous results of similar experiments using different
forms of carbonic anhydrase (11, 95). The data indicate that the isotope effect on the
intrinsic kinetic barrier ΔG‡o is unity (Table 2). This is also evident from the plots
themselves; an isotope effect significantly different than unity on ΔG‡o would be evident

121
in a greater difference in curvature between the data in H2O and D2O. A new feature of
these data is the expression of the overall solvent H/D isotope effect, approximately 2.5,
in the work terms although there is considerable propagation of error. This is contrary to
the assumption that was made in our the previous interpretations of the free energy plot
for proton transfer in carbonic anhydrase (11) where it was assumed that the H/D
isotope effect was expressed in intrinsic kinetic barrier and not in the work terms; this
assumption led to values of wr and wp that were not in agreement with values obtained
using only H2O.
The hint of an inverted region in Figure 5-4 appears supported in Figure 5-7 with a
similar series of experiments using the triple mutant N62L-H62A-N67L HCAII. This
variant has the advantage that the pKa is 6.1 for the zinc-bound water molecule, lower
than the value of 7.2 for H64G, shifting the data to lower values of ∆pKa, as shown
comparing Figures 5 and 4. The parameters of the Marcus equation are given in the
legend to Figure 5 and are similar to those of H64G HCAII.
The very low values of ΔG‡o in Table 5-6 indicate a facile and nearly barrierless
proton transfer, if this application of classical Marcus theory is applicable. These data
are obtained for proton transfer from high concentrations of exogenous proton donors
that we estimate bind weakly at undetermined sites within the active-site cavity. There is
a barrier near 3 to 5 kcal/mol for thermoneutral proton transfer across a hydrogen bond
of double potential-minimum in water. The much smaller barriers for ΔG‡o in Table 5-6
are consistent with proton transfer across a bond more closely related to a low-barrier
hydrogen bond. In fact, a short, strong hydrogen bond has been noted in the active site
of HCAII (69), and its formation may be a necessary precursor to proton transfer. This
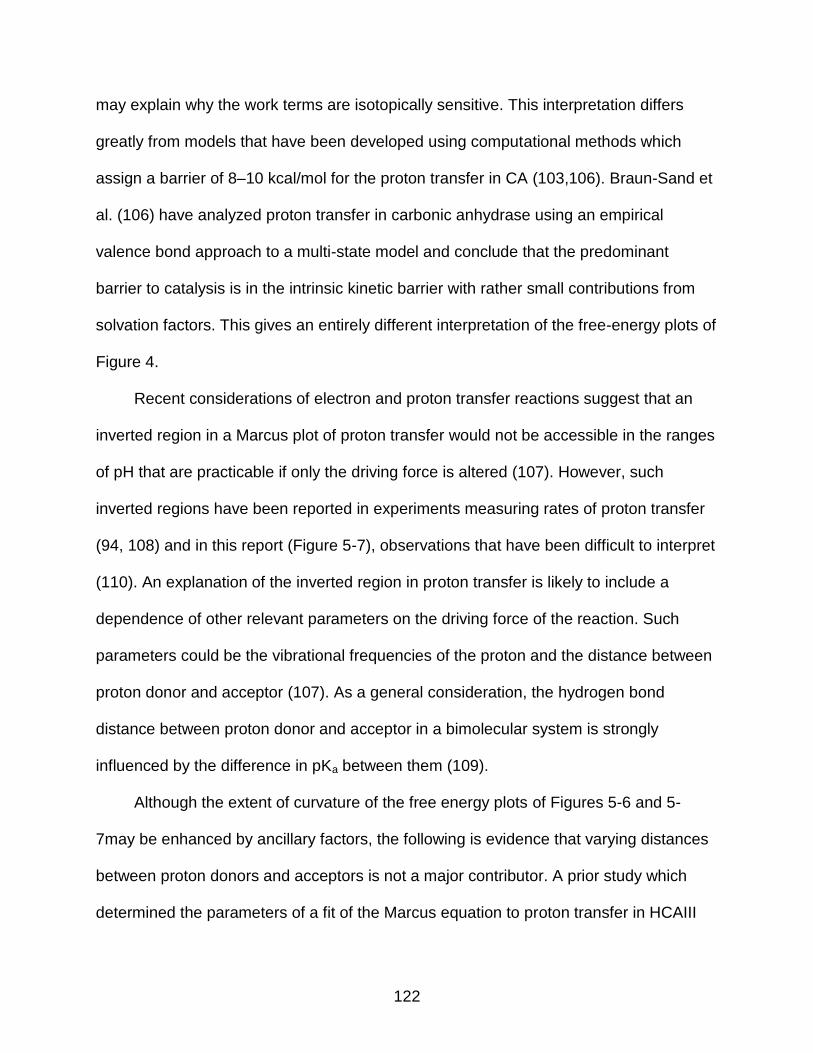
122
may explain why the work terms are isotopically sensitive. This interpretation differs
greatly from models that have been developed using computational methods which
assign a barrier of 8–10 kcal/mol for the proton transfer in CA (103,106). Braun-Sand et
al. (106) have analyzed proton transfer in carbonic anhydrase using an empirical
valence bond approach to a multi-state model and conclude that the predominant
barrier to catalysis is in the intrinsic kinetic barrier with rather small contributions from
solvation factors. This gives an entirely different interpretation of the free-energy plots of
Figure 4.
Recent considerations of electron and proton transfer reactions suggest that an
inverted region in a Marcus plot of proton transfer would not be accessible in the ranges
of pH that are practicable if only the driving force is altered (107). However, such
inverted regions have been reported in experiments measuring rates of proton transfer
(94, 108) and in this report (Figure 5-7), observations that have been difficult to interpret
(110). An explanation of the inverted region in proton transfer is likely to include a
dependence of other relevant parameters on the driving force of the reaction. Such
parameters could be the vibrational frequencies of the proton and the distance between
proton donor and acceptor (107). As a general consideration, the hydrogen bond
distance between proton donor and acceptor in a bimolecular system is strongly
influenced by the difference in pKa between them (109).
Although the extent of curvature of the free energy plots of Figures 5-6 and 5-
7may be enhanced by ancillary factors, the following is evidence that varying distances
between proton donors and acceptors is not a major contributor. A prior study which
determined the parameters of a fit of the Marcus equation to proton transfer in HCAIII

123
(11) differs from the current study in that the proton transfer is intramolecular, from the
proton shuttle residue His64 to the zinc-bound hydroxyl in a series of variants with
different values of pKa for the zinc-bound water. This provides much less flexibility in
distance between proton donor and acceptor. It is notable that the value of the intrinsic
barrier for proton transfer in HCAII was ΔG‡o = 1.4 ± 0.3 kcal/mol, still very small, with
values of the work function 6 – 10 kcal/mol (11).

124
Table 5-1. Crystal Structure Data and Refinement Statistics for N67Q and Y7F+N67Q HCAII
Data-collection statistics N67Q Y7F-N67Q
Wavelength (Å) 0.9724 0.9724 Space group P 21 P 21
Unit-cell parameters (Å,º) a, b, c (Å); β (°)
42.0, 41.2, 72.1; 104.3 42.1, 41.2, 71.9; 104.5
Number of unique reflections Redundancy Completion %
35,820 3.6 (2.5) 97.7 (80.5)
31,729 3.8(3.6) 99.7 (99.8)
Resolution (Å) aRsym
I/σ(I)
50.0-1.50 (1.55-1.50) 7.3 (38.9) 14.5 (4.1)
50.0-1.60 (1.66-1.60) 8.4 (47.3) 13.1 (2.8)
bRcryst (%)
cRfree(%) 18.5 21.4
16.6 20.5
Amino acid residues 3-261 3-261 No. of protein atoms 2180 2199 No. of H2O molecules 376 319 R.m.s.d. for bond lengths (Å), angles (º)
0.006 1.086
0.006 1.019
Ramachandran statistics (%) Most favored, allowed, outlier
87.1, 12.4, 0.0 86.6, 13.4, 0.0
Average B factors (Å2) main-, side-chain, Zn, solvent
18.2, 21.4, 11.5, 29.6 19.8, 22.0, 10.5, 28.7
aRsym = Σ |I-<I>|/ Σ <I>. bRcryst = (Σ |Fo|-|Fc|/ Σ |Fobs| ) x 100 . cRfree is calculated in same manner as bRcryst, except that it uses 5% of the reflection data omitted from refinement. *Values in parenthesis represent highest resolution bin.

125
Table 5-2. Maximal Values of Rate Constants for Hydration of CO2 and Proton Transfer in Dehydration Catalyzed by HCAII and Variants
Enzyme kcatexch/Keff
CO2 CO2 hydration (μM-1s-1) a
kB
proton transfer (μs-1) b
Wild type 120 0.8 Y7F c 120 3.9 N67Q 50 1.7
Y7F-N67Qd 80 9.0 a Measured from the exchange of 18O between CO2 and water in the hydration direction (eq 5). Derived for each variant by a fit of the data (as in Figure 2) to a single ionization. The standard errors for these rate constants are generally 15% or less. b Measured from the exchange of 18O between CO2 and water using eq 6 in the dehydration direction. The standard errors are 22% or less. c Data at 10°C from Fisher et al. (16). d Data at 10°C.
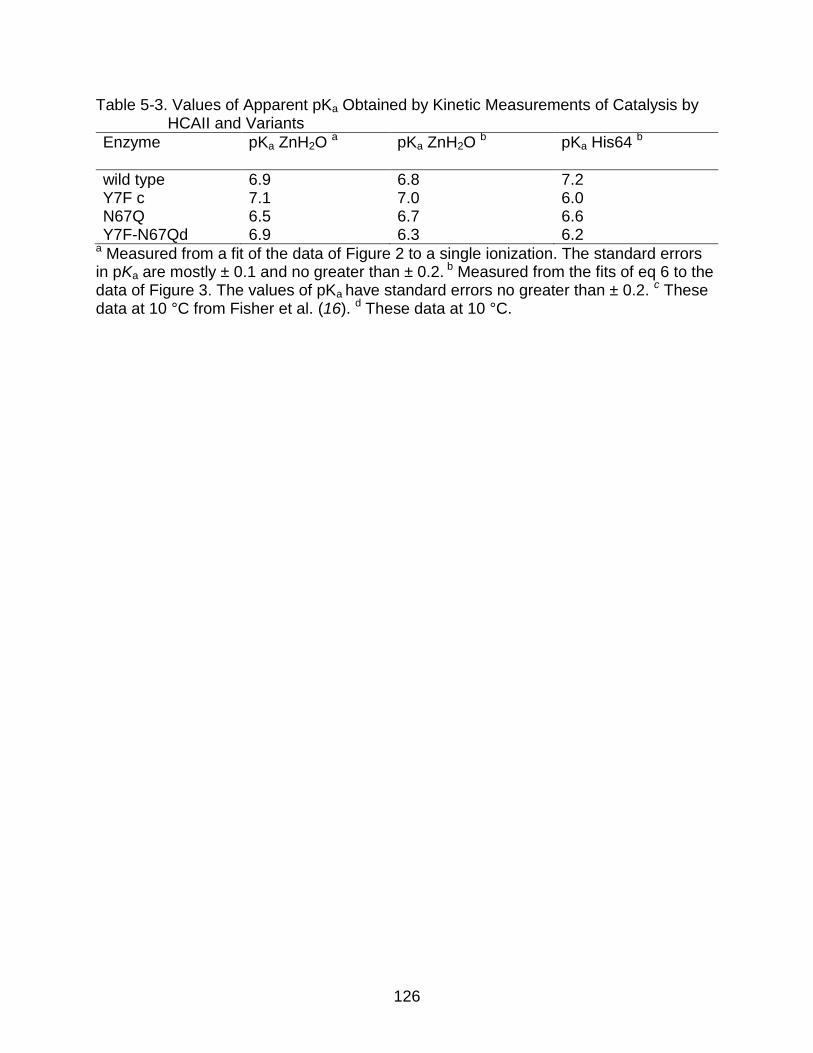
126
Table 5-3. Values of Apparent pKa Obtained by Kinetic Measurements of Catalysis by HCAII and Variants
Enzyme pKa ZnH2O a
pKa ZnH2O b
pKa His64 b
wild type 6.9 6.8 7.2 Y7F c 7.1 7.0 6.0 N67Q 6.5 6.7 6.6 Y7F-N67Qd 6.9 6.3 6.2
a Measured from a fit of the data of Figure 2 to a single ionization. The standard errors in pKa are mostly ± 0.1 and no greater than ± 0.2. b Measured from the fits of eq 6 to the data of Figure 3. The values of pKa have standard errors no greater than ± 0.2. c These data at 10 °C from Fisher et al. (16). d These data at 10 °C.
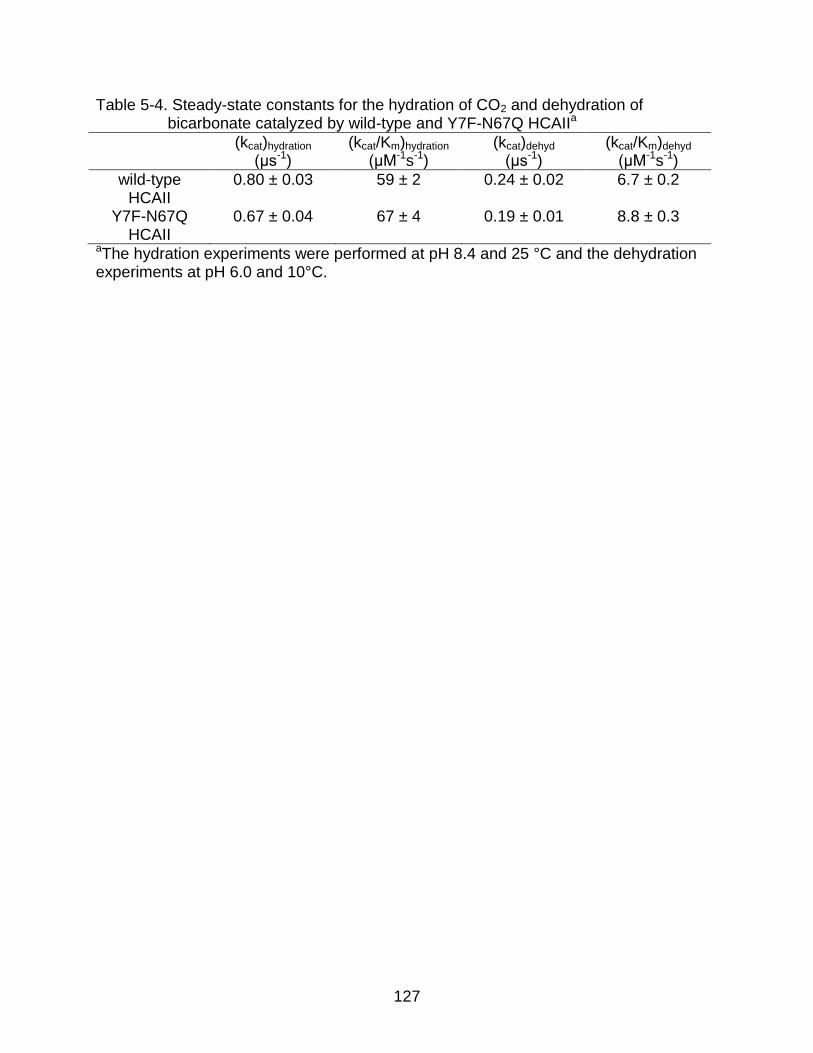
127
Table 5-4. Steady-state constants for the hydration of CO2 and dehydration of bicarbonate catalyzed by wild-type and Y7F-N67Q HCAIIa
(kcat)hydration (μs-1)
(kcat/Km)hydration (μM-1s-1)
(kcat)dehyd (μs-1)
(kcat/Km)dehyd (μM-1s-1)
wild-type HCAII
0.80 ± 0.03 59 ± 2 0.24 ± 0.02 6.7 ± 0.2
Y7F-N67Q HCAII
0.67 ± 0.04 67 ± 4 0.19 ± 0.01 8.8 ± 0.3
aThe hydration experiments were performed at pH 8.4 and 25 °C and the dehydration experiments at pH 6.0 and 10°C.

128
Table 5-5. Comparison of Distances (Å) in the Proposed hydrogen Bond Network: Determined from the Crystal Structures of Variants of HCAII. The error in these distances was 0.16 Å
WTa Y7Fb Y7F-N67Q N67Q
ZnSolvent-W1 2.7 2.7 2.7 2.7
W1-W2 2.7 2.6 2.6 2.9
W2-W3a 2.8 n/a 4.3 2.9
W2-W3b 2.7 2.6 3.1 2.4
W2-H64(Nδ) 3.2/6.3 3.2 2.8 6.7
ZnSolvent-H64(Nδ) 7.2/10.0 7.1 6.7 10.5
H64 in/out in in out aThese data from (45),b These data from (16)

129
Figure 5-1. Structure of the active site of N67Q HCAII. Active-site residues are shown
as purple stick models. Thr199, Thr200, as well as the three histidine residues (His94, His96, His119) coordinating the zinc (gray sphere) are not labeled. The oxygen atoms of water molecules identified in the active-site cavity are shown as red spheres. Presumed hydrogen bonds are represented as dashed red lines. This figure was generated and rendered using Pymol

130
Figure 5-2. Active-site structures for Y7FY7F-N67Q HCAII crystallized at pH 8.0. This
diagram was constructed as described as in Figure 5

131
Table 5-6. Parameters of the Marcus Equation for Activation of H64G HCAII by Exogenous Proton Donors in H2O and D2O (98%)a
H2O D2O Solvent H/D Kinetic Isotope
Effectb
ΔGIo 0.21 + 0.04 0.18 + 0.06 0.95 + 0.11
wr 8.2 + 0.1 8.7 + 0.2 2.3 + 0.9
wp 8.2 + 0.1 8.6 + 0.2 2.0 + 0.7 a Conditions and proton donors as described in Figure 2. b Solvent hydrogen isotope effect = exp[-ΔΔGI
o/RT] or exp[-Δwr/RT]
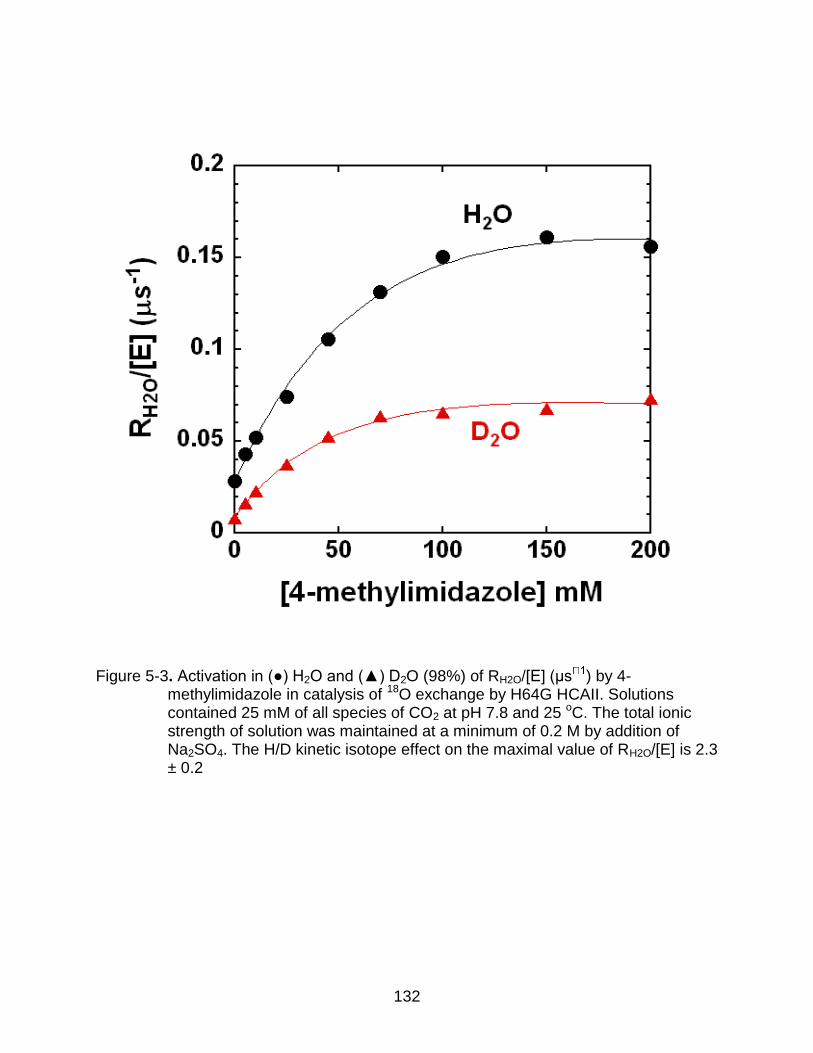
132
Figure 5-3. Activation in (●) H2O and (▲) D2O (98%) of RH2O/[E] (μs ) by 4-
methylimidazole in catalysis of 18O exchange by H64G HCAII. Solutions contained 25 mM of all species of CO2 at pH 7.8 and 25 oC. The total ionic strength of solution was maintained at a minimum of 0.2 M by addition of Na2SO4. The H/D kinetic isotope effect on the maximal value of RH2O/[E] is 2.3 ± 0.2

133
3
4
5
6
5 6 7 8 9
pH
log
( R
H2
O/[
E]
)
Figure 5-4. The dependence on pH of the rate constant RH2O/[E] (s-1) catalyzed by
H64G HCAII and measured in the absence of buffer (□), and in the presence of 100 mM 4-methylimidazole (∆). For comparison, the values of wild-type HCAII in the absence of buffer are given (●). Data were obtained at 25 °C using solutions containing 25 mM of all species of CO2. Ionic strength was maintained at a minimum of 0.2 M by addition of sodium sulfate. The solid line for H64G in the presence of 4-MI is a fit of eq 7 to the data with the rate constant for proton transfer kB = 0.51 ± 0.03 μs-1; pKa ZnH2O = 6.8 ± 0.1; and pKa 4-MI = 8.4 ± 0.1. For wild-type HCAII in the absence of buffer these values are kB = 0.8 μs-1; pKa ZnH2O = 6.8; pKa His64 = 7.2 (26)
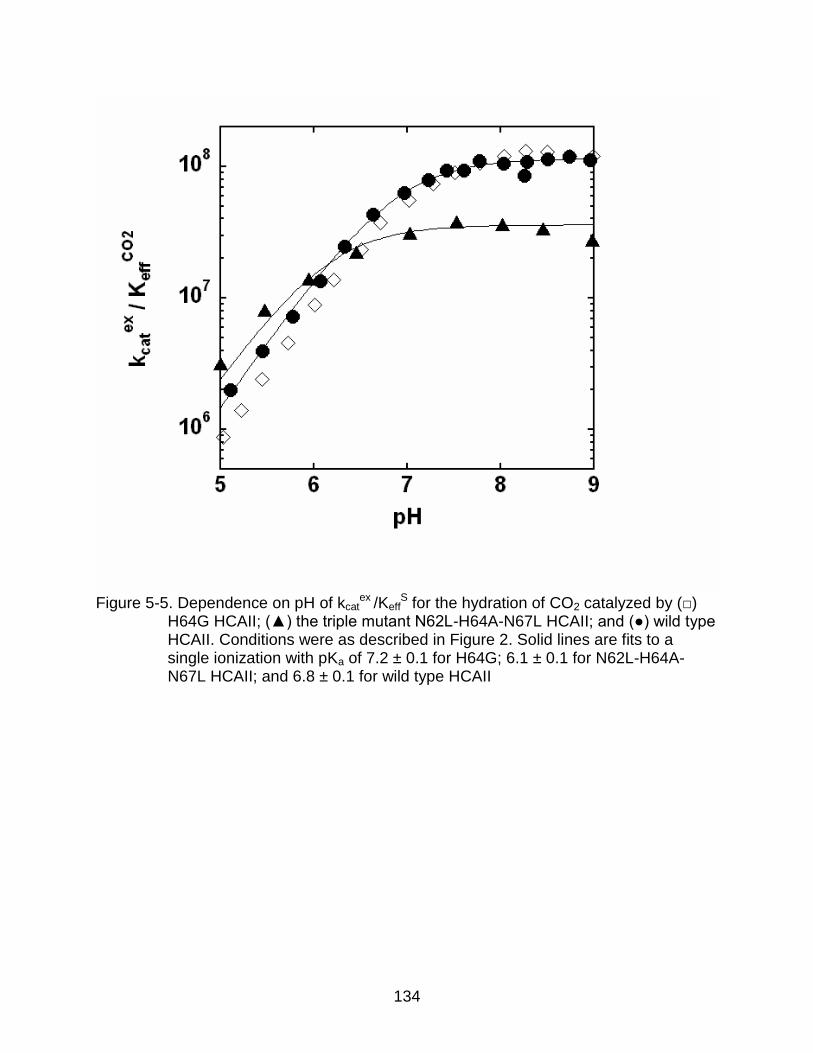
134
Figure 5-5. Dependence on pH of kcat
ex /KeffS for the hydration of CO2 catalyzed by (□)
H64G HCAII; (▲) the triple mutant N62L-H64A-N67L HCAII; and (●) wild type HCAII. Conditions were as described in Figure 2. Solid lines are fits to a single ionization with pKa of 7.2 ± 0.1 for H64G; 6.1 ± 0.1 for N62L-H64A-N67L HCAII; and 6.8 ± 0.1 for wild type HCAII

135
Figure 5-6. Values in (●) H2O and (▲) D2O (98%) for kB (s-1) for the activation of
catalysis by H64G HCAII versus the difference in pKa values of the zinc-bound water and the exogenous proton donor. Conditions were as described in Figure 1, except the pH of each experiment was at the pKa of the exogenous donor used. The following are the individual proton donors with their corresponding solution values of pKa under our conditions: a, 1,2-dimethylimidazole (pKa = 8.3); b, 2-methylimidazole (8.2); c, 2-ethylimidazole (8.0); d, 4-methylimidazole (7.9); e, imidazole (7.0); f, 3,4-dimethylpyridine (6.6); g, 4-methylpyridine (6.1); h, 3-methylpyridine (5.8); i, pyridine (5.3). The pKa of the zinc-bound water molecule in H64G is pKa ZnH2O = 6.8 ± 0.1. The solid lines are a fit of the Marcus equation to the data with parameters given in Table 2
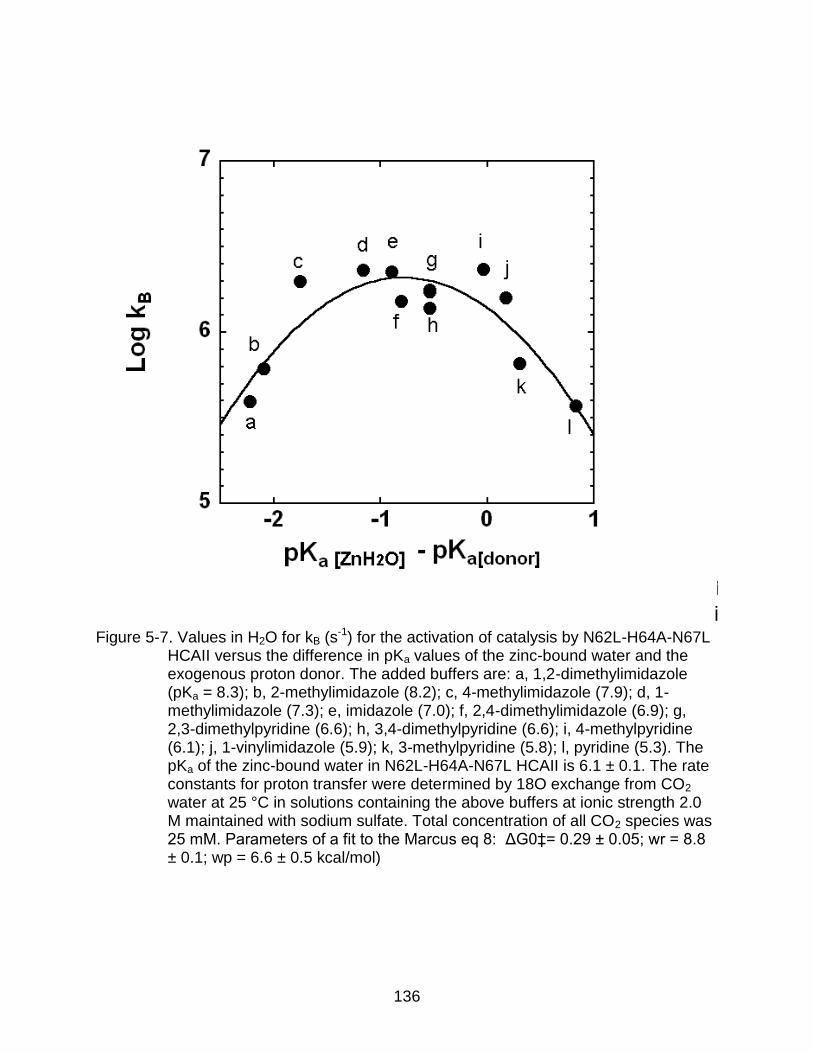
136
Figure 5-7. Values in H2O for kB (s-1) for the activation of catalysis by N62L-H64A-N67L
HCAII versus the difference in pKa values of the zinc-bound water and the exogenous proton donor. The added buffers are: a, 1,2-dimethylimidazole (pKa = 8.3); b, 2-methylimidazole (8.2); c, 4-methylimidazole (7.9); d, 1-methylimidazole (7.3); e, imidazole (7.0); f, 2,4-dimethylimidazole (6.9); g, 2,3-dimethylpyridine (6.6); h, 3,4-dimethylpyridine (6.6); i, 4-methylpyridine (6.1); j, 1-vinylimidazole (5.9); k, 3-methylpyridine (5.8); l, pyridine (5.3). The pKa of the zinc-bound water in N62L-H64A-N67L HCAII is 6.1 ± 0.1. The rate constants for proton transfer were determined by 18O exchange from CO2 water at 25 °C in solutions containing the above buffers at ionic strength 2.0 M maintained with sodium sulfate. Total concentration of all CO2 species was 25 mM. Parameters of a fit to the Marcus eq 8: ΔG0‡= 0.29 ± 0.05; wr = 8.8 ± 0.1; wp = 6.6 ± 0.5 kcal/mol)

137
CHAPTER 6 FUTURE STUDIES
HCAII in Environmental and Artificial Lung Research
Emission of CO2 has a severe impact on climate and is considered a global
pollution problem, with implications in global warming (115). To combat this problem,
research has focused on biochemical fixation of CO2 (116). This requires fast
concentration and solubilization of CO2. The capture of CO2 collected in the bioreactor
is still challenging. Much work has focused on developing a model system that can
efficiently concentrate CO2 and remove it from the atmosphere. Science has look
toward biotechnological methods to solve this problem.
The catalytic efficiency of HCAII has made this enzyme a target for environmental
research. Researchers have been considering HCAII as a component in bioreactors to
aid in the removal of CO2 from the atmosphere (112, 113). One of the focuses of this
research is attempting to develop a more efficient version of HCAII. It has been shown
that mutations in the CO2 binding pocket of HCAII can impact CO2 hydration (40).
However, a HCAII variant in which catalytically efficiency has increased has yet to be
discovered.
Future work involves the discovery of a more efficient mutant of HCAII. Certain
amino acid residues in the binding pocket of HCAII are implicated in the control of
catalysis (40,41) and mutations in this region may promote faster hydration of CO2. The
goal would be to make mutations in the binding pocket that result in increased catalytic
efficiency. Research discussed in Chapter 4 in corroboration with previous data (40)
speculates that mutations at position 143 may not effective in increasing efficiency.
Size and hydrophobicity of substituted residues as well as conformational manipulations
138
resulting from substituted residues should also be considered. The more efficient
variants can then be used in bioreactors for fast sequestration and concentration of
CO2. This would require development of a practical production process in regards to
expression and purification of large quantities of active HCAII, but development of a
more efficient variant of HCAII is the first step.
While HCAII has been proposed for assistance in global warming, it also has
implications for artificial lung research. A key biological function of the lungs is removal
of CO2. HCAII is expressed in the lungs and it participates in this process (114). As a
result, HCAII would be valuable in the development of improved artificial lung
technology.
Future works focuses on development of temperature stable mutants for use in
artificial lungs. The instability of enzymes at various temperatures and conditions make
thermally stable HCAII essential. These variants still maintain their high catalytic
activity. Mutations to increase melting temperature, primarily cysteine mutations to
promote disulfide bridge formation, are a primary area of focus. These highly active and
thermally stable variants of HCAII would be valuable for use in artificial lung
development to assist in the removal of CO2 from the body.
HCAII and Proton Transfer
The proton transfer mechanism is highly complex. This involves the movement
of protons over long distances. The distance from the zinc-bound solvent to His64 is
around 7 Å. Human Carbonic anhydrase II has a very well understood proton transfer
mechanism and if further work is done to better understand proton transfer in this
enzyme, the information attained could provide insight into the complex proton transfer
mechanisms of other enzymes, like bacteriorhodopsin and ATP synthase. It could also
139
prove beneficial as a mimic for proteins in the same family like HCAIX, a membrane
protein that is difficult to solve by crystallography, but has the same proton transfer
mechanism that is implicated in tumorigenesis (18, Figure 6-1).
Future work involves developing HCAII variants with a linear solvent network.
Data from Y7F and Y7F/N67Q HCAII indicate faster proton transfer through a more
linear solvent network. Further mutagenesis in the hydrophilic region should be focused
on discovering residues that will promote removal of branched water molecules W3A
and W3B (discussed in Chapter 5). The proton transfer rates would be measured and
the impact of linearity would be deduced based on the fold changes compared to other
variants. Development of a linear solvent network in HCAII will help to validate the
claim that a linear water network would promote faster proton transfer, or prompt the
consideration of other aspects, like pKa or the distance between the proton shuttle and
solvent network, that can also contribute to the complex nature of proton transfer.

140
Figure 6-1. Overlay of wild type HCAII (pink, PDB ID: 2ILI) and HCAIX mimic (yellow).
The zinc atom is represented as a gray sphere and the bound water/hydroxide by a red sphere. The r.m.s.d. is 0.24 Å. Figure was made using PyMol

141
APPENDIX SEQUENCE ALIGNMENT OF MAMMALIAN CAS

142
1 10310 20 30 40 50 60 70 80 90(1)
----------------------------------ASPDWGYDDKNGPEQ----------WSKLYPIANG-----NNQSPVDIKTSETKHDTSLKPISVSYNPAhCA1 (1)
----------------------------------MSHHWGYGKHNGPEH----------WHKDFPIAKG-----ERQSPVDIDTHTAKYDPSLKPLSVSYDQAhCA2 (1)
----------------------------------MAKEWGYASHNGPDH----------WHELFPNAKG-----ENQSPIELHTKDIRHDPSLQPWSVSYDGGhCA3 (1)
----------------------------------AESHWCYEVQAESSN----------YPCLVPVKWGGNCQKDRQSPINIVTTKAKVDKKLGRFFFSGYDKhCA4 (1)
-----------------------------------------------------------------CATG-----TRQSPINIQWKDSVYDPQLAPLRVSYDAAhCA5A (1)
MVVMNSLRVILQASPGKLLWRKFQIPRFMPARPCSLYTCTYKTRNRALHP--------LWESVDLVPGG-----DRQSPINIRWRDSVYDPGLKPLTISYDPAhCA5B (1)
-----------------------------------MSDWTYSEGALDEAH---------WPQHYPACGG-----QRQSPINLQRTKVRYNPSLKGLNMTGYEThCA6 (1)
-------------MHHHHHHSSGVDLGTENLYFQSMHGWGYGQDDGPSH----------WHKLYPIAQG-----DRQSPINIISSQAVYSPSLQPLELSYEAChCA7 (1)
----------------------SMADLSFIEDTVAFPEKEEDEEEEEEGVEWGYEEGVEWGLVFPDANG-----EYQSPINLNSREARYDPSLLDVRLSPNYVhCA8 (1)
-----------------------------------GPDQSHWRYGGDPP----------WPRVSPACAG-----RFQSPVDIRPQLAAFSPALRPLELLGFQLhCA9 (1)
------MEIVWEVLFLLQANFIVCISAQQNSPKIHEGWWAYKEVVQGSFVPVPSFWGLVNSAWNLCSVG-----KRQSPVNIETSHMIFDPFLTPLRINTGGRhCA10 (1)
----MGAAARLSAPRALVLWAALGAAAHIGPAPDPEDWWSYKDNLQGNFVPGPPFWGLVNAAWSLCAVG-----KRQSPVDVELKRVLYDPFLPPLRLSTGGEhCA11 (1)
-----------------------------------ASKWTYFGPDGENS----------WSKKYPSCGG-----LLQSPIDLHSDILQYDASLTPLEFQGYNLhCA12 (1)
-------------------------------GSMSRLSWGYREHNGPIH----------WKEFFPIADG-----DQQSPIEIKTKEVKYDSSLRPLSIKYDPShCA13 (1)
-----------------MLFSALLLEVIWILAADGGQHWTYEGPHGQDH----------WPASYPECGN-----NAQSPIDIQTDSVTFDPDLPALQPHGYDQhCA14 (1)
--------------MWALDFLLSFLLIQLAAQVDSSGTWCYDSQDPKCG-------PAHWKELAPACGG-----PTQSPINIDLRLVQRDYTLKPFIFQGYDSmCA15 (1)
W Y G W LYP A G RQSPINI T V YDPSL PL LS Consensus (1)
Figure A-1. Sequence alignment of mammalian CAs
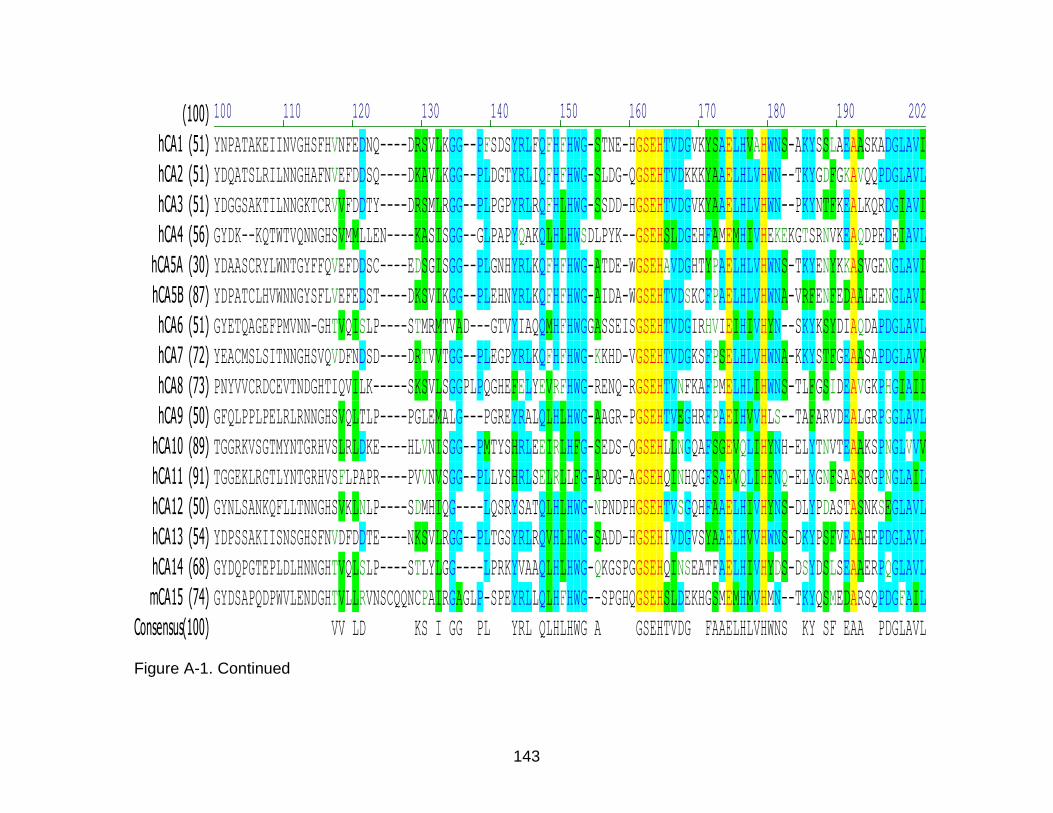
143
100 202110 120 130 140 150 160 170 180 190(100)
YNPATAKEIINVGHSFHVNFEDNQ----DRSVLKGG--PFSDSYRLFQFHFHWG-STNE-HGSEHTVDGVKYSAELHVAHWNS-AKYSSLAEAASKADGLAVIhCA1 (51)
YDQATSLRILNNGHAFNVEFDDSQ----DKAVLKGG--PLDGTYRLIQFHFHWG-SLDG-QGSEHTVDKKKYAAELHLVHWN--TKYGDFGKAVQQPDGLAVLhCA2 (51)
YDGGSAKTILNNGKTCRVVFDDTY----DRSMLRGG--PLPGPYRLRQFHLHWG-SSDD-HGSEHTVDGVKYAAELHLVHWN--PKYNTFKEALKQRDGIAVIhCA3 (51)
GYDK--KQTWTVQNNGHSVMMLLEN----KASISGG--GLPAPYQAKQLHLHWSDLPYK--GSEHSLDGEHFAMEMHIVHEKEKGTSRNVKEAQDPEDEIAVLhCA4 (56)
YDAASCRYLWNTGYFFQVEFDDSC----EDSGISGG--PLGNHYRLKQFHFHWG-ATDE-WGSEHAVDGHTYPAELHLVHWNS-TKYENYKKASVGENGLAVIhCA5A (30)
YDPATCLHVWNNGYSFLVEFEDST----DKSVIKGG--PLEHNYRLKQFHFHWG-AIDA-WGSEHTVDSKCFPAELHLVHWNA-VRFENFEDAALEENGLAVIhCA5B (87)
GYETQAGEFPMVNN-GHTVQISLP----STMRMTVAD---GTVYIAQQMHFHWGGASSEISGSEHTVDGIRHVIEIHIVHYN--SKYKSYDIAQDAPDGLAVLhCA6 (51)
YEACMSLSITNNGHSVQVDFNDSD----DRTVVTGG--PLEGPYRLKQFHFHWG-KKHD-VGSEHTVDGKSFPSELHLVHWNA-KKYSTFGEAASAPDGLAVVhCA7 (72)
PNYVVCRDCEVTNDGHTIQVILK-----SKSVLSGGPLPQGHEFELYEVRFHWG-RENQ-RGSEHTVNFKAFPMELHLIHWNS-TLFGSIDEAVGKPHGIAIIhCA8 (73)
GFQLPPLPELRLRNNGHSVQLTLP----PGLEMALG---PGREYRALQLHLHWG-AAGR-PGSEHTVEGHRFPAEIHVVHLS--TAFARVDEALGRPGGLAVLhCA9 (50)
TGGRKVSGTMYNTGRHVSLRLDKE----HLVNISGG--PMTYSHRLEEIRLHFG-SEDS-QGSEHLLNGQAFSGEVQLIHYNH-ELYTNVTEAAKSPNGLVVVhCA10 (89)
TGGEKLRGTLYNTGRHVSFLPAPR----PVVNVSGG--PLLYSHRLSELRLLFG-ARDG-AGSEHQINHQGFSAEVQLIHFNQ-ELYGNFSAASRGPNGLAILhCA11 (91)
GYNLSANKQFLLTNNGHSVKLNLP----SDMHIQG----LQSRYSATQLHLHWG-NPNDPHGSEHTVSGQHFAAELHIVHYNS-DLYPDASTASNKSEGLAVLhCA12 (50)
YDPSSAKIISNSGHSFNVDFDDTE----NKSVLRGG--PLTGSYRLRQVHLHWG-SADD-HGSEHIVDGVSYAAELHVVHWNS-DKYPSFVEAAHEPDGLAVLhCA13 (54)
GYDQPGTEPLDLHNNGHTVQLSLP----STLYLGG----LPRKYVAAQLHLHWG-QKGSPGGSEHQINSEATFAELHIVHYDS-DSYDSLSEAAERPQGLAVLhCA14 (68)
GYDSAPQDPWVLENDGHTVLLRVNSCQQNCPAIRGAGLP-SPEYRLLQLHFHWG--SPGHQGSEHSLDEKHGSMEMHMVHMN--TKYQSMEDARSQPDGFAILmCA15 (74)
VV LD KS I GG PL YRL QLHLHWG A GSEHTVDG FAAELHLVHWNS KY SF EAA PDGLAVLConsensus(100)
Figure A-1. Continued

144
200 302210 220 230 240 250 260 270 280 290(200)
AVIGVLMKVGEANP---KLQKVLDALQAIKTKGKRA-PFTNFDPSTLLPSSL---DFWTYPGSLTHPPLYESVTWIICKESISVSSEQLAQFRSLLSNVEGDNhCA1(142)
AVLGIFLKVGSAKP---GLQKVVDVLDSIKTKGKSA-DFTNFDPRGLLPESL---DYWTYPGSLTTPPLLECVTWIVLKEPISVSSEQVLKFRKLNFNGEGEPhCA2(141)
AVIGIFLKIGHENG---EFQIFLDALDKIKTKGKEA-PFTKFDPSSLFPASR---DYWTYQGSFTTPPCEECIVWLLLKEPMTVSSDQMAKLRSLLSSAENEPhCA3(141)
AVLAFLVEAGTQVN--EGFQPLVEALSNIPKPEMST-TMAESSLLDLLPKEEKLRHYFRYLGSLTTPTCDEKVVWTVFREPIQLHREQILAFSQKLYYDKEQThCA4(146)
AVIGVFLKLGAHHQ---ALQKLVDVLPEVRHKDTQV-AMGPFDPSCLMPACR---DYWTYPGSLTTPPLAESVTWIVQKTPVEVSPSQLSMFRTLLFSGRGEEhCA5A(121)
AVIGVFLKLGKHHK---ELQKLVDTLPSIKHKDALV-EFGSFDPSCLMPTCP---DYWTYSGSLTTPPLSESVTWIIKKQPVEVDHDQLEQFRTLLFTSEGEKhCA5B(178)
AVLAAFVEVKNYPEN-TYYSNFISHLANIKYPGQRT-TLTGLDVQDMLPRNLQ--HYYTYHGSLTTPPCTENVHWFVLADFVKLSRTQVWKLENSLLDHRNKThCA6(141)
AVVGVFLETGDEHP---SMNRLTDALYMVRFKGTKA-QFSCFNPKCLLPASR---HYWTYPGSLTTPPLSESVTWIVLREPICISERQMGKFRSLLFTSEDDEhCA7(163)
AIIALFVQIGKEHVG---LKAVTEILQDIQYKGKSK-TIPCFNPNTLLPDPLLR-DYWVYEGSLTIPPCSEGVTWILFRYPLTISQLQIEEFRRLRTHVKGAEhCA8(165)
AVLAAFLEEGPEEN--SAYEQLLSRLEEIAEEGSET-QVPGLDISALLPSDFS--RYFQYEGSLTTPPCAQGVIWTVFNQTVMLSAKQLHTLSDTLWGPGDSRhCA9(139)
VVVSIFIKVSDSSNPFLNRMLNRDTITRITYKNDAY-LLQGLNIEELYPETS---SFITYDGSMTIPPCYETASWIIMNKPVYITRMQMHSLRLLSQNQPSQIhCA10(180)
AILSLFVNVASTSNPFLSRLLNRDTITRISYKNDAY-FLQDLSLELLFPESF---GFITYQGSLSTPPCSETVTWILIDRALNITSLQMHSLRLLSQNPPSQIhCA11(182)
AVLAVLIEMGSFN---PSYDKIFSHLQHVKYKGQEA-FVPGFNIEELLPERTA--EYYRYRGSLTTPPCNPTVLWTVFRNPVQISQEQLLALETALYCTHMDDhCA12(140)
AVLGVFLQIGEPNS---QLQKITDTLDSIKEKGKQT-RFTNFDLLSLLPPSW---DYWTYPGSLTVPPLLESVTWIVLKQPINISSQQLAKFRSLLCTAEGEAhCA13(145)
AVLGILIEVGETKN--IAYEHILSHLHEVRHKDQKT-SVPPFNLRELLPKQLG--QYFRYNGSLTTPPCYQSVLWTVFYRRSQISMEQLEKLQGTLFSTEEEPhCA14(158)
AILAVLLVEEDRDN--TNFSAIVSGLKNLSSPGVAVNLTSTFALASLLPSALRLLRYYRYSGSLTTPGCEPAVLWTVFENTVPIGHAQVVQFQAVLQTGPPGLmCA15(169)
AVLGVFL VG Q LVD L IKYKG L FDL LLP DYWTY GSLTTPPC ESVTWIV K PV IS QL FR LLF E Consensus(200)
Figure A-1. Continued

145
303 389310 320 330 340 350 360 370(303)
--A---VPMQHNNRPTQPLKGRTVRASF-----------------------------------------------------------hCA1(238)
--E---ELMVDNWRPAQPLKNRQIKASFK----------------------------------------------------------hCA2(237)
--P---VPLVSNWRPPQPINNRVVRASFKHHHHHH----------------------------------------------------hCA3(237)
------VSMKDNVRPLQQLGQRTVIKS------------------------------------------------------------hCA4(246)
--E---DVMVNNYRPLQPLRDRKLRSSFRLDRTKMRS--------------------------------------------------hCA5A(217)
--E---KRMVDNFRPLQPLMNRTVRSSFRHDYVLNVQAKPKPATSQATP--------------------------------------hCA5B(274)
--------IHNDYRRTQPLNHRVVESNFPNQEYTLGSEFQAENLYFQ----------------------------------------hCA6(240)
--R---IHMVNNFRPPQPLKGRVVKASF-----------------------------------------------------------hCA7(259)
LVEGCDGILGDNFRPTQPLSDRVIRAAFQ----------------------------------------------------------hCA8(263)
------LQL--NFRATQPLNGRVIEASFP----------------------------------------------------------hCA9(237)
--F---LSMSDNFRPVQPLNNRCIRTNINFSLQGKDCPNNRAQKLQYRVNEWLLK--------------------------------hCA10(279)
--F---QSLSGNSRPLQPLAHRALRGNRDPRHPERRCRGPNYRLHVDGVPHGR----------------------------------hCA11(281)
PSP---REMINNFRQVQKFDERLVYTSFSQ---------------------------------------------------------hCA12(237)
--A---AFLVSNHRPPQPLKGRKVRASFH----------------------------------------------------------hCA13(241)
--S---KLLVQNYRALQPLNQRMVFASFIQAGSSYTTGEMLSLGVGILVGCLCLLLAVYFIARKIRKKRLENRKSVVFTSAQATTEAhCA14(256)
HPR----PLTSNFRPQQPLGGRRISASPEASVRSSVSTLPCLHLALVGLGVGLRLWQGP----------------------------mCA15(270)
MV NFRP QPL R VRASF Consensus(303)
Figure A-1. Continued

146
LIST OF REFERENCES
1. Silverman DN, McKenna R. Solvent-Mediated Proton Transfer in Catalysis by Carbonic Anhydrase. Acc Chem Res 2007;40:669-675.
2. Bertini I, Luchinat C. The structure of cobalt(II)-substituted carbonic anhydrase and its implications for the catalytic mechanism of the enzyme. Ann N Y Acad Sci 1984;429:89-98.
3. Liljas A, Håkansson K, Jonsson BH, Xue Y. Inhibition and catalysis of carbonic anhydrase. Recent crystallographic analyses. Eur J Biochem 1994;219(1-2):1-10.
4. Tu CK, Silverman DN. Catalysis by cobalt(II)-substituted carbonic anhydrase II of the exchange of oxygen-18 between CO2 and H2O. Biochemistry 1985;24(21):5881-7.
5. Xu Y, Feng L, Jeffrey PD, Shi Y, Morel FM. Structure and metal exchange in the cadmium carbonic anhydrase of marine diatoms. Nature 2008;452(7183):56-61.
6. Lindskog S. Structure and mechanism of carbonic anhydrase. Pharmacol Ther 1997;74(1):1-20.
7. Whittington DA, Waheed A, Ulmasov B, Shah GN, Grubb JH, Sly WS, Christianson DW. Crystal structure of the dimeric extracellular domain of human carbonic anhydrase XII, a bitopic membrane protein overexpressed in certain cancer tumor cells. Proc Natl Acad Sci U S A 2001;98(17):9545-50.
8. Vargas LA, Alvarez BV. Carbonic anhydrase XIV in the normal and hypertrophic myocardium. J Mol Cell Cardiol 2012;52(3):741-52.
9. Chegwidden WR, Carter ND and Edwards YH. The Carbonic Anhydrases New Horizons, Birkhauser Verlag, Basel 2000.
10. Supuran CT, Scozzafava A and Conway J. Carbonic Anhydrase-Its Inhibitors and Activators, CRC Press, Boca Raton 2004.
11. Silverman DN, Tu C, Chen X, Tanhauser SM, Kresge AJ, Laipis PJ. Rate-equilibria relationships in intramolecular proton transfer in human carbonic anhydrase III. Biochemistry 1993;32(40):10757-62.
12. Picaud SS, Muniz JR, Kramm A, Pilka ES, Kochan G, Oppermann U, Yue WW. Crystal structure of human carbonic anhydrase-related protein VIII reveals the basis for catalytic silencing. Proteins 2009;76(2):507-11.
13. Pastorekova S, Parkkila S, Pastorek J, Supuran CT. Carbonic anhydrases: current state of the art, therapeutic applications and future prospects. J Enzyme Inhib Med Chem 2004;19(3):199-229.
147
14. Dodgson SJ, Forster 2nd RE, Sly WS, and Tashian RE. Carbonic anhydrase activity of intact carbonic anhydrase II-deficient human erythrocytes. Journal of Applied Physiology 1988;64:1472-1480.
15. Yang H, Nevo E, Tashian RE. Unexpected expression of carbonic anhydrase I and selenium-binding protein as the only major non-heme proteins in erythrocytes of the subterranean mole rat (Spalax ehrenbergi). FEBS Letters 1998;430:343-347.
16. Sly WS, Hu, PY. Human Carbonic Anhydrases and Carbonic Anhydrase Deficiencies. Annual Review in Biochemistry 1995;64:375-401.
17. Supuran CT. Carbonic anhydrases--an overview. Curr Pharm Des 2008;14(7):603-14.
18. Robertson N, Potter C, Harris AL. Role of Carbonic Anhydrase IX in Human Tumor Cell Growth, Survival, and Invasion. Cancer Research 2004;64:6160-6165.
19. Christianson DW, Fierke CA. Carbonic anhydrase: Evolution of the zinc binding site by nature and by design. Accounts of Chemical Research 1996;29:331-339.
20. Tu C, Qian M, An H, Wadhwa NR, Duda D, Yoshioka C, Pathak Y, McKenna R, Laipis PJ, Silverman DN. Kinetic analysis of multiple proton shuttles in the active site of human carbonic anhydrase. J Biol Chem 2002;277(41):38870-6.
21. Tu C, Tripp BC, Ferry JG, Silverman DN. Bicarbonate as a proton donor in catalysis by Zn(II)- and Co(II)-containing carbonic anhydrases. J Am Chem Soc 2001;123(25):5861-6.
22. Price GD, Badger MR. Ethoxyzolamide Inhibition of CO(2)-Dependent Photosynthesis in the Cyanobacterium Synechococcus PCC7942. Plant Physiol 1989;89(1):44-50.
23. Cronk JD, Rowlett RS, Zhang KY, Tu C, Endrizzi JA, Lee J, Gareiss PC, Preiss JR. Identification of a novel noncatalytic bicarbonate binding site in eubacterial beta-carbonic anhydrase. Biochemistry 2006;45(14):4351-61
24. Kimber MS, Coleman JR, Pai EF. beta-carbonic anhydrase from Pisum sativum: crystallization and preliminary X-ray analysis. Acta Crystallogr D Biol Crystallogr 2000;56(Pt 7):927-9.
25. Kimber MS, Pai EF. The active site architecture of Pisum sativum beta-carbonic anhydrase is a mirror image of that of alpha-carbonic anhydrases. EMBO J 2000;19(7):1407-18.

148
26. Strop P, Smith KS, Iverson TM, Ferry JG, Rees DC. Crystal structure of the "cab"-type beta class carbonic anhydrase from the archaeon Methanobacterium thermoautotrophicum. J Biol Chem 2001;276(13):10299-305.
27. Mitsuhashi S, Mizushima T, Yamashita E, Yamamoto M, Kumasaka T, Moriyama H, Ueki T, Miyachi S, Tsukihara T. X-ray structure of beta-carbonic anhydrase from the red alga, Porphyridium purpureum, reveals a novel catalytic site for CO(2) hydration. J Biol Chem 2000;275(8):5521-6.
28. Cronk JD, Endrizzi JA, Cronk MR, O'neill JW, Zhang KY. Crystal structure of E. coli beta-carbonic anhydrase, an enzyme with an unusual pH-dependent activity. Protein Sci 2001;10(5):911-22.
29. Nishimori I, Minakuchi T, Kohsaki T, Onishi S, Takeuchi H, Vullo D, Scozzafava A, Supuran CT. Carbonic anhydrase inhibitors: the beta-carbonic anhydrase from Helicobacter pylori is a new target for sulfonamide and sulfamate inhibitors. Bioorg Med Chem Lett 2007;17(13):3585-94.
30. Smith KS, Ferry JG. A plant-type (beta-class) carbonic anhydrase in the thermophilic methanoarchaeon Methanobacterium thermoautotrophicum. J Bacteriol 1999;181(20):6247-53.
31. Kisker, C, Schindelin, H, Alber, BE, Ferry, JG, and Rees, DC. A left-hand beta-helix revealed by the crystal structure of a carbonic anhydrase from the archaeon Methanosarcina thermophila. EMBO Journal 1996;15:2323-2330.
32. Parisi G, Fornasari M, Echave J. Evolutionary analysis of gamma-carbonic anhydrase and structurally related proteins. Mol Phylogenet Evol 2000;14(3):323-34.
33. Iverson TM, Alber BE, Kisker C, Ferry JG, Rees DC. A closer look at the active site of gamma-class carbonic anhydrases: high-resolution crystallographic studies of the carbonic anhydrase from Methanosarcina thermophila. Biochemistry 2000;39(31):9222-31.
34. Macauley SR, Zimmerman SA, Apolinario EE, Evilia C, Hou YM, Ferry JG, Sowers KR. The archetype gamma-class carbonic anhydrase (Cam) contains iron when synthesized in vivo. Biochemistry 2009;48(5):817-9.
35. Zimmerman SA, Ferry JG. Proposal for a hydrogen bond network in the active site of the prototypic gamma-class carbonic anhydrase. Biochemistry 2006;45(16):5149-57.
36. Lane TW, Morel FM. Regulation of carbonic anhydrase expression by zinc, cobalt, and carbon dioxide in the marine diatom Thalassiosira weissflogii. Plant Physiol 2000;123(1):345-52.
149
37. Fu X, Yu LJ, Mao-Teng L, Wei L, Wu C, Yun-Feng M. Evolution of structure in gamma-class carbonic anhydrase and structurally related proteins. Mol Phylogenet Evol 2008;47(1):211-20.
38. Domsic JF, Avvaru BS, Kim CU, Gruner SM, Agbandje-McKenna M, Silverman DN, McKenna R. Entrapment of carbon dioxide in the active site of carbonic anhydrase II. J Biol Chem 2008;283(45):30766-71.
39. Fisher SZ, Tu C, Bhatt D, Govindasamy L, Agbandje-McKenna M, McKenna R, Silverman DN. Speeding up proton transfer in a fast enzyme: kinetic and crystallographic studies on the effect of hydrophobic amino acid substitutions in the active site of human carbonic anhydrase II. Biochemistry 2007;46(12):3803-13.
40. Fierke CA, Calderone TL, Krebs JF. Functional Consequences of Engineering the Hydrophobic Pocket of Carbonic Anhydrase-Ii. Biochemistry 1991;30:11054-11063.
41. Nair SK, Calderone TL, Christianson DW, Fierke CA. Altering the mouth of a hydrophobic pocket. Structure and kinetics of human carbonic anhydrase II mutants at residue Val-121. J Biol Chem 1991;266(26):17320-5.
42. Merz KM. CO2 Binding to Human Carbonic Anhydrase-Ii. Journal of the American Chemical Society 1991;113:406-411.
43. Sjöblom B, Polentarutti M, Djinovic-Carugo K. Structural study of X-ray induced activation of carbonic anhydrase. Proc Natl Acad Sci U S A 2009;106(26):10609-13.
44. Merz KM. Insights into the Function of the Zinc Hydroxide-Thr199-Glu106 Hydrogen-Bonding Network in Carbonic-Anhydrases. Journal of Molecular Biology 1990;214:799-802.
45. Fisher SZ, Maupin CM, Budayova-Spano M, Govindasamy L, Tu C, Agbandje-McKenna M, Silverman DN, Voth GA, McKenna R. Atomic crystal and molecular dynamics simulation structures of human carbonic anhydrase II: insights into the proton transfer mechanism. Biochemistry 2007;46(11):2930-7.
46. Agmon N. The Grotthuss mechanism. Chemical Physics Letters 1995;244:456-462.
47. Cui Q, Karplus M. Is a "proton wire" concerted or stepwise? A model study of proton transfer in carbonic anhydrase. Journal of Physical Chemistry B 2003;107:1071-1078.
48. Simonsson I, Jonsson BH, Lindskog S. C-13 NMR study of carbon dioxide-bicarbonate exchange catalyzed by human carbonic anhydrase-C at chemical-equilibrium. European Journal of Biochemistry 1979;93:409-417.

150
49. Fisher Z, Hernandez Prada JA, Tu C, Duda D, Yoshioka C, An H, Govindasamy L, Silverman DN, McKenna R. Structural and kinetic characterization of active-site histidine as a proton shuttle in catalysis by human carbonic anhydrase II. Biochemistry 2005;44(4):1097-105.
50. Duda D, Tu C, Qian M, Laipis P, Agbandje-McKenna M, Silverman DN, McKenna R. Structural and kinetic analysis of the chemical rescue of the proton transfer function of carbonic anhydrase II. Biochemistry 2001;40(6):1741-8.
51. Håkansson K, Briand C, Zaitsev V, Xue Y, Liljas A. Wild-type and E106Q mutant carbonic anhydrase complexed with acetate. Acta Crystallogr D Biol Crystallogr 1994;50(Pt 1):101-4.
52. Schochetman G, Ou CY, Jones WK. Polymerase chain reaction. J Infect Dis 1988;158(6):1154-7.
53. Mello C, Fire A. DNA transformation. Methods Cell Biol 1995;48:451-82.
54. Schowen KB, Schowen RL. Solvent isotope effects of enzyme systems. Methods Enzymol 1982;87:551-606.
55. Baneyx F. Recombinant protein expression in Escherichia coli. Curr Opin Biotechnol 1999;10(5):411-21.
56. Pulst SM. Neurogenetics: single gene disorders. J Neurol Neurosurg Psychiatry 2003;74(12):1608-14.
57. Silverman DN. Carbonic anhydrase: oxygen-18 exchange catalyzed by an enzyme with rate-contributing proton-transfer steps. Methods Enzymol 1982;87:732-52.
58. Silverman DN, Tu CK. Carbonic anhydrase catalyzed hydration studied by 13C and 18O labeling of carbon dioxide. J Am Chem Soc 1976;98(4):978-84.
59. Silverman DN, Tu CK. Molecular basis of the oxygen exchange from CO2 catalyzed by carbonic anhydrase III from bovine skeletal muscle. Biochemistry 1986;25(26):8402-8.
60. Tu C, Rowlett RS, Tripp BC, Ferry JG, Silverman DN. Chemical rescue of proton transfer in catalysis by carbonic anhydrases in the beta- and gamma-class. Biochemistry 2002;41(51):15429-35.
61. Khalifah RG. Carbon Dioxide Hydration Activity of Carbonic Anhydrase.1. Stop-Flow Kinetic Studies on Native Human Isoenzyme-B and Isoenzyme-C. Journal of Biological Chemistry 1971;246:2561-2573.
62. Chance B. The Stopped-flow Method and Chemical Intermediates in Enzyme Reactions-A Personal Essay. Photosynth Res 2004;80(1-3):387-400.
151
63. Rhodes G. Crystallography Made Crystal Clear. Burlington: Academic Press 2006.
64. Lattman EE and Loll PJ. Protein Crystallography: A Concise Guide. Baltimore: John Hopkins University Press 2008.
65. Drenth J. Principles of Protein X-Ray Crystallography. New York: Springer Science and Business Media 2007.
66. Grina JN. Chemical Kinetics-Introduction and Experimental Techniques. University of Malta 2006.
67. Bragg WL. Proc. Camb. Phil. Soc. 1913;17:43-57
68. Ruiz R, Julve M, Faus J, Lloret F, Muñoz MC, Journaux Y, Bois C. Ferromagnetic Coupling between Copper(II) Centers through the Diamagnetic Zinc(II) Ion: Crystal Structure and Magnetic Properties of [Cu(2)Zn(Hdmg)(2)(dmg)(2)(H(2)O)].0.5H(2)dmg.H(2)O (H(2)dmg = Dimethylglyoxime). Inorg Chem 1997;36(16):3434-3439.
69. Avvaru BS, Kim CU, Sippel KH, Gruner SM, Agbandje-McKenna M, Silverman DN, McKenna R. A short, strong hydrogen bond in the active site of human carbonic anhydrase II. Biochemistry 2010;49(2):249-51.
70. Krebs JF, Rana F, Dluhy RA, Fierke CA. Kinetic and spectroscopic studies of hydrophilic amino acid substitutions in the hydrophobic pocket of human carbonic anhydrase II. Biochemistry 1993;32(17):4496-505.
71. Hakansson K and Wehnert A. Structure of cobalt carbonic anhydrase complexed with bicarbonate. J Mol Biol 1992;228:1212-1218.
72. Jönsson BM, Håkansson K, Liljas A. The structure of human carbonic anhydrase II in complex with bromide and azide. FEBS Lett 1993;322(2):186-90.
73. Bertini I, Luchinat C, Pierattelli R, Vila AJ. The interaction of acetate and formate with cobalt carbonic anhydrase. An NMR study. Eur J Biochem 1992;208(3):607-15.
74. Håkansson K, Carlsson M, Svensson LA, Liljas A. Structure of native and apo carbonic anhydrase II and structure of some of its anion-ligand complexes. J Mol Biol 1992;227(4):1192-204.
75. Lindahl M, Svensson LA, Liljas A. Metal poison inhibition of carbonic anhydrase. Proteins 1993;15(2):177-82.
152
76. Bertini I, Jonsson BH, Luchinat C, Pierattelli R, Vila AJ. Strategies of signal assignments in paramagnetic metalloproteins. An NMR investigation of the thiocyanate adduct of the cobalt (II)-substituted human carbonic anhydrase II. J Magn Reson B 1994;104(3):230-9.
77. Bertini I, Luchinat C, Scozzafava A. A 31P NMR study of phosphate in presence of cobalt(II)- and copper(II)- substituted bovine carbonic anhydrase B. FEBS Lett 1978;93(2):251-4.
78. Supuran CT, Conroy CW, Maren TH. Is cyanate a carbonic anhydrase substrate? Proteins 1997;27(2):272-8.
79. Lindskog S. Interaction of cobalt(II)--carbonic anhydrase with anions. Biochemistry 1966;5(8):2641-6.
80. Supuran CT. Carbonic anhydrases as drug targets--an overview. Curr Top Med Chem 2007;7(9):825-33.
81. Mazumdar PA, Kumaran D, Swaminathan S, Das AK. A novel acetate-bound complex of human carbonic anhydrase II. Acta Crystallogr Sect F Struct Biol Cryst Commun 2008;64(Pt 3):163-6.
82. Maupin, CM., Saunders, MG., Thorpe, IF., McKenna, R., Silverman, DN., and Voth, GA. Origins of enhanced proton transport in the Y7F mutant of human carbonic anhydrase II. Journal of the American Chemical Society 2008;130:11399-11408.
83. McPherson A. Preparation and Analysis of Protein Crystals, Wiley, New York 1982.
84. Kim CU, Kapfer R, Gruner SM. High-pressure cooling of protein crystals without cryoprotectants. Acta Crystallographica Section D-Biological Crystallography 2005;61:881-890.
85. Otwinowski Z, Minor W. Processing of X-ray Diffraction Data Collected in Oscillation Mode. Methods Enzymol 1997;276:307-326.
86. Adams PD, Afonine PV, Bunkoczi G, Chen VB, Davis IW, Echols N, Headd JJ, Hung LW, Kapral GJ, Grosse-Kunstleve RW, McCoy AJ, Moriarty NW, Oeffner R, Read RJ, Richardson DC, Richardson JS, Terwilliger TC, Zwart PH. PHENIX: a comprehensive Python-based system for macromolecular structure solution. Acta Crystallographica Section D-Biological Crystallography 2010;66:213-221
87. Mikulski RL, Silverman DN. Proton transfer in catalysis and the role of proton shuttles in carbonic anhydrase. Biochimica Et Biophysica Acta-Proteins and Proteomics 2010;1804:422-426.
153
88. Borek D, Cymborowski M, Machius M, Minor W, Otwinowski Z. Diffraction data analysis in the presence of radiation damage. Acta Crystallographica Section D-Biological Crystallography 2010;66:426-436.
89. Ravelli RBG, Garman EF. Radiation damage in macromolecular cryocrystallography. Current Opinion in Structural Biology 2006;16:624-629.
90. Carugo O, Carugo KD. When X-rays modify the protein structure: radiation damage at work. Trends in Biochemical Sciences 2005;30:213-219.
91. Sippel KH, Genis C, Govindasamy L, Agbandje-McKenna M, Kiddle JJ, Tripp BC and McKenna R. Synchrotron Radiation Provides a Plausible Explanation for the Generation of a Free Radical Adduct of Thioxolone in Mutant Carbonic Anhydrase II. Journal of Physical Chemistry Letters 2010;1:2898-2902.
92. Karplus PA. Hydrophobicity regained. Protein Sci 1997;6(6):1302-7.
93. Steiner H, Jonsson BH and Lindskog S. Catalytic Mechanism of Carbonic-Anhydrase-Hydrogen-Isotope Effects on Kinetic-Parameters of Human C Isoenzyme. European Journal of Biochemistry 1975;59:253-259.
94. Andrieux CP, Gamby J, Hapiot P, Savéant JM. Evidence for inverted region behavior in proton transfer to carbanions. J Am Chem Soc 2003;125(33):10119-24.
95. An H, Tu CK, Duda D, Montanez-Clemente I, Math K, Laipis PJ, McKenna R and Silverman DN Chemical rescue in catalysis by human carbonic anhydrases II and III. Biochemistry 2002;41:3235-3242.
96. Nair SK, Christianson DW. Unexpected pH-Dependent Conformation of His-64, the Proton Shuttle of Carbonic Anhydrase-II. Journal of the American Chemical Society 1991;113:9455-9458.
97. Tu CK, Silverman DN, Forsman C, Jonsson BH, Lindskog S. Role of histidine 64 in the catalytic mechanism of human carbonic anhydrase II studied with a site-specific mutant. Biochemistry 1989;28(19):7913-8.
98. Kresge AJ, Silverman DN. Application of Marcus rate theory to proton transfer in enzyme-catalyzed reactions. Methods in Enzymology 1999;308: 276-297.
99. Bhatt D, Fisher SZ, Tu C, McKenna R, Silverman DN. Location of binding sites in small molecule rescue of human carbonic anhydrase II. Biophys J 2007;92:562-570.
100. Elder I, Tu CK, Ming LJ, McKenna R, Silverman DN. Proton transfer from exogenous donors in catalysis by human carbonic anhydrase II. Archives of Biochemistry and Biophysics 2005;437:106-114.

154
101. Tu CK, Silverman DN. Solvent deuterium isotope effects in the catalysis of oxygen-18 exchange by human carbonic anhydrase II. Biochemistry 1982;21(25):6353-60.
102. Jackman JE, Merz KM, Fierke CA. Disruption of the active site solvent network in carbonic anhydrase II decreases the efficiency of proton transfer. Biochemistry 1996;35(51):16421-8.
103. Maupin CM, McKenna R, Silverman DN, Voth GA. Elucidation of the proton transport mechanism in human carbonic anhydrase II. J Am Chem Soc 2009;131(22):7598-608.
104. Krebs JF, Fierke CA, Alexander RS, Christianson DW. Conformational mobility of His-64 in the Thr-200----Ser mutant of human carbonic anhydrase II. Biochemistry 1991;30(38):9153-60.
105. Marcus RA. Theoretical Relations among Rate Constants Barriers and Bronsted Slopes of Chemical Reactions. Journal of Physical Chemistry 1968;72:891-&.
106. Braun-Sand S, Strajbl M, Warshel A. Studies of proton translocations in biological systems: simulating proton transport in carbonic anhydrase by EVB-based models. Biophys J 2004;87(4):2221-39.
107. Edwards SJ, Soudackov AV, Hammes-Schiffer S. Driving force dependence of rates for nonadiabatic proton and proton-coupled electron transfer: conditions for inverted region behavior. J Phys Chem B 2009;113(44):14545-8.
108. Peters KS, Cashin A,Timbers P. Picosecond dynamics of nonadiabatic proton transfer: A kinetic study of proton transfer within the contact radical ion pair of substituted benzophenones/N,N-dimethylaniline. Journal of the American Chemical Society 2000;122:107-113.
109. Gilli P, Pretto L, Bertolasi V, Gilli G. Predicting hydrogen-bond strengths from acid-base molecular properties. The pK(a) slide rule: toward the solution of a long-lasting problem. Acc Chem Res 2009;42(1):33-44.
110. Peters KS. A theory-experiment conundrum for proton transfer. Acc Chem Res 2009;42(1):89-96.
111. Xue YF, Vidgren J, Svensson L A, Liljas A, Jonsson BH, Lindskog S Crystallographic Analysis of Thr-200 -] His Human Carbonic-Anhydrase Ii and Its Complex with the Substrate, Hco3-. Proteins-Structure Function and Genetics 1993;15:80-87.
112. Bond GM, Stringer J, Brandvold DK., Simsek FA, Medina MG, Egeland G. Development of Integrated System for Biomimetic CO2 Sequestration Using the Enzyme Carbonic Anhydrase. Energy & Fuels 2001;15(2):309-316
155
113. Mirjafari P, Asghari K and Mahinpey N. Investigating the Application of Enzyme Carbonic Anhydrase for CO2 Sequestration Purposes. Industrial & Engineering Chemistry Research 2007;46(3):921-926
114. Enns T, Hill EP. CO2 diffusing capacity in isolated dog lung lobes and the role of carbonic anhydrase. J Appl Physiol 1983;54(2):483-90.
115. Joos F, Plattner GK, Stocker TF, Marchal O, Schmittner A. Global warming and marine carbon cycle feedbacks on future atmospheric CO2. Science 1999;284(5413):464-7.
116. Chakrabarti S, Bhattacharya S, Bhattacharya SK. Immobilization of D-ribulose-1,5-bisphosphate carboxylase/oxygenase: a step toward carbon dioxide fixation bioprocess. Biotechnol Bioeng 2003;81(6):705-11.

156
BIOGRAPHICAL SKETCH
Dayne West was born in Melbourne, Florida on Thanksgiving. He was pretty
much born and raised in the state of Florida, but has family ties in Alabama. At 6’5” tall
and 280 pounds, he does not have the typical look of scientist, which he credits his
years as football in player in high school and college. He graduated from Gaither High
School in Tampa, Florida in 2004, ranked 23 out of 505 students in his graduating class,
and 49 out of the 50 top high school football players in the state of Florida. He went to
Delaware State University (DSU) in Dover, Delaware on a full football scholarship.
Tragedy struck him with a knee injury severe enough to end his athletic career but not
his academic one. He graduated summa cum laude from DSU in 2008 with a Bachelor
of Science degree in chemistry. That same year he was accepted into graduate school
at the University of Florida. He has worked under the mentorship of Dr. Robert
McKenna. With his hard work, motivation and good karma he was able to graduate in
four years, one year ahead of the 5 year graduate program average. He has seen
immense scientific success and accolades. He has presented at numerous national
conferences and has been awarded pre-doctoral fellowships from the National Science
Foundation, the National Institutes of Health, and the University of Florida. In his four
year career at UF, he will have published 5 papers in various journals. Outside of
research, he has been an ambassador for the promotion of minority students in science.
He has attended the Annual Biomedical Research Conference for Minority Students
(ABRCMS) as a recruiter for the University of Florida. He hopes to have a long,
successful scientific career