Embed Size (px)
Citation preview

Structure of Earnings Survey Quality report 2006 NSSG
NATIONAL STATISTICAL SERVICE OF GREECE
Structure of Earnings Survey Quality report 2006
Division of Population and Labour Market Statistics Wages and Salaries Statistics Section Nikos Fragoulopoulos Zoi Mavraki Pireos 46 & Eponiton, 18510, Piraeus Telephone: (+30) (210) 4852175 e-mail: [email protected] [email protected]
Athens, February 2010
1

Structure of Earnings Survey Quality report 2006 NSSG
Contents Introduction ……………………………………………... 31. Relevance.…………………………………………….….. 62. Accuracy ………………………………………………… 72.1 Sampling errors..…………………………………………. 72.1.1 Probability sampling………………………………….…. 72.1.1.1 Bias. ……………………………………………………... 152.1.1.2 Variance Estimation.………………………………….…. 162.1.2 Non-probability sampling…………………………….…. 192.2 Non-sampling errors……………………………………... 192.2.1 Coverage Errors……………………………………….…. 192.2.2 Measurement Errors……………………………………... 202.2.3 Processing Errors………………………………………… 202.2.4 Non-response errors……………………………………… 212.2.5 Model assumption errors………………………………… 213. Punctuality and timeliness…………………………….…. 223.1 Punctuality. ……………………………………………… 223.2 Timeliness………………………………………………... 224. Accessibility and clarity. ………………………………... 224.1 Accessibility. ……………………………………………. 224.2 Clarity. …………………………………………………... 235. Comparability. …………………………………………... 235.1 Geographical comparability…………………………….. 235.2 Comparability over time. ………………………………... 236. Coherence. ………………………………………………. 24 References……………………………………………….. 25 ANNEX I Tables…………………………………………………… 26ANNEX II Questionnaires ………………………………………… 44
2

Structure of Earnings Survey Quality report 2006 NSSG
Introduction The expansion of the European Union and the function of the internal market
have increased the need for comparable results with regard to the structure of
earnings. This is used as a means to analyze the evolution of the economic
and social cohesion as well as the conduct of reliable comparisons between
Member States.
The most efficient way to estimate the situation with respect to wages is the
production of community statistics using harmonized methods and definitions.
With these harmonized methods we can track changes with respect to the
structure of persons employed as well as the structure of their earnings.
Furthermore, one can explore the evolution of the national economies of the
member states in the framework of a unified European Economic monetary
policy. The development and tendency of the structure of earnings in the long
run is a basic element for the implementation of national and community
policies for the different sectors of economic activity.
For all the above, the European Union has laid down a special policy that
foresees the conduct of statistical surveys every four years for the collection
of structural data with respect to the wages of people employed in enterprises.
Policy
The survey is conducted simultaneously in all MS of the E.U. using
harmonized methods and definitions according to the EP/Council Regulation
(530/1999), 9th March 1999 regarding the structural statistics for the revenues
and labor cost as well the E.U. Implementing Regulation (1916/2000) of the
Council of the 8th September 2000.
Background
The first survey regarding the conduct of revenue statistics in the E.U. with
harmonized methods took place in 1995 in all Member States simultaneously
according to Regulation 2744/95. The harmonized definitions for revenues are
based on the European System of National and Territorial Accounts according
to the E.U. Regulation 2223/96 amended according to the Regulation 448/98.
3

Structure of Earnings Survey Quality report 2006 NSSG
Scope
The scope of the survey at a National level is the production of statistical data
regarding the structure of earnings in enterprises. More specifically collected
data regard the following variables: a) enterprise: sector of economic activity,
geographical area, number of local units, number of persons employed, type
of employment contract, type of financial auditing, main market of economic
activity, and b) employee: gender, age, profession, type of employment
contract, nationality, duration of service in the company, education level and
vocational training, earnings received during October 2006. Additionally, in a
macroeconomic level, the conduct of surveys relating to the structure of
earnings will become the way of depicting the allocation of earnings according
to the sector of economic activity. Moreover, this allocation can be evaluated
according to the special characteristics of persons employed broken down by
various sectors of economic activity. Finally in E.U. level, the survey aims in
providing harmonized statistics, which will provide comparable quantity and
quality information for all Member-States relating to the structure of earnings
of persons employed.
Methodology
It is a sampling survey based on the method of 3-phase stratified random
sampling where the sampling units are the local units that belong to
enterprises employing more than 10 persons. The enterprises from which the
local units are collected are selected from the business register 2004. Prior to
selection, enterprises are allocated in strata according to geographical region,
economic activity (NACE rev. 1, 2-digit), and the size of the enterprise, which
is based on the number of persons employed in the enterprise.
The sampling phases are the following:
1st phase: Enterprises are selected from the business register
2nd phase: A sample of local units is selected from the enterprises of the 1st
phase
3rd phase: Selection of a sample of persons employed from the collected
enterprises.
4

Structure of Earnings Survey Quality report 2006 NSSG
In total, 3.087 enterprises, 8.540 local units and 47.940 persons employed
were surveyed out of 32.021 enterprises (sampling rate = 9,6%), 49.995 local
units (sampling rate = 17,1%) and 1.489.184 persons employed respectively
(sampling rate =3,2%).
Sectors of Economic Activity
The survey was conducted on the enterprises belonging to the following
sectors of economic activity (NACE Rev.1.1): Mining and quarrying (C),
Manufacturing (D), Electricity, gas and water supply, (E), Construction (F),
Wholesale and retail trade; repair of motor vehicles, motorcycles and personal
and household goods (G), Hotels and restaurants (H), Transport, storage and
communication (I), Financial intermediation (J), Real estate, renting and
business activities (K), Education (Μ), Health and social work (Ν), Other
community, social and personal service activities (O).
Reference year of data collection
Data regarding the structure of earnings from enterprises were collected for
the reference year 2006 whereas data for persons employed referred to the
year 2006 as well as to a representative month of the same year and more
specifically October 2006.
Questionnaires
The questionnaires used in the survey are:
- Type I questionnaire, to be completed by the enterprise
- Type II questionnaire, to be completed by the employee
Organization
The survey was designed and organized by the Division of Population and
Labour Market Statistics of N.S.S.G. in collaboration with the Division of
Organization, Methodology and International Relations, in the framework of
Eurostat guidelines.
5

Structure of Earnings Survey Quality report 2006 NSSG
1. Relevance NSSG is able to meet users’ needs, who either visit the library of our Service or send in their request for SES data. It can also provide users with anonymised SES microdata. However, it is impossible to provide data, which, are considered to be confidential. Main national core users of the data of Structure of Earnings survey are: Universities for research purposes, politicians and in general analysts and decisions makers. On the other hand, enterprises, which are our data suppliers, are also data users. The main needs for our users are: - Statistical analysis of the results and further studies - Policy for policy makers and also - Comparisons of level of work remuneration in various sectors for various jobs and with various qualifications. Analysts are often looking for individual anonymised data and in this case, the confidentiality rules are implemented.
6

Structure of Earnings Survey Quality report 2006 NSSG
2. Accuracy 2.1 Sampling errors 2.1.1 Probability sampling
The survey covered all local units belonging to enterprises with average annual employment 10 persons or more in the areas of economic activity defined by sections C-K plus M, N and O of NACE Rev.1. The sampling frame that was used for the selection of the primary sampling units (enterprises) was the register of enterprises with reference year 2004. This register is compiled by data coming from administrative sources (Social Insurance Foundation and Tax Authorities). Also for sections M and N special registers were used with reference year 2005.
In order to trace the local units for data collection, since the survey units are the
local units and those were not included in the register of the enterprises, we applied the two-stage stratified random sampling. At the first stage we selected enterprises and their local units, so actually the primary sampling unit is the local unit, while at the second stage we selected employees (final unit).
More specifically, the process for the selection of the sampling units was the
following: The enterprises with average annual employment 10 persons or more included in
the survey and were stratified by:
a. Geographical Region – NUTS 1 (Northern Greece, Central Greece, Attica, Aegean Islands and Crete) b. Two-digit NACE Rev.1.1 code of economic activity within each geographical region (Geography x Economic Activity = Major stratum), and c. Size class of the enterprise. In each of the major strata, the enterprises were stratified into 4 size classes, according to their size, determined by their average annual number of employees in the business register, as follows.
Size class 1 10-19 Employees
'' 2 20-49 '' '' 3 50-99 '' '' 4 100+ ''
Size class 4 (100+ employees) was exhaustively surveyed (census class).
In each one of the final strata (let = Geography x Economic Activity x Size Class) the sampling units were selected as follows:
h
7

Structure of Earnings Survey Quality report 2006 NSSG
1st stage: Firstly, a sample of enterprises was selected out of the nh N h enterprises in
the stratum with equal probabilities of selection. In case were one enterprise consisted of more than one local unit then all the local units of the enterprise were selected for survey. In fact the primary sampling unit is the local unit. 2nd stage: In each selected primary unit, namely local unit, let , a sample m of employees was selected out of the
i hi
M hi employees included in the local unit during
the survey period ( i =1,2, …,n ) with equal probabilities of selection. hi
In each section, the sample size of enterprises (1st stage of sampling), and the
number of employees to be surveyed (2nd stage of sampling) were defined, so as the co-efficient of variation (%) of the variable “number of employees” not to exceed 3% and the coefficient of variation of the variable “gross monthly earnings” not to exceed 5%, based on data of the previous survey (reference year 2002). As the survey characteristics have strong correlation with the number of the employees, the distribution of the sample size both for enterprises and employees by geographic regions, two-digit NACE Rev.1.code and size classes of the enterprises (final stratum) was defined proportionally to the total number of employees in the stratum, according to data coming from the register of the enterprises.
So the sample of employees in each final stratum was calculated proportionally to the total number of employees in the stratum. The sample size of employees in the selected enterprises of the sample was calculated proportionally to their total number of employees. By this way we calculated the sample size of employees in each selected enterprise. Since actually the primary sampling unit is the local unit, in case where the enterprise had more than one local unit, then the sample size of employees of the enterprise was allocated proportionally to the local units of the enterprise according to their total number of employees. The total number of employees of the local unit was not included in any register but it was collected and enumerated by the interviewer for each selected enterprise of the sample.
In each local unit the sampling fraction, δ, was calculated accordingly (δ = hi
hi
mM )
and the selection of the employees to be surveyed was conduct with the use of the systematic sampling according to the following:
• Selection of a random number, ρ that should be a positive integer or decimal number, such as ρ≤ δ and if integer should have as many decimal digits as δ. ρ was selected with the use of random numbers table.
• Production of the sequence of numbers α1=ρ, α2=ρ+δ, α3=ρ+2δ, …, αm=ρ+(m-1)δ that actually compiles the sample of employees to be surveyed. αm should be a number not greater than the number of employees of the local unit (frame of employees of the local unit).
• The selected employees should have the following ascending numbers in the sorted frame of employees of the local unit:
o βi=αi when αi= integer o βi= [ ] iα +1 when αi= decimal (i=1,2,…,m) and [ ] represent the integer
part of the number
8

Structure of Earnings Survey Quality report 2006 NSSG
The final active sample size of local units was 8.540 out of 49.995 (sampling rate=17,1% according to estimations based on sampling data) and the active sample size of employees was 47.940 out of 1.489.184 (sampling rate=3,2%). The following tables present the sample size of a) enterprises, b) local units and c) employees as well as the corresponding sampling rates (%) broken down by section and size class.
Table 1. Number of enterprises of the population (N) and of the initial sample (n)
by section and size class (size class at the sampling phase)
Employment size classes Total 10_19 20_49 50_99 100+
Nace Rev.1
N n N n N n N n N n Total 32.021 4.820 17.191 1.044 10.697 1.190 2.254 707 1.879 1.879C 164 54 88 16 52 17 14 11 10 10D 7.359 1.354 3.950 280 2.295 335 575 200 539 539E 96 39 43 9 30 9 9 7 14 14F 1.846 346 945 55 566 84 195 67 140 140G 6.828 973 4.163 238 1.876 237 416 125 373 373H 3.861 585 2.494 184 1.004 165 206 79 157 157I 1.855 372 1.051 85 538 98 139 62 127 127J 197 77 51 10 58 12 47 14 41 41K 1.999 416 1.021 76 609 94 197 74 172 172M 6.547 153 2.910 30 3.265 54 319 16 53 53N 409 236 58 14 100 20 63 14 188 188O 860 215 417 47 304 65 74 38 65 65
Table 2. Sampling rates of enterprises (initial sample) by section and size class (size class at the sampling phase)
NACE Rev. 1
Employment size classes
Total 10_19 20_49 50_99 100+ Sampling
Rate (%) Sampling Rate (%)
Sampling Rate (%)
Sampling Rate (%)
Sampling Rate (%)
Total 15,1% 6,1% 11,1% 31,4% 100,0%C 32,9% 18,2% 32,7% 78,6% 100,0%D 18,4% 7,1% 14,6% 34,8% 100,0%E 40,6% 20,9% 30,0% 77,8% 100,0%F 18,7% 5,8% 14,8% 34,4% 100,0%G 14,3% 5,7% 12,6% 30,0% 100,0%H 15,2% 7,4% 16,4% 38,3% 100,0%I 20,1% 8,1% 18,2% 44,6% 100,0%J 39,1% 19,6% 20,7% 29,8% 100,0%K 20,8% 7,4% 15,4% 37,6% 100,0%M 2,3% 1,0% 1,7% 5,0% 100,0%N 57,7% 24,1% 20,0% 22,2% 100,0%O 25,0% 11,3% 21,4% 51,4% 100,0%
9

Structure of Earnings Survey Quality report 2006 NSSG
Table 3. Number of enterprises of the population (N) and of the final sample (n) by section and size class (size class at the sampling phase)
Employment size classes Total 10_19 20_49 50_99 100+
Nace Rev.1
N n N n N n N n N n Total 32.021 3.087 17.191 475 10.697 747 2.254 458 1.879 1.407C 164 35 88 7 52 14 14 7 10 7D 7.359 930 3.950 116 2.295 233 575 155 539 426E 96 32 43 6 30 7 9 6 14 13F 1.846 176 945 26 566 38 195 32 140 80G 6.828 663 4.163 127 1.876 167 416 91 373 278H 3.861 305 2.494 70 1.004 94 206 39 157 102I 1.855 240 1.051 41 538 59 139 41 127 99J 197 57 51 6 58 9 47 5 41 37K 1.999 252 1.021 39 609 54 197 37 172 122M 6.547 58 2.910 6 3.265 13 319 7 53 32N 409 193 58 9 100 16 63 11 188 157O 860 146 417 22 304 43 74 27 65 54
Table 4. Sampling rates of enterprises (final sample) by section and size class (size class at the sampling phase)
NACE Rev. 1
Employment size classes
Total 10_19 20_49 50_99 100+ Sampling
Rate (%) Sampling Rate (%)
Sampling Rate (%)
Sampling Rate (%)
Sampling Rate (%)
Total 9,6% 2,8% 7,0% 20,3% 74,9%C 21,3% 8,0% 26,9% 50,0% 70,0%D 12,6% 2,9% 10,2% 27,0% 79,0%E 33,3% 14,0% 23,3% 66,7% 92,9%F 9,5% 2,8% 6,7% 16,4% 57,1%G 9,7% 3,1% 8,9% 21,9% 74,5%H 7,9% 2,8% 9,4% 18,9% 65,0%I 12,9% 3,9% 11,0% 29,5% 78,0%J 28,9% 11,8% 15,5% 10,6% 90,2%K 12,6% 3,8% 8,9% 18,8% 70,9%M 0,9% 0,2% 0,4% 2,2% 60,4%N 47,2% 15,5% 16,0% 17,5% 83,5%O 17,0% 5,3% 14,1% 36,5% 83,1%
10

Structure of Earnings Survey Quality report 2006 NSSG
Table 5. Number of local units of the population (N) and of the sample (n) by section of the local unit and size class of the enterprise
Employment size classes Total
10 - 49 50 - 249 250 - 499 500 - 999 1000+ NACE Rev. 1
N n N n N n N n N n N n Total 49.995 8.540 22.727 1.685 13.978 2.636 4.001 841 2.280 633 7.008 2.745C 261 74 136 32 90 31 34 10 2 1D 9.155 1.530 4.642 434 3.290 711 775 204 278 105 170 76E 157 77 67 11 39 25 2 1 1 1 48 39F 2.446 299 1.062 93 817 120 329 45 116 18 122 23G 14.422 2.572 4.486 484 5.954 980 1.161 254 707 179 2.113 675H 4.481 540 2.401 206 1.219 201 391 66 202 32 268 35I 3.647 838 1.376 154 618 175 206 54 122 33 1.325 422J 3.269 1.546 160 25 134 40 70 28 191 77 2.715 1.376K 2.660 433 1.309 111 647 164 283 72 363 74 58 12M 6.797 80 5.761 25 492 13 415 12 40 7 89 23N 772 327 148 33 150 71 147 65 236 101 91 57O 1.928 224 1.179 77 529 105 187 30 24 6 9 6
Table 6. Sampling rates of local units by section of the local unit and size class of the enterprise
Employment size classes
Total 10-49 50-249 250-499 500-999 1000+ NACE Rev. 1
Sampling Rate (%)
Sampling Rate (%)
Sampling Rate (%)
Sampling Rate (%)
Sampling Rate (%)
Sampling Rate (%)
Total 17,1% 7,4% 18,9% 21,0% 27,8% 39,2%C 28,4% 23,6% 34,4% 29,9% 50,0%D 16,7% 9,3% 21,6% 26,3% 37,8% 44,7%E 49,0% 16,4% 64,1% 50,0% 100,0% 81,3%F 12,2% 8,8% 14,7% 13,7% 15,6% 18,9%G 17,8% 10,8% 16,5% 21,9% 25,3% 31,9%H 12,1% 8,6% 16,5% 16,9% 15,8% 13,0%I 23,0% 11,2% 28,3% 26,2% 27,0% 31,9%J 47,3% 15,7% 29,9% 40,1% 40,3% 50,7%K 16,3% 8,5% 25,3% 25,5% 20,4% 20,8%M 1,2% 0,4% 2,6% 2,9% 17,6% 25,8%N 42,4% 22,3% 47,5% 44,1% 42,8% 62,9%O 11,6% 6,5% 19,9% 16,0% 25,1% 67,8%
11

Structure of Earnings Survey Quality report 2006 NSSG
Table 7. Number of employees of the population (N) and of the sample (n) by section of the local unit and size class of the enterprise
Employment size classes Total
10 - 49 50 - 249 250 - 499 500 - 999 1000+ Nace Rev. 1
N n N n N n N n N n N n Total 1.489.184 47.940 376.451 11.592 411.941 15.968 187.430 4.567 158.211 4.576 355.152 11.237C 6.076 396 2.330 213 3.005 163 698 19 44 1 D 319.895 11.828 80.566 3313 118.021 5096 50.796 1437 41.820 1123 28.692 859 E 36.637 1.283 1.343 68 3.057 263 986 19 536 30 30.715 903 F 72.464 2.180 18.582 769 28.989 942 12.513 215 4.977 106 7.403 148 G 272.655 9.339 48.166 2950 100.026 3750 30.468 800 22.715 481 71.280 1358 H 112.970 3.784 34.232 1465 44.137 1496 16.367 352 11.089 343 7.145 128 I 117.343 4.915 17.743 926 20.792 1202 8.037 227 8.497 280 62.274 2280 J 71.625 3.786 1.213 112 4.089 220 1.383 90 4.831 301 60.110 3063 K 95.672 3.584 22.619 878 33.665 1306 16.257 520 16.245 614 6.885 266 M 206.553 1.281 128.890 168 22.536 139 24.541 160 5.611 114 24.974 700 N 122.743 3.896 2.458 178 13.028 697 18.545 592 38.108 1088 50.605 1341 O 54.552 1.668 18.310 552 20.595 694 6.839 136 3.783 96 5.024 190
Table 8. Sampling Rates of Employees by section of the local unit and size class
of the enterprise
Employment size classes Total 10-49 50-249 250-499 500-999 1000+
NACE Rev.1
Sampling Rate (%)
Sampling Rate (%)
Sampling Rate (%)
Sampling Rate (%)
Sampling Rate (%)
Sampling Rate (%)
Total 3,2% 3,1% 3,9% 2,4% 2,9% 3,2%C 6,5% 9,1% 5,4% 2,7% 2,3%D 3,7% 4,1% 4,3% 2,8% 2,7% 3,0%E 3,5% 5,1% 8,6% 1,9% 5,6% 2,9%F 3,0% 4,1% 3,2% 1,7% 2,1% 2,0%G 3,4% 6,1% 3,7% 2,6% 2,1% 1,9%H 3,3% 4,3% 3,4% 2,2% 3,1% 1,8%I 4,2% 5,2% 5,8% 2,8% 3,3% 3,7%J 5,3% 9,2% 5,4% 6,5% 6,2% 5,1%K 3,7% 3,9% 3,9% 3,2% 3,8% 3,9%M 0,6% 0,1% 0,6% 0,7% 2,0% 2,8%N 3,2% 7,2% 5,4% 3,2% 2,9% 2,6%O 3,1% 3,0% 3,4% 2,0% 2,5% 3,8%
12

Structure of Earnings Survey Quality report 2006 NSSG
Estimation process Extrapolation factor of local units in stratum h
Since actually the primary sampling unit is the local unit and the 2-stage stratified sampling was applied, the extrapolation factor of each local unit was based on the inverse of the probability of selection of the enterprise (also in the first stage of sampling) multiplied with the inverse of the response rate of the enterprise in the stratum.
[ ] 1−×= hh
hhi r
nNw (1)
where = response rate of enterprises in stratum hr h In case where the enterprise consists of more than one local unit, then all the local units of the enterprise have the same extrapolation factor. Extrapolation factor of employees in stratum h
The extrapolation factor of each employee j that was surveyed (employed in local unit i in stratum ), was calculated using the formula: h
hi
hihihij m
Mww ×= (2)
Estimation of basic characteristics
Before presenting the estimation process of basic characteristics as well the variance estimation process that was applied, we mention that all local units surveyed were post-stratified by:
- Geographical region (NUTS 1), - Economic activity (2-digit codes) and - Employment size class defined as follows:
Size Class 1 1-4 Employees
'' 2 5-9 '' '' 3 10-19 '' '' 4 20-49 '' '' 5 50-99 '' '' 6 100-249 '' '' 7 250-499 '' '' 8 500-999 '' '' 9 1000+
13

Structure of Earnings Survey Quality report 2006 NSSG
The post-stratification contributed in reducing the element variance of the survey characteristics in each post-stratum and thus low variances of the estimated survey characteristics were achieved.
(Concerning the notation followed from now on, we mention that after applying the post-stratification, as described above, represents the stratum formulated after the post-stratification technique).
h
Concerning the estimation process, in each stratum (stratum= Geography Χ
Economic Activity Χ Size class), the estimation h
Y h
)of the characteristic y of the
survey was calculated using the formula:
∑∑= =
⋅=n mh hi
i jhijhijh ywY
1 1
)(3)
where: nh
: the number of local units of the sample in stratum h
mhi: the number of employees that were surveyed in local unit i in stratum h
whij: the extrapolation factor of the employee j in local unit i in stratum h
yhij: the value of the characteristic y for the employee j in local unit i in stratum h
In case the characteristic y is a qualitative variable (e.g. we are interested in the category “full time employees”), then the specific variable takes the following values: = 1, if the surveyed employee belongs to the category of interest hijy = 0, if the surveyed employee does not belong to the category of interest hijy Estimation of a basic characteristic in country level
The estimation of a characteristic y in country level, Y total (variable y in country level of a two-digit NACE Rev.1 code of economic activity), is calculated by adding up the estimations Y h
) of every stratum that contains the local units belonging to the
specific two-digit NACE Rev.1 code economic activity. Generally, in order for the estimations of the survey characteristics to be produced
at a higher than stratum level, we add up the estimations of the (final) strata, that form the level under survey.
14

Structure of Earnings Survey Quality report 2006 NSSG
2.1.1.1 Bias
The statistics produced using the estimator formula (3) are unbiased. However,
there are also quantities being produced using the ratio of two variables, XYR = . For
example the variable “average gross hourly earnings” represents the ratio of gross annual earnings for a specific year (variable y ) divided by the total number or hours worked (variable . )x
The procedure that is generally applied for estimating ratios is the following: For each stratum of a specific two-digit NACE Rev.1 code of economic activity
we define: h
h
hh X
YR = (4)
where and are the sum of the values of variables hY hX y and x respectively for all the employees of the population under survey that belong to stratum h .
Furthermore, the ratio of the values of variables y and x for all employees of the population under survey that belong to a higher than stratum level (Geographical Region, Country Total) is defined as:
∑
∑=
hh
hh
X
YR (5)
The estimations for the ratios and hR R are calculated using the formulas (6) and
(7) respectively:
h
hh X
YR )
))
= (6) and ∑
∑=
hh
hh
X
YR )
)
) (7)
The ratio estimators hR
) and R
)are biased. In general, the ratio estimation has a
bias of order (where = the sample size of local units). Since the standard error (s.e.) of the estimation
n/1 nR)
is of order n/1 , the quantity (Bias/s.e.) is also of order
n/1 and it becomes negligible as the sample size increases. In practice, this technical bias is usually unimportant in samples of moderate and large size. Its value in small samples is of interest, however, in stratified sampling with many strata, where we may wish to compute and examine ratio estimates in individual strata with small samples in the strata, the bias is approximately equal to zero (0).
locn
15

Structure of Earnings Survey Quality report 2006 NSSG
As the technical bias of R)
occurs because the denominator x of xyR = is a
random variable, one can use the ( ) %20<XCV)
(CV: Coefficient of variation of X)
), as an indicator of examining if the effect of bias on the accuracy of R
) is negligible or
not. Thus, the ( )XCV)
serves as a critical control on the validity of combined ratio estimations and it is a useful and safe-check on the bias of ratio statistics. 2.1.1.2 Variance Estimation
After the post-stratification (already described in “estimation of basic characteristics”) and in order to calculate variance estimations the local units were broken down in two categories:
1st category: Local units i belonging to sampling strata h with extrapolation factor greater than 1, that is > 1. hiw 2nd category: Local units i belonging to census strata with extrapolation factor equal to 1, that is = 1.
hhiw
Variance Estimation for the local units of the 1st category
For the local units belonging to the 1st category we calculate the following: i) The number N h of the local units in the stratum h with the use of the following formula:
∑=
=nh
ihih wN
1 (8)
where: nh : the number of the local units of the sample that belong to stratum h (The number of the local units that results from formula (8) was rounded to the nearest integer). ii) For each local unit ( ) of the first category we calculate the value of the characteristic
i nhi ,...,1=y with the formula:
∑=
⋅=mhi
jhij
hi
hihi ym
MY1
)(9)
where: M hi : the number of employees of the local unit in stratum h i
mhi: the number of employees that were surveyed and that belong to the local unit
in stratum i hyhij
: the value of the characteristic y for the employee j belonging to the local unit
in stratum i h
16

Structure of Earnings Survey Quality report 2006 NSSG
iii) From the local units in stratum of the 1st category and taking into account
the results of the formulas (8) and (9) presented above, the variance estimation nh h
( )Y hV)
is calculated as follows:
( ) ( )( )
( )∑∑
⎟⎠⎞
⎜⎝⎛
==
⋅−⋅
⋅+
⎥⎥⎥⎥⎥⎥⎥
⎦
⎤
⎢⎢⎢⎢⎢⎢⎢
⎣
⎡∑=
−⋅−⋅
−⋅=
nn
nh
i hiV
hh
ihi
hi
hihihi
h
h
i hhi
hh
hhhh sm
mMMnN
n
YYnn
nNNY1
2
1
2
2 11
)
))
(10)
where:
⎥⎥⎥⎥⎥⎥⎥
⎦
⎤
⎢⎢⎢⎢⎢⎢⎢
⎣
⎡∑=
−⋅−
= ∑⎟⎠⎞
⎜⎝⎛
=
m
mhi
j hijhij
j hihij
hihi m
yyms
1
2
22 11
1 (11)
Variance Estimation for the local units of the 2nd category
For the local units belonging to the 2nd category the variance estimation nh
( )Y hV)
is calculated as:
( ) ( )∑
=
⋅−⋅
=n
Vh
ihi
hi
hihihih sm
mMMY1
2) (12)
where is calculated with the use of formula (11) above. shi
2
Variance Estimation in country l vel e
The variance estimation ( )Y totalV)
of Y total
) (variable y in country level of a two-
digit NACE Rev.1 code of economic activity) is calculated by adding up the variance estimations ( )Y h
V)
of Y h
)of every stratum that contains the local units belonging to
the specific two-digit NACE Rev.1 code of economic activity.
Generally, in order for the variance estimations of the survey characteristics to be produced at a higher than stratum level, we add up the estimations of the (final) strata, which form the level under survey.
17
Structure of Earnings Survey Quality report 2006 NSSG
Coefficient of Variation (for Variance) The coefficient of variation (%) for variance estimation totalY
) is calculated using
the formula
100.)(
)(total
totaltotal Y
YVYCV )
))
= (16)
All coefficients of variation (CVs) that were calculated for the variables required
are presented in Annex I. For full time employees: Among various categories of the examined characteristics (e.g. a certain age category or a certain education category) the maximum CV at country level for:
a) monthly gross earnings is: i) men: 6,8% for age category 55-64, ii) women: 21.9% for those working in sector C and iii) both sexes: 5.7% for age category 55-64,
b) monthly hours is: i) men: 6.8% for those working in sector M, ii) women: 22.1% those working in sector C and iii) both sexes: 5.1% for age category >=65 and also for ISCO-88 category coded 1.
At sector level, for both sexes the minimum CV is 0.6% for monthly hours in sector N, while the maximum CV is 5.6% for monthly gross earnings in sector M. Among sexes the minimum CV is 1.1% for monthly hours, for men in sector D, while the maximum is 22.1% for monthly hours, for women in sector C. Generally, among sexes CVs for the various characteristics and their categories for women are greater than those of men. Also, generally, the CV decreases while the relevant percentage of monthly hours of full time employment on total monthly hours of full time employment increases. More specifically, for both sexes when this percentage is greater that 10%, the relevant CV is lower than 8%. The same applies for monthly gross earnings of full time employment where, for both sexes when the percentage on total monthly gross earnings is greater than 10%, the CV is lower than 5.7%. For part time employees: The CVs are much greater than those of the full time employees. Among various categories of the examined characteristics, the maximum CV at country level for monthly gross earnings is: i) men: 97.2,% for ISCO-88 category coded 1, ii) women: 72.4% for ISCO-88 category coded 1 and iii) both sexes: 68.1% for ISCO-88 category coded. These results are logic and of small importance since employees in this ISCO-88 category are not usually expected to work under a part-time agreement. Also, the estimated participation of monthly gross earnings of this ISCO-88 category to the total gross monthly earnings is negligible. So, the “real” maximum CVs are actually lower, and apart from some greater values around 50% (with really small participation to the total, concerning the estimated values), in general they are even lower, with their majority varying up to 20%. At sector level, for both sexes the minimum CV is 4.3% in sector G, which is a sector with very important estimated participation to the total gross monthly earnings, while the maximum CV is 80.8% in sector E, which is a sector of really meaningless participation to the total concerning the estimated monthly gross earnings. Among sexes the minimum CV is 4.8% for women in sector G and the maximum CV is 94.4% for men in sector E. The latter, is also of meaningless importance since the estimated participation of the monthly gross earnings of the sector to the total monthly gross earnings is 0.02%.
18

Structure of Earnings Survey Quality report 2006 NSSG
Generally, among sexes CVs for the various characteristics and their categories for men are greater than those of women (women work under part-time agreement much more usually compared to men). Also, generally the CV decreases while the relevant percentage of monthly gross earnings on total monthly gross earnings increases. More specifically, for both sexes when the percentage on total monthly gross earnings is greater than 10%, the CV is lower than 36%. 2.1.2 Non-probability sampling
Non-probability sampling was not used in the survey.
2.2 Non-sampling errors 2.2.1 Coverage Errors
There were problems of over-coverage, under-coverage and miss-classification.
The over-coverage problems mainly have to do with enterprises that were included in the business register, they were selected in the sample, but they were not actually existed at the time of the survey (closed enterprises). These enterprises actually reduced the initial sample size of enterprises and consequently of local units, . The
decrease of the number of sampling units from n to
hn
h ( )Ln
h
h+1 in each stratum
inflates the variance of the estimated statistics. Here, denotes the relative loss of accuracy in stratum . In this case the estimator is unbiased under the condition that the death rate of enterprises is equal to their birth rate.
Lh
h
The under-coverage refers to units (enterprises) missing from the sampling frame.
The probability of selection of each missing unit of order is equal to zero (i 0=Pi )
and thus, the extrapolation factor of the missing unit cannot be defined
(wi
011 =Pi
). As a result, the under-coverage problem underestimates the produced
statistics. Corrections and weighting for non-coverage is difficult, because under-coverage rates cannot be obtained from the sample itself, but only from external sources. However, for sections C-K (where there were data available, with reference year 2006) the survey results were compared with those of the Structural Business Surveys of NSSG and there was not under-coverage.
Moreover, due to miss-classification problems of the register, some sampling
units changed design strata after data collection. These units were allocated to the new strata, retaining their initial probabilities of selection. This event changes the initial element variance, destroys the initial allocation of the enterprises of the sample and as a result inflates the variance of the estimations. Consequently, the co-efficient of variation of the produced statistics is higher than the co-efficient of variation based on the initial sample design.
19

Structure of Earnings Survey Quality report 2006 NSSG
2.2.2 Measurement Errors. The data collection method used was face-to-face interview that resulted in
completing paper questionnaires. The collection method applied ensured the high quality of the information gathered, since the interviewers assisted the respondents, and carefully checked the filled in questionnaires, before leaving the enterprise.
The interviewers participated in the survey were experienced permanent staff of
the National Statistical Service of Greece (NSSG). Before the launching of the survey the interviewers attended a one-day training seminar. The scope of the seminar was to enable the interviewers to: a) fully understand the definitions of the survey characteristics in order to avoid the respondent bias, (b) correctly fill in the questionnaire, and (c) efficiently check for errors by applying logical controls.
The structure and the size of the questionnaire were designed to be user-friendly
for the interviewers and the questions were formulated in a clear and simple language, using appropriate vocabulary. Additionally, documents containing useful instructions were compiled, analyzing all the questions of the questionnaire. This activity targeted at collecting fully completed questionnaires, with no missing variables. 2.2.3 Processing Errors.
The data collection was decentralized at the regional offices of NSSG, with the
supervision of the Central Offices. The collected data were gathered at the Central Offices of NSSG where data entry, coding, checking for possible measurement errors, logical controls and comparisons with other sources of statistical information took place. These activities were carried out by experience, permanent staff of the Directorate in charge of the survey.
After performing all final controls for detection of possible non-sampling errors,
the database created was ready for applying the weighting process and the plausibility checks after tabulation. These checks included: i) comparisons of data with the corresponding data of the former relevant survey (reference year 2002) as well as with data of other surveys and statistical sources e.g. European Union Survey of Income and Living Conditions (EU-SILC) for 2006, National Accounts for 2006, ii) checks on the variance estimations of basic survey characteristics. The final look at the printouts of variance values did not reveal something unusual that needed further investigation.
More analytically, data editing was based on quality control measures, which were
the following: o Checks on the quality of the collected data for tracing extreme values. These
extreme values were corrected in case they were wrong values or they were confirmed in case they were right. These data capture errors were detected and corrected at the level of the surveyed unit.
o Comparisons of the collected data with the respective data of the previous survey. All possible high differences (absolute values greater than 10%) were investigated. In case these high differences were right, the values were confirmed, while in case these high values were wrong, the source of error was detected and removed.
20

Structure of Earnings Survey Quality report 2006 NSSG
o Conducting of checks, in order the produced data to be harmonized with data from other statistical information sources. The aim of these checks was to evaluate the impact of possible frame errors (e.g. under-coverage) and to gain knowledge of biases and other non-random errors.
2.2.4 Non-response errors The following tables depict the unit response rates of the enterprises by section
and size class of the enterprise, as well as the response rates per section.
Table 9. Unit response rates by section and size class of the enterprise
Employment size bands Total 10-49 50-249 250-499 500-999 1000+
Nace Rev.1
Response Rate %
Response Rate %
Response Rate %
Response Rate %
Response Rate %
Response Rate %
Total 63,7% 57,2% 66,8% 72,4% 81,5% 76,3%C 68,5% 72,7% 64,7% 66,7% D 69,0% 59,6% 76,9% 78,5% 84,9% 51,9%E 83,7% 52,9% 100,0% 100,0% 100,0%F 48,0% 56,1% 41,0% 54,2% 40,0% 42,9%G 68,1% 64,0% 70,9% 83,6% 67,9% 66,7%H 54,0% 48,4% 60,8% 56,7% 100,0% 100,0%I 64,3% 56,3% 69,3% 66,7% 100,0% 83,3%J 69,6% 68,2% 46,9% 100,0% 100,0% 100,0%K 57,6% 53,5% 58,8% 59,1% 81,0% 50,0%M 39,0% 27,4% 30,8% 90,0% 44,4% 100,0%N 82,8% 85,3% 75,0% 74,5% 100,0% 88,6%O 62,0% 58,9% 67,5% 57,1% 37,5% 100,0%
The response rates for total as well for employment size classes are quite
satisfactory. In the census (take-all strata), in which all population units were included in the sample, the unit response rates are quite high in many cases, but not 100% in all combinations of sections and size classes, due to non-response from the part of the enterprises. So some census strata became sampling strata, thus increasing the sampling error of the characteristics of the survey.
Concerning the item non-response, there was not any imputation method applied, since item non-response was not appeared in the local units included in the sample.
2.2.5 Model assumption errors
There was not any model used in the survey.
21

Structure of Earnings Survey Quality report 2006 NSSG
3. Punctuality and timeliness
3.1 Punctuality To conduct the survey the following steps have been taken: 1. August 2007 – January 2008: Data collection phase. 2. October 2007 - January 2008: processing phase has taken place. By this term
we mean: a. Coding of the questionnaires b. First logical checks for consistency of data collected 3. October 2007 - February 2008: the data entry phase. 4. March 2008 – July 2008: final checks and corrections of data (data entry
errors, logical errors etc) 5. August 2008 - October 2008: calculation of extrapolation factors, tabulation of
results, sending of data to Eurostat. In the timetable described above, it can be easily seen that there is an overlap
between various works that have taken place. Due to very short time limits available for the survey, data collection phase was overlapping data processing phase etc
3.2 Timeliness
There is a significant time span between the release of the data (2008) and the
reference period of them (2006) due to the fact that enterprises found the questionnaire too heavy and therefore, they were not so keen to collaborate with interviewers, combined with the fact that information had to be collected by local unit and not by enterprise.
4. Accessibility and clarity
4.1 Accessibility The NSSG website: www.Statistics.Gr includes: 1. A short description of the methodology of the survey (sampling design,
register used etc) 2. Definitions of the core variables that have been collected 3. The questionnaire used 4. Some tables with the results of the survey This information is presented in Greek and in English and was ready by the end of
2008.
22

Structure of Earnings Survey Quality report 2006 NSSG
In case users need more detailed information they can ask for it and special tables can be produced on request. Moreover, in some cases (ie research purposes) anonymised individual data can also be sent to the users.
4.2 Clarity
Regarding metadata available, we have to note that all publications in electronic
or in paper format are always accompanied with some methodological notes referring to:
- Sampling methods used - Definitions of some core variables - And also some useful notes to the user like coverage of the survey level of
detail in which data are available ( geographical and also activity level ) etc
5. Comparability
5.1 Geographical comparability The variables collected from the survey were fully in line with the definitions
mentioned in the relevant Regulation. All the European concepts have been respected.
5.2 Comparability over time In principle there have been no changes in definitions between the two surveys
(2002 and 2006) except the ones enforced by relevant Regulations. Both surveys were compatible with European concepts.
23

Structure of Earnings Survey Quality report 2006 NSSG
6. Coherence
Nace 1 National Accounts 2006 Structure of Earnings 2006
Remuneration (in euro)
Persons employed
Remuneration / Person (in euro)
Remuneration (in euro)
Persons employed
Remuneration / Person (in euro)
C-O 70.294.349.490 2.833.606 24807,4 34.494.521.588 1.489.185 23163,4C 441.383.155 13.128 33.621,3 117.144.541 6.076 19.279,9D 8.047.593.279 416.143 19.338,5 6.912.155.089 319.895 21.607,6E 1.398.736.016 32.191 43.451,6 1.470.845.177 36.637 40.146,4F 3.828.890.000 243.138 15.747,8 1.274.250.543 72.464 17.584,6G 10.370.875.284 519.890 19.948,2 4.873.935.568 272.655 17.875,8H 2.719.335.110 147.443 18.443,2 3.079.007.700 112.970 27.255,1I 5.817.181.239 174.311 33.372,3 3.268.340.590 117.343 27.852,9J 4.219.590.695 102.828 41.035,4 2.168.921.694 71.625 30.281,6K 5.367.504.356 156.437 34.310,9 1.934.016.528 95.672 20.215,1L 12.367.056.000 434.985 28.431,0 M 7.597.197.538 276.931 27.433,5 5.161.352.983 206.553 24.988,0N 4.228.947.319 180.689 23.404,5 2.955.831.229 122.743 24.081,5O 3.890.059.499 135.492 28.710,6 1.278.719.946 54.552 23.440,4
The Structure of earnings survey covers only enterprises employing more than 10
persons, while in National Accounts all enterprises are covered. This is why respective figures for number of persons employed are generally higher in National Accounts (with the exception of NACE E) where an underestimation of number of persons employed is observed.
To achieve a kind of comparability between National Accounts and Structure of Earnings Survey and to check coherence, we calculated Remuneration per person for both surveys. If we compare results, we see that coherence is achieved in the majority of Nace sectors.
24

Structure of Earnings Survey Quality report 2006 NSSG
References Cochran, W. G. (1977). Sampling techniques (3rd edition). John Wiley and Sons.
New York, Chichester, Brisbane, Toronto, Singapore. Kish, L., Namboodiri, N. K. and Pillai, R.K. (1962). The ratio bias in surveys. Journal
of the American, Statistical Association., 57, 863-876. Kish, L (1965). Survey sampling. John Wiley and Sons. New York. Kish, L. (1992). Weighting for Unequal PI . Journal of Official Statistics. Vol. 8, No
2, 183-200. Statistics Sweden. Kalton G. and Kasprzyk D. (1986). The treatment of missing survey data. Survey
Methodology, 12, 1-16. Sarndal C. E., Swensson, B. and Wretman. J. (1992). Model Assisted Survey
Sampling. Springer-Verlang. New York, Inc.
25
Structure of Earnings Survey Quality report 2006 NSSG
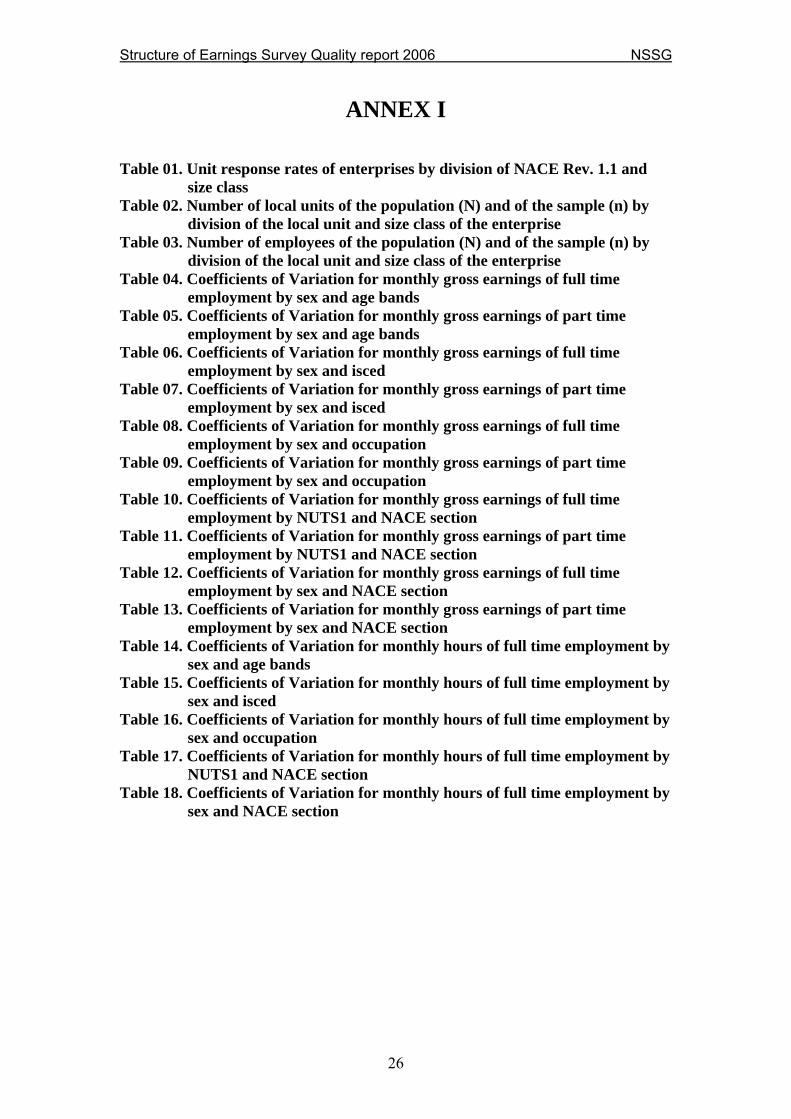
ANNEX I Table 01. Unit response rates of enterprises by division of NACE Rev. 1.1 and
size class Table 02. Number of local units of the population (N) and of the sample (n) by
division of the local unit and size class of the enterprise Table 03. Number of employees of the population (N) and of the sample (n) by
division of the local unit and size class of the enterprise Table 04. Coefficients of Variation for monthly gross earnings of full time
employment by sex and age bands Table 05. Coefficients of Variation for monthly gross earnings of part time
employment by sex and age bands Table 06. Coefficients of Variation for monthly gross earnings of full time
employment by sex and isced Table 07. Coefficients of Variation for monthly gross earnings of part time
employment by sex and isced Table 08. Coefficients of Variation for monthly gross earnings of full time
employment by sex and occupation Table 09. Coefficients of Variation for monthly gross earnings of part time
employment by sex and occupation Table 10. Coefficients of Variation for monthly gross earnings of full time
employment by NUTS1 and NACE section Table 11. Coefficients of Variation for monthly gross earnings of part time
employment by NUTS1 and NACE section Table 12. Coefficients of Variation for monthly gross earnings of full time
employment by sex and NACE section Table 13. Coefficients of Variation for monthly gross earnings of part time
employment by sex and NACE section Table 14. Coefficients of Variation for monthly hours of full time employment by
sex and age bands Table 15. Coefficients of Variation for monthly hours of full time employment by
sex and isced Table 16. Coefficients of Variation for monthly hours of full time employment by
sex and occupation Table 17. Coefficients of Variation for monthly hours of full time employment by
NUTS1 and NACE section Table 18. Coefficients of Variation for monthly hours of full time employment by
sex and NACE section
26

Structure of Earnings Survey Quality report 2006 NSSG
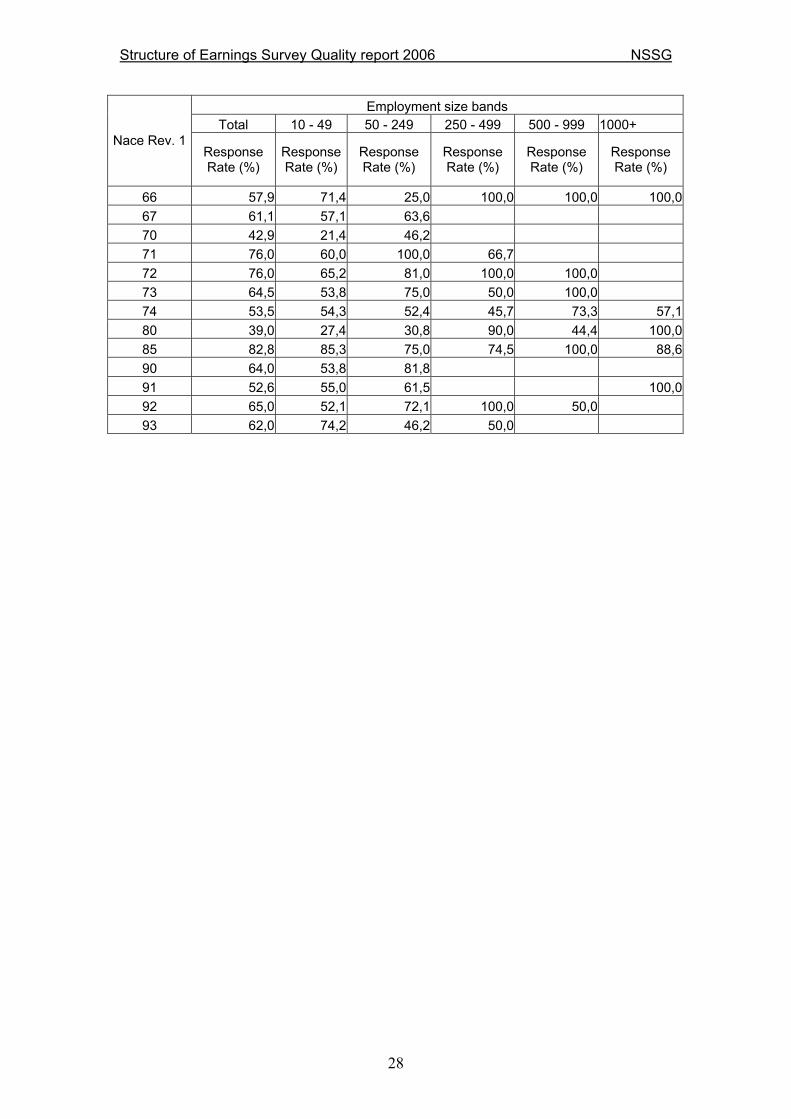
Table 1. Unit response rates of enterprises by division of NACE Rev. 1.1 and size class
Employment size bands
Total 10 - 49 50 - 249 250 - 499 500 - 999 1000+ Nace Rev. 1
Response Rate (%)
Response Rate (%)
Response Rate (%)
Response Rate (%)
Response Rate (%)
Response Rate (%)
Total 63,7 57,2 66,8 72,4 81,5 76,310 75,0 66,7 100,0 11 100,0 100,0 100,0 13 60,0 50,0 100,0 14 67,4 74,1 57,1 50,0 15 75,8 55,0 90,7 81,3 75,0 66,716 66,7 100,0 66,7 100,0 17 59,8 67,7 47,5 100,0 66,7 18 57,0 50,0 69,6 100,0 19 56,0 52,9 57,1 100,0 20 64,3 52,6 85,7 100,0 21 76,0 63,2 84,0 83,3 22 68,3 58,7 79,5 54,5 100,0 23 60,0 57,1 50,0 50,0 50,0 100,024 81,1 77,8 78,6 88,9 100,0 25 83,0 73,9 96,0 60,0 26 74,2 71,4 77,8 100,0 50,027 82,9 80,0 92,3 71,4 100,0 28 69,5 51,9 87,2 88,9 100,0 29 65,7 62,5 71,4 50,0 100,0 50,030 50,0 42,9 50,0 100,0 31 80,6 84,2 84,6 100,0 32 85,7 42,9 100,0 33 56,3 30,0 100,0 100,0 34 61,9 50,0 80,0 50,0 100,0 35 45,0 58,8 26,3 50,0 50,036 59,3 58,9 58,3 50,0 100,0 37 50,0 50,0 100,0 40 80,0 100,0 100,041 84,2 60,0 100,0 100,0 100,045 48,0 56,1 41,0 54,2 40,0 42,950 77,0 60,7 95,6 100,0 100,0 51 66,0 65,6 65,4 80,8 70,0 40,052 68,7 61,7 73,3 82,6 64,7 73,755 54,0 48,4 60,8 56,7 100,0 100,060 67,0 67,6 64,7 50,0 83,361 61,7 61,5 68,8 100,0 62 92,9 83,3 100,0 100,0 100,063 59,6 50,0 73,3 33,3 100,0 64 66,7 51,7 65,2 100,0 100,0 87,565 78,6 75,0 46,2 100,0 100,0 100,0
27
Structure of Earnings Survey Quality report 2006 NSSG
Employment size bands Total 10 - 49 50 - 249 250 - 499 500 - 999 1000+
Nace Rev. 1 Response Rate (%)
Response Rate (%)
Response Rate (%)
Response Rate (%)
Response Rate (%)
Response Rate (%)
66 57,9 71,4 25,0 100,0 100,0 100,067 61,1 57,1 63,6 70 42,9 21,4 46,2 71 76,0 60,0 100,0 66,7 72 76,0 65,2 81,0 100,0 100,0 73 64,5 53,8 75,0 50,0 100,0 74 53,5 54,3 52,4 45,7 73,3 57,180 39,0 27,4 30,8 90,0 44,4 100,085 82,8 85,3 75,0 74,5 100,0 88,690 64,0 53,8 81,8 91 52,6 55,0 61,5 100,092 65,0 52,1 72,1 100,0 50,0 93 62,0 74,2 46,2 50,0
28

Structure of Earnings Survey Quality report 2006 NSSG
Table 2. Number of local units of the population (N) and of the sample (n) by division of the local unit and size class of the enterprise
Employment size classes Total 10 - 49 50 - 249 250 - 499 500 - 999 1000+ Nace Rev. 1
N n N n N n N n N n N n Total 49.995 8.540 22.727 1.685 13.978 2.636 4.001 841 2.280 633 7.008 2.745
10 7 5 5 3 3 2 11 2 2 1 1 1 1 13 23 6 12 2 11 4 14 229 61 118 26 77 25 33 9 2 1 15 1.919 364 593 61 900 174 224 55 76 29 126 45 16 21 12 2 1 9 5 11 6 17 484 68 338 25 70 22 34 8 42 13 18 1.099 119 480 38 510 68 108 13 19 143 15 134 10 8 4 1 1 20 252 29 201 13 16 10 33 4 2 2 21 254 58 102 14 102 32 50 12 22 633 99 352 29 219 55 58 11 5 4 23 70 23 15 4 10 4 3 2 36 7 7 6 24 475 141 176 25 223 73 66 35 10 8 25 368 69 140 17 191 44 36 8 26 712 129 338 42 323 65 40 12 11 10 27 133 39 68 9 36 15 12 8 16 7 28 791 105 483 33 230 48 61 17 17 7 29 402 59 324 25 50 18 1 1 6 5 22 10 30 29 12 10 5 13 4 6 3 31 174 37 117 17 53 18 4 2 32 59 21 42 5 11 10 2 2 4 4 33 88 14 52 4 35 9 1 1 34 68 20 41 8 18 7 3 2 6 3 35 173 18 136 10 31 5 2 1 3 1 1 1 36 789 75 481 36 239 25 29 7 40 7
29
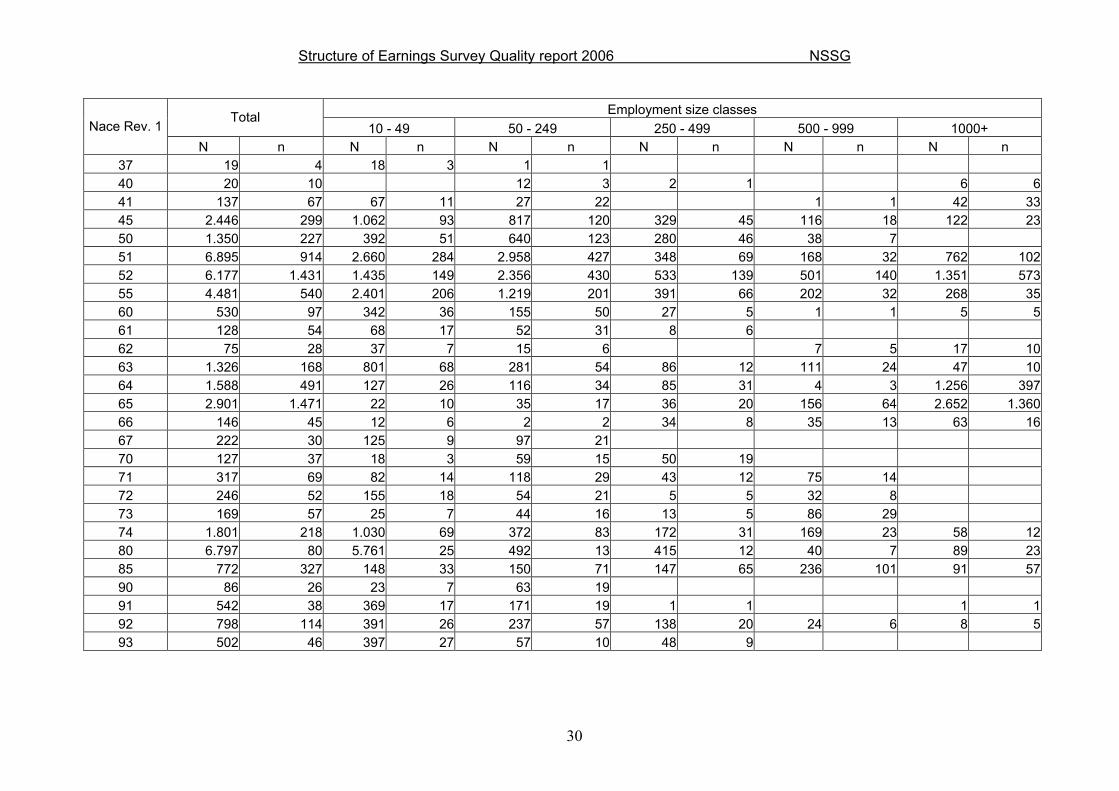
Structure of Earnings Survey Quality report 2006 NSSG
Employment size classes Total 10 - 49 50 - 249 250 - 499 500 - 999 1000+ Nace Rev. 1
N n N n N n N n N n N n 37 19 4 18 3 1 1 40 20 10 12 3 2 1 6 6 41 137 67 67 11 27 22 1 1 42 33 45 2.446 299 1.062 93 817 120 329 45 116 18 122 23 50 1.350 227 392 51 640 123 280 46 38 7 51 6.895 914 2.660 284 2.958 427 348 69 168 32 762 102 52 6.177 1.431 1.435 149 2.356 430 533 139 501 140 1.351 573 55 4.481 540 2.401 206 1.219 201 391 66 202 32 268 35 60 530 97 342 36 155 50 27 5 1 1 5 5 61 128 54 68 17 52 31 8 6 62 75 28 37 7 15 6 7 5 17 10 63 1.326 168 801 68 281 54 86 12 111 24 47 10 64 1.588 491 127 26 116 34 85 31 4 3 1.256 397 65 2.901 1.471 22 10 35 17 36 20 156 64 2.652 1.360 66 146 45 12 6 2 2 34 8 35 13 63 16 67 222 30 125 9 97 21 70 127 37 18 3 59 15 50 19 71 317 69 82 14 118 29 43 12 75 14 72 246 52 155 18 54 21 5 5 32 8 73 169 57 25 7 44 16 13 5 86 29 74 1.801 218 1.030 69 372 83 172 31 169 23 58 12 80 6.797 80 5.761 25 492 13 415 12 40 7 89 23 85 772 327 148 33 150 71 147 65 236 101 91 57 90 86 26 23 7 63 19 91 542 38 369 17 171 19 1 1 1 1 92 798 114 391 26 237 57 138 20 24 6 8 5 93 502 46 397 27 57 10 48 9
30

Structure of Earnings Survey Quality report 2006 NSSG
Table 3. Number of employees of the population (N) and of the sample (n) by division of the local unit and size class of the enterprise
Employment size classes Total 10 - 49 50 - 249 250 - 499 500 - 999 1000+ Nace Rev. 1
N n N n N n N n N n N n Total 1.489.184 47.940 376.451 11.592 411.941 15.968 187.430 4.567 158.211 4.576 355.152 11.237
10 161 34 56 10 105 24 11 116 6 15 4 101 2 13 988 42 354 21 634 21 14 4.812 314 1.905 178 2.266 118 597 17 44 1 15 72.368 2.622 8.084 431 27.085 1167 13.622 396 8.579 222 14.999 406 16 7.061 160 48 8 1.558 31 5.455 121 17 17.158 556 4.824 168 5.823 209 2.554 79 3.958 100 18 24.880 730 9.340 319 12.929 369 2.611 42 19 3.774 145 2.750 87 758 43 266 15 20 4.899 222 2.573 98 761 71 756 20 809 33 21 8.375 392 1.208 69 4.726 251 2.441 72 22 23.613 875 6.891 260 10.471 444 3.698 92 2.554 79 23 6.301 210 188 24 209 11 503 28 1.406 22 3.995 125 24 23.505 1.057 2.777 161 10.761 558 7.097 234 2.869 104 25 11.849 518 3.276 159 7.015 315 1.557 44 26 20.113 826 6.451 350 8.387 323 2.393 70 2.881 83 27 8.929 376 1.177 66 1.954 134 2.900 88 2.899 88 28 25.179 880 9.075 261 9.655 436 4.153 121 2.296 62 29 15.716 598 6.273 242 3.140 180 406 15 2.005 65 3.892 96 30 2.233 72 127 19 1.007 28 1.099 25 31 6.649 300 2.390 128 2.369 135 1.890 37 32 3.681 239 460 16 744 76 854 50 1.623 97 33 2.654 112 524 24 1.531 61 600 27 34 3.198 146 565 38 897 54 392 11 1.343 43 35 10.884 239 3.238 89 2.470 58 940 10 2.934 30 1.302 52
31

Structure of Earnings Survey Quality report 2006 NSSG
Employment size classes Total 10 - 49 50 - 249 250 - 499 500 - 999 1000+ Nace Rev. 1
N n N n N n N n N n N n 36 16.565 528 8.080 285 5.267 159 1.058 32 2.161 52 37 309 25 248 11 61 14 40 28.057 733 536 22 986 19 26.535 692 41 8.580 550 1.343 68 2.521 241 536 30 4.180 211 45 72.464 2.180 18.582 769 28.989 942 12.513 215 4.977 106 7.403 148 50 25.019 1.063 5.728 369 13.490 565 5.267 111 535 18 51 137.618 4.652 34.854 1881 61.380 2123 14.773 334 11.164 172 15.446 142 52 110.018 3.624 7.584 700 25.156 1062 10.428 355 11.016 291 55.834 1216 55 112.970 3.784 34.232 1465 44.137 1496 16.367 352 11.089 343 7.145 128 60 28.138 1.232 5.560 233 6.749 407 1.943 45 527 22 13.359 525 61 3.432 281 1.139 132 1.614 109 680 40 62 6.404 301 519 37 733 65 622 24 4.531 175 63 29.055 1.122 9.468 399 8.923 431 2.413 31 5.959 191 2.292 70 64 50.314 1.979 1.058 125 2.773 190 3.002 111 1.389 43 42.092 1510 65 65.080 3.436 270 52 1.188 89 1.176 67 3.801 235 58.645 2993 66 3.040 218 225 26 114 33 206 23 1.029 66 1.465 70 67 3.505 132 719 34 2.787 98 70 3.247 144 276 13 1.430 74 1.541 57 71 4.143 219 1.127 78 1.426 84 1.051 37 539 20 72 9.848 481 2.714 121 3.598 218 1.425 78 2.112 64 73 6.166 295 536 49 2.138 119 465 19 3.026 108 74 72.267 2.445 17.966 617 25.073 811 11.775 329 10.568 422 6.885 266 80 206.553 1.281 128.890 168 22.536 139 24.541 160 5.611 114 24.974 700 85 122.743 3.896 2.458 178 13.028 697 18.545 592 38.108 1088 50.605 1341 90 3.315 173 649 50 2.666 123 91 12.161 282 4.133 98 6.190 110 300 3 1.538 71 92 28.939 916 7.590 211 8.962 394 5.118 96 3.783 96 3.486 119 93 10.136 297 5.938 193 2.777 67 1.421 37
32

Structure of Earnings Survey Quality report 2006 NSSG
Table 4. Coefficients of Variation for monthly gross earnings of full time employment by sex and age bands
Men Women Total
AGE BANDS VARIANCE ESTIMATION ESTIMATED VALUE CV %
VARIANCE ESTIMATION
ESTIMATED VALUE CV %
VARIANCE ESTIMATION
ESTIMATED VALUE CV %
15 - 24 1.593.220.469.552,7 31.017.132,4 4,1 3.520.315.220.693,3 30.745.329,4 6,1 5.152.312.746.241,8 61.762.461,8 3,7 25 - 54 141.134.140.231.521,0 1.198.407.843,8 1,0 130.822.060.459.452,0 701.279.570,2 1,6 242.970.298.204.098,0 1.899.687.413,9 0,8 55 - 64 172.285.334.144.785,0 193.402.241,7 6,8 14.326.923.645.518,9 50.299.409,7 7,5 193.713.143.285.209,0 243.701.651,4 5,7 >=65 897.703.893.069,6 19.516.839,1 4,9 142.487.326.297,8 2.141.885,0 17,6 1.048.076.859.258,4 21.658.724,1 4,7
TOTAL 376.929.150.219.007,0 1.442.344.056,9 1,3 129.606.191.068.285,0 784.466.194,3 1,5 401.781.760.768.734,0 2.226.810.251,2 0,9
Table 5. Coefficients of Variation for monthly gross earnings of part time employment by sex and age bands
Men Women Total AGE
BANDS VARIANCE ESTIMATION ESTIMATED VALUE CV %VARIANCE
ESTIMATION ESTIMATED
VALUE CV %VARIANCE
ESTIMATION ESTIMATED
VALUE CV % 15 - 24 127.901.806.886,2 2.990.327,2 12,0 186.405.755.096,8 5.514.374,0 7,8 330.011.624.764,8 8.504.701,2 6,8 25 - 54 45.470.357.953.492,9 40.144.397,1 16,8 17.543.890.759.307,6 40.232.448,9 10,4 74.325.697.891.989,6 80.376.846,0 10,7 55 - 64 2.607.606.132.426,6 7.714.052,0 20,9 252.022.118.257,3 3.374.299,4 14,9 2.830.719.424.144,4 11.088.351,4 15,2 >=65 335.095.346.823,8 1.359.788,5 42,6 908.233.253,4 51.912,8 58,1 336.003.580.077,2 1.411.701,4 41,1
TOTAL 61.953.686.235.599,8 52.208.564,8 15,1 17.967.141.061.002,7 49.173.035,1 8,6 91.794.568.551.111,6 101.381.600,0 9,5
33

Structure of Earnings Survey Quality report 2006 NSSG
Table 6. Coefficients of Variation for monthly gross earnings of full time employment by sex and isced
Men Women Total
ISCED VARIANCE ESTIMATION ESTIMATED VALUE CV %VARIANCE
ESTIMATION ESTIMATED
VALUE CV %VARIANCE
ESTIMATION ESTIMATED
VALUE CV % 01 14.100.197.055.733,2 147.526.560,4 2,5 33.002.729.644.698,2 61.782.569,7 9,3 47.237.530.579.486,6 209.309.130,1 3,3 02 10.581.800.454.849,7 145.169.504,8 2,2 4.407.061.870.173,1 59.688.928,4 3,5 14.859.687.474.756,8 204.858.433,2 1,9 03 34.426.595.607.103,0 411.550.252,9 1,4 34.364.525.044.366,1 292.636.139,5 2,0 64.426.434.923.987,4 704.186.392,4 1,1 04 7.767.098.881.031,5 106.575.489,9 2,6 1.490.715.177.256,9 26.019.009,5 4,7 9.534.963.198.184,0 132.594.499,4 2,3 05 80.926.455.783.028,4 192.227.072,0 4,7 14.167.651.892.316,0 133.231.413,1 2,8 105.812.922.863.623,0 325.458.485,1 3,2 06 283.053.681.666.764,0 439.295.176,9 3,8 189.985.166.901.233,0 211.108.134,1 6,5 572.307.927.767.601,0 650.403.311,0 3,7
TOTAL 376.929.150.219.007,0 1.442.344.056,9 1,3 129.606.191.068.285,0 784.466.194,3 1,5 401.781.760.768.734,0 2.226.810.251,2 0,9
Table 7. Coefficients of Variation for monthly gross earnings of part time employment by sex and isced
Men Women Total
ISCED VARIANCE
ESTIMATION ESTIMATED VALUE CV %VARIANCE
ESTIMATION ESTIMATED
VALUE CV %VARIANCE
ESTIMATION ESTIMATED
VALUE CV % 01 106.842.255.481,2 2.116.078,3 15,4 290.197.332.755,1 5.191.569,0 10,4 406.602.353.536,6 7.307.647,2 8,7 02 157.747.643.193,8 2.987.920,7 13,3 251.990.284.268,2 5.761.402,4 8,7 426.067.162.915,7 8.749.323,0 7,5 03 365.697.311.678,7 7.205.120,7 8,4 591.888.455.895,9 14.938.838,9 5,1 1.010.666.671.923,8 22.143.959,6 4,5 04 197.502.382.449,8 2.221.850,8 20,0 1.127.325.849.301,8 3.911.126,8 27,1 1.923.516.452.042,9 6.132.977,6 22,6 05 19.907.896.442.445,9 8.181.591,3 54,5 1.129.712.719.501,9 4.691.342,7 22,7 21.394.622.239.133,4 12.872.934,0 35,9 06 21.812.511.290.082,6 29.496.003,2 15,8 9.146.991.879.055,4 14.678.755,3 20,6 40.919.665.822.692,2 44.174.758,5 14,5
TOTAL 61.953.686.235.599,8 52.208.564,8 15,1 17.967.141.061.002,7 49.173.035,1 8,6 91.794.568.551.111,6 101.381.600,0 9,5
34

Structure of Earnings Survey Quality report 2006 NSSG
Table 8. Coefficients of Variation for monthly gross earnings of full time employment by sex and occupation
Men Women Total
ISCO-88 VARIANCE
ESTIMATION ESTIMATED VALUE CV %VARIANCE
ESTIMATION ESTIMATED
VALUE CV %VARIANCE
ESTIMATION ESTIMATED
VALUE CV % 1 38.809.418.262.481,9 99.032.293,1 6,3 4.301.967.754.599,6 26.825.978,3 7,7 43.298.086.126.716,9 125.858.271,4 5,2 2 275.333.612.022.129,0 377.710.243,4 4,4 189.776.257.859.320,0 183.623.042,3 7,5 533.134.439.145.446,0 561.333.285,7 4,1 3 15.036.543.190.253,4 153.806.933,8 2,5 9.841.128.148.140,9 124.650.746,0 2,5 24.996.072.449.419,5 278.457.679,8 1,8 4 15.453.726.599.991,7 181.491.146,0 2,2 27.045.419.272.719,3 220.622.595,1 2,4 48.514.808.110.478,2 402.113.741,1 1,7 5 23.141.119.972.908,1 107.880.102,3 4,5 7.392.743.339.113,3 117.565.984,1 2,3 30.368.775.914.420,1 225.446.086,4 2,4 7 16.761.235.575.487,4 214.606.879,7 1,9 1.146.311.748.672,3 21.843.471,9 4,9 17.993.043.847.040,0 236.450.351,7 1,8 8 17.540.170.399.692,7 199.778.497,1 2,1 657.485.790.114,7 12.159.676,4 6,7 17.905.219.542.589,0 211.938.173,6 2,0 9 7.816.560.860.430,7 106.301.286,5 2,6 36.849.959.640.083,4 77.038.081,2 7,9 44.812.542.346.522,2 183.339.367,7 3,7
TOTAL 376.929.150.219.007,0 1.442.344.056,9 1,3 129.606.191.068.285,0 784.466.194,3 1,5 401.781.760.768.734,0 2.226.810.251,2 0,9
Table 9. Coefficients of Variation for monthly gross earnings of part time employment by sex and occupation
Men Women Total
ISCO-88 VARIANCE
ESTIMATION ESTIMATED VALUE CV %VARIANCE
ESTIMATION ESTIMATED
VALUE CV %VARIANCE
ESTIMATION ESTIMATED
VALUE CV % 1 1.137.060.517,9 34.709,5 97,2 182.100.977,4 18.632,7 72,4 1.319.161.495,4 53.342,2 68,1 2 60.879.762.636.218,4 35.191.070,6 22,2 9.076.048.589.709,9 13.968.714,6 21,6 79.043.737.319.628,8 49.159.785,2 18,1 3 460.493.783.297,8 2.542.402,9 26,7 3.997.425.396.700,1 3.973.265,4 50,3 6.815.182.018.199,5 6.515.668,2 40,1 4 196.001.458.632,5 2.933.413,4 15,1 655.824.867.475,1 12.274.981,0 6,6 836.247.350.139,2 15.208.394,4 6,0 5 134.947.303.379,7 3.721.944,7 9,9 410.025.842.968,3 10.622.039,3 6,0 572.132.086.470,5 14.343.984,0 5,3 7 157.375.304.789,7 2.732.452,8 14,5 65.979.917.587,4 998.835,4 25,7 230.836.502.867,4 3.731.288,2 12,9 8 93.364.151.384,9 2.065.785,4 14,8 2.255.153.681,7 179.138,8 26,5 95.706.776.393,3 2.244.924,2 13,8 9 154.541.132.520,0 2.927.149,2 13,4 321.862.807.951,8 7.137.427,8 7,9 506.908.102.464,5 10.064.577,1 7,1
TOTAL 61.953.686.235.599,8 52.208.564,8 15,1 17.967.141.061.002,7 49.173.035,1 8,6 91.794.568.551.111,6 101.381.600,0 9,5
35

Structure of Earnings Survey Quality report 2006 NSSG
Table 10. Coefficients of Variation for monthly gross earnings of full time employment by NUTS1 and NACE section
GR1 GR2 GR3 GR4 Total
NACE1 VARIANCE
ESTIMATION ESTIMATED
VALUE CV %
VARIANCE ESTIMATION
ESTIMATED VALUE
CV %
VARIANCE ESTIMATION
ESTIMATED VALUE
CV %
VARIANCE ESTIMATION
ESTIMATED VALUE
CV %
VARIANCE ESTIMATION
ESTIMATED VALUE
CV %
C 18.409.758.384,0 3.752.010,7 3,6 128.385.003.025,9 2.693.029,0 13,3 18.025.584.654,3 1.788.420,1 7,5 11.751.775.275,1 987.844,1 11,0 176.572.121.339,3 9.221.303,9 4,6
D 4.343.299.713.466,4 141.338.267,9 1,5 2.103.813.307.536,6 71.401.953,1 2,0 15.682.375.728.441,8 236.590.478,8 1,7 193.189.218.732,0 14.450.054,2 3,0 22.322.677.968.176,7 463.780.754,0 1,0
E 130.765.446.847,0 22.030.508,8 1,6 583.021.768.833,5 21.126.862,4 3,6 419.866.313.203,4 50.299.059,2 1,3 1.107.452.475,6 1.712.268,3 1,9 1.134.760.981.359,5 95.168.698,7 1,1
F 1.344.659.660.430,0 29.286.070,0 4,0 590.976.335.816,6 11.065.865,0 6,9 3.784.531.760.425,2 55.350.454,1 3,5 736.946.041.615,9 7.329.161,3 11,7 6.457.113.798.287,7 103.031.550,4 2,5
G 2.177.209.224.098,7 70.848.802,1 2,1 1.110.251.752.008,5 31.576.777,7 3,3 8.854.358.567.256,6 200.885.813,4 1,5 1.056.956.347.406,4 15.060.436,4 6,8 13.198.775.890.770,3 318.371.829,6 1,1
H 689.022.876.483,6 19.172.889,6 4,3 704.477.705.875,3 17.345.973,0 4,8 3.899.436.623.065,0 41.873.306,1 4,7 3.010.941.472.985,4 39.864.923,6 4,4 8.303.878.678.409,3 118.257.092,3 2,4
I 401.435.585.729,6 36.554.950,7 1,7 325.025.089.019,9 22.929.042,6 2,5 3.304.006.699.625,5 146.470.662,4 1,2 454.615.704.952,9 16.819.973,7 4,0 4.485.083.079.327,9 222.774.629,4 1,0
J 237.132.384.364,6 21.905.042,3 2,2 76.865.729.185,8 14.036.161,4 2,0 2.572.172.438.050,0 107.988.350,2 1,5 29.044.963.374,3 6.876.631,6 2,5 2.915.215.514.974,7 150.806.185,5 1,1
K 932.344.799.218,7 17.769.808,4 5,4 281.363.057.732,7 4.304.913,6 12,3 12.027.469.355.370,1 105.397.196,6 3,3 170.007.277.755,6 5.285.289,9 7,8 13.411.184.490.077,2 132.757.208,5 2,8
M 29.541.593.817.646,9 131.892.812,5 4,1 193.707.763.759.937,0 70.938.841,7 19,6 91.534.057.527.484,5 90.279.733,9 10,6 5.783.207.257.297,0 28.258.840,2 8,5 320.566.622.362.365,0 321.370.228,3 5,6
N 1.046.450.220.031,0 65.547.511,1 1,6 422.887.045.039,0 35.593.436,7 1,8 3.411.306.089.033,6 92.979.504,2 2,0 408.404.669.771,5 17.888.649,3 3,6 5.289.048.023.875,0 212.009.101,4 1,1
O 429.922.114.185,8 15.445.788,5 4,2 54.840.618.483,7 5.518.289,8 4,2 3.029.040.026.789,3 53.255.404,6 3,3 7.025.100.312,4 5.042.186,4 1,7 3.520.827.859.771,3 79.261.669,3 2,4
TOTAL 41.292.245.600.886,3 575.544.462,6 1,1 200.089.671.172.494,0 308.531.146,0 4,6 148.536.646.713.399,0 1.183.158.383,6 1,0 11.863.197.281.954,1 159.576.259,0 2,2 401.781.760.768.734,0 2.226.810.251,3 0,9
36

Structure of Earnings Survey Quality report 2006 NSSG
Table 11. Coefficients of Variation for monthly gross earnings of part time employment by NUTS1 and NACE section
GR1 GR2 GR3 GR4 Total
NACE1 VARIANCE
ESTIMATION ESTIMATED
VALUE CV %
VARIANCE ESTIMATION
ESTIMATED VALUE
CV %
VARIANCE ESTIMATION
ESTIMATED VALUE
CV %
VARIANCE ESTIMATION
ESTIMATED VALUE
CV %
VARIANCE ESTIMATION
ESTIMATED VALUE
CV %
C 491.628.967,2 29.906,2 74,1 3.096.587.730,8 66.317,5 83,9 29.682.132,5 8.247,1 66,1 130.627.728,0 11.781,0 97,0 3.748.526.558,4 116.251,8 52,7
D 163.725.017.792,4 2.283.380,7 17,7 14.673.140.519,0 592.788,3 20,4 167.970.993.591,8 1.898.186,5 21,6 2.878.341.822,0 203.129,9 26,4 349.247.493.725,2 4.977.485,5 11,9
E 0,0 2.418.011,4 1.755,8 88,6 0,0 79.338.402,7 9.437,6 94,4 81.756.414,1 11.193,5 80,8
F 45.150.088.617,6 597.074,2 35,6 28.173.464.057,5 482.356,7 34,8 74.830.772.068,3 1.012.256,1 27,0 13.964.886.068,3 131.344,1 90,0 162.119.210.811,7 2.223.031,0 18,1
G 174.975.343.894,5 4.915.666,9 8,5 116.872.272.501,5 3.601.474,1 9,5 393.503.820.182,2 10.660.866,6 5,9 151.595.549.090,0 2.279.351,2 17,1 836.946.985.668,1 21.457.358,9 4,3
H 75.170.491.650,8 1.410.942,5 19,4 113.647.270.456,8 1.272.831,8 26,5 252.586.948.221,4 4.471.933,9 11,2 136.099.573.312,1 2.496.943,8 14,8 577.504.283.641,1 9.652.652,0 7,9
I 5.871.236.424,0 429.651,2 17,8 22.882.636.567,0 256.916,4 58,9 32.379.062.870,2 1.367.288,1 13,2 20.964.971.596,0 402.342,4 36,0 82.097.907.457,2 2.456.198,0 11,7
J 700.663.467,4 128.954,3 20,5 416.955.011,1 85.622,7 23,8 4.482.585.480,2 215.474,9 31,1 1.020.225.115,6 67.313,3 47,5 6.620.429.074,3 497.365,3 16,4
K 43.998.598.571,5 881.137,9 23,8 33.125.297.494,8 385.008,6 47,3 351.627.148.788,2 4.592.030,0 12,9 9.188.243.028,5 296.035,4 32,4 437.939.287.882,9 6.154.211,9 10,8
M 4.419.906.007.301,4 9.245.622,1 22,7 14.303.802.330.612,1 13.337.278,8 28,4 69.557.633.248.455,7 26.397.886,2 31,6 843.761.840.420,6 1.438.844,8 63,8 89.125.103.426.789,9 50.419.631,8 18,7
N 31.360.753.544,9 522.909,0 33,9 564.657.265,5 36.999,0 64,2 56.836.354.386,9 938.995,8 25,4 1.721.916,4 1.421,8 92,3 88.763.487.113,9 1.500.325,6 19,9
O 27.474.745.197,2 485.650,2 34,1 466.370.782,4 73.874,3 29,2 96.313.826.540,6 1.292.811,3 24,0 140.813.454,6 63.558,9 18,7 124.395.755.974,9 1.915.894,8 18,4
TOTAL 4.988.824.575.428,9 20.930.895,2 10,7 14.637.723.401.009,9 20.193.224,0 18,9 70.988.194.442.718,0 52.855.976,5 15,9 1.179.826.131.954,8 7.401.504,2 14,7 91.794.568.551.111,7 101.381.600,1 9,5
37

Structure of Earnings Survey Quality report 2006 NSSG
Table 12. Coefficients of Variation for monthly gross earnings of full time employment by sex and NACE section
Men Women Total
NACE1 VARIANCE ESTIMATION ESTIMATED
VALUE CV %VARIANCE
ESTIMATION ESTIMATED
VALUE CV %VARIANCE
ESTIMATION ESTIMATED
VALUE CV % C 214.581.957.039,2 8.302.117,7 5,6 40.415.786.318,3 919.186,1 21,9 176.572.121.339,3 9.221.303,9 4,6 D 25.657.646.804.968,0 334.899.787,0 1,5 7.408.705.575.729,6 128.880.967,0 2,1 22.322.677.968.176,7 463.780.754,0 1,0 E 1.963.642.692.480,9 83.158.993,3 1,7 840.730.790.685,1 12.009.705,4 7,6 1.134.760.981.359,5 95.168.698,7 1,1 F 6.005.513.144.003,2 84.346.238,6 2,9 2.467.484.683.775,0 18.685.311,8 8,4 6.457.113.798.287,7 103.031.550,4 2,5 G 13.885.797.140.327,9 199.586.423,0 1,9 5.667.869.845.818,4 118.785.406,6 2,0 13.198.775.890.770,3 318.371.829,6 1,1 H 6.550.390.780.550,9 61.384.783,9 4,2 2.976.463.402.147,0 56.872.308,4 3,0 8.303.878.678.409,3 118.257.092,3 2,4 I 6.410.026.955.525,4 165.232.370,6 1,5 2.970.876.368.377,0 57.542.258,7 3,0 4.485.083.079.327,9 222.774.629,4 1,0 J 4.492.103.971.362,2 83.005.741,5 2,6 1.570.690.949.070,7 67.800.444,0 1,8 2.915.215.514.974,7 150.806.185,5 1,1 K 7.917.584.221.641,7 74.095.897,1 3,8 8.001.398.357.656,6 58.661.311,4 4,8 13.411.184.490.077,2 132.757.208,5 2,8 M 294.754.340.901.974,0 215.237.971,4 8,0 90.669.280.199.206,5 106.132.257,0 9,0 320.566.622.362.365,0 321.370.228,3 5,6 N 5.589.407.235.116,0 85.478.290,6 2,8 4.794.225.068.267,6 126.530.810,8 1,7 5.289.048.023.875,0 212.009.101,4 1,1 O 3.488.114.414.018,0 47.615.442,1 3,9 2.198.050.041.233,7 31.646.227,2 4,7 3.520.827.859.771,3 79.261.669,3 2,4 TOTAL 376.929.150.219.007,0 1.442.344.056,9 1,3 129.606.191.068.285,0 784.466.194,3 1,5 401.781.760.768.734,0 2.226.810.251,2 0,9
38

Structure of Earnings Survey Quality report 2006 NSSG
Table 13. Coefficients of Variation for monthly gross earnings of part time employment by sex and NACE section
Men Women Total
NACE1 VARIANCE ESTIMATION ESTIMATED
VALUE CV % VARIANCE
ESTIMATION ESTIMATED
VALUE CV %VARIANCE
ESTIMATION ESTIMATED
VALUE CV % C 3.705.268.532,0 102.026,0 59,7 62.022.714,4 14.225,8 55,4 3.748.526.558,4 116.251,8 52,7 D 178.885.737.576,3 2.574.799,6 16,4 136.463.494.598,7 2.402.685,9 15,4 349.247.493.725,2 4.977.485,5 11,9 E 79.338.402,7 9.437,6 94,4 2.418.011,4 1.755,8 88,6 81.756.414,1 11.193,5 80,8 F 146.493.760.415,2 1.977.708,7 19,4 16.162.263.839,8 245.322,3 51,8 162.119.210.811,7 2.223.031,0 18,1 G 183.954.978.821,3 4.104.172,5 10,5 689.985.192.057,5 17.353.186,3 4,8 836.946.985.668,1 21.457.358,9 4,3 H 207.524.001.936,3 4.398.559,3 10,4 298.879.396.800,8 5.254.092,6 10,4 577.504.283.641,1 9.652.652,0 7,9 I 45.001.827.743,4 1.277.548,6 16,6 38.819.977.357,9 1.178.649,4 16,7 82.097.907.457,2 2.456.198,0 11,7 J 158.491.245,6 17.600,5 71,5 7.374.528.078,7 479.764,8 17,9 6.620.429.074,3 497.365,3 16,4 K 40.954.193.435,9 1.273.836,1 15,9 327.026.387.226,7 4.880.375,8 11,7 437.939.287.882,9 6.154.211,9 10,8 M 61.023.608.196.211,6 34.825.437,0 22,4 16.358.539.421.936,2 15.594.194,8 25,9 89.125.103.426.789,9 50.419.631,8 18,7 N 39.254.850.498,1 728.179,0 27,2 47.410.624.018,3 772.146,6 28,2 88.763.487.113,9 1.500.325,6 19,9 O 84.065.590.781,3 919.259,8 31,5 46.415.334.362,4 996.635,0 21,6 124.395.755.974,9 1.915.894,8 18,4
TOTAL 61.953.686.235.599,7 52.208.564,7 15,1 17.967.141.061.002,8 49.173.035,1 8,6 91.794.568.551.111,6 101.381.600,0 9,5
39

Structure of Earnings Survey Quality report 2006 NSSG
Table 14. Coefficients of Variation for monthly hours of full time employment by sex and age bands
Men Women Total
AGE BANDS
VARIANCE ESTIMATION
ESTIMATED VALUE CV %
VARIANCE ESTIMATION
ESTIMATED VALUE CV %
VARIANCE ESTIMATION
ESTIMATED VALUE CV %
15 - 24 53.582.998.183,2 5.828.304,0 4,0 127.281.789.034,6 5.873.454,6 6,1 181.318.550.116,3 11.701.758,6 3,6 25 - 54 1.028.759.210.392,7 120.575.434,9 0,8 1.439.611.207.459,9 86.058.086,2 1,4 2.112.906.609.891,6 206.633.521,1 0,7 55 - 64 758.347.526.535,4 14.562.320,7 6,0 68.780.518.728,2 4.576.847,2 5,7 893.146.135.635,6 19.139.167,9 4,9 >=65 3.950.965.140,9 1.214.948,4 5,2 1.279.444.174,1 211.866,6 16,9 5.260.346.859,9 1.426.815,0 5,1 TOTAL 1.687.927.939.610,6 142.181.008,1 0,9 1.283.522.132.870,7 96.720.254,6 1,2 1.713.713.643.327,6 238.901.262,6 0,5
Table 15. Coefficients of Variation for monthly hours of full time employment by sex and isced
Men Women Total
ISCED VARIANCE
ESTIMATION ESTIMATED
VALUE CV %VARIANCE
ESTIMATION ESTIMATED
VALUE CV %VARIANCE
ESTIMATION ESTIMATED
VALUE CV % 01 190.396.331.198,6 17.927.425,2 2,4 394.183.018.102,0 9.199.850,7 6,8 587.980.454.465,9 27.127.275,9 2,8 02 165.589.086.620,0 18.720.944,0 2,2 79.393.773.215,9 9.385.594,1 3,0 241.875.235.357,8 28.106.538,1 1,7 03 395.105.950.504,9 46.917.316,4 1,3 707.491.139.096,6 39.951.674,8 2,1 1.022.250.475.812,7 86.868.991,2 1,2 04 102.328.663.898,5 11.853.255,6 2,7 32.683.588.152,8 3.805.041,3 4,8 140.919.852.104,9 15.658.296,8 2,4 05 635.644.619.341,7 17.997.642,4 4,4 235.954.367.190,6 16.299.150,4 3,0 1.111.381.559.634,4 34.296.792,7 3,1 06 697.180.340.823,3 28.764.424,6 2,9 1.640.363.465.579,8 18.078.943,3 7,1 2.401.093.759.125,9 46.843.367,9 3,3 TOTAL 1.687.927.939.610,6 142.181.008,1 0,9 1.283.522.132.870,7 96.720.254,6 1,2 1.713.713.643.327,6 238.901.262,6 0,5
40

Structure of Earnings Survey Quality report 2006 NSSG
Table 16. Coefficients of Variation for monthly hours of full time employment by sex and occupation
Men Women Total
ISCO-88 VARIANCE
ESTIMATION ESTIMATED
VALUE CV %VARIANCE
ESTIMATION ESTIMATED
VALUE CV %VARIANCE
ESTIMATION ESTIMATED
VALUE CV % 1 96.685.858.500,2 4.959.329,3 6,3 15.486.461.110,5 1.612.500,1 7,7 112.910.937.859,1 6.571.829,5 5,1 2 833.209.080.511,2 26.197.835,2 3,5 1.630.205.968.050,1 15.892.597,9 8,0 1.870.836.883.618,0 42.090.433,1 3,2 3 113.525.940.395,3 14.246.217,1 2,4 179.873.372.065,4 14.626.633,7 2,9 295.808.375.355,5 28.872.850,9 1,9 4 176.018.383.794,6 20.349.471,9 2,1 454.599.090.019,0 28.438.188,4 2,4 689.261.064.822,8 48.787.660,4 1,7 5 254.244.475.223,4 14.073.832,6 3,6 160.519.853.955,7 18.529.425,5 2,2 407.079.029.802,3 32.603.258,1 2,0 7 215.596.367.317,2 23.125.852,3 2,0 25.783.829.307,6 3.229.910,4 5,0 243.539.015.759,7 26.355.762,7 1,9 8 212.335.582.001,5 23.093.013,5 2,0 17.138.232.604,8 1.947.152,6 6,7 223.385.924.744,3 25.040.166,1 1,9 9 155.889.896.960,7 15.890.663,4 2,5 520.950.371.982,1 12.414.538,0 5,8 683.135.219.637,5 28.305.201,4 2,9 TOTAL 1.687.927.939.610,6 142.181.008,1 0,9 1.283.522.132.870,7 96.720.254,6 1,2 1.713.713.643.327,6 238.901.262,6 0,5
41

Structure of Earnings Survey Quality report 2006 NSSG
Table 17. Coefficients of Variation for monthly hours of full time employment by NUTS1 and NACE section
GR1 GR2 GR3 GR4 Total
NACE1 VARIANCE
ESTIMATION ESTIMATED
VALUE CV %
VARIANCE ESTIMATION
ESTIMATED VALUE
CV %
VARIANCE ESTIMATION
ESTIMATED VALUE
CV %
VARIANCE ESTIMATION
ESTIMATED VALUE
CV %
VARIANCE ESTIMATION
ESTIMATED VALUE CV %
C 448.023.245,5 470.882,1 4,5 283.846.960,2 290.415,9 5,8 49.089.936,8 207.583,5 3,4 50.554.039,6 115.031,0 6,2 831.514.182,1 1.083.912,5 2,7
D 38.981.482.706,4 18.710.623,1 1,1 13.177.129.167,0 8.817.348,1 1,3 44.297.744.471,2 25.966.410,4 0,8 2.957.203.600,9 1.978.070,5 2,7 99.413.559.945,5 55.472.452,0 0,6
E 297.180.578,9 1.730.899,0 1,0 1.191.608.114,6 1.992.327,3 1,7 647.389.476,7 3.252.206,1 0,8 5.102.611,3 166.544,0 1,4 2.141.280.781,5 7.141.976,5 0,6
F 7.691.759.544,9 3.688.793,6 2,4 3.889.096.672,8 1.375.801,0 4,5 19.767.803.201,1 6.577.709,8 2,1 3.451.269.467,4 822.565,3 7,1 34.799.928.886,2 12.464.869,8 1,5
G 19.446.828.088,7 10.178.872,3 1,4 20.255.367.066,3 4.868.765,5 2,9 53.779.621.977,7 24.428.841,1 0,9 9.943.044.185,1 2.149.650,2 4,6 103.424.861.317,8 41.626.129,2 0,8
H 10.163.007.301,5 3.027.057,2 3,3 10.958.466.526,1 2.639.230,5 4,0 29.055.634.806,1 5.995.418,4 2,8 28.428.765.390,5 5.554.178,4 3,0 78.605.874.024,3 17.215.884,4 1,6
I 2.547.271.429,3 3.381.217,7 1,5 3.806.420.309,7 2.122.969,1 2,9 12.720.915.447,9 13.129.040,1 0,9 2.361.363.496,6 1.617.998,3 3,0 21.435.970.683,4 20.251.225,2 0,7
J 276.717.528,6 1.880.135,3 0,9 137.568.714,7 1.170.163,5 1,0 2.317.726.893,1 8.136.563,0 0,6 51.177.103,7 607.971,4 1,2 2.783.190.240,1 11.794.833,2 0,4
K 7.475.175.652,4 2.529.468,0 3,4 4.147.371.899,0 627.946,5 10,3 42.979.014.026,3 11.052.399,9 1,9 1.048.183.853,9 627.541,4 5,2 55.649.745.431,6 14.837.355,8 1,6
M 114.721.228.771,0 9.813.825,7 3,5 466.120.236.911,5 5.872.429,6 11,6 497.652.655.323,9 7.374.331,0 9,6 193.016.072.460,8 2.896.029,2 15,2 1.271.510.193.467,3 25.956.615,6 4,3
N 2.600.719.774,3 6.706.331,4 0,8 1.223.450.965,7 3.582.334,7 1,0 10.026.526.982,1 9.695.643,8 1,0 4.211.028.452,1 1.915.060,8 3,4 18.061.726.174,1 21.899.370,6 0,6
O 5.060.924.417,8 2.087.331,9 3,4 622.809.892,4 770.316,2 3,2 19.241.128.949,0 5.584.197,3 2,5 130.934.934,3 714.792,4 1,6 25.055.798.193,6 9.156.637,9 1,7
TOTAL 209.710.319.039,3 64.205.437,3 0,7 525.813.373.200,0 34.130.047,9 2,1 732.535.251.491,9 121.400.344,4 0,7 245.654.699.596,2 19.165.432,9 2,6 1.713.713.643.327,5 238.901.262,7 0,5
42

Structure of Earnings Survey Quality report 2006 NSSG
Table 18. Coefficients of Variation for monthly hours of full time employment by sex and NACE section
Men Women Total
NACE1 VARIANCE
ESTIMATION ESTIMATED
VALUE CV %VARIANCE
ESTIMATION ESTIMATED
VALUE CV %VARIANCE
ESTIMATION ESTIMATED
VALUE CV % C 1.198.590.378,2 943.279,0 3,7 963.744.271,9 140.633,5 22,1 831.514.182,1 1.083.912,5 2,7 D 161.752.936.617,7 37.351.961,8 1,1 118.418.227.729,1 18.120.490,2 1,9 99.413.559.945,5 55.472.452,0 0,6 E 7.430.245.901,9 6.213.061,3 1,4 4.000.290.013,4 928.915,2 6,8 2.141.280.781,5 7.141.976,5 0,6 F 48.887.638.330,0 10.041.903,5 2,2 32.832.034.232,3 2.422.966,3 7,5 34.799.928.886,2 12.464.869,8 1,5 G 125.241.530.870,5 23.803.296,2 1,5 97.447.119.314,4 17.822.833,0 1,8 103.424.861.317,8 41.626.129,2 0,8 H 53.669.786.395,0 7.980.746,1 2,9 62.771.644.051,1 9.235.138,3 2,7 78.605.874.024,3 17.215.884,4 1,6 I 42.577.878.977,6 14.004.956,0 1,5 32.489.236.142,6 6.246.269,1 2,9 21.435.970.683,4 20.251.225,2 0,7 J 12.036.457.235,9 5.771.019,5 1,9 10.836.873.816,2 6.023.813,7 1,7 2.783.190.240,1 11.794.833,2 0,4 K 63.049.555.681,1 7.833.163,9 3,2 56.353.380.343,8 7.004.191,8 3,4 55.649.745.431,6 14.837.355,8 1,6 M 1.097.864.056.584,2 15.459.966,8 6,8 799.680.505.560,7 10.496.648,7 8,5 1.271.510.193.467,3 25.956.615,6 4,3 N 37.420.431.172,8 7.899.066,0 2,4 38.262.679.217,6 14.000.304,6 1,4 18.061.726.174,1 21.899.370,6 0,6 O 36.798.831.465,7 4.878.588,0 3,9 29.466.398.177,4 4.278.049,9 4,0 25.055.798.193,6 9.156.637,9 1,7 TOTAL 1.687.927.939.610,6 142.181.008,1 0,9 1.283.522.132.870,7 96.720.254,6 1,2 1.713.713.643.327,6 238.901.262,6 0,5
43

Structure of Earnings Survey Quality report 2006 NSSG
ANNEX II
Questionnaires
44

Structure of Earnings Survey Quality report 2006 NSSG
45

Structure of Earnings Survey Quality report 2006 NSSG
46

Structure of Earnings Survey Quality report 2006 NSSG
47

Structure of Earnings Survey Quality report 2006 NSSG
48

Structure of Earnings Survey Quality report 2006 NSSG
49

Structure of Earnings Survey Quality report 2006 NSSG
50
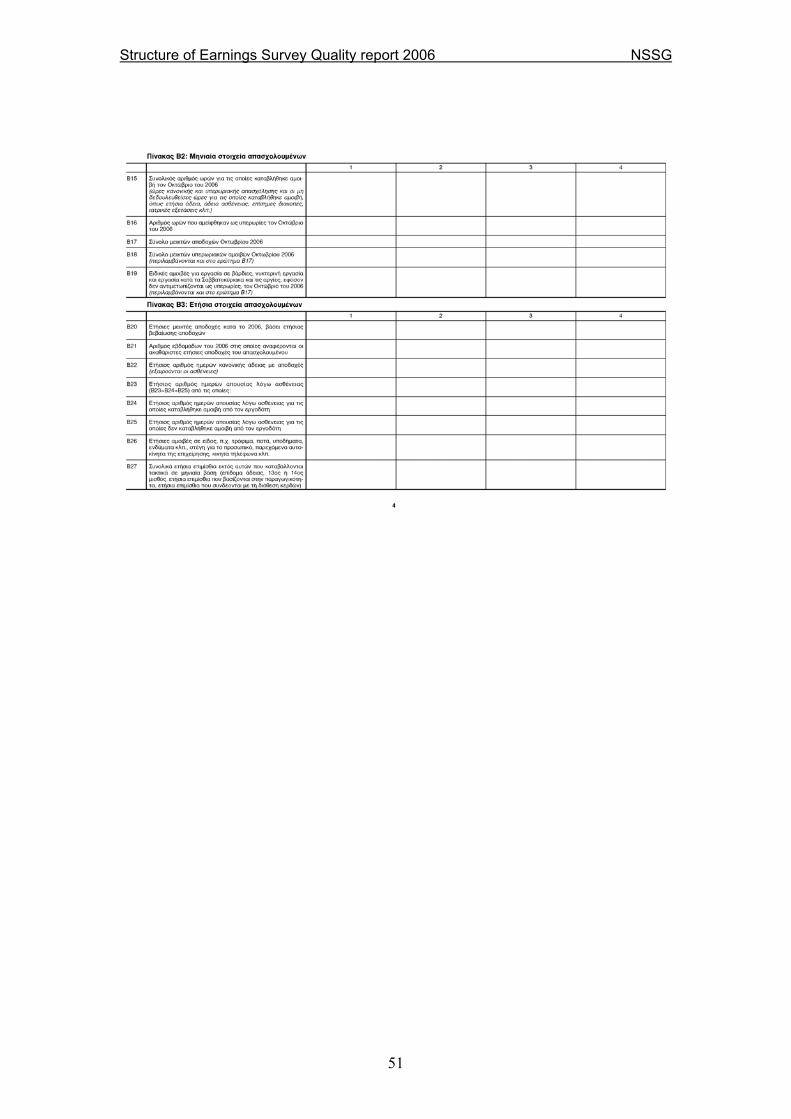
Structure of Earnings Survey Quality report 2006 NSSG
51

Structure of Earnings Survey Quality report 2006 NSSG
52

Structure of Earnings Survey Quality report 2006 NSSG
53

Structure of Earnings Survey Quality report 2006 NSSG
54