Embed Size (px)
Citation preview
LETTERS
Structure of the amantadine binding site of influenzaM2 proton channels in lipid bilayersSarah D. Cady1, Klaus Schmidt-Rohr1, Jun Wang2, Cinque S. Soto2, William F. DeGrado2 & Mei Hong1
The M2 protein of influenza A virus is a membrane-spanning tetra-meric proton channel targeted by the antiviral drugs amantadineand rimantadine1. Resistance to these drugs has compromised theireffectiveness against many influenza strains, including pandemicH1N1. A recent crystal structure of M2(22–46) showed electrondensities attributed to a single amantadine in the amino-terminalhalf of the pore2, indicating a physical occlusion mechanism forinhibition. However, a solution NMR structure of M2(18–60)showed four rimantadines bound to the carboxy-terminal lipid-facing surface of the helices3, suggesting an allosteric mechanism.Here we show by solid-state NMR spectroscopy that two amanta-dine-binding sites exist in M2 in phospholipid bilayers. The high-affinity site, occupied by a single amantadine, is located in theN-terminal channel lumen, surrounded by residues mutated inamantadine-resistant viruses. Quantification of the protein–aman-tadine distances resulted in a 0.3 A-resolution structure of the high-affinity binding site. The second, low-affinity, site was observed onthe C-terminal protein surface, but only when the drug reaches highconcentrations in the bilayer. The orientation and dynamics of thedrug are distinct in the two sites, as shown by 2H NMR. These resultsindicate that amantadine physically occludes the M2 channel, thuspaving the way for developing new antiviral drugs against influenzaviruses. The study demonstrates the ability of solid-state NMR toelucidate small-molecule interactions with membrane proteins anddetermine high-resolution structures of their complexes.
The M2 protein of influenza A viruses is a modular, multifunc-tional protein that plays important roles in the acidification anduncoating of the endosome-entrapped virus and in viral assemblyand budding1,4. Its proton-conducting activity is mediated by a singletransmembrane (TM) domain that forms a four-helix bundle, whichacts as a pH-activated proton channel. The TM domain alone issufficient for tetramerization5,6 and for amantadine-sensitive protonconductivity in vesicles and cell membranes7,8.
The recent low pH crystal structure of micelle-solubilized M2(22–46)shows a single molecule of amantadine (Amt) in the N-terminal porelumen, consistent with the known stoichiometry of binding8 and thelocation of resistant mutations, including Leu 26, Val 27, Ala 30, Ser 31and Gly 34 (refs 9–11). However, the low-pH state of the protein is onlytransiently populated in acidifying endosomes, whereas the drug firstbinds with higher affinity to the protein near neutral pH9. Thus, deter-mining the structure of the drug-complexed M2 protein at neutral pH isimportant for understanding its mechanism of inhibition. The solutionNMR structure of micelle-solubilized M2(18–60) at pH 7.5 failed toshow strong nuclear Overhauser effects (NOEs) between the drugand pore-lining residues, but it would have been difficult to observeNOEs between the fast-relaxing pore-lining residues and unlabelledrimantadine undergoing restricted motion in the pore. Weak NOEswere observed between residues on the protein surface and the drug
which, however, comprised 13% of the detergent in which the proteinwas dissolved (200-fold excess over protein tetramers). We thus turnedto solid-state NMR (SSNMR), which allows for investigation of thedynamics and contacts of drug molecules bound at variable concentra-tions to membrane proteins in phospholipid bilayers, which are farbetter mimics of biological membranes than micelles.
Rotational-echo double-resonance (REDOR) NMR is a powerfulmethod to measure sub-nanometre inter-atomic distances with up to0.1-A accuracy12. The M2 peptide (residues 22–46), reconstituted intoDMPC (dimyristoylphosphatidylcholine) vesicles at pH 7.5 under fullytetrameric conditions6,13, contained uniformly 13C-labelled residueswhose 13C chemical shifts were assigned from two-dimensional correla-tion spectra (Supplementary Fig. 1). Amantadine was perdeuterated,thus enabling 13C{2H} REDOR distance measurements (observednucleus{unobserved nucleus}).
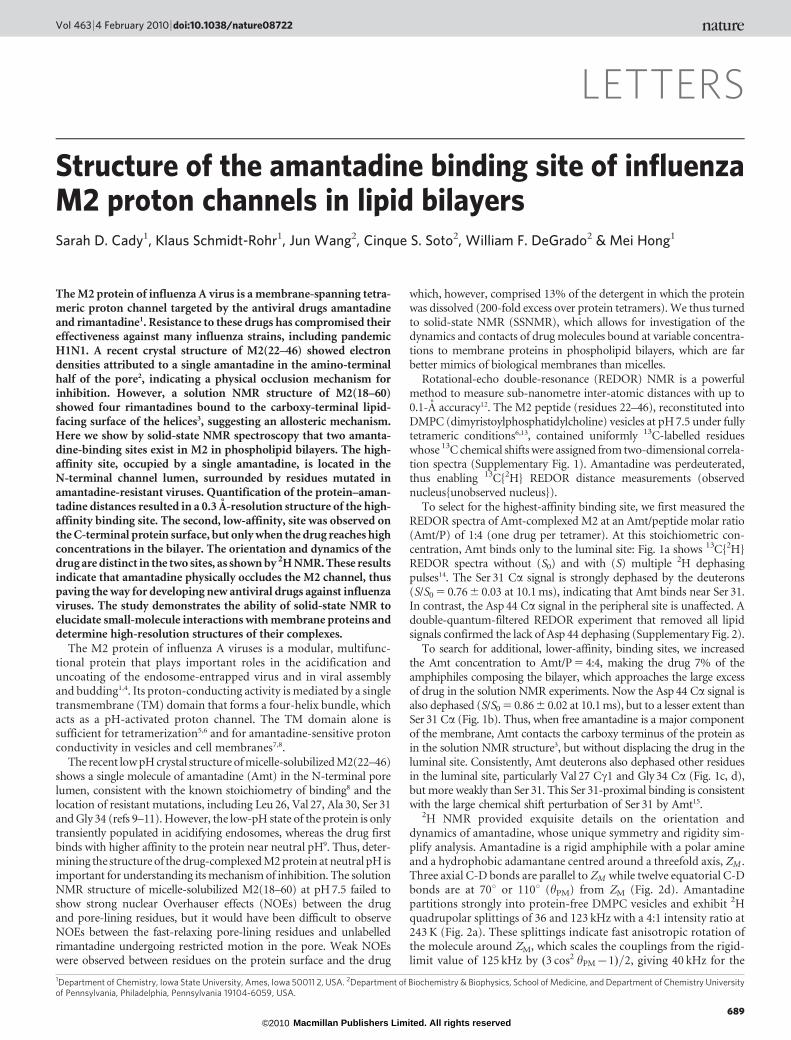
To select for the highest-affinity binding site, we first measured theREDOR spectra of Amt-complexed M2 at an Amt/peptide molar ratio(Amt/P) of 1:4 (one drug per tetramer). At this stoichiometric con-centration, Amt binds only to the luminal site: Fig. 1a shows 13C{2H}REDOR spectra without (S0) and with (S) multiple 2H dephasingpulses14. The Ser 31 Ca signal is strongly dephased by the deuterons(S/S0 5 0.76 6 0.03 at 10.1 ms), indicating that Amt binds near Ser 31.In contrast, the Asp 44 Ca signal in the peripheral site is unaffected. Adouble-quantum-filtered REDOR experiment that removed all lipidsignals confirmed the lack of Asp 44 dephasing (Supplementary Fig. 2).
To search for additional, lower-affinity, binding sites, we increasedthe Amt concentration to Amt/P 5 4:4, making the drug 7% of theamphiphiles composing the bilayer, which approaches the large excessof drug in the solution NMR experiments. Now the Asp 44 Ca signal isalso dephased (S/S0 5 0.86 6 0.02 at 10.1 ms), but to a lesser extent thanSer 31 Ca (Fig. 1b). Thus, when free amantadine is a major componentof the membrane, Amt contacts the carboxy terminus of the protein asin the solution NMR structure3, but without displacing the drug in theluminal site. Consistently, Amt deuterons also dephased other residuesin the luminal site, particularly Val 27 Cc1 and Gly 34 Ca (Fig. 1c, d),but more weakly than Ser 31. This Ser 31-proximal binding is consistentwith the large chemical shift perturbation of Ser 31 by Amt15.
2H NMR provided exquisite details on the orientation anddynamics of amantadine, whose unique symmetry and rigidity sim-plify analysis. Amantadine is a rigid amphiphile with a polar amineand a hydrophobic adamantane centred around a threefold axis, ZM .Three axial C-D bonds are parallel to ZM while twelve equatorial C-Dbonds are at 70u or 110u (hPM) from ZM (Fig. 2d). Amantadinepartitions strongly into protein-free DMPC vesicles and exhibit 2Hquadrupolar splittings of 36 and 123 kHz with a 4:1 intensity ratio at243 K (Fig. 2a). These splittings indicate fast anisotropic rotation ofthe molecule around ZM, which scales the couplings from the rigid-limit value of 125 kHz by (3 cos2 hPM{1)=2, giving 40 kHz for the
1Department of Chemistry, Iowa State University, Ames, Iowa 50011 2, USA. 2Department of Biochemistry & Biophysics, School of Medicine, and Department of Chemistry Universityof Pennsylvania, Philadelphia, Pennsylvania 19104-6059, USA.
Vol 463 | 4 February 2010 | doi:10.1038/nature08722
689Macmillan Publishers Limited. All rights reserved©2010
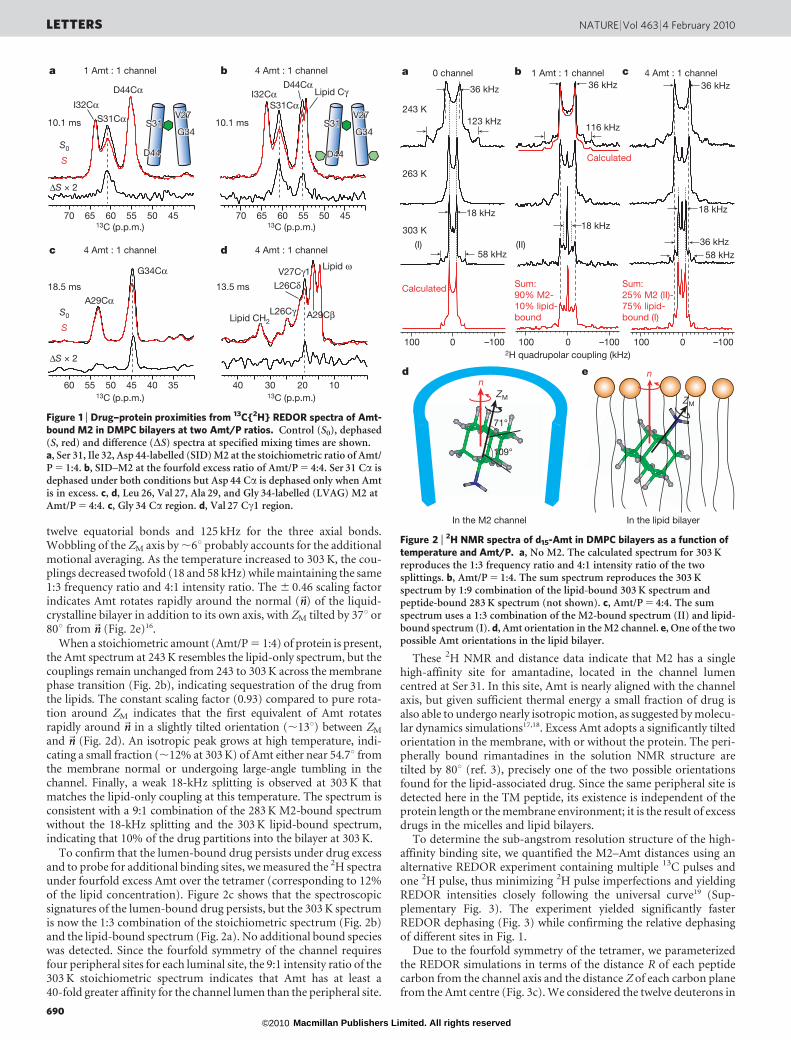
twelve equatorial bonds and 125 kHz for the three axial bonds.Wobbling of the ZM axis by ,6u probably accounts for the additionalmotional averaging. As the temperature increased to 303 K, the cou-plings decreased twofold (18 and 58 kHz) while maintaining the same1:3 frequency ratio and 4:1 intensity ratio. The 6 0.46 scaling factorindicates Amt rotates rapidly around the normal (~nn) of the liquid-crystalline bilayer in addition to its own axis, with ZM tilted by 37u or80u from~nn (Fig. 2e)16.
When a stoichiometric amount (Amt/P 5 1:4) of protein is present,the Amt spectrum at 243 K resembles the lipid-only spectrum, but thecouplings remain unchanged from 243 to 303 K across the membranephase transition (Fig. 2b), indicating sequestration of the drug fromthe lipids. The constant scaling factor (0.93) compared to pure rota-tion around ZM indicates that the first equivalent of Amt rotatesrapidly around~nn in a slightly tilted orientation (,13u) between ZM
and~nn (Fig. 2d). An isotropic peak grows at high temperature, indi-cating a small fraction (,12% at 303 K) of Amt either near 54.7u fromthe membrane normal or undergoing large-angle tumbling in thechannel. Finally, a weak 18-kHz splitting is observed at 303 K thatmatches the lipid-only coupling at this temperature. The spectrum isconsistent with a 9:1 combination of the 283 K M2-bound spectrumwithout the 18-kHz splitting and the 303 K lipid-bound spectrum,indicating that 10% of the drug partitions into the bilayer at 303 K.
To confirm that the lumen-bound drug persists under drug excessand to probe for additional binding sites, we measured the 2H spectraunder fourfold excess Amt over the tetramer (corresponding to 12%of the lipid concentration). Figure 2c shows that the spectroscopicsignatures of the lumen-bound drug persists, but the 303 K spectrumis now the 1:3 combination of the stoichiometric spectrum (Fig. 2b)and the lipid-bound spectrum (Fig. 2a). No additional bound specieswas detected. Since the fourfold symmetry of the channel requiresfour peripheral sites for each luminal site, the 9:1 intensity ratio of the303 K stoichiometric spectrum indicates that Amt has at least a40-fold greater affinity for the channel lumen than the peripheral site.
These 2H NMR and distance data indicate that M2 has a singlehigh-affinity site for amantadine, located in the channel lumencentred at Ser 31. In this site, Amt is nearly aligned with the channelaxis, but given sufficient thermal energy a small fraction of drug isalso able to undergo nearly isotropic motion, as suggested by molecu-lar dynamics simulations17,18. Excess Amt adopts a significantly tiltedorientation in the membrane, with or without the protein. The peri-pherally bound rimantadines in the solution NMR structure aretilted by 80u (ref. 3), precisely one of the two possible orientationsfound for the lipid-associated drug. Since the same peripheral site isdetected here in the TM peptide, its existence is independent of theprotein length or the membrane environment; it is the result of excessdrugs in the micelles and lipid bilayers.
To determine the sub-angstrom resolution structure of the high-affinity binding site, we quantified the M2–Amt distances using analternative REDOR experiment containing multiple 13C pulses andone 2H pulse, thus minimizing 2H pulse imperfections and yieldingREDOR intensities closely following the universal curve19 (Sup-plementary Fig. 3). The experiment yielded significantly fasterREDOR dephasing (Fig. 3) while confirming the relative dephasingof different sites in Fig. 1.
Due to the fourfold symmetry of the tetramer, we parameterizedthe REDOR simulations in terms of the distance R of each peptidecarbon from the channel axis and the distance Z of each carbon planefrom the Amt centre (Fig. 3c). We considered the twelve deuterons in
V27Cγ1L26Cδ
L26CγLipid CH2
Lipid ω
A29Cβ
S31Cα
D44Cα D44Cα
G34Cα
A29Cα
I32Cα
10.1 ms
18.5 ms 13.5 ms
10.1 ms
S0
S
ΔS × 2
S0
S
ΔS × 2
13C (p.p.m.) 13C (p.p.m.)
13C (p.p.m.) 13C (p.p.m.)
a b
c d
50 4555606570 50 4555606570
40 3545505560 40 30 20 10
S31CαI32Cα Lipid Cγ
1 Amt : 1 channel 4 Amt : 1 channel
4 Amt : 1 channel 4 Amt : 1 channel
S31S31S31V27V27V27
G34G34G34
D44D44D44
S31S31S31V27V27V27
G34G34G34
D44D44D44
Figure 1 | Drug–protein proximities from 13C{2H} REDOR spectra of Amt-bound M2 in DMPC bilayers at two Amt/P ratios. Control (S0), dephased(S, red) and difference (DS) spectra at specified mixing times are shown.a, Ser 31, Ile 32, Asp 44-labelled (SID) M2 at the stoichiometric ratio of Amt/P 5 1:4. b, SID–M2 at the fourfold excess ratio of Amt/P 5 4:4. Ser 31 Ca isdephased under both conditions but Asp 44 Ca is dephased only when Amtis in excess. c, d, Leu 26, Val 27, Ala 29, and Gly 34-labelled (LVAG) M2 atAmt/P 5 4:4. c, Gly 34 Ca region. d, Val 27 Cc1 region.
243 K
263 K
303 K
2H quadrupolar coupling (kHz)100 0 –100 100 0 –100 100 0 –100
36 kHz
123 kHz
18 kHz
58 kHz
36 kHz
116 kHz
18 kHz
36 kHz
18 kHz
58 kHz36 kHz
a b c1 Amt : 1 channel0 channel 4 Amt : 1 channel
Calculated
Sum:90% M2-10% lipid-bound
Calculated
(II)(I)
d
Sum:25% M2 (II)-75% lipid- bound (I)
n
71°
109°
In the M2 channel
ZM
e
ZM
In the lipid bilayer
n
Figure 2 | 2H NMR spectra of d15-Amt in DMPC bilayers as a function oftemperature and Amt/P. a, No M2. The calculated spectrum for 303 Kreproduces the 1:3 frequency ratio and 4:1 intensity ratio of the twosplittings. b, Amt/P 5 1:4. The sum spectrum reproduces the 303 Kspectrum by 1:9 combination of the lipid-bound 303 K spectrum andpeptide-bound 283 K spectrum (not shown). c, Amt/P 5 4:4. The sumspectrum uses a 1:3 combination of the M2-bound spectrum (II) and lipid-bound spectrum (I). d, Amt orientation in the M2 channel. e, One of the twopossible Amt orientations in the lipid bilayer.
LETTERS NATURE | Vol 463 | 4 February 2010
690Macmillan Publishers Limited. All rights reserved©2010
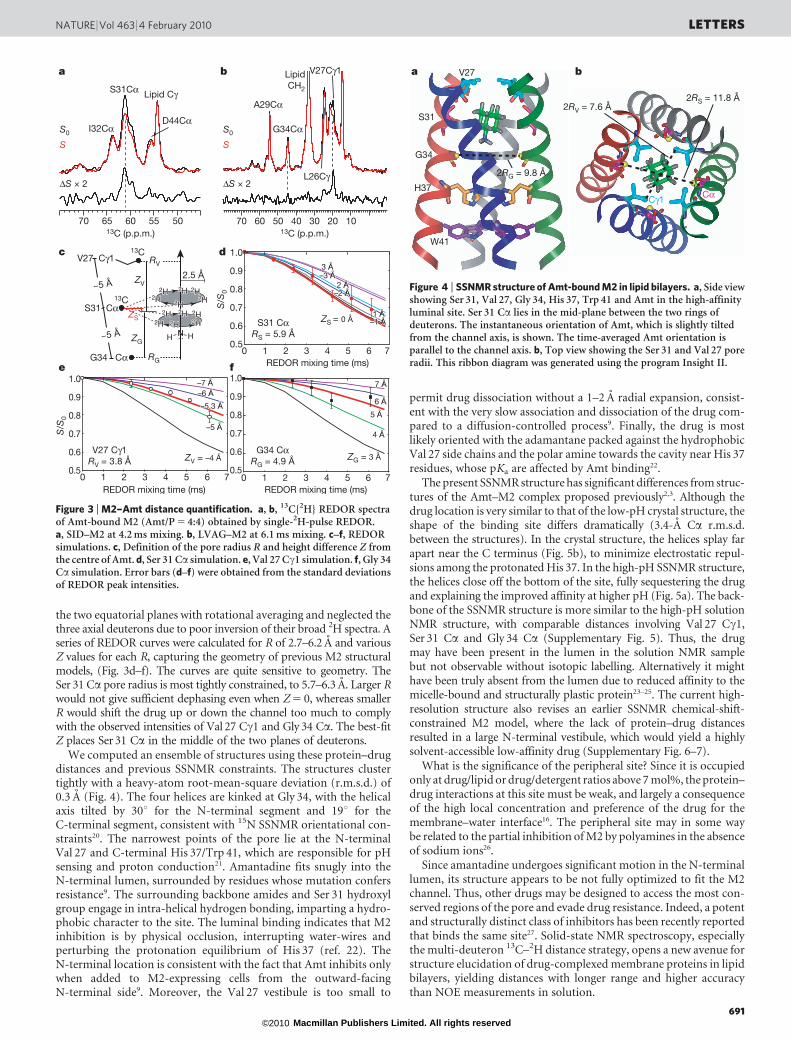
the two equatorial planes with rotational averaging and neglected thethree axial deuterons due to poor inversion of their broad 2H spectra. Aseries of REDOR curves were calculated for R of 2.7–6.2 A and variousZ values for each R, capturing the geometry of previous M2 structuralmodels, (Fig. 3d–f). The curves are quite sensitive to geometry. TheSer 31 Ca pore radius is most tightly constrained, to 5.7–6.3 A. Larger Rwould not give sufficient dephasing even when Z 5 0, whereas smallerR would shift the drug up or down the channel too much to complywith the observed intensities of Val 27 Cc1 and Gly 34 Ca. The best-fitZ places Ser 31 Ca in the middle of the two planes of deuterons.
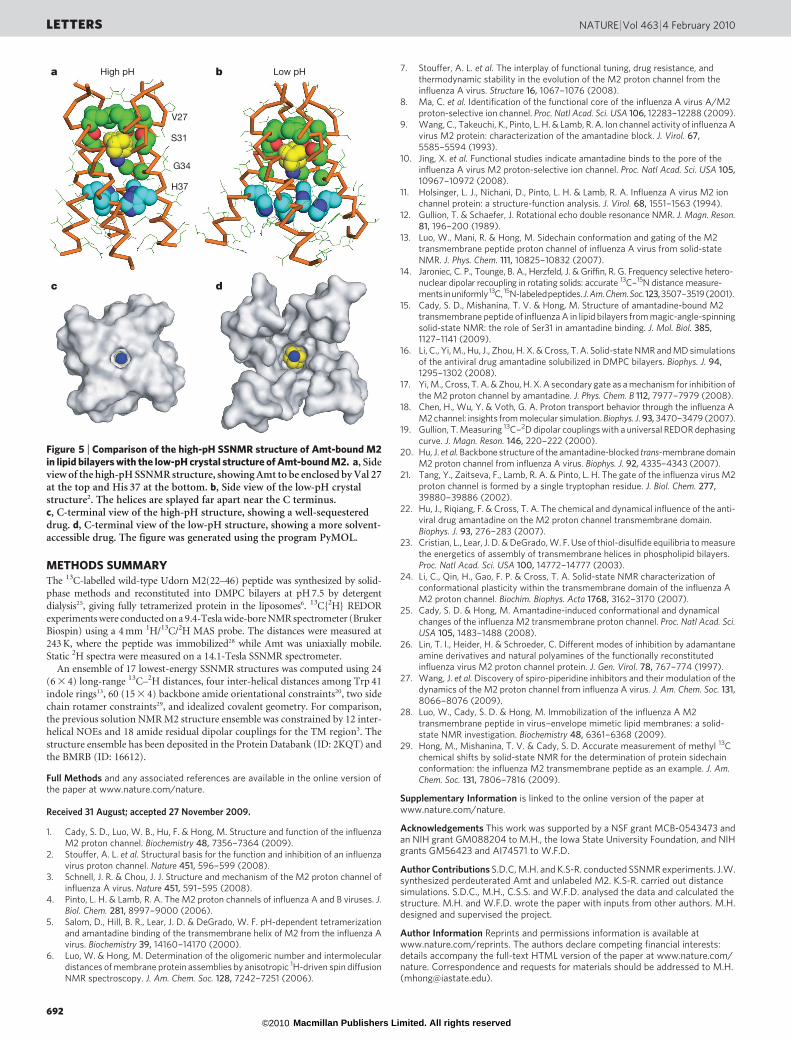
We computed an ensemble of structures using these protein–drugdistances and previous SSNMR constraints. The structures clustertightly with a heavy-atom root-mean-square deviation (r.m.s.d.) of0.3 A (Fig. 4). The four helices are kinked at Gly 34, with the helicalaxis tilted by 30u for the N-terminal segment and 19u for theC-terminal segment, consistent with 15N SSNMR orientational con-straints20. The narrowest points of the pore lie at the N-terminalVal 27 and C-terminal His 37/Trp 41, which are responsible for pHsensing and proton conduction21. Amantadine fits snugly into theN-terminal lumen, surrounded by residues whose mutation confersresistance9. The surrounding backbone amides and Ser 31 hydroxylgroup engage in intra-helical hydrogen bonding, imparting a hydro-phobic character to the site. The luminal binding indicates that M2inhibition is by physical occlusion, interrupting water-wires andperturbing the protonation equilibrium of His 37 (ref. 22). TheN-terminal location is consistent with the fact that Amt inhibits onlywhen added to M2-expressing cells from the outward-facingN-terminal side9. Moreover, the Val 27 vestibule is too small to
permit drug dissociation without a 1–2 A radial expansion, consist-ent with the very slow association and dissociation of the drug com-pared to a diffusion-controlled process9. Finally, the drug is mostlikely oriented with the adamantane packed against the hydrophobicVal 27 side chains and the polar amine towards the cavity near His 37residues, whose pKa are affected by Amt binding22.
The present SSNMR structure has significant differences from struc-tures of the Amt–M2 complex proposed previously2,3. Although thedrug location is very similar to that of the low-pH crystal structure, theshape of the binding site differs dramatically (3.4-A Ca r.m.s.d.between the structures). In the crystal structure, the helices splay farapart near the C terminus (Fig. 5b), to minimize electrostatic repul-sions among the protonated His 37. In the high-pH SSNMR structure,the helices close off the bottom of the site, fully sequestering the drugand explaining the improved affinity at higher pH (Fig. 5a). The back-bone of the SSNMR structure is more similar to the high-pH solutionNMR structure, with comparable distances involving Val 27 Cc1,Ser 31 Ca and Gly 34 Ca (Supplementary Fig. 5). Thus, the drugmay have been present in the lumen in the solution NMR samplebut not observable without isotopic labelling. Alternatively it mighthave been truly absent from the lumen due to reduced affinity to themicelle-bound and structurally plastic protein23–25. The current high-resolution structure also revises an earlier SSNMR chemical-shift-constrained M2 model, where the lack of protein–drug distancesresulted in a large N-terminal vestibule, which would yield a highlysolvent-accessible low-affinity drug (Supplementary Fig. 6–7).
What is the significance of the peripheral site? Since it is occupiedonly at drug/lipid or drug/detergent ratios above 7 mol%, the protein–drug interactions at this site must be weak, and largely a consequenceof the high local concentration and preference of the drug for themembrane–water interface16. The peripheral site may in some waybe related to the partial inhibition of M2 by polyamines in the absenceof sodium ions26.
Since amantadine undergoes significant motion in the N-terminallumen, its structure appears to be not fully optimized to fit the M2channel. Thus, other drugs may be designed to access the most con-served regions of the pore and evade drug resistance. Indeed, a potentand structurally distinct class of inhibitors has been recently reportedthat binds the same site27. Solid-state NMR spectroscopy, especiallythe multi-deuteron 13C–2H distance strategy, opens a new avenue forstructure elucidation of drug-complexed membrane proteins in lipidbilayers, yielding distances with longer range and higher accuracythan NOE measurements in solution.
55 50606570 70 60 50 40 30 20 10
S31Cα Lipid Cγ
Lipid CH2
I32CαD44Cα
V27Cγ1
L26Cγ
G34Cα
A29Cα
S0
S
ΔS × 2
S0
S
ΔS × 2
a b
2 Å2 Å2 Å
3 Å3 Å3 Å–3 Å–3 Å–3 Å
–2 Å–2 Å–2 Å
–1 Å–1 Å–1 Å1 Å1 Å1 Å
S31 CαRS = 5.9 Å
ZS = 0 Å
0 1 2 3 4 5 6 7REDOR mixing time (ms)
1.0
0.8
0.6
0.5
0.7
0.9
G34 CαRG = 4.9 Å
5 Å5 Å5 Å
4 Å4 Å4 Å
6 Å6 Å6 Å
7 Å7 Å7 Å
ZG = 3 Å
REDOR mixing time (ms)
1.0
0.8
0.6
0.5
0.7
0.9
0 1 2 3 4 5 6 7
2H2H2H
2H2H2H2H2H2H
2H2H2H 2H2H2H2H2H2H13C
13C
2H2H2H
2H2H2H2H2H2H
2H2H2H 2H2H2H2H2H2H
RV
RG
2.5 Å~5 Å
ZS
ZG
ZV
S31 Cα
V27 Cγ1
~5 Å
G34 Cα
NNH H:
c d
fe
V27 Cγ1RV = 3.8 Å ZV = –4 Å
REDOR mixing time (ms)
1.0
0.8
0.6
0.5
0.7
0.9
0 1 2 3 4 5 6 7
–5 Å–5 Å–5 Å
–6 Å–6 Å–6 Å–7 Å–7 Å–7 Å
–5.3 Å–5.3 Å–5.3 Å
13C (p.p.m.) 13C (p.p.m.)S
/S0
S/S
0
Figure 3 | M2–Amt distance quantification. a, b, 13C{2H} REDOR spectraof Amt-bound M2 (Amt/P 5 4:4) obtained by single-2H-pulse REDOR.a, SID–M2 at 4.2 ms mixing. b, LVAG–M2 at 6.1 ms mixing. c–f, REDORsimulations. c, Definition of the pore radius R and height difference Z fromthe centre of Amt. d, Ser 31 Ca simulation. e, Val 27 Cc1 simulation. f, Gly 34Ca simulation. Error bars (d–f) were obtained from the standard deviationsof REDOR peak intensities.
V27
S31
G34
W41
H37
2RG = 9.8 Å
CαCγ1
2RV = 7.6 Å2RS = 11.8 Å
a b
Figure 4 | SSNMR structure of Amt-bound M2 in lipid bilayers. a, Side viewshowing Ser 31, Val 27, Gly 34, His 37, Trp 41 and Amt in the high-affinityluminal site. Ser 31 Ca lies in the mid-plane between the two rings ofdeuterons. The instantaneous orientation of Amt, which is slightly tiltedfrom the channel axis, is shown. The time-averaged Amt orientation isparallel to the channel axis. b, Top view showing the Ser 31 and Val 27 poreradii. This ribbon diagram was generated using the program Insight II.
NATURE | Vol 463 | 4 February 2010 LETTERS
691Macmillan Publishers Limited. All rights reserved©2010
METHODS SUMMARYThe 13C-labelled wild-type Udorn M2(22–46) peptide was synthesized by solid-
phase methods and reconstituted into DMPC bilayers at pH 7.5 by detergent
dialysis25, giving fully tetramerized protein in the liposomes6. 13C{2H} REDOR
experiments were conducted on a 9.4-Tesla wide-bore NMR spectrometer (BrukerBiospin) using a 4 mm 1H/13C/2H MAS probe. The distances were measured at
243 K, where the peptide was immobilized28 while Amt was uniaxially mobile.
Static 2H spectra were measured on a 14.1-Tesla SSNMR spectrometer.
An ensemble of 17 lowest-energy SSNMR structures was computed using 24
(6 3 4) long-range 13C–2H distances, four inter-helical distances among Trp 41
indole rings13, 60 (15 3 4) backbone amide orientational constraints20, two side
chain rotamer constraints29, and idealized covalent geometry. For comparison,
the previous solution NMR M2 structure ensemble was constrained by 12 inter-
helical NOEs and 18 amide residual dipolar couplings for the TM region3. The
structure ensemble has been deposited in the Protein Databank (ID: 2KQT) and
the BMRB (ID: 16612).
Full Methods and any associated references are available in the online version ofthe paper at www.nature.com/nature.
Received 31 August; accepted 27 November 2009.
1. Cady, S. D., Luo, W. B., Hu, F. & Hong, M. Structure and function of the influenzaM2 proton channel. Biochemistry 48, 7356–7364 (2009).
2. Stouffer, A. L. et al. Structural basis for the function and inhibition of an influenzavirus proton channel. Nature 451, 596–599 (2008).
3. Schnell, J. R. & Chou, J. J. Structure and mechanism of the M2 proton channel ofinfluenza A virus. Nature 451, 591–595 (2008).
4. Pinto, L. H. & Lamb, R. A. The M2 proton channels of influenza A and B viruses. J.Biol. Chem. 281, 8997–9000 (2006).
5. Salom, D., Hill, B. R., Lear, J. D. & DeGrado, W. F. pH-dependent tetramerizationand amantadine binding of the transmembrane helix of M2 from the influenza Avirus. Biochemistry 39, 14160–14170 (2000).
6. Luo, W. & Hong, M. Determination of the oligomeric number and intermoleculardistances of membrane protein assemblies by anisotropic 1H-driven spin diffusionNMR spectroscopy. J. Am. Chem. Soc. 128, 7242–7251 (2006).
7. Stouffer, A. L. et al. The interplay of functional tuning, drug resistance, andthermodynamic stability in the evolution of the M2 proton channel from theinfluenza A virus. Structure 16, 1067–1076 (2008).
8. Ma, C. et al. Identification of the functional core of the influenza A virus A/M2proton-selective ion channel. Proc. Natl Acad. Sci. USA 106, 12283–12288 (2009).
9. Wang, C., Takeuchi, K., Pinto, L. H. & Lamb, R. A. Ion channel activity of influenza Avirus M2 protein: characterization of the amantadine block. J. Virol. 67,5585–5594 (1993).
10. Jing, X. et al. Functional studies indicate amantadine binds to the pore of theinfluenza A virus M2 proton-selective ion channel. Proc. Natl Acad. Sci. USA 105,10967–10972 (2008).
11. Holsinger, L. J., Nichani, D., Pinto, L. H. & Lamb, R. A. Influenza A virus M2 ionchannel protein: a structure-function analysis. J. Virol. 68, 1551–1563 (1994).
12. Gullion, T. & Schaefer, J. Rotational echo double resonance NMR. J. Magn. Reson.81, 196–200 (1989).
13. Luo, W., Mani, R. & Hong, M. Sidechain conformation and gating of the M2transmembrane peptide proton channel of influenza A virus from solid-stateNMR. J. Phys. Chem. 111, 10825–10832 (2007).
14. Jaroniec, C. P., Tounge, B. A., Herzfeld, J. & Griffin, R. G. Frequency selective hetero-nuclear dipolar recoupling in rotating solids: accurate 13C–15N distance measure-ments inuniformly13C, 15N-labeledpeptides.J.Am.Chem.Soc.123,3507–3519(2001).
15. Cady, S. D., Mishanina, T. V. & Hong, M. Structure of amantadine-bound M2transmembrane peptide of influenza A in lipid bilayers from magic-angle-spinningsolid-state NMR: the role of Ser31 in amantadine binding. J. Mol. Biol. 385,1127–1141 (2009).
16. Li, C., Yi, M., Hu, J., Zhou, H. X. & Cross, T. A. Solid-state NMR and MD simulationsof the antiviral drug amantadine solubilized in DMPC bilayers. Biophys. J. 94,1295–1302 (2008).
17. Yi, M., Cross, T. A. & Zhou, H. X. A secondary gate as a mechanism for inhibition ofthe M2 proton channel by amantadine. J. Phys. Chem. B 112, 7977–7979 (2008).
18. Chen, H., Wu, Y. & Voth, G. A. Proton transport behavior through the influenza AM2 channel: insights from molecular simulation. Biophys. J. 93, 3470–3479 (2007).
19. Gullion, T. Measuring 13C–2D dipolar couplings with a universal REDOR dephasingcurve. J. Magn. Reson. 146, 220–222 (2000).
20. Hu, J. et al. Backbone structure of the amantadine-blocked trans-membrane domainM2 proton channel from influenza A virus. Biophys. J. 92, 4335–4343 (2007).
21. Tang, Y., Zaitseva, F., Lamb, R. A. & Pinto, L. H. The gate of the influenza virus M2proton channel is formed by a single tryptophan residue. J. Biol. Chem. 277,39880–39886 (2002).
22. Hu, J., Riqiang, F. & Cross, T. A. The chemical and dynamical influence of the anti-viral drug amantadine on the M2 proton channel transmembrane domain.Biophys. J. 93, 276–283 (2007).
23. Cristian, L., Lear, J. D. & DeGrado, W. F. Use of thiol-disulfide equilibria to measurethe energetics of assembly of transmembrane helices in phospholipid bilayers.Proc. Natl Acad. Sci. USA 100, 14772–14777 (2003).
24. Li, C., Qin, H., Gao, F. P. & Cross, T. A. Solid-state NMR characterization ofconformational plasticity within the transmembrane domain of the influenza AM2 proton channel. Biochim. Biophys. Acta 1768, 3162–3170 (2007).
25. Cady, S. D. & Hong, M. Amantadine-induced conformational and dynamicalchanges of the influenza M2 transmembrane proton channel. Proc. Natl Acad. Sci.USA 105, 1483–1488 (2008).
26. Lin, T. I., Heider, H. & Schroeder, C. Different modes of inhibition by adamantaneamine derivatives and natural polyamines of the functionally reconstitutedinfluenza virus M2 proton channel protein. J. Gen. Virol. 78, 767–774 (1997).
27. Wang, J. et al. Discovery of spiro-piperidine inhibitors and their modulation of thedynamics of the M2 proton channel from influenza A virus. J. Am. Chem. Soc. 131,8066–8076 (2009).
28. Luo, W., Cady, S. D. & Hong, M. Immobilization of the influenza A M2transmembrane peptide in virus–envelope mimetic lipid membranes: a solid-state NMR investigation. Biochemistry 48, 6361–6368 (2009).
29. Hong, M., Mishanina, T. V. & Cady, S. D. Accurate measurement of methyl 13Cchemical shifts by solid-state NMR for the determination of protein sidechainconformation: the influenza M2 transmembrane peptide as an example. J. Am.Chem. Soc. 131, 7806–7816 (2009).
Supplementary Information is linked to the online version of the paper atwww.nature.com/nature.
Acknowledgements This work was supported by a NSF grant MCB-0543473 andan NIH grant GM088204 to M.H., the Iowa State University Foundation, and NIHgrants GM56423 and AI74571 to W.F.D.
Author Contributions S.D.C, M.H. and K.S-R. conducted SSNMR experiments. J.W.synthesized perdeuterated Amt and unlabeled M2. K.S-R. carried out distancesimulations. S.D.C., M.H., C.S.S. and W.F.D. analysed the data and calculated thestructure. M.H. and W.F.D. wrote the paper with inputs from other authors. M.H.designed and supervised the project.
Author Information Reprints and permissions information is available atwww.nature.com/reprints. The authors declare competing financial interests:details accompany the full-text HTML version of the paper at www.nature.com/nature. Correspondence and requests for materials should be addressed to M.H.([email protected]).
a b
c d
High pH Low pH
V27
S31
G34
H37
Figure 5 | Comparison of the high-pH SSNMR structure of Amt-bound M2in lipid bilayers with the low-pH crystal structure of Amt-bound M2. a, Sideview of the high-pH SSNMR structure, showing Amt to be enclosed by Val 27at the top and His 37 at the bottom. b, Side view of the low-pH crystalstructure2. The helices are splayed far apart near the C terminus.c, C-terminal view of the high-pH structure, showing a well-sequestereddrug. d, C-terminal view of the low-pH structure, showing a more solvent-accessible drug. The figure was generated using the program PyMOL.
LETTERS NATURE | Vol 463 | 4 February 2010
692Macmillan Publishers Limited. All rights reserved©2010

METHODSSample preparation. The wild-type Udorn M2(22–46) sequence
SSDPLVVAASIIGILHLILWILDRL was synthesized with 13C-, 15N-labelled amino
acids at Leu 26, Val 27, Ala 29 and Gly 34 in one sample (LVAG), and Ser 31, Ile 32
and Asp 44 in another sample (SID). The peptide was reconstituted into DMPC
vesicles by detergent dialysis using octyl-b-D-glucopyranoside. The peptide/lipid
molar ratios were 1:8 for all 2H NMR experiments and 1:8 or 1:15 for the REDOR
experiments. A phosphate buffer (pH 7.5) was used for lipid vesicle preparation
and throughout detergent dialysis. The dialyzed proteoliposome solutions were
centrifuged at 150,000g to obtain ,40% hydrated membrane pellets. Amantadine
was directly titrated into the membrane pellet to the desired amount.
Solid-state NMR spectroscopy. A triple-resonance 1H/13C/2H magic-angle-
spinning (MAS) probe was used for the 13C–2H REDOR experiments and a1H/13C/15N probe was used for two dimensional correlation experiments for
resonance assignment. The 2H pulse length in the REDOR experiments was
6.2ms, and 13C and 15N pulse lengths were 5–6ms.13C–2H REDOR experiments were carried out at MAS frequencies of 4250 Hz
or 4750 Hz. A REDOR pulse sequence containing a single selective 13C pulse andmultiple composite 90u180u90u 2H pulses was used to obtain clear qualitative
dephasing at long mixing times, since the selective 13C pulse suppressed the13C–13C scalar coupling and gave rise to long 13C T2 relaxation times. However,
the use of multiple 2H pulses is known to slow down dipolar dephasing by the
cumulative effects of imperfect inversion of the broad 2H quadrupolar spectra30.
Thus, a second version of REDOR experiment consisting of multiple 13C non-
selective pulses and a single composite 2H pulse was carried out to obtain quant-
itative dephasing values at shorter mixing times. Distance quantification was
possible because the multiple heteronuclear couplings commute and the uniaxial
rotation of amantadine removes the effects of 2H–2H homonuclear couplings.
Perdeuteration speeded up 13C–2H REDOR dephasing by ,ffiffiffiffiffi
15p
-fold compared
to a single 13C–2H pair. The inversion efficiency of the deuterons in the single-2H-
pulse REDOR experiment was 70% based on measurements of the model com-
pound 13Ca, 2Hb-labelled alanine (Supplementary Fig. 3).
REDOR distance simulations. Using a motionally averaged model, we calcu-
lated REDOR curves for various published M2 models (Supplementary Figs
4–6), with pore radii R of 2.7–6.2 A. For each R, several REDOR curves with
different Z values were calculated. The best-fit Z values for a specific R werecompared with the carbon plane separations in the structural model. Plane
separations that are inconsistent with the differences in Z values exclude the
structural model. The Ser 31 Ca pore radius is constrained by the M2-drug
distances to be 5.7–6.3 A. Once amantadine is confined within 1 A vertical dis-
tance of the Ser 31 Ca plane, the Val 27 Cc1 and Gly 34 Ca pore radii are jointly
constrained by the Val 27 Cc1–Gly 34 Ca plane separation, which is 10.5 6 1.0 A
in all M2 structures so far. We found that neither RV nor RG can exceed 6.0 A, as it
would lead to overly small plane separations.
In the final refined SSNMR structure, Val 27 Cc1 is fit by RV 5 3.8 A with
ZV 5 25.3 A, indicating that the Val 27 Cc1 plane is 5.3 A above the centre of
amantadine. Gly 34 Ca is fit by RG 5 4.9 A with a distance of 5.0 A below the
amantadine centre.
Structure calculation and refinement. The process of generating a helix that is
consistent with the protein-drug distances, backbone N–H orientational con-
straints, and side chain rotameric conformations, was carried out in two phases.
In the first phase, we constructed an ideal helix with the sequence
SSDPLVVAASIIGILHLILWILDRL whose w/y angles were set to (265u, 242u).
The helix was then split at the Gly 34–Ile 35 bond and reconnected using a rigid-
body optimization procedure that maximized agreement with the SSNMR15N–1H dipolar couplings20 and the internal geometry at that bond. Rotamer
preferences were taken from the high-resolution X-ray structure of M2 (PDB
ID: 3BKD).
In the second phase we refined our model to maximize agreement with the13C–2H REDOR distances (Supplementary Table 2) and the backbone 15N–1H
dipolar couplings (Supplementary Table 3). To do this, we combined an inverse
kinematics algorithm with a Monte Carlo/simulated annealing (MC/SA) mini-
mization procedure that would gradually relax the backbone of the helix subject
to REDOR distance constraints and the N–H dipolar couplings. Rotamer
preferences were also changed to maximize agreement with the x1 angle con-
straints (Supplementary Table 4). The MC/SA minimization procedure was used
to generate an ensemble with a maximum heavy-atom r.m.s.d. of 0.3 A between
any two models. Because the REDOR distances provided excellent constraints
between the drug and M2, we positioned the amantadine molecule near Ser 31
without the need for further minimization. Figure 5 was created using the
PyMOL Molecular Graphics System.
30. Sack, I., Goldbourt, A., Vega, S. & Buntkowsky, G. Deuterium REDOR: principlesand applications for distance measurements. J. Magn. Reson. 138, 54–65 (1999).
doi:10.1038/nature08722
Macmillan Publishers Limited. All rights reserved©2010
Contents
(A) Chemical shift assignment of amantadine-bound M2 in DMPC bilayers
(B) Additional 13C-2H REDOR spectra, REDOR simulation protocol and model compound result
(C) REDOR simulations for various M2 structural models
(D) Computation procedure for the structure ensemble of amantadine-bound M2 in lipid bilayers
(E) Synthesis of perdeuterated amantadine
(F) Complete set of 2H spectra of perdeuterated amantadine in lipid bilayers
SUPPLEMENTARY INFORMATIONdoi: 10.1038/nature08722
www.nature.com/nature 1
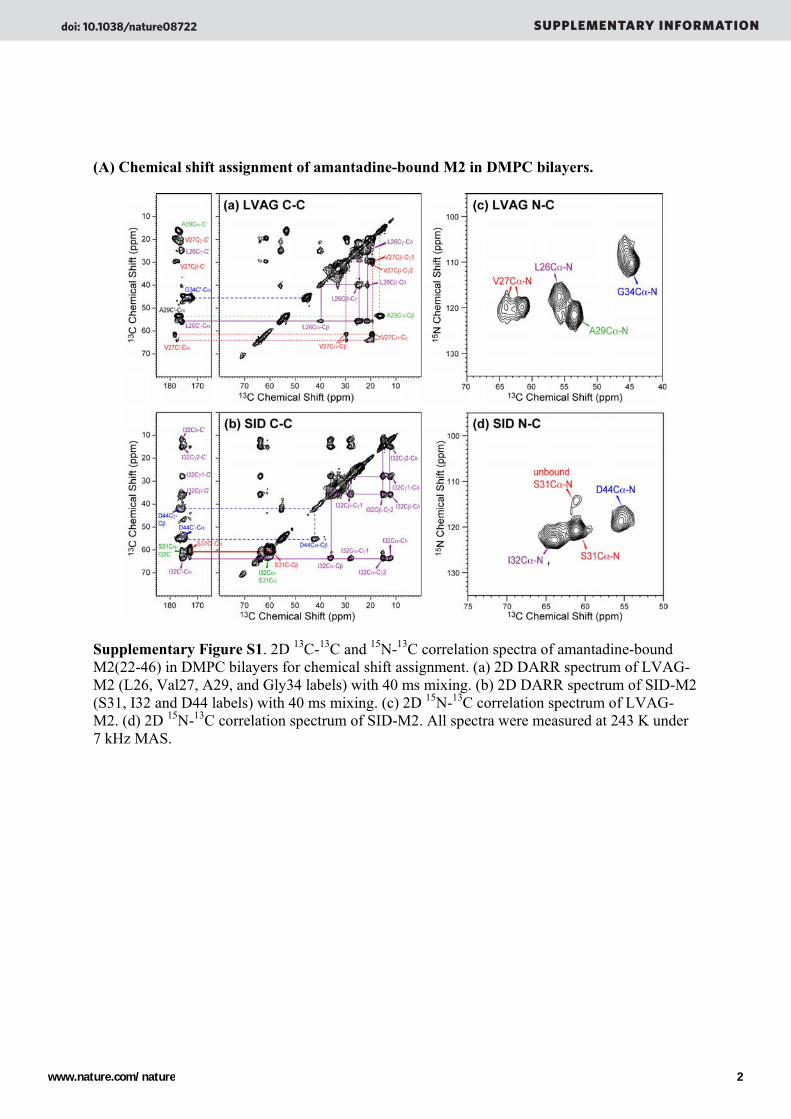
(A) Chemical shift assignment of amantadine-bound M2 in DMPC bilayers.
Supplementary Figure S1. 2D 13C-13C and 15N-13C correlation spectra of amantadine-bound M2(22-46) in DMPC bilayers for chemical shift assignment. (a) 2D DARR spectrum of LVAG-M2 (L26, Val27, A29, and Gly34 labels) with 40 ms mixing. (b) 2D DARR spectrum of SID-M2 (S31, I32 and D44 labels) with 40 ms mixing. (c) 2D 15N-13C correlation spectrum of LVAG-M2. (d) 2D 15N-13C correlation spectrum of SID-M2. All spectra were measured at 243 K under 7 kHz MAS.
doi: 10.1038/nature08722 SUPPLEMENTARY INFORMATION
www.nature.com/nature 2
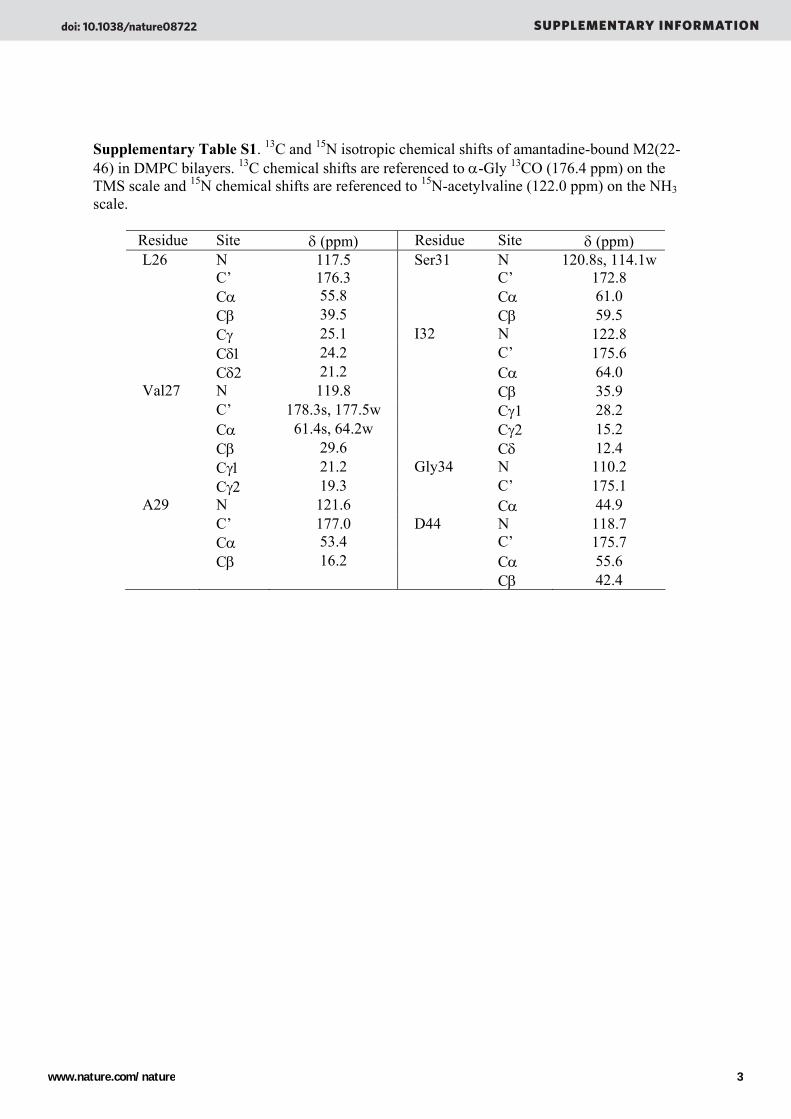
Supplementary Table S1. 13C and 15N isotropic chemical shifts of amantadine-bound M2(22-46) in DMPC bilayers. 13C chemical shifts are referenced to α-Gly 13CO (176.4 ppm) on the TMS scale and 15N chemical shifts are referenced to 15N-acetylvaline (122.0 ppm) on the NH3 scale.
Residue Site δ (ppm) Residue Site δ (ppm) L26 N 117.5 Ser31 N 120.8s, 114.1w C’ 176.3 C’ 172.8 Cα 55.8 Cα 61.0 Cβ 39.5 Cβ 59.5 Cγ 25.1 I32 N 122.8 Cδ1 24.2 C’ 175.6 Cδ2 21.2 Cα 64.0 Val27 N 119.8 Cβ 35.9 C’ 178.3s, 177.5w Cγ1 28.2 Cα 61.4s, 64.2w Cγ2 15.2 Cβ 29.6 Cδ 12.4 Cγ1 21.2 Gly34 N 110.2 Cγ2 19.3 C’ 175.1 A29 N 121.6 Cα 44.9 C’ 177.0 D44 N 118.7 Cα 53.4 C’ 175.7 Cβ 16.2 Cα 55.6 Cβ 42.4
doi: 10.1038/nature08722 SUPPLEMENTARY INFORMATION
www.nature.com/nature 3
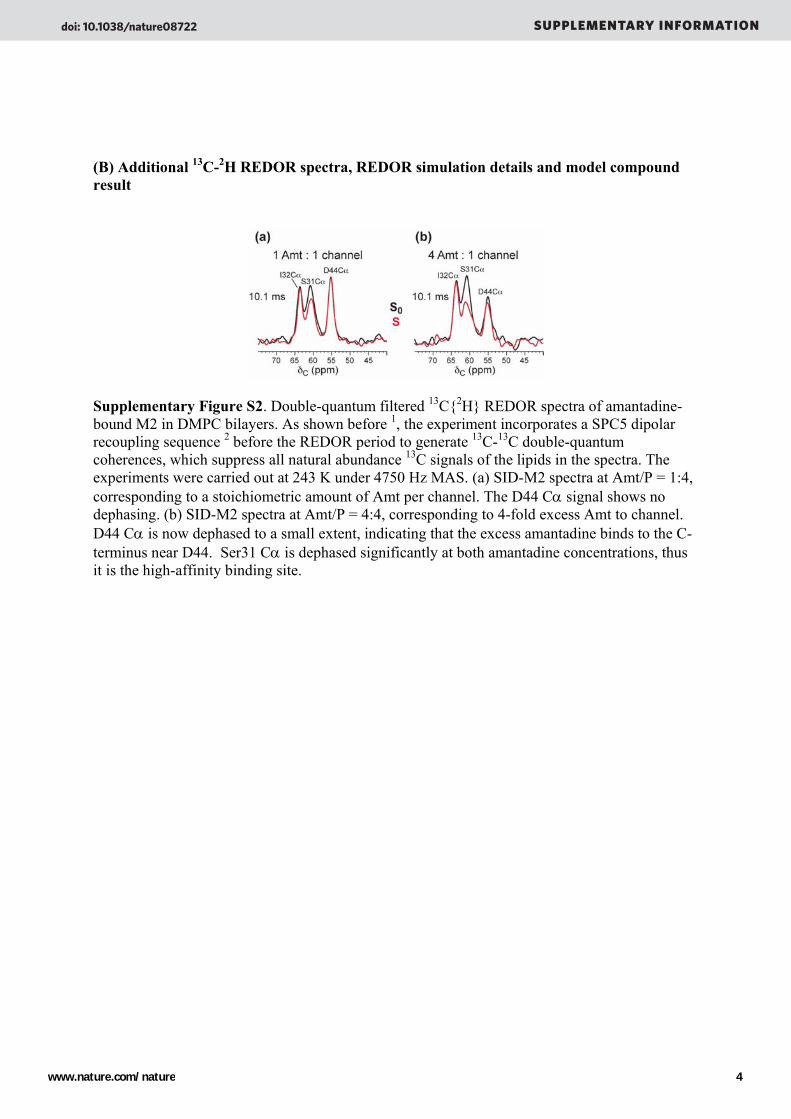
(B) Additional 13C-2H REDOR spectra, REDOR simulation details and model compound result
Supplementary Figure S2. Double-quantum filtered 13C{2H} REDOR spectra of amantadine-bound M2 in DMPC bilayers. As shown before 1, the experiment incorporates a SPC5 dipolar recoupling sequence 2 before the REDOR period to generate 13C-13C double-quantum coherences, which suppress all natural abundance 13C signals of the lipids in the spectra. The experiments were carried out at 243 K under 4750 Hz MAS. (a) SID-M2 spectra at Amt/P = 1:4, corresponding to a stoichiometric amount of Amt per channel. The D44 Cα signal shows no dephasing. (b) SID-M2 spectra at Amt/P = 4:4, corresponding to 4-fold excess Amt to channel. D44 Cα is now dephased to a small extent, indicating that the excess amantadine binds to the C-terminus near D44. Ser31 Cα is dephased significantly at both amantadine concentrations, thus it is the high-affinity binding site.
doi: 10.1038/nature08722 SUPPLEMENTARY INFORMATION
www.nature.com/nature 4
13C-2H REDOR simulations. The dephasing of a 13C spin in the peptide by the recoupled dipolar fields of 12 equatorial deuterons on the amantadine molecule was simulated in detail by considering the uniaxial rotation of amantadine. The coupling of 13C to 15 deuterons increases the second moment (i.e. the sum of the squares) of the 13C-2H dipolar couplings 15-fold compared to a single 13C-2H spin pair, thus speeding up the dephasing by a factor of 15 ≈ 3.9 .
The three axial deuterons have a three times wider spectrum, which makes their inversion significantly incomplete under the 2H 90˚ pulse length of 6.2 μs. Thus, they were neglected in the simulations.
The inversion efficiency of the 12 deuterons was about 70%, as determined by
measurements on Ala-CD3 (Supplementary Figure S3), which has a very similar motionally narrowed 2H spectrum to amantadine.
The geometry of the 12 equatorial amantadine deuterons is as follows. Six deuterons are
located on one ring of 2.20 Å radius centered on the C-N bond axis. The other six deuterons lie on two rings of 2.48 Å radius that are so close (separated by only 0.37 Å) that they were combined into one ring. The planes of the two rings are separated by 2.10 Å along the C-N axis.
The orientation-dependent 13C-2H REDOR frequency (ωCD) under MAS is
ωCD β,γ,r( )= δCD r( )⋅ 2π
⋅ sin2βsin γ , (1)
where β is the polar angle between the C-D vector and the rotor axis and γ is the azimuthal angle of the internuclear vector around the rotor axis. The coupling constant δCD depends on the 13C-2H distance r according to:
δCD r( ) = −2⋅μ04π
hγCγD
r3 = −2π⋅ 9.3 kHz 1
r 1 Å( )3 (2)
The ωCD values were calculated for β, γ and r values that correspond to various locations of the deuterons on each ring, which are sampled at 10˚ steps around the channel axis. Since each ring undergoes uniaxial rotation, the REDOR frequencies were then averaged to give ω CD.
For 13C coupled to an I = 1 spin of a deuteron, the 2I + 1 = 3 allowed values of the z-component of the deuterium spin angular momentum result in three equally spaced spectral lines of equal intensity, at 0 and ± ω CD, for each orientation of the C-D vector. Thus, the single spin-pair 13C-2H REDOR time signal after N rotor periods, tr , for one channel orientation is: S S0( )single spin pair = 1+ 2cos ω CDNtr( )[ ] 3. (3)
For M deuterons, the REDOR time signal is the product of the single-spin-pair signals,
doi: 10.1038/nature08722 SUPPLEMENTARY INFORMATION
www.nature.com/nature 5
S S0( )M spin pairs =1
3M Πm=1M 1+ 2cos ω CD,mNtr( )[ ]. (4)
Due to the fast rotation of the amantadine molecule around the C-N axis, all six deuterons on each ring have the same motionally averaged 13C-2H dipolar coupling. Thus, the motionally averaged REDOR frequencies for each ring, ω CD
A and ω CDB , are multiplied to give the total
REDOR signal experienced by each peptide 13C:
S S0( )12 amantadine deuterons =1
312 1+ 2cos ω CDA Ntr( )⎡
⎣ ⎢ ⎤ ⎦ ⎥ 6⋅ 1+ 2cos ω CD
B Ntr( )⎡ ⎣ ⎢
⎤ ⎦ ⎥ 6
(5)
This REDOR signal is finally powder averaged for all channel orientations relative to the rotor axis. Powder averaging was performed in a molecule- (peptide-) fixed frame, by sweeping the rotor-axis orientation over the surface of a unit sphere and by rotation around the rotor axis, each in 10˚ steps.
doi: 10.1038/nature08722 SUPPLEMENTARY INFORMATION
www.nature.com/nature 6
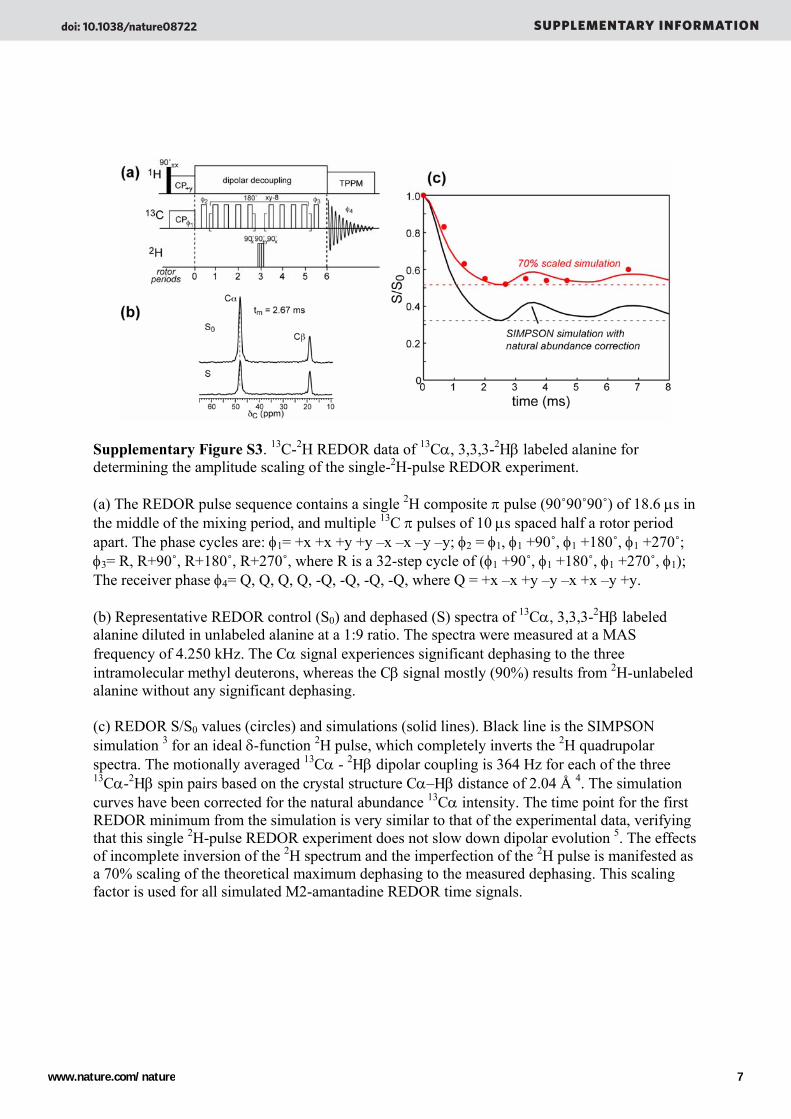
Supplementary Figure S3. 13C-2H REDOR data of 13Cα, 3,3,3-2Hβ labeled alanine for determining the amplitude scaling of the single-2H-pulse REDOR experiment. (a) The REDOR pulse sequence contains a single 2H composite π pulse (90˚90˚90˚) of 18.6 μs in the middle of the mixing period, and multiple 13C π pulses of 10 μs spaced half a rotor period apart. The phase cycles are: φ1= +x +x +y +y –x –x –y –y; φ2 = φ1, φ1 +90˚, φ1 +180˚, φ1 +270˚; φ3= R, R+90˚, R+180˚, R+270˚, where R is a 32-step cycle of (φ1 +90˚, φ1 +180˚, φ1 +270˚, φ1); The receiver phase φ4= Q, Q, Q, Q, -Q, -Q, -Q, -Q, where Q = +x –x +y –y –x +x –y +y. (b) Representative REDOR control (S0) and dephased (S) spectra of 13Cα, 3,3,3-2Hβ labeled alanine diluted in unlabeled alanine at a 1:9 ratio. The spectra were measured at a MAS frequency of 4.250 kHz. The Cα signal experiences significant dephasing to the three intramolecular methyl deuterons, whereas the Cβ signal mostly (90%) results from 2H-unlabeled alanine without any significant dephasing. (c) REDOR S/S0 values (circles) and simulations (solid lines). Black line is the SIMPSON simulation 3 for an ideal δ-function 2H pulse, which completely inverts the 2H quadrupolar spectra. The motionally averaged 13Cα - 2Hβ dipolar coupling is 364 Hz for each of the three 13Cα-2Hβ spin pairs based on the crystal structure Cα–Hβ distance of 2.04 Å 4. The simulation curves have been corrected for the natural abundance 13Cα intensity. The time point for the first REDOR minimum from the simulation is very similar to that of the experimental data, verifying that this single 2H-pulse REDOR experiment does not slow down dipolar evolution 5. The effects of incomplete inversion of the 2H spectrum and the imperfection of the 2H pulse is manifested as a 70% scaling of the theoretical maximum dephasing to the measured dephasing. This scaling factor is used for all simulated M2-amantadine REDOR time signals.
doi: 10.1038/nature08722 SUPPLEMENTARY INFORMATION
www.nature.com/nature 7

(C) REDOR simulations for various M2 structural models
Supplementary Figure S4. Simulations of Val27 Cγ1, Ser31 Cα and Gly34 Cα 13C{2H} REDOR data using the pore sizes of the low-pH crystal structure of amantadine-bound M2(22-46) (PDB code: 3C9J) 6. Val27 Cγ1 has a best-fit ZV of –6 Å while the Gly34 Cα best-fit ZG is 3.5 Å. Ser31 Cα has a best-fit Z of 2 Å or –2 Å. Either ZS value agrees only marginally with the Val27 Cγ1 – Ser31 Cα plane separation (4.8 Å) and the Ser31 Cα - Gly34 Cα plane separation (4.6 Å) in the model. Thus, the low-pH structure of Amt-bound M2 in detergent is different, as expected, from the high-pH SSNMR structure of bound M2 in lipid bilayers.
doi: 10.1038/nature08722 SUPPLEMENTARY INFORMATION
www.nature.com/nature 8
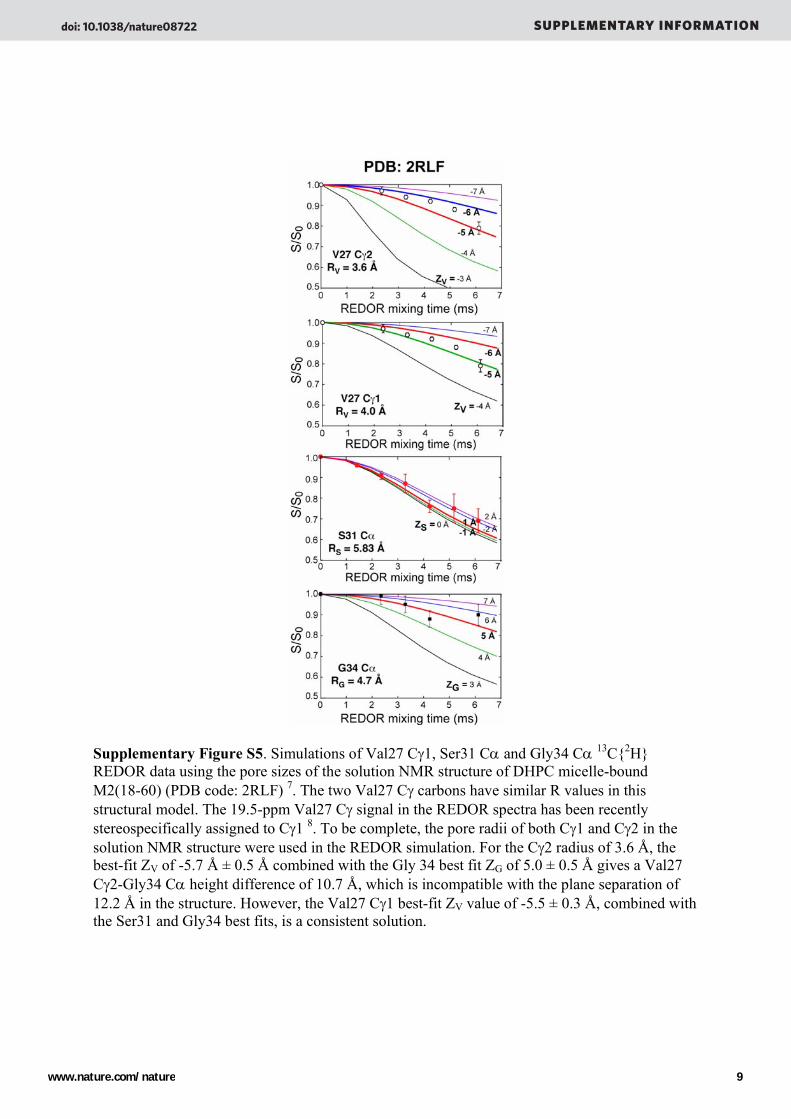
Supplementary Figure S5. Simulations of Val27 Cγ1, Ser31 Cα and Gly34 Cα 13C{2H} REDOR data using the pore sizes of the solution NMR structure of DHPC micelle-bound M2(18-60) (PDB code: 2RLF) 7. The two Val27 Cγ carbons have similar R values in this structural model. The 19.5-ppm Val27 Cγ signal in the REDOR spectra has been recently stereospecifically assigned to Cγ1 8. To be complete, the pore radii of both Cγ1 and Cγ2 in the solution NMR structure were used in the REDOR simulation. For the Cγ2 radius of 3.6 Å, the best-fit ZV of -5.7 Å ± 0.5 Å combined with the Gly 34 best fit ZG of 5.0 ± 0.5 Å gives a Val27 Cγ2-Gly34 Cα height difference of 10.7 Å, which is incompatible with the plane separation of 12.2 Å in the structure. However, the Val27 Cγ1 best-fit ZV value of -5.5 ± 0.3 Å, combined with the Ser31 and Gly34 best fits, is a consistent solution.
doi: 10.1038/nature08722 SUPPLEMENTARY INFORMATION
www.nature.com/nature 9
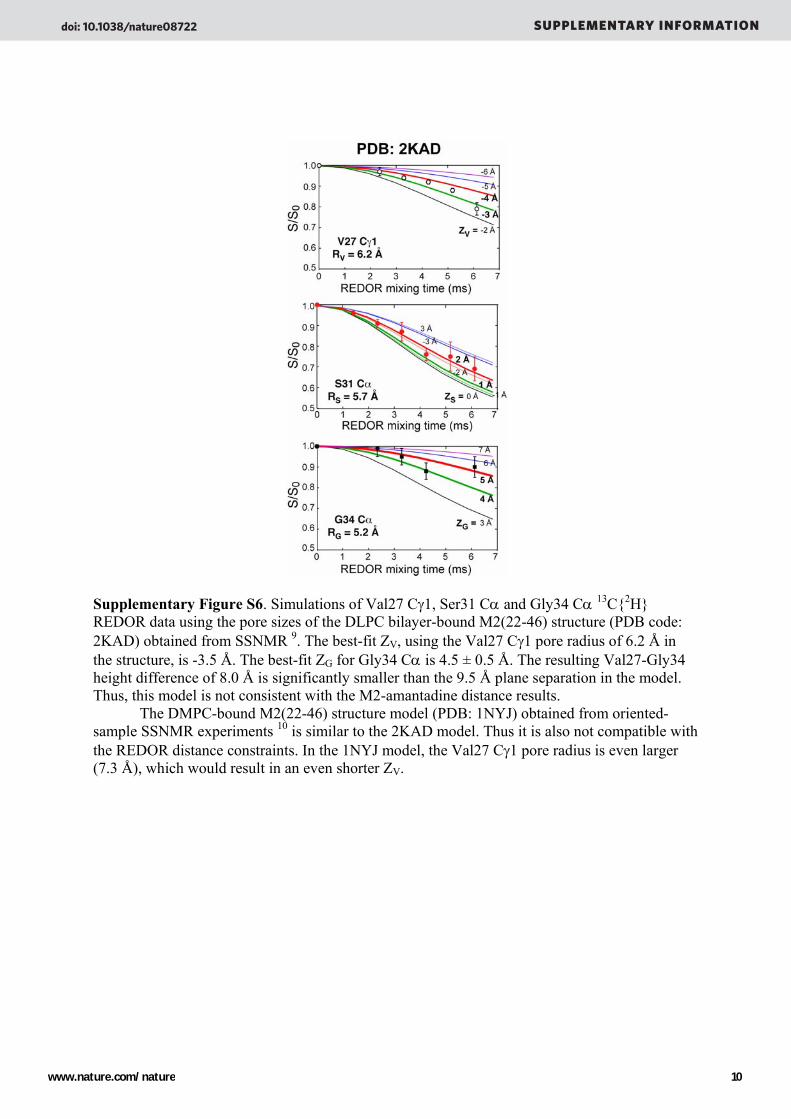
Supplementary Figure S6. Simulations of Val27 Cγ1, Ser31 Cα and Gly34 Cα 13C{2H} REDOR data using the pore sizes of the DLPC bilayer-bound M2(22-46) structure (PDB code: 2KAD) obtained from SSNMR 9. The best-fit ZV, using the Val27 Cγ1 pore radius of 6.2 Å in the structure, is -3.5 Å. The best-fit ZG for Gly34 Cα is 4.5 ± 0.5 Å. The resulting Val27-Gly34 height difference of 8.0 Å is significantly smaller than the 9.5 Å plane separation in the model. Thus, this model is not consistent with the M2-amantadine distance results.
The DMPC-bound M2(22-46) structure model (PDB: 1NYJ) obtained from oriented-sample SSNMR experiments 10 is similar to the 2KAD model. Thus it is also not compatible with the REDOR distance constraints. In the 1NYJ model, the Val27 Cγ1 pore radius is even larger (7.3 Å), which would result in an even shorter ZV.
doi: 10.1038/nature08722 SUPPLEMENTARY INFORMATION
www.nature.com/nature 10
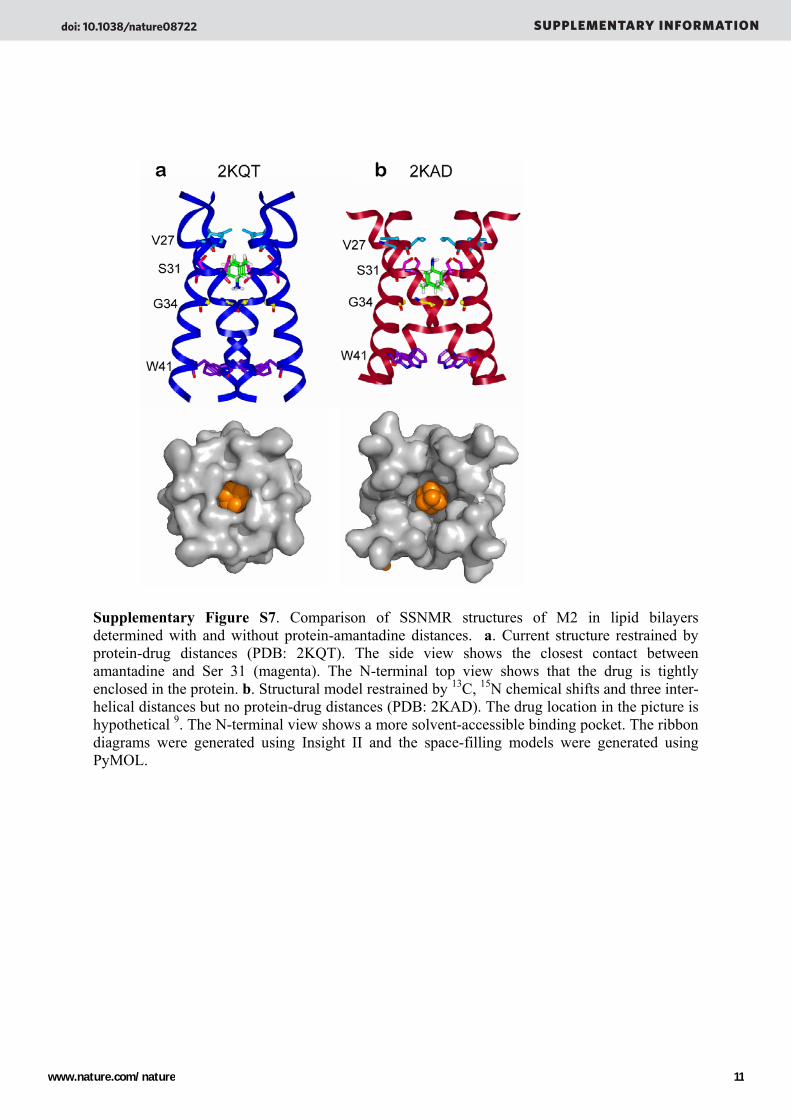
Supplementary Figure S7. Comparison of SSNMR structures of M2 in lipid bilayers determined with and without protein-amantadine distances. a. Current structure restrained by protein-drug distances (PDB: 2KQT). The side view shows the closest contact between amantadine and Ser 31 (magenta). The N-terminal top view shows that the drug is tightly enclosed in the protein. b. Structural model restrained by 13C, 15N chemical shifts and three inter-helical distances but no protein-drug distances (PDB: 2KAD). The drug location in the picture is hypothetical 9. The N-terminal view shows a more solvent-accessible binding pocket. The ribbon diagrams were generated using Insight II and the space-filling models were generated using PyMOL.
doi: 10.1038/nature08722 SUPPLEMENTARY INFORMATION
www.nature.com/nature 11
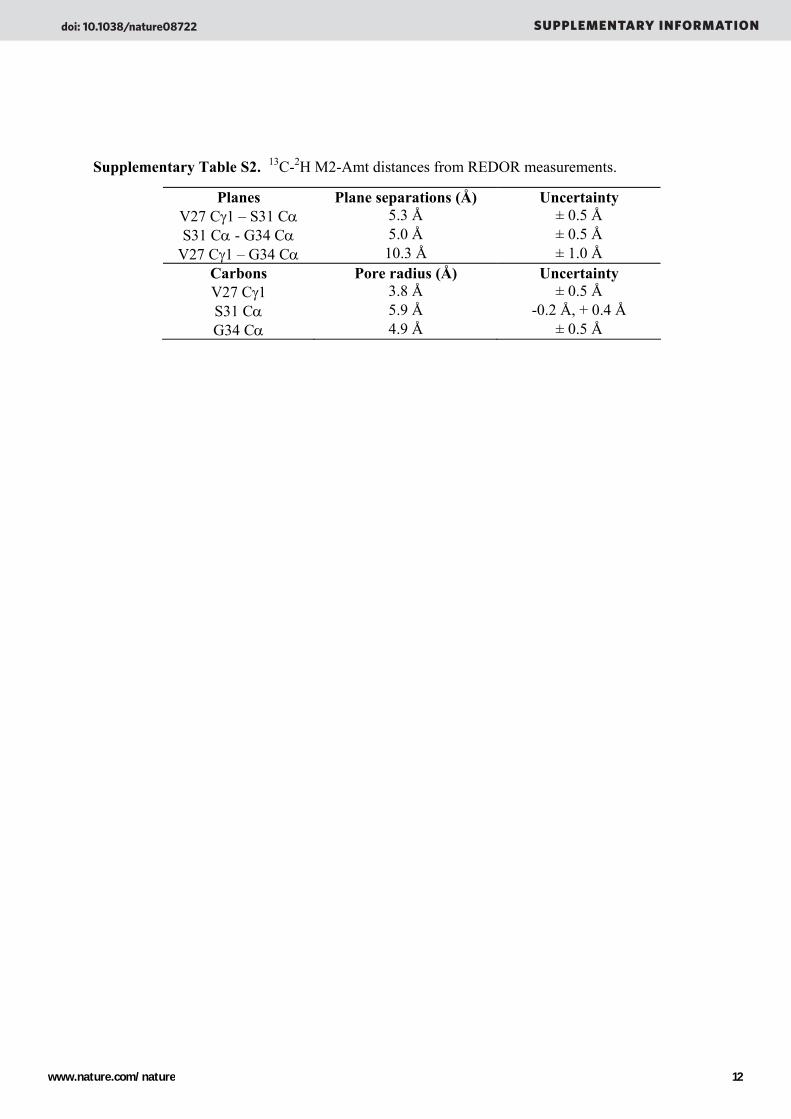
Supplementary Table S2. 13C-2H M2-Amt distances from REDOR measurements.
Planes Plane separations (Å) Uncertainty V27 Cγ1 – S31 Cα 5.3 Å ± 0.5 Å S31 Cα - G34 Cα 5.0 Å ± 0.5 Å
V27 Cγ1 – G34 Cα 10.3 Å ± 1.0 Å Carbons Pore radius (Å) Uncertainty V27 Cγ1 3.8 Å ± 0.5 Å S31 Cα 5.9 Å -0.2 Å, + 0.4 Å G34 Cα 4.9 Å ± 0.5 Å
doi: 10.1038/nature08722 SUPPLEMENTARY INFORMATION
www.nature.com/nature 12

(D) Computation procedure for the SSNMR structure ensemble of amantadine-bound M2 in lipid bilayers
An ideal helix with the sequence SSDPLVVAASIIGILHLILWILDRL was constructed using standard internal geometry and by setting the (φ, ψ) values to (-65˚, -42˚). Side chain rotamer conformations were taken from the high-resolution M2 crystal structure (PDB ID: 3BKD). The ideal helix was then split at the Gly34-Ile35 amide bond to generate two separate helices. Each helix fragment was then transformed to the global frame of reference such that the helical axes were coincident with the global Z axis. The Gly34-Ile35 bond was then rebuilt using a rigid-body optimization procedure composed of a harmonic potential to optimize the internal geometry between Gly34-Ile35, and a harmonic potential to optimize the fit to the 15N-1H dipolar couplings from SSNMR 11. To simplify coordinate transformation, Gly34 Cα was set as at the origin. The rigid-body optimization procedure resulted in a helix that agreed with the N-H bond orientations to within ±10˚ of the previous SSNMR results.
To maximize agreement with the 15N orientational constraints further, an inverse kinematics algorithm (IKA) was used to gradually relax the backbone 12. To reduce large-scale movements between the N-terminal and C-terminal segments of the helix, the wriggling algorithm was used to construct a set of suitably local dihedral-angle moves along the protein chain without distorting the internal bond lengths and bond angles. The stochastic nature of this algorithm allowed us to easily integrate in a Monte Carlo/simulated annealing (MC/SA) minimization strategy. Thus, small random perturbations to the (φ, ψ) angles (up to ±1º) were introduced along the backbone of the helix subject to the following potential: ( ) ( ) ( ) ( )2 2 2 2
0 0 0 0 12 6
dipolarradial dihedral dist nonb
I i II i III i IV ii i i i i i j
A BV C r r C C C d dR R
θ θ τ τ>
⎛ ⎞= ⋅ − + ⋅ − + ⋅ − + ⋅ − + −⎜ ⎟⎝ ⎠
∑ ∑ ∑ ∑ ∑ ∑
The temperature was initially set to 106 K and decreased by 10% every 100 steps until a
temperature of 25 K was reached. The constants (CI-CIV) were obtained through a trial-and-error process. Some side chain rotamers were changed to maximize agreement with the radial distances (Supplementary Table 2). An ensemble of models was obtained by selecting the top scoring model after one round of MC/SA minimization and refining again with the IKA. The constant CIII was set to 50 kcal/mol-radian2. Since the radial distance provided excellent restraints between the drug and M2, we were able to position the amantadine molecule near S31 without the need for further minimization.
A brief description for each of the terms in the above potential energy function is provided below: 1) Radial potential—used to improve the fit between the distance belonging to atoms in Supplementary Table S2 and the channel axis (i.e., the global Z axis). The constant CI was set to 1000 kcal/mol-Ǻ2. 2) Dipolar angle potential—used to improve the fit with the 15N dipolar coupling data measured by SSNMR (PDB ID: 2H95) (Supplementary Table S3) 11. The angle θ is measured between the
doi: 10.1038/nature08722 SUPPLEMENTARY INFORMATION
www.nature.com/nature 13
channel axis and the bond vector formed between the amide backbone nitrogen and the corresponding amide hydrogen. The constant CII was set to 1000 kcal/mol-radians2. 3) Dihedral potential—used to maintain the helical geometry by forcing the dihedral angles to stay in an acceptable region of Ramachandran space. The constant CIII was set to 100 kcal/mol-radians2. The starting dihedral angle value was set as the target value. 4) Distance potential—used to maintain the helical geometry by forcing the hydrogen bond distances between the backbone of the ith carbonyl-oxygen and i+4th nitrogen to remain close to the starting value. This potential was also used to restrain the Trp41 distance in Supplementary Table S4. The constant CIV was set to 100 kcal/mol-Ǻ2. 5) Lennard-Jones potential—the parameters for this potential were taken directly from the CHARMM22 force field parameter file in XPLOR-NIH 13. Interactions between the ith and i+4th bonded neighbor interactions were not considered and non-bonded cutoffs were not utilized. After each pass of the local sampling algorithm, a C4 operation about the channel axis was performed to generate the four equivalent chains before calculating the energy.
doi: 10.1038/nature08722 SUPPLEMENTARY INFORMATION
www.nature.com/nature 14
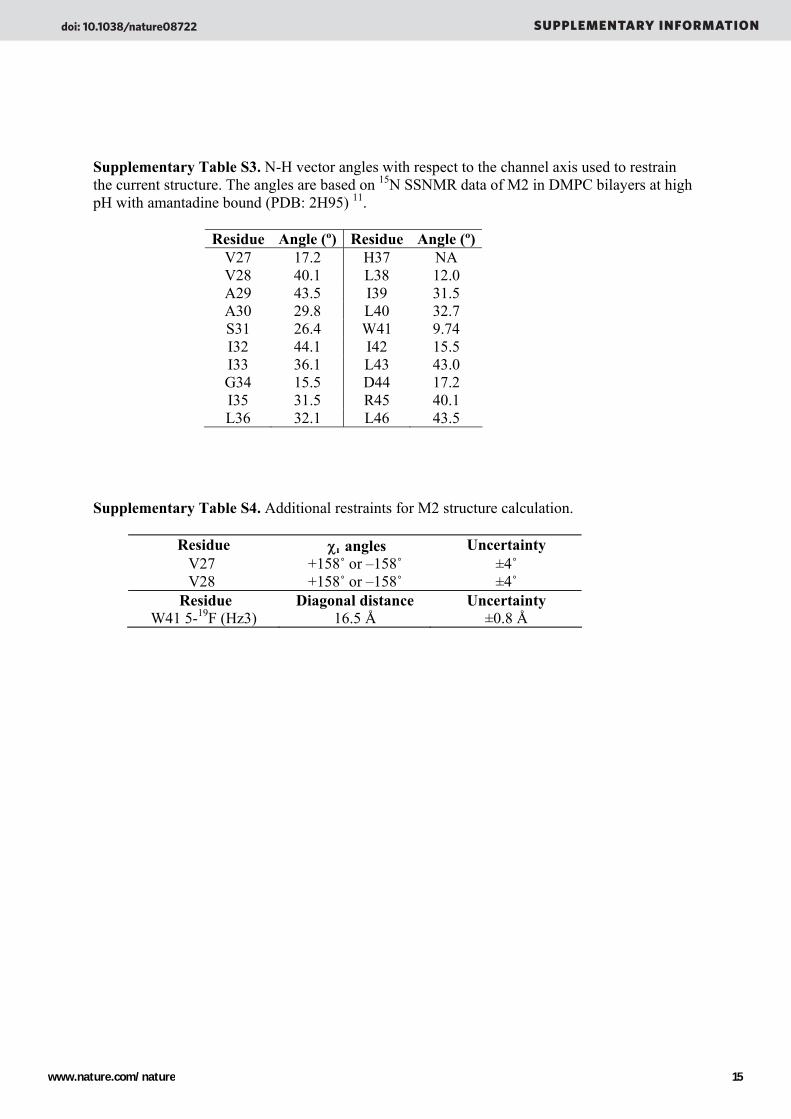
Supplementary Table S3. N-H vector angles with respect to the channel axis used to restrain the current structure. The angles are based on 15N SSNMR data of M2 in DMPC bilayers at high pH with amantadine bound (PDB: 2H95) 11.
Residue Angle (º) Residue Angle (º)V27 17.2 H37 NA V28 40.1 L38 12.0 A29 43.5 I39 31.5 A30 29.8 L40 32.7 S31 26.4 W41 9.74 I32 44.1 I42 15.5 I33 36.1 L43 43.0 G34 15.5 D44 17.2 I35 31.5 R45 40.1 L36 32.1 L46 43.5
Supplementary Table S4. Additional restraints for M2 structure calculation.
Residue χ angles Uncertainty V27 +158˚ or –158˚ ±4˚ V28 +158˚ or –158˚ ±4˚
Residue Diagonal distance Uncertainty W41 5-19F (Hz3) 16.5 Å ±0.8 Å
doi: 10.1038/nature08722 SUPPLEMENTARY INFORMATION
www.nature.com/nature 15
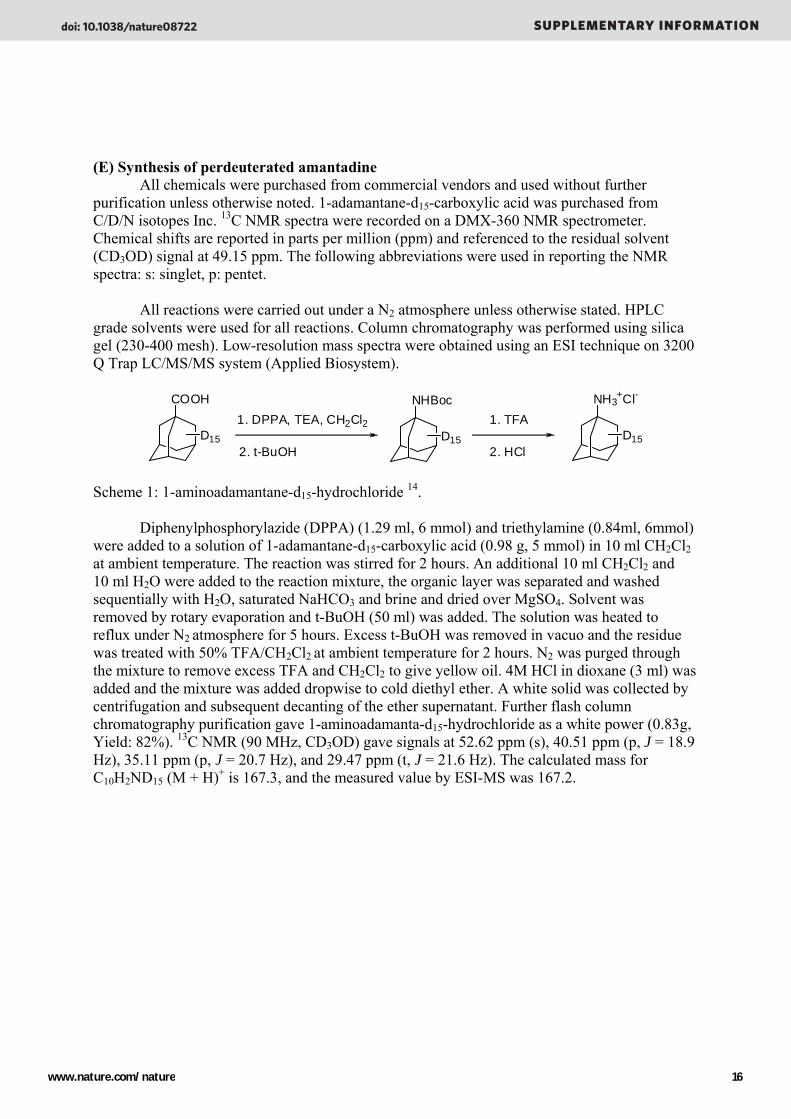
(E) Synthesis of perdeuterated amantadine
All chemicals were purchased from commercial vendors and used without further purification unless otherwise noted. 1-adamantane-d15-carboxylic acid was purchased from C/D/N isotopes Inc. 13C NMR spectra were recorded on a DMX-360 NMR spectrometer. Chemical shifts are reported in parts per million (ppm) and referenced to the residual solvent (CD3OD) signal at 49.15 ppm. The following abbreviations were used in reporting the NMR spectra: s: singlet, p: pentet.
All reactions were carried out under a N2 atmosphere unless otherwise stated. HPLC
grade solvents were used for all reactions. Column chromatography was performed using silica gel (230-400 mesh). Low-resolution mass spectra were obtained using an ESI technique on 3200 Q Trap LC/MS/MS system (Applied Biosystem).
COOH
D15
1. DPPA, TEA, CH2Cl2
2. t-BuOH
NHBoc
D15
1. TFA
2. HCl
NH3+Cl-
D15
Scheme 1: 1-aminoadamantane-d15-hydrochloride 14.
Diphenylphosphorylazide (DPPA) (1.29 ml, 6 mmol) and triethylamine (0.84ml, 6mmol) were added to a solution of 1-adamantane-d15-carboxylic acid (0.98 g, 5 mmol) in 10 ml CH2Cl2 at ambient temperature. The reaction was stirred for 2 hours. An additional 10 ml CH2Cl2 and 10 ml H2O were added to the reaction mixture, the organic layer was separated and washed sequentially with H2O, saturated NaHCO3 and brine and dried over MgSO4. Solvent was removed by rotary evaporation and t-BuOH (50 ml) was added. The solution was heated to reflux under N2 atmosphere for 5 hours. Excess t-BuOH was removed in vacuo and the residue was treated with 50% TFA/CH2Cl2 at ambient temperature for 2 hours. N2 was purged through the mixture to remove excess TFA and CH2Cl2 to give yellow oil. 4M HCl in dioxane (3 ml) was added and the mixture was added dropwise to cold diethyl ether. A white solid was collected by centrifugation and subsequent decanting of the ether supernatant. Further flash column chromatography purification gave 1-aminoadamanta-d15-hydrochloride as a white power (0.83g, Yield: 82%). 13C NMR (90 MHz, CD3OD) gave signals at 52.62 ppm (s), 40.51 ppm (p, J = 18.9 Hz), 35.11 ppm (p, J = 20.7 Hz), and 29.47 ppm (t, J = 21.6 Hz). The calculated mass for C10H2ND15 (M + H)+ is 167.3, and the measured value by ESI-MS was 167.2.
doi: 10.1038/nature08722 SUPPLEMENTARY INFORMATION
www.nature.com/nature 16
(F) Complete set of 2H spectra of perdeuterated amantadine in lipid bilayers.
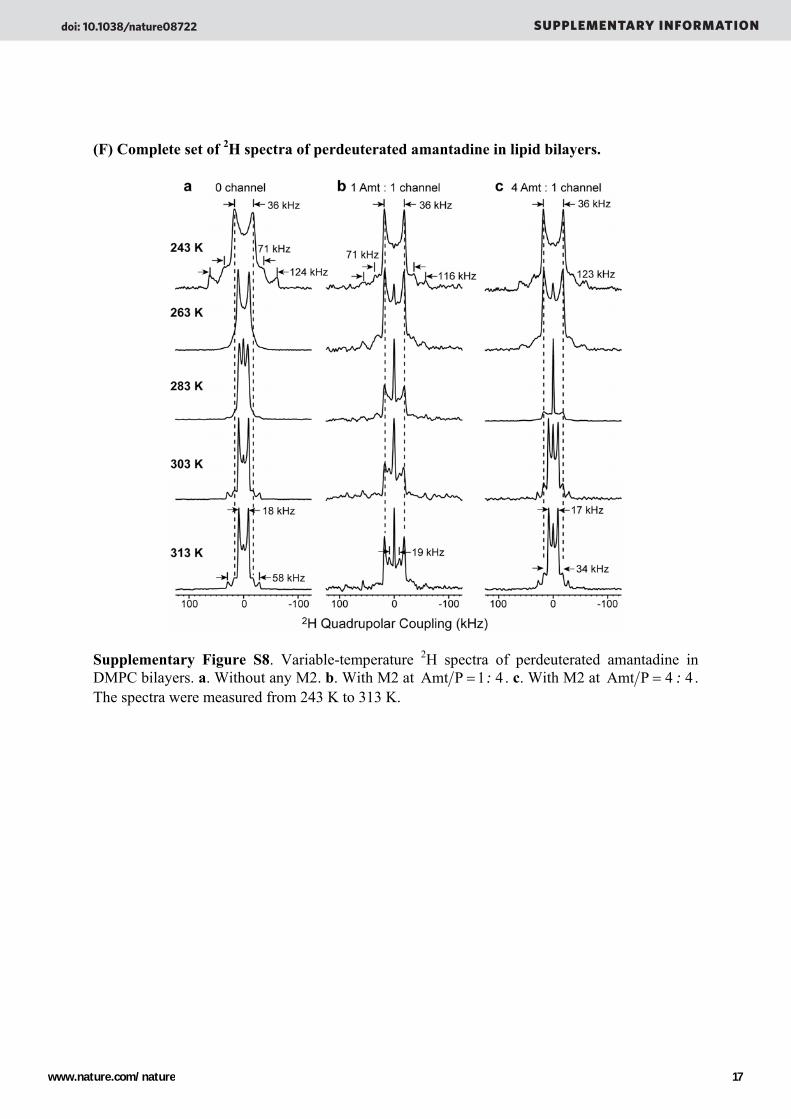
Supplementary Figure S8. Variable-temperature 2H spectra of perdeuterated amantadine in DMPC bilayers. a. Without any M2. b. With M2 at Amt P =1: 4 . c. With M2 at Amt P = 4 : 4 . The spectra were measured from 243 K to 313 K.
doi: 10.1038/nature08722 SUPPLEMENTARY INFORMATION
www.nature.com/nature 17
References 1 Su, Y., Doherty, T., Waring, A. J., Ruchala, P. & Hong, M. Roles of arginine and lysine
residues in the translocation of a cell-penetrating peptide from (13)C, (31)P, and (19)F solid-state NMR. Biochemistry 48, 4587-4595 (2009).
2 Hohwy, M., Rienstra, C. M., Jaroniec, C. P. & Griffin, R. G. Fivefold symmetric homonuclear dipolar recoupling in rotating solids: application to double-quantum spectroscopy. J. Chem. Phys. 110, 7983-7992 (1999).
3 Bak, M., Rasmussen, T. & Nielsen, N. C. SIMPSON: A General Simulation Program for Solid-State NMR Spectroscopy. J. Magn. Reson. 147, 296-330 (2000).
4 Schmidt, A., Kowalewski, T. & Schaefer, J. Local packing in glassy polycarbonates by carbon-deuterium REDOR NMR. Macromolecules 26, 1729–1733 (1993).
5 Sack, I. & Vega, S. Efficient deuterium-carbon REDOR NMR Spectroscopy. J. Magn. Reson. 145, 52-61 (2000).
6 Stouffer, A. L. et al. Structural basis for the function and inhibition of an influenza virus proton channel. Nature 451, 596-599 (2008).
7 Schnell, J. R. & Chou, J. J. Structure and mechanism of the M2 proton channel of influenza A virus. Nature 451, 591-595 (2008).
8 Hong, M., Mishanina, T. V. & Cady, S. D. Accurate measurement of methyl 13C chemical shifts by solid-state NMR for the determination of protein sidechain conformation: the influenza M2 transmembrane peptide as an example. J. Am. Chem. Soc. 131, 7806-7816 (2009).
9 Cady, S. D., Mishanina, T. V. & Hong, M. Structure of amantadine-bound M2 transmembrane peptide of influenza A in lipid bilayers from magic-angle-spinning solid-state NMR: the role of Ser31 in amantadine binding. . J. Mol. Biol. 385, 1127-1141 (2009).
10 Nishimura, K., Kim, S., Zhang, L. & Cross, T. A. The closed state of a H+ channel helical bundle combining precise orientational and distance restraints from solid state NMR. Biochemistry 41, 13170-13177 (2002).
11 Hu, J. et al. Backbone stucture of the amantadine-blocked transMembrane domain M2 proton channel from influenza A virus. Biophys. J. 92, 4335-4343 (2007).
12 Cahill, S., Cahill, M. & Cahill, K. On the kinematics of protein folding. J. Comput. Chem. 24, 1364-1370 (2003).
13 Schwieters, C. D., Kuszewski, J. J., Tjandra, N. & Clore, G. M. The Xplor-NIH NMR molecular structure determination package. J. Magn. Reson. 160, 65-73 (2003).
14 Nasr, K., Pannier, N., Frangioni, J. V. & Maison, W. Rigid multivalent scaffolds based on adamantane. J. Org. Chem. 73, 1056-1060 (2008).
doi: 10.1038/nature08722 SUPPLEMENTARY INFORMATION
www.nature.com/nature 18