Embed Size (px)
Citation preview
ANALYTICAL SCIENCES MARCH 2014, VOL. 30 365
Introduction
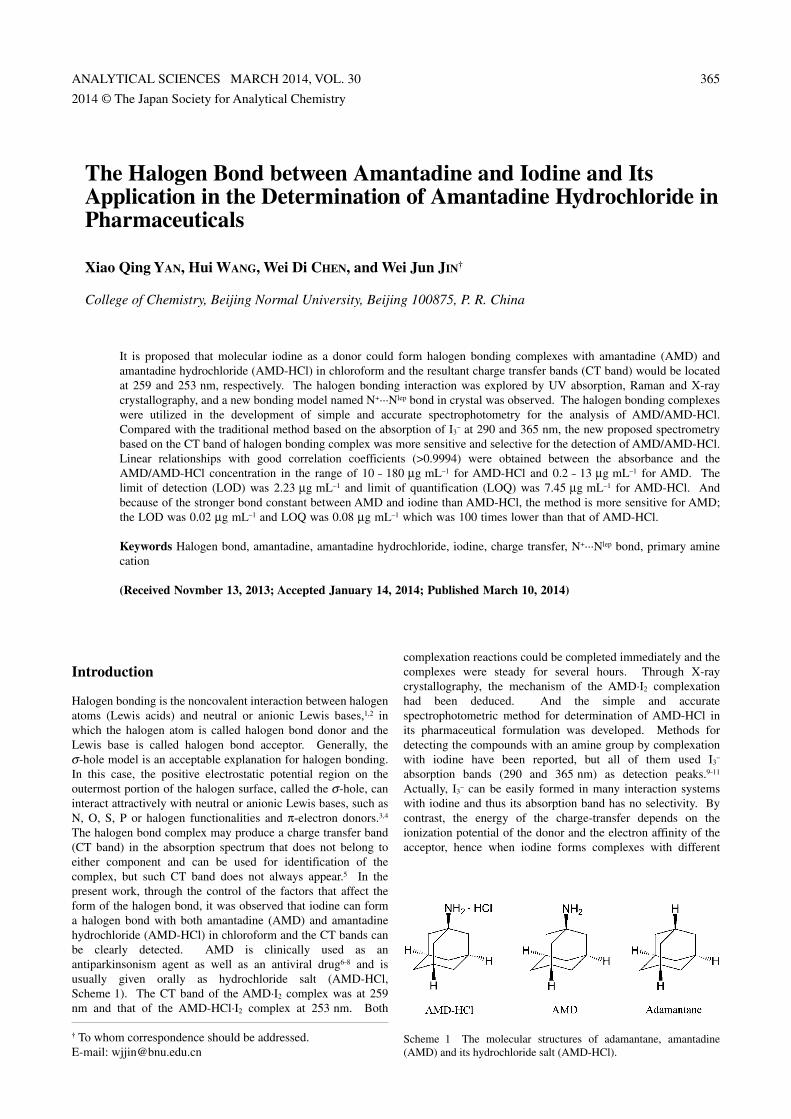
Halogen bonding is the noncovalent interaction between halogen atoms (Lewis acids) and neutral or anionic Lewis bases,1,2 in which the halogen atom is called halogen bond donor and the Lewis base is called halogen bond acceptor. Generally, the σ-hole model is an acceptable explanation for halogen bonding. In this case, the positive electrostatic potential region on the outermost portion of the halogen surface, called the σ-hole, can interact attractively with neutral or anionic Lewis bases, such as N, O, S, P or halogen functionalities and π-electron donors.3,4 The halogen bond complex may produce a charge transfer band (CT band) in the absorption spectrum that does not belong to either component and can be used for identification of the complex, but such CT band does not always appear.5 In the present work, through the control of the factors that affect the form of the halogen bond, it was observed that iodine can form a halogen bond with both amantadine (AMD) and amantadine hydrochloride (AMD-HCl) in chloroform and the CT bands can be clearly detected. AMD is clinically used as an antiparkinsonism agent as well as an antiviral drug6–8 and is usually given orally as hydrochloride salt (AMD-HCl, Scheme 1). The CT band of the AMD·I2 complex was at 259 nm and that of the AMD-HCl·I2 complex at 253 nm. Both
complexation reactions could be completed immediately and the complexes were steady for several hours. Through X-ray crystallography, the mechanism of the AMD·I2 complexation had been deduced. And the simple and accurate spectrophotometric method for determination of AMD-HCl in its pharmaceutical formulation was developed. Methods for detecting the compounds with an amine group by complexation with iodine have been reported, but all of them used I3
– absorption bands (290 and 365 nm) as detection peaks.9–11 Actually, I3
– can be easily formed in many interaction systems with iodine and thus its absorption band has no selectivity. By contrast, the energy of the charge-transfer depends on the ionization potential of the donor and the electron affinity of the acceptor, hence when iodine forms complexes with different
2014 © The Japan Society for Analytical Chemistry
† To whom correspondence should be addressed.E-mail: [email protected]
The Halogen Bond between Amantadine and Iodine and Its Application in the Determination of Amantadine Hydrochloride in Pharmaceuticals
Xiao Qing YAN, Hui WANG, Wei Di CHEN, and Wei Jun JIN†
College of Chemistry, Beijing Normal University, Beijing 100875, P. R. China
It is proposed that molecular iodine as a donor could form halogen bonding complexes with amantadine (AMD) and amantadine hydrochloride (AMD-HCl) in chloroform and the resultant charge transfer bands (CT band) would be located at 259 and 253 nm, respectively. The halogen bonding interaction was explored by UV absorption, Raman and X-ray crystallography, and a new bonding model named N+···Nlep bond in crystal was observed. The halogen bonding complexes were utilized in the development of simple and accurate spectrophotometry for the analysis of AMD/AMD-HCl. Compared with the traditional method based on the absorption of I3
– at 290 and 365 nm, the new proposed spectrometry based on the CT band of halogen bonding complex was more sensitive and selective for the detection of AMD/AMD-HCl. Linear relationships with good correlation coefficients (>0.9994) were obtained between the absorbance and the AMD/AMD-HCl concentration in the range of 10 – 180 μg mL–1 for AMD-HCl and 0.2 – 13 μg mL–1 for AMD. The limit of detection (LOD) was 2.23 μg mL–1 and limit of quantification (LOQ) was 7.45 μg mL–1 for AMD-HCl. And because of the stronger bond constant between AMD and iodine than AMD-HCl, the method is more sensitive for AMD; the LOD was 0.02 μg mL–1 and LOQ was 0.08 μg mL–1 which was 100 times lower than that of AMD-HCl.
Keywords Halogen bond, amantadine, amantadine hydrochloride, iodine, charge transfer, N+···Nlep bond, primary amine cation
(Received Novmber 13, 2013; Accepted January 14, 2014; Published March 10, 2014)
Scheme 1 The molecular structures of adamantane, amantadine (AMD) and its hydrochloride salt (AMD-HCl).
366 ANALYTICAL SCIENCES MARCH 2014, VOL. 30
acceptors there are different CT bands, which can be used for selective detection. By selecting a suitable interaction system, more halogen bond donors can be found to produce CT bands, which will expand the application range of the UV absorption method.
Experimental
Reagents and chemicalsAmantadine (98%) and adamantane (98%) were purchased
from Alfa Aesar (WardHill, USA). Amantadine hydrochloride (99%) was obtained from J&K Technology Co., Ltd. (Beijing, China) and its pharmaceutical formulation used was from PengYao Pharmaceutical Co., Ltd. (Jiangsu, China), labeled to contain 100 mg AMD-HCl per tablet. Iodine was also supplied by J&K and resublimed when prepared the required iodine solutions. Analytically pure chloroform purchased from Tianjin Bodi Chemical Co. (Tianjin, China) was dried by distillation and kept over CaH2 in a brown bottle before use.
Spectral measurementsThe UV absorption spectra were obtained in a 1-mm quartz
cuvette using a TU-1901 spectrophotometer (Beijing Purkinje General Instrument Co., Beijing, China) and by incrementally adding the 0.0125 mol L–1 AMD or 0.125 mol L–1 AMD-HCl chloroform stock solution (from 1 to 10 μL) to the 250 μL chloroform solution of the 5 mM I2. For quantitative analysis, a 1-cm quartz cuvette was used and the intensities of CT bands were obtained by incrementally adding the 5000 μg mL–1 AMD-HCl (from 5 to 90 μL) or 500 μg mL–1 AMD (from 1 to 65 μL) to the 2500 μL chloroform solution of the 2.5 mM I2.
Raman spectra were obtained on a Laser Confocal Micro-Raman Spectroscopy (LabRAM Aramis, Horiba JvonYvon) with the use of a HeNe laser and a 633 nm radiation at the sample, and the resolution was better than 1 cm–1. Generally, 20 scans per sample within 300 s were collected. The solid samples were detected directly, and the liquid samples were sealed in capillary tubes. The concentrations of I2 and AMD/AMD-HCl in chloroform were both 0.1 M.
Determination of molar ratio of reactants in complexesThe Job method of continuous variation was employed to
determine the molar ratio of reactants in the complex. Solutions of AMD (5.0 × 10⁻⁴ M) and iodine (5.0 × 10⁻⁴ M) were prepared in chloroform. A series of mixture solutions was made
consisting of complementary proportions of the two solutions (in ratio 0:10, 1:9, ..., 5:5, ..., 9:1, 10:0 ) in 1 mL volumetric flasks. For the complex of AMD-HCl and iodine, 5.0 × 10⁻³ M standard solution of AMD-HCl and iodine were used. Absorbance was measured at 259 nm for AMD and 253 nm for AMD-HCl.
Procedure for AMD-HCl tabletsIodine-AMD-HCl method. The 10 tablets of AMD-HCl were finely ground into powder. Then the powder equivalent to 500 mg AMD-HCl was dissolved in about 15 mL chloroform and was sonicated for 15 min at 30°C. The slurry was filtered. The extraction procedure was repeated three times, and the liquid extracts were incorporated into a 50-mL volumetric flask and the volume was completed to the mark with chloroform. Then the procedure was followed as above.Iodine-AMD method. The powder equivalent to 500 mg AMD-HCl was transfered to a 50-mL volumetric flask. Ten milliliters of 0.1 M HCl were added and heated gently to achieve complete dissolution. The solution was cooled and diluted with water to volume. Next, 5 mL of the solution was pipetted into a 250-mL separator, and 40 mL of 1.0 N sodium hydroxide and 50 mL chloroform was added. The mixture was then shaken for 60 min, and the chloroform layer was collected.
Preparation of cocrystals of AMD·I2 and AMD-HCl·I2
AMD (0.0151 g)/AMD-HCl (0.0188 g) and iodine (0.0254 g) in an equimolar ratio were dissolved in chloroform solvent in a glass vial. Slow evaporation of the solvent at room temperature for one month yielded the reddish brown crystals. The products were isolated prior to total evaporation of the solvents to guarantee crystal purity. But only AMD·I2 crystal was appropriate for obtaining X-ray single crystal data.
CrystallographySingle crystal diffraction data were collected at 293 K on a
Bruker SMART APEX diffractometer with graphite monochromated Mo-Kα radiation (λ = 0.71069 Å). Empirical absorption corrections were applied using the multiscan method. The structure was solved by a direct method and refined by full-matrix least-squares on F2 using the SHELX program with anisotropic thermal parameters for all non-hydrogen atoms.12,13 Hydrogen atoms were placed by calculated positions. The relevant crystallographic data of the structure reported in this paper are shown in Table S1 (Supporting Information).
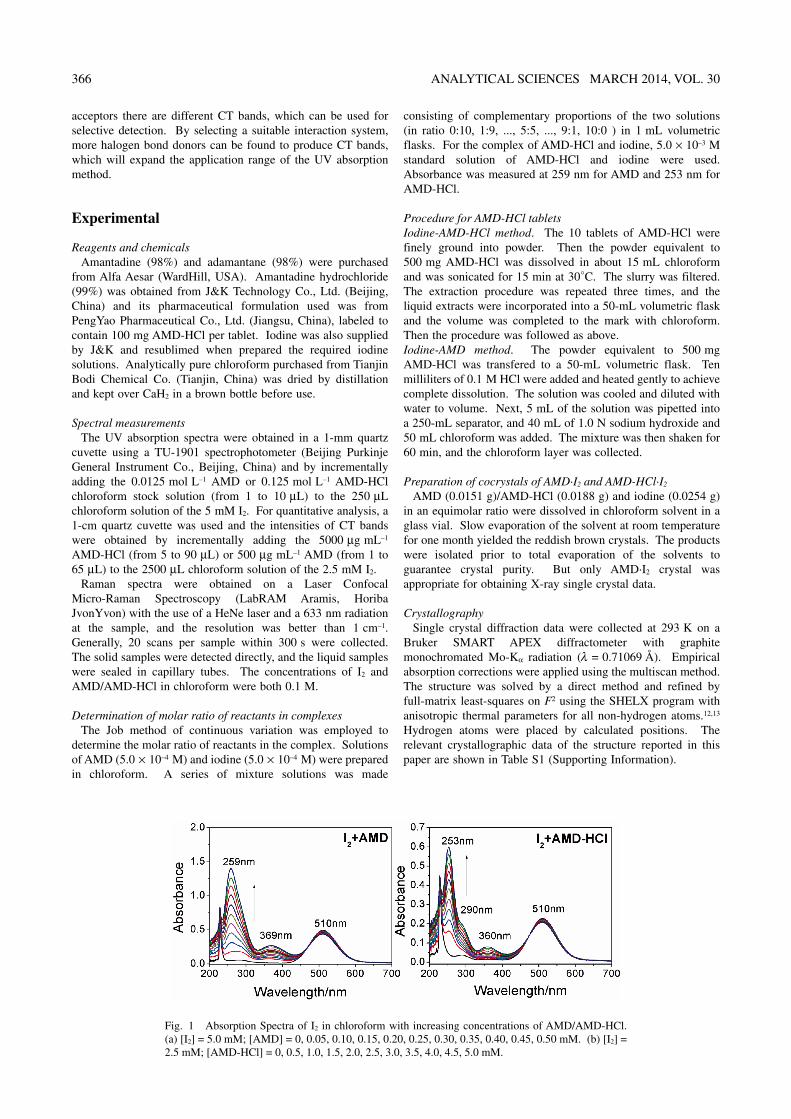
Fig. 1 Absorption Spectra of I2 in chloroform with increasing concentrations of AMD/AMD-HCl. (a) [I2] = 5.0 mM; [AMD] = 0, 0.05, 0.10, 0.15, 0.20, 0.25, 0.30, 0.35, 0.40, 0.45, 0.50 mM. (b) [I2] = 2.5 mM; [AMD-HCl] = 0, 0.5, 1.0, 1.5, 2.0, 2.5, 3.0, 3.5, 4.0, 4.5, 5.0 mM.
ANALYTICAL SCIENCES MARCH 2014, VOL. 30 367
Results and Discussion
Selection of suitable halogen bond donors and solvents for AMD/AMD-HCl detection system
The N atom with n-electrons in AMD is a potential halogen bonding acceptor. UV-Vis spectroscopy is a simple and convenient method to investigate halogen bonding interactions when a new CT band appears. The appearance of CT band is affected mostly by halogen bond donor. Generally, the stronger the halogen bond, the more easily a CT band appears. Diiodoperfluoroethane is usually the first choice because of its strong ability of forming halogen bonds.14 Moreover, the solvent used to prepare samples is another factor that should be considered because the solvent can have a remarkable effect on the formation of halogen bonds.15,16 Generally, halogen bonds form more readily in weak polar solvents. But AMD and AMD-HCl are more easily dissolved in polar solvents, and such solvents can weaken the halogen bond because they may act as good halogen bonding acceptors or hydrogen bonding donors that will compete with AMD/AMD-HCl. Based on such considerations, chloroform, which is commonly thought to have a weak effect on halogen bonding and also can dissolve the AMD/AMD-HCl well, was selected as the solvent. But disappointing, no obvious new CT band appeared. Then, iodine was chosen to interact with AMD/AMD-HCl as it is a stronger halogen bond donor than diiodoperfluoroethane. As shown in Fig. 1, the color of iodine in chloroform was violet and show the two absorption maximum at 228 and 510 nm. When AMD was added, the color changed to reddish brown immediately and the absorption spectrum of the complex showed two obvious peaks at 259 and 369 nm. When AMD-HCl was added, three new absorption peaks at 253, 290 and 360 nm appeared. The appearance of the peaks at 290 and 360/369 nm was characteristically ascribed to the formation of triiodide ion I3
–.17,18 In the AMD·I2 complex, the peak at 290 nm was overlapped by the peak at 259 nm. The absorption located at 259/253 nm was the CT band between iodine and AMD/AMD-HCl and increased with increasing concentration of AMD/AMD-HCl, which can be used to detect AMD/AMD-HCl. The reason why absorption peaks of I3
– are not suitable for determination is these two peaks appear commonly in many interaction systems reported9–11 and are not selective. Even when the adamantane (without amine group interacting with iodine) was added, these two peaks still existed (Fig. S1, Supporting Imformation), which are due to the subtle interaction of iodine with solvents.19 Regarding the charge transfer band, the energy of the charge-transfer depends on the ionization potential of the donor and the electron affinity of the acceptor. Hence, when different acceptors with different electron affinity form complexes with iodine, there are different CT bands, which is a good phenomenon for selectively detection. For example, the complex pyridine·I2 has the CT band at 235 nm,20 and in the present study, when AMD forms into its hydrochloride salt, the CT band at 259 nm shifts to 253 nm. So, the CT band is a good choice for detection of analytes by UV spectrum. Moreover, compared with the absorptions at 290 and 360/369 nm, the CT band at 253 or 259 nm was more sensitive to the AMD-HCl/AMD.
The characterization of the interaction between iodine and AMD/AMD-HCl
A comparison experiment of adamantane with no amine group was conducted. When adamantane interacted with iodine, no CT band was observed as shown in Fig. S1 (Supporting
Information), which further proves the CT band at 259/253 nm in the AMD/AMD-HCl complexes with iodine is caused by the electron transfer from amine to I-I σ* antibonding orbital. From Fig. 1, it can be seen that with an increase in AMD/AMD-HCl concentration, the absorption of I3
– increased, which indicates that the polarization of iodine atom in the complex increases to the extent where a clear-cut separation of charge occurs. Based on the Mulliken’s theory, the interaction would experience a transformation of the initially formed outer complex D·I2 into an inner complex (DI)+I– 20 followed by a fast reaction of the resulting inner complex with iodine to form a triiodide ion.
The stoichiometry of the resulting charge-transfer complexes between iodine and AMD/AMD-HCl was examined by the method of continuous variations. Both continuous variation plots (Fig. S2, Supporting Information) exhibited a maximum value at 0.5, indicating the formation of 1:1 complexes in solution. The association constants of the complexes in chloroform were determined employing the CT bands using the Benesi–Hildebrand equation under conditions where the AMD/AMD-HCl was present with a 2 – 12 fold excess.21 The details for the calculations are presented in the Supporting Information. The calculated association constants and extinction coefficients of the complexes are recorded in Table 1. The association constant of the AMD·I2 complex is about 26 times larger than that of the AMD-HCl·I2 complex, which is consistent with the phenomenon that the AMD·I2 complex showed a stronger CT band than the AMD-HCl·I2 complex. It is speculated that the n-electrons of N atom in AMD-HCl were partially shared by H+, which weakened the interaction with I2.
To obtain more direct evidences of the interaction between AMD/AMD-HCl and iodine, such as their geometrical parameters and bonding directions, the crystals of these two complexes were tried to prepare. Different solvents were tested including pure solvents, ethanol, acetone, acetonitrile, chloroform, dichloromethane and their mixture with ethanol. The crystal of the AMD·I2 complex was obtained in pure chloroform or pure dichloromethane, and the crystal of the AMD-HCl·I2 complex was obtained in chloroform. But only the AMD·I2 crystal was good enough for X-ray measurements. It is speculated that the weak interaction between AMD-HCl and I2, whose association constant is only 38.08 ± 6.96 M–1, leads to their complex crystal arranging loosely that was not
Table 1 Quantitative parameters for the charge-transfer band of AMD/AMD-HCl with iodine
Parameter AMD AMD-HCl
λ/nmExtinction coefficient ε × 104/M–1 cm–1 ± SD
Association constant K/M–1 ± SD
Beer’s law limit/μg mL–1
Sandell’s sensitivity/μg cm–2
Regression equationSlope ± SDIntercept ± SDCorrelation coefficient (r)
Detection limit LOD/ μg mL–1
Quantification limit LOQ/ μg mL–1
2593.44 ± 0.11
(9.91 ± 0.15)× 102
0.2 – 13 0.06
0.1955 ± 0.0023–0.0017 ± 0.0016
0.99990.02
0.08
2531.32 ± 0.17
(0.381 ± 0.07)× 102
10 – 1800.15
0.0047 ± 0.00010.0339 ± 0.0035
0.99942.23
7.45
ε and K were the average results of triplicated experiments. Solpe and Intercept were the average results of six replicates experiments.
368 ANALYTICAL SCIENCES MARCH 2014, VOL. 30
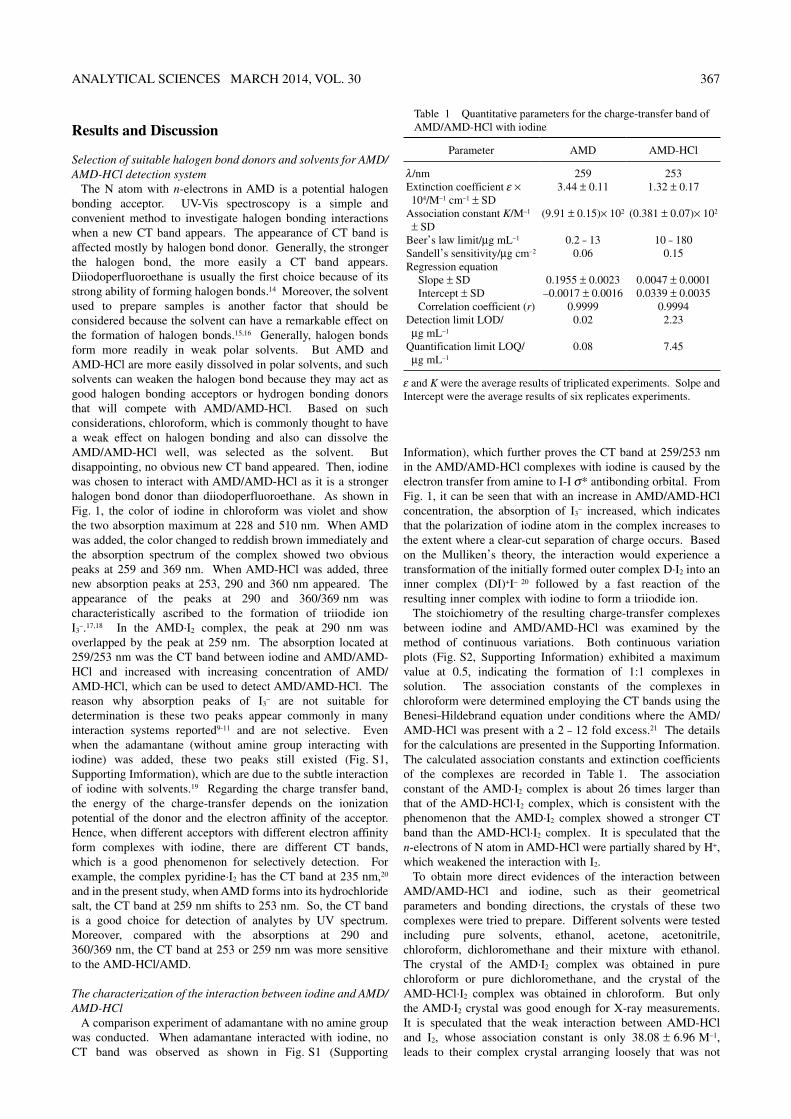
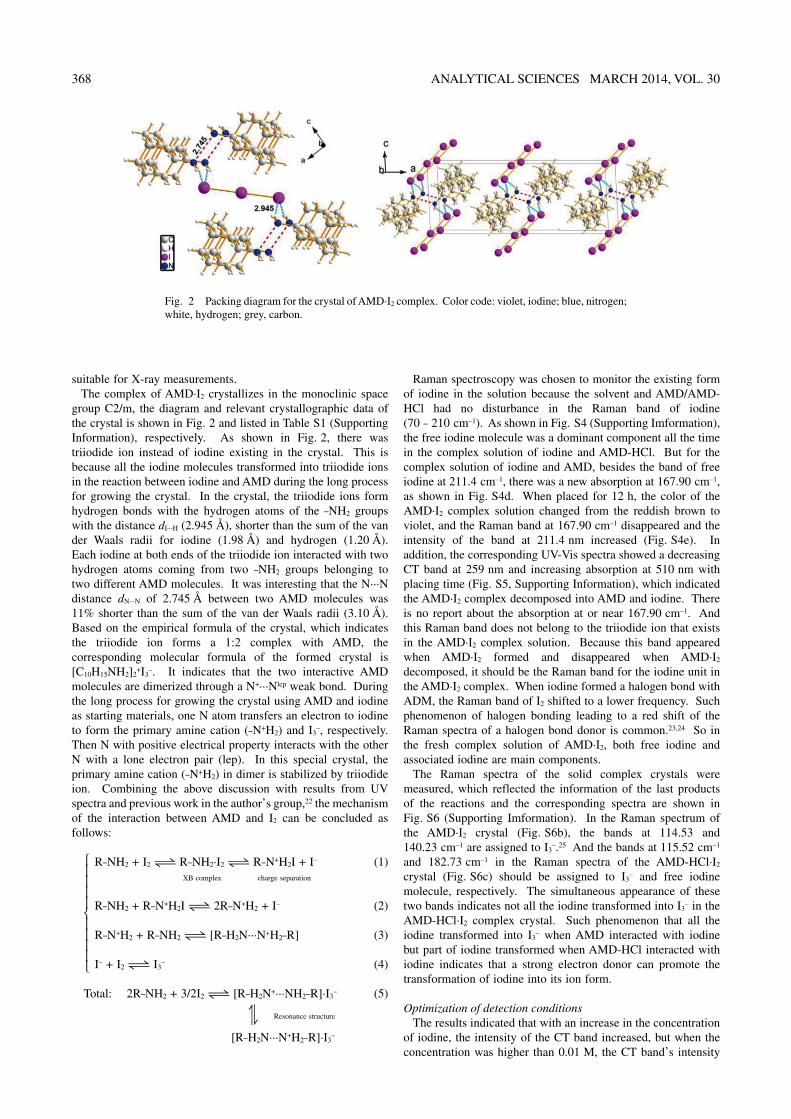
suitable for X-ray measurements.The complex of AMD·I2 crystallizes in the monoclinic space
group C2/m, the diagram and relevant crystallographic data of the crystal is shown in Fig. 2 and listed in Table S1 (Supporting Information), respectively. As shown in Fig. 2, there was triiodide ion instead of iodine existing in the crystal. This is because all the iodine molecules transformed into triiodide ions in the reaction between iodine and AMD during the long process for growing the crystal. In the crystal, the triiodide ions form hydrogen bonds with the hydrogen atoms of the –NH2 groups with the distance dI···H (2.945 Å), shorter than the sum of the van der Waals radii for iodine (1.98 Å) and hydrogen (1.20 Å). Each iodine at both ends of the triiodide ion interacted with two hydrogen atoms coming from two –NH2 groups belonging to two different AMD molecules. It was interesting that the N···N distance dN···N of 2.745 Å between two AMD molecules was 11% shorter than the sum of the van der Waals radii (3.10 Å). Based on the empirical formula of the crystal, which indicates the triiodide ion forms a 1:2 complex with AMD, the corresponding molecular formula of the formed crystal is [C10H15NH2]2
+I3–. It indicates that the two interactive AMD
molecules are dimerized through a N+···Nlep weak bond. During the long process for growing the crystal using AMD and iodine as starting materials, one N atom transfers an electron to iodine to form the primary amine cation (–N+H2) and I3
–, respectively. Then N with positive electrical property interacts with the other N with a lone electron pair (lep). In this special crystal, the primary amine cation (–N+H2) in dimer is stabilized by triiodide ion. Combining the above discussion with results from UV spectra and previous work in the author’s group,22 the mechanism of the interaction between AMD and I2 can be concluded as follows:
R–NH2 + I2 R–NH2·I2 R–N+H2I + I– (1)
XB complex charge separation
R–NH2 + R–N+H2I 2R–N+H2 + I– (2)
R–N+H2 + R–NH2 [R–H2N···N+H2–R] (3)
I– + I2 I3– (4)
Total: 2R–NH2 + 3/2I2 [R–H2N+···NH2–R]·I3– (5)
Resonance structure
[R–H2N···N+H2–R]·I3–
Raman spectroscopy was chosen to monitor the existing form of iodine in the solution because the solvent and AMD/AMD-HCl had no disturbance in the Raman band of iodine (70 – 210 cm–1). As shown in Fig. S4 (Supporting Imformation), the free iodine molecule was a dominant component all the time in the complex solution of iodine and AMD-HCl. But for the complex solution of iodine and AMD, besides the band of free iodine at 211.4 cm–1, there was a new absorption at 167.90 cm–1, as shown in Fig. S4d. When placed for 12 h, the color of the AMD·I2 complex solution changed from the reddish brown to violet, and the Raman band at 167.90 cm–1 disappeared and the intensity of the band at 211.4 nm increased (Fig. S4e). In addition, the corresponding UV-Vis spectra showed a decreasing CT band at 259 nm and increasing absorption at 510 nm with placing time (Fig. S5, Supporting Information), which indicated the AMD·I2 complex decomposed into AMD and iodine. There is no report about the absorption at or near 167.90 cm–1. And this Raman band does not belong to the triiodide ion that exists in the AMD·I2 complex solution. Because this band appeared when AMD·I2 formed and disappeared when AMD·I2 decomposed, it should be the Raman band for the iodine unit in the AMD·I2 complex. When iodine formed a halogen bond with ADM, the Raman band of I2 shifted to a lower frequency. Such phenomenon of halogen bonding leading to a red shift of the Raman spectra of a halogen bond donor is common.23,24 So in the fresh complex solution of AMD·I2, both free iodine and associated iodine are main components.
The Raman spectra of the solid complex crystals were measured, which reflected the information of the last products of the reactions and the corresponding spectra are shown in Fig. S6 (Supporting Imformation). In the Raman spectrum of the AMD·I2 crystal (Fig. S6b), the bands at 114.53 and 140.23 cm–1 are assigned to I3
–.25 And the bands at 115.52 cm–1 and 182.73 cm–1 in the Raman spectra of the AMD-HCl·I2 crystal (Fig. S6c) should be assigned to I3
– and free iodine molecule, respectively. The simultaneous appearance of these two bands indicates not all the iodine transformed into I3
– in the AMD-HCl·I2 complex crystal. Such phenomenon that all the iodine transformed into I3
– when AMD interacted with iodine but part of iodine transformed when AMD-HCl interacted with iodine indicates that a strong electron donor can promote the transformation of iodine into its ion form.
Optimization of detection conditionsThe results indicated that with an increase in the concentration
of iodine, the intensity of the CT band increased, but when the concentration was higher than 0.01 M, the CT band’s intensity
⎧⎪⎪⎪⎪⎨⎪⎪⎪⎪⎩
Fig. 2 Packing diagram for the crystal of AMD·I2 complex. Color code: violet, iodine; blue, nitrogen; white, hydrogen; grey, carbon.
ANALYTICAL SCIENCES MARCH 2014, VOL. 30 369
increased slowly and started to decrease at 0.03 M. So an iodine concentration of 0.0025 M was chosen in the present study. Complete chromogenesis was instantaneous and the stability of the complex solution was studied (Fig. S5). The complex solution of AMD-HCl and iodine was very stable within 2 h and the AMD·I2 complex solution was stable within 30 min. With an increase in placing time, a slight increase of the CT band of the AMD-HCl·I2 complex solution was observed, which may be because more AMD-HCl·I2 formed, and the color of the AMD·I2 complex solution changed from the reddish brown to violet gradually and the CT band at 258 nm decreased (Fig. S5a).
Development and validation of the analytical methodsUnder the optimum conditions, the calibration curves
correlating the absorption intensity with the corresponding concentration of AMD or AMD-HCl were constructed. The regression equations were derived using the least-squares method. Both plots were linear with very small intercepts and good correlation coefficients. The analytical parameters are given in Table 1. The limit of detection (LOD) and limit of quantification (LOQ) were determined using the formula: LOD or LOQ = κSDa/b, where κ = 3 for LOD and 10 for LOQ, SDa is the standard deviation of the intercept, and b is the slope. Based on the six replicate measurements, the LOD was 2.23 μg mL–1 and LOQ was 7.45 μg mL–1 for AMD-HCl. And for the AMD, the LOD was 0.02 μg mL–1 and LOQ was 0.08 μg mL–1 which was 100 times lower than that of AMD-HCl. Such a low detection limit for AMD is rare in the UV detection method.
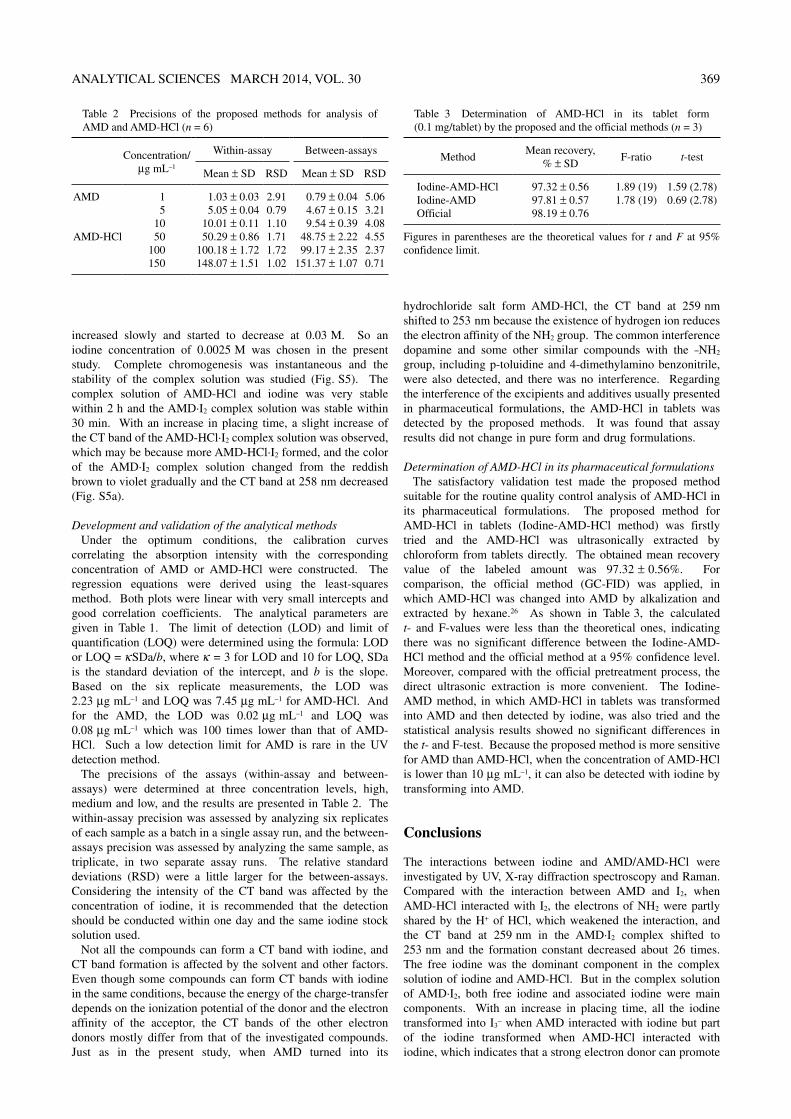
The precisions of the assays (within-assay and between-assays) were determined at three concentration levels, high, medium and low, and the results are presented in Table 2. The within-assay precision was assessed by analyzing six replicates of each sample as a batch in a single assay run, and the between-assays precision was assessed by analyzing the same sample, as triplicate, in two separate assay runs. The relative standard deviations (RSD) were a little larger for the between-assays. Considering the intensity of the CT band was affected by the concentration of iodine, it is recommended that the detection should be conducted within one day and the same iodine stock solution used.
Not all the compounds can form a CT band with iodine, and CT band formation is affected by the solvent and other factors. Even though some compounds can form CT bands with iodine in the same conditions, because the energy of the charge-transfer depends on the ionization potential of the donor and the electron affinity of the acceptor, the CT bands of the other electron donors mostly differ from that of the investigated compounds. Just as in the present study, when AMD turned into its
hydrochloride salt form AMD-HCl, the CT band at 259 nm shifted to 253 nm because the existence of hydrogen ion reduces the electron affinity of the NH2 group. The common interference dopamine and some other similar compounds with the –NH2 group, including p-toluidine and 4-dimethylamino benzonitrile, were also detected, and there was no interference. Regarding the interference of the excipients and additives usually presented in pharmaceutical formulations, the AMD-HCl in tablets was detected by the proposed methods. It was found that assay results did not change in pure form and drug formulations.
Determination of AMD-HCl in its pharmaceutical formulationsThe satisfactory validation test made the proposed method
suitable for the routine quality control analysis of AMD-HCl in its pharmaceutical formulations. The proposed method for AMD-HCl in tablets (Iodine-AMD-HCl method) was firstly tried and the AMD-HCl was ultrasonically extracted by chloroform from tablets directly. The obtained mean recovery value of the labeled amount was 97.32 ± 0.56%. For comparison, the official method (GC-FID) was applied, in which AMD-HCl was changed into AMD by alkalization and extracted by hexane.26 As shown in Table 3, the calculated t- and F-values were less than the theoretical ones, indicating there was no significant difference between the Iodine-AMD-HCl method and the official method at a 95% confidence level. Moreover, compared with the official pretreatment process, the direct ultrasonic extraction is more convenient. The Iodine-AMD method, in which AMD-HCl in tablets was transformed into AMD and then detected by iodine, was also tried and the statistical analysis results showed no significant differences in the t- and F-test. Because the proposed method is more sensitive for AMD than AMD-HCl, when the concentration of AMD-HCl is lower than 10 μg mL–1, it can also be detected with iodine by transforming into AMD.
Conclusions
The interactions between iodine and AMD/AMD-HCl were investigated by UV, X-ray diffraction spectroscopy and Raman. Compared with the interaction between AMD and I2, when AMD-HCl interacted with I2, the electrons of NH2 were partly shared by the H+ of HCl, which weakened the interaction, and the CT band at 259 nm in the AMD·I2 complex shifted to 253 nm and the formation constant decreased about 26 times. The free iodine was the dominant component in the complex solution of iodine and AMD-HCl. But in the complex solution of AMD·I2, both free iodine and associated iodine were main components. With an increase in placing time, all the iodine transformed into I3
– when AMD interacted with iodine but part of the iodine transformed when AMD-HCl interacted with iodine, which indicates that a strong electron donor can promote
Table 2 Precisions of the proposed methods for analysis of AMD and AMD-HCl (n = 6)
Concentration/μg mL–1
Within-assay Between-assays
Mean ± SD RSD Mean ± SD RSD
AMD
AMD-HCl
1 5 10 50100150
1.03 ± 0.035.05 ± 0.04
10.01 ± 0.1150.29 ± 0.86
100.18 ± 1.72148.07 ± 1.51
2.910.791.101.711.721.02
0.79 ± 0.044.67 ± 0.159.54 ± 0.39
48.75 ± 2.2299.17 ± 2.35
151.37 ± 1.07
5.063.214.084.552.370.71
Table 3 Determination of AMD-HCl in its tablet form (0.1 mg/tablet) by the proposed and the official methods (n = 3)
MethodMean recovery,
% ± SDF-ratio t-test
Iodine-AMD-HClIodine-AMDOfficial
97.32 ± 0.5697.81 ± 0.5798.19 ± 0.76
1.89 (19)1.78 (19)
1.59 (2.78)0.69 (2.78)
Figures in parentheses are the theoretical values for t and F at 95% confidence limit.
370 ANALYTICAL SCIENCES MARCH 2014, VOL. 30
the transformation of iodine into its ion form. The AMD·I2 complex crystal reflected the last product of the reaction that the triiodide ion formed a 1:2 complex with AMD ((C10H15NH2)2
+I3–). Based on the data of the crystal, the
mechanism of the interaction between AMD and I2 can be concluded that iodine transformed into I3
– by obtaining an electron from the N in AMD and generated the primary amine cation (–N+H2) which dimerized with the other neutral AMD molecule through N+···Nlep interaction. The appearance of primary amine cation is extremely rare.
The halogen bonding complex was utilized in the development of a simple, rapid and accurate spectrophotometric method for the analysis of AMD-HCl in its pharmaceutical formulation (tablet). The recovery percentage was 97.32 ± 0.56%. Because of the stronger bond constant between AMD and iodine than AMD-HCl, the spectrophotometric method by iodine is more sensitive for AMD than AMD-HCl, which can be used to detect lower than 10 ppm AMD-HCl by alkalization.
Acknowledgements
The authors acknowledge financial support from the National Natural Science Foundation of China (No. 90922023), Ph.D. foundation program of Ministry of Education.
Supporting Information
The Supporting Information is available free of charge on the Web at http://www.jsac.or.jp/analsci/.
References
1. A. C. Legon, Angew. Chem., Int. Ed., 1999, 38, 2686. 2. M. Fourmigué, Curr. Opin. Solid State Mater. Sci., 2009,
13, 36. 3. T. Clark, M. Hennemann, J. S. Murray, and P. Politzer, J.
Mol. Model., 2007, 13, 291. 4. P. Politzer, P. Lane, M. C. Concha, Y. Ma, and J. S. Murray,
J. Mol. Model., 2007, 13, 305.
5. S. V. Rosokha, I. S. Neretin, T. Y. Rosokha, J. Hecht, and J. K. Kochi, Heteroat. Chem., 2006, 17, 449.
6. T. H. Maugh, Science, 1979, 206, 1058. 7. L. P. Van Voris, R. F. Betts, F. G. Hayden, W. A. Christmas,
and R. G. Douglas Jr., J. Am. Med. Assoc., 1981, 245, 1128. 8. C. Paci, A. Thomas, and M. Onofrj, Neurol. Sci., 2001, 22,
75. 9. A. A. Mostafa, L. I. Bebawy, and H. H. Refaat, J. Pharm.
Biomed. Anal., 2002, 27, 889. 10. I. Darwish, A. S. Khedr, H. F. Askal, and R. M. Mahmoud,
J. Appl. Spectrosc., 2006, 73, 707. 11. A. A. Gouda, Talanta, 2009, 80, 151. 12. G. M. Sheldrick, “SHELXTL (Version 5.1.)”, 1998, Bruker
Analytical X-ray Instruments Inc., Madison, Wisconsin. 13. G. M. Sheldrick, “SHELX-97”, 1997, PC Version,
University of Göttingen, Germany. 14. Q. J. Shen and W. J. Jin, Phys. Chem. Chem. Phys., 2011,
13, 13721. 15. M. G. Sarwar, B. Dragisic, L. J. Salsberg, C. Gouliaras, and
M. S. Taylor, J. Am. Chem. Soc., 2010, 132, 1646. 16. S. C. Blackstock, J. P. Lorand, and J. K. Kochi, J. Org.
Chem., 1987, 52, 1451. 17. A. D. Awtrey and R. E. Connick, J. Am. Chem. Soc., 1951,
73, 1842. 18. R. E. Buckles, J. P. Yuk, and A. I. Popov, J. Am. Chem.
Soc., 1952, 74, 4379. 19. Z. Kebede and S. E. Lindquist, Sol. Energy Mater. Sol.
Cells, 1999, 57, 259. 20. C. Reid, and R. S. Mulliken, J. Am. Chem. Soc., 1954, 76,
3869. 21. H. A. Benesi and J. Hildebrand, J. Am. Chem. Soc., 1949,
71, 2703. 22. X. Pang, H. Wang, X. R. Zhao, and W. J. Jin, Dalton Trans.,
2013, 42, 8788. 23. X. Q. Yan, Q. J. Shen, X. R. Zhao, H. Y. Gao, X. Pang, and
W. J. Jin, Anal. Chim. Acta, 2012, 753, 48. 24. H. Wang, X. R. Zhao, and W. J. Jin, Phys. Chem. Chem.
Phys., 2013, 15, 4320. 25. E. M. Nour, L. H. Chen, and J. Laane, J. Phys. Chem.,
1986, 90, 2841. 26. The United States Pharmacopeial Convention USP32-
NF27, 1504.