Embed Size (px)
Citation preview
Louisiana State UniversityLSU Digital Commons
LSU Doctoral Dissertations Graduate School
2016
Student Internalizing Behavior Screener andStudent Externalizing Behavior Screener: AnAnalysis of Reliability, Validity, and Usability inElementary School PopulationsKelsey Lynn HartmanLouisiana State University and Agricultural and Mechanical College
Follow this and additional works at: https://digitalcommons.lsu.edu/gradschool_dissertations
Part of the Psychology Commons
This Dissertation is brought to you for free and open access by the Graduate School at LSU Digital Commons. It has been accepted for inclusion inLSU Doctoral Dissertations by an authorized graduate school editor of LSU Digital Commons. For more information, please [email protected].
Recommended CitationHartman, Kelsey Lynn, "Student Internalizing Behavior Screener and Student Externalizing Behavior Screener: An Analysis ofReliability, Validity, and Usability in Elementary School Populations" (2016). LSU Doctoral Dissertations. 2512.https://digitalcommons.lsu.edu/gradschool_dissertations/2512
STUDENT INTERNALIZING BEHAVIOR SCREENER AND STUDENT
EXTERNALIZING BEHAVIOR SCREENER: AN ANALYSIS OF RELIABILITY,
VALIDITY, AND USABILITY IN ELEMENTARY SCHOOL POPULATIONS
A Dissertation
Submitted to the Graduate Faculty of the
Louisiana State University and
Agricultural and Mechanical College
in partial fulfillment of the
requirements for the degree of
Doctor of Philosophy
in
The Department of Psychology
by
Kelsey Lynn Hartman
B.A., Goshen College, 2008
M.A., Louisiana State University, 2014
August 2016
ii
TABLE OF CONTENTS
ABSTRACT ................................................................................................................................... iv
CHAPTER
1 REVIEW OF LITERATURE ............................................................................................1
Need for Emotional and Behavioral Intervention in Schools ..................................1
Students with Emotional and Behavioral Difficulties .............................................1
Features of EBDs .........................................................................................1
Characteristics of Children with EBDs ........................................................3
Outcomes Associated with EBDs ................................................................4
IDEIA and Emotional Disturbance ..............................................................5
Traditional Systems of Service Delivery .................................................................6
Limitations of Reactive Referral Methods ...................................................7
Early Identification and Intervention .....................................................................11
IDEIA and Prevention................................................................................12
Multitiered Systems of Support (MTSS) ...................................................13
Universal Screening ...............................................................................................14
Barriers to Universal Behavior Screening Adoption .................................15
Considerations in Selecting Universal Screening Measures ......................17
Implementation of Universal Screening ....................................................23
Available Universal Screening Measures ..................................................26
Benefits of SIBS and SEBS Screening Measures ......................................30
Purpose and Research Questions ...........................................................................33
2 METHOD ........................................................................................................................35
Participants and Setting..........................................................................................35
Measures ................................................................................................................37
Student Internalizing Behavior Screener ...................................................37
Student Externalizing Behavior Screener ..................................................38
BASC-2 Behavioral and Emotional Screening System .............................39
SSIS Performance Screening Guide ..........................................................40
Student Archival Data ................................................................................41
Usage Rating Profile - Assessment ............................................................43
Procedure ...............................................................................................................44
Consent and Assent ....................................................................................44
Teacher Training ........................................................................................44
Data Collection ..........................................................................................45
3 RESULTS ........................................................................................................................46
Descriptive Statistics ..............................................................................................46
Reliability of the SIBS and SEBS ..........................................................................48
Concurrent Validity ...............................................................................................50
Predictive Validity .................................................................................................55
Social Validity .......................................................................................................62
iii
4 DISCUSSION..................................................................................................................64
Limitations and Future Directions .........................................................................78
Implications for Schools ........................................................................................81
REFERENCES ..............................................................................................................................84
APPENDIX
A SIBS AND SEBS COMBINED MEASURE .................................................................91
B IRB APPROVAL ............................................................................................................92
C CONSENT AND ASSENT FORMS ..............................................................................93
VITA ..............................................................................................................................................99
iv
ABSTRACT
Universal screening for emotional and behavioral risk in schools facilitates early identification
and intervention for students as part of multitiered systems of support. Because early intervention
has the potential to mitigate adverse outcomes of emotional and behavioral disorders and schools
are prime locations to reach at-risk youth, research on the technical adequacy and usability of
universal screeners to identify students for available school-based supports is vital. The purpose
of this study was to extend existing research by Cook et al. (2011) and Cook, Volpe, and
Gresham (2012) on the technical adequacy and usability of two universal screening measures,
the Student Internalizing Behavior Screener (SIBS) and the Student Externalizing Behavior
Screener (SEBS). Findings provided evidence for the reliability, concurrent validity, short-term
predictive validity, and usability of the SIBS and SEBS in a sample of elementary-school
students and their teachers. As a secondary focus, the technical adequacy and usability of the
SIBS and SEBS was compared to that of two well-researched universal behavior screening
measures. Results indicated that, in general, the SIBS and SEBS as a combined measure
performed similarly to the criterion screening measures.
1
CHAPTER 1
REVIEW OF LITERATURE
Need for Emotional and Behavioral Intervention in Schools
The difficulties of school-aged youth with emotional and behavioral disorders (EBDs)
may challenge the successful functioning of schools and put the youth themselves at risk for a
host of adverse academic and social outcomes (Gresham, 2005; King, Reschly, & Appleton,
2012). Of the approximately 1 in 5 school-age youth that at any given time experience emotional
and behavioral problems that meet criteria for a mental health disorder, only a small percentage
are identified and receive school-based support services (Costello, Mustillo, Erkanli, Keeler, &
Angold, 2003; National Association of School Psychologists [NASP], 2002; Walker, Severson,
& Seeley, 2010). This is surprising and disappointing given the prime opportunity for schools to
address the mental health problems of all school-aged youth (Levitt, Saka, Romanelli, &
Hoagwood, 2007). However, research investigating evidence-based prevention and intervention
practices for students with EBDs in schools, such as multitiered systems of support (MTSS) and
in particular school-wide positive behavior interventions and supports (SWPBIS), has grown
substantially. As a vital process in these systems, researchers continue to explore improvements
in accurately and efficiently identifying students with EBDs who may benefit from early
intervention supports provided in schools related to moderating adverse outcomes (Kamphaus,
Reynolds, & Dever, 2014; Levitt et al., 2007).
Students with Emotional and Behavioral Difficulties
Features of EBDs. Students with emotional and behavioral difficulties or disorders
exhibit various behavioral features, including internalizing and externalizing behavior patterns,
that contrast so significantly with what is typically acceptable that functioning is adversely
affected in domains such as interpersonal relations, academic achievement, and everyday
2
activities (Lane, Oakes, Menzies, & Germer, 2014; NASP, 2002). Externalizing behaviors are
overt, undercontrolled behaviors, which are directed outward toward the environment (Cook,
Volpe, & Gresham, 2012). Verbal and physical aggression are prime examples; other examples
in the school setting include disruptive behavior (i.e., talking out, getting out of one’s seat
without permission), rule breaking, temper tantrums, and noncompliance or defiance of
directives (Cook et al., 2012). Disorders commonly associated with externalizing behavior
patterns include attention-deficit/hyperactivity disorder (ADHD), oppositional defiant disorder,
and conduct disorder (American Psychiatric Association, 2013). In contrast, internalizing
behaviors are covert, overcontrolled behaviors, which are directed internally (Achenbach &
Edelbrock, 1978). Sadness, worry, fear, withdrawal, and somatic complaints are behaviors
related to mental health disorders, such as depression and anxiety (American Psychiatric
Association, 2013).
While both internalizing and externalizing behavior patterns are manifestations of EBDs,
the difference in the very nature of these behaviors commonly leads to inconsistencies in the
identification of risk. For example, because externalizing behaviors tend to disrupt instruction,
other students’ learning, social relationships, and the functioning of the classroom, students with
these difficulties are more likely to be identified by teachers and administrators for support
services (Lane, 2007; Lane et al., 2014). Conversely, students with internalizing behavior
patterns are more likely to be overlooked at school because they are “quiet” and thus less likely
to receive needed support services (Lane et al., 2014; Walker et al., 2010). Students with both
behavior patterns are in need of intervention for emotional and behavioral difficulties, as
negative outcomes related to school success and interpersonal functioning may occur.
3
Characteristics of Children with EBDs. The experiences and characteristics of students
with emotional and behavioral disorders have been examined in two milestone longitudinal
studies, the Special Education Elementary Longitudinal Study (SEELS) and the National
Longitudinal Transition Study-2 (NLTS2). These studies were conducted with support from the
U.S. Department of Education and provide data on a nationally representative sample of
approximately 22,000 students with disabilities served under IDEIA. These studies collected data
on students with disabilities from elementary to middle school (SEELS) and from high school to
early adulthood (NLTS2) by parent report and contribute to the development of a comprehensive
knowledge base and understanding of the academic, social, behavioral, and everyday
functioning, challenges, and characteristics of students with EBDs (Bradley, Doolittle, &
Bartolotta, 2008).
In a summary of these longitudinal studies, Wagner, Kutash, Duchnowski, Epstein, and
Sumi (2005) discussed student and household characteristics of students who qualified for
special education services under the Individuals with Disabilities Education Improvement Act
(IDEIA) category of Emotional Disturbance (ED). Seventy-five percent of students classified
with ED were males. Furthermore, significantly more African American students were identified
as ED than was representative of the percentage of African Americans in the school-age
population (27% versus 17%). Regarding socioeconomic status, 33% of elementary and middle
school students with ED lived in poverty, compared to the 16% of students living in poverty in
the school population. Students with ED were also found to be significantly more likely to live in
a single-parent household; that is, about 35% of elementary and middle school students with ED
were from a single-parent household, compared to only 26% of the school population.
4
Additionally, there were significantly more elementary and middle school students with ED with
an unemployed head of household (24%) than in the general population (17%).
In addition, the SEELS and NLTS2 studies shed light on the typical functioning of
students with ED in social, cognitive, and communication domains (Wagner et al., 2005). First,
students with ED were significantly more likely to have greater deficits in overall social skills
compared to their peers with other disabilities. They also more commonly had some specific
skills deficits than the general population, for example in self-control skills. According to parent
report, students with ED were found to have similar cognitive functioning relative to students
with other disabilities. Finally, while students with ED did not demonstrate more difficulties with
communication than other students with disabilities, a somewhat concerning percentage of
students were reported to have some trouble with speaking, carrying on a conversation, and
understanding what others say (27%, 35%, and 44%, respectively).
Outcomes Associated with EBDs. There are a myriad of adverse outcomes, both short-
and long-term, associated with emotional and behaviors disorders that affect not only the
students with EBDs inside and beyond the classroom, but also the other students in the classroom
and the functioning of the school (Gresham, 2005; Lane, 2007; Lane et al., 2014). There is a
strong body of evidence showing an association between behavior and academic achievement
(e.g., Caprara, Barbaranelli, Pastorelli, Bandura, & Zimbardo, 2000; Kamphaus et al., 2014;
Malecki & Elliott, 2002). For example, in a study by Bradley and colleagues (2008), 75% of
students with emotional and behavior problems performed below grade level in reading and 97%
performed below grade level in math. Poor academic engagement and poor work completion
have also been found to be associated with EBDs, as well as difficulties with social relationships
(Bradley et al., 2008; Lane et al., 2014). Not surprisingly, high rates of school failure are present
5
among students with EBDs; in fact, the majority of students with EBDs drop out of school
(Bradley et al., 2008). Students with EBDs also experience discipline procedures more
frequently, including suspensions and expulsions, and miss school more often (Bradley et al.,
2008; Lane, Carter, Pierson, & Glaeser, 2006; Wagner et al., 2005). In addition, the behavior of
students with EBDs can interrupt classroom instruction and interfere with the learning of all
students in the classroom (Lane, 2007).
Without intervention, these difficulties typically do not improve and result in poor long-
term outcomes, such as unemployment or poor employment due to challenges in social
interactions (Lane et al., 2014). In addition, the majority of students with EBD do not obtain
postsecondary education (Wagner et al., 2005). Other adverse outcomes include substance abuse,
suicide, and criminal behavior (Barkley, Fischer, Smallish, & Fletcher, 2004; Bradley et al.,
2008). The various negative outcomes associated with EBDs highlight the importance of early
identification of risk and the need for intervention. The provision of early intervention services
may moderate or prevent these negative outcomes (Feil, Severson, & Walker, 2002).
IDEIA and Emotional Disturbance. Unfortunately, far fewer children than the
prevalence of mental health difficulties would suggest are in need actually receive school-based
services. Herein, lies the need for research in determining how to identify and provide
intervention for students experiencing such difficulties. The Individuals with Disabilities
Education Improvement Act (IDEIA) of 2004 delineates 13 categories of disability. Students
ages 3-21 may be evaluated for specific categories and classified in order to receive special
education services for an educational disability. Emotional Disturbance (ED) is one of the special
education disability categories, under which students with emotional and behavioral difficulties
may be served. Special education services for these students might include: behavior intervention
6
plans implemented by school staff, consultation services for teachers and parents to facilitate
student functioning, parent training, and/or counseling for students.
To be eligible to receive services under the ED category, students must meet criteria
outlined in IDEIA. Students with ED must exhibit one or more of the following characteristics
over a long period of time and to a marked degree that adversely affects educational
performance: (a) an inability to learn that cannot be explained by intellectual, sensory, or health
factors; (b) an inability to build or maintain satisfactory interpersonal relationships with peers
and teachers; (c) inappropriate types of behavior or feelings under normal circumstances; (d) a
general pervasive mood of unhappiness or depression; or (e) a tendency to develop physical
symptoms or fears associated with personal or school problems. Children with schizophrenia
qualify, but children who are socially maladjusted are excluded, unless they are ED. Less than
1% of all children in school qualify for school-based services under Emotional Disturbance
(ED), and approximately 6% of all elementary- and middle-school children in special education
are classified under ED (Wagner et al., 2005). A considerable discrepancy exists between this
and the estimated 20% of children with significant mental health problems (Gresham, 2005),
which suggests that schools are under-identifying and under-serving a substantial number of
students.
Traditional Systems of Service Delivery
Despite the ideal opportunity to intervene with students, historically, schools have relied
heavily on the classroom management skills of general education teachers to manage students
with emotional and behavioral challenges (Walker et al., 2010). Parallel to traditional “refer-test-
place” methods for gaining special education services for students with academic difficulties,
schools operated under a “wait to fail” system to refer students with emotional and behavioral
7
problems for special education services (Walker et al., 2010). In order to be referred for an
evaluation to determine eligibility for special education services for Emotional Disturbance
(ED), students had to demonstrate a highly severe problems and a great need for services (Gerber
& Semmel, 1984; Kamphaus, DiStefano, Dowdy, Eklund, & Dunn, 2010). The system relied on
teachers to nominate or refer students for special education services, and the resulting
phenomenon was often that students with emotional and behavioral problems were not referred
until their behavior was no longer manageable or tolerable for the teacher (Gerber & Semmel,
1984). This method of referral allowed problems that started as minor challenges for a student to
develop into severe problems before services were provided, a system aptly named “wait to fail.”
Identification methods that delay identification of behavior problems is untenable because
problems that fail to be identified and treated early on may become more severe and/or more
difficult to remediate later (Del’Homme, Kasari, Forness, & Bagley, 1996; Gottlieb, 1991; Lane
et al., 2014), putting the students at risk for a host of negative outcomes both short- and long-
term.
Limitations of Reactive Referral Methods. “Wait to fail” methods of referral for school-
based services for ED often place the responsibility of nominating students for additional
services with the teacher (Gerber & Semmel, 1984). Teachers are likely to have excellent
knowledge and understanding of students’ behavior because of the extensive time together in the
classroom (Dowdy, Doane, Eklund, & Dever, 2011; Eklund et al., 2009). However, there are
several weaknesses related to solely utilizing teacher nominations for referral for additional
services, mainly related to inconsistent and inaccurate identification, as well as under-
identification of students (Dowdy et al., 2011; Kamphaus et al., 2010).
8
Because externalizing problems are more salient, cause more disruption to classroom
instruction, and lead to frustration when they cannot be managed effectively, teachers may be
more likely to refer students with externalizing behavior patterns (Dowdy et al., 2011; Walker et
al., 2010). In comparison, internalizing problems tend to be overlooked by teachers because they
do not disrupt the functioning of the classroom; therefore, students with internalizing behavior
patterns are often not referred and thus do not receive special education services (Feil et al.,
2002; Kauffman, 2001; Walker et al., 2010). Additionally, teachers often lack the training,
education, or knowledge regarding accurate identification of emotional and behavioral risk and
the threshold for when a problem has reached the severity level that indicates a need for
additional services (Tilly, 2008). Furthermore, teachers who do not have the skills to work
effectively with students at risk for emotional and behavioral problems may be more likely to
refer students than teachers with the appropriate behavior management skills (Dowdy et al.,
2011; Tilly, 2008).
Teachers also have different tolerance levels for student behavior and different
perceptions regarding emotional and behavioral problems, resulting in inconsistent identification
(Walker et al., 2010). In particular, teachers may believe schools are not responsible for
addressing emotional and behavioral problems (Eklund et al., 2009), or that some at-risk students
are still “teachable” while others are not (Gerber & Semmel, 1984). In some cases, referrals may
be driven by the desire to remove the student with disruptive behavior problems from the
classroom so that they can more easily teach the other students (Feil et al., 2002). Furthermore, a
referral process that relies on teachers is subject to bias. For example, male students’ behavior
problems may be construed as more severe than the same problems in females (Loades &
Mastroyannopoulou, 2010). In addition, disparities exist in the racial and ethnic makeup of
9
students in special education under ED (Skiba, Middelberg, & McClain, 2014). African
American and Native American students tend to be overrepresented (Donovan & Cross, 2002),
while Latino students may be underrepresented (Skiba et al., 2008).
Beyond teacher nomination, the use of office discipline referral (ODR) data is another
method for referring students for additional school-based services for emotional and behavior
problems. An office discipline referral (ODR) is a written report that documents a behavior
observed by a school staff member that a student exhibited in violation of a school rule, which is
typically followed by a consequence (Sugai, Sprague, Horner, & Walker, 2000). The most useful
ODR reports contain information on the problem behavior (operationally defined), the
antecedents and/or consequences, and the location of the incident. When ODR reports are well-
done, ODRs have the potential to serve as a built-in data collection system with treatment utility
that, beyond the report itself, provides information on the frequency of the problem behavior
(Sugai et al., 2000). Moreover, ODR data can serve as an indicator of a student’s overall
behavioral performance (Hawken, Vincent, & Schumann, 2008). The effectiveness of school-
wide behavioral supports may be investigated through the use of ODR data, and it may also be
examined within students to determine which students are in need of additional behavior
supports (Hawken et al., 2008). The following cut-off points for the number of ODRs a student
receives and its relation to additional intervention supports have been suggested: no additional
intervention necessary for students with 0-1 ODRs, Tier 2 interventions for 2-5 ODRs, and Tier
3 interventions for 6 or more ODRs (Horner, Sugai, Todd, & Lewis-Palmer, 2005).
While ODRs are beneficial as indicators of overall problem behavior in school and
provide useful school- and student-level data, there are several limitations when used as a
screening measure. First, the assignment of an ODR to a student may be influenced by a
10
teacher’s subjectivity, a problem similar to that of teacher nominations for additional support
services, leading to inconsistency and variability in when and for what offenses students are
assigned ODRs, even within the same school (Hawken et al., 2008; King et al., 2012; McIntosh,
Frank & Spaulding, 2010). Since behavior supports in some schools are provided based on the
number of ODRs a student earns, inconsistency in their assignment to students may result in
under- or over-identification of students for supplemental behavior supports. Second, because of
the nature of internalizing behaviors, students with these patterns of behavior often do not earn
ODRs (Lane et al., 2014). In a system that relies on ODRs for referral for additional services,
students with internalizing behavior problems, such as anxiety and depression, are unlikely to be
identified or treated (Kauffman, 2001). Third, when ODRs are used for screening purposes,
students must necessarily demonstrate the problem behavior on several occasions or at a high
intensity in order to gain support services (King & Reschly, 2014).
A confluence of the factors described above related to teacher referrals or office
discipline referrals (ODRs) often leads to the under-identification of some groups of students
(i.e., those with internalizing behavior patterns, minorities), the over-identification of other
groups (i.e., minorities, boys), and the inconsistent identification of all students (i.e., due to
teacher tolerance, skills, and beliefs; Lane et al., 2014; Walker et al., 2010). Ultimately, the key
limitation of reactive referral methods, such as teacher nominations or ODRs, is that they often
fail to identify students early, if at all, for the school-based support services that can moderate or
prevent the negative outcomes associated with EBDs (Eklund et al., 2009). It is often the case
that the students with the highest risk for EBDs fail to be identified for additional services
(Kamphaus et al., 2010). Ironically, school practices seem to suggest that schools are concerned
about referring an excessive number of students with EBDs, but they do not seem similarly
11
concerned regarding the under-identification or late referral of students with EBDs (Feil et al.,
2002).
Early Identification and Intervention
Early identification of behavioral and emotional risk is key to improving outcomes for
students (Walker et al., 2010). Behavioral and emotional risk is defined by the presence of early
symptoms of disorders that over time may lead to special education placement or mental health
diagnosis and treatment (O’Connell, Boat, & Warner, 2009). It is clear that schools have the
opportunity to address behavioral and emotional risk by implementing systems that identify at-
risk students early and provide interventions targeted at remediating the current problem or
symptoms and preventing negative, distal outcomes and the development of more severe
problems (Dowdy et al., 2011; Levitt et al., 2007). Even though the positive impact of early
identification and intervention is well-documented (Walker & Shinn, 2002), schools have been
somewhat slow to adopt and fully implement such systems for emotional and behavioral
problems, as compared to prevention-based systems for academic difficulties (Hawken et al.,
2008; Feil et al., 2002).
Universal screening for emotional and behavioral risk may be the proactive solution to
promote accurate, consistent, and early identification of at-risk students. To explore this
assertion, several studies have compared teacher nomination and ODR referral methods to
universal screening procedures in relation to identification of students at-risk for emotional and
behavioral problems. A study by Dowdy and colleagues (2011) compared teacher nominations to
universal screening data for detecting at-risk students and found that the Behavioral and
Emotional Screening System (BESS), a universal screening measure completed by the teacher,
resulted in significantly greater identification of students as at-risk compared to teacher
12
nominations (24.1% versus 17.7%). In addition, teachers nominated significantly more males
and fewer females compared to the results of the BESS. As an illustration of the variability
between teacher nominations and universal screening methods, only 10.4% of the students were
detected by both methods. In a study by Eklund and colleagues (2009) that also compared
teacher nominations to universal screening, the results showed that although 23% of students
were identified by both methods, an additional 27% of students were detected by the BESS but
not by teacher nominations, suggesting an improved ability of the universal screening measure to
detect risk over teacher nominations.
In a study of 1,974 students in grades 1-8 that investigated the relationship between
school nominations, ODRs, and universal screening measures (BESS and SSIS-Performance
Screening Guide), results showed inconsistent identification rates by screening method (Miller,
Cohen, Chafouleas, Riley-Tillman, Welsh, & Fabiano, 2014). School nominations (i.e., referral
for intervention or currently receiving intervention) resulted in the fewest number of students
identified, at just 5% of the students. School nomination and ODR methods did not identify
students at significantly different rates. In addition, the relationship between ODRs and universal
screening methods was weak; specifically, Pearson’s r correlation coefficients ranged from -.01
to -.06. Results indicate the need for schools to carefully consider which screening method they
will use to identify at-risk students because different methods will likely lead to different rates of
identification for supplemental services (Miller et al., 2014).
IDEIA and Prevention. In the last decade and a half especially, school-based practices
promoting early identification of students’ behavioral difficulties have been heavily promoted by
multiple federal government agencies, organizations, and legislation, such as the No Child Left
Behind Act of 2001 (Walker et al., 2010). The National Research Council also endorsed early
13
identification (i.e., universal screening of students) in combination with multitiered interventions
(Walker et al., 2010). Finally, the Individuals with Disabilities Education Improvement Act
(IDEIA, 2004) highlights the importance of early identification for students in need of both
academic and behavioral supports for the purpose of diminishing the need for special education
services at a later time (Walker et al., 2010). Specifically, IDEIA (2004) describes the schools’
obligation to establish systems that effectively identify which students need additional supports
and which do not. Under IDEIA, local education agencies may allocate up to 15% of their
available funding for practices that engender prevention through early identification and
intervention (Walker et al., 2010).
Multitiered Systems of Support. As an alternative to “wait to fail” systems that enable
the further development of problems before services are provided, the premise of response to
intervention (RTI) or multitiered systems of support (MTSS) is prevention by early identification
and evidence-based intervention (Batsche et al., 2005; Lane et al., 2014). These systems have
historically focused on academic difficulties and supports (Batsche et al., 2005), but their
foundation and key features should logically serve students with EBDs equally well (Hawken et
al., 2008). Even though MTSS can serve as a method for making eligibility decisions for special
education services, it is increasingly being utilized as a proactive means for providing all
students with supports that match the intensity of their needs (Gresham, 2004). The foundational
features of MTSS include: (a) provision of multiple tiers or levels of intervention; (b) problem-
solving methodology to determine intensity of intervention; (c) use of evidence-based
interventions; (d) utilization of progress monitoring data to inform intervention; (e) data-based
decision making related to student progress; and (f) assessment for multiple purposes, including
screening, diagnosis, and progress monitoring (Batsche et al., 2005). Implementation of school-
14
wide positive behavior interventions and supports (SWPBIS) parallels MTSS in that both
systems provide multiple tiers of support matched to the intensity of the problem (Hawken et al.,
2008).
One of the critical features of MTSS is identifying which students continue to
demonstrate behavioral and emotional risk despite implementation of school-wide behavior
supports and who are in need of additional supports (Lane et al., 2014). MTSS requires
identifying the intensity of students’ needs in order to determine the intensity or tier of
intervention and provide the appropriate services (Glover & Albers, 2007; Kamphaus et al.,
2014; Walker et al., 2010). To efficiently accomplish the objective of early identification and
intervention, schools should make use of systematic and structured approaches, such as universal
screening procedures, that assess all students for risk (Dowdy et al., 2011; Glover & Albers,
2007). Despite being integral to providing early intervention, universal screening is still
considered a relatively new means for referring students for supplemental interventions (Glover
& Albers, 2007).
Universal Screening
Universal screening in the behavioral domain is designed to detect at-risk students early
so that schools can provide the appropriate interventions (Walker et al., 2010). Universal
screening involves administering a relatively brief measure to all students for the purpose of
gathering data that allows inferences about students’ future performance (Albers & Kettler,
2014). Universal screening measures accomplish several objectives: identifying students at-risk
behaviorally or emotionally, providing data that inform intervention and the necessary intensity
of it, and assessing the effectiveness of school-wide programs, such as SWPBIS (Kettler, Glover,
Albers, & Feeney-Kettler, 2014; Walker et al., 2010). An approach to identification of risk, such
15
as universal screening, has the potential to more accurately determine which students need
additional supports and provide them early, as compared to traditional teacher referral methods
(Dowdy et al., 2011). Furthermore, universal screening seems an especially useful means for
identifying at-risk students early given research that suggests that universal screening tools can
effectively predict the emotional and behavioral outcomes of students (Kamphaus & Reynolds,
2007).
Universal screening for emotional and behavioral risk has been researched and advanced
by experts and organizations for several decades (Reynolds, 1979; Walker et al., 2010).
However, the widespread use and appropriate implementation of universal screening has yet to
occur, despite the popularity of similar procedures for academic concerns and the development
of technically-adequate universal screening measures for emotional and behavioral problems
(Kamphaus et al., 2014; Walker et al., 2010). Moreover, universal screening for academic
difficulties and hearing and vision problems has become commonplace in schools, while
identifying students with emotional and behavioral risk has not been as highly prioritized
(Severson, Walker, Hope-Doolittle, Kratochwill, & Gresham, 2007). Estimates of the prevalence
of universal screening for emotional and behavioral risk suggest that as few as 2% of schools
engage in universal screening processes for early identification and intervention for students with
EBDs (Romer & McIntosh, 2005).
Barriers to Universal Behavior Screening Adoption. The value of early identification of
emotional and behavioral risk and the provision of intervention for students begs the question:
Why are schools not immediately embracing universal screening for emotional and behavioral
risk, as they have for academic deficits, and implementing it in accordance with research? As
with any new system, schools are likely to face barriers to successful implementation, which may
16
prevent initial adoption of the system as well. Common barriers to implementation of universal
screening are related to competing demands, philosophical reasons, teacher or parent resistance,
or a combination of these. First, schools continually manage numerous demands, including
financial limitations and academic accountability (Walker et al., 2010). Competing demands may
result in resistance to adoption of a system like universal screening or adoption with poor
implementation. For example, schools may be concerned that universal screening will result in
the identification of more at-risk students than the school has the resources available to provide
interventions for (Walker et al., 2010). Second, schools have been increasingly held accountable
for the academic performance of all students, which may lead to the allocation of resources to
focus solely on academic intervention. Third, schools may not pursue implementation of
universal screening because they do not buy into the belief that schools are responsible for
addressing the mental health problems of their students (Gresham, 2005; Walker et al., 2010).
Fourth, teachers or other school staff may resist implementation of universal screening
for a variety of reasons (Walker et al., 2010). For example, teachers may believe that completing
universal screening measures requires too much extra effort and time. Furthermore, teachers may
prefer using their judgment in determining which students are at-risk, as they believe they know
their students well enough to render universal screening unnecessary (Walker et al., 2010).
Teachers and parents may also be concerned about the stigma attached to students who are
identified and labelled by universal screeners as having emotional and behavioral problems and
subsequently referred for additional supports (Levitt et al., 2007). All of these barriers highlight
the importance of educating schools and families on the value of universal screening, especially
of early identification and intervention, and on the availability of technically adequate, cost
effective, and brief universal screening measures (Levitt et al., 2007; Walker et al., 2010).
17
There is, however, newfound interest from schools and other stakeholders in universal
screening for emotional and behavioral risk due to recent developments (Albers & Kettler, 2014;
Kamphaus et al., 2014). First, there is a growing body of evidence that shows that students
identified with ED by schools are at-risk for adverse outcomes, both inside and outside of school
(Kamphaus et al., 2014). School tragedies, such as school shootings and other violence, have
captured the national spotlight and highlighted the importance of detecting risk and addressing
students’ mental health needs (Severson et al., 2007). With the increased popularity of MTSS,
including RTI, as a means for early intervention, universal screening has necessarily become
more prevalent as a complementary method that identifies students for the available intervention
services (Albers & Kettler, 2014; Glover & Albers, 2007; Kamphaus et al., 2014). Lastly, there
are currently a sufficient number of available universal screening measures that are both
psychometrically-sound and feasible for schools to administer, in terms of time, cost, and
resources (Kamphaus et al., 2010; Kamphaus et al., 2014).
Considerations in Selecting Universal Screening Measures. Because there are a variety
of universal screening measures available, schools should evaluate screeners according to
criteria, such as technical adequacy and usability (Albers & Kettler, 2014; Glover & Albers,
2007; Lane et al., 2014). Evidence of technical adequacy that should be examined by school
psychologists or school administrators includes: normative sample demographics, reliability, and
validity (accurate identification). When the appropriate considerations are made in selecting a
universal screening measure, the accuracy of score interpretations may be improved (Lane et al.,
2014).
Regarding norms, schools should compare the normative sample on which the measure
was standardized to the school’s population. If the population of the school is adequately
18
represented in the normative sample, meaningful interpretations may be made (Glover & Albers,
2007). When available, local norms are ideal for providing additional interpretation of a
student’s performance in relation to the specific population of the school (Glover & Albers,
2007). The recency of the norms and the adequacy of the sample size are additional criteria to
assess for a screening measure under consideration (Glover & Albers, 2007).
Additionally, evidence of the consistency of scores on a measure should be examined
across items within the measure, time, and raters, via reliability estimates (Albers & Kettler,
2014; Salvia & Ysseldyke, 2004). Internal consistency reliability coefficients, such as coefficient
alpha, provide an estimate of the relationship among the scores or responses across items on a
measure (American Educational Research Association [AERA], American Psychological
Association [APA], & National Council for Measurement in Education [NCME], 1999; Salvia &
Ysseldyke, 2004). Test-retest reliability indicates the consistency of scores, or the correlation
between scores, on a measure from one administration to the next (AERA et al., 1999; Salvia &
Ysseldyke, 2004). Test-retest reliability coefficients may be lower than internal consistency
estimates because of individual changes over time or the provision of intervention services
between administrations of a measure (AERA et al., 1999; Salvia & Ysseldyke, 2004). Finally
interrater reliability estimates the agreement between informants who complete the same
measure on an individual (AERA et al., 1999; Salvia & Ysseldyke, 2004). Reliability
coefficients range from 0 to 1, where higher values suggest better consistency (Glover & Albers,
2007). For screening purposes, reliability coefficients around .70 or .80 are considered
acceptable because decisions based on interpretation of screening scores are not high-stakes
(Albers & Kettler, 2014; Reynolds & Livingston, 2014). Evidence in support of reliability should
19
be examined initially before validity evidence because a measure cannot be valid if it is not
reliable (Albers & Kettler, 2014).
In the Standards for Educational and Psychological Testing, AERA et al. (1999)
describes five types of validity evidence that a measure accurately assesses its intended
construct. These include content validity, validity based on response processes, internal structure
validity, validity based on relations to other variables, and consequential validity. Validity based
on relations to other variables is commonly known as criterion-related validity and indicates the
degree to which scores on a measure predict scores on a related criterion variable (Albers &
Kettler, 2014; Glover & Albers, 2007). Evidence for criterion-related validity is frequently used
to evaluate psychological and educational assessments because the relationship between
performance on a measure like a universal screener and critical outcomes, such as academic
failure or special education classification, demonstrates the value in screening to identify
students who may be at risk for poor outcomes (Albers & Kettler, 2014). Predictive and
concurrent validity are two types of criterion-related validity that provide important information
to individuals evaluating various screening measures (Salvia & Ysseldyke, 2004).
Predictive validity of screening measures refers to the ability of the measure to predict
which individuals will develop emotional or behavioral difficulties or disorders (Glover &
Albers, 2007). Several indices are typically calculated as indictors of the diagnostic or
classification accuracy of a measure, known as conditional probability, which is particularly
critical to evaluate with screening measures (Albers & Kettler, 2014). The possible outcomes of
screening for individuals are defined by two dichotomies: whether or not individuals are
identified as needing intervention by the screening measure and whether or not individuals are
truly in need of intervention (Albers & Kettler, 2014). Although an individual’s true need for
20
intervention is hypothetical, it is assessed by administering a well-researched, comprehensive
measure of the same construct (Albers & Kettler, 2014). Consideration of these two dichotomies
may best be conceptualized as a matrix of four possible categorical outcomes of screening: true
positive (correctly identified as needing intervention), false positive (incorrectly identified), false
negative (not identified but in need of intervention), and true negative (correctly identified as not
needing intervention; Albers & Kettler, 2014; Glover & Albers, 2007).
Based on the categorical outcomes, conditional probability indices may be calculated.
The sensitivity index indicates the proportion of students who were correctly identified by the
screening measure as at-risk (i.e., in need of intervention) compared to all the students who were
at-risk, as determined by the outcome measure (Albers & Kettler, 2014; Glover & Albers, 2007;
Lane et al., 2014). Poor sensitivity suggests the measure under-identifies at-risk students (Glover
& Albers, 2007). The specificity index indicates the proportion of students who were correctly
identified by the screening measure as not at-risk compared to all the students who were not at-
risk based on the outcome measure (Albers & Kettler, 2014; Glover & Albers, 2007; Lane et al.,
2014). Positive predictive power is the proportion of students who were correctly identified as at-
risk on the screening measure compared to all the students who were identified by the screening
measure, and the negative predictive power is the proportion of students who were correctly
identified as not at-risk on the screening measure compared to all the students who were not
identified by the screening measure (Albers & Kettler, 2014; Glover & Albers, 2007; Lane et al.,
2014). Low positive predictive power suggests the measure over-identifies students as at-risk
(Glover & Albers, 2007). Although not all the indices may be simultaneously maximized for a
screening measure (Albers & Kettler, 2014), it is important to consider all the indices in light of
the resources available to the school and the severity of the problem and its associated outcomes
21
(Glover & Albers, 2007). There are two additional indices that indicate the effectiveness of the
screening measure and the prevalence of risk, but careful consideration must be given to their
interpretation (Glover & Albers, 2007). The hit rate provides an indication of the accuracy of a
measure in classifying students into risk and not-at-risk categories (i.e., percentage of true
positives and true negatives out of the total number students; Glover & Albers, 2007; Lane et al.,
2014). The base rate estimates the prevalence of risk and is calculated by comparing the rate of
true positives and the false negatives to the total number of students assessed (Lane et al., 2014).
In addition to evidence of reliability and validity, schools should evaluate the usability of
screening measures, given that poor usability may serve as a barrier to implementation of a
universal screening process in schools (Walker et al., 2010). In terms of the feasibility of a
screening measure, cost of the measure, time to administer, effort to complete, and fit with
available school-based services should be considered (Glover & Albers, 2007; Harrison,
Vannest, & Reynolds, 2013; Walker et al., 2010). Cost of a measure, including cost of the startup
package, forms, and software, should be deemed appropriate for the benefits incurred from their
use (Glover & Albers, 2007; Harrison et al., 2013). Administration of the measure should not
place an undue burden on staff time or take time from teacher instruction (Glover & Albers,
2007). Indicators of the time required to complete a measure include: the number of items,
administration time, and the length of time to score and interpret the measure (Harrison et al.,
2013). Related to the consideration of time, completion of a screening measure should not
require extensive effort to understand the instructions or to complete (Glover & Albers, 2007;
Walker et al., 2010). Finally, schools should consider the sensitivity and positive predictive
power of a measure and ascertain whether they have the resources available to accommodate the
22
number of students likely to be detected by the measure (Glover & Albers, 2007; Walker et al.,
2010).
Furthermore, the various stakeholders in a school should find the measure acceptable
(Glover & Albers, 2007). Overall, measures may be considered acceptable to teachers and staff if
they believe that the benefits are greater than the cost, time, and effort required to complete
administration (Glover & Albers, 2007). In addition, acceptability may be improved if the
universal screening process and the target of the measure in particular are aligned with the
school’s mission (Walker et al., 2010). For example, when remediation of the target of the
measure (i.e., internalizing and externalizing behaviors) is valued by the stakeholders and they
find the data provided by the measure useful, they may find participation in the screening process
more acceptable (Glover & Albers, 2007; Harrison et al., 2013). Lastly, data from the screening
measure should possess treatment utility, in that results from the screening contribute to
development of the intervention and outcomes (Cook, Volpe, & Livanis, 2010; Hayes, Nelson, &
Jarrett, 1987; Walker et al., 2010). All of these factors contribute to “buy in,” which may be
important for appropriate implementation of the universal screening process (Glover & Albers,
2007).
Schools should also considered the fit of a screening measure with the existing school
infrastructure and population of students and personnel (Glover & Albers, 2007; Harrison et al.,
2013). Conducting universal screening requires time and personnel resources to administer the
screening measure, and score and interpret the data (Glover & Albers, 2007). For schools that
have an existing structure in place for early identification and intervention, such as MTSS for
academics and/or behavior, adoption of a universal screening process for emotional and
behavioral risk is likely to be easier than for a school without such infrastructure. For example,
23
the training of school staff for administration and interpretation is a vital component of universal
screening (Harrison et al., 2013), but less training may be necessary for a school already
implementing MTSS for academics. Not only should schools assess the fit of a measure with
existing infrastructure, but they should also assess how appropriate a measure is for the student
population, whether the measure provides for accommodations for students with disabilities or
for students whose first language is not English (AERA et al., 1999; Harrison et al., 2013).
Implementation of Universal Screening. There are a number of practical considerations
that schools must address in order to implement universal screening successfully, such as the
approach to screening, timing of administration, parental permission, and data security
(Kamphaus et al., 2014; Lane et al., 2014; Walker et al., 2010). The universal screening approach
most commonly recommended is multiple gating, which involves screening all students initially
with a brief measure and progressively administering additional, more intensive assessments to
students who continue to be identified as at risk at each stage of assessment (Albers & Kettler,
2014; Lane et al., 2014). The advantage of multiple-gating approaches is that a smaller sample of
students is detected with improved accuracy at each stage, also making the approach cost-
effective and time-efficient (Albers & Kettler, 2014; Lane et al., 2014; Walker & Severson,
1992). Multiple-gating approaches are consistent with multi-method, multi-informant assessment
methodology in that each stage may employ different informants (i.e., teacher, parent, student)
and/or different methods (i.e., screeners, broadband behavior rating scales, observations; Lane et
al., 2014). Albers and Kettler (2014) provided a description of a multiple-gating approach to
universal screening for emotional and behavioral problems. First, the teacher completes a
universal screening measure on all students, by ranking students on problem behavior. Next, the
teacher completes a standardized, broadband behavior rating scale, such as the Behavior
24
Assessment System for Children – Second Edition (BASC-2), on the five highest-ranked
students from the first phase of assessment. Finally, for students who are detected as at-risk by
the broadband rating scale, systematic, direct observations are conducted by the school
psychologist and parents complete the parent-report form of the BASC-2. The Systematic
Screening for Behavior Disorders (SSBD; Walker & Severson, 1992) is a well-researched
multiple-gating approach to universal screening that is prepackaged and comprised of brief
teacher ratings on all students’ externalizing and internalizing behaviors, followed by more in-
depth rating scale assessments on the three highest-ranked students on internalizing and
externalizing behaviors from the first phase, and finally systematic, direct observations of the
students who are detected as at-risk during the second phase.
Another practical consideration is when to administer universal screening measures and
how often. Lane et al. (2014) recommend administering universal screening measures three times
per year, once in the fall, winter, and spring. Fall screenings should be completed about 6-8
weeks into the school year to ensure that teachers have had the opportunity to sufficiently
observe students’ behavior, and winter screenings should be administered before the winter
break (Lane et al., 2014). Conducting multiple universal screenings throughout the year is
advantageous as part of multitiered systems of support (MTSS) because it provides multiple
opportunities at regular intervals to identify students for Tier 2 and 3 intervention supports and
determine whether students have responded to intervention (Lane et al., 2014). Kamphaus et al.
(2014) also recommend screening students soon after they enroll in a new school and at key
transition points in students’ education, including entry into middle and high school.
In order for schools to conduct universal screening procedures responsibly, they must
consult federal and state regulations regarding parental consent and child assent, such as the
25
Protection of Pupil Rights Amendment of 1978 (Lane et al., 2014; Levitt et al., 2007). Beyond
the federal level, guidelines differ across states and districts as to whether parental consent may
be active or passive or whether screening procedures are integral to normal educational practices
and thus do not require parental consent (Kamphaus et al., 2014; Lane et al., 2014). With active
consent, parents must sign and return a permission form that includes explanation of the
procedures. Passive consent requires parents to sign and return a permission form only if they
decline their child’s participation in the universal screening procedures; if the form if is not
returned, parental permission is assumed (Kamphaus et al., 2014; Lane et al., 2014). Alongside
the consent process, schools should provide parents with information about the screening process
and school-based student services, as well as opportunities to ask questions about the process and
the screening results (Levitt et al., 2007). An advantage of obtaining active parental consent is
that it ensures parental support in the process (Walker et al., 2010). Unfortunately consent from
parents whose children demonstrate the most difficulties may be more challenging to obtain
(Levitt et al., 2007; Severson & Ary, 1983).
A final consideration when developing universal screening procedures is data security of
the screening measures and results. It is vital that schools can maintain the privacy and
confidentiality of students’ data so that they do not violate students’ rights (Lane et al., 2014;
Walker et al., 2010). Teachers should be trained in the importance of data security and
procedures for maintaining confidentiality, such as restricting discussion of screening results to
faculty meetings (Lane et al., 2014). Procedures may also be built into the screening process to
maintain confidentiality; for example, administration of screening may occur on secure network
drives or websites or take place in faculty meetings (Lane et al., 2014). Schools should construct
a plan for training teachers and maintaining data security and confidentiality (Levitt et al., 2007).
26
Available Universal Screening Measures. Universal screening is not a recent innovation;
in fact, the need for it was suggested more than three decades ago by researchers and experts
(Albers & Kettler, 2014; Reynolds, 1979). Universal screening measures have been around for as
long (Cowen et al., 1973), with the majority developed in the past two decades (Glover &
Albers, 2007; Lane et al., 2014). Universal screening has become increasingly popular in schools
with the widespread promotion and adoption of multitiered systems of support that are
predicated on early identification (Kamphaus et al., 2014).
There are a variety of measures available that screen for emotional and behavioral risk
(Glover & Albers, 2007). Given that there is not a single, “gold standard” universal screener
recommended by experts, schools are tasked with selecting the screening measure among those
available that best meets the school’s needs (Lane et al., 2014). Some of the universal screening
measures available for assessing emotional and behavioral risk include: BASC-2 Behavioral and
Emotional Screening System (BESS; Kamphaus & Reynolds, 2007), Social Skills Improvement
System – Performance Screening Guide (SSIS-PSG; Elliott & Gresham, 2007), Systematic
Screening for Behavior Disorders (SSBD; Walker & Severson, 1990), Strengths and Difficulties
Questionnaire (SDQ; Goodman, 1997), and Student Risk Screening Scale (SRSS; Drummond,
1994). For comprehensive descriptions of the SSBD, SDQ, and SRSS universal screening
measures and a review of their empirical support, the author recommends referencing Lane and
colleagues (2014). Research on the BESS and SSIS-PSG is presented below to facilitate
comparison between screening measures; however, ultimately, schools must determine which
screening measures best suit their resources and needs.
The Behavioral and Emotional Screening System (BESS; Kamphaus & Reynolds, 2007)
is the universal screening measure component of the Behavioral Assessment System for Children
27
(2nd Edition). The BESS is designed to assess internalizing and externalizing behavior problems,
school problems, and adaptive skills for students in grades kindergarten through 12. There are
three informant reports, one for teachers, parents, and students (for grades 3-12), that each
contain 25-30 items and can be completed in about 5 minutes. Items are rated on a 4-point Likert
scale (Never, Sometimes, Often, or Almost Always) to indicate the frequency of an observed
behavior. The ratings are summed and compared to a normative sample of 12,350 students across
40 states to produce a single T-score (M = 50, SD = 10). Higher T-scores suggest greater risk for
emotional and behavioral problems, with scores being classified into the categories normal (T-
scores 20-60), elevated (T-scores 61-70), or extremely elevated (T-scores above 70). In addition,
there are three indices to suggest whether there is concern regarding the validity of an
informant’s ratings. These include indices to detect an overly similar pattern of responses,
inconsistent responses to similar items, and heavily negative responses. The BESS may be
completed on paper and hand-scored or computer-scored with the appropriate software or
completed and scored electronically through AIMSweb electronic assessment and data
management system (NCS Pearson Education, 2012). The initial kit is available for
approximately $135; other costs may include scoring software, extra forms, and/or the web-
based system.
Evidence for the technical adequacy of the BESS was demonstrated by Kamphaus and
Reynolds (2007). Findings showed good internal consistency (.96 for teachers, .94 for parents,
and .92 for students), test-retest reliability (.80-.91), and interrater reliability (.71-.83).
Convergent validity of the BESS was also demonstrated with multiple criterion measures,
including the Achenbach System of Empirically Based Assessment (ASEBA; .71-.77) and
Connor’s rating scales (.51-.78). Furthermore, King et al. (2012) found that, in a sample of 496

28
elementary-school children, scores on the teacher report form of the BESS were correlated with
scores on the BASC-2 and the ASEBA Teacher Rating Form (Achenbach & Rescorla, 2001).
Renshaw and colleagues (2009) found that, in a sample of 48 third and fourth graders, scores on
the BESS had concurrent validity with academic, behavioral, and engagement (i.e., academic
effort) indicators, as assigned by teachers in students’ report cards. Specifically, students’ risk
classification according to their BESS scores were significantly correlated with their academic
(-.55), behavioral (-.51), and engagement (-.61) report-card scores.
Predictive validity of the BESS was examined in a study of 492 elementary school
students by King and Reschly (2014). Results showed that scores on the BESS in the fall
significantly correlated with academic (i.e., oral reading fluency on Dynamic Indicators of Basic
Early Literacy Skills and a statewide criterion-referenced test) and behavioral (i.e., ODRs,
suspension, and attendance) outcomes in the spring. In a study of 694 sixth- and seventh-grade
students by Chin, Dowdy, and Quirk (2013), BESS scores significantly predicted whether or not
students earned ODRs, suspensions, and unsatisfactory behavioral grades. Also, students
classified into the extremely elevated risk group exhibited greater percentages of ODRs,
suspensions, and unsatisfactory behavioral grades than in other risk groups. Similar results were
found by King et al. (2012) in a sample of elementary-school students; significant differences
were found among BESS risk classification groups on oral reading fluency measures, ODRs,
suspensions, and attendance. Results from a longitudinal study by Kamphaus and Reynolds
(2007) revealed that BESS teacher scores predicted academic performance 4 years later,
providing preliminary evidence for the long-term predictive validity of the BESS. Overall,
research on the BESS provides significant evidence in support of adequate reliability, concurrent
validity, and predictive validity.
29
The Social Skills Improvement System – Performance Screening Guide (SSIS-PSG;
Elliott & Gresham, 2007) is another universal screening measure that not only assesses
behavioral indicators of school performance (Prosocial Behavior and Motivation to Learn), but
also academic indicators (Reading and Math Skills). The SSIS-PSG is part of the Social Skills
Improvement System (SSIS), which supports social skills assessment and intervention in a
multitiered model. There are versions of the SSIS-PSG created for preschool, elementary, and
secondary students. To complete the SSIS-PSG, teachers rate students in four skill domains,
including Prosocial Behavior, Motivation to Learn, Reading Skills, and Math Skills. At the
elementary level, students are assigned a single rating for each domain from 1-5 based on their
current functioning. Descriptions of performance levels or observed behaviors and skills in each
domain are provided to anchor ratings. Ratings correspond to risk levels as follows: 4 or 5
indicates expectations are met based on age and grade level, 2 or 3 indicates moderate concern or
difficulty, and a 1 suggests high concern or risk. Ratings may be linked to intervention in that
students with a low rating in a particular domain can be identified for additional supports
targeted at that domain. Teachers with a typical class size can expect to complete the SSIS-PSG
on all students in about 30 minutes. Forms are available for purchase; a pack of 10 forms to
screen 10 classrooms costs about $45.
The SSIS-PSG standardization studies by Elliott and Gresham (2007) included data from
138 teachers from preschool to high school on all of their students. In a subset of 25 teachers and
543 students, strong to moderate evidence of reliability was demonstrated with test-retest
reliability coefficients from 0.68 to 0.74 and interrater reliability coefficients between .55 and .68
for elementary-aged students. Teachers indicated that the behaviors assessed by the SSIS-PSG
were important and that the measure was easy to understand and complete. In addition, evidence
30
for concurrent validity of the SSIS-PSG with the teacher version of the more comprehensive
SSIS-Rating Scales (SSIS-RS) was indicated by a negative correlation between SSIS-PSG
ratings and the Problem Behaviors subscale on the SSIS-RS and also by positive correlations
between ratings on the SSIS-PSG Reading Skills, Math Skills, and Motivation to Learn domains
and scores on the SSIS-RS Social Skills subscale. The predictive validity of the SSIS-PSG was
explored in a study by Kettler, Elliott, Davies, and Griffin (2011) on a sample of 360 third- and
fifth-grade students in Australia. Results indicated that SSIS-PSG and SSIS-RS scores predicted
students’ performance on Australia’s national achievement test. The SSIS-PSG, although not
generating the large number of studies that the BESS has at present, still demonstrates evidence
for technical adequacy and usability.
Benefits of the SIBS and SEBS. The Student Internalizing Behavior Screener (SIBS;
Cook et al., 2011) and Student Externalizing Behavior Screener (SEBS; Cook et al., 2012) are
two universal behavior screening measures more recently developed. There is preliminary
research to support the technical adequacy and usability of these measures that provides promise
for their use in schools. When compared to the other available behavior screening measures, the
prime benefits of the SIBS and SEBS to schools is that they are available at no cost, yet still
assess a range of emotional and behavioral difficulties. Given schools’ limited resources, if the
SIBS and SEBS demonstrate evidence for adequate psychometric properties and usability,
schools may highly prefer to adopt them for universal behavior screening procedures.
The Student Internalizing Behavior Screener (SIBS; Cook et al., 2011) was designed to
identify students at-risk for internalizing behavior disorders in particular. To complete the SIBS,
teachers rate all students on seven internalizing behavior items, which research and experts
suggest are associated with various negative outcomes. A 4-point Likert scale (Never,
31
Rarely/Seldom, Occasionally/Moderately, Frequently/Almost Always), corresponding to the
perceived frequency of behavior, is used to rate students, with total scores falling in a range from
0-21. Items assess the following behavioral domains: anxiety, bullying victimization, isolation or
rejection by peers, excessive time spent with adults rather than peers, withdrawal, sadness, and
somatic complaints. Students who score higher on the SIBS display a greater number of and/or
more frequent internalizing behavior problems.
Initial research on the SIBS (Cook et al., 2011) was conducted with a sample of 1,357
elementary-school students in the Western region of the United States. Evidence for reliability of
the SIBS was demonstrated by adequate internal consistency (Cronbach’s alphas of .81 and .79)
and good test-retest reliability (r = .74). Furthermore, evidence of the convergent validity of the
SIBS was indicated by a strong correlation with the ASEBA Teacher Report Form Internalizing
scale (r = .82; Achenbach & Rescorla, 2001). Divergent validity was established by significantly
different correlations with the Student Risk Screening Scale (SRSS; Drummond, 1994), which
assesses externalizing behaviors, versus the ASEBA Teacher Report Form, which assesses
internalizing behaviors as on the SIBS. A ROC curve analysis supported the following cut off
scores: 8 or more points signifies “at-risk,” 4 to 7 points is “on the radar,” and 3 or fewer points
suggests no risk.
The Student Externalizing Behavior Screener (SEBS; Cook et al., 2012) was designed as
the counterpart to the SIBS, in that it assesses externalizing behavior patterns while the SIBS
assesses internalizing behavior patterns. Administering the measures in conjunction allows for
identification of risk for a comprehensive range of emotional and behavior problems. In contrast
to the SRSS, which assesses antisocial, externalizing behaviors, the SEBS was developed for the
purpose of providing more objective, well-defined behaviors. The seven items on the SEBS
32
comprise key indicators of externalizing behavior patterns that were selected following a review
of the research and expert opinion. Items assess the following behavioral domains: defiance or
opposition to adults, aggression, bullying perpetration, difficulty with anger management, lying,
disruptive classroom behavior, and hyperactivity. As on the SIBS, teachers rate all students on a
4-point Likert scale from Never to Frequently/Almost Always. Higher total scores on the SEBS
suggest a greater number of and/or more frequent externalizing behavior problems. For a class of
approximately 25 students, teachers on average will spend approximately 15 to 20 minutes
completing the SIBS and SEBS. A combined version of the SEBS and SIBS is located in the
Appendix.
Preliminary data on the SEBS was collected by Cook et al. (2012) in two student samples
in the Western region of the United States, one of 947 elementary-school students and the other
of 4,194 middle- and high-school students. Results supported the reliability of the SEBS, with
excellent internal consistency estimates (Cronbach’s alphas of .89 and .84 for elementary and
secondary students respectively) and strong test-retest reliability (r = .92 and .88 respectively). In
addition, convergent validity was demonstrated by a strong correlation of SEBS scores with the
ASEBA Teacher Report Form Externalizing scale (r = .87) and with the SRSS (r = .91). A
moderately strong correlation with the SIBS (r = .54) was found, likely due to the comorbidity of
internalizing and externalizing problems. The correlation between the SEBS and SIBS was
significant weaker than between the SEBS, SRSS, and ASEBA Teacher Report Form
Externalizing scale, suggesting initial evidence for divergent validity of the SEBS. A ROC curve
analysis yielded cut off scores for the SEBS of 9 or more points (at-risk), 5 to 8 points (“on the
radar”), and 4 or fewer points (“not at risk”).
33
Purpose and Research Questions
Although approximately 1 in 5 students are experiencing mental health concerns at any
given time, less than 1% of students are identified for school-based services (Costello et al.,
2003). This is problematic because emotional and behavioral difficulties, without intervention,
typically do not resolve on their own and may become more severe and/or more difficult to
remediate later (e.g., Lane et al., 2014), putting students at risk for a host of negative outcomes
both short- and long-term.
Universal screening is becoming an increasingly popular method for identifying students
with emotional and behavioral problems early (Levitt et al., 2007). In particular, universal
screening is a central feature of MTSS for behavior, particularly school-wide positive behavior
interventions and supports (SWPBIS). The early detection and provision of intervention for
students with EBDs can moderate negative outcomes, both socially and academically. Because
of the importance of early identification and intervention for improved outcomes and the limited
resources of schools in terms of time and money, the development of technically-adequate
measures that efficiently screen all students for the purpose of identifying at-risk students is a
critical direction for future research.
The central purpose of the present study was to further evaluate the technical adequacy
and usability of two recently-developed, universal behavior screeners, the Student Internalizing
Behavior Screener (SIBS) and the Student Externalizing Behavior Screener (SEBS).
Specifically, the study sought to: (a) assess the reliability of the SIBS and SEBS; (b) evaluate the
concurrent validity of the SIBS and SEBS with well-researched behavioral screeners; (c)
investigate the short-term predictive validity of the SIBS and SEBS with other indicators of
school performance, both behavioral and academic; (d) supplement social validity data on the
34
SIBS and SEBS. The secondary direction for investigation in this study was to compare and
contrast evidence for use of the SIBS and SEBS with two well-established universal behavior
screening measures.
For these purposes, the present study investigated the following research questions:
1. Do the SIBS and SEBS demonstrate adequate internal consistency and test-retest reliability?
2. Are the SIBS and SEBS significantly correlated with scores and risk classification status on
well-established universal behavior screening measures, including the BESS and SSIS-PSG?
3. Are the rates of detection of emotional and behavioral risk by the SIBS and SEBS similar to
other behavior screening measures (i.e., BESS and SSIS-PSG)? Also, do the SIBS and SEBS
identify similar students as at-risk compared to the BESS and SSIS-PSG?
4. Are the results of the SIBS and SEBS, BESS, and SSIS-PSG (i.e., scores and risk
classification) significantly correlated with indicators of school performance, including office
discipline referrals (ODRs), suspensions, attendance, and academic achievement?
5. Are there significant mean differences between “normal” and “at risk” classification groups
as identified by the SIBS and SEBS on indicators of school performance (i.e., ODRs)? How
do these findings compare to the differences between classification groups identified by the
BESS and SSIS-PSG?
6. Are the SIBS and SEBS perceived by teachers as being acceptable, feasible, and usable?
Furthermore, how does usability of the SIBS and SEBS compare to that of the BESS and
SSIS-PSG?
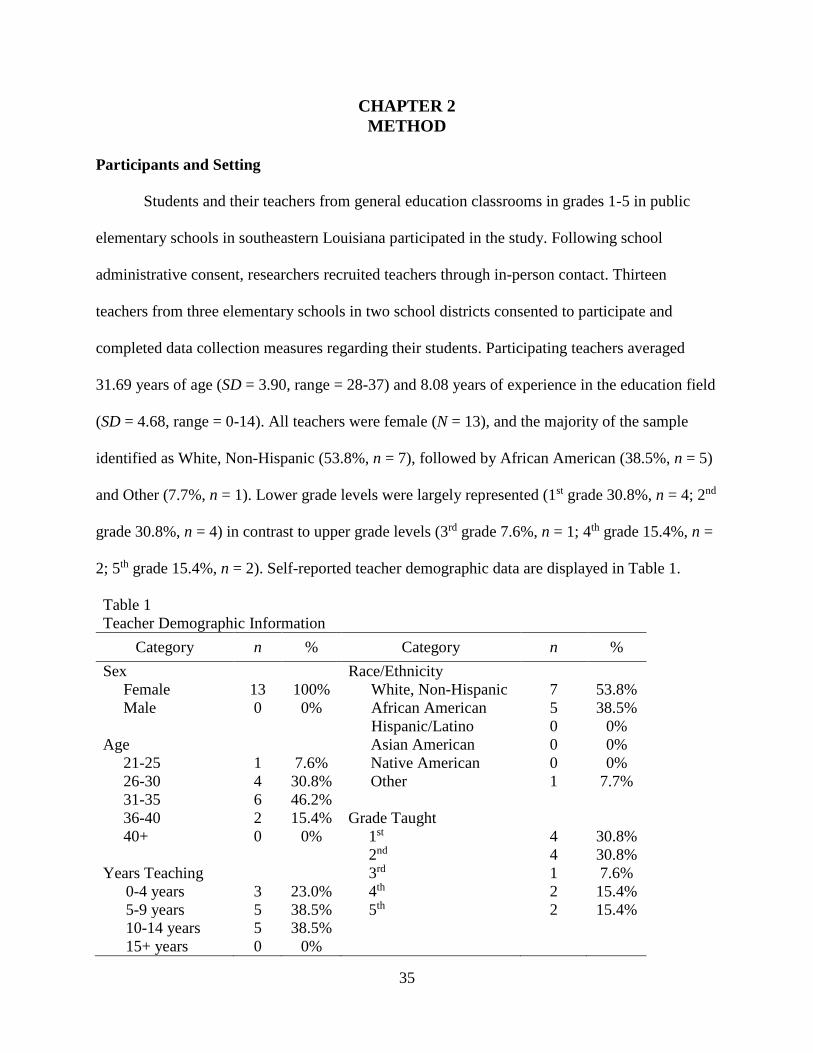
35
CHAPTER 2
METHOD
Participants and Setting
Students and their teachers from general education classrooms in grades 1-5 in public
elementary schools in southeastern Louisiana participated in the study. Following school
administrative consent, researchers recruited teachers through in-person contact. Thirteen
teachers from three elementary schools in two school districts consented to participate and
completed data collection measures regarding their students. Participating teachers averaged
31.69 years of age (SD = 3.90, range = 28-37) and 8.08 years of experience in the education field
(SD = 4.68, range = 0-14). All teachers were female (N = 13), and the majority of the sample
identified as White, Non-Hispanic (53.8%, n = 7), followed by African American (38.5%, n = 5)
and Other (7.7%, n = 1). Lower grade levels were largely represented (1st grade 30.8%, n = 4; 2nd
grade 30.8%, n = 4) in contrast to upper grade levels (3rd grade 7.6%, n = 1; 4th grade 15.4%, n =
2; 5th grade 15.4%, n = 2). Self-reported teacher demographic data are displayed in Table 1.
Table 1
Teacher Demographic Information
Category n % Category n %
Sex Race/Ethnicity
Female 13 100% White, Non-Hispanic 7 53.8%
Male 0 0% African American 5 38.5%
Hispanic/Latino 0 0%
Age Asian American 0 0%
21-25 1 7.6% Native American 0 0%
26-30 4 30.8% Other 1 7.7%
31-35 6 46.2%
36-40 2 15.4% Grade Taught
40+ 0 0% 1st 4 30.8%
2nd 4 30.8%
Years Teaching 3rd 1 7.6%
0-4 years 3 23.0% 4th 2 15.4%
5-9 years 5 38.5% 5th 2 15.4%
10-14 years 5 38.5%
15+ years 0 0%

36
Students were then recruited from consenting teachers’ classrooms. Parental consent and
child assent was obtained for student participation in the study; no inclusionary criteria were
applied. A total of 168 students comprised the sample at the outset of the study. Fourteen
students who were initially enrolled in the study (8.3% of the original sample) withdrew from
participating schools during the semester; their data were excluded from analyses. Therefore, 154
students completed the study by remaining enrolled in participating schools for the duration of
the semester in which the study was conducted.
Participating students’ demographic information was collected from each school district’s
online database. Of the 154 students in the final sample, students’ average age was 7.86 (SD =
1.55, range = 6-11). Reflective of teacher participation, younger ages (70.8% ages 6-8 years, n =
109) and lower grade levels (70.2% in 1st and 2nd grades, n = 108) were more heavily represented
in the student sample. The majority of students were female (60.4%, n = 93), and most students
identified as African American (55.8%, n = 86). The remainder of the sample was comprised of
White, Non-Hispanic (37.7%, n = 58), Hispanic/Latino (3.9%, n = 6), and Asian American
(2.6%, n = 4) students. Based on economic need, 68.2% of participating students (n = 105) were
eligible for free or reduced lunch. It should be noted, however, that all students in one school
district received free or reduced lunch (n = 85) due to general economic need across the district.
A small proportion of the student sample had English as a Second Language (ESL) status (5.2%,
n = 8).
Additional student data were collected regarding educational programming for
accommodations and/or modifications for learning and performance. Six students (3.9% of the
sample) had a 504 plan for educational accommodations provided by the school related to a
suspected disability. Twelve students (7.8% of the sample) were classified as special education
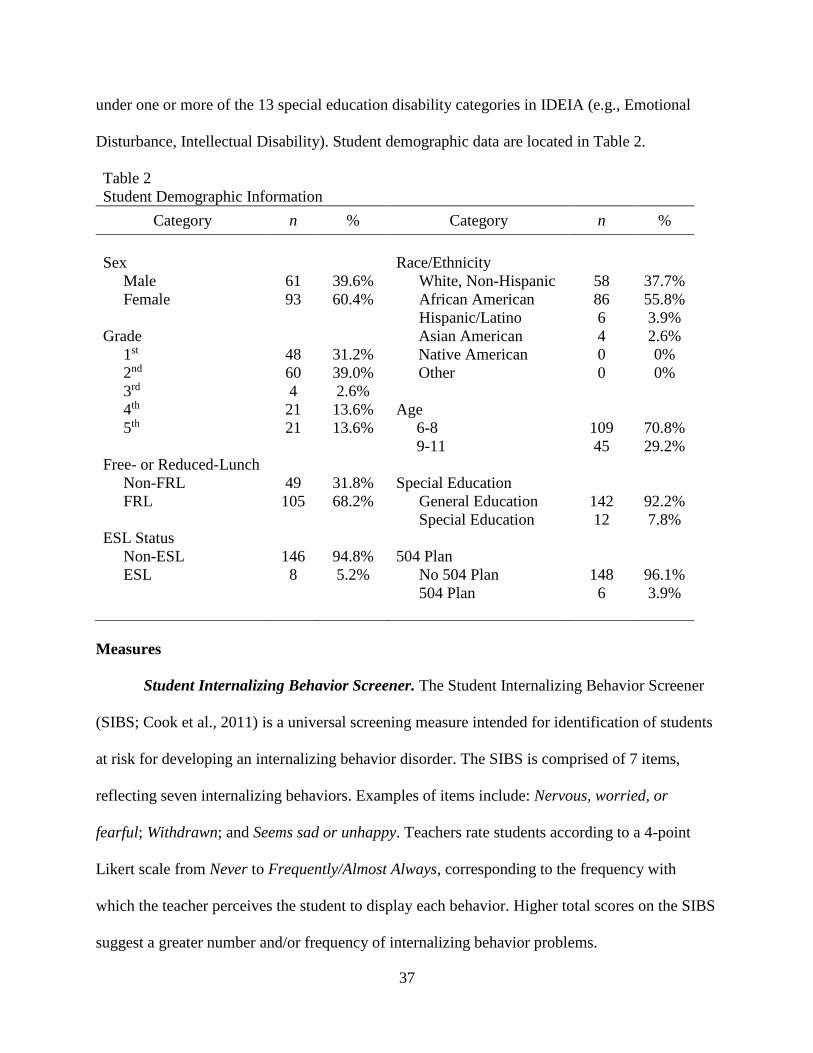
37
under one or more of the 13 special education disability categories in IDEIA (e.g., Emotional
Disturbance, Intellectual Disability). Student demographic data are located in Table 2.
Table 2
Student Demographic Information
Category n % Category n %
Sex Race/Ethnicity
Male 61 39.6% White, Non-Hispanic 58 37.7%
Female 93 60.4% African American 86 55.8%
Hispanic/Latino 6 3.9%
Grade Asian American 4 2.6%
1st 48 31.2% Native American 0 0%
2nd 60 39.0% Other 0 0%
3rd 4 2.6%
4th 21 13.6% Age
5th 21 13.6% 6-8 109 70.8%
9-11 45 29.2%
Free- or Reduced-Lunch
Non-FRL 49 31.8% Special Education
FRL 105 68.2% General Education 142 92.2%
Special Education 12 7.8%
ESL Status
Non-ESL 146 94.8% 504 Plan
ESL 8 5.2% No 504 Plan 148 96.1%
504 Plan 6 3.9%
Measures
Student Internalizing Behavior Screener. The Student Internalizing Behavior Screener
(SIBS; Cook et al., 2011) is a universal screening measure intended for identification of students
at risk for developing an internalizing behavior disorder. The SIBS is comprised of 7 items,
reflecting seven internalizing behaviors. Examples of items include: Nervous, worried, or
fearful; Withdrawn; and Seems sad or unhappy. Teachers rate students according to a 4-point
Likert scale from Never to Frequently/Almost Always, corresponding to the frequency with
which the teacher perceives the student to display each behavior. Higher total scores on the SIBS
suggest a greater number and/or frequency of internalizing behavior problems.
38
Prior research on the SIBS (i.e., Cook et al., 2011) resulted in the following cut off
scores: 8 or more points signifies “at-risk,” 4 to 7 points is “on the radar,” and 3 or fewer points
suggest no risk. Cook and colleagues (2011) found that the SIBS demonstrated adequate internal
consistency (Cronbach’s α of .81 and .79) and good test-retest reliability (r = .74). Furthermore,
a strong correlation of SIBS scores with the ASEBA Teacher Report Form Internalizing scale (r
= .82; Achenbach & Rescorla, 2001) provided evidence of criterion-related validity.
In the current study, to assess emotional and behavioral risk related to internalizing
behaviors, teachers completed the SIBS on participating students in their classrooms
approximately 6 weeks into the academic calendar year, and a second administration occurred
about one month later to assess test-retest reliability. The SIBS measure is presented in
combination with the SEBS measure in Appendix A.
Student Externalizing Behavior Screener. The Student Externalizing Behavior Screener
(SEBS; Cook et al., 2012) is a 7-item universal screening measure designed to assess
externalizing behaviors and identify students who are at-risk due to externalizing behavior
problems. The following are examples of items: Defiant or oppositional to adults; Fights or
argues with peers; and Disrupts class activities. Teachers rate students using a 4-point Likert
scale from Never to Frequently/Almost Always. As on the SIBS, higher total scores on the SEBS
suggest a greater number and/or frequency of behavior problems.
A study by Cook and colleagues (2012) yielded cut off scores of 9 or more points (“at-
risk”), 5 to 8 points (“on the radar”), and 4 or fewer points (“not at risk”). Research on the SEBS
by Cook and colleagues (2012) revealed excellent internal consistency estimates (Cronbach’s α
of .89 and .84) and strong test-retest reliability (r = .92). In addition, a strong correlation of
39
SEBS scores with the ASEBA Teacher Report Form Externalizing scale (r = .87) and with the
SRSS (r = .91) supported criterion-related validity.
Teachers in the current study completed the SEBS concurrently with the SIBS on all
participating students in order to assess emotional and behavioral risk related to externalizing
behaviors. The SIBS and SEBS measures are located in Appendix A as a combined screener in
the same format completed by teachers in the study. In the combined SIBS/SEBS screening
measure, items from the SEBS are presented first (# 1-7), followed by items from the SIBS (#8-
14).
BASC-2 Behavioral and Emotional Screening System. The BASC-2 Behavioral and
Emotional Screening System (BESS; Kamphaus & Reynolds, 2007) is a universal screening
measure completed by teachers in the present study for the purpose of identifying behavioral and
emotional strengths and problems in participating students. The teacher report form consists of
25 items assessing internalizing and externalizing problems, school difficulties, and adaptive
skills. Teachers rate students on a 4-point Likert scale from Never to Almost Always to indicate
the frequency with which each behavior is observed at school. When the BESS is scored and
compared to a normative sample, a single T-score (M = 50, SD = 10) indicates the overall risk
level of a student for emotional and behavioral problems, either normal (T-scores 20-60),
elevated (T-scores 61-70), or extremely elevated (T-scores above 70).
Research on the BESS (e.g., Kamphaus & Reynolds, 2007) suggests acceptable
psychometric properties, including good internal consistency (.96 for teachers), test-retest
reliability (.80-.91), and interrater reliability (.71-.83). Adequate convergent validity has been
demonstrated with the ASEBA (.71-.77) and Connor’s rating scales (.51-.78).
40
As a well-researched, technically adequate universal screener for emotional and
behavioral risk, the BESS served as a criterion measure in the current study. The teacher report
form of the BESS was generated from the AIMSweb electronic assessment and data
management system (http://www.aimsweb.com; NCS Pearson Education, 2012) and printed for
administration to teachers concurrently with the SIBS and SEBS measures. Ratings were
manually entered into AIMSweb by the researcher for scoring purposes.
SSIS Performance Screening Guide. The Social Skills Improvement System –
Performance Screening Guide (SSIS-PSG; Elliott & Gresham, 2007) is a universal screening
measure designed to efficiently assess academic and behavioral indicators related to school
success. To identify whether or not students are at-risk, teachers evaluate students relative to
expectations in four skill domains, including Prosocial Behavior, Motivation to Learn, Reading
Skills, and Math Skills. Elementary-school students are assigned a global rating from 1-5 for
each domain based on their current functioning that corresponds to descriptions of performance
levels or observed behaviors and skills. A rating of 4 or 5 indicates that the student’s functioning
meets expectations based on age and grade level. A rating of 2 or 3 indicates moderate concern
or difficulty, and a rating of 1 suggests high concern or at-risk performance. Low ratings indicate
the need for additional intervention.
In studies by Elliott and Gresham (2007) on the SSIS-PSG, test-retest reliability
coefficients ranged from .68 to .74 and interrater reliability coefficients were between .55 and .68
for a sample of elementary-aged students; these estimates respectively suggest strong to
moderate evidence of reliability of the SSIS-PSG.
In the present study, the SSIS-PSG was completed by teachers on participating students
in their classrooms approximately 6 weeks into the academic calendar year concurrently with
41
completion of the other screeners (i.e., combined SIBS/SEBS and BESS). Because 2 of the 13
total teachers did not complete both math and reading skill ratings due to the content area focus
of their instruction, only the behavioral ratings were utilized for analyses.
Student Archival Data. Common indicators of school performance tracked and recorded
by teachers and school administrators were collected by researchers on participating students
from each school district’s online database. These indicators served as measures of behavioral
and academic performance across the semester for comparison to teacher perceptions of
emotional and behavioral risk according to universal screeners. Data on the following indicators
were collected on participating students for the duration of the semester: office discipline
referrals (ODRs), days of suspension, attendance, referral for behavioral intervention,
attendance, and academic grades.
Office discipline referrals (ODRs) served as a proxy measure for observations of problem
behavior at school. Students typically receive an ODR from a teacher or administrator as a result
of a major rule infraction (e.g., physical aggression) or repeated minor infractions (e.g., not
following directions or work refusal). Schools in the current study maintained records of ODRs
in the school district’s online database. Researchers collected data on the total number of ODRs
received by each participating student during the first semester of the academic calendar year.
An additional proxy measure of the degree of problem behavior displayed at school was the total
number of days students were suspended from school, including both in-school and out-of-
school suspensions.
As a measure of the level of teacher or school concern related to emotional or behavioral
risk, data were collected on whether or not students were referred for additional behavioral
interventions or were currently receiving additional behavioral intervention services. In
42
Louisiana, students who exhibit recurring, serious behavioral problems at school may be referred
by their teacher or administrator to a school-based problem-solving committee for additional
behavioral supports or interventions as per state educational law (Bulletin 1508 in Louisiana). If
these supports are not effective for a student (i.e., the student continues to demonstrate serious
problem behavior), the student may be referred for an evaluation to determine eligibility for
special education. At the end of the first semester, researchers asked teachers to indicate whether
or not participating students were referred at any time during the semester for additional
behavioral intervention or were currently receiving additional behavioral intervention services.
In addition, data on students’ school attendance were collected from the school district’s
online databases. Attendance was operationalized as the number of days the student was present
and on-time to school. Late or tardy arrivals to school were subtracted from the number of days
of attendance since the student was not present for the full school day. For example, if a student
was absent 4 days and late to school 3 days out of a total of 50 days, then the student was
considered to have attended 43 full school days. For the purpose of data analysis, the number of
days the student was present and on-time was divided by the total number of days the student
was enrolled during the semester, and a percentage was calculated.
Finally, as an objective measure of academic performance, students’ letter grades for the
first semester of the school year (i.e., the first two nine-week grading periods) were collected
from the school district’s online databases. Grades were collected in core subject areas only,
including Math, Reading, Science, and Social Studies. Letter grades were assigned a point value
(i.e., A=4, B=3, C=2, D=1, F=0). The point values for each student were averaged across the
subject areas and then averaged across the two grading periods to calculate a grade-point average
(GPA) for data analysis.
43
Usage Rating Profile – Assessment. The Usage Rating Profile – Assessment (URP-A;
Chafouleas, Miller, Briesch, Neugebauer, & Riley-Tillman, 2012) is a 28-item self-report
measure intended to evaluate perceived acceptability, feasibility, and usability of an assessment
instrument completed by the rater. Items are rated on a 6-point Likert scale indicating the degree
of agreement with item statements, from Strongly Disagree to Strongly Agree.
A study by Miller and colleagues (2015) on the construct validity of the URP-A revealed
that items assess six domains of usability, including Acceptability (appropriateness of the
assessment and interest in its use), Understanding (knowledge of assessment and its procedures),
Home-School Collaboration (perceived necessity of collaboration in completing the assessment),
Feasibility (ease of use), System Climate (extent of fit within school systems), and System
Support (need for additional support to use the assessment), with internal consistency estimates
ranging from .63 to .90. Total scores on the URP-A reflect overall perceptions of the usability of
an assessment. The Total Usability score and the six domain scores are interpreted using mean
item scores.
The URP-A was adapted for use in the present study to include only the 15 items
comprising the Acceptability and Feasibility subscales. Teachers completed the revised URP-A
regarding their perceptions of the combined SIBS/SEBS, BESS, and SSIS-PSG, immediately
following completion of the screeners. Because teachers completed the SIBS and SEBS as one
combined screener, the two measures were rated together as one measure on the URP-A. Data
from the URP-A as completed by teachers allowed for comparison of social validity across the
three administered screening measures.
44
Procedure
Consent and Assent. Recruitment for the study began with contact with school
administrators in southeastern Louisiana. Researchers obtained informed consent from
administrators at 3 public elementary schools in 2 school districts. Teachers were then recruited
by researchers at the participating schools via in-person contact. Informed consent was obtained
from 13 teachers for completing the study measures as part of data collection on students in their
classrooms. Teachers were offered a nominal incentive for their participation; upon completion
of the study, all teachers received a $10 gift card. In addition, one teacher was randomly selected
for a $100 gift card. Demographic information was obtained from teachers by self-report at the
time of informed consent.
Following teacher recruitment, active parental consent was sought for all students in
participating teachers’ classrooms. Informed consent letters were sent home with students for
their parents or guardians. Students were offered a small tangible incentive (i.e., piece of candy)
for returning the parental consent form regardless of whether parental consent was provided or
not. For students who did not return the parental consent form after approximately a week,
teachers sent home additional consent forms. In total, approximately 3 weeks were allotted for
students to return parental consent forms. Finally, researchers went into participating teachers’
classrooms to obtain student assent for participation. For the student assent process, the study
was explained to students for whom parental consent had been obtained using language
appropriate for their grade level and age.
Teacher Training. Following the consent process and approximately 6 weeks into the
school year, researchers provided each teacher with a brief, informal training on data collection
procedures for the study, specifically regarding completion of the universal screening measures
45
(i.e., combined SIBS/SEBS, BESS, SSIS-PSG) and the social validity questionnaire (i.e., URP-
A). Furthermore, each teacher was provided with the study measures, materials, and instructions
for data collection, including the study timeline, in a binder.
Data Collection. Approximately 6 weeks into the school year, teachers completed the
universal behavior screeners, including the combined SIBS/SEBS, BESS, and SSIS-PSG, on all
participating students in their classroom. A time period of 6 weeks was chosen, consistent with
the literature, to allow teachers to have enough observations of their students to complete the
screening measures appropriately. At that time, teachers also completed the URP-A regarding
their perceptions of the usability of the combined SIBS/SEBS, BESS, and SSIS-PSG. Teachers
were given one week to complete the measures, after which the researchers collected them. For
the purpose of assessing test-retest reliability, teachers completed the combined SIBS/SEBS for a
second time about 4 weeks later on all participating students. Again, teachers were given one
week to complete the combined SIBS/SEBS before researchers collected the forms. All teachers
completed the forms in a timely manner.
At the end of the semester, which consisted of approximately 18 weeks of school,
researchers collected information from the school districts’ online databases and from teachers
on student demographics and the following outcomes across the duration of the semester:
number of office discipline referrals (ODRs), days of suspension, whether or not the student was
referred for additional behavior intervention or currently received behavioral intervention
services, attendance, and letter grades from core academic subject areas.
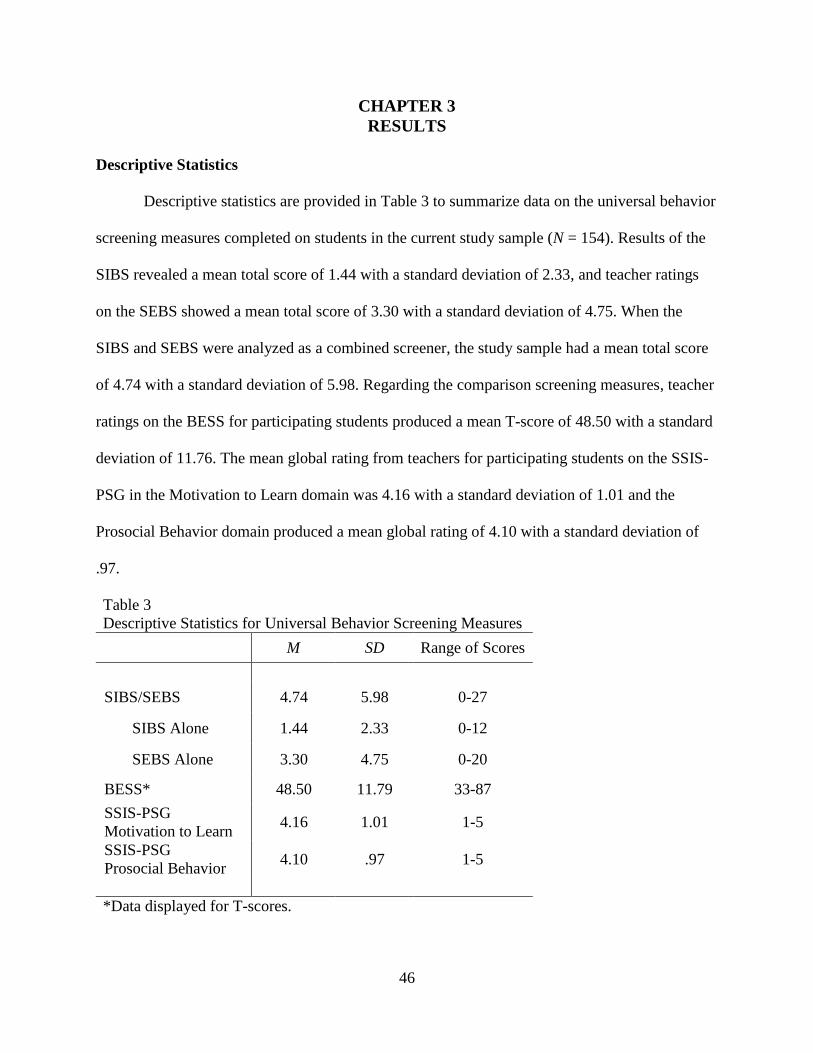
46
CHAPTER 3
RESULTS
Descriptive Statistics
Descriptive statistics are provided in Table 3 to summarize data on the universal behavior
screening measures completed on students in the current study sample (N = 154). Results of the
SIBS revealed a mean total score of 1.44 with a standard deviation of 2.33, and teacher ratings
on the SEBS showed a mean total score of 3.30 with a standard deviation of 4.75. When the
SIBS and SEBS were analyzed as a combined screener, the study sample had a mean total score
of 4.74 with a standard deviation of 5.98. Regarding the comparison screening measures, teacher
ratings on the BESS for participating students produced a mean T-score of 48.50 with a standard
deviation of 11.76. The mean global rating from teachers for participating students on the SSIS-
PSG in the Motivation to Learn domain was 4.16 with a standard deviation of 1.01 and the
Prosocial Behavior domain produced a mean global rating of 4.10 with a standard deviation of
.97.
Table 3
Descriptive Statistics for Universal Behavior Screening Measures
M SD Range of Scores
SIBS/SEBS 4.74 5.98 0-27
SIBS Alone 1.44 2.33 0-12
SEBS Alone 3.30 4.75 0-20
BESS* 48.50 11.79 33-87
SSIS-PSG
Motivation to Learn 4.16 1.01 1-5
SSIS-PSG
Prosocial Behavior 4.10 .97 1-5
*Data displayed for T-scores.
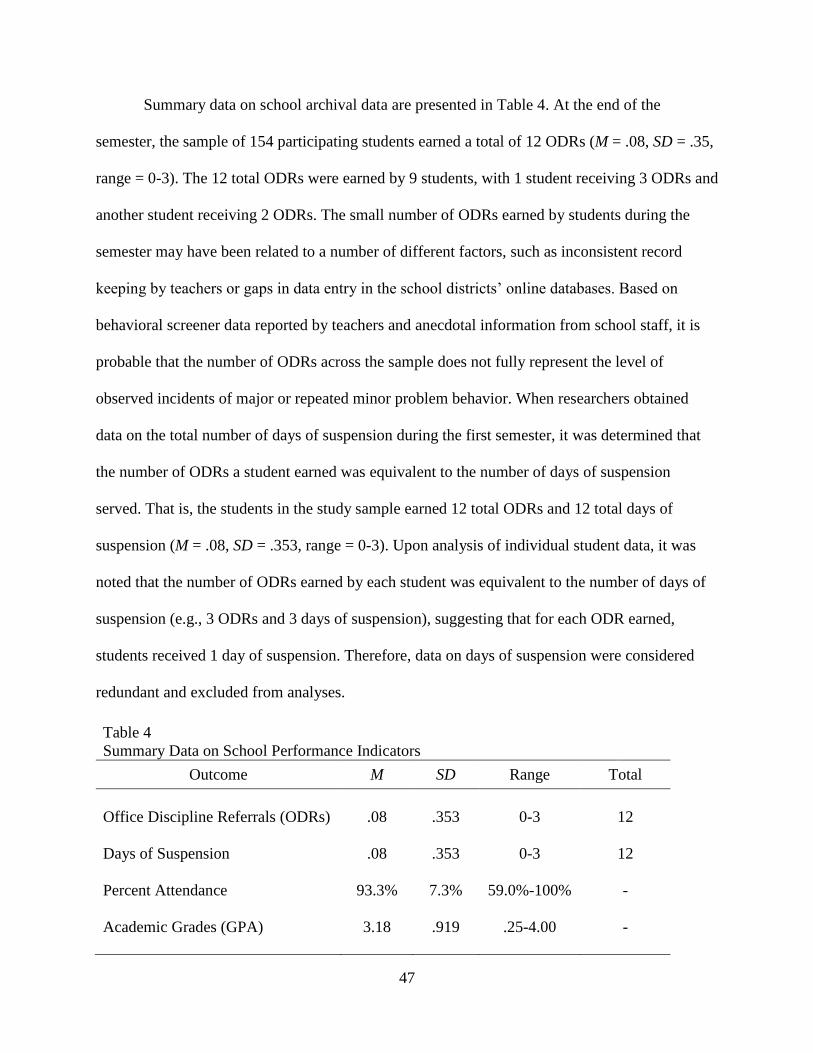
47
Summary data on school archival data are presented in Table 4. At the end of the
semester, the sample of 154 participating students earned a total of 12 ODRs (M = .08, SD = .35,
range = 0-3). The 12 total ODRs were earned by 9 students, with 1 student receiving 3 ODRs and
another student receiving 2 ODRs. The small number of ODRs earned by students during the
semester may have been related to a number of different factors, such as inconsistent record
keeping by teachers or gaps in data entry in the school districts’ online databases. Based on
behavioral screener data reported by teachers and anecdotal information from school staff, it is
probable that the number of ODRs across the sample does not fully represent the level of
observed incidents of major or repeated minor problem behavior. When researchers obtained
data on the total number of days of suspension during the first semester, it was determined that
the number of ODRs a student earned was equivalent to the number of days of suspension
served. That is, the students in the study sample earned 12 total ODRs and 12 total days of
suspension (M = .08, SD = .353, range = 0-3). Upon analysis of individual student data, it was
noted that the number of ODRs earned by each student was equivalent to the number of days of
suspension (e.g., 3 ODRs and 3 days of suspension), suggesting that for each ODR earned,
students received 1 day of suspension. Therefore, data on days of suspension were considered
redundant and excluded from analyses.
Table 4
Summary Data on School Performance Indicators
Outcome M SD Range Total
Office Discipline Referrals (ODRs) .08 .353 0-3 12
Days of Suspension .08 .353 0-3 12
Percent Attendance 93.3% 7.3% 59.0%-100% -
Academic Grades (GPA) 3.18 .919 .25-4.00 -
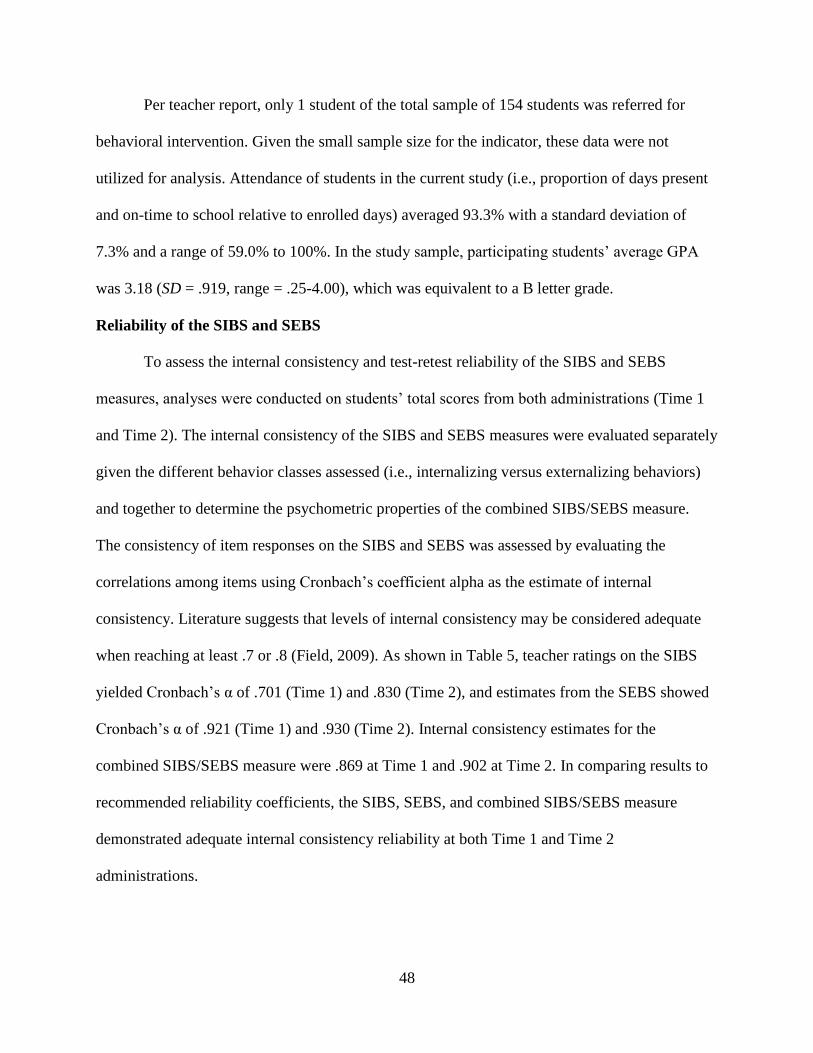
48
Per teacher report, only 1 student of the total sample of 154 students was referred for
behavioral intervention. Given the small sample size for the indicator, these data were not
utilized for analysis. Attendance of students in the current study (i.e., proportion of days present
and on-time to school relative to enrolled days) averaged 93.3% with a standard deviation of
7.3% and a range of 59.0% to 100%. In the study sample, participating students’ average GPA
was 3.18 (SD = .919, range = .25-4.00), which was equivalent to a B letter grade.
Reliability of the SIBS and SEBS
To assess the internal consistency and test-retest reliability of the SIBS and SEBS
measures, analyses were conducted on students’ total scores from both administrations (Time 1
and Time 2). The internal consistency of the SIBS and SEBS measures were evaluated separately
given the different behavior classes assessed (i.e., internalizing versus externalizing behaviors)
and together to determine the psychometric properties of the combined SIBS/SEBS measure.
The consistency of item responses on the SIBS and SEBS was assessed by evaluating the
correlations among items using Cronbach’s coefficient alpha as the estimate of internal
consistency. Literature suggests that levels of internal consistency may be considered adequate
when reaching at least .7 or .8 (Field, 2009). As shown in Table 5, teacher ratings on the SIBS
yielded Cronbach’s α of .701 (Time 1) and .830 (Time 2), and estimates from the SEBS showed
Cronbach’s α of .921 (Time 1) and .930 (Time 2). Internal consistency estimates for the
combined SIBS/SEBS measure were .869 at Time 1 and .902 at Time 2. In comparing results to
recommended reliability coefficients, the SIBS, SEBS, and combined SIBS/SEBS measure
demonstrated adequate internal consistency reliability at both Time 1 and Time 2
administrations.
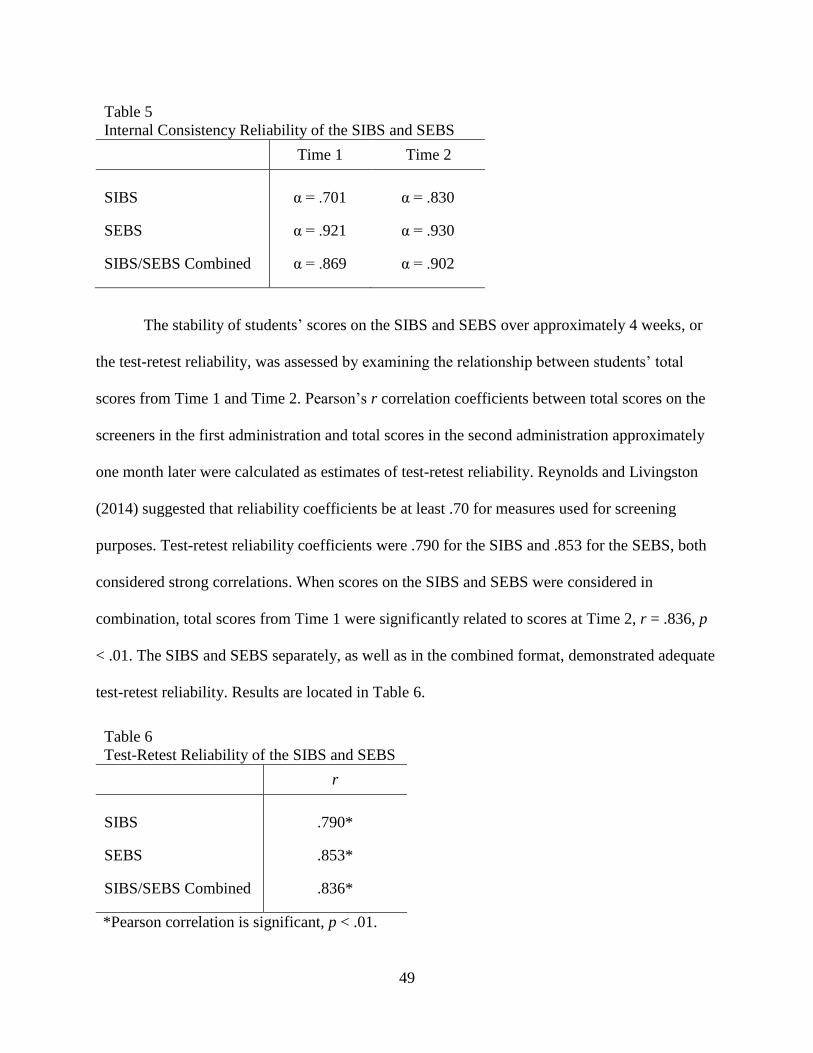
49
The stability of students’ scores on the SIBS and SEBS over approximately 4 weeks, or
the test-retest reliability, was assessed by examining the relationship between students’ total
scores from Time 1 and Time 2. Pearson’s r correlation coefficients between total scores on the
screeners in the first administration and total scores in the second administration approximately
one month later were calculated as estimates of test-retest reliability. Reynolds and Livingston
(2014) suggested that reliability coefficients be at least .70 for measures used for screening
purposes. Test-retest reliability coefficients were .790 for the SIBS and .853 for the SEBS, both
considered strong correlations. When scores on the SIBS and SEBS were considered in
combination, total scores from Time 1 were significantly related to scores at Time 2, r = .836, p
< .01. The SIBS and SEBS separately, as well as in the combined format, demonstrated adequate
test-retest reliability. Results are located in Table 6.
Table 5
Internal Consistency Reliability of the SIBS and SEBS
Time 1 Time 2
SIBS α = .701 α = .830
SEBS α = .921 α = .930
SIBS/SEBS Combined α = .869 α = .902
Table 6
Test-Retest Reliability of the SIBS and SEBS
r
SIBS .790*
SEBS .853*
SIBS/SEBS Combined .836*
*Pearson correlation is significant, p < .01.
50
Concurrent Validity
To determine evidence for concurrent validity, the relationship among scores on
screening measures as well as rates of, consistency in, and accuracy of risk identification across
measures were evaluated. First, the association between scores on the SIBS and SEBS measures
and well-researched behavioral screeners was assessed using Pearson’s r correlation coefficients.
The BESS and SSIS-PSG were considered criterion measures given the extensive research base
supporting adequate reliability and validity. The strength of the resulting bivariate correlations
was interpreted using the following recommendations from Cohen (1977): correlations less than
.30 are small, .30 to .49 are moderate, and greater than .50 are strong.
Findings from the current study, located in Table 7, showed teacher ratings of students’
emotional and behavioral risk resulted in a significant correlation coefficient of .823 between
total scores on the combined SIBS/SEBS and T-scores on the BESS, the strongest association
between screening measures in the study. That is, students with higher total scores (i.e., greater
reported emotional and behavioral risk) on the combined SIBS/SEBS tended to have higher
scores on the BESS. In addition, total scores on the combined SIBS/SEBS were significantly and
negatively related to behavioral domain ratings from the SSIS-PSG, r = -.596 on Prosocial
Behavior and r = -.713 on Motivation to Learn. The greater number and/or frequency of reported
emotional and behavioral problems on the combined SIBS/SEBS, the lower the rating of
Prosocial Behavior or Motivation to Learn.
Other relationships among screening measures were found to be significantly strong;
negative correlations were revealed between the BESS and SSIS-PSG Motivation to Learn (r = -
.761) and Prosocial Behavior (r = -.794) domains, while a positive correlation was found
between the SSIS-PSG Motivation to Learn and Prosocial Behavior domains (r = .746). Overall,
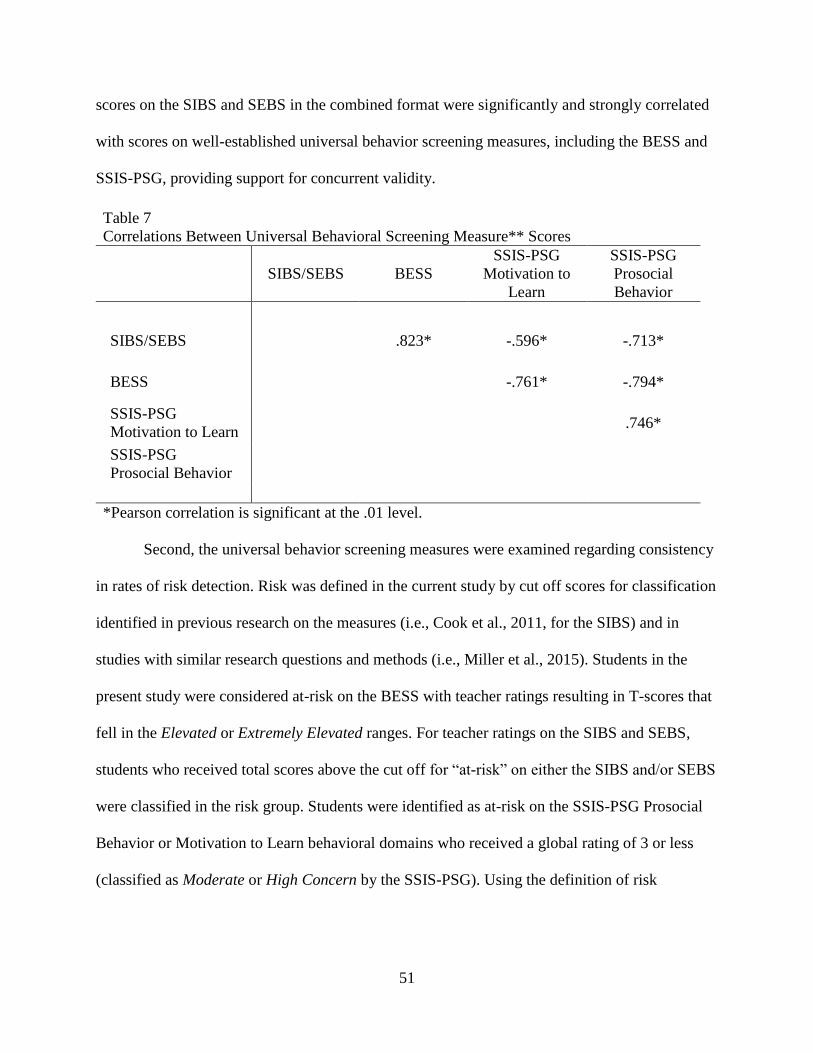
51
scores on the SIBS and SEBS in the combined format were significantly and strongly correlated
with scores on well-established universal behavior screening measures, including the BESS and
SSIS-PSG, providing support for concurrent validity.
Second, the universal behavior screening measures were examined regarding consistency
in rates of risk detection. Risk was defined in the current study by cut off scores for classification
identified in previous research on the measures (i.e., Cook et al., 2011, for the SIBS) and in
studies with similar research questions and methods (i.e., Miller et al., 2015). Students in the
present study were considered at-risk on the BESS with teacher ratings resulting in T-scores that
fell in the Elevated or Extremely Elevated ranges. For teacher ratings on the SIBS and SEBS,
students who received total scores above the cut off for “at-risk” on either the SIBS and/or SEBS
were classified in the risk group. Students were identified as at-risk on the SSIS-PSG Prosocial
Behavior or Motivation to Learn behavioral domains who received a global rating of 3 or less
(classified as Moderate or High Concern by the SSIS-PSG). Using the definition of risk
Table 7
Correlations Between Universal Behavioral Screening Measure** Scores
SIBS/SEBS BESS
SSIS-PSG
Motivation to
Learn
SSIS-PSG
Prosocial
Behavior
SIBS/SEBS .823* -.596* -.713*
BESS -.761* -.794*
SSIS-PSG
Motivation to Learn .746*
SSIS-PSG
Prosocial Behavior
*Pearson correlation is significant at the .01 level.
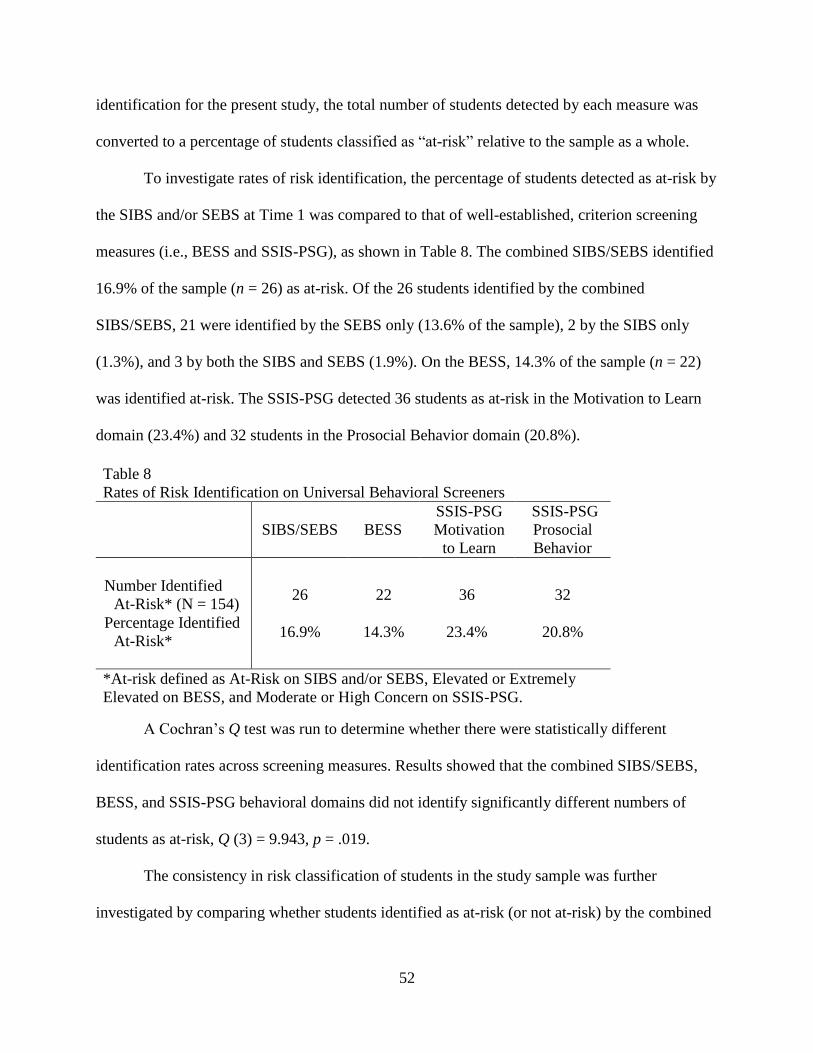
52
identification for the present study, the total number of students detected by each measure was
converted to a percentage of students classified as “at-risk” relative to the sample as a whole.
To investigate rates of risk identification, the percentage of students detected as at-risk by
the SIBS and/or SEBS at Time 1 was compared to that of well-established, criterion screening
measures (i.e., BESS and SSIS-PSG), as shown in Table 8. The combined SIBS/SEBS identified
16.9% of the sample (n = 26) as at-risk. Of the 26 students identified by the combined
SIBS/SEBS, 21 were identified by the SEBS only (13.6% of the sample), 2 by the SIBS only
(1.3%), and 3 by both the SIBS and SEBS (1.9%). On the BESS, 14.3% of the sample (n = 22)
was identified at-risk. The SSIS-PSG detected 36 students as at-risk in the Motivation to Learn
domain (23.4%) and 32 students in the Prosocial Behavior domain (20.8%).
A Cochran’s Q test was run to determine whether there were statistically different
identification rates across screening measures. Results showed that the combined SIBS/SEBS,
BESS, and SSIS-PSG behavioral domains did not identify significantly different numbers of
students as at-risk, Q (3) = 9.943, p = .019.
The consistency in risk classification of students in the study sample was further
investigated by comparing whether students identified as at-risk (or not at-risk) by the combined
Table 8
Rates of Risk Identification on Universal Behavioral Screeners
SIBS/SEBS BESS
SSIS-PSG
Motivation
to Learn
SSIS-PSG
Prosocial
Behavior
Number Identified
At-Risk* (N = 154) 26 22 36 32
Percentage Identified
At-Risk* 16.9% 14.3% 23.4% 20.8%
*At-risk defined as At-Risk on SIBS and/or SEBS, Elevated or Extremely
Elevated on BESS, and Moderate or High Concern on SSIS-PSG.
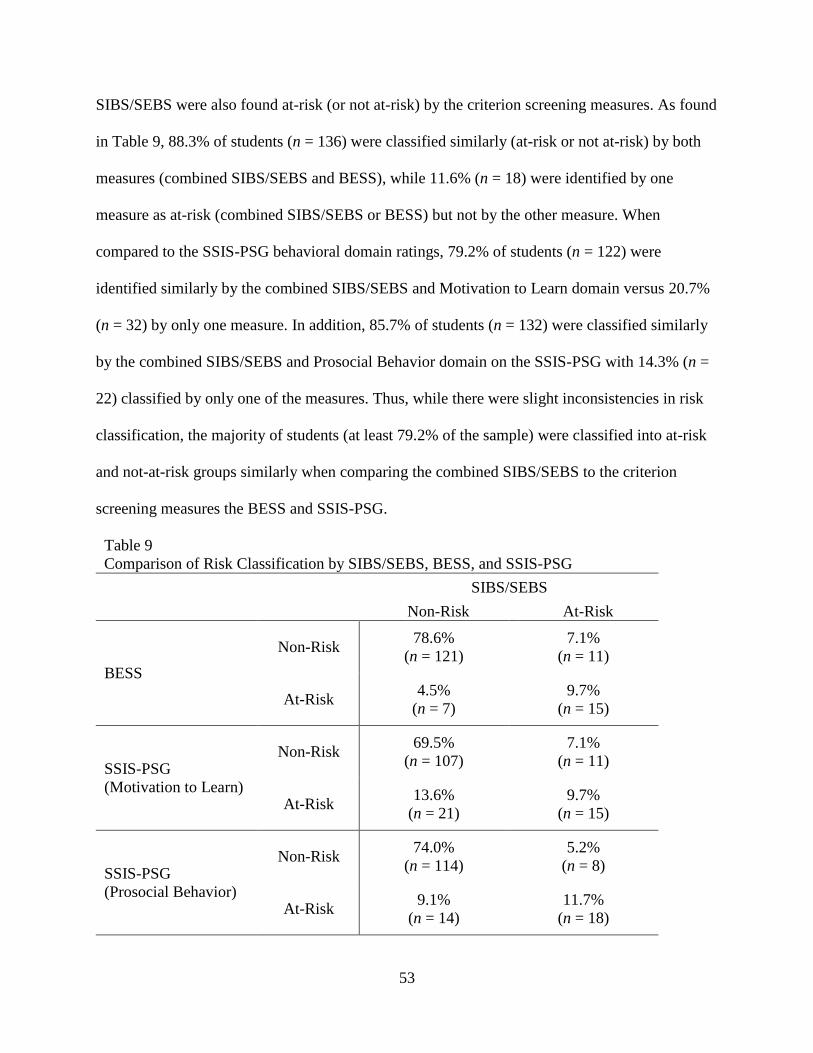
53
SIBS/SEBS were also found at-risk (or not at-risk) by the criterion screening measures. As found
in Table 9, 88.3% of students (n = 136) were classified similarly (at-risk or not at-risk) by both
measures (combined SIBS/SEBS and BESS), while 11.6% (n = 18) were identified by one
measure as at-risk (combined SIBS/SEBS or BESS) but not by the other measure. When
compared to the SSIS-PSG behavioral domain ratings, 79.2% of students (n = 122) were
identified similarly by the combined SIBS/SEBS and Motivation to Learn domain versus 20.7%
(n = 32) by only one measure. In addition, 85.7% of students (n = 132) were classified similarly
by the combined SIBS/SEBS and Prosocial Behavior domain on the SSIS-PSG with 14.3% (n =
22) classified by only one of the measures. Thus, while there were slight inconsistencies in risk
classification, the majority of students (at least 79.2% of the sample) were classified into at-risk
and not-at-risk groups similarly when comparing the combined SIBS/SEBS to the criterion
screening measures the BESS and SSIS-PSG.
Table 9
Comparison of Risk Classification by SIBS/SEBS, BESS, and SSIS-PSG
SIBS/SEBS
Non-Risk At-Risk
BESS
Non-Risk 78.6%
(n = 121)
7.1%
(n = 11)
At-Risk 4.5%
(n = 7)
9.7%
(n = 15)
SSIS-PSG
(Motivation to Learn)
Non-Risk 69.5%
(n = 107)
7.1%
(n = 11)
At-Risk 13.6%
(n = 21)
9.7%
(n = 15)
SSIS-PSG
(Prosocial Behavior)
Non-Risk 74.0%
(n = 114)
5.2%
(n = 8)
At-Risk 9.1%
(n = 14)
11.7%
(n = 18)
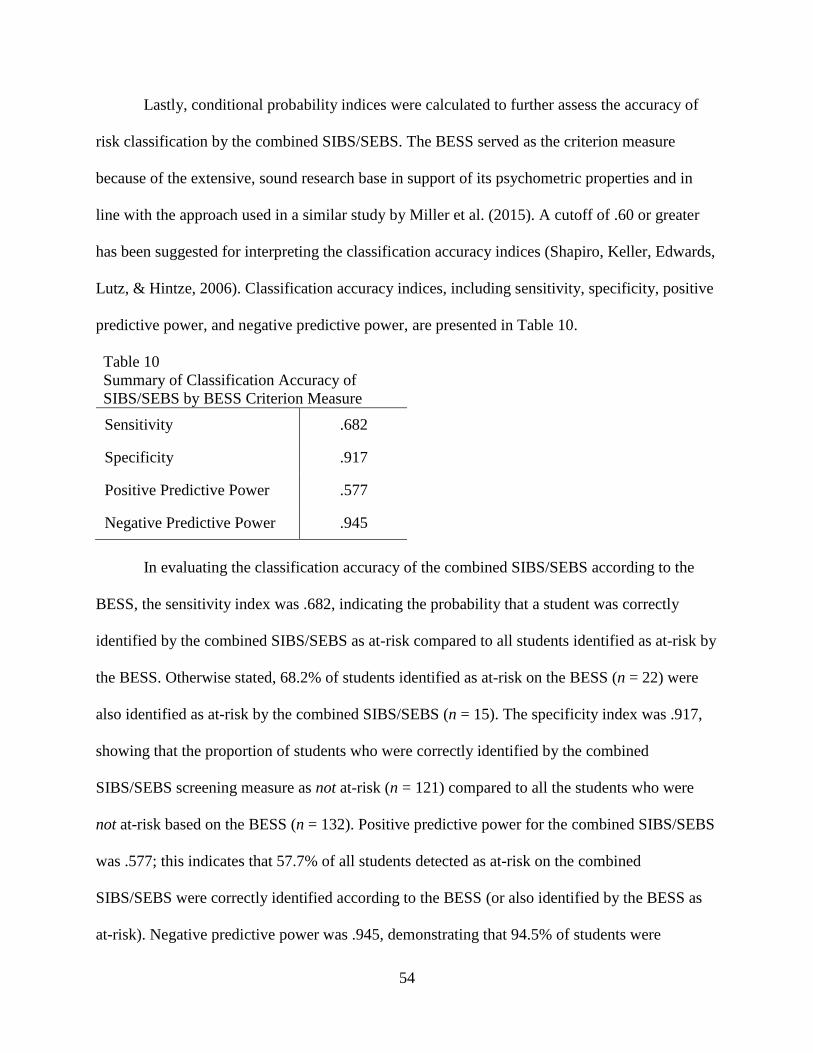
54
Lastly, conditional probability indices were calculated to further assess the accuracy of
risk classification by the combined SIBS/SEBS. The BESS served as the criterion measure
because of the extensive, sound research base in support of its psychometric properties and in
line with the approach used in a similar study by Miller et al. (2015). A cutoff of .60 or greater
has been suggested for interpreting the classification accuracy indices (Shapiro, Keller, Edwards,
Lutz, & Hintze, 2006). Classification accuracy indices, including sensitivity, specificity, positive
predictive power, and negative predictive power, are presented in Table 10.
Table 10
Summary of Classification Accuracy of
SIBS/SEBS by BESS Criterion Measure
Sensitivity .682
Specificity .917
Positive Predictive Power .577
Negative Predictive Power .945
In evaluating the classification accuracy of the combined SIBS/SEBS according to the
BESS, the sensitivity index was .682, indicating the probability that a student was correctly
identified by the combined SIBS/SEBS as at-risk compared to all students identified as at-risk by
the BESS. Otherwise stated, 68.2% of students identified as at-risk on the BESS (n = 22) were
also identified as at-risk by the combined SIBS/SEBS (n = 15). The specificity index was .917,
showing that the proportion of students who were correctly identified by the combined
SIBS/SEBS screening measure as not at-risk (n = 121) compared to all the students who were
not at-risk based on the BESS (n = 132). Positive predictive power for the combined SIBS/SEBS
was .577; this indicates that 57.7% of all students detected as at-risk on the combined
SIBS/SEBS were correctly identified according to the BESS (or also identified by the BESS as
at-risk). Negative predictive power was .945, demonstrating that 94.5% of students were
55
correctly identified as not at-risk on the combined SIBS/SEBS screening measure compared to
all students not identified by the combined SIBS/SEBS. The combined SIBS/SEBS performed
well in terms of classification accuracy with the BESS as the criterion, meeting the
recommended cutoff of .60 for all indices with the exception of positive predictive power, which
only slightly missed the criterion.
Predictive Validity
To evaluate the short-term predictive validity of the SIBS and SEBS, the extent to which
scores and risk classification on the SIBS and SEBS were associated with students’ academic
achievement and behavior at school was assessed. Data from the first administration of the SIBS
and SEBS taken 6 weeks into the academic calendar year and student archival data collected at
the end of the first semester from the school districts’ online databases were used for analysis.
First, Pearson’s product-moment correlation coefficients were calculated to assess the
strength of the relationship between total scores from the SIBS alone, SEBS alone, and combined
SIBS/SEBS and the indicators of school performance, including the number of ODRs (or
suspensions), academic achievement in core subject areas (grade point average), and attendance
(percentage of school days attended and on-time). Shown in Table 11, regarding behavioral
performance, students’ scores on the SEBS alone were moderately correlated with the number of
office discipline referrals (r = .329) earned during the semester, which demonstrates that the
greater the teacher-perceived externalizing behavior, the greater the number of ODRs students
tended to earn. Small correlations were found between the SIBS alone and combined SIBS/SEBS
and ODRs (r = .022 and r = .270, respectively).
When considering academic performance, a strong, negative correlation was revealed
between average grades in core subject areas and combined SIBS/SEBS scores (r = -.534),
56
suggesting that higher scores on the combined SIBS/SEBS (i.e., greater emotional and
behavioral risk) were associated with poorer grades. Average grades and total scores on the SIBS
alone and SEBS alone were moderately and negatively related (r = -.413 and r = -.470,
respectively). Finally, the relationship with students’ attendance was small and negative across
the screeners, including the combined SIBS/SEBS (r = -.220), SIBS alone (r = -.219), and SEBS
alone (r = -.270). As teacher-perceived emotional and behavioral problems as reported on the
SIBS and SEBS screening measures increased, students’ attendance decreased. Although the
strength of the association between scores on the SIBS alone, SEBS alone, and combined
SIBS/SEBS and performance indicators varied, all correlations were significant (p < .01), except
for the correlation between the SIBS alone and number of ODRs earned.
Additionally, the association between the BESS and SSIS-PSG behavioral domain ratings
and school performance indicators was investigated; analyses across screeners allowed for
comparison of predictive validity evidence for the different screeners. Results are summarized in
Table 11. Students’ T-scores on the BESS screening measure were strongly and negatively
associated with average grades (r = -.658). Higher T-scores on the BESS were moderately
related to greater ODRs earned (r = .338) and poorer attendance (r = -.322).
Associations with SSIS-PSG behavioral domains were small to strong. A small
relationship was shown between lower ratings on the SSIS-PSG Motivation to Learn domain
(i.e., higher risk) and greater ODRs earned (r = -.291). Better behavior (i.e., higher ratings)
reported in the Motivation to Learn domain was moderately related to improved attendance (r =
.301) and strongly related to higher average grades (r = -.553). Ratings on the SSIS-PSG
Prosocial Behavior domain were strongly and positively correlated with students’ average grades
(r = .553), suggesting that greater teacher-perceived prosocial behavior in students is associated
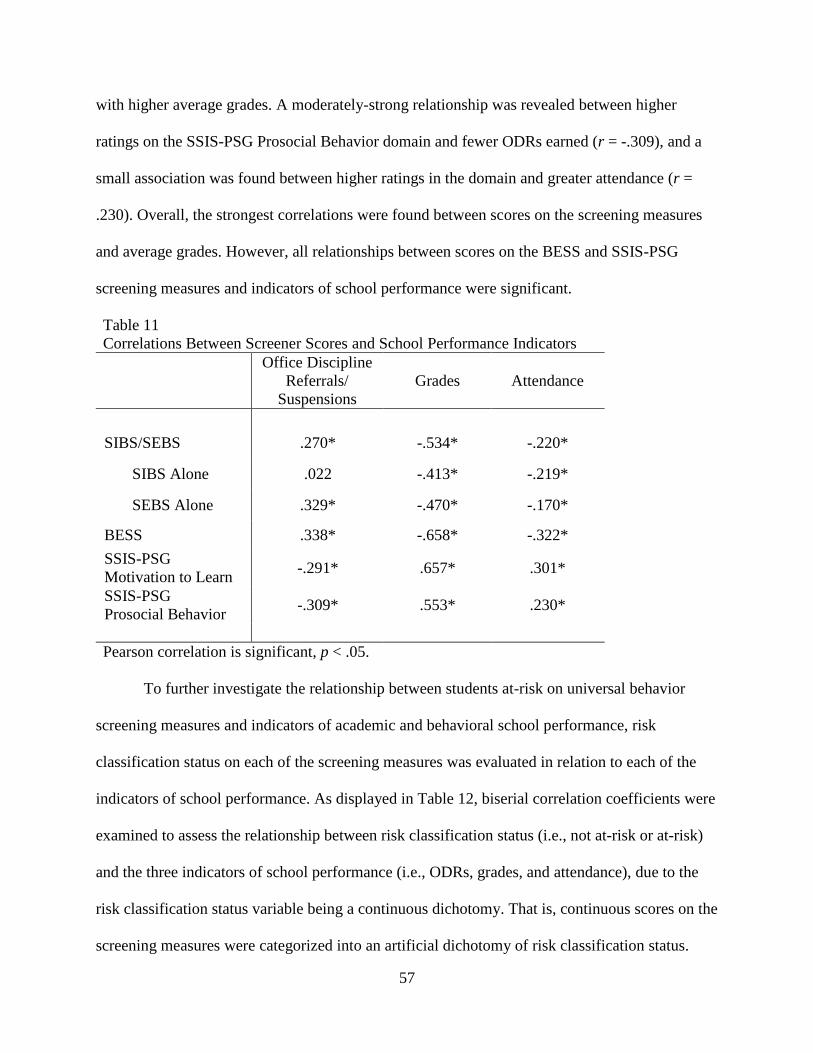
57
with higher average grades. A moderately-strong relationship was revealed between higher
ratings on the SSIS-PSG Prosocial Behavior domain and fewer ODRs earned (r = -.309), and a
small association was found between higher ratings in the domain and greater attendance (r =
.230). Overall, the strongest correlations were found between scores on the screening measures
and average grades. However, all relationships between scores on the BESS and SSIS-PSG
screening measures and indicators of school performance were significant.
Table 11
Correlations Between Screener Scores and School Performance Indicators
Office Discipline
Referrals/
Suspensions
Grades Attendance
SIBS/SEBS .270* -.534* -.220*
SIBS Alone .022 -.413* -.219*
SEBS Alone .329* -.470* -.170*
BESS .338* -.658* -.322*
SSIS-PSG
Motivation to Learn -.291* .657* .301*
SSIS-PSG
Prosocial Behavior -.309* .553* .230*
Pearson correlation is significant, p < .05.
To further investigate the relationship between students at-risk on universal behavior
screening measures and indicators of academic and behavioral school performance, risk
classification status on each of the screening measures was evaluated in relation to each of the
indicators of school performance. As displayed in Table 12, biserial correlation coefficients were
examined to assess the relationship between risk classification status (i.e., not at-risk or at-risk)
and the three indicators of school performance (i.e., ODRs, grades, and attendance), due to the
risk classification status variable being a continuous dichotomy. That is, continuous scores on the
screening measures were categorized into an artificial dichotomy of risk classification status.
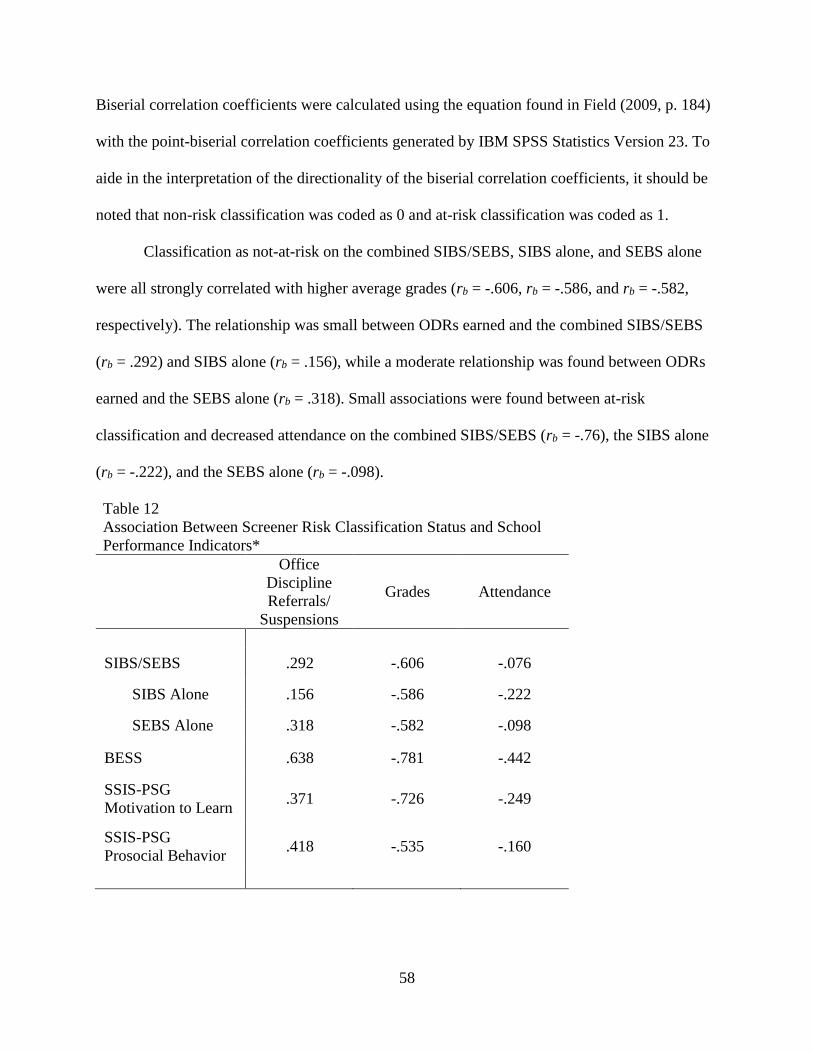
58
Biserial correlation coefficients were calculated using the equation found in Field (2009, p. 184)
with the point-biserial correlation coefficients generated by IBM SPSS Statistics Version 23. To
aide in the interpretation of the directionality of the biserial correlation coefficients, it should be
noted that non-risk classification was coded as 0 and at-risk classification was coded as 1.
Classification as not-at-risk on the combined SIBS/SEBS, SIBS alone, and SEBS alone
were all strongly correlated with higher average grades (rb = -.606, rb = -.586, and rb = -.582,
respectively). The relationship was small between ODRs earned and the combined SIBS/SEBS
(rb = .292) and SIBS alone (rb = .156), while a moderate relationship was found between ODRs
earned and the SEBS alone (rb = .318). Small associations were found between at-risk
classification and decreased attendance on the combined SIBS/SEBS (rb = -.76), the SIBS alone
(rb = -.222), and the SEBS alone (rb = -.098).
Table 12
Association Between Screener Risk Classification Status and School
Performance Indicators*
Office
Discipline
Referrals/
Suspensions
Grades Attendance
SIBS/SEBS .292 -.606 -.076
SIBS Alone .156 -.586 -.222
SEBS Alone .318 -.582 -.098
BESS .638 -.781 -.442
SSIS-PSG
Motivation to Learn .371 -.726 -.249
SSIS-PSG
Prosocial Behavior .418 -.535 -.160
59
The strength of the association between risk classification status on the SIBS and SEBS
and school performance indicators was compared to that of the BESS and SSIS-PSG screening
measures. Again, risk identification on the screening measures was strongly related to poorer
grades (rb = -.781 for the BESS, rb = -.726 for the SSIS-PSG Motivation to Learn domain, and rb
= -.535 for the Prosocial Behavior domain). Risk detection on the BESS was also strongly
correlated with greater ODRs earned (rb = .638), while risk detection on the SSIS-PSG was
moderately related to greater ODRs (rb = .371 for the Motivation to Learn domain and rb = .418
for the Prosocial Behavior domain). When examining attendance, the BESS demonstrated a
moderate correlation (rb = -.442), the SSIS-PSG Motivation to Learn domain a small correlation
(rb = -.249), and the SSIS-PSG Prosocial Behavior domain a similarly small correlation (rb = -
.160). In comparison to the SSIS-PSG behavioral domains and the SIBS and SEBS, the strongest
associations were revealed between risk classification status on the BESS and school
performance indicators.
Additionally, mean differences on school performance indicators between risk
classification groups were investigated. Independent samples t-tests with a Bonferroni correction
(.05/3 = .0167) were run to assess the significance of mean differences between “non-risk” and
“at-risk” classification groups as identified by the combined SIBS/SEBS, SIBS alone, and SEBS
alone screening measures on the indicators of school performance. In some cases, the assumption
of homogeneity of variances was violated, according to Levene’s test; therefore the adjusted t-
test statistic as calculated by IBM SPSS Statistics Version 23 was reported and noted in Table
13, where all results from t-tests run are located. On the combined SIBS/SEBS, on average,
students classified not-at-risk earned significantly higher average grades (M = 3.34, SD = .78)
than students identified as at-risk (M = 2.35, SD = 1.16), t(30) = 4.33, p < .0167, d = 1.17.
60
Results were also significant regarding average grades earned for risk classification groups on
the SIBS alone and SEBS alone, t(152) = 3.05, p < .0167, d = 1.40, and t(27) = 4.01, p < .0167, d
= 1.15, respectively.
When examining behavioral indicators of school performance, students detected as at-
risk on the combined SIBS/SEBS did not earn significantly more ODRs (M = .23, SD = .65) than
students classified not-at-risk (M = 05, SD = .25), t(26) = -1.42, p > .0167, d = -.52. Findings
held for the SIBS alone and SEBS alone, in that no significant differences were found between
risk classification groups on ODRs earned, t(152) = -.785, p > .0167, d = -.37, and t(24) = -1.46,
p > .0167, d = -.58, respectively. Finally, on the combined SIBS/SEBS, on average, students
identified as at-risk did not differ significantly on attendance (M = .92, SD = .074) from students
identified as not at-risk (M = .93, SD = .07), t(152) = .63, p > .0167 d = .14. Again, results were
consistent for the SIBS alone and SEBS alone, t(152) = 1.13, p > .0167, d = .43, and t(152) =
.81, p > .0167, d = .14.
In order to compare mean differences between risk classification groups across screening
measures, independent samples t-tests with a Bonferroni correction were additionally run on risk
classification groups as identified by the criterion screening measures the BESS and SSIS-PSG.
On the BESS, students who were not at-risk earned significantly better average grades (M = 3.36,
SD = .76) than students detected at-risk (M = 2.05, SD = .99), t(152) = 7.16, p < .0167, d = 1.66.
Results were similarly significant for the SSIS-PSG behavioral domains, t(47) = 6.46, p < .0167,
d = 1.46, for Motivation to Learn, and t(40) = 4.22, p < .0167, d = 1.00, for Prosocial Behavior.
Regarding behavioral performance of risk classification groups, students classified as at-risk on
the BESS averaged significantly greater ODRs (M = .50, SD = .80) than students not at-risk (M =
.01, SD = .09), t(21) = -2.88, p < .0167, d = -1.60. However, on the SSIS-PSG behavioral
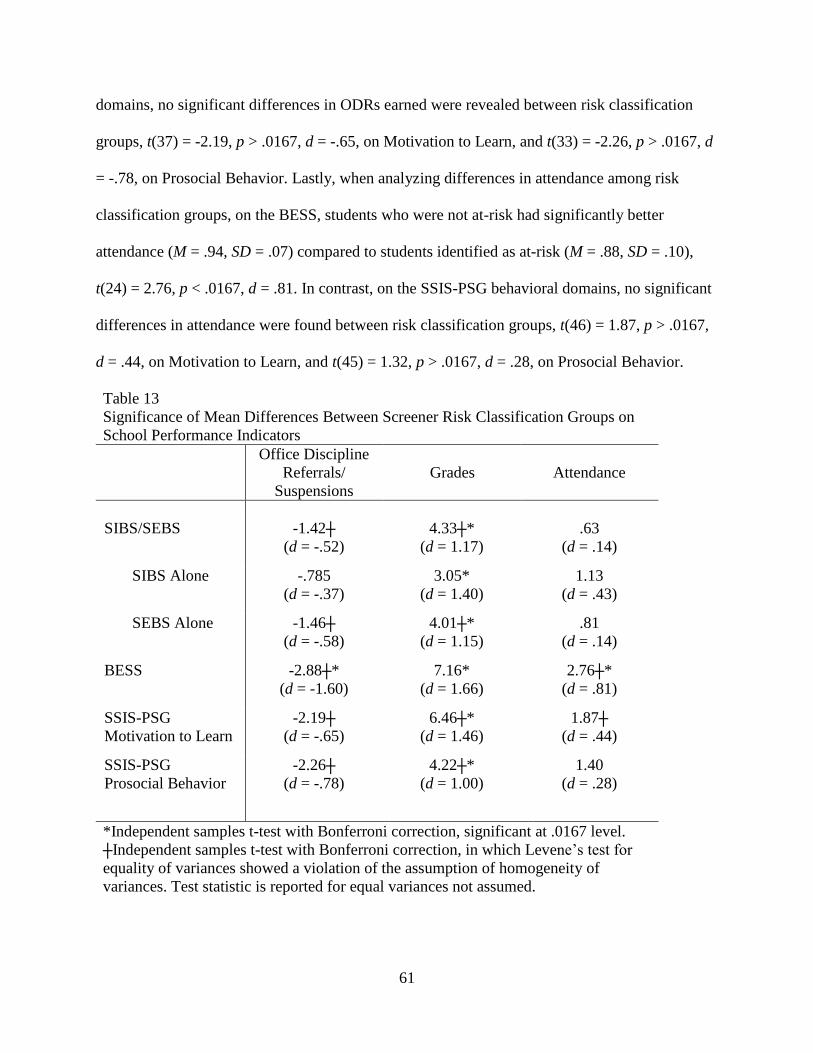
61
domains, no significant differences in ODRs earned were revealed between risk classification
groups, t(37) = -2.19, p > .0167, d = -.65, on Motivation to Learn, and t(33) = -2.26, p > .0167, d
= -.78, on Prosocial Behavior. Lastly, when analyzing differences in attendance among risk
classification groups, on the BESS, students who were not at-risk had significantly better
attendance (M = .94, SD = .07) compared to students identified as at-risk (M = .88, SD = .10),
t(24) = 2.76, p < .0167, d = .81. In contrast, on the SSIS-PSG behavioral domains, no significant
differences in attendance were found between risk classification groups, t(46) = 1.87, p > .0167,
d = .44, on Motivation to Learn, and t(45) = 1.32, p > .0167, d = .28, on Prosocial Behavior.
Table 13
Significance of Mean Differences Between Screener Risk Classification Groups on
School Performance Indicators
Office Discipline
Referrals/
Suspensions
Grades Attendance
SIBS/SEBS -1.42┼
(d = -.52)
4.33┼*
(d = 1.17)
.63
(d = .14)
SIBS Alone -.785
(d = -.37)
3.05*
(d = 1.40)
1.13
(d = .43)
SEBS Alone -1.46┼
(d = -.58)
4.01┼*
(d = 1.15)
.81
(d = .14)
BESS -2.88┼*
(d = -1.60)
7.16*
(d = 1.66)
2.76┼*
(d = .81)
SSIS-PSG
Motivation to Learn
-2.19┼
(d = -.65)
6.46┼*
(d = 1.46)
1.87┼
(d = .44)
SSIS-PSG
Prosocial Behavior
-2.26┼
(d = -.78)
4.22┼*
(d = 1.00)
1.40
(d = .28)
*Independent samples t-test with Bonferroni correction, significant at .0167 level.
┼Independent samples t-test with Bonferroni correction, in which Levene’s test for
equality of variances showed a violation of the assumption of homogeneity of
variances. Test statistic is reported for equal variances not assumed.
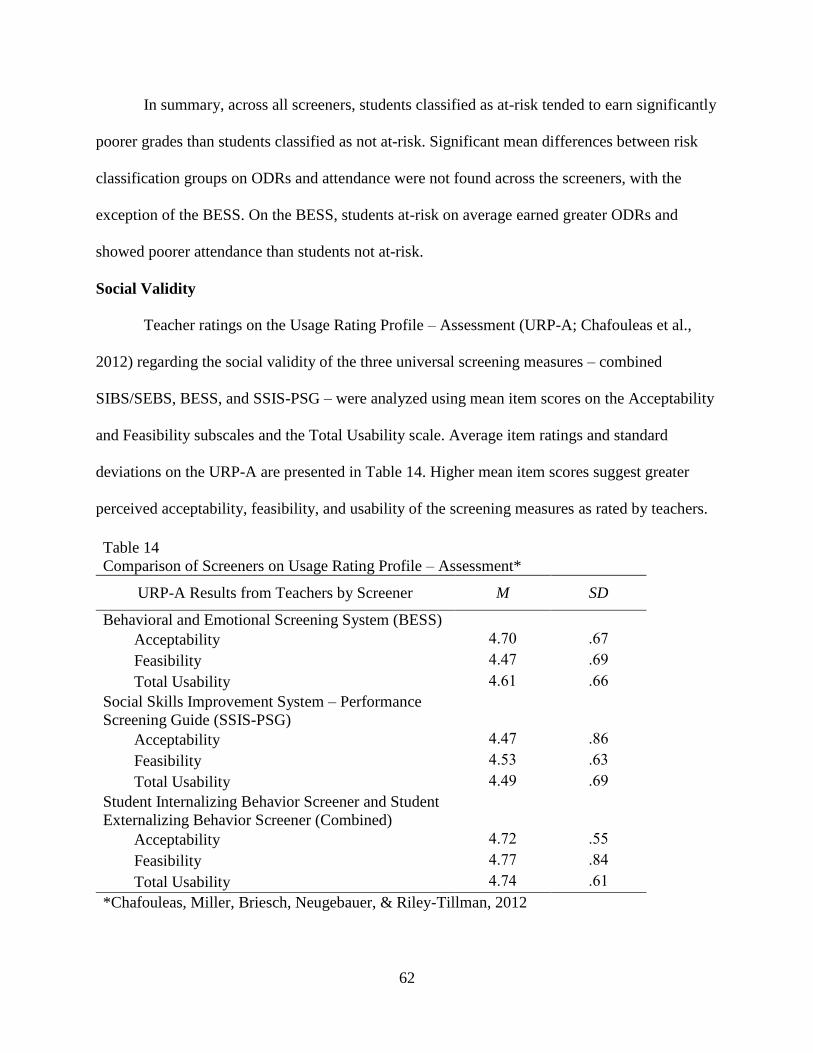
62
In summary, across all screeners, students classified as at-risk tended to earn significantly
poorer grades than students classified as not at-risk. Significant mean differences between risk
classification groups on ODRs and attendance were not found across the screeners, with the
exception of the BESS. On the BESS, students at-risk on average earned greater ODRs and
showed poorer attendance than students not at-risk.
Social Validity
Teacher ratings on the Usage Rating Profile – Assessment (URP-A; Chafouleas et al.,
2012) regarding the social validity of the three universal screening measures – combined
SIBS/SEBS, BESS, and SSIS-PSG – were analyzed using mean item scores on the Acceptability
and Feasibility subscales and the Total Usability scale. Average item ratings and standard
deviations on the URP-A are presented in Table 14. Higher mean item scores suggest greater
perceived acceptability, feasibility, and usability of the screening measures as rated by teachers.
Table 14
Comparison of Screeners on Usage Rating Profile – Assessment*
URP-A Results from Teachers by Screener M SD
Behavioral and Emotional Screening System (BESS)
Acceptability 4.70 .67
Feasibility 4.47 .69
Total Usability 4.61 .66
Social Skills Improvement System – Performance
Screening Guide (SSIS-PSG)
Acceptability 4.47 .86
Feasibility 4.53 .63
Total Usability 4.49 .69
Student Internalizing Behavior Screener and Student
Externalizing Behavior Screener (Combined)
Acceptability 4.72 .55
Feasibility 4.77 .84
Total Usability 4.74 .61
*Chafouleas, Miller, Briesch, Neugebauer, & Riley-Tillman, 2012
63
Teachers’ mean item ratings on the URP-A concerning the combined SIBS/SEBS
screening measure fell in the Agree range for the Acceptability (M = 4.72, SD = .55) and
Feasibility (M = 4.77, SD = .84) subscales, as well as the Total Usability (M = 4.74, SD = .61)
scale, suggesting that the combined SIBS/SEBS was perceived by teachers as being acceptable,
feasible, and usable. Additionally, mean item scores on the combined SIBS/SEBS were
compared to that of the criterion screening measures the BESS and SSIS-PSG. Regarding the
BESS, teachers’ item ratings on the URP-A Acceptability subscale averaged 4.70 (SD = .67), on
the Feasibility subscale 4.47 (SD = .69), and on the Total Usability scale 4.61 (SD = .66).
Teachers’ item ratings on the URP-A concerning the SSIS-PSG showed mean item ratings of
4.47 (SD = .86) on the Acceptability subscale, 4.53 (SD = .63) on the Feasibility subscale, and
4.49 (SD = .69) on the Total Usability scale. Across screening measures, no large differences
were revealed between perceived acceptability compared to feasibility. Overall, mean item
scores on the URP-A were similar across screening measures and suggested teacher agreement
with the acceptability, feasibility, and overall usability of the measures.
64
CHAPTER 4
DISCUSSION
Early identification and intervention for students with emotional and behavioral
difficulties is vital to preventing or moderating adverse outcomes and promoting school success.
Universal screening facilitates early identification of emotional and behavioral risk, necessitating
continued research on universal screening measures and their implementation. The central
purpose of this study was to extend existing research by Cook and colleagues (2011, 2012) and
further investigate the technical adequacy and usability of two universal screening measures, the
Student Internalizing Behavior Screener (SIBS) and the Student Externalizing Behavior Screener
(SEBS), in an elementary school population. The study’s secondary focus was to compare and
contrast psychometric and usability evidence in support of the SIBS and SEBS screening
measures with that of two well-established screening measures, the BESS and SSIS-PSG
behavioral domains. Specifically, the research questions explored in this study evaluated the
SIBS and SEBS in terms of reliability, association between SIBS and SEBS scores and well-
established screening measures, rates of risk detection, consistency in risk detection compared to
criterion screening measures, relationships between risk and school performance indicators,
mean differences between risk classification groups, and teacher-perceived usability of the
screening measures.
The first research question investigated the adequacy of evidence for the internal
consistency and test-retest reliability of the SIBS and SEBS. At both Time 1 and Time 2
administrations, both the SIBS and SEBS reached internal consistency reliability coefficients of
at least .70 (Cronbach’s α = .701-.930), suggesting adequate internal consistency for each
screening measure. These findings are consistent with previous research on the SIBS and SEBS
that found adequate internal consistency reliability coefficients ranging from .79 to .81 on the
65
SIBS and .84 to .89 on the SEBS (Cook et al., 2011; Cook et al., 2012). When examining item
scores across both the SIBS and SEBS in the present study, internal consistency estimates at both
administrations also reached adequate levels (Cronbach’s α of .869 and .902). This demonstrates
internal consistency evidence for use of the two measures in a combined format. Test-rest
reliability coefficients for Time 1 versus Time 2 administrations of the SIBS and SEBS showed
strong, significant Pearson’s product-moment correlations of .790 for the SIBS and .853 for the
SEBS, meeting the suggested threshold of .70 for screening measures (Reynolds & Livingston,
2014). Reliability estimates were in line with previous research showing adequate test-retest
reliability for the SIBS (r = .74; Cook et al., 2011) and the SEBS (r = .92 and .88, depending on
the sample demographics; Cook et al., 2012). Internal consistency reliability estimates, as well as
test-retest reliability estimates, in the current study and in previous research for the SIBS were
slightly lower than for the SEBS. Teachers may be less likely to observe the range of
internalizing behaviors assessed by the SIBS, as these behaviors are inherently less salient, or it
may be that the externalizing behaviors assessed by the SEBS are more likely to co-occur,
improving the internal consistency of the screening measure in comparison to the SIBS. When
ratings from the SIBS and SEBS were analyzed in combination for the current study, test-retest
reliability remained strong and significant (r = .836). Therefore, as hypothesized, findings from
this study provide additional evidence that the SIBS and SEBS screening measures demonstrate
adequate internal consistency and test-retest reliability.
Secondly, the strength of association of scores on the SIBS and SEBS with scores on
well-established universal behavior screening measures was examined to determine evidence for
concurrent validity. Strong and significant correlations were evident between all screening
measure scores (r = ,596-.823), including the combined SIBS/SEBS, BESS, and SSIS-PSG
66
behavioral domains. The directions of the associations between scores on screening measures
were consistent with the types of behaviors assessed, positive or negative. For example, as total
scores on the combined SIBS/SEBS increased (i.e., greater number and/or frequency of problem
behaviors), global ratings on the SSIS-PSG behavioral domains decreased (i.e., fewer prosocial
behaviors). Furthermore, increased total scores on the combined SIBS/SEBS were related to
higher T-scores on the BESS (i.e., greater number and/or frequency of problem behaviors). The
smallest correlation, though still considered strong, was found between the combined
SIBS/SEBS and the SSIS-PSG Motivation to Learn domain. The combined SIBS/SEBS assesses
a variety of internalizing and externalizing behaviors, while the Motivation to Learn domain
assesses mainly academic engagement. The differences in behaviors assessed may account for
the weaker association between scores. Similarly, greater consistencies in behaviors and number
of items assessed by the combined SIBS/SEBS and BESS may provide explanation for a stronger
association in scores. Importantly, the largest correlation with the combined SIBS/SEBS was
found with the BESS (r = .823), which served as one of the criterion measures given the breadth
of research support for its psychometric properties. The strength of the correlation with this
criterion measure, and with the SSIS-PSG criterion measure, provides support for the concurrent
validity of the combined SIBS/SEBS and supports the hypothesis that the combined SIBS/SEBS
significantly correlates with well-established universal behavior screening measures.
The third research question explored the rates of detection of emotional and behavioral
risk by the SIBS and SEBS, similarity in risk detection rates to well-established screening
measures, and consistency and accuracy of risk classification. The combined SIBS/SEBS
identified 16.9% of students in the current study as at-risk. The majority of students detected by
the combined measure were at-risk on the SEBS; that is, more students were perceived by
67
teachers to exhibit significant concerns regarding externalizing behaviors versus internalizing
behaviors. The rate of risk detection by the combined SIBS/SEBS was then compared to that of
the criterion screening measures to determine whether the rates were similar. The BESS
classified 14.3% of the sample as at-risk, and on the SSIS-PSG Motivation to Learn domain
23.4% and Prosocial Behavior domain 20.8% of students were found at-risk. The SSIS-PSG
behavioral domains identified a greater number of students as at-risk, which may have been
related to the use of a single global rating measurement system rather than the rating of multiple
items. The combined SIBS/SEBS and BESS rates of risk detection were more similar, likely due
to the consistency in behaviors assessed and the multiple-item rating measurement system.
However, differences in risk detection rates across the screening measures were not shown to be
statistically significant, which supports the hypothesis that the screening measures classify
similar rates of students as at-risk.
Given the importance of screening measures for identifying academic or emotional and
behavioral risk within a MTSS model, rates of risk detection by the screening measures in the
study were considered in comparison to the expected rate in a MTSS model. However, rates of
emotional and behavioral risk differ across populations, suggesting that the expected rate of risk
in a MTSS model should be considered a general guideline only, not applicable to or
representative of every population. In a MTSS model, it would be expected that approximately
15% of students would be identified as at-risk and in need of additional intervention supports as
part of Tier 2 or Tier 3. In the present study, the universal behavior screening measures classified
between 14.3% and 23.4% of students with emotional and behavioral risk, similar to the
expected rate of 15% in a MTSS model. The BESS and combined SIBS/SEBS were most similar
to the expected rate of identification, but rates of detection on the SSIS-PSG behavioral domains
68
were also not significantly different from the expected rate. However, differences in detection
rates across screening measures, however small, might be an important consideration for schools
because higher rates of risk detection will lead to increased use of and need for school resources,
such as staff time and effort to provide intervention and monitor progress.
In addition, rates of risk detection in the present study are consistent with estimates of the
prevalence of mental health concerns in the population. As discussed previously, approximately
20% of youth experience emotional and behavioral difficulties consistent with a mental health
disorder (Costello et al., 2003). The screening measures in this study classified between 14.3%
and 23.4% of students with emotional and behavioral risk. The consistency in identification rates
on the screening measures with the prevalence of mental health concerns in the population, on an
ideal level, suggests that most youth in need of services would be identified by the screening
measures and then provided with intervention services in schools using a MTSS model. The
exciting implication is that the extreme under-identification of mental health concerns in youth at
present could be addressed by the use of universal screening measures, such as the combined
SIBS/SEBS, BESS, and SSIS-PSG, in schools. It should be noted, however, that the
demographic characteristics of students participating in the present study were not representative
of the general population, and therefore, results (i.e., rates of risk detection) may not be
representative of the general population.
In addition to rates of risk detection, the screening measures were examined regarding the
consistency in students identified. That is, results of the screening measures were analyzed to
determine whether students detected as at-risk (or not at-risk) on one measure were also detected
(or not detected) on another measure. Across all screening measures, including the combined
SIBS/SEBS, BESS, and SSIS-PSG behavioral domains, despite slight differences in students
69
detected, the majority of students (at least 79.2% of the sample) were classified consistently as
either at-risk or not at-risk by the combined SIBS/SEBS compared to each of the criterion
screening measures.
Accuracy in risk detection is another important consideration when selecting among
screening measures. No screening measure will identify risk with complete accuracy, but
conditional probability indices provide an additional method to evaluate whether measures
identify risk and non-risk in a manner that is most beneficial, and least detrimental, for students
(Ikeda, Neesen, & Witt, 2008). With the well-researched BESS serving as the criterion measure,
sensitivity, specificity, positive predictive power, and negative predictive power of the combined
SIBS/SEBS were calculated and examined. The sensitivity of the combined SIBS/SEBS (.682)
met the recommended cutoff of .60, indicating that students are identified by the screening
measure as at-risk with sufficient accuracy. Although the sensitivity index met the cutoff, it does
suggest that the combined SIBS/SEBS missed the identification of approximately 31.8% of
students identified by the BESS as at-risk. Clearly the missed identification of risk, at any rate,
may have significant implications for each student who may not receive intervention services as
a result. The specificity index indicated that classification of non-risk was highly accurate by the
combined SIBS/SEBS, in that 91.7% of students found not at-risk by the BESS were also not at-
risk on the combined SIBS/SEBS.
Positive predictive power of the combined SIBS/SEBS (.577) slightly missed the
recommended cutoff for classification accuracy. Low positive predictive power in this study
indicated that the combined SIBS/SEBS identified additional students not identified by the
criterion measure the BESS, resulting in false positives or the over-identification of risk (Glover
& Albers, 2007). However, rather than being problematic, this is generally acceptable for

70
screening purposes because it is better to provide services for students who are not at-risk than
miss the opportunity to identify and provide services for at-risk students (Levitt et al., 2007).
Furthermore, in a universal screening method that utilizes multiple gating procedures, false
positives would likely be detected with additional, more comprehensive assessments (Kamphaus
et al., 2014). Negative predictive power of the combined SIBS/SEBS (.945) also suggested
adequate accuracy and a low number of false negatives. Yet, this indicates that 5.5% of students
in the sample were falsely identified by the combined SIBS/SEBs as not at-risk. Although it is a
low number of students in the sample (n = 7), the real-world implications for these students
might possibly involve a failure to identify risk in the future and subsequent continuation and/or
worsening of emotional and behavioral difficulties, potentially leading to adverse outcomes.
Therefore, while not a large number of false negatives in this study, the implications of any
number of false negatives are still important to consider in terms of each of those students not
identified. However, as previously discussed, not all conditional probability indices can be
simultaneously maximized (Albers & Kettler, 2014), so one should evaluate all of the indices in
light of the resources available to the school (important with identification of false positives) and
the severity of the problem and its associated outcomes (important with missed identification of
true positives; Glover & Albers, 2007).
In summary, conditional probability indices for the combined SIBS/SEBS revealed
sufficient risk classification accuracy, with the exception of positive predictive power, which is
somewhat acceptable for screening purposes. Although consistent with methods used in a study
by Miller and colleagues (2015) to assess consistency in risk detection by different methods, the
classification accuracy indices in the present study may need to be interpreted with some caution
considering that the criterion measure used was also a screening measure, rather than a more
71
comprehensive measure, such as the BASC Teacher Rating Scale (Kamphaus & Reynolds, 2007)
or Achenbach Teacher Report Form (Achenbach & Rescorla, 2001). Despite this consideration,
results largely supported the hypothesis that the combined SIBS/SEBS consistently identifies
students as at-risk compared to the BESS, providing additional evidence for concurrent validity.
Fourth, the relationship between indicators of school performance, both behavioral and
academic, and scores and risk classification status on universal behavior screening measures was
investigated. Regarding the behavioral indicator of student performance, significant correlations
were revealed between scores on all universal behavior screening measures and office discipline
referrals (ODRs), with the exception of the SIBS alone. This finding would be expected, given
that ODRs are typically issued for externalizing behavior problems (e.g., fighting), while
internalizing behavior problems, such as worry or sadness, would be unlikely to warrant an
ODR. Despite the significance of the associations, the strength was small (r = .270 on the
combined SIBS/SEBS) to moderate (r = .338 on the BESS), depending on the screening
measure, though still similar in strength across measures. In general, the greater the number of
ODRs earned by a student, the greater the number and/or severity of problems reported by
teachers on the combined SIBS/SEBS and BESS; the opposite relationship was apparent with the
SSIS-PSG behavioral domains. The small-to-moderate strength of the relationship may be
accounted for by the range of emotional and behavioral concerns assessed. Because internalizing
behaviors are assessed by the BESS and combined SIBS/SEBS, it may attenuate the correlation
of scores with ODRs. Furthermore, the low number of total ODRs in the study sample suggests
that teachers are likely under-reporting or inconsistently reporting instances of behavior that
should lead to ODRs, which may also affect the relationship.
72
Despite possible inconsistencies in reporting, the relationship with a behavioral indicator
of school performance, such as ODRs, provides important support for use of the combined
SIBS/SEBS, in that the early identification of emotional and behavioral risk can lead to
additional intervention and the prevention of further behavioral problems, as revealed by ODRs
for example. Additionally, when comparing the combined SIBS/SEBS to criterion screening
measures (i.e., BESS and SSIS-PSG), the relationship with ODRs was similar in strength,
indicating that the screening measures demonstrate comparable evidence for predictive validity.
For academic indicators of school performance, evidence for an association with scores
on screening measures was strong for the combined SIBS/SEBS, BESS, and SSIS-PSG
behavioral domains (r = .534-.658). As the number and/or frequency of emotional and behavioral
concerns reported increased (or fewer prosocial or academic engagement behaviors were
evident), students in the study tended to earn poorer average grades. Support for the association
between emotional and behavioral risk and academic achievement also comes from a study by
Chenier (2012), which found that teacher ratings on universal behavior screening measures were
significantly correlated with statewide assessment results in Louisiana. The relationship between
emotional and behavior risk and academic performance, supported by a plethora of studies (e.g.,
Caprara et al., 2000), shows the importance of identifying emotional and behavioral risk.
Addressing risk through intervention may facilitate learning and academic performance, and
schools should give serious consideration to implementing universal screening for emotional and
behavioral risk in addition to universal screening for academic skill deficits.
Although significant, associations between scores on the universal behavior screening
measures and student attendance were small (r = .220) to moderate (r = .322). Generally, as
students’ emotional and behavioral risk increased, school attendance decreased. Poor attendance
73
leads to missed instruction and can potentially impact academic performance. While decreased
attendance is likely also related to other factors, its relationship with emotional and behavior risk
points to the need, as part of a comprehensive approach, to identify risk early, intervene, and
ideally moderate the impact of poorer school attendance on academic performance.
Although the significant association between scores on universal behavior screening
measures and school performance indicators provides important validity evidence, ultimately
risk classification status determines whether students are identified and provided with early
intervention. Therefore, correlations between risk classification status on the screening measures
and school performance indicators were evaluated. The relationship between emotional and
behavioral risk and grades remained strong. Correlations between risk classification status and
average grades were large across all screening measures (rb = .535-.781), with the highest
correlation found with the BESS. The association between risk and ODRs earned was mostly
consistent for risk classification status on the combined SIBS/SEBS, BESS, and SSIS-PSG (rb =
.292-.638), when compared to associations with scores. Again, the smallest correlation was
revealed with the SIBS alone (rb = .156). As with average grades, the strongest correlation with
ODRs was found with risk classification on the BESS. Finally, the relationship between risk
classification status and student attendance varied widely (rb = .076-.442), and its strength was,
for the most part, small to insignificant, depending on the screening measure. Overall, risk
classification status on the BESS, compared to the combined SIBS/SEBS and SSIS-PSG, showed
the strongest association with each of the school performance indicators. Therefore, partial
support was provided for the short-term predictive validity of the combined SIBS/SEBS, most
strongly for academic performance but also slightly for behavioral performance. When compared
74
to the criterion screening measures, the BESS performed more strongly than the combined
SIBS/SEBS in regards to predictive validity.
The fifth research question explored whether mean differences exist between risk
classification groups as identified by universal behavior screening measures on indicators of
school performance, both behavioral and academic. Findings were evaluated across screening
measures. Students at-risk as detected by the combined SIBS/SEBS, on average, earned
significantly lower grades than students classified not-at-risk. These findings held for the BESS
and SSIS-PSG Motivation to Learn and Prosocial Behavior domains. In contrast, mean
differences in both ODRs and attendance between risk classification groups as identified by the
combined SIBS/SEBS and SSIS-PSG were non-significant. Considerations for interpreting these
findings include: strict significance levels due to the number of t-tests conducted (i.e., lower
significance value) and the violation of the assumption of homogeneity of variances across
groups, which reduced the t-value. However, significant mean differences for ODRs and
attendance were found for risk classification groups on the BESS. Therefore, the hypothesis was
partially supported, in that mean differences on the academic performance indicator were found
between risk classification groups on the combined SIBS/SEBS, but differences were not
significant for ODRs and attendance. When comparing findings to the criterion screening
measures, validity evidence for the combined SIBS/SEBS was similar to the SSIS-PSG.
However, the BESS demonstrated stronger validity evidence, with significant mean differences
between risk classification groups apparent for each school performance indicator.
The final research question addressed teacher perceptions of the acceptability, feasibility,
and usability of the combined SIBS/SEBS and contrasted those perceptions with that of well-
established universal behavior screening measures. Acceptability concerns the degree of
75
perceived appropriateness and interest in using an assessment measure. Teacher ratings on the
URP-A revealed a mean item score on the Acceptability subscale of 4.72 (SD = .55) for the
combined SIBS/SEBS, indicating that teachers find the screening measure to be acceptable.
Ratings for the BESS (M = 4.70, SD = .67) and SSIS-PSG (M = 4.47, SD = .86) were similar. A
study by Miller and colleagues (2014) investigating social validity perceptions using the URP-A
revealed consistent ratings on acceptability for the BESS (M = 4.41, SD = .69) and SSIS-PSG (M
= 4.40, SD = .67) in a fall semester administration of the measures. A comparison of findings on
the URP-A across screening measures suggests that teacher find the measures similarly
acceptable, which further supports the use of the combined SIBS/SEBS in schools. If teachers
and/or school administrators perceive that a screening measure is not socially valid or usable,
they may be less likely to adopt it for use in their schools, which points to the importance of a
measure being perceived as acceptable.
Relatedly, feasibility represents the ease of use or completion of the screening measure,
in terms of time or effort involved. Teachers’ ratings on the URP-A were in the Agree range (M
= 4.77, SD = .84) and showed that the combined SIBS/SEBS was perceived by teachers as
feasible to complete. When compared to the well-established screening measures, teachers found
the BESS (M = 4.47, SD = .69) and SSIS-PSG (M = 4.53, SD = .63) similarly feasible. Miller
and colleagues (2014) demonstrated similar URP-A ratings on feasibility for the BESS (M =
4.41, SD = .85) and SSIS-PSG (M = 4.40, SD = .74) in the fall administration of the screening
measures. Feasibility is an essential consideration for screening measures because it stands to
reason that teachers will be resistant and/or less likely to complete a measure that they perceive
as overly time intensive or requiring too much effort.
76
There were no substantial differences in acceptability compared to feasibility within and
across screening measures. Although the combined SIBS/SEBS received slightly higher mean
item ratings for both acceptability and feasibility compared to the other behavior screening
measures, these small differences are likely insignificant. Advantages of the combined
SIBS/SEBS that may relate to acceptability and feasibility include: fewer items than the BESS
(but more than the SSIS-PSG), assessment of a wider range of behaviors than the SSIS-PSG (but
not as much variability in behaviors as the BESS), and simplicity in completing the measure and
interpreting scores. However, these advantages are hypothesized by the researchers only, and
based on the ratings from teachers across screening measures, did not result in significant
differences in teacher perceptions of acceptability or feasibility, according to URP-A ratings.
Overall perceived usability of the screening measures was similar across measures. In
particular the combined SIBS/SEBS received mean item scores similar to the criterion measures,
the BESS and SSIS-PSG. Therefore, as hypothesized, the combined SIBS/SEBS’ perceived
usability is similar to well-established, criterion measures (i.e., BESS). That is, teachers did not
find any screening measure more acceptable or feasible than another measure, which provides
social validity support for the use of the combined SIBS/SEBS, as well as the BESS and SSIS-
PSG.
In addition, data collected for this study revealed important findings related to
identification methods and intervention for students with emotional and behavioral risk. First,
just one student in the study sample (less than 1% of all students in the sample) was identified
and referred for intervention by his or her teacher, possibly reflecting limited teacher knowledge
of available resources for behavioral intervention, inadequate capacity for general education
behavioral intervention in the study’s school districts, or poor recognition of emotional and
77
behavioral risk by teachers. Although this is a surprising finding when compared to the portion
of the study sample identified as at-risk by the universal behavior screening measures (at least
14.3%), it is consistent with the less than 1% rate of special education classification under the
category Emotional Disturbance, where students with significant emotional and behavioral
difficulties would qualify. If referral for intervention in the current study were considered a
method of risk identification by teachers, the rate of emotional and behavioral risk detection by
this method was substantially lower than with the universal behavior screening measures. This
suggests that the majority of at-risk students in the study were not identified by teachers as at-
risk and in need of intervention without the use of the universal behavior screening measures.
Second, similar to teacher nomination methods, the use of ODRs to identify risk in the
sample would have largely under-identified students compared to the universal behavior
screening measures. Just 2 students in the study earned more than 1 ODR over the fall semester,
and only 7 students earned 1 ODR. When used as a risk identification method, ODRs would have
resulted in the referral of 2 students (1% of the sample) for Tier 2 or 3 intervention, as compared
to screening methods, which indicated at least 14.3% of the study sample were at-risk and in
need of additional supports in a MTSS model. Although some of the students may have earned
more ODRs throughout the remainder of the school year and then been identified for
intervention, as an identification method, the use of ODRs relies on an increase in problem
behavior before providing intervention. Therefore, as methods for detection of emotional and
behavioral risk, ODRs and teacher nomination performed poorly in the current study, identifying
surprisingly few students as at-risk, when compared to universal behavior screening measures.
The under-identification of at-risk students by these methods has long-term implications for
student success, such as the possibility of academic failure and school dropout.
78
Limitations and Future Directions
Findings from this study present important implications for research and practice in the
area of universal screening measures for emotional and behavioral risk and their implementation.
However, conclusions from these findings must account for several limitations in the
methodology and sample of the current study. Limitations from this study suggest multiple
avenues for future directions in research in the area of universal screening for emotional and
behavioral risk.
First, regarding methodology, findings were limited to the variables or indicators
assessed. For example, student risk identification methods did not include directly asking
teachers to nominate students who they perceived to be at-risk. In comparison to collecting data
on referral for intervention at the school, teachers may have identified additional students as at-
risk if asked to consider all students’ emotional and behavioral risk. Still, previous research has
found that teacher nomination methods often fail to detect students early, if at all, for additional
school supports (Eklund et al., 2009). However, the primary benefit of teacher nomination may
be the reduced time required for risk identification (e.g., making a list of the top 5 at-risk
students in the class or reporting students to administration as they are identified), compared to
completing a universal screening measure. Extended research in this avenue might explore
whether providing teacher training on signs of emotional and behavioral risk might improve their
accuracy and consistency in identifying at-risk students.
The universal behavior screening measurement method is by its nature a limitation, in
that rating methods only indicate perceptions of behavior from the informant or rater, rather than
observed frequency or severity of behavior in the school setting. Universal screening in a MTSS
model might incorporate other more objective identification methods, such as ODRs or
79
systematic direct observations, to identify the maximum number of students who are true
positives for emotional and behavioral risk. A multiple gating procedure using such methods
might be examined by future research. Furthermore, additional informants, such as parents or
students, might complete the screening measures to identify at-risk students more accurately. The
added value of adding informants to the screening process might be investigated in future
studies. Studies should also examine the addition of informants in terms of the practical
difficulties with implementation, such as the effort and time required to collect parent ratings and
the age requirements for student self-report screening measures. Teacher report may continue to
be the most acceptable and feasible method for screening. Future research on teacher-completed
screening measures might include additional screening measures (i.e., SDQ, SRSS) to provide
more comprehensive comparisons regarding reliability, validity, and usability.
Exploration of the predictive validity of the combined SIBS/SEBS and other screening
measures was limited in the current study. Data on school performance indicators (i.e., grades,
ODRs) were only collected over the course of one semester, or approximately 5 months.
Research on predictive validity would benefit from assessing long-term outcomes for at-risk
students on the combined SIBS/SEBS and other screening measures, such as school dropout.
Additionally, future research might examine the continued assessment of the presence or
development of emotional and behavioral risk over time, in order to determine how risk status or
degree changes. The body of research on universal behavior screening measures might also be
expanded by further investigating the relationship of risk with other school performance
indicators or outcomes, including conduct grades and achievement test scores. Research on such
outcomes, among others, might provide incremental support for the concurrent validity of
universal behavior screening measures.
80
The current study was limited to the single administration of screening measures without
the benefit of systematic intervention for at-risk students or follow-up screening to determine
possible changes in risk status. A potential direction for research to explore, long-term risk could
be assessed with the provision of intervention supports in a MTSS model. Essentially, research
exploring the benefits of universal screening as part of a MTSS model for emotional and
behavioral difficulties would contribute important findings for schools considering
implementation. Within this area, the present study only assessed teacher perceptions of
acceptability and feasibility of completing universal behavior screening measures. Perceptions of
school administrators or MTSS coordinators in regards to universal screening measures for
emotional and behavioral risk would be valuable in furthering research and spreading
implementation of screening. Also, the identification of barriers, by surveys for example, may
lead to improvements in implementation procedures for schools. For instance, school
administrators might perceive the combined SIBS/SEBS as preferable over other screening
measures because it is available for free, or the SSIS-PSG more be viewed somewhat
unfavorably because its higher risk identification rate would require more school resources for
intervention.
Additionally, the composition of the study sample and the data on the outcome variables
limited conclusions. First, the composition of the study sample may have been impacted by the
requirement of active parental consent for participation in the study. A portion of students across
participating classrooms were not included in the study because they did not return parental
permission forms. These students may have provided additional variability in the data related to
emotional and behavioral risk and school performance indicators. Just a small portion of the
study sample was identified as at-risk (36 students or less depending on the screening measure).
81
A larger total sample size would likely increase the sample of students identified as at-risk and
bolster findings in future research. Additionally, a small portion of the study sample withdrew
from participating schools during the study, resulting in the loss of data. In terms of outcomes,
ODR data were limited, possibly due to inaccurate and/or inconsistent reporting or record
keeping by school staff. Additional research in this area might select schools for a study sample
that consistently report and track ODRs. Moreover, differences in the variability of school
performance indicators limited the significance of findings on mean differences between risk
classification groups. With a larger sample, future studies might avoid this limitation. Finally,
conclusions from this study are restricted to the geographic location of the participants in the
study (southeastern Louisiana), and generalizations to other geographic areas should be cautious.
Implications for Schools
This study explores the properties of universal screening measures used to identify
emotional and behavioral risk, particularly the SIBS and the SEBS, and highlights the
importance of early identification and intervention for at-risk students. The body of research on
emotional and behavioral difficulties shows adverse outcomes for at-risk youth without
intervention. This study supports findings that emotional and behavioral risk is associated with
poorer academic performance; it stands to reason that long-term outcomes for at-risk youth are
likely related (i.e., school failure and dropout). The implementation of universal behavior
screening in schools promotes the early identification of risk and within a MTSS model, allows
for early intervention matched to the intensity of need. Ideally, negative outcomes will be
prevented, or at the last, moderated. On the other hand, the challenges with universal screening,
including the time and effort required to complete measures and the resources needed by the
school for implementation of screening and provision of intervention (i.e., staff, finances), may
82
suggest why the implementation of universal screening for emotional and behavioral risk has yet
to be widespread. In the present study, teachers perceived the three universal behavior screening
measures to be acceptable and feasible. However, the usability perceptions and support of school
administrators and other staff is also important to consider for implementation of universal
behavior screening, and further investigation on what factors might encourage and facilitate
adoption of a MTSS model for emotional and behavioral risk is needed.
This study extends research on the SIBS and SEBS and provides evidence for the
technical adequacy and usability of the screening measures in a combined format. The combined
SIBS/SEBS demonstrated adequate reliability, concurrent validity with well-established
screening measures, and short-term predictive validity, especially related to academic
performance. Furthermore, findings from this study were consistent with previous research on
the SIBS and SEBS. The combined SIBS/SEBS also performed fairly well in comparison to the
criterion screening measures, the BESS and SSIS-PSG, for example in risk detection rates. In
addition, although it should be interpreted cautiously given that results may not be representative
of the general population, rates of risk detection by the combined SIBS/SEBS were similar to the
expected rate in a MTSS model and to the prevalence of mental health concerns in the
population. Ratings from teachers who completed the combined SIBS/SEBS in this study
suggested that it is an acceptable and feasible screening measure. Its perceived usability was
consistent with that of the BESS and SSIS-PSG. In conclusion, the case for use of the combined
SIBS/SEBS in a MTSS model for emotional and behavioral risk does not rely on the
demonstration of significantly better or greater technical adequacy or usability evidence as
compared to other screening measures, such as the BESS and SSIS-PSG, just that it shows
similarly adequate evidence, which the findings from this study largely support. With similar
83
evidence revealed for its use, the combined SIBS/SEBS may be an ideal choice for schools
implementing universal behavior screening, given its availability at no cost and the limited
resources available to schools.
Universal behavior screening will continue to be an important area for future research
because of the prevalence of emotional and behavioral risk in students and the necessity of
identifying and addressing mental health needs, which are often not identified, or identified late,
in schools and other settings. The current study provides an excellent foundation for future
research in the implementation of the SIBS and SEBS in a MTSS model and in the correlates and
outcomes for youth detected as at-risk on universal behavior screening measures. The addition of
research regarding universal behavior screening will ideally support the spread of its adoption in
schools and improve the provision of mental health services for at-risk students in school,
supporting the success of all students.
84
REFERENCES
Achenbach, T. M., & Edelbrock, C. S. (1978). The classification of child psychopathology: A
review and analysis of empirical efforts. Psychological Bulletin, 85, 1275–1301.
Achenbach, T. M., & Rescorla, L. A. (2001). Manual for the ASEBA School-Age Forms and
Profiles. Burlington, VT: University of Vermont, Research Center for Children, Youth,
and Families.
Albers, C. A., Glover, T. A., & Kratochwill, T. R. (2007). Introduction to the special series: How
can universal screening enhance educational and mental health outcomes? Journal of
School Psychology, 45, 113-116.
Albers, C. A., & Kettler, R. J. (2014). Best practices in universal screening. In P. L. Harrison, &
A. Thomas (Eds.), Best practices in school psychology: Data-based and collaborative
decision making (pp. 121-131). Bethesda, MD: National Association of School
Psychologists.
American Educational Research Association (AERA), American Psychological Association
(APA), & National Council for Measurement in Education (NCME). (1999). Standards
for educational and psychological testing. Washington, DC: AERA.
American Psychiatric Association. (2013). Diagnostic and statistical manual of mental disorders
(5th ed.). Washington, DC: Author.
Barkley, R. A., Fischer, M., Smallish, L., & Fletcher, K. (2004). The persistence of attention-
deficit/hyperactivity disorder into young adulthood as a function of reporting source and
definition of disorder. Journal of Abnormal Psychology, 111, 279–289.
Batsche, G., Elliot, J., Graden, J. L., Grimes, J., Kovaleski, J. F., Prasse, D., et al. (2005).
Response to intervention: Policy considerations and implementation. Alexandria, VA:
National Association of State Directors of Special Education.
Bradley, R., Doolittle, J., & Bartolotta, R. (2008). Building on the data and adding to the
discussion: The experiences and outcomes of students with emotional disturbance.
Journal of Behavioral Education, 17, 4-23. doi: 10.1007/s10864-007-9058-6
Caprara, G. V., Barbaranelli, C., Pastorelli, C, Bandura, A., & Zimbardo, P. G. (2000). Prosocial
foundations of children’s academic achievement. Psychological Science, 11, 302-306.
Chafouleas, S. M., Miller, F. G., Briesch, A. M., Neugebauer, S. R., & Riley-Tillman, T. C.
(2012). Usage Rating Profile – Assessment. Storrs, CT: University of Connecticut.
Chenier, J. S. (2012). Using behavior screening data to predict scores on statewide assessments.
(Doctoral dissertation). Retrieved from http://etd.lsu.edu/docs/available/etd-11152012-
111639/unrestricted/Chenier_diss.pdf
85
Chin, J. K., Dowdy, E., & Quirk, M. P. (2013). Universal screening in middle school: Examining
the Behavioral and Emotional Screening System. Journal of Psychoeducational
Assessment, 31, 53-60. doi: 10.1177/0734282912448137
Cohen, J. (1977). Statistical power analysis for the behavioral sciences (rev. ed.). New York,
NY: Academic Press.
Cook, C. R., Rasetshwane, K. B., Truelson, E., Grant, S., Dart, E. H., Collins, T. A., & Sprague,
J. (2011). Development and validation of the Student Internalizing Behavior Screener:
Examination of reliability, validity, and classification accuracy. Assessment for Effective
Intervention, 36(2), 71-79. doi: 10.1177/1534508410390486
Cook, C. R., Volpe, R. J., & Gresham, F. M. (2012). Technical adequacy, classification
accuracy and social validity of the Student Externalizing Behavior Screener.
Unpublished manuscript.
Cook, C. R., Volpe, R. J., & Livanis, A. (2010). Constructing a roadmap for future universal
screening research beyond academics. Assessment for Effective Intervention, 35, 197-205.
doi: 10.1177/1534508410379841
Costello, J. E., Mustillo, S., Erkanli, A., Keeler, G., & Angold, A. (2003). Prevalence and
development of psychiatric disorders in childhood and adolescence. Archives of General
Psychiatry, 60, 837−844.
Cowen, E. L., Dorr, D., Clarfield, S. P., Kreling, B., McWilliams, S. A., Pokracki, F.,… Wilson,
A. B. (1973). The AML: A quick-screening device for early identification of school
maladaption. American Journal of Community Psychology, 1, 12-35. doi:
10.1007/BF00881243
Del’Homme, M., Kasari, C., Forness, S. R., & Bagley, R. (1996). Prereferral intervention and
students at-risk for emotional or behavioral disorders. Education and Treatment of
Children, 19, 272-285.
Donovon, M. S., & Cross, C. T. (2002). Minority students in special education. Washington, DC:
National Academy Press.
Dowdy, E., Doane, K., Eklund, K., & Dever, B. V. (2011). A comparison of teacher nomination
and screening to identify behavioral and emotional risk within a sample of
underrepresented students. Journal of Emotional and Behavioral Disorders, 21, 127-137.
doi: 10.1177/1063426611417627
Drummond, T. (1994). The Student Risk Screening Scale (SRSS). Grants Pass, OR: Josephine
County Mental Health Program.
Eklund, K., Renshaw, T. L., Dowdy, E., Jimerson, S. R., Hart, S. R., Jones, C. N., & Earhart, J.
(2009). Early identification of behavioral and emotional problems in youth: Universal
screening versus teacher-referral identification. The California School Psychologist, 14,
89-95.
86
Elliot, S. N. & Gresham, F. M. (2007). Social Skills Improvement System – Performance
Screening Guide. San Antonio, TX: Pearson Assessments.
Feil, E. G., Severson, H. H., & Walker, H. M. (2002). Early screening and intervention to
prevent the development of aggressive, destructive behavior patterns among at-risk
children. In M. R. Shinn, H. M. Walker, & G. Stoner (Eds.), Interventions for academic
and behavior problems II: Preventive and remedial approaches (pp. 143-166). Bethesda,
MD: National Association of School Psychologists.
Field, A. (2009). Discovering statistics using SPSS (3rd ed.). Thousand Oaks, CA: SAGE
Publications.
Gerber, M. M., & Semmel, M. I. (1984). Teacher as imperfect test: Reconceptualizing the
referral process. Educational Psychologist, 16, 137–148. doi:
10.1177/0022219409335217
Glover, T. A., & Albers, C. A. (2007). Considerations for evaluating universal screening
assessments. Journal of School Psychology, 45, 117-135. doi: 10.1016/j.jsp.2006.05.005
Goodman, R. (1997). The Strengths and Difficulties Questionnaire: A research note. Journal of
Child Psychology and Psychiatry, 38, 581-586. doi: 10.1111/j.1469-7610.1997.tb01545.x
Gottlieb, G. (1991). Experiential canalization of behavioral development: Theory.
Developmental Psychology, 27, 4-13.
Gresham, F. M. (2004). Current status and future directions of school-based behavioral
interventions. School Psychology Review, 33, 326–343.
Gresham, F. M. (2005). Response to intervention: An alternative means of identifying students
as emotionally disturbed. Education and Treatment of Children, 28, 328-344.
Harrison, J. R., Vannest, K. J., & Reynolds, C. R. (2013). Social acceptability of five screening
instruments for social, emotional, and behavioral challenges. Behavioral Disorders, 38,
171-189.
Hawkin, L. S., Vincent, C. G., & Schumann, J. (2008). Response to intervention for social
behavior. Journal of Emotional and Behavioral Disorders, 16, 213-225. doi:
10.1177/1063426608316018
Hayes, S. C., Nelson, R. O, & Jarrett, R. B. (1987). The treatment utility of assessment: A
functional approach to evaluating assessment quality. American Psychologist, 42,
963−974.
Horner, R. H., Sugai, G., Todd, A. W., & Lewis-Palmer, T. (2005). School-wide positive
behavior support. In L. Bambara & L. Kern (Eds.), Individualized supports for students
with problem behaviors: Designing positive behavior plans (pp. 359-390). New York,
NY: Guildford Press.
87
Ikeda, M. J., Neesen, E., & Witt, J. C. (2008). Best practices in universal screening. In A.
Thomas & J. Grimes (Eds.), Best practices in school psychology V (pp. 721-734).
Bethesda, MD: National Association of School Psychologists.
Individuals with Disabilities Education Improvement Act of 2004, 20 U.S.C. § 1400 et esq.
(2004) (reauthorization of Individuals with Disabilities Act of 1990)
Kamphaus, R. W., DiStefano, C., Dowdy, E., Eklund, K., & Dunn, A. R. (2010). Determining
the presence of a problem: Comparing two approaches for detecting youth behavioral
risk. School Psychology Review, 39, 395-407.
Kamphaus, R. W., & Reynolds, C. R. (2007). BASC-2 Behavioral and Emotional Screening
System. Minneapolis, MN: Pearson Assessment.
Kamphaus, R. W., Reynolds, C. R., & Dever, B. V. (2014). Behavioral and mental health
screening. In R. J. Kettler, T. A. Glover, C. A. Albers, & K. A. Feeney-Kettler (Eds.),
Universal screening in educational settings: Evidence-based decision making for schools
(pp. 249-273). Washington, DC: American Psychological Association.
Kauffman, J. M. (2001). Characteristics of emotional and behavioral disorders in children and
youth (7th ed.). Upper Saddle, NJ: Merrill / Prentice Hall.
Kettler, R. J., Elliott, S. N., Davies, D., & Griffin, P. (2011). Testing a multi-stage screening
system: Predicting performance on Australia’s national achievement test using teachers’
ratings of academic and social behaviors. School Psychology International, 33, 93-111.
Kettler, R. J., Glover, T. A., Albers, C. A., & Feeney-Kettler, K. A. (2014). An introduction to
universal screening in educational settings. In R. J. Kettler, T. A. Glover, C. A. Albers, &
K. A. Feeney-Kettler (Eds.), Universal screening in educational settings: Evidence-based
decision making for schools (pp. 249-273). Washington, DC: American Psychological
Association.
King, K. R., & Reschly, A. L. (2014). A comparison of screening instruments: Predictive validity
of the BESS and BSC. Journal of Psychoeducational Assessment, 32, 687-698. doi:
10.1177/0734282914531714
King, K., Reschly, A. L., & Appleton, J. J. (2012). An examination of the validity of the
Behavioral and Emotional Screening System in a rural elementary school: Validity of the
BESS. Journal of Psychoeducational Assessment, 30, 527-538. doi:
10.1177/0734282912440673
Lane, K. L. (2007). Identifying and supporting students at risk for emotional and behavioral
disorders within multi-level models: Data driven approaches to conducting secondary
interventions with an academic emphasis. Education and Treatment of Children, 30, 135–
164.
Lane, K. L., Carter, E. W., Pierson, M. R., & Glaeser, B. C. (2006). Academic, social, and
behavioral characteristics of high school students with emotional disturbances or learning
88
disabilities. Journal of Emotional and Behavioral Disorders, 14, 108-117. doi:
10.1177/10634266060140020101
Lane, K. L., Oakes, W. P., Menzies, H. M., & Germer, K. A. (2014) Screening and identification
approaches for detecting students at risk. In H. M. Walker, & F. M. Gresham (Eds.),
Handbook of evidence-based practices for emotional and behavioral disorders:
Applications in schools (pp. 129-151). New York, NY: The Guilford Press.
Levitt, J. M., Saka, N., Romanelli, L. H., & Hoagwood, K. (2007). Early identification of mental
health problems in schools: The status of instrumentation. Journal of School Psychology,
45, 163-191. doi:10.1016/j.jsp.2006.11.005
Loades, M. E., & Mastroyannopoulou, K. (2010). Teachers’ recognition of children’s mental
health problems. Child and Adolescent Mental Health, 15, 150–156. doi:
10.1111/j.14753588.2009.00551.x
Malecki, C. K., & Elliott, S. N. (2002). Children’s social behaviors as predictors of academic
achievement: A longitudinal analysis. School Psychology Quarterly, 17, 1-23.
McIntosh, K., Frank, J. L., & Spaulding, S. A. (2010). Establishing research-based trajectories of
office discipline referrals for individual students. School Psychology Review, 39, 380-
394.
Miller, F. G., Chafouleas, S. M., Briesch, A. M., Riley-Tillman, T. C., Welsh, M. E., Fabiano, G.
A., & Neugebauer, S. R. (2014). Extending social validity to assessment practices:
Construct validation of the Usage Rating Profile. Manuscript in preparation.
Miller, F. G., Cohen, D., Chafouleas, S. M., Riley-Tillman, T. C., Welsh, M. E., & Fabiano, G.
A. (2015). A comparison of measures to screen for social, emotional, and behavioral risk.
School Psychology Quarterly, 30, 184-196.
National Association of School Psychologists (2002). Position statement on students with
emotional and behavioral disorders. Bethesda, MD: Author.
NCS Pearson Education. (2012). AIMSweb. San Antonio, TX: Author.
O’Connell, M. E., Boat, T., Warner, K. E. (Eds.). (2009). Preventing mental, emotional, and
behavioral disorders among young people: Progress and possibilities. Washington, DC:
National Academy Press.
Renshaw, T. L., Eklund, K., Dowdy, E., Jimerson, S. R., Hart, S. R., Earhart, J., & Jones, C. N.
(2009). Examining the relationship between scores on the Behavioral and Emotional
Screening System and student academic, behavioral, and engagement outcomes: An
investigation of concurrent validity in elementary school. The California School
Psychologist, 14, 81-88.
Reynolds, C. R. (1979). Should we screen preschoolers? Contemporary Educational Psychology,
4, 175-181. doi: 10.1016/0361-476X(79)90073-0
89
Reynolds, C. R., & Livingston, R. B. (2014). A psychometric primer for school psychologists. In
P. L. Harrison, & A. Thomas (Eds.), Best practices in school psychology: Foundations
(pp. 281-300). Bethesda, MD: National Association of School Psychologists.
Romer, D., & McIntosh, M. (2005). The roles and perspectives of school mental health
professionals in promoting adolescent mental health. In D. L. Evans, E. B. Foa, R. E.
Gur, H. Hendin, C. P. O’Brien, M. E. P. Seligman, et al. (Eds.), Treating and preventing
adolescent mental health disorders: What we know and what we don’t know (pp. 598-
615). New York, NY: Oxford University Press.
Salvia, J., & Ysseldyke, J. E. (2004). Assessment in special and inclusive education (9th ed.).
Boston, MA: Houghton Mifflin.
Severson, H. H., & Ary, D. V. (1983). Sampling bias due to consent procedures with
adolescents. Addictive Behaviors, 8, 433-437.
Severson, H. H., Walker, H. M., Hope-Doolittle, J., Kratochwill, T. R., & Gresham, F. M.
(2007). Proactive, early screening to detect behaviorally at-risk students: Issues,
approaches, emerging innovations, and professional practices. Journal of School
Psychology, 45, 193-223.
Shapiro, E. S., Keller, M. A., Edwards, L., Lutz, G., & Hintze, J. M. (2006). General outcome
measures and performance on state assessment and standardized tests: Reading and math
performance in Pennsylvania. Journal of Psychoeducational Assessment, 42, 19-35.
Skiba, R. J., Middelberg, L. V., & McClain, M. B. (2014) Screening and identification
approaches for detecting students at risk. In H. M. Walker, & F. M. Gresham (Eds.),
Handbook of evidence-based practices for emotional and behavioral disorders:
Applications in schools (pp. 54-70). New York, NY: The Guilford Press.
Skiba, R. J., Simmons, A. D., Ritter, S., Gibb, A., Rausch, M. K., Cuadrado, J., & Chung, C. G.
(2008). Achieving equity in special education: History, status, and current challenges.
Exceptional Children, 74, 264-288.
Sugai, G., Sprague, J. R., Horner, R. H., & Walker, H. M. (2000). Preventing school violence:
The use of office discipline referrals to assess and monitor school-wide discipline
interventions. Journal of Emotional and Behavioral Disorders, 8, 94-101.
Tilly, W. D. (2008). The evolution of school psychology to science-based practice: Problem
solving and the three-tiered model. In A. Thomas & J. Grimes (Eds.), Best practices in
school psychology V (pp.17-35). Bethesda, MD: National Association of School
Psychologists.
Wagner, M., Kutash, K., Duchnowski, A. J., Epstein, M. H., & Sumi, W. C. (2005). The children
and youth we serve: A national picture of the characteristics of students with emotional
disturbances receiving special education. Journal of Emotional and Behavioral
Disorders, 13, 79-96.
90
Walker, H. M., & Severson, H. H. (1990). Systematic Screening for Behavior Disorders:
Technical manual. Longmont, CO: Sopris West.
Walker, H. M., & Severson, H. (1992). Systematic Screening for Behavior Disorders (2nd ed.).
Longmont, CO: Sopris West.
Walker, H. M., Severson, H. H., & Seeley, J. R. (2010). Universal, school-based screening for
the early detection of behavioral problems contributing to later destructive outcomes. In
M. R. Shinn, & H. M. Walker (Eds.), Interventions for achievement and behavior
problems in a three-tier model including RTI (pp. 677-702). Bethesda, MD: National
Association of School Psychologists.
Walker, H. M., & Shinn, M. R. (2002). Structuring school-based interventions to achieve
integrated primary, secondary, and tertiary prevention goals for safe and effective
schools. In M. R. Shinn, H. M. Walker, & G. Stoner (Eds.), Interventions for academic
and behavior problems II: Preventative and remedial approaches (pp. 1–25). Bethesda,
MD: National Association of School Psychologists.
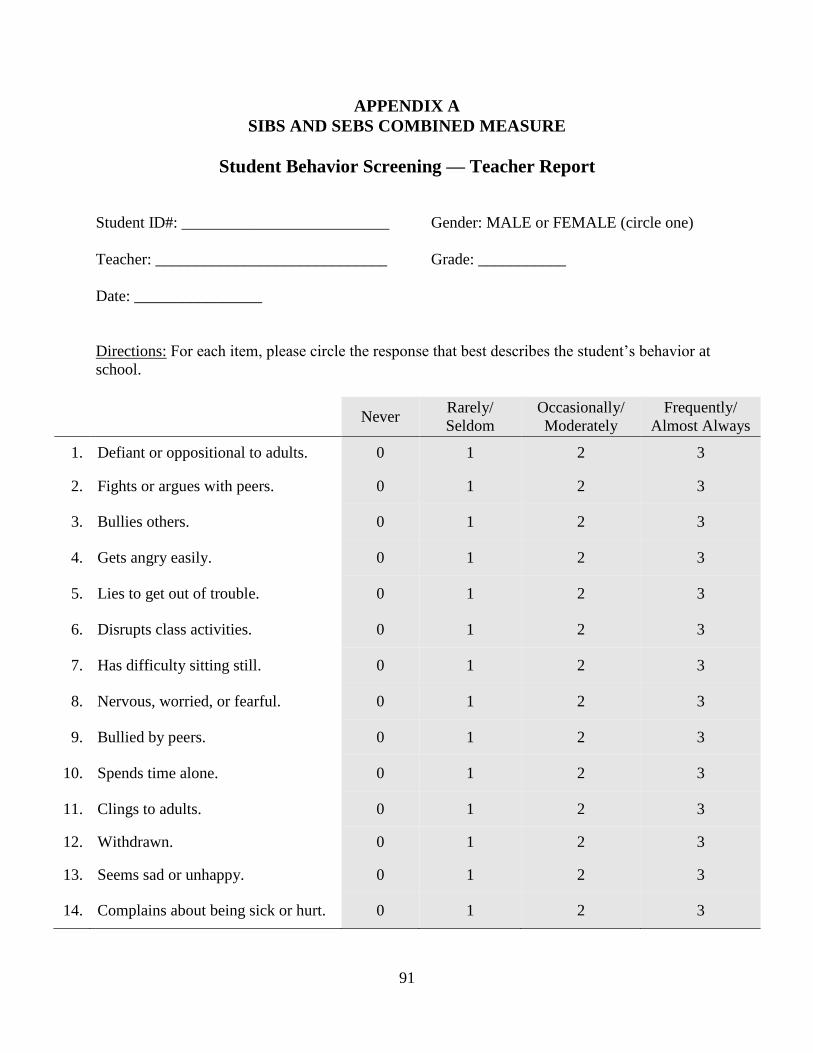
91
APPENDIX A
SIBS AND SEBS COMBINED MEASURE
Student Behavior Screening — Teacher Report
Student ID#: __________________________ Gender: MALE or FEMALE (circle one)
Teacher: _____________________________ Grade: ___________
Date: ________________
Directions: For each item, please circle the response that best describes the student’s behavior at
school.
Never
Rarely/
Seldom
Occasionally/
Moderately
Frequently/
Almost Always
1. Defiant or oppositional to adults. 0 1 2 3
2. Fights or argues with peers. 0 1 2 3
3. Bullies others. 0 1 2 3
4. Gets angry easily. 0 1 2 3
5. Lies to get out of trouble. 0 1 2 3
6. Disrupts class activities. 0 1 2 3
7. Has difficulty sitting still. 0 1 2 3
8. Nervous, worried, or fearful. 0 1 2 3
9. Bullied by peers. 0 1 2 3
10. Spends time alone. 0 1 2 3
11. Clings to adults. 0 1 2 3
12. Withdrawn. 0 1 2 3
13. Seems sad or unhappy. 0 1 2 3
14. Complains about being sick or hurt. 0 1 2 3
92
APPENDIX B
IRB APPROVAL
93
APPENDIX C
CONSENT AND ASSENT FORMS ______________________________________________________________________________
LOUISIANA STATE UNIVERSITY
ADMINISTRATOR INFORMED CONSENT FORM
We are requesting your approval and support to conduct the study Student Internalizing Behavior
Screener and Student Externalizing Behavior Screener: An Analysis of Reliability, Validity, and
Usability in Elementary School Populations at your school. The following sections outline the
details of the study.
Purpose of the Study: Early identification and intervention for students at-risk for emotional
and behavioral difficulties is key to producing the best outcomes. Universal screening is a
proactive method for detecting at-risk students that involves relatively brief behavior
assessments of all students. This study is being conducted to examine two free, recently
developed universal behavior screeners for use in schools. In addition, this study will provide
valuable knowledge for the purpose of comparing and contrasting the accuracy and acceptability
of multiple behavior screeners.
Description of the Study: We are requesting approval to conduct a study on universal behavior
screeners at your school. With your support, we will request participation in the study from
teachers at your school. We will provide a training to teachers on the study procedures and
provide all materials before the study begins. Parental permission and student assent will be
obtained, but students will not be observed, asked to complete anything or do anything
differently, nor interact with researchers. Teachers will be asked to complete several brief
screeners on all students in their class with parental permission approximately 6 weeks into the
school year. On these screeners, teachers will rate each student’s behavior and academic
performance at school. One month later, teachers will complete one of the screeners again and
fill out a short questionnaire indicating their opinion of the screeners. At the end of the semester
we will collect information on students’ office discipline referrals (ODRs), conduct grades,
suspensions, referral for school-based interventions, attendance, and academic grades.
Completing the training, rating scales, and additional student information will take
approximately 6-7 hours of each teacher’s time over the course of the semester. Frank Gresham,
Ph.D., and Kelsey Hartman, M.A., of the Department of Psychology at Louisiana State
University (LSU) are conducting this research.
Benefits: By participating in this study, your school will be contributing to the evaluation of
universal behavior screeners and knowledge on the benefits and disadvantages of different
screeners. Findings will be useful in providing insight into the development of screeners and
implementation in schools. As a practical benefit to your school, completing the behavior
screeners may help detect students in your school who are in need of extra supports. We will also
provide each teacher with a summary on the screening results, so that they may see how students
are performing overall behaviorally. Your school will also gain knowledge on available universal
behavior screeners for use at your school. In addition, to show our appreciation for teachers’

94
time, effort, and assistance in our research efforts, we will provide each participating teacher
with a $10 gift card. All participating teachers will also be entered into a raffle to win a $100 gift
card. In order to be eligible for this compensation, teachers must participate until the end of the
study.
Risks: There are minimal risks associated with participation in this study. For example, teachers
may feel uncomfortable rating students’ behavior; however, they will be trained on rating
procedures to minimize these risks. Additionally, by completing the screeners, teachers may
identify students in need of extra behavioral supports. If pursued, this may require the use of
school resources but for the benefit of the students.
Right to Refuse: Participation in this study is voluntary and your school will only be included if
you agree to participate. You may choose to withdraw your school’s participation at any time
without affecting your relationship with your school or with LSU.
Privacy: Data will be kept completely confidential through the use of ID numbers, so that data
cannot be linked to names. Results of this study may be published, but no names or identifying
information will be included.
If you have any questions about this study, you may contact Dr. Frank Gresham at (225) 578-
4663 or Kelsey Hartman at [email protected], Monday-Friday 8:00 a.m. – 4:30 p.m. If you
have any questions about your child’s rights or other concerns, please contact Dennis Landin,
Chairman, Institutional Review Board, (225) 578-8692, [email protected], www.lsu.edu/irb.
By signing this form, I acknowledge that I have read and understand the above information. I
also acknowledge the researchers’ obligation to provide me with a copy of this consent form if
signed by me.
PLEASE CIRCLE ONE:
I give approval for teachers and students at my school to participate. YES NO
Name (please print): ______________________________________________
Signature: ______________________________________________ Date: _______________
Phone Number: __________________________
Email: ______________________________________________________________________
(Please provide the email address you are most easily reached at.)
______________________________________________________________________________
95
LOUISIANA STATE UNIVERSITY
TEACHER INFORMED CONSENT FORM
We are requesting your participation and collaboration in the study Student Internalizing
Behavior Screener and Student Externalizing Behavior Screener: An Analysis of Reliability,
Validity, and Usability in Elementary School Populations. The following sections outline the
details of the study.
Purpose of the Study: Early identification and intervention for students at-risk for emotional
and behavioral difficulties is key to producing the best outcomes. Universal screening is a
proactive method for detecting at-risk students that involves relatively brief behavior
assessments of all students. This study is being conducted to examine two free, recently
developed universal behavior screeners for use in schools. In addition, this study will provide
valuable knowledge for the purpose of comparing and contrasting the accuracy and acceptability
of multiple behavior screeners.
Description of the Study: We are requesting your assistance in this study on universal behavior
screeners. We will provide a training on the study procedures and provide all materials before the
study begins. Parental permission and student assent will be obtained, but students will not be
asked to complete anything. You will be asked to complete several brief screeners on all students
in your class with parental permission approximately 6 weeks into the school year. On these
screeners, you will rate each student’s behavior and academic performance at school. One month
later, you will complete one of the screeners again and fill out a short questionnaire indicating
your opinion of the screeners. At the end of the semester we will collect information on students’
office discipline referrals (ODRs), conduct grades, suspensions, referral for school-based
interventions, attendance, and academic grades. Completing the training, rating scales, and
additional student information will take approximately 6-7 hours of your time over the course of
the semester. This study is being conducted with your administrator’s approval. Frank Gresham,
Ph.D., and Kelsey Hartman, M.A., of the Department of Psychology at Louisiana State
University (LSU) are conducting this research.
Benefits: By participating in this study, you will be contributing to the evaluation of universal
behavior screeners and knowledge on the benefits and disadvantages of different screeners.
Findings will be useful in providing insight into the development of screeners and
implementation in schools. As a practical benefit to you, completing the behavior screeners may
help you detect students in your classroom who are in need of extra supports, which should
expedite and facilitate intervention planning and implementation. We will also provide you with
a summary of your classroom’s performance on the screeners, so that you may see how your
students are performing overall behaviorally. In addition, to show our appreciation for your time,
effort, and assistance in our research efforts, we will provide each participating teacher with a
$10 gift card. All participating teachers will also be entered into a raffle to win a $100 gift card.
In order to be eligible for this compensation, you must participate until the end of the study.
Risks: There are minimal risks associated with participation in this study. For example, you may
feel uncomfortable rating students’ behavior; however, you will be trained on rating procedures

96
to minimize these risks. Furthermore, data will be kept completely confidential through the use
of ID numbers, so that data cannot be linked to names.
Right to Refuse: Participation in this study is voluntary and you will only be included if you
agree to participate. You may choose to withdraw your participation at any time without
affecting your relationship with your school or with LSU.
Privacy: Data will remain completely confidential. Results of this study may be published, but
no names or identifying information will be included.
If you have any questions about this study, you may contact Dr. Frank Gresham at (225) 578-
4663 or Kelsey Hartman at [email protected], Monday-Friday 8:00 a.m. – 4:30 p.m. If you
have any questions about your child’s rights or other concerns, please contact Dennis Landin,
Chairman, Institutional Review Board, (225) 578-8692, [email protected], www.lsu.edu/irb.
By signing this form, I acknowledge that I have read and understand the above information. I
also acknowledge the researchers’ obligation to provide me with a copy of this consent form if
signed by me.
PLEASE CIRCLE ONE:
I agree to participate. YES NO
Name (please print): ______________________________________________
Signature: ______________________________________________ Date: _______________
Phone Number: __________________________
Email: ______________________________________________________________________
(Please provide the email address you are most easily reached at.)
______________________________________________________________________________
97
LOUISIANA STATE UNIVERSITY
PARENTAL PERMISSION
Your child has been selected to participate in a research project about different measures of
students’ behavior at school and how that might be related to their grades, attendance, and
reports of their behavior in school. The name of this project is Student Internalizing Behavior
Screener and Student Externalizing Behavior Screener: An Analysis of Reliability, Validity, and
Usability in Elementary School Populations. This study is being conducted at your child’s school
with administrator approval and support. Frank Gresham, Ph.D., and Kelsey Hartman, M.A., of
the Department of Psychology at Louisiana State University (LSU) are conducting this research.
The purpose of this study is to investigate how teachers’ ratings of students’ behavior might be
linked to students’ academic performance, attendance, and behavior at school. The researchers
are also interested in learning about new measures of student behavior and finding out how
consistently teachers rate students’ behavior.
As part of this project, your child’s teacher will be asked to complete several rating forms on
your child’s behavior at school. Researchers with LSU will collect these rating forms and also
review your child’s recent academic and conduct grades, attendance, and school reports of your
child’s behavior. Your child will not be asked to do anything differently than what he/she
normally does at school.
There are minimal risks associated with participation in this study. By rating your child’s
behavior, your child’s teacher may become aware that your child is experiencing difficulties at
school. However, your child is likely to benefit by being rated on behaviors that could potentially
lead to problems in school. By becoming aware of these specific behaviors, your child’s school
will be better able to develop and implement helpful interventions. Your child’s participation in
this study may also increase research knowledge of the best ways to measure student behavior,
which may benefit other children in the future.
Rating results and other information about your child will remain completely confidential. Your
child will be assigned a code number so he/she cannot be identified by personal information.
Results of the study may be published, but no names or identifying information will be included
for publication. Data will be kept confidential unless release is required by law.
Your child’s participation is voluntary, and you may withdraw your child from the study at any
time without affecting your relationship with your child’s school or with LSU.
If you have any questions about this study, you may contact Dr. Frank Gresham at (225) 578-
4663 or Kelsey Hartman at [email protected], Monday-Friday 8:00 a.m. – 4:30 p.m. If you
have any questions about your child’s rights or other concerns, please contact Dennis Landin,
Chairman, Institutional Review Board, (225) 578-8692, [email protected], www.lsu.edu/irb.

98
By signing this form, I acknowledge that I have read and understand the above information. I
also acknowledge the researchers’ obligation to provide me with a copy of this consent form if
signed by me.
PLEASE CHECK ONE and return this completed form with your child to school.
____ YES, I give my permission for my child to participate in this study.
____ NO, I prefer that my child not participate in this study.
Date _______________________
Child’s Name (please print) _______________________________________________
Parent/Guardian Name (please print) ________________________________________________
Parent/Guardian Signature ________________________________________________________
Phone Number _______________________ Email ____________________________________
______________________________________________________________________________
CHILD ASSENT
I, _______________________________________________________________, agree to be in a
study to help learn more about measuring kids’ behavior and its connections to grades and
behavior at school. I understand that my grades and reports of my behavior may be looked at, but
I don’t need to do anything differently at school. I can decide to stop being in the study at any
time without getting in trouble.
Child’s Name: __________________________________ Age:______ Date: ____________
Witness*: ___________________________________ Date: _________________
*The witness must be present for the assent process, not just the signature by the minor.
99
VITA
Kelsey Lynn Hartman, a native of Carmel, Indiana, received her Bachelor of Arts degree
in Elementary Education with a minor in Spanish in 2008 from Goshen College in Goshen,
Indiana. Over the next three years, she volunteered with the Boys & Girls Club in Fresno,
California, substitute taught in Indianapolis, Indiana, and taught English in Quito, Ecuador.
These experiences sparked an interest in classroom management and assessment and intervention
for children with behavioral, social, and emotional difficulties. In 2011, she entered graduate
school in the Department of Psychology at Louisiana State University. She received her Master
of Arts degree from LSU in May 2014 and completed her predoctoral internship with the
psychological services department of Cypress-Fairbanks Independent School District in Houston,
Texas. She expects to graduate with her doctorate in August 2016.