Embed Size (px)
Citation preview
STUDENT OUTCOME AND ACHIEVEMENT REPORT (SOAR)
COLLEGE PERFORMANCE OF NEW MARYLAND
HIGH SCHOOL GRADUATES
March 2009
MARYLAND HIGHER EDUCATION COMMISSION 839 Bestgate Rd. Suite 400 Annapolis, MD 21401-3013
MARYLAND HIGHER EDUCATION COMMISSION
Kevin M. O’Keefe, Chairman
Donald J. Slowinski, Sr., Vice Chairman
Joshua Ackerman
Joann A. Boughman
Mark R. Frazer
Anwer Hasan
Leronia A. Josey
James G. Morgan
Nhora Barrera Murphy
Emmett Paige, Jr.
Chung K. Pak
Paul L. Saval
James E. Lyons, Sr. Secretary of Higher Education
Martin O’Malley Anthony G. Brown Governor Lt. Governor
Authored by Danette Gerald, Ph.D.
Introduction
Maryland has much to celebrate in terms of its educational system. Nationally, Maryland is among the top five states in bachelor’s degree production, and ranks third, behind only Massachusetts and Colorado, in the percentage of its workforce holding advanced degrees, bachelor’s degrees or associate’s degrees. On the P-12 front, Maryland’s public education system was recently named #1 in the nation by Education Week, and ranked #1 in achievement and participation rates on the College Board’s Advanced Placement exams. In light of these accomplishments, however, an examination of student performance data at the intersection of the P-12 and postsecondary systems suggests that more needs to be done to ensure that a greater number of the state’s high school students graduate with the skills necessary to be considered “college-ready.” These data also imply that an “expectations gap” exists between P-12 educators who expect students to acquire a certain knowledge base in order to graduate from high school, postsecondary faculty who typically expect students to possess a different, more expansive skill set in order to be prepared for college-level work. In this vein, this edition of the Student Outcome and Achievement Report (SOAR) continues to serve as the Maryland Higher Education Commission’s (MHEC) response to the General Assembly’s 1988 edict to “improve information to high schools and local school systems concerning the performance of their graduates at the college level.” Since 1990, the SOAR study has provided county superintendents, high school principals and college administrators with the following information for recent high school graduates who attend in-state colleges and universities: the proportion of students who required remedial coursework in math, English and reading; average student grades in the first college math and English courses; and cumulative grade point average earned at the end of the first year of collegiate study. Since 1996, MHEC has included data about students’ high school experiences in the SOAR study in an effort to better understand factors that may influence academic performance in college. The College Board, which administers the Scholastic Assessment Test, and the American College Testing Program (ACT) provide the high school experience data that are included in SOAR. Students who take the SAT or ACT complete a comprehensive questionnaire which asks questions about their high school experiences and academic performance, as well as their family and background characteristics. Students’ questionnaire responses provide information about the courses they took in various subjects and the grades they received, the number of years they studied in a specific academic area, if they enrolled in honors classes, and their grade point averages and class rank. This information is then matched to the SOAR academic performance data that are collected at the end of students’ first year of college.
The Study The 2009 SOAR relies upon two sets of data, the academic performance data (which are collected directly from the colleges and universities) and the SAT/ACT data, to examine the relationship between students’ academic achievements and experiences in high school and how they did during their first year in college. Specifically, the report includes students who
1
graduated from Maryland high schools in the 2005-2006 year and who also enrolled at a Maryland college or university during the 2006-2007 academic year. SOAR also includes an examination of the long-term graduation and transfer patterns of students who enrolled at public colleges and universities through fall 2000 (four-year campuses) and fall 2002 (community colleges). The report contains four separate sections. The first examines the differences between the college performance of students who did and did not complete a college preparatory curriculum in high school, as indicated by the self-reported SAT/ACT data. The second part contains the results of a multivariate regression analysis which attempts to identify factors that best predict student performance during the first year of college. The third section examines trends in the data since 1997-1998. The final section of the study presents the four-year graduation and transfer rates for students who enrolled in community colleges after graduating from high school, and the six-year graduation rates for students who enrolled in public four-year institutions after completing high school. The graduation rates are based on whether or not students completed a college preparatory curriculum in high school. Returning readers will observe two notable differences in this edition of SOAR. First, throughout the report the terms remedial and developmental are used interchangeably. Also, for the first time since the study began, separate analyses were conducted for Latino students and they are no longer included as part of the “other” category in the race/ethnicity breakdowns.
Study Limitations Like every research study, SOAR has certain limitations that should be considered when interpreting the analyses. These limitations are outlined below:
Approximately 40 percent of students who graduated from Maryland high schools in 2005-2006 and attended college in the state are not included in the study because they did not take the SAT or ACT, and high school experiences information could not be obtained for students who did not take one of these standardized tests. It is likely that most of the individuals who were excluded from the analyses for this reason attended community colleges which do not require students to submit standardized test scores.
The high school experiences data included in the report were self reported through a
questionnaire that students completed when they took the SAT or ACT. These data were not verified by external sources such as high school transcripts, and are therefore not definitive. However, it is common for researchers to rely on self-reported data when collecting information from students. Several major, highly-respected national surveys, including the Cooperative Institutional Research Program (CIRP) Freshman Survey administered by the Higher Education Research Institute at the University of California Los Angeles, and the Beginning College Survey of Student Engagement which is hosted by the Center for Postsecondary Research at Indiana University, are based upon self-reported data from recent high school graduates.
2
On the SAT/ACT questionnaires some students may indicate that they completed Algebra II when, in fact, it took them two years to complete Algebra I. Additionally, some colleges and universities admit students who have not completed Algebra II even though completing mathematics courses at least through this level typically indicates that students are prepared for college-level mathematics. The self-reported data included in SOAR do not capture these important nuances which impact students’ ability to successfully enroll in and complete credit-bearing mathematics courses.
The content and level of rigor of high school courses taught in specific subject areas may
vary across counties, schools and even within the same school. Therefore, there is no guarantee that all students who took a particular course had the same intellectual experience, or were adequately prepared to be successful in a college or university setting.
The report only contains information about Maryland high school graduates who enrolled
at Maryland colleges or universities, and excludes all Maryland high school graduates who enrolled in higher education institutions in another state. Forty-eight percent of students who graduated from Maryland public high schools in 2005-2006 and went directly on to college attended in-state institutions, and 29 percent of public high school graduates enrolled in college in Maryland and took the SAT or ACT. However, 37 percent of Maryland high school graduates who enrolled in college attended out-of-state institutions. The percentage of graduates who enroll in out-of-state institutions varies, sometimes considerably, by county and jurisdiction, and excluding data about the performance of these students may understate or overstate the SOAR results for some local education agencies.
While all of the community colleges in the State have adopted common standards for
requiring students to take remedial courses, a student’s likelihood of being placed in a remedial course at a four-year college or university may vary considerably depending upon the institution that he or she chooses to attend. Currently, each four-year institution sets its own standards for placing students in remedial courses, and there is no uniformity in the assessment instruments used to do so. Additionally, not all four-year colleges and universities offer remedial coursework, and this is true even among the public four-year colleges and universities. For example, in the fall of 2006, Coppin State University, Salisbury University and the University of Maryland College Park did not offer remedial programs in at least one of the three key subject areas – math, English or reading. Thus, students who may have otherwise been required to take a remedial course in one of these areas were placed directly in a credit-bearing course if they attended one of these three institutions.
3
SOAR Findings
I. College Performance of CORE and NON-CORE Students As in previous versions of the SOAR study, this update examines the academic performance of recent Maryland high school graduates during their first year of study at a Maryland college or university based upon whether they completed a college-preparatory course of study in high school. Students who completed a college preparatory curriculum are identified as “core” students, and those that did not complete a college preparatory curriculum are identified as “non-core” students. This section of the report examines students’ need for developmental coursework in math, reading and/or English, the average grades obtained in the first college math and English courses, and the cumulative grade point average earned after the first year of postsecondary study. The data are presented by postsecondary institution, jurisdiction gender and race in Tables 2-13. Core students in the 2006-2007 freshman cohort outperformed non-core students on every measure of academic achievement, although in some cases, the margin of difference between the two groups was minimal. A smaller percentage of core than non-core students required remedial assistance in math, English, or reading. On average, core students also earned higher grades in their first math and English courses, and had higher grade point averages at the end of their first year of college. With few exceptions, core students performed better than non-core students regardless of background characteristics (i.e., gender or race), the county or regional jurisdiction in which they attended high school, or the specific college or university they attended. These trends have been evident since SOAR’s inception. Remediation. The SOAR analyses in show that considerably more non-core (49 percent) than core (32percent) students needed to take a developmental math course upon enrolling in college. More non-core (22 percent) than core (11 percent) students also required remedial assistance in English, and the same was true for reading where 25 percent of non-core versus 13 percent of core students needed remediation. These results are consistent with a 2003 report by the National Center for Education Statistics (NCES) which tracked the long-term outcomes of high school graduates of the Class of 1992. The study found that there was a direct relationship between the intensity of a student’s high school curriculum and the number of remedial courses they need to take in college. For example, the NCES study found that while less than 15 percent of students whose high school curriculum was in the highest academic intensity quintile enrolled in a remedial course, more than two-thirds of those whose high school course of study was in the lowest academic intensity quintile required remediation. When examining only students who began their postsecondary careers at community colleges, over half (56 percent) of students in the core category required math remediation, while 21 percent and 22 percent, respectively, needed a developmental course in English and reading. Comparatively, two-thirds of non-core community college students (69 percent) were assessed as needing remediation in math, 35 percent required remedial help in English and 35 percent needed assistance in reading.
4
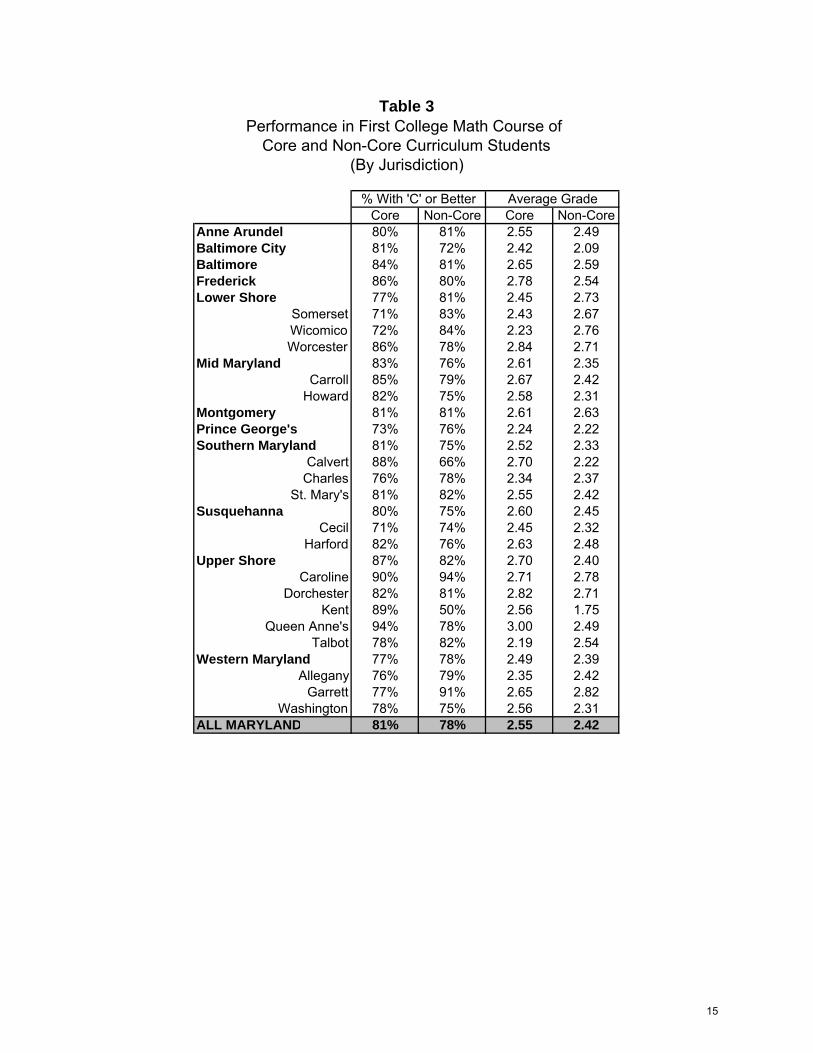
At the public four-year universities, 15 percent of core students were assessed as needing remedial assistance in math, while smaller percentages needed remedial coursework in English (3 percent) and reading (7 percent). Of the non-core students at these campuses, 28 percent had to take a developmental math course, while 7 percent and 13 percent, respectively, enrolled in developmental courses in English and reading. Baltimore City, the Lower Shore (Somerset Wicomico and Worcester counties) Prince George’s county and the Susquehanna region (Cecil and Harford counties) had the largest proportion of core students, ranging from 37 percent to 42 percent, who needed to take a developmental math course. These areas also had the highest math remediation rates, of at least 50 percent, among non-core students. English remediation rates were highest among core students from the Lower Shower, the Upper Shore (Caroline, Dorchester, Kent, Queen Anne’s and Talbot counties) and Western Maryland where at least 15 percent of graduates in this category had to enroll in a developmental English course. More than 25 percent of all non-core students from Baltimore City, the Upper Shore, and Western Maryland (Allegany, Garrett and Washington counties) were required to take a developmental English course. Prince George’s County led the State in the percentage of core students placed in a developmental reading course (24 percent), while more than 30 percent of non-core students from Baltimore City, Prince George’s County, and the Upper Shore needed remedial assistance in reading. Among students in the core and non-core categories, more women than men needed remedial assistance in math. The remediation rates for men and women were nearly the same, for both the core and non-core groups, in English and reading. African American and Latino students in the core and non-core categories were more likely than students from other racial and ethnic backgrounds to require developmental coursework in math, English or reading. For example, while 49 percent of African American and 40 percent of Latino students in the core category required remedial assistance in math, much smaller percentages of Asian (24 percent) and White (39 percent) students did so. Grade in First Math Course. Core students earned an average grade of 2.55 in their first college math course and performed better than non-core students who earned an average grade of 2.42. By a narrow margin, a slightly higher percentage of core (81 percent) than non-core (78 percent) students earned at least a “C” grade in the first math class. Core students who attended high school in Frederick County earned the highest math grade of individuals from any jurisdiction (2.78), and core students from Prince George’s County earned the lowest average math grade (2.24). Although a greater proportion of women than men were required to take a remedial math course, women outperformed men college mathematics. For example, among core students, 85 percent of women received a “C” or better in the first math course, while only 76 percent of men did so. Similarly, women in the core category earned an average grade of 2.57 in the first math class, while the men’s average grade was 2.38.
5

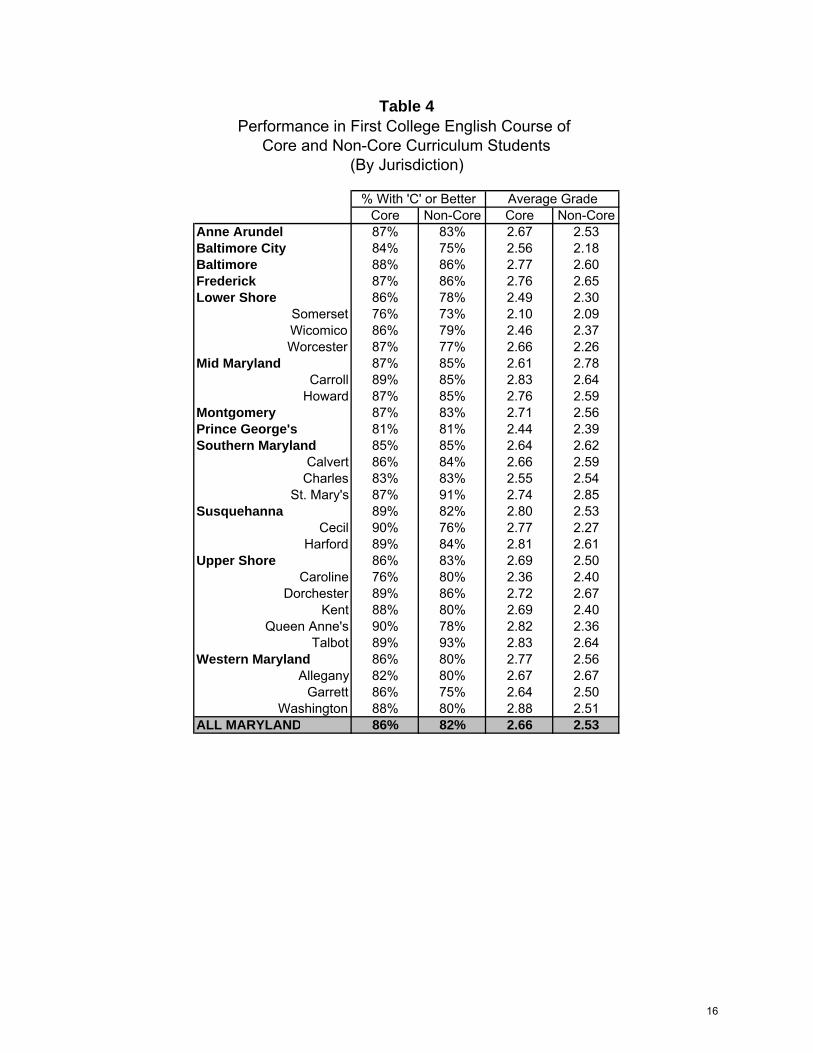
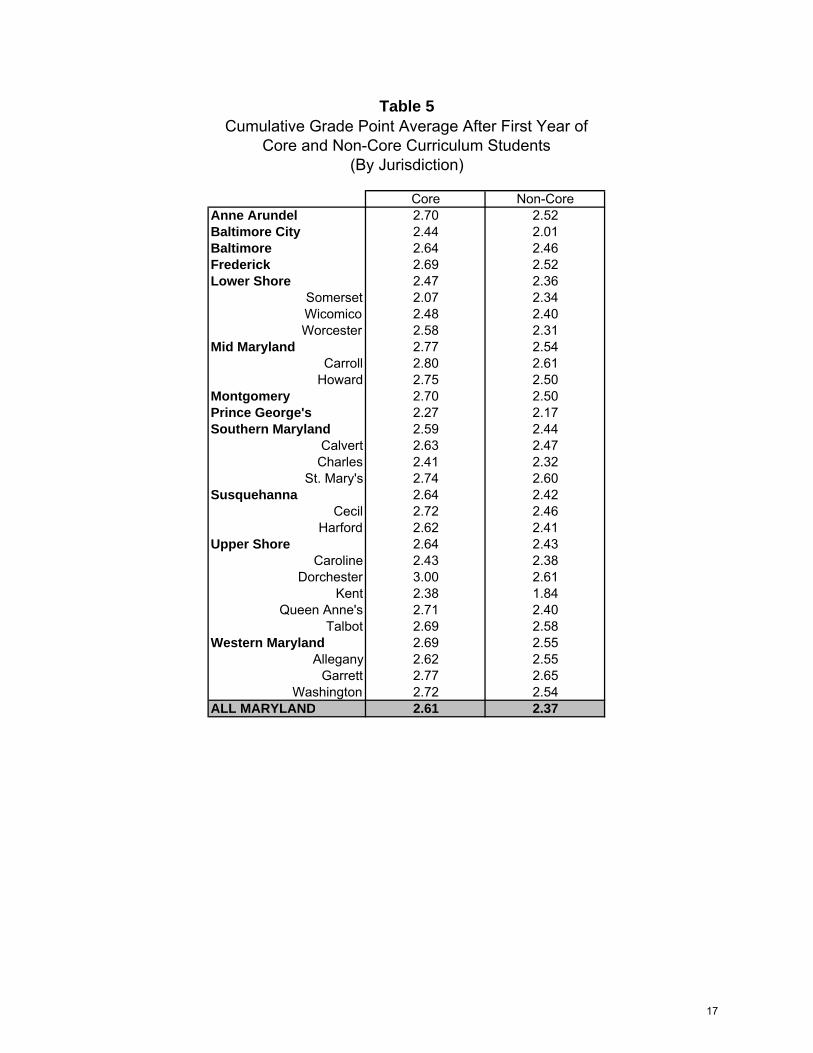
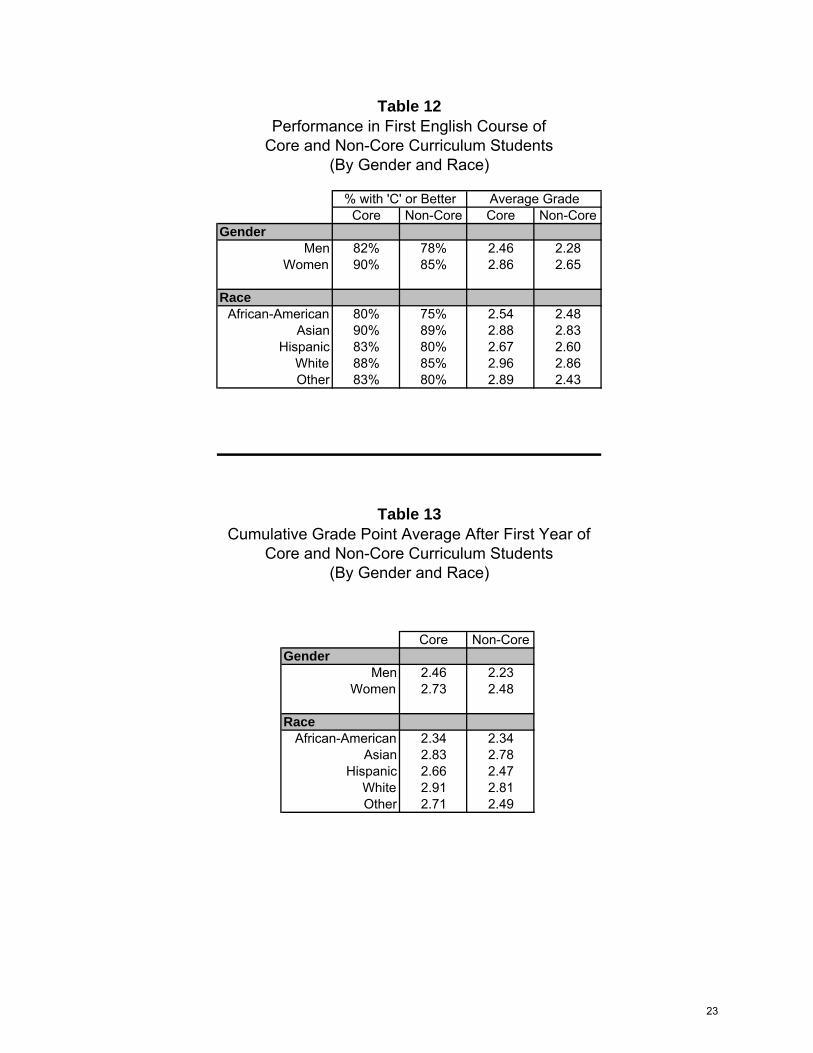
Grade in First English Course. Students in the core category earned an average grade of 2.66 in their first college English course, while non-core students earned a grade of 2.53. Large proportions of both core (86 percent) and non-core (82 percent) students attained at least a “C” or better in the first English class. Core students who attended high school in Baltimore County (2.77), Frederick County (2.76), the Susquehanna region (2.80) and Western Maryland (2.77) earned the highest English grades. Core students from Prince Georges County attained a 2.44 in the first English course, the lowest average grade of all jurisdictions. Women outperformed men in the core (2.86 vs. 2.46) and non-core (2.65 vs. 2.28) categories, receiving grades that were dramatically higher than those of their male peers. Although African American students’ grades (2.54 for core; 2.48 non-core) were considerably lower than those of students from other groups, substantial proportions of African American students in the core (80 percent) and non-core (75 percent) categories earned a grade of “C” or better in their first college English course. Grade Point Average (GPA). After their initial year in college, the statewide, cumulative grade point average was 2.61 for core students and 2.37 for non-core students. Core students who attended high school in the Mid Maryland region (Carroll and Howard counties) earned the highest GPA (2.77) while those from Prince George’s County attained the lowest (2.27). The grade point averages of women, both core and non-core, were considerably higher than those of men in either group. African American core and non-cores students earned a 2.34 grade point average which was lower than the grade point averages of students from other racial/ethnic groups. II. FACTORS AFFECTING COLLEGE PERFORMANCE In an effort to identify factors that influence and might help to predict college success, the SOAR analyses include an examination of the relationship between students’ high school experiences and background characteristics and their performance in college. This section is designed to provide high school teachers, guidance counselors, administrators and parents with information that they can use when advising students about preparing for college. Method. A multiple regression analysis was conducted using the grades received in the first college math and English courses and cumulative grade point average after the first year of college as measures of collegiate performance (dependent variables), and numerous items from the SAT questionnaire as well as demographic data from the SOAR database which served as indicators of high school experiences and student background characteristics (independent variables). Data from the ACT were not included in this section of the study because the small number of students who took this test may have distorted the results. The following five steps were followed for this analysis:
The SAT and SOAR data were used to build a model that only contained relevant variables – those that were good predictors of college performance.
6
A stepwise selection approach that only retained variables that met the standard significance criterion for each of the college performance variables was implemented. This step eliminated the majority of the high school experiences and background attribute variables.
A correlation coefficient was calculated for each set of college performance and high school experiences variables, and among each of the high school experiences variables.
A multiple regression analysis was conducted by entering all of the high school experiences variables simultaneously and examining their relationship with each of the college performance variables separately. If a high school experiences variable did not achieve a t significance level of .01 on the multiple regression analysis and did not have a correlation coefficient of at least .1 in its relationship with the college performance variable, it was eliminated.
Another series of multiple regression analyses were conducted, one for each of the college performance variables. The remaining high school experiences variables were entered individually in order of their strength. The results of the analyses are displayed in Tables 14, 15 and 16.
The individual factors which emerged as the predictors of college performance (t<.01) are listed below in order of their strength: First Math Grade High School Grade Point Average SAT Math Score Honors Chemistry Average Grade – Math Race Average Grade – Foreign Languages Gender First English Grade High School Grade Point Average SAT Verbal Score Gender Race Average Grade – English Honors English Grade Point Average High School Grade Point Average SAT Verbal Score SAT Math Score Race Gender Average Grade – English Average Grade – Social Sciences Honors Chemistry Father’s Educational Level
7
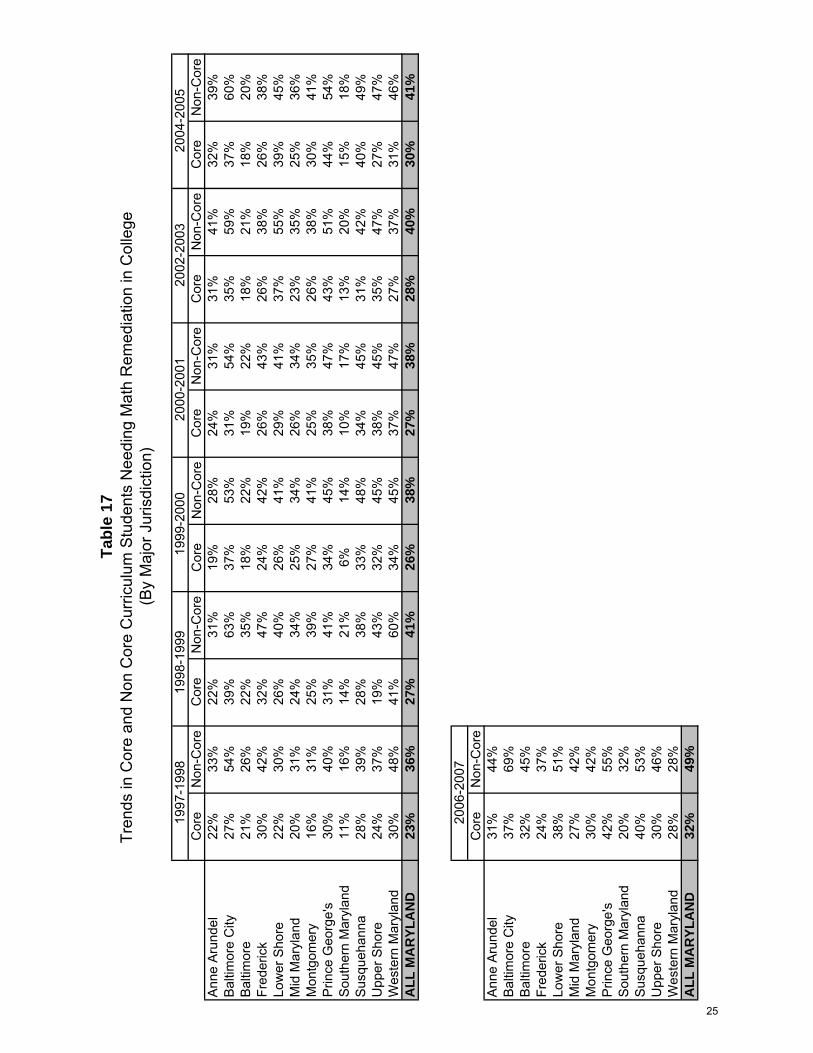
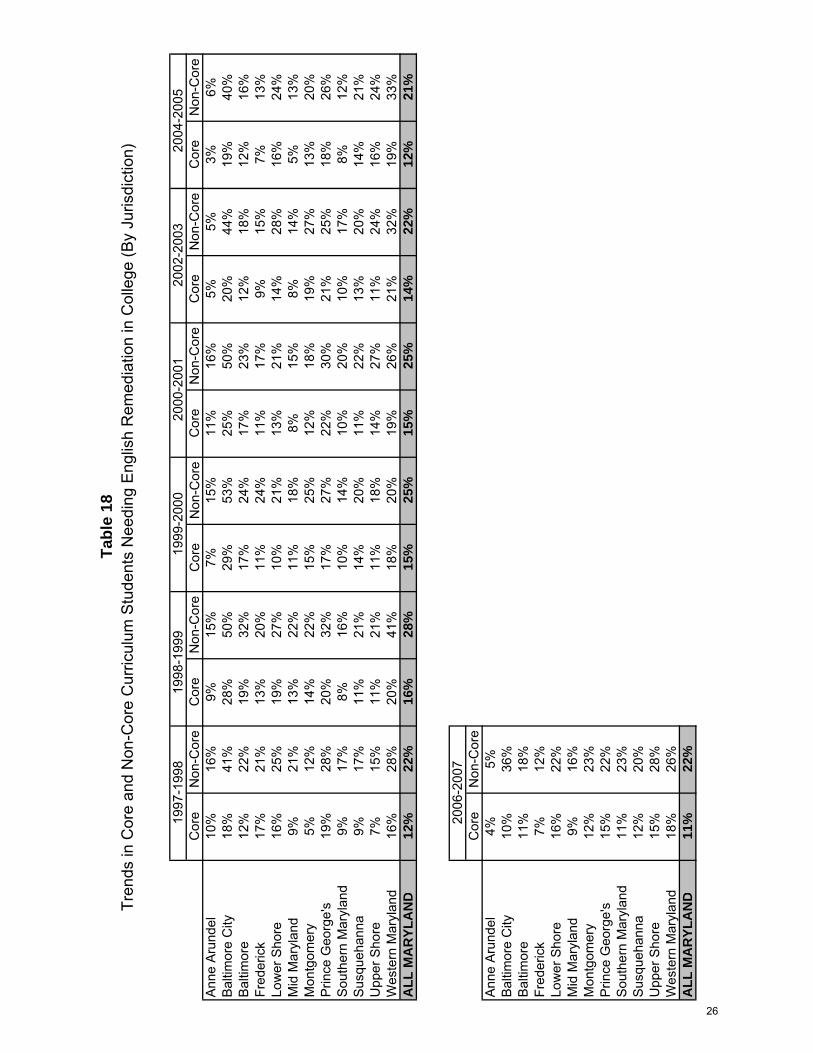
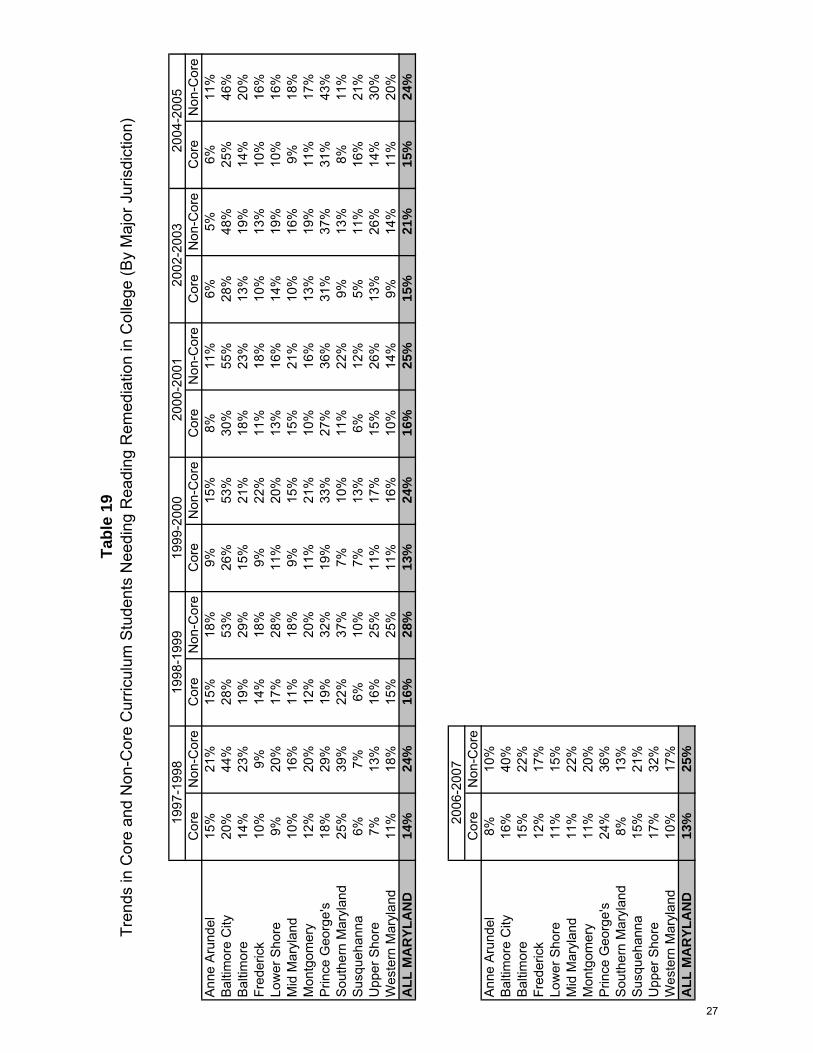
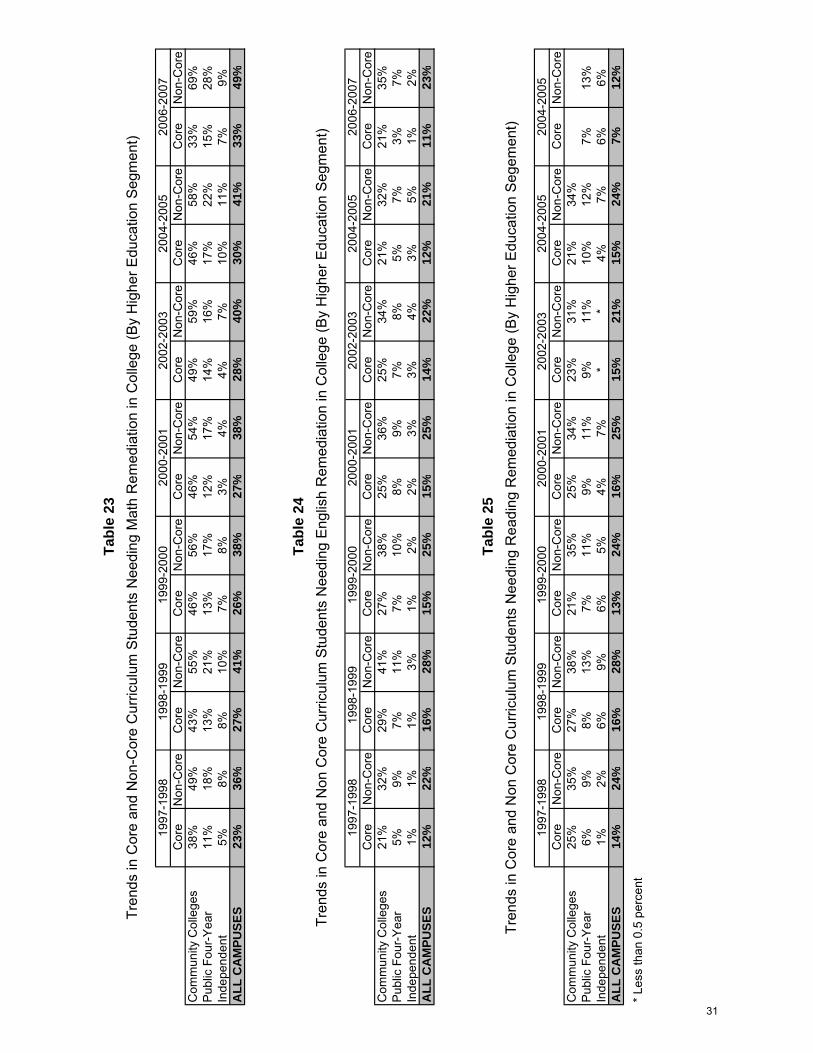
This is the tenth consecutive report in which student high school grade point average emerged as the best predictor of first college English grade and college grade point average. High school grade point average has also been the best predictor of first math grade in 9 out of 10 SOAR studies. SAT math score, enrolling in honors chemistry, and average grades in math and foreign language courses were also strong predictors of the first college math grade. Other noteworthy predictors of the first English grade were SAT verbal score, average grade in high school English courses, and enrolling in an honors English class. In addition to high school GPA, the best predictors of college grade point average were SAT verbal and math scores, average grades earned in English and social sciences courses, and father’s educational level. Race and gender had a statistically significant influence on all three college performance (dependent) variables, even after controlling for other demographic characteristics and high school experiences variables. This study represents the fifth consecutive time that race has had a significant impact on first math grade, first English grade, and grade point average. Gender has had a significant impact on all three college performance variables in every SOAR study, with the exception of the 2006 edition. III. TRENDS IN COLLEGE PERFORMANCE OF HIGH SCHOOL GRADUATES Trend data pertaining to the last seven SOAR studies are presented in Tables 17-34. These tables provide information on educational outcomes for students in the core and non-core categories by jurisdiction (i.e., county or regional service area), higher education segment, and race and gender. Overall, the data reveal a great deal of consistency in students’ academic performance over the course of the last ten years. Remediation. Consistent with the trend that has been evident in the last seven reports, in 2006-2007 more core and non-core students required remediation in math, than in reading or English, and the math remediation rates for students in both categories reached their highest levels since SOAR’s inception. The percentage of core students requiring additional assistance in math has continued to increase steadily in the last seven studies from 23 percent to 32 percent, and over the same period the math remediation rate for non-core students has risen from 36 percent to 49 percent. Since the last SOAR, which examined the 2004-2005 cohort, was released, the percentage of students who attended a community college and needed remediation in math also increased for both the core (from 46 percent to 56 percent) and non-core (58 percent to 69 percent) groups. The percentage of core students who needed to enroll in a remedial math course at the public four-year universities decreased slightly (from 17 percent to 14 percent) over the same two year period, while the percentage of non-core students at these institutions who needed additional math help increased by 6 percentage points, from 22 percent to 28 percent. While the proportion of all students requiring math remediation has increased, the percentage of students needing developmental English and reading courses has remained relatively stable over the years. For example, in 1997-1998, 12 percent of core students needed remedial assistance in English while 22 percent of non-core students did so. Ten year’s later in 2006-2007, the
8
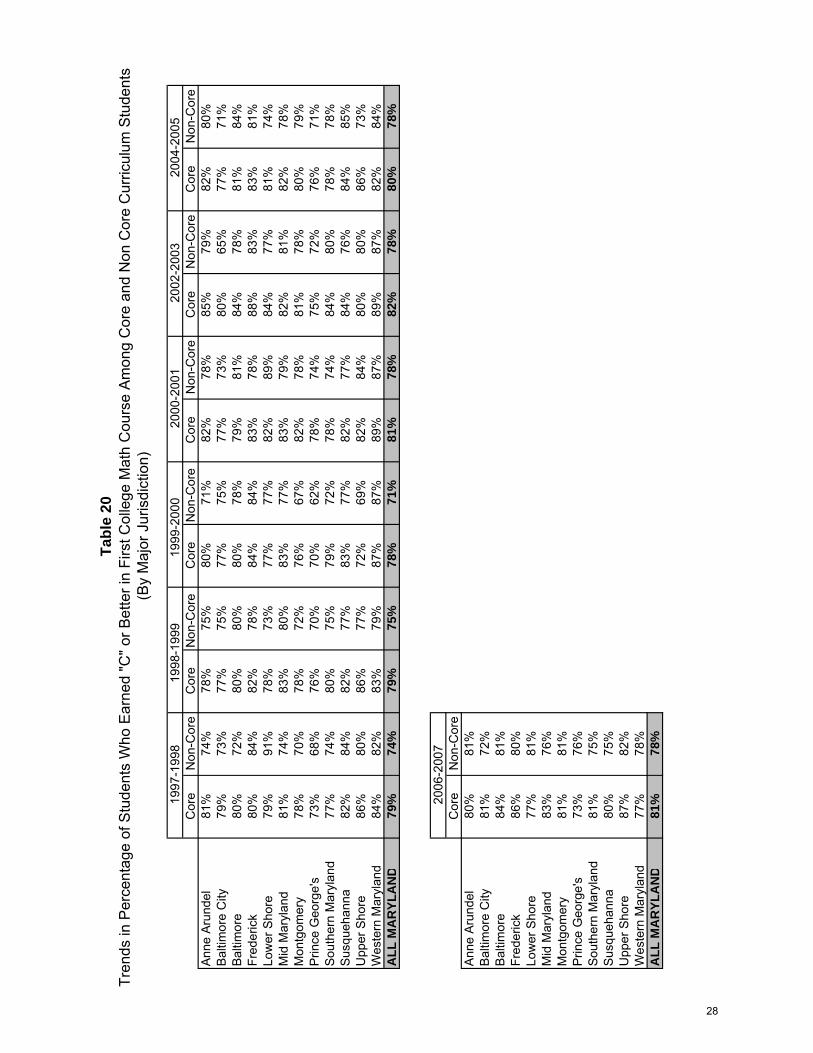
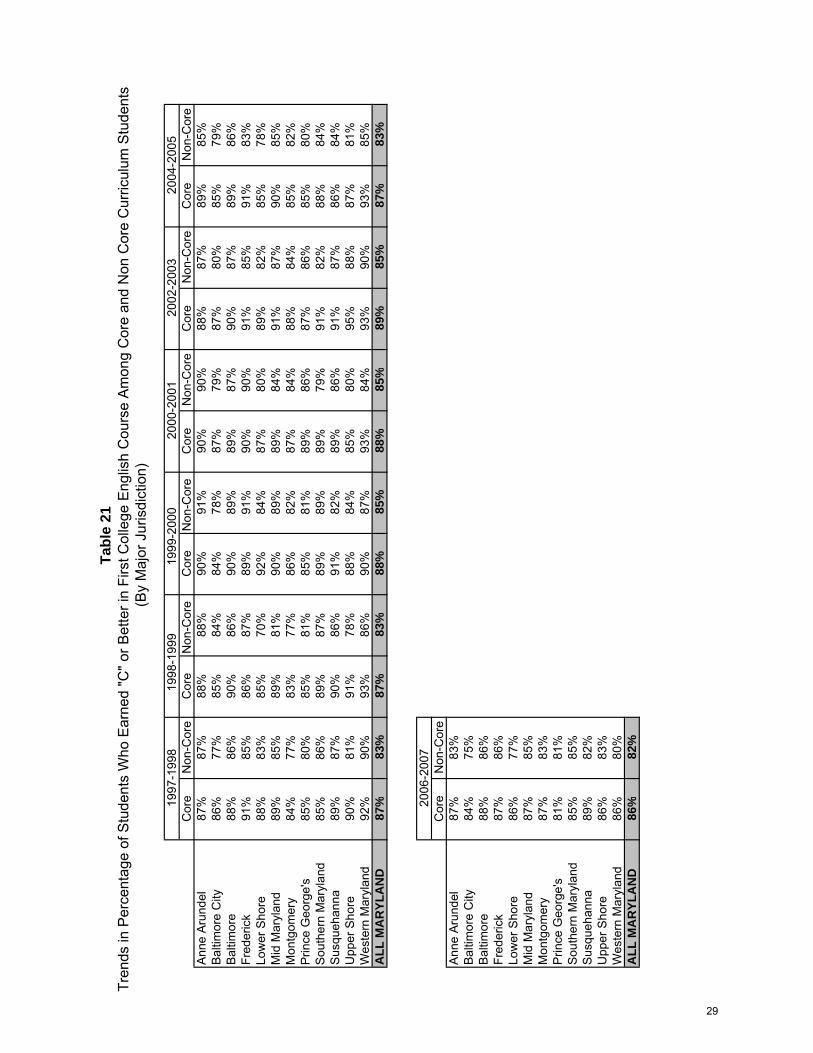
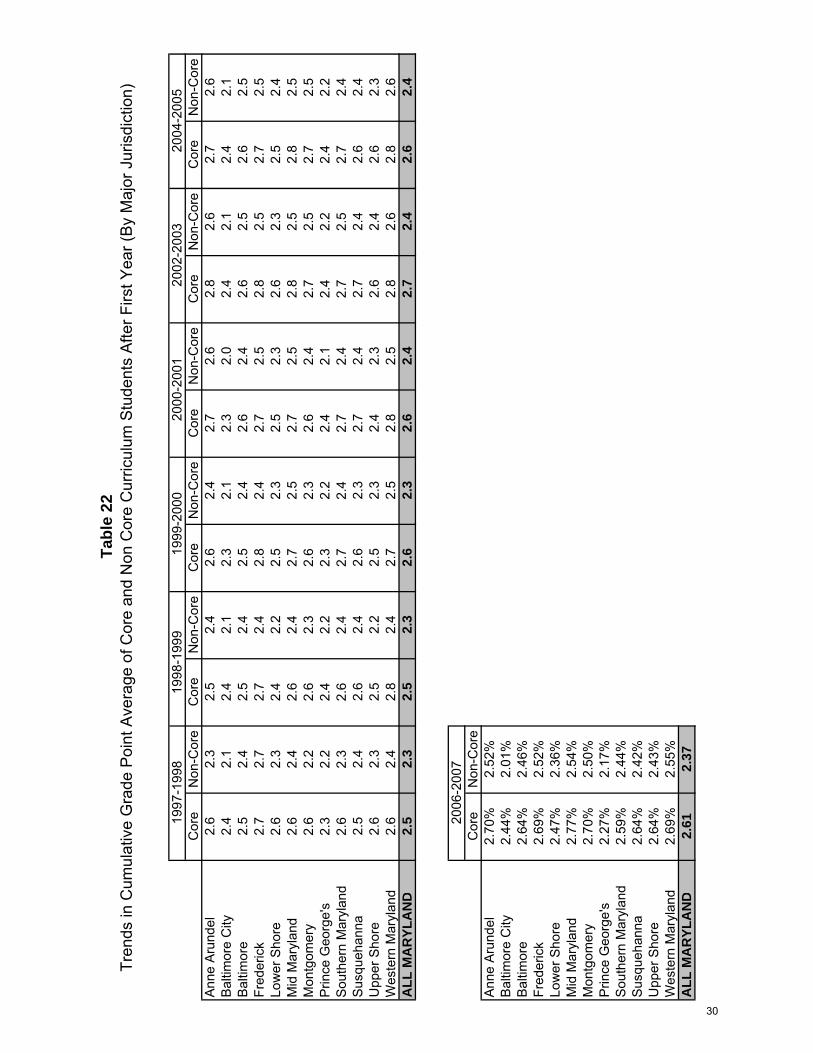
proportion of core students who required a remedial English course had decreased by just one percentage point to 11 percent, and at 22 percent the proportion of non-core students who enrolled in a remedial English class remained the same. The English remediation rates at the community colleges and public four-year campuses have also remained relatively flat over time, and particularly so since the last SOAR study. Performance in First Math Course. This year, a slightly higher percentage of core (81 percent) than non-core (78 percent) students received at least a grade of “C” in their first college math course. These findings mark the continuation of a long-standing trend in which a narrow margin, ranging from two to six percentage points, has separated the performance levels of core and non-core students. Although, over time, more women than men from both the core and non-core groups, required remedial assistance in math, women have been considerably more likely to earn a higher grade in their first math course than their male counterparts. Additionally, higher percentages of women than men, among core and non-core students, earned a “C” or above in their first math class. Traditionally, African Americans have been less likely than students from other racial/ethnic groups to earn a “C” or better in the first math course; nevertheless in 2006-2007 at least 70 percent of African American students in the core and non-core categories earned a minimum grade of “C” in their initial math class. In this study, Latino students were also less likely than those from other racial/ethnic groups to earn at least a “C.” Large proportions of core and non-core students from Frederick County have consistently earned at least a “C” in the first college math course, while Prince George’s County has typically had the smallest proportion of students who do so. Performance in First English Course. Over the course of the last seven SOAR studies, a considerable majority of students in the core and non-core categories have earned at least a “C” grade in their first English course, and more core than non-core students have achieved this status each year. Graduates from Baltimore County high schools have consistently been above the statewide average in the proportion of students who earned a “C” or better in the first English course, and since 1997-1998 at least 88 percent of core students from Baltimore County have met this threshold. In each of the past SOAR studies, a larger proportion of women than men earned at least a “C” in their first English class. This year, at least 85 percent of core and non-core women earned a “C”, while neither of the groups of men reached this threshold. Grade Point Average. In each edition of SOAR since 1997-1998, core students have earned higher cumulative grade point averages than their non-core peers. Students from Frederick County, Mid Maryland, Montgomery County and Western Maryland have consistently earned the highest GPAs among students from all jurisdictions, and have exceeded the average statewide GPA in each SOAR cycle. On the other hand, students who attended high school in Baltimore City and Prince George’s County have typically earned grade point averages lower than those of their counterparts from other jurisdictions, and below the State average.
9
Similarly to the grades earned in the first math and English courses, core and non-core women have earned higher grade point averages than men since 1997-1998. Also, the GPAs for African American students in both categories have traditionally been lower than those of students from other racial and ethnic backgrounds. Factors Affecting College Performance. For the last 10 years, high school grade point average has emerged as the strongest predictor of college performance, among all 64 high school experience and background variables included in the database. With only one exception, high school grade point average has been the best predictor of all three measures of college performance (first college math grade, first college English grade, and college grade point average) in each of the 10 years. While several other variables have consistently had a strong relationship to one or more of the college performance variables for multiple years, no other indicator approaches the predictive power of the high school grade point average variable. The SAT verbal score and average grade in high school English variables each had a statistically significant affect on first English grade and cumulative grade point average in all 10 years. The SAT math score variable was an important predictor of students’ first math grade in each of the 10 years, and of grade point average in nine years. In 9 out of 10 years, the average high school math grade variable has been a good predictor of students’ performance in their first college math course. Gender has been related to all three variables in 9 of the 10 years, and race has had a statistically significant affect on all three college performance variables in 5 of the years.
GRADUATION RATES OF CORE AND NON CORE STUDENTS
The SOAR analyses also include trends in the transfer and graduation rates of core and non-core students at Maryland’s public two-year and four-year colleges and universities. Beginning with the 1998 cohort, transfer and graduation rate information is also provided for Maryland residents who originally enrolled at a public institution and subsequently transferred to a state –aided independent college or university. Table 35 shows data trends for individuals who enrolled at a community college as first-time, full-time students directly after graduating from high school, and who earned an associate degree or certificate from any two-year institution and/or transferred to a four-year institution in Maryland within four years of their original date of entry. The results show that since 1994, the completion and transfer rates for community college students in the core category have been consistently higher than similar rates for their non-core counterparts. However, the difference in the success rates of students who completed a college preparatory curriculum and those who did not has narrowed considerably over time. While there was a 12 percentage point difference in the graduation and transfer rates of students in the 1994 cohort (46 percent for core vs. 33.7 percent for non-core), only 7 percentage points separated students in the 2002 cohort (47.1 percent for core vs. 40.2 percent for non-core). Additionally, the graduation and transfer rate for core students has remained relatively stable, varying only 3 percentage points, over the eight year period studied. Conversely, the success rate for non-core students increased by 7 percentage points over the same period of time, and the most recent cohort of non-core community college students achieved the highest success rate (40.2 percent) in SOAR’s history. These data confirm the findings of Maryland’s degree progress analysis for community college
10
students which shows that students who require remediation when they first enroll and successfully complete their developmental coursework continue to stay enrolled, graduate and transfer at nearly the same rate as students who were considered college-ready upon entry (81.9 percent for developmental completers vs. 83.7 percent for college-ready students). Table 36 includes data for students who enrolled in a public four-year university immediately after graduating from high school and obtained a bachelor’s degree within six years of their original enrollment date. The bachelor’s degree attainment rates for both core and non-core students in the 2000 cohort were higher than the success rates achieved of any of the previous cohorts. While a 7 percentage point difference separated the success rates of core (64 percent) and non-core (57.1 percent) students in the 1994 cohort, that difference had virtually disappeared with the 2000 cohort (67.6 percent for core vs. 67 percent for non-core). Additionally, similar to the pattern that was evident in the community college success rates, there has been a modest amount of variance (less than 3 percentage points) in the bachelor’s degree attainment rate of students in the core category, while the rate for non-core students has increased by nearly 10 percentage points over the same time period. The narrowing of the success rate gap between core and non-core students who enroll at public four-year universities may indicate that these institutions have implemented effective success strategies that mitigate the effects of not completing a college preparatory high school curriculum. Table 37 includes the transfer and graduation rates of core and non-core students by gender, race/ethnicity and jurisdiction. With only a few exceptions, students in the core category had more favorable long-term outcomes than those in the non-core category. Core community college students from Baltimore City, Prince George’s County, Southern Maryland, the Upper Shore and Western Maryland graduated and transferred at considerably higher rates (of at least 10 percentage points) than their non-core peers. The success rates of African American and Latino students who were in the core group and attended four-year universities were much higher, by at least 7 percentage points, than those of their peers in the non-core group. Core students from Anne Arundel and Prince George’s counties and the Upper Shore who attended four-year universities were also much more likely (by at least 6percentage points) than non-core students from these areas to earn a bachelor’s degree within six years. The SOAR findings regarding core and non-core students’ long-term educational outcomes are consistent with prior research which suggests that the academic rigor of a student’s high school curriculum has a significant effect on his or her likelihood of attaining a college degree. According to The Toolbox Revisited (2006), which tracked the long-term outcomes of 1992 high school graduates, 82 percent and 61 percent of students who had completed a high school curriculum in the highest and second highest quintiles of the academic intensity distribution had earned a bachelor’s degree by 2000, compared to only 9 percent and 24 percent of students lowest and second lowest curricular intensity quintiles. This study also included a multivariate analysis that examined the effect of academic resources (a composite variable that included measures of students’ curricular records, class rank/GPA and standardized test scores) at time of postsecondary entry, and found that every step a student moved up the five-point academic resources scale improved their probability of earning a bachelor’s degree by nearly 13 percent.
11

RECOMMENDATIONS FOR POLICY, PRACTICE and RESEARCH ACT’s 2007 Annual Report, Preparing for a World of Opportunities, suggests that students who are not adequately equipped to succeed in college are less likely to enroll in the first place, more likely than others to require remedial coursework during the first year of postsecondary study, and less likely than their peers to earn a college degree. The report also asserts that while more students than ever before are meeting college readiness benchmarks fewer than 38 percent are prepared to succeed in a first-year science course, less than 60 percent are ready for college social science classes, and less than 75 percent and 77 percent are adequately prepared for college-level math or English, respectively. These findings are borne out in the results of the SOAR study and indicate that Maryland’s P-12 and higher education leaders, along with policy makers and members of the business community alike must join forces to ensure that more high school graduates are prepared to successfully enroll in and complete college. The following recommendations are designed provide a starting point for addressing the issues of college readiness within the state:
Maryland’s P-20 Council should create an alignment subcommittee or task force that examines the twin issues of college readiness and college remediation. This workgroup should forward a plan which includes measurable, attainable action recommendations for increasing college readiness rates to the Governor within 10 months of its formation.
As a way to track student success from pre-kindergarten through college, the State must
develop a plan for establishing a comprehensive data system. Not doing so will mean that Maryland will soon find itself far behind other states that already have these data systems in place, or have already developed plans to implement them within the next five years. A workgroup should be established to develop a plan for creating and implementing a statewide longitudinal data system, and the workgroup’s proposed action plan should be completed within 10-12 months of its formation.
One of the three pillars of an effective, statewide P-20 system, along with enhancing
college readiness and developing a P-20 longitudinal data system, is strengthening teacher quality. As such, Maryland must continue to focus on attracting, retaining and continually developing highly-qualified educators who have the skills necessary to teach courses that comprise a rigorous, college preparatory curriculum. This should continue to be a joint effort of both P-20 and postsecondary systems and leaders.
While SOAR is a solid study that provides a wealth of useful data, one of its major
limitations lies in the fact that it does not provide any information about Maryland high school graduates who attend out-of-state colleges and universities. To address this issue, MHEC should partner with the National Student Clearinghouse to obtain retention and graduation rate data for students who attend colleges in other states.
12
H. S. GradsN N % H.S. Grads N % H.S. Grads
Anne Arundel 4,755 2,356 49.5% 1,209 25.4%Baltimore City 4,108 1,609 39.2% 1,188 28.9%Baltimore 7,326 3,436 46.9% 2,170 29.6%Frederick 2,724 1,341 49.2% 773 28.4%Lower Shore 1,529 768 50.2% 519 33.9%
Somerset 148 63 42.6% 41 27.7%Wicomico 880 451 51.3% 285 32.4%Worcester 501 254 50.7% 193 38.5%
Mid Maryland 5,704 3,077 53.9% 1,966 34.5%Carroll 2,218 1,190 53.7% 748 33.7%
Howard 3,486 1,887 54.1% 1,218 34.9%Montgomery 9,799 5,245 53.5% 3,029 30.9%Prince George's 7,814 3,047 39.0% 1,812 23.2%Southern Maryland 4,089 1,844 45.1% 999 24.4%
Calvert 1,195 563 47.1% 347 29.0%Charles 1,925 808 42.0% 393 20.4%
St. Mary's 969 473 48.8% 259 26.7%Susquehanna 3,607 1,800 49.9% 1,027 28.5%
Cecil 945 390 41.3% 214 22.6%Harford 2,662 1,410 53.0% 813 30.5%
Upper Shore 1,677 742 44.2% 457 27.3%Caroline 387 150 38.8% 97 25.1%
Dorchester 306 133 43.5% 77 25.2%Kent 177 56 31.6% 40 22.6%
Queen Anne's 504 258 51.2% 145 28.8%Talbot 303 145 47.9% 98 32.3%
Western Maryland 2,404 1,107 46.0% 654 27.2%Allegany 732 360 49.2% 212 29.0%
Garrett 285 145 50.9% 88 30.9%Washington 1,387 602 43.4% 354 25.5%
ALL MARYLAND** 55,536 26,372 47.5% 15,803 28.5%
* Graduates from Edison schools are not available.**Note: Total includes unknown county
Enrolled in CollegeEnrolled in College and
Took SAT or ACT
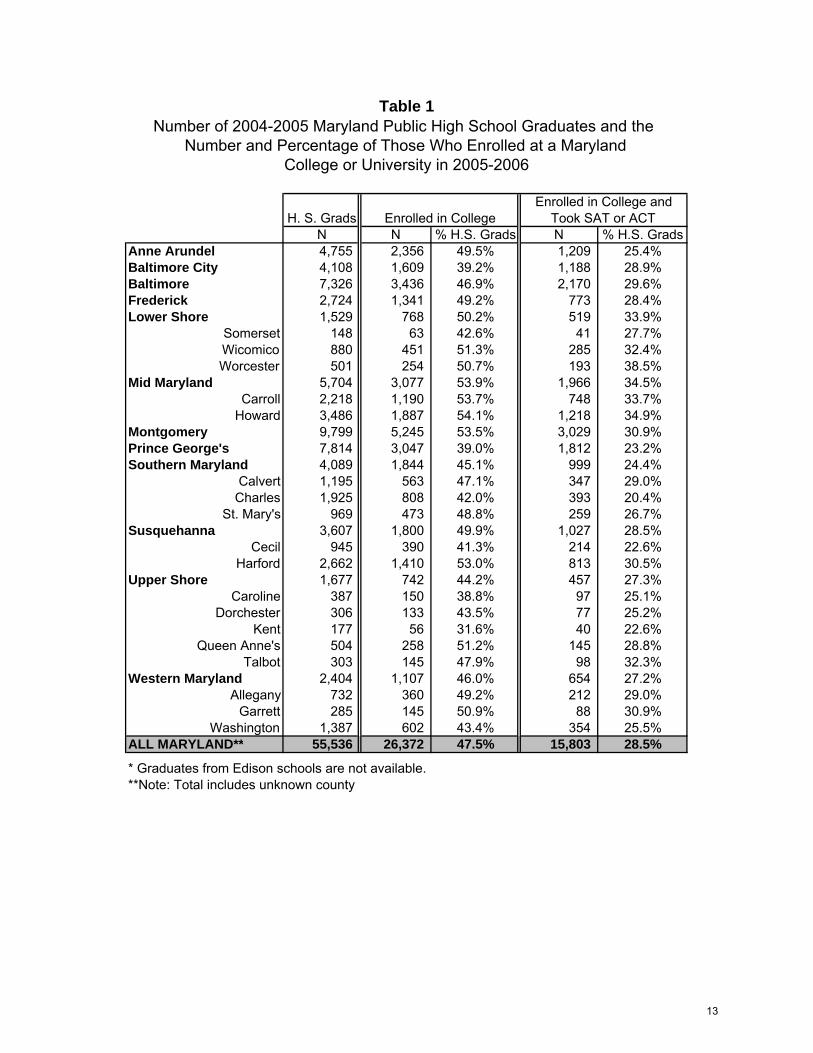
Table 1Number of 2004-2005 Maryland Public High School Graduates and the
Number and Percentage of Those Who Enrolled at a MarylandCollege or University in 2005-2006
13
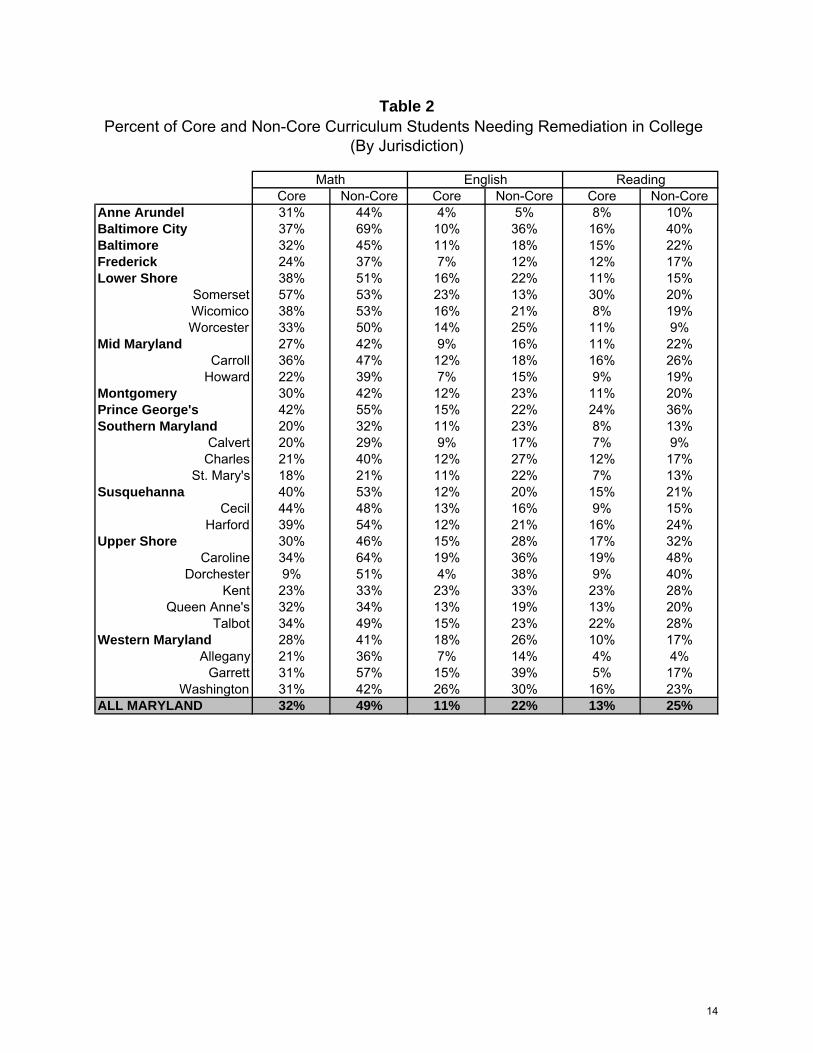
Table 2Percent of Core and Non-Core Curriculum Students Needing Remediation in College
(By Jurisdiction)
Math English ReadingCore Non-Core Core Non-Core Core Non-Core
Anne Arundel 31% 44% 4% 5% 8% 10%Baltimore City 37% 69% 10% 36% 16% 40%Baltimore 32% 45% 11% 18% 15% 22%Frederick 24% 37% 7% 12% 12% 17%Lower Shore 38% 51% 16% 22% 11% 15%
Somerset 57% 53% 23% 13% 30% 20%Wicomico 38% 53% 16% 21% 8% 19%Worcester 33% 50% 14% 25% 11% 9%
Mid Maryland 27% 42% 9% 16% 11% 22%Carroll 36% 47% 12% 18% 16% 26%
Howard 22% 39% 7% 15% 9% 19%Montgomery 30% 42% 12% 23% 11% 20%Prince George's 42% 55% 15% 22% 24% 36%Southern Maryland 20% 32% 11% 23% 8% 13%
Calvert 20% 29% 9% 17% 7% 9%Charles 21% 40% 12% 27% 12% 17%
St. Mary's 18% 21% 11% 22% 7% 13%Susquehanna 40% 53% 12% 20% 15% 21%
Cecil 44% 48% 13% 16% 9% 15%Harford 39% 54% 12% 21% 16% 24%
Upper Shore 30% 46% 15% 28% 17% 32%Caroline 34% 64% 19% 36% 19% 48%
Dorchester 9% 51% 4% 38% 9% 40%Kent 23% 33% 23% 33% 23% 28%
Queen Anne's 32% 34% 13% 19% 13% 20%Talbot 34% 49% 15% 23% 22% 28%
Western Maryland 28% 41% 18% 26% 10% 17%Allegany 21% 36% 7% 14% 4% 4%
Garrett 31% 57% 15% 39% 5% 17%Washington 31% 42% 26% 30% 16% 23%
ALL MARYLAND 32% 49% 11% 22% 13% 25%
14
% With 'C' or Better Average GradeCore Non-Core Core Non-Core
Anne Arundel 80% 81% 2.55 2.49Baltimore City 81% 72% 2.42 2.09Baltimore 84% 81% 2.65 2.59Frederick 86% 80% 2.78 2.54Lower Shore 77% 81% 2.45 2.73
Somerset 71% 83% 2.43 2.67Wicomico 72% 84% 2.23 2.76Worcester 86% 78% 2.84 2.71
Mid Maryland 83% 76% 2.61 2.35Carroll 85% 79% 2.67 2.42
Howard 82% 75% 2.58 2.31Montgomery 81% 81% 2.61 2.63Prince George's 73% 76% 2.24 2.22Southern Maryland 81% 75% 2.52 2.33
Calvert 88% 66% 2.70 2.22Charles 76% 78% 2.34 2.37
St. Mary's 81% 82% 2.55 2.42Susquehanna 80% 75% 2.60 2.45
Cecil 71% 74% 2.45 2.32Harford 82% 76% 2.63 2.48
Upper Shore 87% 82% 2.70 2.40Caroline 90% 94% 2.71 2.78
Dorchester 82% 81% 2.82 2.71Kent 89% 50% 2.56 1.75
Queen Anne's 94% 78% 3.00 2.49Talbot 78% 82% 2.19 2.54
Western Maryland 77% 78% 2.49 2.39Allegany 76% 79% 2.35 2.42
Garrett 77% 91% 2.65 2.82Washington 78% 75% 2.56 2.31
ALL MARYLAND 81% 78% 2.55 2.42
Table 3Performance in First College Math Course of
Core and Non-Core Curriculum Students(By Jurisdiction)
15
% With 'C' or Better Average GradeCore Non-Core Core Non-Core
Anne Arundel 87% 83% 2.67 2.53Baltimore City 84% 75% 2.56 2.18Baltimore 88% 86% 2.77 2.60Frederick 87% 86% 2.76 2.65Lower Shore 86% 78% 2.49 2.30
Somerset 76% 73% 2.10 2.09Wicomico 86% 79% 2.46 2.37Worcester 87% 77% 2.66 2.26
Mid Maryland 87% 85% 2.61 2.78Carroll 89% 85% 2.83 2.64
Howard 87% 85% 2.76 2.59Montgomery 87% 83% 2.71 2.56Prince George's 81% 81% 2.44 2.39Southern Maryland 85% 85% 2.64 2.62
Calvert 86% 84% 2.66 2.59Charles 83% 83% 2.55 2.54
St. Mary's 87% 91% 2.74 2.85Susquehanna 89% 82% 2.80 2.53
Cecil 90% 76% 2.77 2.27Harford 89% 84% 2.81 2.61
Upper Shore 86% 83% 2.69 2.50Caroline 76% 80% 2.36 2.40
Dorchester 89% 86% 2.72 2.67Kent 88% 80% 2.69 2.40
Queen Anne's 90% 78% 2.82 2.36Talbot 89% 93% 2.83 2.64
Western Maryland 86% 80% 2.77 2.56Allegany 82% 80% 2.67 2.67
Garrett 86% 75% 2.64 2.50Washington 88% 80% 2.88 2.51
ALL MARYLAND 86% 82% 2.66 2.53
Table 4Performance in First College English Course of
Core and Non-Core Curriculum Students(By Jurisdiction)
16
Core Non-CoreAnne Arundel 2.70 2.52Baltimore City 2.44 2.01Baltimore 2.64 2.46Frederick 2.69 2.52Lower Shore 2.47 2.36
Somerset 2.07 2.34Wicomico 2.48 2.40Worcester 2.58 2.31
Mid Maryland 2.77 2.54Carroll 2.80 2.61
Howard 2.75 2.50Montgomery 2.70 2.50Prince George's 2.27 2.17Southern Maryland 2.59 2.44
Calvert 2.63 2.47Charles 2.41 2.32
St. Mary's 2.74 2.60Susquehanna 2.64 2.42
Cecil 2.72 2.46Harford 2.62 2.41
Upper Shore 2.64 2.43Caroline 2.43 2.38
Dorchester 3.00 2.61Kent 2.38 1.84
Queen Anne's 2.71 2.40Talbot 2.69 2.58
Western Maryland 2.69 2.55Allegany 2.62 2.55
Garrett 2.77 2.65Washington 2.72 2.54
ALL MARYLAND 2.61 2.37
Table 5Cumulative Grade Point Average After First Year of
Core and Non-Core Curriculum Students(By Jurisdiction)
17

Math English ReadingCore Non-Core Core Non-Core Core Non-Core
Community CollegesAllegany 46% 74% 20% 49% 6% 24%
Anne Arundel 49% 60% 4% 6% 8% 12%Baltimore City 84% 95% 55% 75% 24% 59%
Baltimore County 69% 82% 25% 43% 29% 45%Carroll 71% 77% 26% 30% 27% 41%
Cecil 73% 70% 21% 21% 19% 21%Chesapeake 51% 59% 32% 44% 31% 50%
Frederick 43% 59% 12% 18% 23% 28%Garrett 59% 64% 31% 43% 10% 25%
Hagerstown 44% 52% 40% 38% 23% 27%Harford 68% 74% 23% 32% 27% 32%Howard 58% 67% 20% 27% 21% 29%
Montgomery 57% 67% 25% 39% 19% 31%Prince George's 48% 59% 19% 23% 45% 55%
Southern Maryland 27% 46% 22% 37% 13% 20%Wor-Wic 77% 85% 29% 36% 17% 20%
All Community Colleges 56% 69% 21% 35% 22% 35%
University System of MarylandBowie 53% 53% 20% 15% 26% 24%
Coppin 71% 71% - - - - Frostburg 21% 26% 0% 0% 0% 0%
Towson 23% 38% 0% * 13% 24%UMBC 2% 2% * 0% 6% 7%UMCP 4% 6% - - - - UMES 79% 85% 26% 40% 35% 42%
All University System of MD 14% 27% 2% 4% 6% 11%Morgan 29% 33% 28% 32% 30% 34%
All Public Four-Year 15% 28% 3% 7% 7% 13%
IndependentsCapitol College 10% 18% 10% 12% - -
Columbia Union 19% 25% 10% 10% - - Hood 27% 31% 10% 7% - -
Loyola 1% 3% - - - - MD Institute College of Art - - 8% 11% - -
Mount St. Mary's 31% 47% - - - - Sojourner Douglass N/A 100% N/A 100% - -
Stevenson - - 0% 0% 20% 21%All Independents 6% 9% 1% 2% 6% 6%
All Campuses 32% 49% 11% 22% 13% 25%
Percent of Core and Non-Core Curriculum Students Needing Remediation in College(By Institution)
Table 6
18
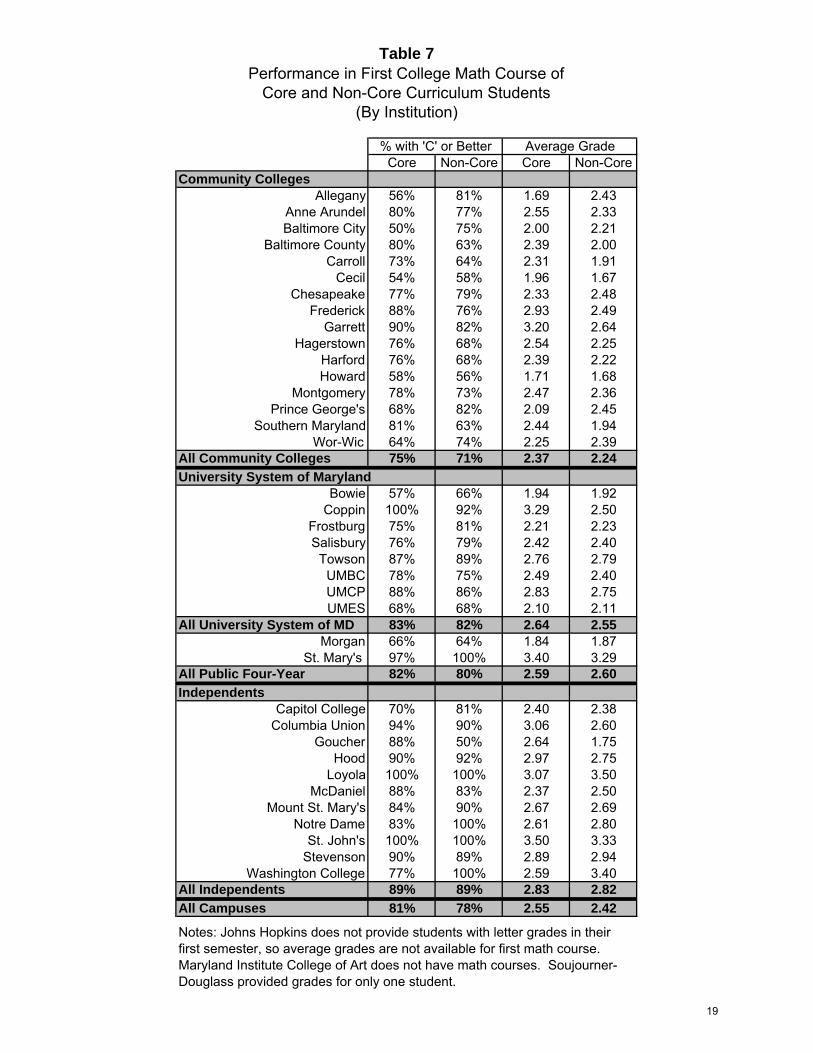
% with 'C' or Better Average GradeCore Non-Core Core Non-Core
Community CollegesAllegany 56% 81% 1.69 2.43
Anne Arundel 80% 77% 2.55 2.33Baltimore City 50% 75% 2.00 2.21
Baltimore County 80% 63% 2.39 2.00Carroll 73% 64% 2.31 1.91
Cecil 54% 58% 1.96 1.67Chesapeake 77% 79% 2.33 2.48
Frederick 88% 76% 2.93 2.49Garrett 90% 82% 3.20 2.64
Hagerstown 76% 68% 2.54 2.25Harford 76% 68% 2.39 2.22Howard 58% 56% 1.71 1.68
Montgomery 78% 73% 2.47 2.36Prince George's 68% 82% 2.09 2.45
Southern Maryland 81% 63% 2.44 1.94Wor-Wic 64% 74% 2.25 2.39
All Community Colleges 75% 71% 2.37 2.24
University System of MarylandBowie 57% 66% 1.94 1.92
Coppin 100% 92% 3.29 2.50Frostburg 75% 81% 2.21 2.23Salisbury 76% 79% 2.42 2.40
Towson 87% 89% 2.76 2.79UMBC 78% 75% 2.49 2.40UMCP 88% 86% 2.83 2.75UMES 68% 68% 2.10 2.11
All University System of MD 83% 82% 2.64 2.55Morgan 66% 64% 1.84 1.87
St. Mary's 97% 100% 3.40 3.29All Public Four-Year 82% 80% 2.59 2.60
IndependentsCapitol College 70% 81% 2.40 2.38
Columbia Union 94% 90% 3.06 2.60Goucher 88% 50% 2.64 1.75
Hood 90% 92% 2.97 2.75Loyola 100% 100% 3.07 3.50
McDaniel 88% 83% 2.37 2.50Mount St. Mary's 84% 90% 2.67 2.69
Notre Dame 83% 100% 2.61 2.80St. John's 100% 100% 3.50 3.33
Stevenson 90% 89% 2.89 2.94Washington College 77% 100% 2.59 3.40
All Independents 89% 89% 2.83 2.82
All Campuses 81% 78% 2.55 2.42
Notes: Johns Hopkins does not provide students with letter grades in their first semester, so average grades are not available for first math course. Maryland Institute College of Art does not have math courses. Soujourner-Douglass provided grades for only one student.
Table 7Performance in First College Math Course of
Core and Non-Core Curriculum Students(By Institution)
19
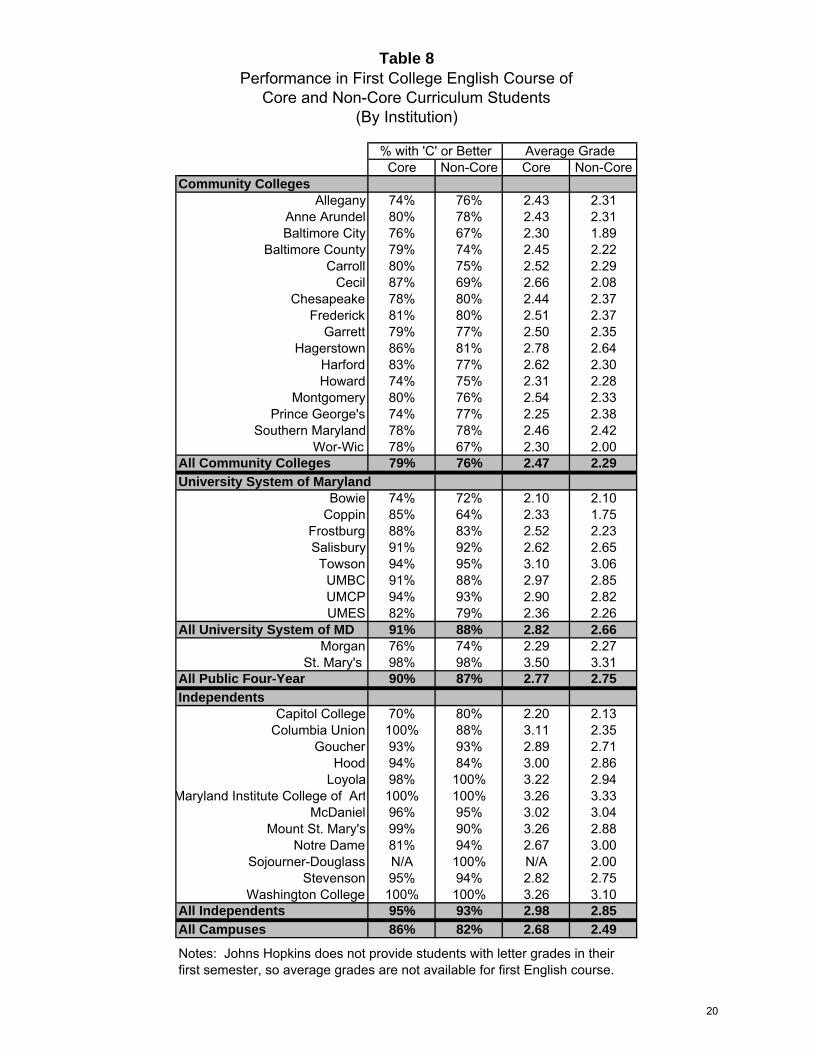
% with 'C' or Better Average GradeCore Non-Core Core Non-Core
Community CollegesAllegany 74% 76% 2.43 2.31
Anne Arundel 80% 78% 2.43 2.31Baltimore City 76% 67% 2.30 1.89
Baltimore County 79% 74% 2.45 2.22Carroll 80% 75% 2.52 2.29
Cecil 87% 69% 2.66 2.08Chesapeake 78% 80% 2.44 2.37
Frederick 81% 80% 2.51 2.37Garrett 79% 77% 2.50 2.35
Hagerstown 86% 81% 2.78 2.64Harford 83% 77% 2.62 2.30Howard 74% 75% 2.31 2.28
Montgomery 80% 76% 2.54 2.33Prince George's 74% 77% 2.25 2.38
Southern Maryland 78% 78% 2.46 2.42Wor-Wic 78% 67% 2.30 2.00
All Community Colleges 79% 76% 2.47 2.29
University System of MarylandBowie 74% 72% 2.10 2.10
Coppin 85% 64% 2.33 1.75Frostburg 88% 83% 2.52 2.23Salisbury 91% 92% 2.62 2.65
Towson 94% 95% 3.10 3.06UMBC 91% 88% 2.97 2.85UMCP 94% 93% 2.90 2.82UMES 82% 79% 2.36 2.26
All University System of MD 91% 88% 2.82 2.66Morgan 76% 74% 2.29 2.27
St. Mary's 98% 98% 3.50 3.31All Public Four-Year 90% 87% 2.77 2.75
IndependentsCapitol College 70% 80% 2.20 2.13
Columbia Union 100% 88% 3.11 2.35Goucher 93% 93% 2.89 2.71
Hood 94% 84% 3.00 2.86Loyola 98% 100% 3.22 2.94
Maryland Institute College of Art 100% 100% 3.26 3.33McDaniel 96% 95% 3.02 3.04
Mount St. Mary's 99% 90% 3.26 2.88Notre Dame 81% 94% 2.67 3.00
Sojourner-Douglass N/A 100% N/A 2.00Stevenson 95% 94% 2.82 2.75
Washington College 100% 100% 3.26 3.10All Independents 95% 93% 2.98 2.85
All Campuses 86% 82% 2.68 2.49
Notes: Johns Hopkins does not provide students with letter grades in their first semester, so average grades are not available for first English course.
Table 8Performance in First College English Course of
Core and Non-Core Curriculum Students(By Institution)
20
Community CollegesAllegany
Anne ArundelBaltimore City
Baltimore CountyCarroll
CecilChesapeake
FrederickGarrett
HagerstownHarfordHoward
MontgomeryPrince George's
Southern MarylandWor-Wic
All Community CollegesUniversity System of Maryland
BowieCoppin
FrostburgSalisbury
TowsonUMBCUMCPUMES
All University System of MDMorgan
St. Mary's All Public Four-YearIndependents
Capitol CollegeColumbia Union
GoucherHood
Johns HopkinsLoyola
Maryland Institute College of ArtMcDaniel
Mount St. Mary'sNotre Dame
Sojourner-DouglassSt. Johns
StevensonWashington College
All IndependentsAll Campuses
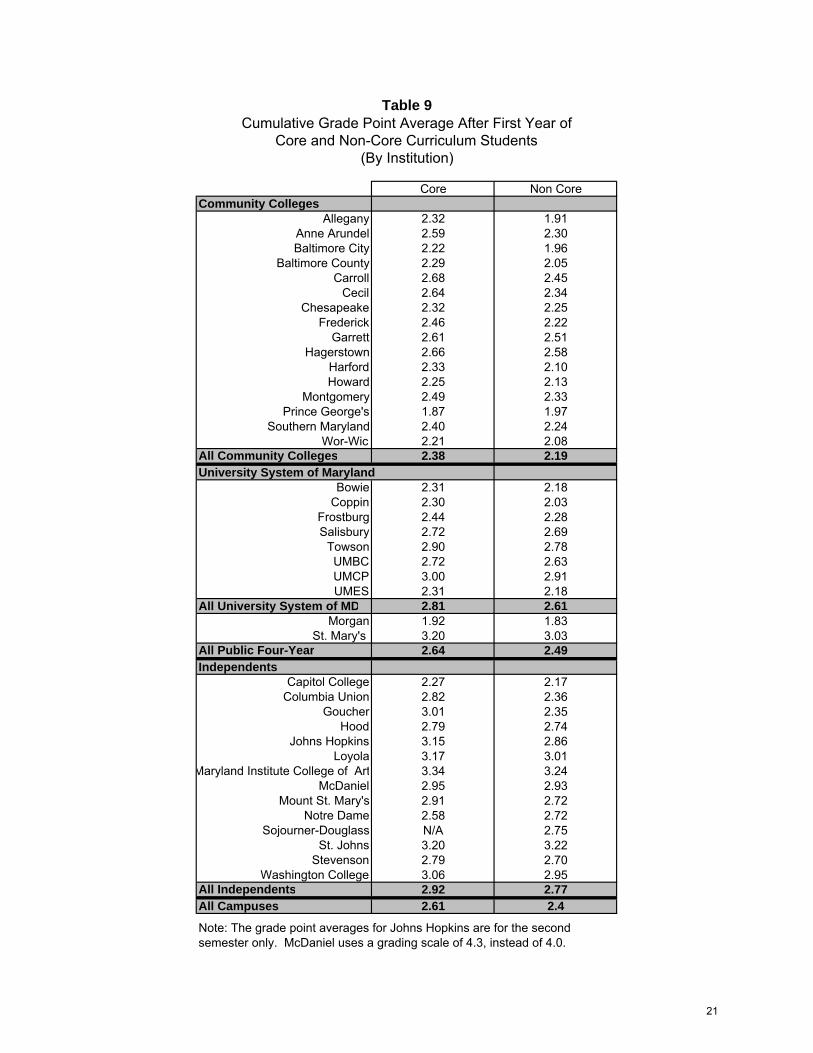
Note: The grade point averages for Johns Hopkins are for the second semester only. McDaniel uses a grading scale of 4.3, instead of 4.0.
Table 9Cumulative Grade Point Average After First Year of
Core and Non-Core Curriculum Students(By Institution)
2.452.34
Core Non Core
1.912.30
2.25
2.322.592.222.292.682.642.32
1.962.05
2.462.612.662.332.252.491.872.40
2.132.331.972.24
2.222.512.582.10
2.082.19
2.312.30
2.212.38
2.182.032.282.692.78
3.15 2.86
2.442.722.902.723.00
2.18
2.632.91
2.81 2.612.31
1.923.202.64
2.272.823.012.79
3.173.342.952.912.58N/A
2.793.06
3.20
1.833.032.49
2.172.362.352.74
3.013.242.932.722.722.75
2.702.95
3.22
2.772.4
2.922.61
21
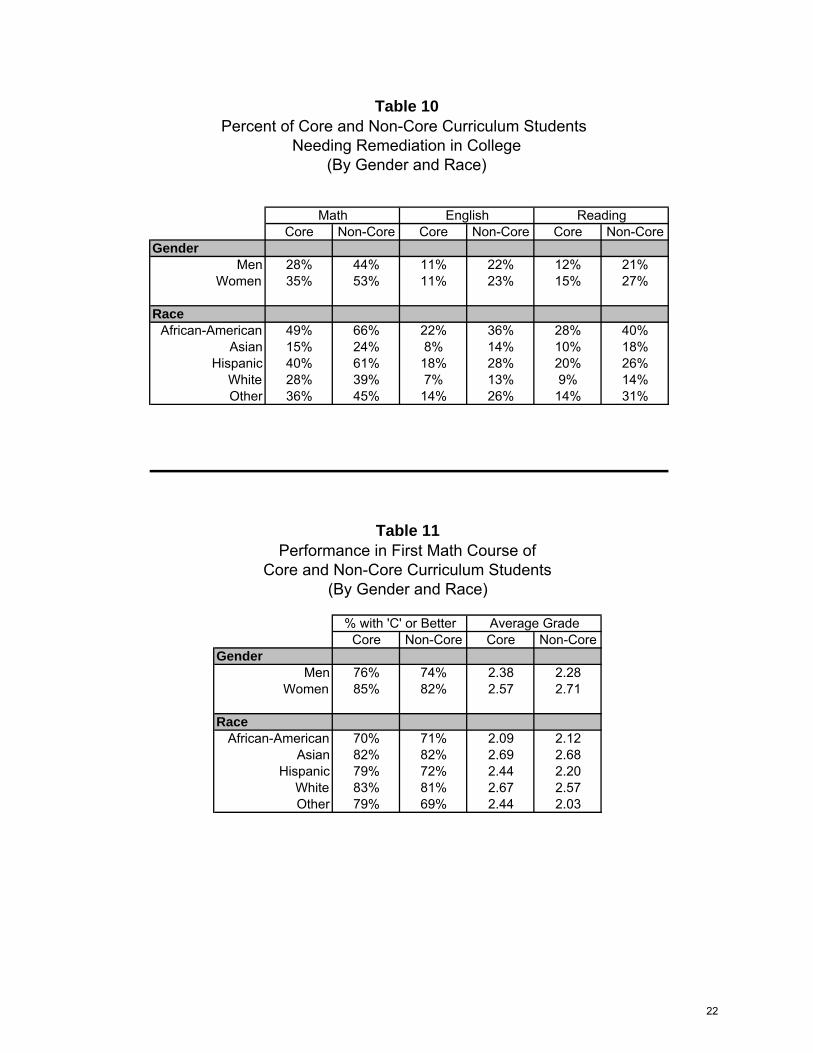
Math English ReadingCore Non-Core Core Non-Core Core Non-Core
GenderMen 28% 44% 11% 22% 12% 21%
Women 35% 53% 11% 23% 15% 27%
RaceAfrican-American 49% 66% 22% 36% 28% 40%
Asian 15% 24% 8% 14% 10% 18%Hispanic 40% 61% 18% 28% 20% 26%
White 28% 39% 7% 13% 9% 14%Other 36% 45% 14% 26% 14% 31%
% with 'C' or Better Average GradeCore Non-Core Core Non-Core
GenderMen 76% 74% 2.38 2.28
Women 85% 82% 2.57 2.71
RaceAfrican-American 70% 71% 2.09 2.12
Asian 82% 82% 2.69 2.68Hispanic 79% 72% 2.44 2.20
White 83% 81% 2.67 2.57Other 79% 69% 2.44 2.03
Table 11Performance in First Math Course of
Core and Non-Core Curriculum Students(By Gender and Race)
Table 10Percent of Core and Non-Core Curriculum Students
Needing Remediation in College(By Gender and Race)
22
% with 'C' or Better Average GradeCore Non-Core Core Non-Core
GenderMen 82% 78% 2.46 2.28
Women 90% 85% 2.86 2.65
RaceAfrican-American 80% 75% 2.54 2.48
Asian 90% 89% 2.88 2.83Hispanic 83% 80% 2.67 2.60
White 88% 85% 2.96 2.86Other 83% 80% 2.89 2.43
Core Non-CoreGender
Men 2.46 2.23Women 2.73 2.48
RaceAfrican-American 2.34 2.34
Asian 2.83 2.78Hispanic 2.66 2.47
White 2.91 2.81Other 2.71 2.49
Table 12Performance in First English Course of
Core and Non-Core Curriculum Students
(By Gender and Race)
(By Gender and Race)
Table 13Cumulative Grade Point Average After First Year of
Core and Non-Core Curriculum Students
23
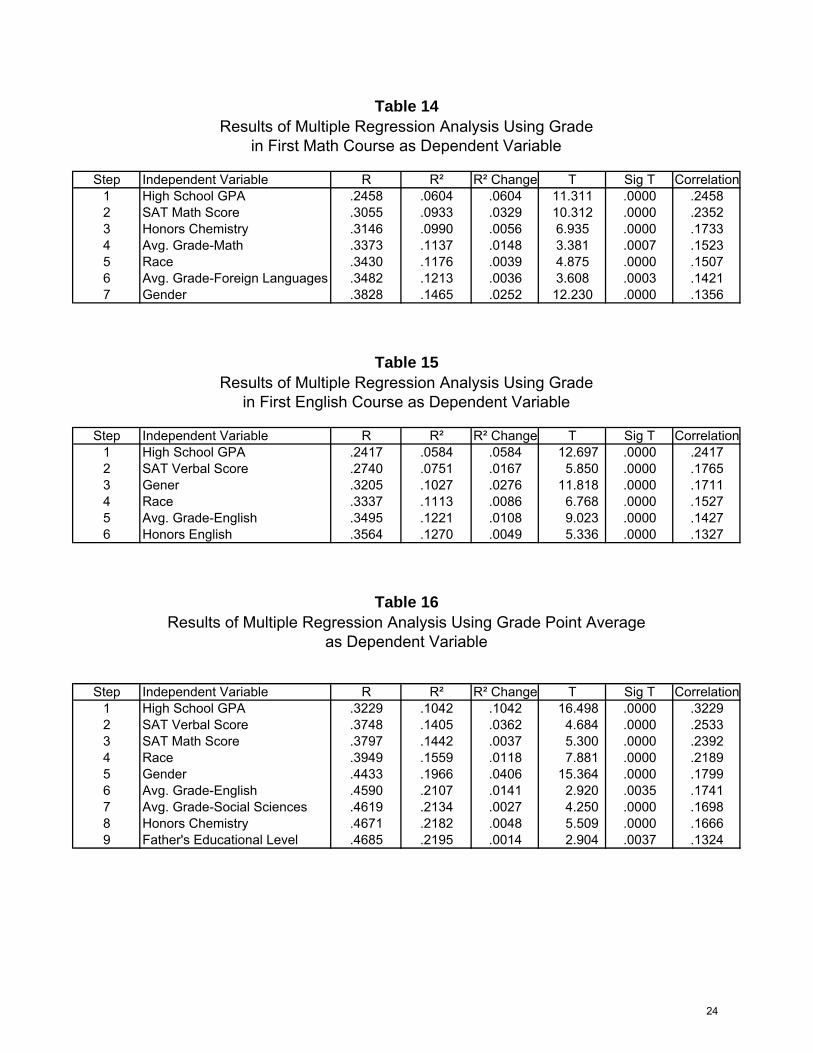
Table 14Results of Multiple Regression Analysis Using Grade
in First Math Course as Dependent Variable
Step Independent Variable R R² R² Change T Sig T Correlation1 High School GPA .2458 .0604 .0604 11.311 .0000 .24582 SAT Math Score .3055 .0933 .0329 10.312 .0000 .23523 Honors Chemistry .3146 .0990 .0056 6.935 .0000 .17334 Avg. Grade-Math .3373 .1137 .0148 3.381 .0007 .15235 Race .3430 .1176 .0039 4.875 .0000 .15076 Avg. Grade-Foreign Languages .3482 .1213 .0036 3.608 .0003 .14217 Gender .3828 .1465 .0252 12.230 .0000 .1356
Table 15Results of Multiple Regression Analysis Using Grade
in First English Course as Dependent Variable
Step Independent Variable R R² R² Change T Sig T Correlation1 High School GPA .2417 .0584 .0584 12.697 .0000 .24172 SAT Verbal Score .2740 .0751 .0167 5.850 .0000 .17653 Gener .3205 .1027 .0276 11.818 .0000 .17114 Race .3337 .1113 .0086 6.768 .0000 .15275 Avg. Grade-English .3495 .1221 .0108 9.023 .0000 .14276 Honors English .3564 .1270 .0049 5.336 .0000 .1327
Table 16Results of Multiple Regression Analysis Using Grade Point Average
as Dependent Variable
Step Independent Variable R R² R² Change T Sig T Correlation1 High School GPA .3229 .1042 .1042 16.498 .0000 .32292 SAT Verbal Score .3748 .1405 .0362 4.684 .0000 .25333 SAT Math Score .3797 .1442 .0037 5.300 .0000 .23924 Race .3949 .1559 .0118 7.881 .0000 .21895 Gender .4433 .1966 .0406 15.364 .0000 .17996 Avg. Grade-English .4590 .2107 .0141 2.920 .0035 .17417 Avg. Grade-Social Sciences .4619 .2134 .0027 4.250 .0000 .16988 Honors Chemistry .4671 .2182 .0048 5.509 .0000 .16669 Father's Educational Level .4685 .2195 .0014 2.904 .0037 .1324
24
1997
-199
8
1
998-
1999
2000
-200
120
02-2
003
2004
-200
5C
ore
Non
-Cor
eC
ore
Non
-Cor
eC
ore
Non
-Cor
eC
ore
Non
-Cor
eC
ore
Non
-Cor
eC
ore
Non
-Cor
eA
nne
Aru
ndel
22
%33
%22
%31
%19
%28
%24
%31
%31
%41
%32
%39
%B
altim
ore
City
27%
54%
39%
63%
37%
53%
31%
54%
35%
59%
37%
60%
Bal
timor
e21
%26
%22
%35
%18
%22
%19
%22
%18
%21
%18
%20
%Fr
eder
ick
30%
42%
32%
47%
24%
42%
26%
43%
26%
38%
26%
38%
Low
er S
hore
22%
30%
26%
40%
26%
41%
29%
41%
37%
55%
39%
45%
Mid
Mar
ylan
d20
%31
%24
%34
%25
%34
%26
%34
%23
%35
%25
%36
%M
ontg
omer
y16
%31
%25
%39
%27
%41
%25
%35
%26
%38
%30
%41
%P
rince
Geo
rge'
s30
%40
%31
%41
%34
%45
%38
%47
%43
%51
%44
%54
%S
outh
ern
Mar
ylan
d11
%16
%14
%21
%6%
14%
10%
17%
13%
20%
15%
18%
Sus
queh
anna
28%
39%
28%
38%
33%
48%
34%
45%
31%
42%
40%
49%
Upp
er S
hore
24%
37%
19%
43%
32%
45%
38%
45%
35%
47%
27%
47%
Wes
tern
Mar
ylan
d30
%48
%41
%60
%34
%45
%37
%47
%27
%37
%31
%46
%A
LL
MA
RY
LA
ND
23%
36%
27%
41%
26%
38%
27%
38%
28%
40%
30%
41%
2006
-200
7C
ore
Non
-Cor
eA
nne
Aru
ndel
31
%44
%B
altim
ore
City
37%
69%
Bal
timor
e32
%45
%Fr
eder
ick
24%
37%
Low
er S
hore
38%
51%
Mid
Mar
ylan
d27
%42
%M
ontg
omer
y30
%42
%P
rince
Geo
rge'
s42
%55
%S
outh
ern
Mar
ylan
d20
%32
%S
usqu
ehan
na40
%53
%U
pper
Sho
re30
%46
%W
este
rn M
aryl
and
28%
28%
AL
L M
AR
YL
AN
D32
%49
%
1999
-200
0
Tab
le 1
7Tr
ends
in C
ore
and
Non
Cor
e C
urric
ulum
Stu
dent
s N
eedi
ng M
ath
Rem
edia
tion
in C
olle
ge(B
y M
ajor
Jur
isdi
ctio
n)
25
1997
-199
8
1
998-
1999
2000
-200
120
02-2
003
2004
-200
5C
ore
Non
-Cor
eC
ore
Non
-Cor
eC
ore
Non
-Cor
eC
ore
Non
-Cor
eC
ore
Non
-Cor
eC
ore
Non
-Cor
eA
nne
Aru
ndel
10
%16
%9%
15%
7%15
%11
%16
%5%
5%3%
6%B
altim
ore
City
18%
41%
28%
50%
29%
53%
25%
50%
20%
44%
19%
40%
Bal
timor
e12
%22
%19
%32
%17
%24
%17
%23
%12
%18
%12
%16
%Fr
eder
ick
17%
21%
13%
20%
11%
24%
11%
17%
9%15
%7%
13%
Low
er S
hore
16%
25%
19%
27%
10%
21%
13%
21%
14%
28%
16%
24%
Mid
Mar
ylan
d9%
21%
13%
22%
11%
18%
8%15
%8%
14%
5%13
%M
ontg
omer
y5%
12%
14%
22%
15%
25%
12%
18%
19%
27%
13%
20%
Prin
ce G
eorg
e's
19%
28%
20%
32%
17%
27%
22%
30%
21%
25%
18%
26%
Sou
ther
n M
aryl
and
9%17
%8%
16%
10%
14%
10%
20%
10%
17%
8%12
%S
usqu
ehan
na9%
17%
11%
21%
14%
20%
11%
22%
13%
20%
14%
21%
Upp
er S
hore
7%15
%11
%21
%11
%18
%14
%27
%11
%24
%16
%24
%W
este
rn M
aryl
and
16%
28%
20%
41%
18%
20%
19%
26%
21%
32%
19%
33%
AL
L M
AR
YL
AN
D12
%22
%16
%28
%15
%25
%15
%25
%14
%22
%12
%21
%
2006
-200
7C
ore
Non
-Cor
eA
nne
Aru
ndel
4%
5%B
altim
ore
City
10%
36%
Bal
timor
e11
%18
%Fr
eder
ick
7%12
%Lo
wer
Sho
re16
%22
%M
id M
aryl
and
9%16
%M
ontg
omer
y12
%23
%P
rince
Geo
rge'
s15
%22
%S
outh
ern
Mar
ylan
d11
%23
%S
usqu
ehan
na12
%20
%U
pper
Sho
re15
%28
%W
este
rn M
aryl
and
18%
26%
AL
L M
AR
YL
AN
D11
%22
%
1999
-200
0
Tab
le 1
8Tr
ends
in C
ore
and
Non
-Cor
e C
urric
ulum
Stu
dent
s N
eedi
ng E
nglis
h R
emed
iatio
n in
Col
lege
(By
Juris
dict
ion)
26
1997
-199
8
1
998-
1999
199
9-20
0020
00-2
001
2002
-200
320
04-2
005
Cor
eN
on-C
ore
Cor
eN
on-C
ore
Cor
eN
on-C
ore
Cor
eN
on-C
ore
Cor
eN
on-C
ore
Cor
eN
on-C
ore
Ann
e A
rund
el
15%
21%
15%
18%
9%15
%8%
11%
6%5%
6%11
%B
altim
ore
City
20%
44%
28%
53%
26%
53%
30%
55%
28%
48%
25%
46%
Bal
timor
e14
%23
%19
%29
%15
%21
%18
%23
%13
%19
%14
%20
%Fr
eder
ick
10%
9%14
%18
%9%
22%
11%
18%
10%
13%
10%
16%
Low
er S
hore
9%20
%17
%28
%11
%20
%13
%16
%14
%19
%10
%16
%M
id M
aryl
and
10%
16%
11%
18%
9%15
%15
%21
%10
%16
%9%
18%
Mon
tgom
ery
12%
20%
12%
20%
11%
21%
10%
16%
13%
19%
11%
17%
Prin
ce G
eorg
e's
18%
29%
19%
32%
19%
33%
27%
36%
31%
37%
31%
43%
Sou
ther
n M
aryl
and
25%
39%
22%
37%
7%10
%11
%22
%9%
13%
8%11
%S
usqu
ehan
na6%
7%6%
10%
7%13
%6%
12%
5%11
%16
%21
%U
pper
Sho
re7%
13%
16%
25%
11%
17%
15%
26%
13%
26%
14%
30%
Wes
tern
Mar
ylan
d11
%18
%15
%25
%11
%16
%10
%14
%9%
14%
11%
20%
AL
L M
AR
YL
AN
D14
%24
%16
%28
%13
%24
%16
%25
%15
%21
%15
%24
%
2006
-200
7C
ore
Non
-Cor
eA
nne
Aru
ndel
8%
10%
Bal
timor
e C
ity16
%40
%B
altim
ore
15%
22%
Fred
eric
k12
%17
%Lo
wer
Sho
re11
%15
%M
id M
aryl
and
11%
22%
Mon
tgom
ery
11%
20%
Prin
ce G
eorg
e's
24%
36%
Sou
ther
n M
aryl
and
8%13
%S
usqu
ehan
na15
%21
%U
pper
Sho
re17
%32
%W
este
rn M
aryl
and
10%
17%
AL
L M
AR
YL
AN
D13
%25
%
Tab
le 1
9Tr
ends
in C
ore
and
Non
-Cor
e C
urric
ulum
Stu
dent
s N
eedi
ng R
eadi
ng R
emed
iatio
n in
Col
lege
(By
Maj
or J
uris
dict
ion)
27
1997
-199
8
1
998-
1999
199
9-20
0020
00-2
001
2002
-200
320
04-2
005
Cor
eN
on-C
ore
Cor
eN
on-C
ore
Cor
eN
on-C
ore
Cor
eN
on-C
ore
Cor
eN
on-C
ore
Cor
eN
on-C
ore
Ann
e A
rund
el
81%
74%
78%
75%
80%
71%
82%
78%
85%
79%
82%
80%
Bal
timor
e C
ity79
%73
%77
%75
%77
%75
%77
%73
%80
%65
%77
%71
%B
altim
ore
80%
72%
80%
80%
80%
78%
79%
81%
84%
78%
81%
84%
Fred
eric
k80
%84
%82
%78
%84
%84
%83
%78
%88
%83
%83
%81
%Lo
wer
Sho
re79
%91
%78
%73
%77
%77
%82
%89
%84
%77
%81
%74
%M
id M
aryl
and
81%
74%
83%
80%
83%
77%
83%
79%
82%
81%
82%
78%
Mon
tgom
ery
78%
70%
78%
72%
76%
67%
82%
78%
81%
78%
80%
79%
Prin
ce G
eorg
e's
73%
68%
76%
70%
70%
62%
78%
74%
75%
72%
76%
71%
Sou
ther
n M
aryl
and
77%
74%
80%
75%
79%
72%
78%
74%
84%
80%
78%
78%
Sus
queh
anna
82%
84%
82%
77%
83%
77%
82%
77%
84%
76%
84%
85%
Upp
er S
hore
86%
80%
86%
77%
72%
69%
82%
84%
80%
80%
86%
73%
Wes
tern
Mar
ylan
d84
%82
%83
%79
%87
%87
%89
%87
%89
%87
%82
%84
%A
LL
MA
RY
LA
ND
79%
74%
79%
75%
78%
71%
81%
78%
82%
78%
80%
78%
2006
-200
7C
ore
Non
-Cor
eA
nne
Aru
ndel
80
%81
%B
altim
ore
City
81%
72%
Bal
timor
e84
%81
%Fr
eder
ick
86%
80%
Low
er S
hore
77%
81%
Mid
Mar
ylan
d83
%76
%M
ontg
omer
y81
%81
%P
rince
Geo
rge'
s73
%76
%S
outh
ern
Mar
ylan
d81
%75
%S
usqu
ehan
na80
%75
%U
pper
Sho
re87
%82
%W
este
rn M
aryl
and
77%
78%
AL
L M
AR
YL
AN
D81
%78
%
Tab
le 2
0Tr
ends
in P
erce
ntag
e of
Stu
dent
s W
ho E
arne
d "C
" or B
ette
r in
Firs
t Col
lege
Mat
h C
ours
e A
mon
g C
ore
and
Non
Cor
e C
urric
ulum
Stu
dent
s (B
y M
ajor
Jur
isdi
ctio
n)
28
1997
-199
8
1
998-
1999
199
9-20
0020
00-2
001
2002
-200
320
04-2
005
Cor
eN
on-C
ore
Cor
eN
on-C
ore
Cor
eN
on-C
ore
Cor
eN
on-C
ore
Cor
eN
on-C
ore
Cor
eN
on-C
ore
Ann
e A
rund
el
87%
87%
88%
88%
90%
91%
90%
90%
88%
87%
89%
85%
Bal
timor
e C
ity86
%77
%85
%84
%84
%78
%87
%79
%87
%80
%85
%79
%B
altim
ore
88%
86%
90%
86%
90%
89%
89%
87%
90%
87%
89%
86%
Fred
eric
k91
%85
%86
%87
%89
%91
%90
%90
%91
%85
%91
%83
%Lo
wer
Sho
re88
%83
%85
%70
%92
%84
%87
%80
%89
%82
%85
%78
%M
id M
aryl
and
89%
85%
89%
81%
90%
89%
89%
84%
91%
87%
90%
85%
Mon
tgom
ery
84%
77%
83%
77%
86%
82%
87%
84%
88%
84%
85%
82%
Prin
ce G
eorg
e's
85%
80%
85%
81%
85%
81%
89%
86%
87%
86%
85%
80%
Sou
ther
n M
aryl
and
85%
86%
89%
87%
89%
89%
89%
79%
91%
82%
88%
84%
Sus
queh
anna
89%
87%
90%
86%
91%
82%
89%
86%
91%
87%
86%
84%
Upp
er S
hore
90%
81%
91%
78%
88%
84%
85%
80%
95%
88%
87%
81%
Wes
tern
Mar
ylan
d92
%90
%93
%86
%90
%87
%93
%84
%93
%90
%93
%85
%A
LL
MA
RY
LA
ND
87%
83%
87%
83%
88%
85%
88%
85%
89%
85%
87%
83%
2006
-200
7C
ore
Non
-Cor
eA
nne
Aru
ndel
87
%83
%B
altim
ore
City
84%
75%
Bal
timor
e88
%86
%Fr
eder
ick
87%
86%
Low
er S
hore
86%
77%
Mid
Mar
ylan
d87
%85
%M
ontg
omer
y87
%83
%P
rince
Geo
rge'
s81
%81
%S
outh
ern
Mar
ylan
d85
%85
%S
usqu
ehan
na89
%82
%U
pper
Sho
re86
%83
%W
este
rn M
aryl
and
86%
80%
AL
L M
AR
YL
AN
D86
%82
%
Tab
le 2
1Tr
ends
in P
erce
ntag
e of
Stu
dent
s W
ho E
arne
d "C
" or B
ette
r in
Firs
t Col
lege
Eng
lish
Cou
rse
Am
ong
Cor
e an
d N
on C
ore
Cur
ricul
um S
tude
nts
(By
Maj
or J
uris
dict
ion)
29
1997
-199
8
1
998-
1999
1999
-200
020
00-2
001
2002
-200
320
04-2
005
Cor
eN
on-C
ore
Cor
eN
on-C
ore
Cor
eN
on-C
ore
Cor
eN
on-C
ore
Cor
eN
on-C
ore
Cor
eN
on-C
ore
Ann
e A
rund
el
2.6
2.3
2.5
2.4
2.6
2.4
2.7
2.6
2.8
2.6
2.7
2.6
Bal
timor
e C
ity2.
42.
12.
42.
12.
32.
12.
32.
02.
42.
12.
42.
1B
altim
ore
2.5
2.4
2.5
2.4
2.5
2.4
2.6
2.4
2.6
2.5
2.6
2.5
Fred
eric
k2.
72.
72.
72.
42.
82.
42.
72.
52.
82.
52.
72.
5Lo
wer
Sho
re2.
62.
32.
42.
22.
52.
32.
52.
32.
62.
32.
52.
4M
id M
aryl
and
2.6
2.4
2.6
2.4
2.7
2.5
2.7
2.5
2.8
2.5
2.8
2.5
Mon
tgom
ery
2.6
2.2
2.6
2.3
2.6
2.3
2.6
2.4
2.7
2.5
2.7
2.5
Prin
ce G
eorg
e's
2.3
2.2
2.4
2.2
2.3
2.2
2.4
2.1
2.4
2.2
2.4
2.2
Sou
ther
n M
aryl
and
2.6
2.3
2.6
2.4
2.7
2.4
2.7
2.4
2.7
2.5
2.7
2.4
Sus
queh
anna
2.5
2.4
2.6
2.4
2.6
2.3
2.7
2.4
2.7
2.4
2.6
2.4
Upp
er S
hore
2.6
2.3
2.5
2.2
2.5
2.3
2.4
2.3
2.6
2.4
2.6
2.3
Wes
tern
Mar
ylan
d2.
62.
42.
82.
42.
72.
52.
82.
52.
82.
62.
82.
6A
LL
MA
RY
LA
ND
2.5
2.3
2.5
2.3
2.6
2.3
2.6
2.4
2.7
2.4
2.6
2.4
2006
-200
7C
ore
Non
-Cor
eA
nne
Aru
ndel
2.
70%
2.52
%B
altim
ore
City
2.44
%2.
01%
Bal
timor
e2.
64%
2.46
%Fr
eder
ick
2.69
%2.
52%
Low
er S
hore
2.47
%2.
36%
Mid
Mar
ylan
d2.
77%
2.54
%M
ontg
omer
y2.
70%
2.50
%P
rince
Geo
rge'
s2.
27%
2.17
%S
outh
ern
Mar
ylan
d2.
59%
2.44
%S
usqu
ehan
na2.
64%
2.42
%U
pper
Sho
re2.
64%
2.43
%W
este
rn M
aryl
and
2.69
%2.
55%
AL
L M
AR
YL
AN
D2.
612.
37
Tab
le 2
2Tr
ends
in C
umul
ativ
e G
rade
Poi
nt A
vera
ge o
f Cor
e an
d N
on C
ore
Cur
ricul
um S
tude
nts
Afte
r Firs
t Yea
r (B
y M
ajor
Jur
isdi
ctio
n)
30
1997
-199
8
1
998-
1999
199
9-20
0020
00-2
001
2002
-200
320
04-2
005
2006
-200
7C
ore
Non
-Cor
eC
ore
Non
-Cor
eC
ore
Non
-Cor
eC
ore
Non
-Cor
eC
ore
Non
-Cor
eC
ore
Non
-Cor
eC
ore
Non
-Cor
eC
omm
unity
Col
lege
s38
%49
%43
%55
%46
%56
%46
%54
%49
%59
%46
%58
%33
%69
%P
ublic
Fou
r-Y
ear
11%
18%
13%
21%
13%
17%
12%
17%
14%
16%
17%
22%
15%
28%
Inde
pend
ent
5%8%
8%10
%7%
8%3%
4%4%
7%10
%11
%7%
9%A
LL
CA
MP
US
ES
23%
36%
27%
41%
26%
38%
27%
38%
28%
40%
30%
41%
33%
49%
1997
-199
8
1
998-
1999
199
9-20
0020
00-2
001
2002
-200
320
04-2
005
2006
-200
7C
ore
Non
-Cor
eC
ore
Non
-Cor
eC
ore
Non
-Cor
eC
ore
Non
-Cor
eC
ore
Non
-Cor
eC
ore
Non
-Cor
eC
ore
Non
-Cor
eC
omm
unity
Col
lege
s21
%32
%29
%41
%27
%38
%25
%36
%25
%34
%21
%32
%21
%35
%P
ublic
Fou
r-Y
ear
5%9%
7%11
%7%
10%
8%9%
7%8%
5%7%
3%7%
Inde
pend
ent
1%1%
1%3%
1%2%
2%3%
3%4%
3%5%
1%2%
AL
L C
AM
PU
SE
S12
%22
%16
%28
%15
%25
%15
%25
%14
%22
%12
%21
%11
%23
%
1997
-199
8
1
998-
1999
199
9-20
00
2
000-
2001
200
2-20
0320
04-2
005
2004
-200
5C
ore
Non
-Cor
eC
ore
Non
-Cor
eC
ore
Non
-Cor
eC
ore
Non
-Cor
eC
ore
Non
-Cor
eC
ore
Non
-Cor
eC
ore
Non
-Cor
eC
omm
unity
Col
lege
s25
%35
%27
%38
%21
%35
%25
%34
%23
%31
%21
%34
%P
ublic
Fou
r-Y
ear
6%9%
8%13
%7%
11%
9%11
%9%
11%
10%
12%
7%13
%In
depe
nden
t1%
2%6%
9%6%
5%4%
7%*
*4%
7%6%
6%A
LL
CA
MP
US
ES
14%
24%
16%
28%
13%
24%
16%
25%
15%
21%
15%
24%
7%12
%
* Le
ss th
an 0
.5 p
erce
nt
Tren
ds in
Cor
e an
d N
on-C
ore
Cur
ricul
um S
tude
nts
Nee
ding
Mat
h R
emed
iatio
n in
Col
lege
(By
Hig
her E
duca
tion
Seg
men
t)
Tren
ds in
Cor
e an
d N
on C
ore
Cur
ricul
um S
tude
nts
Nee
ding
Eng
lish
Rem
edia
tion
in C
olle
ge (B
y H
ighe
r Edu
catio
n S
egm
ent)
Tren
ds in
Cor
e an
d N
on C
ore
Cur
ricul
um S
tude
nts
Nee
ding
Rea
ding
Rem
edia
tion
in C
olle
ge (B
y H
ighe
r Edu
catio
n S
egem
ent)
Tab
le 2
3
Tab
le 2
4
Tab
le 2
5
31
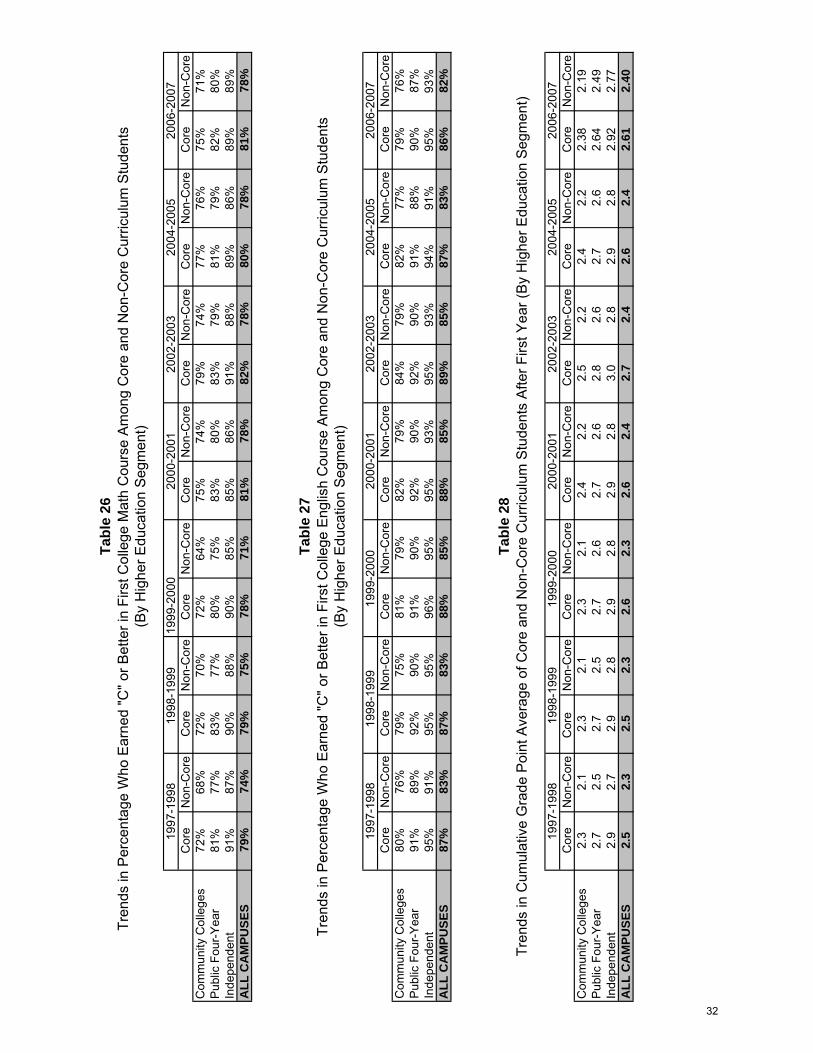
1997
-199
8
1
998-
1999
1999
-200
020
00-2
001
2002
-200
320
04-2
005
2006
-200
7C
ore
Non
-Cor
eC
ore
Non
-Cor
eC
ore
Non
-Cor
eC
ore
Non
-Cor
eC
ore
Non
-Cor
eC
ore
Non
-Cor
eC
ore
Non
-Cor
eC
omm
unity
Col
lege
s72
%68
%72
%70
%72
%64
%75
%74
%79
%74
%77
%76
%75
%71
%P
ublic
Fou
r-Y
ear
81%
77%
83%
77%
80%
75%
83%
80%
83%
79%
81%
79%
82%
80%
Inde
pend
ent
91%
87%
90%
88%
90%
85%
85%
86%
91%
88%
89%
86%
89%
89%
AL
L C
AM
PU
SE
S79
%74
%79
%75
%78
%71
%81
%78
%82
%78
%80
%78
%81
%78
%
1997
-199
8
1
998-
1999
199
9-20
0020
00-2
001
2002
-200
320
04-2
005
2006
-200
7C
ore
Non
-Cor
eC
ore
Non
-Cor
eC
ore
Non
-Cor
eC
ore
Non
-Cor
eC
ore
Non
-Cor
eC
ore
Non
-Cor
eC
ore
Non
-Cor
eC
omm
unity
Col
lege
s80
%76
%79
%75
%81
%79
%82
%79
%84
%79
%82
%77
%79
%76
%P
ublic
Fou
r-Y
ear
91%
89%
92%
90%
91%
90%
92%
90%
92%
90%
91%
88%
90%
87%
Inde
pend
ent
95%
91%
95%
95%
96%
95%
95%
93%
95%
93%
94%
91%
95%
93%
AL
L C
AM
PU
SE
S87
%83
%87
%83
%88
%85
%88
%85
%89
%85
%87
%83
%86
%82
%
1997
-199
8
1
998-
1999
199
9-20
0020
00-2
001
2002
-200
320
04-2
005
2006
-200
7C
ore
Non
-Cor
eC
ore
Non
-Cor
eC
ore
Non
-Cor
eC
ore
Non
-Cor
eC
ore
Non
-Cor
eC
ore
Non
-Cor
eC
ore
Non
-Cor
eC
omm
unity
Col
lege
s2.
32.
12.
32.
12.
32.
12.
42.
22.
52.
22.
42.
22.
382.
19P
ublic
Fou
r-Y
ear
2.7
2.5
2.7
2.5
2.7
2.6
2.7
2.6
2.8
2.6
2.7
2.6
2.64
2.49
Inde
pend
ent
2.9
2.7
2.9
2.8
2.9
2.8
2.9
2.8
3.0
2.8
2.9
2.8
2.92
2.77
AL
L C
AM
PU
SE
S2.
52.
32.
52.
32.
62.
32.
62.
42.
72.
42.
62.
42.
612.
40
Tren
ds in
Per
cent
age
Who
Ear
ned
"C" o
r Bet
ter i
n Fi
rst C
olle
ge E
nglis
h C
ours
e A
mon
g C
ore
and
Non
-Cor
e C
urric
ulum
Stu
dent
s(B
y H
ighe
r Edu
catio
n S
egm
ent)
Tab
le 2
8Tr
ends
in C
umul
ativ
e G
rade
Poi
nt A
vera
ge o
f Cor
e an
d N
on-C
ore
Cur
ricul
um S
tude
nts
Afte
r Firs
t Yea
r (B
y H
ighe
r Edu
catio
n S
egm
ent)
Tren
ds in
Per
cent
age
Who
Ear
ned
"C" o
r Bet
ter i
n Fi
rst C
olle
ge M
ath
Cou
rse
Am
ong
Cor
e an
d N
on-C
ore
Cur
ricul
um S
tude
nts
(By
Hig
her E
duca
tion
Seg
men
t)
Tab
le 2
6
Tab
le 2
7
32
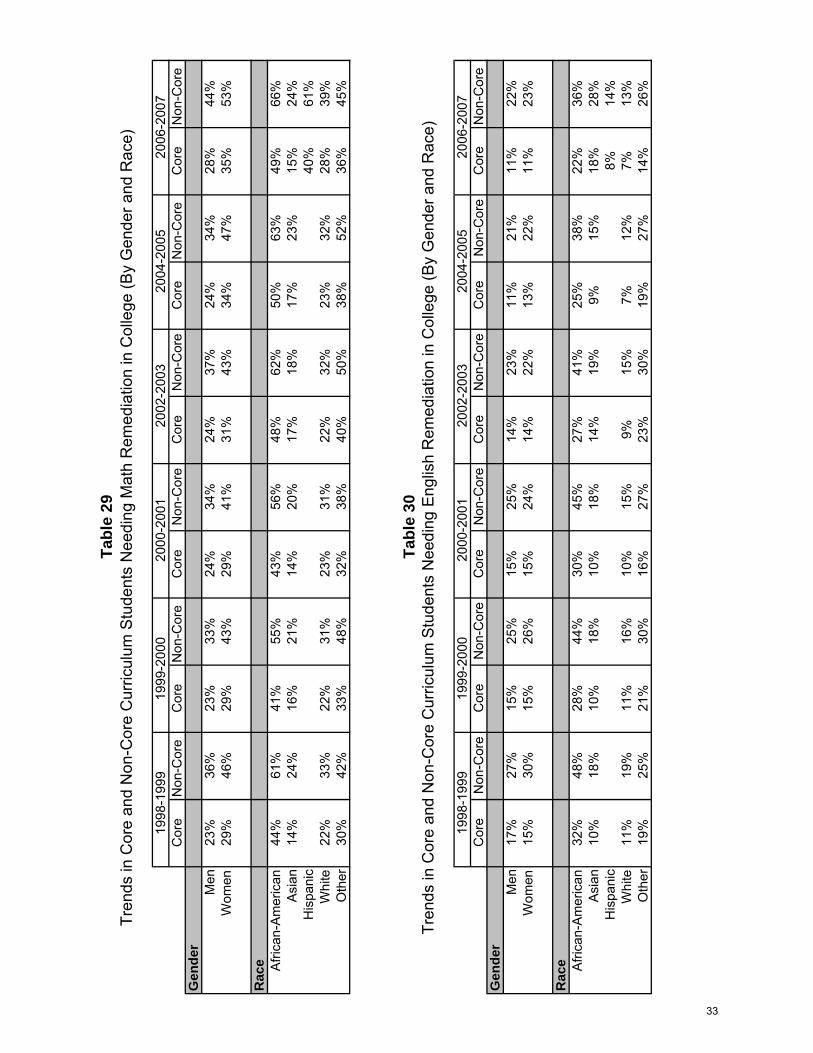
199
8-19
99
1
999-
2000
2000
-200
120
02-2
003
2006
-200
7C
ore
Non
-Cor
eC
ore
Non
-Cor
eC
ore
Non
-Cor
eC
ore
Non
-Cor
eC
ore
Non
-Cor
eC
ore
Non
-Cor
eG
end
erM
en23
%36
%23
%33
%24
%34
%24
%37
%24
%34
%28
%44
%W
omen
29%
46%
29%
43%
29%
41%
31%
43%
34%
47%
35%
53%
Rac
e Afri
can-
Am
eric
an44
%61
%41
%55
%43
%56
%48
%62
%50
%63
%49
%66
%A
sian
14%
24%
16%
21%
14%
20%
17%
18%
17%
23%
15%
24%
His
pani
c40
%61
%W
hite
22%
33%
22%
31%
23%
31%
22%
32%
23%
32%
28%
39%
Oth
er30
%42
%33
%48
%32
%38
%40
%50
%38
%52
%36
%45
%
199
8-19
99
1
999-
2000
2000
-200
120
02-2
003
2006
-200
7C
ore
Non
-Cor
eC
ore
Non
-Cor
eC
ore
Non
-Cor
eC
ore
Non
-Cor
eC
ore
Non
-Cor
eC
ore
Non
-Cor
eG
end
erM
en17
%27
%15
%25
%15
%25
%14
%23
%11
%21
%11
%22
%W
omen
15%
30%
15%
26%
15%
24%
14%
22%
13%
22%
11%
23%
Rac
e Afri
can-
Am
eric
an32
%48
%28
%44
%30
%45
%27
%41
%25
%38
%22
%36
%A
sian
10%
18%
10%
18%
10%
18%
14%
19%
9%15
%18
%28
%H
ispa
nic
8%14
%W
hite
11%
19%
11%
16%
10%
15%
9%15
%7%
12%
7%13
%O
ther
19%
25%
21%
30%
16%
27%
23%
30%
19%
27%
14%
26%
2004
-200
5
2004
-200
5
Tren
ds in
Cor
e an
d N
on-C
ore
Cur
ricul
um S
tude
nts
Nee
ding
Mat
h R
emed
iatio
n in
Col
lege
(By
Gen
der a
nd R
ace)
Tab
le 2
9
Tab
le 3
0Tr
ends
in C
ore
and
Non
-Cor
e C
urric
ulum
Stu
dent
s N
eedi
ng E
nglis
h R
emed
iatio
n in
Col
lege
(By
Gen
der a
nd R
ace)
33
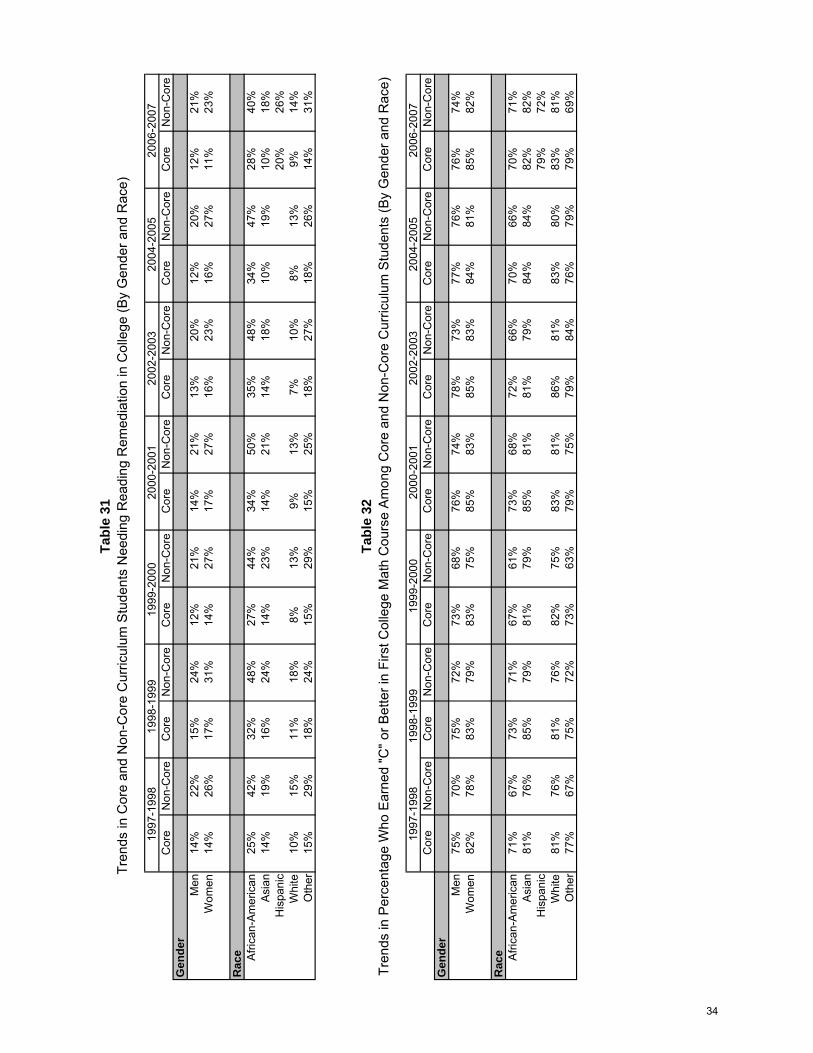
1997
-199
8
1
998-
1999
199
9-20
0020
00-2
001
2002
-200
320
04-2
005
2006
-200
7C
ore
Non
-Cor
eC
ore
Non
-Cor
eC
ore
Non
-Cor
eC
ore
Non
-Cor
eC
ore
Non
-Cor
eC
ore
Non
-Cor
eC
ore
Non
-Cor
eG
end
erM
en14
%22
%15
%24
%12
%21
%14
%21
%13
%20
%12
%20
%12
%21
%W
omen
14%
26%
17%
31%
14%
27%
17%
27%
16%
23%
16%
27%
11%
23%
Rac
e Afri
can-
Am
eric
an25
%42
%32
%48
%27
%44
%34
%50
%35
%48
%34
%47
%28
%40
%A
sian
14%
19%
16%
24%
14%
23%
14%
21%
14%
18%
10%
19%
10%
18%
His
pani
c20
%26
%W
hite
10%
15%
11%
18%
8%13
%9%
13%
7%10
%8%
13%
9%14
%O
ther
15%
29%
18%
24%
15%
29%
15%
25%
18%
27%
18%
26%
14%
31%
19
97-1
998
199
8-19
9919
99-2
000
2000
-200
120
02-2
003
2004
-200
520
06-2
007
Cor
eN
on-C
ore
Cor
eN
on-C
ore
Cor
eN
on-C
ore
Cor
eN
on-C
ore
Cor
eN
on-C
ore
Cor
eN
on-C
ore
Cor
eN
on-C
ore
Gen
der
Men
75%
70%
75%
72%
73%
68%
76%
74%
78%
73%
77%
76%
76%
74%
Wom
en82
%78
%83
%79
%83
%75
%85
%83
%85
%83
%84
%81
%85
%82
%
Rac
e Afri
can-
Am
eric
an71
%67
%73
%71
%67
%61
%73
%68
%72
%66
%70
%66
%70
%71
%A
sian
81%
76%
85%
79%
81%
79%
85%
81%
81%
79%
84%
84%
82%
82%
His
pani
c79
%72
%W
hite
81%
76%
81%
76%
82%
75%
83%
81%
86%
81%
83%
80%
83%
81%
Oth
er77
%67
%75
%72
%73
%63
%79
%75
%79
%84
%76
%79
%79
%69
%
Tab
le 3
1Tr
ends
in C
ore
and
Non
-Cor
e C
urric
ulum
Stu
dent
s N
eedi
ng R
eadi
ng R
emed
iatio
n in
Col
lege
(By
Gen
der a
nd R
ace)
Tab
le 3
2Tr
ends
in P
erce
ntag
e W
ho E
arne
d "C
" or B
ette
r in
Firs
t Col
lege
Mat
h C
ours
e A
mon
g C
ore
and
Non
-Cor
e C
urric
ulum
Stu
dent
s (B
y G
ende
r and
Rac
e)
34
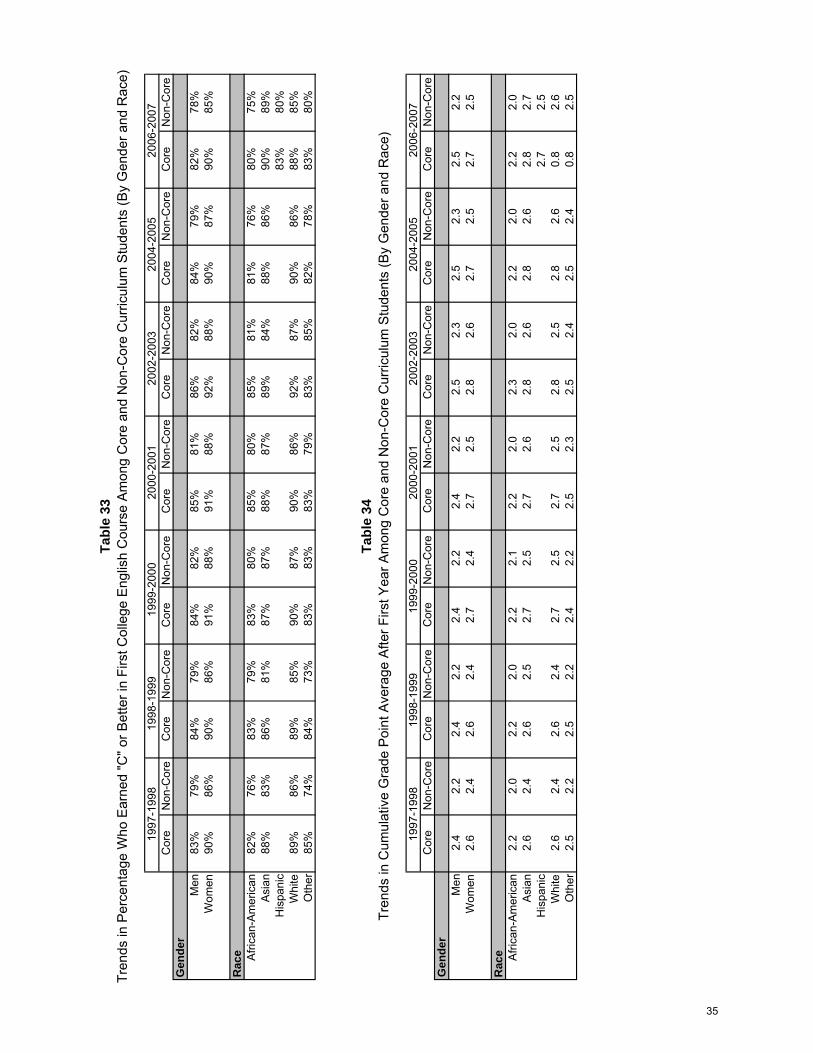
1997
-199
8
1
998-
1999
199
9-20
0020
00-2
001
2002
-200
320
04-2
005
2006
-200
7C
ore
Non
-Cor
eC
ore
Non
-Cor
eC
ore
Non
-Cor
eC
ore
Non
-Cor
eC
ore
Non
-Cor
eC
ore
Non
-Cor
eC
ore
Non
-Cor
eG
end
erM
en83
%79
%84
%79
%84
%82
%85
%81
%86
%82
%84
%79
%82
%78
%W
omen
90%
86%
90%
86%
91%
88%
91%
88%
92%
88%
90%
87%
90%
85%
Rac
e Afri
can-
Am
eric
an82
%76
%83
%79
%83
%80
%85
%80
%85
%81
%81
%76
%80
%75
%A
sian
88%
83%
86%
81%
87%
87%
88%
87%
89%
84%
88%
86%
90%
89%
His
pani
c83
%80
%W
hite
89%
86%
89%
85%
90%
87%
90%
86%
92%
87%
90%
86%
88%
85%
Oth
er85
%74
%84
%73
%83
%83
%83
%79
%83
%85
%82
%78
%83
%80
%
2006
-200
7C
ore
Non
-Cor
eC
ore
Non
-Cor
eC
ore
Non
-Cor
eC
ore
Non
-Cor
eC
ore
Non
-Cor
eC
ore
Non
-Cor
eC
ore
Non
-Cor
eG
end
erM
en2.
42.
22.
42.
22.
42.
22.
42.
22.
52.
32.
52.
32.
52.
2W
omen
2.6
2.4
2.6
2.4
2.7
2.4
2.7
2.5
2.8
2.6
2.7
2.5
2.7
2.5
Rac
e Afri
can-
Am
eric
an2.
22.
02.
22.
02.
22.
12.
22.
02.
32.
02.
22.
02.
22.
0A
sian
2.6
2.4
2.6
2.5
2.7
2.5
2.7
2.6
2.8
2.6
2.8
2.6
2.8
2.7
His
pani
c2.
72.
5W
hite
2.6
2.4
2.6
2.4
2.7
2.5
2.7
2.5
2.8
2.5
2.8
2.6
0.8
2.6
Oth
er2.
52.
22.
52.
22.
42.
22.
52.
32.
52.
42.
52.
40.
82.
5
Tren
ds in
Per
cent
age
Who
Ear
ned
"C" o
r Bet
ter i
n Fi
rst C
olle
ge E
nglis
h C
ours
e A
mon
g C
ore
and
Non
-Cor
e C
urric
ulum
Stu
dent
s (B
y G
ende
r and
Rac
e)T
able
33
Tab
le 3
4
1997
-199
819
98-1
999
1999
-200
020
00-2
001
2002
-200
320
04-2
005
Tren
ds in
Cum
ulat
ive
Gra
de P
oint
Ave
rage
Afte
r Firs
t Yea
r Am
ong
Cor
e an
d N
on-C
ore
Cur
ricul
um S
tude
nts
(By
Gen
der a
nd R
ace)
35
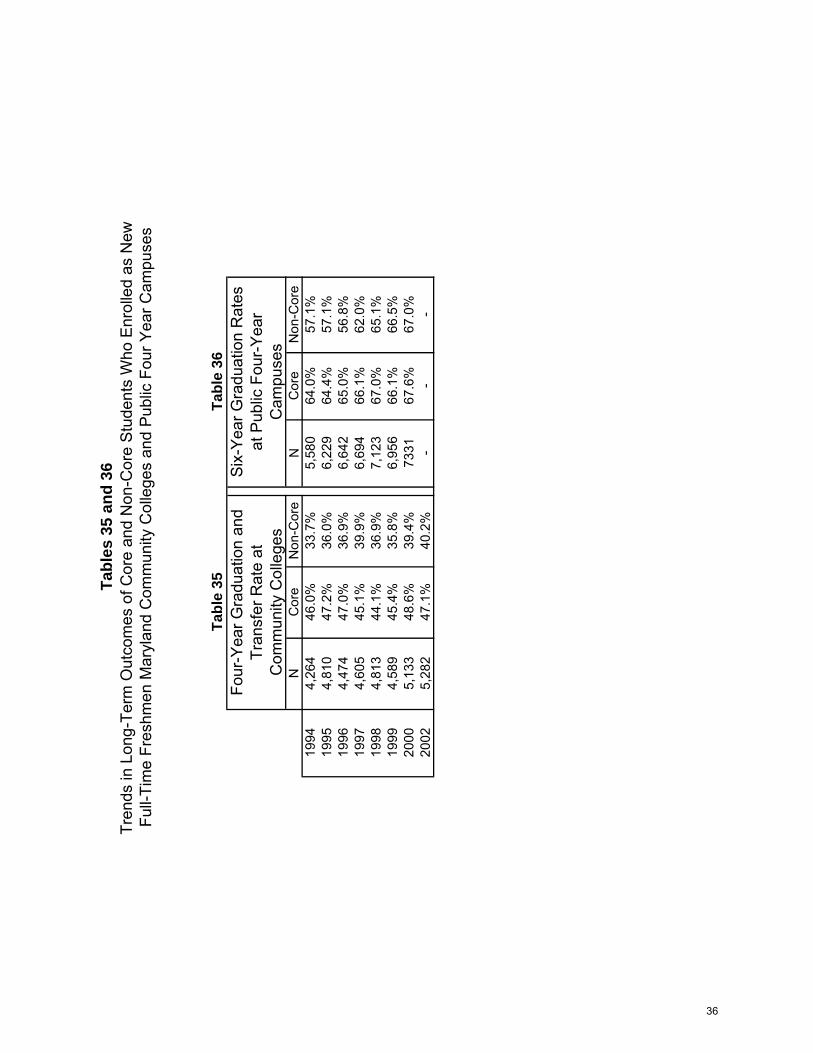
NC
ore
Non
-Cor
eN
Cor
eN
on-C
ore
1994
4,26
446
.0%
33.7
%5,
580
64.0
%57
.1%
1995
4,81
047
.2%
36.0
%6,
229
64.4
%57
.1%
1996
4,47
447
.0%
36.9
%6,
642
65.0
%56
.8%
1997
4,60
545
.1%
39.9
%6,
694
66.1
%62
.0%
1998
4,81
344
.1%
36.9
%7,
123
67.0
%65
.1%
1999
4,58
945
.4%
35.8
%6,
956
66.1
%66
.5%
2000
5,13
348
.6%
39.4
%73
3167
.6%
67.0
%20
025,
282
47.1
%40
.2%
- -
-
Four
-Yea
r Gra
duat
ion
and
Tran
sfer
Rat
e at
Com
mun
ity C
olle
ges
Six
-Yea
r Gra
duat
ion
Rat
es
at P
ublic
Fou
r-Y
ear
Cam
puse
s
Tab
le 3
6
Tab
les
35 a
nd
36
Tren
ds in
Lon
g-Te
rm O
utco
mes
of C
ore
and
Non
-Cor
e S
tude
nts
Who
Enr
olle
d as
New
Full-
Tim
e Fr
eshm
en M
aryl
and
Com
mun
ity C
olle
ges
and
Pub
lic F
our Y
ear C
ampu
ses
Tab
le 3
5
36
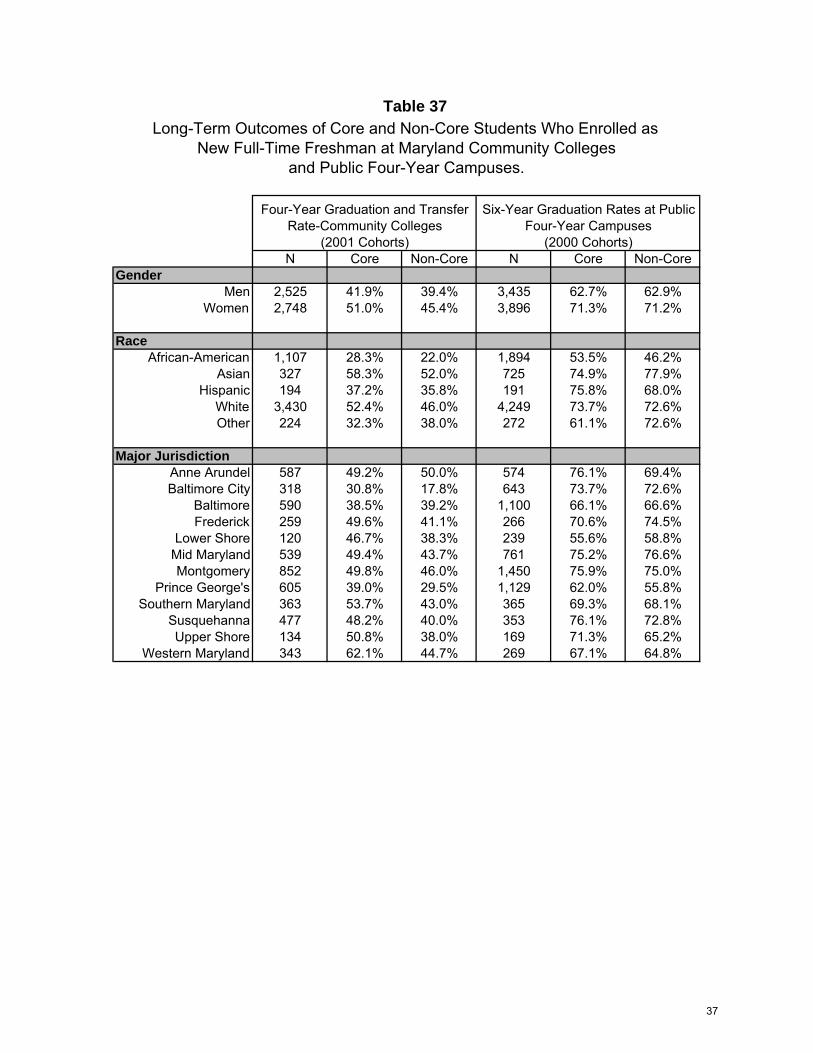
N Core Non-Core N Core Non-CoreGender
Men 2,525 41.9% 39.4% 3,435 62.7% 62.9%Women 2,748 51.0% 45.4% 3,896 71.3% 71.2%
RaceAfrican-American 1,107 28.3% 22.0% 1,894 53.5% 46.2%
Asian 327 58.3% 52.0% 725 74.9% 77.9%Hispanic 194 37.2% 35.8% 191 75.8% 68.0%
White 3,430 52.4% 46.0% 4,249 73.7% 72.6%Other 224 32.3% 38.0% 272 61.1% 72.6%
Major JurisdictionAnne Arundel 587 49.2% 50.0% 574 76.1% 69.4%Baltimore City 318 30.8% 17.8% 643 73.7% 72.6%
Baltimore 590 38.5% 39.2% 1,100 66.1% 66.6%Frederick 259 49.6% 41.1% 266 70.6% 74.5%
Lower Shore 120 46.7% 38.3% 239 55.6% 58.8%Mid Maryland 539 49.4% 43.7% 761 75.2% 76.6%Montgomery 852 49.8% 46.0% 1,450 75.9% 75.0%
Prince George's 605 39.0% 29.5% 1,129 62.0% 55.8%Southern Maryland 363 53.7% 43.0% 365 69.3% 68.1%
Susquehanna 477 48.2% 40.0% 353 76.1% 72.8%Upper Shore 134 50.8% 38.0% 169 71.3% 65.2%
Western Maryland 343 62.1% 44.7% 269 67.1% 64.8%
Four-Year Graduation and Transfer Rate-Community Colleges
(2001 Cohorts)
Six-Year Graduation Rates at Public Four-Year Campuses
(2000 Cohorts)
Long-Term Outcomes of Core and Non-Core Students Who Enrolled asNew Full-Time Freshman at Maryland Community Colleges
and Public Four-Year Campuses.
Table 37
37