Embed Size (px)
Citation preview

STUDENT PERFORMANCE REPORT Irvington Union Free School District
Report to the Board of EducationMay 2019
1

Monitoring Student Growth• Standardized test data is only one measure of student achievement and does not
necessarily demonstrate growth
• State tests have limits to their value:• Represents performance on a given day(s)• Cohort sizes hinder direct comparisons• Consistent changes in test models, scale and cut scores, & curriculum standards
• The District utilizes multiple means of assessment to measure progress including:• Teacher observation• Regular, formative assessment• Common unit assessments • Teacher-made assessments• Benchmark assessments, universal screener• Student self-reflection • Student choice/participation in electives
• Value of dispositional learning: 21st Century Skills & Habits of Mind
• Rich extracurricular opportunities such as arts, music, athletics, and clubs
2

Executive Summary
• 95% of 2018 class received Regents Diplomas
• SAT scores - A new format was used in 2018 - the categories are:
• Reading and Writing 17% higher than US average • Math 18% higher• Total 17% higher
• ACT score 29% higher than national average
• 19 AP Class offerings: 67% passing, 41% of all exam-takers received 4 or 5
3
Irvington Schools continue to perform at very high levels

� 2002-03: 14 Teams Honored, 4 Teams with Top Student Averages in the Group
� 2003-04: 16 Teams Honored, 2 Teams with NYS Highest GPA, 4 League Champions
� 2004-05: 14 Teams Honored, 3 Teams with NYS Highest GPA, 2 League Champions
� 2005-06: 14 Teams Honored� 2007-08: 20 recognized as NYS Scholar Athlete teams . Boys
Bowling and Boys Soccer highest GPA in NYS for their sport� 2008-09: 24 recognized as NYS Scholar Athlete teams . Boys and
Girls Track teams highest GPA in NYS for their sport� 2009-10: 22 recognized as NYS Scholar Athlete teams. Girls cross
country, bowling and softball teams highest GPA in NYS for their sport
� 2010-11: 20 recognized as NYS Scholar Athlete teams. Three teams with highest average GPA in NYS for their sport
� 2011-12: 22 out of 27 Varsity Teams Recognized as NYS Scholar Athlete teams (90 or higher GPA). Two teams with highest average GPA in NYS for their sport
� 2012-13: 22 out of 27 Varsity Teams Recognized as NYS Scholar Athlete teams (90 or higher GPA). Two teams with highest average GPA in NYS for their sport
4
� 2013-14: 21 out of 27 Varsity Teams Recognized as NYS Scholar Athlete teams (90 or higher GPA). Three teams with highest average GPA in
NYS for their sport
� 2014-15: 16 varsity teams honored as NYS Scholar Athlete teams (above 90 avg.) and 1 team was a NYS Scholar Athlete Champion as highest GPA’s in the state
� 2015-16: 6 varsity teams recognized as NY State Scholar Athlete Team Champions, highest GPA for their sport in the state; 14 varsity teams in all were recognized as State Scholar Athlete teams with an average GPA of 90 or above.
� 2016-17: 227 varsity students achieved status as NY State Scholar Athletes with a average GPA of 90 or above during their sports season. 21 varsity teams were recognized by NY State as Scholar Athlete Teams. This means that 75% of the entire team roster had a 90 or better average. As a result of having 21 of 24 teams with a 90 average or better, NYSPHSAA recognized Irvington as a School of Excellence for having at least 75% of all varsity teams achieve Scholar Athlete Team status.
2017-18: 235 varsity students achieved status as NY State Scholar Athletes with an average GPA of 90 or above during their sports season. 24 teams were recognized by NY State as Scholar Athlete teams. This means that 75 % of the entire roster had a 90 or better average.
NYS Scholar Athlete = 90 or higher GPA

Opportunities• The District continues to use test data as one tool to inform our work
• Data is used to lead meaningful discussions to target cohort needs and inform curriculum design
• Data use continues to increase across the District
• The District has focused on deepening instruction and aligning curricula – this work will continue to enhance student achievement
• The District’s focus on Professional Learning has had positive impacts on student growth
• Data usage continues to increase at all levels to help inform instruction
Note: State test data does not necessarily depict growth but demonstrates achievement on the particular test
5

Executive Summary – Standardized Tests
• Irvington English Language Arts scores rank among the top 6 in our measured cohort of schools for grades 6-8; we continue to see improvement from our efforts in this area
• For Math standardized tests, our IMS 8th grade scores are impacted by the cohort of students taking the advanced level course (Algebra) as they take the Algebra Regents instead
• Regents Scores (% passing):
6
Algebra I 93% English 86% Earth Science 92%
Algebra II 94% Global History 87% Living Environment 94%
Geometry 97% US History 96% Chemistry 96%

Executive Summary – Standardized Tests
• Teachers utilize released questions to aid in the planning of instruction
• Use data reports to identify which standards posed challenges for individual students
• Informs small group and whole group instruction
• In math, use data at math learning sessions
• Interventionists target support using data
• Team meeting time used to review data
7

New York State TestsEnglish Language Arts & Mathematics
8

2018 English Language Arts Scores
9
2018 Mathematics Scores
10

Comparative DataGrade 3 - 8 Tests & Regents Exams
11

Comparison Data
• Ardsley
• Blind Brook
• Briarcliff Manor
• Croton-Harmon
• Dobbs Ferry
• Edgemont
• Hastings-on-Hudson
• Irvington
• Mamaroneck
• Pleasantville
• Rye Neck
12
To better understand how Irvington students performed in context of comparative districts, the following slides include data for the following districts:

Mathematics - Grade 3 - 8
13

2018 Math - Grades 3 & 414
Score Distribution vs Comparison Cohort of Westchester Schools

2018 Math - Grades 5 & 615
Score Distribution vs Comparison Cohort of Westchester Schools

2018 Math - Grades 7 & 816
Score Distribution vs Comparison Cohort of Westchester Schools

English Language Arts - Grade 3 - 8
17

2018 ELA - Grades 3 & 418
Score Distribution vs Comparison Cohort of Westchester Schools

2018 ELA - Grades 5 & 619
Score Distribution vs Comparison Cohort of Westchester Schools

2018 ELA - Grades 7 & 820
Score Distribution vs Comparison Cohort of Westchester Schools

Science - Grades 4 & 8
21

2018 Science - Grades 4 & 8 22
Score Distribution vs Comparison Cohort of Westchester Schools

Executive Summary – Grade 3 - 8 Tests• Longitudinal data allows the District to examine trends in cohorts
• Use of RTI data supporting struggling learners
• Mean score average of MS ELA scores is among the highest of our regional cohorts:
• Edgemont 614• Irvington 611• Mamaroneck 611• Hastings 611• Ardsley 610• Briarcliff 610
• Expanded use of data may introduce additional insights into student needs and curricular enhancements
23
• Croton-Harmon 610• Pleasantville 609• Blind Brook 608• Dobbs Ferry 607• Rye Neck 607

Regents Exams
24

Executive Summary – Regents Exams
25
Regents Diploma Advanced Regents DiplomaExamination Requirements
A student must achieve a score of 65 or higher on five Regents exams:
• English Language Arts (ELA)
• Any mathematics exam (Algebra I, Geometry, or Algebra II/Trigonometry)
• Any social studies exam (Global History and Geography or U.S. History and Government)
• Any science exam ( Living Environment, Chemistry, Earth Science, or Physics)
• Any additional Regents exam or assessment approved by the State for this purpose
A student must achieve a score of 65 or higher on nine exams:
• English Language Arts (ELA)
• Three mathematics exams (Algebra I, Geometry, and Algebra II/Trigonometry)
• Any social studies exam (Global History and Geography or U.S. History and Government)
• Two science exams (Living Environment and one of the following: Chemistry, Earth Science, or Physics)
• Any additional Regents exam or assessment approved by the State for this purpose
• Any Languages Other Than English (LOTE) exam

Irvington High School Regents Diplomas Awarded
26
Year Students Graduates Regents Diplomas
2003 94 91 82%
2004 124 123 95%
2005 138 134 97%
2006 122 119 96%
2007 141 138 92%
2008 157 145 93%
2009 172 169 99%
2010 149 146 95%
2011 155 151 96%
2012 142 142 96%
2013 150 146 97%
2014 148 146 95%
2015 134 130 95%
2016 150 146 97%
2017 130 128 95%
2018 127 124 95%
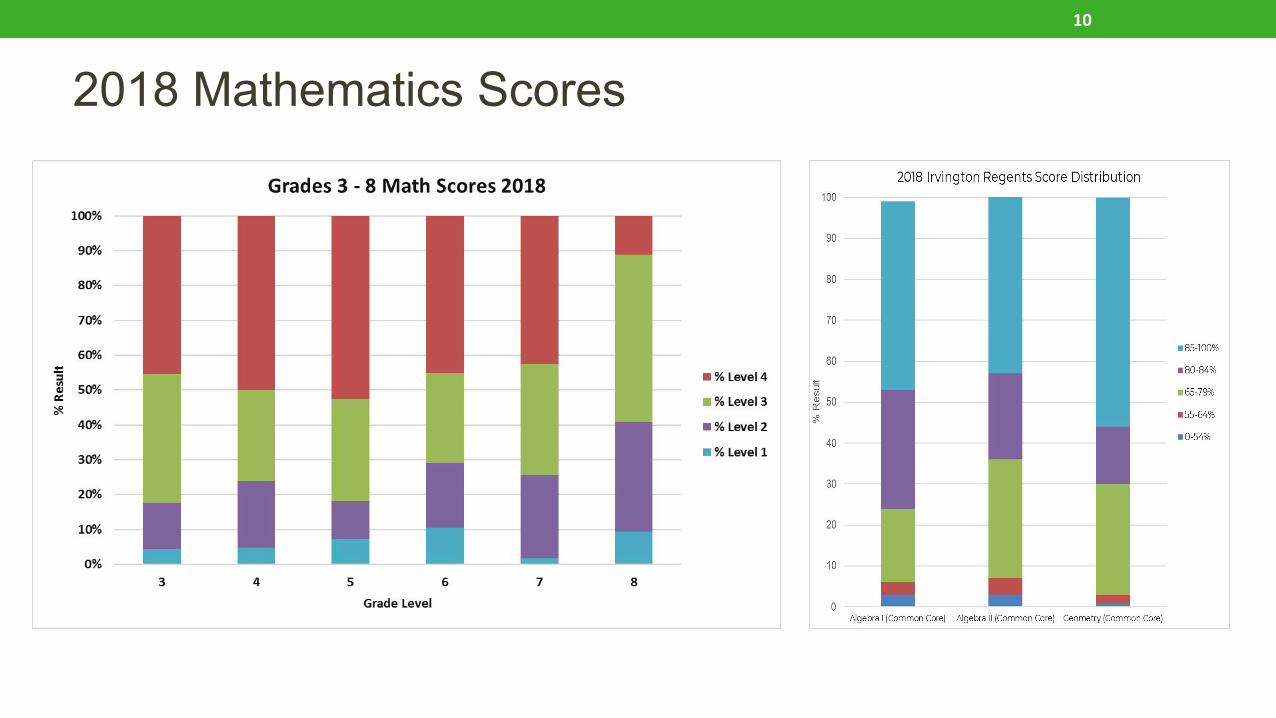
2018 Irvington Regents Results
27
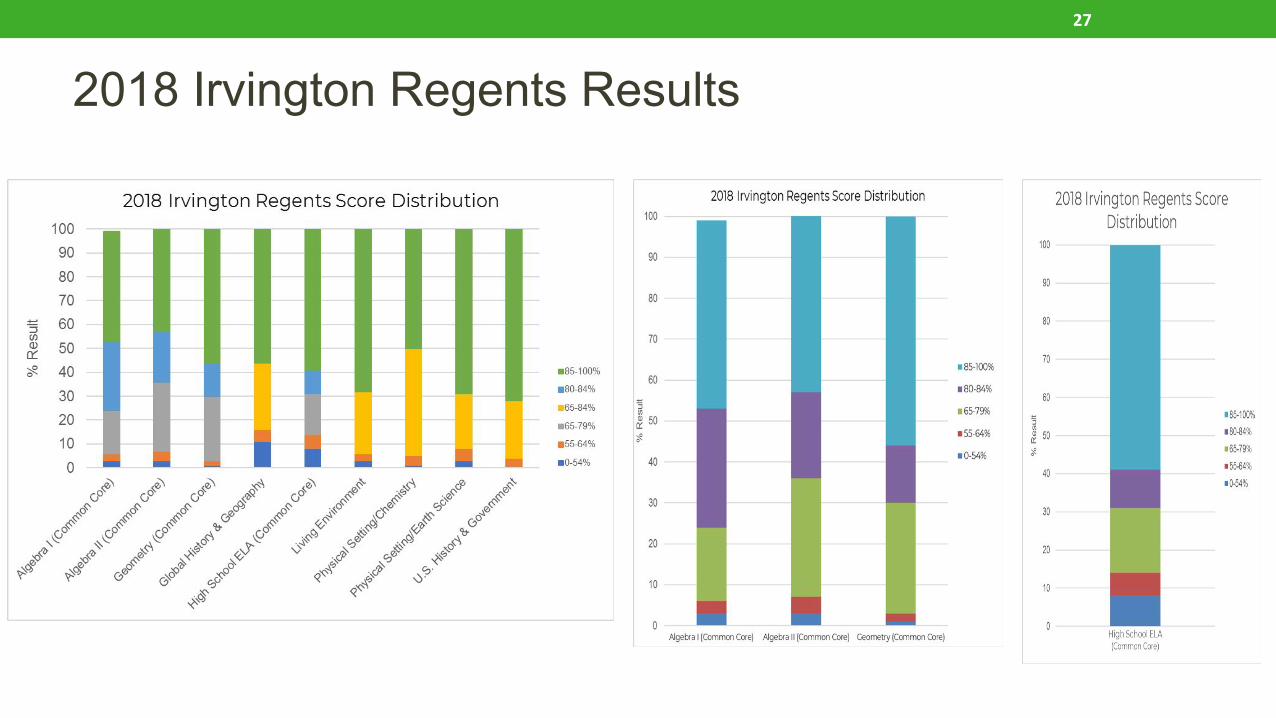
2018 Common Core Algebra
28
Score Distribution vs Comparison Cohort of Westchester Schools
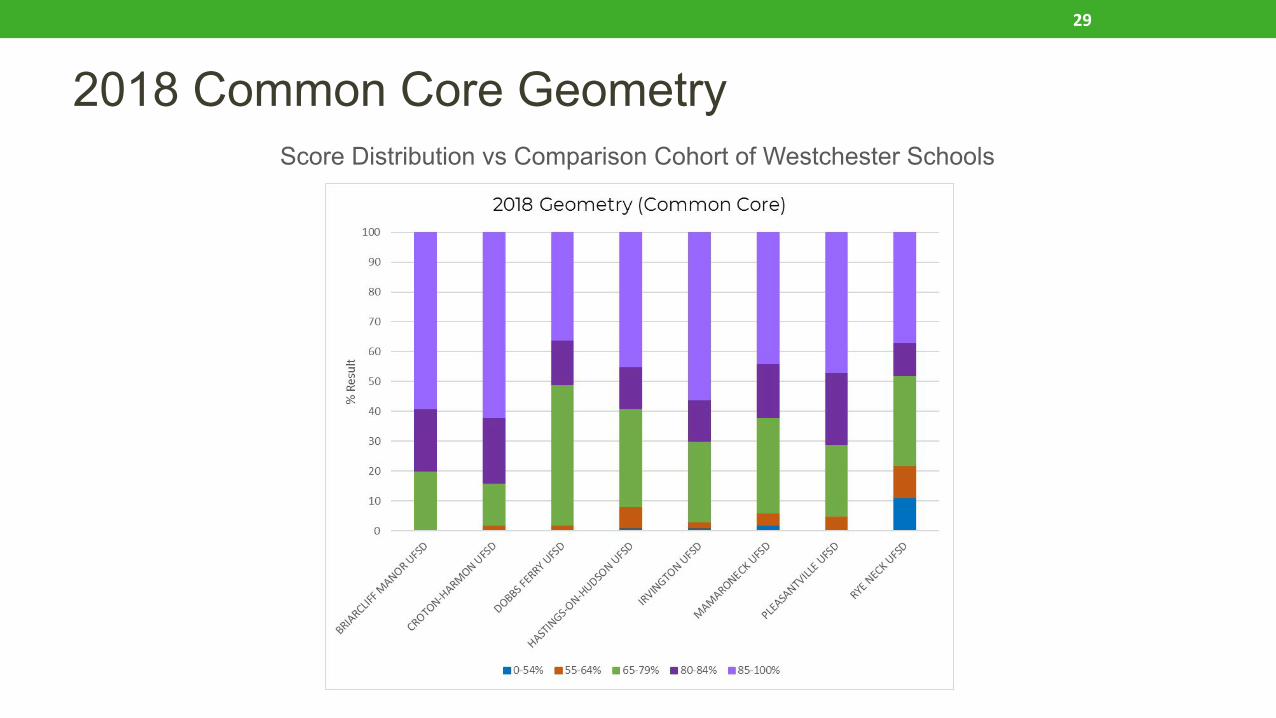
2018 Common Core Geometry
29
Score Distribution vs Comparison Cohort of Westchester Schools

2018 Science Regents
30
Score Distribution vs Comparison Cohort of Westchester Schools

2018 Chemistry Regents
31
Score Distribution vs Comparison Cohort of Westchester Schools

2018 History Regents
32
Score Distribution vs Comparison Cohort of Westchester Schools

2018 Common Core ELA Comparison
33
Score Distribution vs Comparison Cohort of Westchester Schools

Executive Summary – Regents Exams
• Consideration of the value/need to continue to pursue the advanced Regents Diploma
• Few colleges consider aside from NYS public institutions
• Cohort results vary, for all school districts, due to numerous factors
• Cohort size and course selection of electives impacts participation
• Departments can utilize data to inform instruction and reflect on past experiences
34

Advanced Placement (AP) Exams
35

Executive Summary - Advanced Placement
• IHS maintains open-enrollment for AP courses which increased access for all students
• The addition of numerous electives has impacted student enrollment in AP courses
• Overall, Irvington students performed well, with 67% passing (3+) at least one exam
• Of the 583 exams taken by students in 2018, 15% resulted in a 5, and 26% resulted in a 4 and 26% resulted in a 3, for overall passing of 67%
36
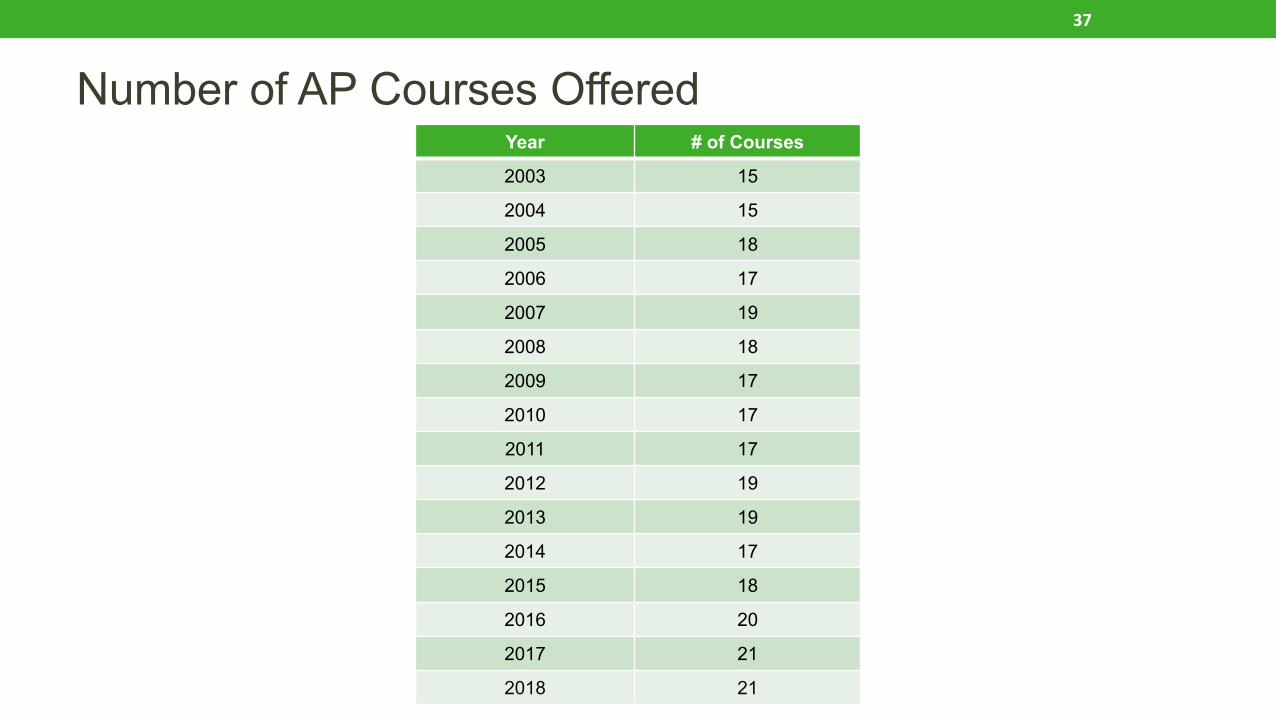
Number of AP Courses OfferedYear # of Courses
2003 15
2004 15
2005 18
2006 17
2007 19
2008 18
2009 17
2010 17
2011 17
2012 19
2013 19
2014 17
2015 18
2016 20
2017 21
2018 21
37

AP Exam – Participation and Passing RatesYear Enrollment # Taking # Passing
2003 480 231 160
2004 530 394 296
2005 550 416 291
2006 597 384 272
2007 600 410 266
2008 608 457 289
2009 611 536 329
2010 607 524 302
2011 612 505 344
2012 608 554 381
2013 594 589 368
2014 559 559 367
2015 530 525 405
2016 569 558 383
2017 540 527 377
2018 535 583 389
38

2018 AP Exam Scores
39
Enrollment in AP classes varies significantly by program, which impacts score distribution. We continue to review programs to identify areas for improvement as well as to find new course opportunities.
Note: AP Computer Science is offered in alternating years - it was previously offered in the 2015-16 school year and will not be offered again until the 2019-20 school year.AP Music Theory is offered in alternating years – it was offered in the 2016-17 school year and will not be offered again until the 2018-19 school year.

National Passing % 2018
World: 56%US: 52%Macro: 58%Micro: 68%Psych: 66%
Red box indicates performance below National average
Course Number of Students
Year 2014-2015 2015-2016 2016-2017 2017-2018
Macro 56 62 49 45
Micro 33 42 35 27
Psychology 44 30 41 42
US History 86 80 65 95
World History 27 14 30 22
40

41
National Passing % 2018
Calc AB: 58%Calc BC: 80%Stat: 61%Comp Sci A: 68%
Red box indicates performance below National average
Course Number of Students
Year 2014-2015 2015-2016 2016-2017 2017-2018
Calculus AB 16 27 29 30
Calculus BC 18 22 19 12
Computer Science 2 10 7
Statistics 10 15 4

42
National Passing % 2018
Bio: 62%Chem: 56%Envir: 48%Physics 1: 41%
Course Number of Students
Year 2014-2015 2015-2016 2016-2017 2017-2018
Biology 15 13 16 33
Chemistry 37 36 26 33
Environmental
39 38 26 30
Physics 13 11

43
National Passing % 2018
Lang: 58%Lit: 47%
Course Number of Students
Year 2014-2015 2015-2016 2016-2017 2017-2018
Language 69 34 72 104
Literature 46 80 21 35

44
National Passing % 2018
French: 77%Spanish: 88%Latin: 66%
Course Number of Students
Year 2014-2015 2015-2016 2016-2017 2017-2018
French 12 8 6 4
Latin 10 14 17 8
Spanish 5 14 23 28

45
National Passing % 2016
2D: 84%Portfolio: 89%
Course Number of Students
Year 2014-2015 2015-2016 2016-2017 2017-2018
2-D Design 1 6 1 2
Drawing Portfolio 2 5 4 10

Executive Summary – AP Exams
• Consideration of how to gain more/deeper data on AP exams & courses to better understand shifts in scores
• Future contemplation of correlation between course experiences and AP test scores
• Departments can utilize data to inform instruction and reflect on past experiences
46

HISTORICAL DATAThe following slides depict examples of the class of 2020 & 2021 as they progressed through the Irvington Schools
47

Grades 3 - 8 Mathematics - Levels 3 & 4
48
2013 & 2014 represent new cut scores and scale scoring for Grades 3-8
Math – Proficient & Advanced
Year Grade 3 Grade 4 Grade 5 Grade 6 Grade 7 Grade 8
2011 76% 90% 91% 93% 96% 90%
2012 85% 87% 94% 88% 90% 95%
2013 61% 66% 62% 68% 60% 68%
2014 67% 76% 75% 73% 71% 61%
2015 63% 73% 76% 73% 64% 62%
2016 81% 69% 72% 82% 73% 55%
2017 77% 80% 71% 76% 75% 56%
2018 82% 76% 82% 71% 74% 59%

Grades 3 - 8 English Language Arts - Levels 3 & 4
49
2013 & 2014 represent new cut scores and scale scoring for Grades 3-8
ELA – Proficient & Advanced
Year Grade 3 Grade 4 Grade 5 Grade 6 Grade 7 Grade 8
2011 82% 90% 79% 83% 81% 79%
2012 86% 84% 88% 77% 78% 80%
2013 55% 74% 62% 74% 50% 56%
2014 63% 64% 67% 60% 63% 57%
2015 52% 68% 63% 66% 59% 76%
2016 78% 66% 63% 68% 73% 75%
2017 66% 74% 64% 69% 82% 73%
2018 73% 69% 73% 76% 75% 68%

Historical View: Class of 2022 Performance Grades 3-8
50

Historical View: Class of 2022 Performance Grades 3-8
51

Historical View: Class of 2022 – ELA Performance
52
This chart follows the performance of the class of 2022 through 5 years – vs a cohort of comparison schools’ 2022 classes

Historical View: Class of 2022 – Math Performance
53
This chart follows the performance of the class of 2022 through 5 years – vs a cohort of comparison schools’ 2022 classes
Critical note: in 2014 IUFSD 8th graders taking Algebra stopped taking the 8th grade NYS test. Thus, the data does not accurately reflect the 8th grade achievement – Not sure if this applies

54
Examining Data - High School Profile

Graduating Class55
2013 2014 2015 2016 2017 2018
Graduates 152 148 130 146 133 127
College-Bound Students
94% 94% 95% 95% 91% 96%
4-Year Colleges 85% 85% 85% 82%
2-Year Colleges 10% 10% 6% 14%

Advanced Placement Results56
2013-14 2014-15 2015-16 2016-17 2017-18
# of Students 260 215 212 202 212
# of Exams 590 525 555 511 582
Score of 3 or Higher 71% 77% 69% 71% 67%
AP Scholars 25 39 43 36 50
National AP Scholars 5 4 6 9 1
AP Scholars with Distinction
23 35 39 30 21
AP Scholars with Honor 26 24 19 13 30
Equity and Excellence 43% 53% 57% 59% 48%

Mean Test Scores57
Class of 2013
Class of 2014
Class of 2015
Class of 2016 Class of 2017
Class of 2018
ACT Composite 25.8 27.1 26 26.7 27.7 26.9
SAT I 2400 1600
Critical Reading 571 606 606 613 619
Math 583 624 608 627 625 620
Writing 573 617 609 608 612
Evidenced Based Reading and Writing
640

58
SAT II Mean Scores Class of 2013 Class of 2014 Class of 2015 Class of 2016 Class of 2017 Class of 2018
Biology-Ecology 661 673 735 713 705 653
Biology-Molecular 668 676 715 707 735 714
Chemistry 714 706 733 741 725 714
Chinese w/Listening 720 780 780
English Literature 580 673 620 653 685 592
French 560 668 665 480
French w/Listening 570
German 770 400
Japanese w/Listening 635 730
Latin 718 616 715 695 690
Math Level I 666 685 674 648 594 626
Math Level II 698 710 717 740 732 688
Physics 675 718 570
Spanish 650 690 642
Spanish w/Listening 590 740
US History 682 690 666 660 657
World History 703 702 717 750 693

ACT Taken Before 201559
Class of 2013
Class of 2014
Class of 2015
Class of 2016 Class of 2017
Class of 2018
ACT Composite 25.8 27.1 26 26.7 27.7 26.9
English 25.9 28.5 31.2
Math 25.8 27.4 28.8
Reading 27.1 28.6 27.3
Science Reasoning 26.5 27.8 29.3

ACT
60
Class of 2013
Class of 2014
Class of 2015
Class of 2016 Class of 2017
Class of 2018
ACT Composite 25.8 27.1 26.7 26.7 27.8 26.9
ELA 22.7 25.4 22.6
English 26.4 27.9 27.5
Math 26.2 27.1 26.0
Reading 27.3 29.0 28.3
Science 26.7 28.1 27.1
STEM 26.7 27.6 26.6
Writing 19.5 21.2 8.1
An average score on the current ACT Writing Exam is a little below a 7. For highly selective colleges, you'll want a score of 8 or higher. Scores of 10, 11, and 12 truly stand out and highlight strong writing skills

Grade Distribution through Junior Year
61
Class of2014
Class of2015
Class of2016
Class of2017
Class of 2018
Class of2019
Mean GPA 3.37 3.35 3.41 3.59
Median GPA 3.49 3.41 3.54 3.75
Range of GPA’s 1.53-4.45 1.82-4.50 1.33-4.51
Number of Students 148 130 158 139 118 137
1st Decile 4.48-4.14 4.41-4.00 4.54-4.20
2nd Decile 4.13-3.95 3.99-3.81 4.19-3.96
3rd Decile 3.94-3.79 3.80-3.66
4th Decile 3.78-3.65 3.65-3.47

62
Examining Data - Middle School ELA

63
6th Grade ELA Standard 2014 2015 2016 2017 2018
RL.6.2Determine a theme or central idea from a text and how it is conveyed through particular details; provide a summary of the text distinct from personal opinions or judgments
69.81% 66.94% 67.94% 85.85% 80.5%
RI.6.2. Determine a central idea of a text and how it is conveyed through particular details; provide a summary of the text distinct from personal opinions or judgments
70.14% 77.50% 78.31% 69.03% 72%
RL.6.3Describe how a particular story’s or drama’s plot unfolds in a series of episodes as well as how the characters respond or change as the plot moves toward a resolution
79.23% 69.53% 82.74% 80.75% 86.4%
RI.6.3Analyze in detail how a key individual, event, or idea is introduced, illustrated, and elaborated in a text (e.g., through examples or anecdotes)
74.91% 68.04% 60.75% 75.24% 64.33%
RL.6.4Determine the meaning of words and phrases as they are used in a text, including figurative and connotative meanings; analyze the impact of a specific word choice on meaning and tone
78.64% 75.00% 79.03% 74.21% 87%
RI.6.4Determine the meaning of words and phrases as they are used in a text, including figurative, connotative, and technical meanings
78.87% 77.08% 62.37% 87.42% 87%
RL.6.5Analyze how a particular sentence, chapter, scene, or stanza fits into the overall structure of a text and contributes to the development of the theme, setting, or plot
78.05% 85.00% 78.43% 84.91% 70%
RI.6.5Analyze how a particular sentence, paragraph, chapter, or section fits into the overall structure of a text and contributes to its development as a whole
76.06% 79.31% 70.32% 77.04% 58%

64
7th Grade ELA Standard 2014 2015 2016 2017 2018
RL.7.2Determine a theme or central idea of a text and analyze its development over the course of the text; provide an objective summary of the text
56.47% 64.84% 79.81% 73.28% 78.4%
RI.7.2Determine two or more central ideas in a text and analyze their development over the course of the text; provide an objective summary of the text
58.28% 72.66% 75.28% 79.10% 69.67%
RL.7.3Analyze how particular elements of a story or drama interact (e.g., how setting shapes the characters or plot) 76.57% 65.74% 66.57% 76.49% 78.86%
RI.7.3Analyze the interactions between individuals, events, and ideas in a text (e.g., how ideas influence individuals or events, or how individuals influence ideas or events)
70.28% 68.49% 75.22% 72.48% 69%
RL.7.4Determine the meaning of words and phrases as they are used in a text, including figurative and connotative meanings; analyze the impact of rhymes and other repetitions of sound (e.g., alliteration) on a specific verse or stanza of a poem or section of a text
67.13% 66.02% 88.33% 69.11% 88.25%
RI.7.4Determine the meaning of words and phrases as they are used in a text, including figurative, connotative, and technical meanings; analyze the impact of a specific word choice on meaning and tone
74.20% 80.21% 92.22% 90.83% 71%
RI.7.5Analyze the structure an author uses to organize a text, including how the major sections contribute to the whole and to the development of ideas
63.23% 73.24% 71.48% 60.55% 80.33%
RL.7.6Analyze how the author develops the points of view of different characters or narrators in a text 71.33% 67.19% 69.72% 72.94% 76%
RI.7.6Determine an author’s point of view or purpose in a text and analyze how the author distinguishes his or her position from that of others
82.75% 81.25% 73.33% 75.00% 78%

65
8th Grade ELA Standard 2014 2015 2016 2017 2018
RL.8.2Determine a theme or central idea of a text and analyze its development over the course of a text, including its relationship to the characters, setting, and plot; provide an objective summary of the text
74.17% 72.28% 74.77% 86.79% 82.8%
RI.8.2Determine a central idea of a text and analyze its development over the course of the text, including its relationship to supporting ideas; provide an objective summary of the text
55.56% 82.44% 85.02% 83.61% 77.5%
RL.8.3Analyze how particular lines of dialogue or incidents in a story or drama propel the action, reveal aspects of a character, or provoke a decision
71.83% 74.96% 86.79% 82.67% 72.5%
RI.8.3Analyze how a text makes connections between individuals, ideas, or events (e.g., through comparisons, analogies, or categories)
78.54% 79.96% 69.19% 69.51% 81%
RL.8.4Determine the meaning of words and phrases as they are used in a text, including figurative and connotative meanings; analyze the impact of specific word choices on meaning and tone, including analogies or allusions to other texts
75.67% 71.12% 85.59% 76.22% 80.5%
RI.8.4Determine the meaning of words and phrases as they are used in a text, including figurative, connotative, and technical meanings; analyze the impact of specific word choices on meaning and tone, including analogies or allusions to other texts
86.67% 79.20% 83.33% 57.93% 88.5%
RI.8.5Analyze in detail the structure of a specific paragraph in a text, including the role of particular sentences in developing and refining a key concept
79.42% 75.19% 81.68% 79.51% 74.25%
RL.8.6Analyze how differences in the points of view of the characters and the audience or reader (e.g., created through the use of dramatic irony) create such effects as suspense or humor
71.35% 81.68% 87.09% 73.17% 64.67%
RI.8.6Determine an author’s point of view or purpose in a text and analyze how the author acknowledges and responds to conflicting evidence or viewpoints
78.75% 78.88% 95.50% 90.85% 69%

Next Generation Learning Standards (ELA)Two new guiding principles:
• “Advanced Literacies” = “A set of skills and competencies that enable communication, spoken and written, in increasingly diverse ways and with increasingly diverse audiences” in order to enable “participation in academic, civic, and professional communities”
• “Lifelong Practices of Readers and Writers,” including the idea that there should be time for students to write and read for enjoyment, expression, and connection with others (in addition to learning)
Timeline:• Full implementation of new standards starting in fall 2020• Revised grade 3-8 ELA assessments will be given during the 2020-2021 school year• No timeline yet for HS assessments but it will not be earlier than the 2020-2021 school year
Key Definitions:• “Text” = printed material, speech, graphics, visual art, digital representations, video, and other visual and audio
depictions of ideas, concepts, and experiences• “Literature” = stories, drama, poetry, fiction, myths, graphic novels, other literary texts• “Informational texts” = nonfiction; biographies; autobiographies; books; articles about science, art, history, social
studies; and information displayed in charts, graphs, or maps, in both print or digital sources
66

Reading Guidelines:• There is no required reading list associated with the standards
• Expectation is that teachers:• Include a balance of contemporary and classic texts• Insure that texts are culturally responsive and that they reflect a diversity of authors, time periods,
genres, and cultural perspectives• Make texts available in students’ home language when possible• Expose students to a balance of literary and informational texts
• Expectation is that students:• Read and interact with grade level texts• Read full-length texts, shorter texts, and excerpts• Have opportunities to read independently and to self-select texts based on interest• Read for multiple purposes (for learning and for pleasure)
67

Some Thoughts:68
• The review of the benchmark analysis was done at each grade level • No clear and substantial areas of need were identified based on deficiencies in that analysis. • However, the work at grade level meetings brought about the desire for subsequent work
around articulation and adjustment of expectations across grade levels tied to specific units of study.
• These shifts are being represented in a variety of ways depending on the nature of the change. In some cases, tasks and assessments have been adjusted to better reflect the growth in sophistication that is expected as students move.• For example, through the process, it became clear that there was a need to engage
students in more authentic writing tasks in grade 8. This led to changes in the AWE for two different units.

69
Examining Data - K-5 Math

2nd Grade Math
70
3.OA.1 Interpret products of whole numbers, e.g., interpret 5 × 7 as the total number of objects in 5 groups of 7 objects each. For example, describe a context in which a total number of objects can be expressed as 5 × 7.
Building Success Rate2015 - 72%2016 - 81%2017 - no questions on the test2018 - 91 %
How:While Grade 2 doesn't have a test, we were not doing well on the basic multiplication standard for grade 3. We think it was because our pacing in grade 2 was not on target to get through Module 6 which is the Foundations of Multiplication and Division module. So a we tightened our pacing so that every class would get through the whole module to develop the idea of area and tiling and rows and columns for arrays.

3rd Grade Math3.NF.2 Represent a fraction 1/b on a number line diagram by defining the interval from 0 to 1 as the whole and partitioning it into b equal parts. Recognize that each part has size 1/b and that the endpoint of the part based at 0 locates the number 1/b on the number line.
Building Success Rate2016 67%2017 58%2018 75%
How:In a learning session we talked about how to partition number lines and what strategies to use with our students. We decided to label 0 as a fraction (0/3 or 0/4) and rename all the one wholes as fractions also (3/3 or 4/4) so that it would be more clear how many equal parts were on the number line and where each fraction should be plotted. Teachers modeled this repeatedly and it became a new expectation for students to label all of their number lines in this way.
71

4th Grade MathMD.5A and B An angle is measured with reference to a circle with its center at the common endpoint of the rays, by considering the fraction of the circular arc between the points where the two rays intersect the circle. An angle that turns through 1/360 of a circle is called a "one-degree angle," and can be used to measure angles. (B) An angle that turns through n one-degree angles is said to have an angle measure of n degrees.
Building Success Rate2015 - 69%2016 - 79%2017 - 94%
How:We decided to go "hands-on" and we made interlocking circles with the students to show the fractional parts. So the students could show 1/4 of a circle and name it as 90 degrees, etc.
72

5th Grade Math 73
5.MD.1 Convert among different-sized standard measurement units within a given measurement system and use these conversions in solving multi-step, real world problems.
Last year we changed the way we teach conversions and when we teach conversions based on data analysis
Building Success Rate2016 - 58% 2017 - 56%2018 - 78%
How:In summer work, we pulled all the conversions lessons spread out over 5 modules and we created a 7-day mini-conversion module to really focus on what it means to convert, how to figure out the conversion factor, and to allow for repeated practice in a more concentrated time frame.

Summary Notes
• Again, test data gives the District a window into how students perform on a specific test on a specific date(s)
• Information can be useful, but is also limited due to numerous factors such as the consistent changes in testing models, shifts in cut scores, and alterations in state curriculum standards
• District remains committed to developing a local assessment program that is largely performance-based and seeks to have students demonstrate deep thinking skills and complex application of skills and knowledge
74

Final Thoughts
• Continue to develop and expand local common assessments
• Evolution towards more ‘authentic’ assessment of student learning• Project-based learning/assessment • Capstone Projects
• Data will continue to be viewed as one aspect of measuring student achievement
• District to expand data use• Summer-based professional learning for key instructional leaders• Targeted data objectives for 2019-20
75

Discussion
76