Embed Size (px)
Citation preview
10
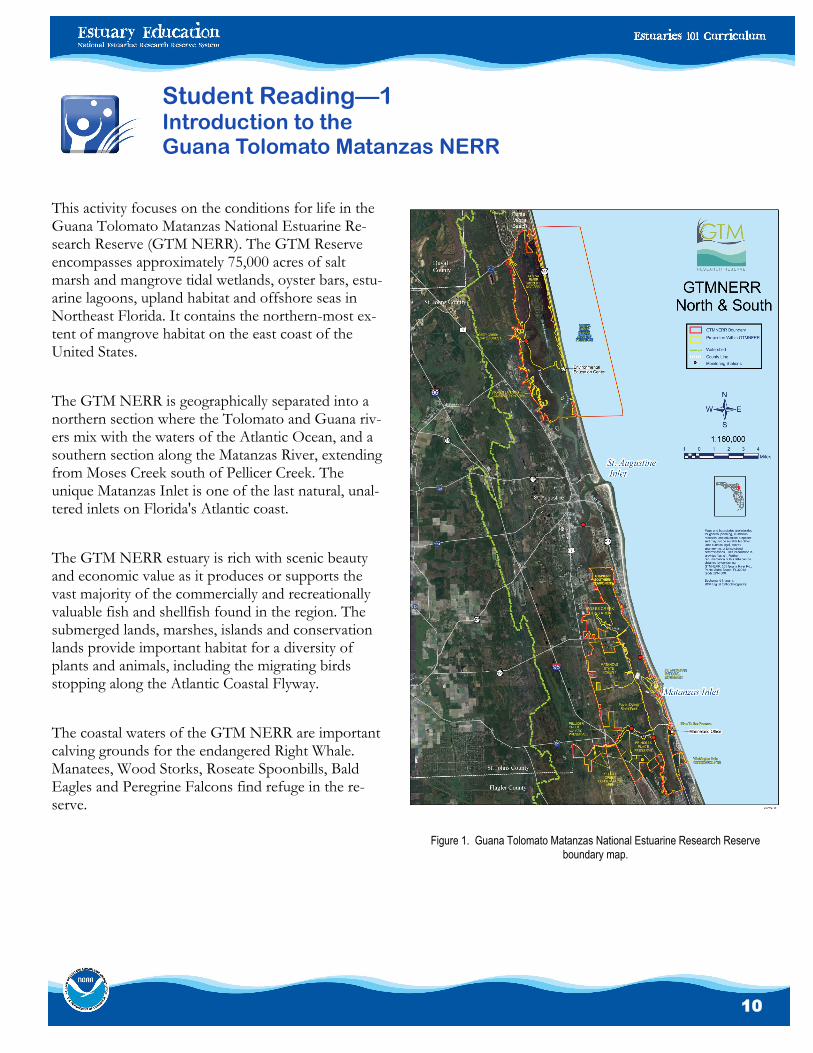
This activity focuses on the conditions for life in the Guana Tolomato Matanzas National Estuarine Re-search Reserve (GTM NERR). The GTM Reserve encompasses approximately 75,000 acres of salt marsh and mangrove tidal wetlands, oyster bars, estu-arine lagoons, upland habitat and offshore seas in Northeast Florida. It contains the northern-most ex-tent of mangrove habitat on the east coast of the United States.
The GTM NERR is geographically separated into a northern section where the Tolomato and Guana riv-ers mix with the waters of the Atlantic Ocean, and a southern section along the Matanzas River, extending from Moses Creek south of Pellicer Creek. The unique Matanzas Inlet is one of the last natural, unal-tered inlets on Florida's Atlantic coast.
The GTM NERR estuary is rich with scenic beauty and economic value as it produces or supports the vast majority of the commercially and recreationally valuable fish and shellfish found in the region. The submerged lands, marshes, islands and conservation lands provide important habitat for a diversity of plants and animals, including the migrating birds stopping along the Atlantic Coastal Flyway.
The coastal waters of the GTM NERR are important calving grounds for the endangered Right Whale. Manatees, Wood Storks, Roseate Spoonbills, Bald Eagles and Peregrine Falcons find refuge in the re-serve.
Student Reading—1 Introduction to the Guana Tolomato Matanzas NERR
Figure 1. Guana Tolomato Matanzas National Estuarine Research Reserve boundary map.
11
Student Reading—2 Nutrients in an Estuary
Nutrients in the Estuary
Of all the essential nutrients for life in an estuary, nitro-gen and phosphorus are the two that most often limit the growth of primary producers in an estuary. Nitrogen is a key component in:
1) chlorophyll, the green pigment in primary producersthat absorbs sunlight during photosynthesis,
2) amino acids, the building blocks of proteins, and
3) genetic material, including deoxyribonucleic acid(DNA) and ribonucleic acid (RNA).
Nitrogen ranks as the fourth most abundant chemical element in living tissue, behind oxygen, carbon, and hy-drogen. Phosphorus is also a key component in DNA, and it is found in adenosine triphosphate (ATP), a mole-cule that is important in energy transfer and storage in living cells.
Natural sources of nitrogen include nutrients from rock weathering and animal waste entering the estuary from: stream flows; enriched, deep ocean water brought in by tides and upwelling; guano (waste) from birds; dead or-ganisms in the water; and nitrogen gas in the atmos-phere. Air contains nitrogen gas (N2), but most organ-isms can’t use it in this form. Aquatic life in estuaries needs to obtain nitrogen in forms they can use, or nitro-gen that is “fixed.” These forms are compounds such as nitrite (NO2), nitrate (NO3), ammonia (NH3), and am-monium (NO4). Animals get their nitrogen from feeding on plants or on other animals that have fed on plants.
Eutrophication and Algal Blooms
An overload of nutrients is called eutrophication (Greek for “good-nutrition”). Eutrophication, the over-enrichment of nutrients, can be harmful to estuaries. Over-enrichment often causes “algal blooms” in estuar-ies. The influx nutrients cause excessive growth of algae that results in the water becoming cloudy, thus reducing the amount of sunlight that plants can use to photosyn-
thesize. Large algal mats floating on the surface can block much of the light that underwater plants such as sea grasses need to survive. Disturbances to sea grass communities can in turn be harmful to other organisms like fish and crabs that depend on the grasses for food, shelter, and nursery areas. When algae dies, it sinks to the bottom where bacteria in the sediments decompose it. This process removes oxygen from the water. As bac-teria decompose more algae, more oxygen is consumed. If too much oxygen is removed from deep waters, small organisms die endangering all forms of life in the estu-ary.
Algae blooms can disrupt food webs, damage estuarine habitats, and deplete oxygen to the extent that organ-isms die or move out. The conditions created by these blooms may encourage only species that can tolerate eutrophic conditions (e.g., blue-green algae). In addition, the appearance of the cloudy water and decaying algae mats, unpleasant odors, and loss of estuarine species can diminish the recreational value of estuaries.
Algal blooms may result from natural conditions, but they are also linked to excess nutrients that come from human activities. Excess nutrients may come from septic tanks, wastewater treatment plants, point source dis-charges from sewage and industry, exhaust from cars, emissions from industry, fertilizers from lawns, golf courses, and farms and animal waste (especially live-stock). Sources of nitrogen that do not enter estuaries directly are transported to estuaries by stream flows, rain, leaching, groundwater, and storm water.
Algal bloom can be detected by measurements of chlo-rophyll-a. Chlorophyll-a is a pigment in algae that is in-volved in photosynthesis. Concentrations of chlorophyll-a are measures of algae abundance (the more chloro-phyll-a, the more algae). Concentrations measured are measured in units of micrograms per liter (µg/L).
12
When water has low levels of oxygen the condition is called hypoxia. In estuaries, lakes, and coastal waters, low oxygen usually means a concentration of less than 2 parts per million. Anoxia refers to water that has been completely depleted of oxygen. Anoxic conditions may force crabs and other bottom-dwelling organisms to even come up on land to escape oxygen starvation. These events are called “jubilees.” Large areas of estuar-ies where organisms have died off or vacated for lack of sufficient oxygen are called dead zones. Some estuaries experience dead zones regularly.
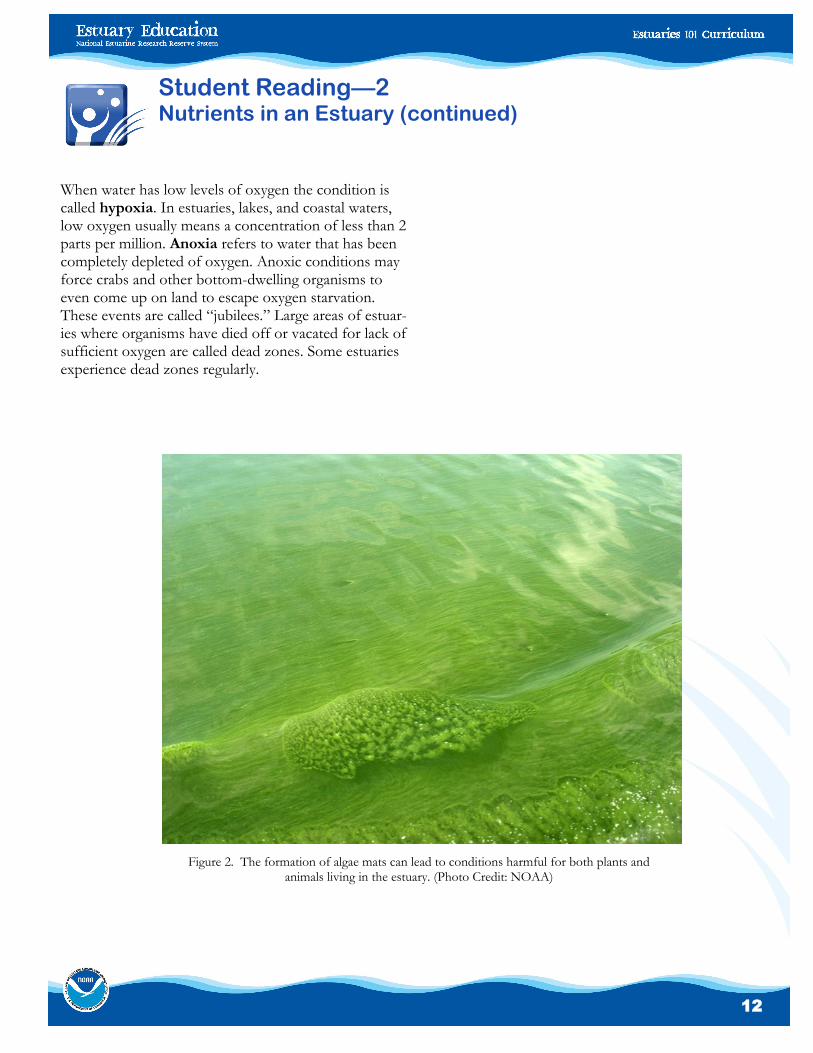
Figure 2. The formation of algae mats can lead to conditions harmful for both plants and animals living in the estuary. (Photo Credit: NOAA)
Student Reading—2 Nutrients in an Estuary (continued)
13
Student Worksheet Nutrients in an Estuary
Student Name __________________________________________________________________
Part 1: Nutrients in an Estuary
In this part of the activity, you will produce models of estuaries that have an increasing amount of nutrient added to them in order to address the following question: What effects does increasing the amount of nutrients in an estuary have on plant growth, on the amount of dissolved oxygen, and on other water quality factors that impact life in an estuary?
Your model will consist of a series of 600 ml beakers containing water samples with algae. You will add nutrients, in the form of commercial fertilizer, to each beaker and then monitor the samples once a week, measuring the water quality parameters and describing the algae growth.
Instructions
Put on your goggles! It is very important that you wear them when adding fertilizer to the beakers.
Label one beaker: No added nutrients. Also include details about the nature of the water sample (e.g. fresh water or salt water) on the labels.
Label another beaker: 1 teaspoon nutrients. Add 1 tsp of fertilizer to this beaker and stir until the fertilizer is dissolved.
Repeat for additional beakers with 2, 3, 4, and 5 teaspoons of nutrients in each.
Place the beakers on a counter situated so all the beakers receive about the same amount of sunlight per day.
Record information on the contents of each beaker, using this technique to see inside:
Stand with your back to a light source so it is shining over your shoulder and through the beaker.
Place a white piece of paper behind the beaker (on the opposite side of the light source).
Describe and/or draw any algae you can see in the beaker. (You may not see any algae, especially at the begin-ning. If that’s the case, record, “No algae visible.”)
Take digital images of all six beakers and note the time and date you took the pictures.
14
Page 2 of 6 Making Predictions
1a. How do you think the amount of fertilizer will affect the amount of algae in each of the samples?
1b. How do you think the algal growth will differ between the fresh and salt-water samples?
1c. How is this experiment different from conditions in an actual estuary that receives excess nutrients?
Tracking the Models Over Time
Examine the contents of your beakers, using the technique from the instructions above, and record your observa-tions every two or three days over a period of three weeks. Also, take a digital image every two or three days. At the end of three weeks, display all images and observe the changes in your model estuaries.
1d. How did the amount of fertilizer affect the amount of algae in each of the samples?
1e. How did the algal growth differ between the fresh and salt water samples?
15
Page 3 of 6
1f. Explain using the process of photosynthesis how the level of dissolved oxygen varies with increasing amounts of living algae.
1g. Explain using the process of decomposition how the level of dissolved oxygen would vary in the beakers as the algae die and settled to the bottom.
Part 2 — Using Data to Study Eutrophication and Conditions in an Estuary
In this part of the activity, you will investigate how nutrients affect of algal blooms on water quality at various sta-tions within the GTM NERR site. Using the graphs and chart on the Student Data Sheet—GTM 2002-3 Nutrient Data, answer the following questions.
2a. Compare 16-month nitrogen and chlorophyll-a values for each site. During which seasons do peak values seem to occur at most sites? Why do you think so?
2b. Do you see a clear pattern that shows a relationship between TN and chlorophyll-a?
2c. Which three sites seem to show the strongest correlation between TN chlorophyll-a?
2d. What other factors do you think determine whether or not nutrient input will cause algal blooms?
16
Page 4 of 6
2e. If the chlorophyll-a threshold for an algal bloom is 20 ug/L, which sites may have experienced algal blooms during the period of observation?
2f. Looking at the chart, what conclusion can you make about the influences of nutrient loading and residence time on chlorophyll-a concentrations?
Part 3—Eutrophication and the Nitrogen Cycle
In order for organisms to survive in an estuary, a constant source of nutrients must be present for them to consume. But as you have seen, too many nutrients flowing into an estuary can lead to anoxic conditions and even massive die-offs of animal and plant species. In this part of the activity, you will be asked to review your work and examine the effect of nutrients on other abiotic factors that ultimately determine the welfare of species in the estuary.
To summarize your investigations about nutrients in an estuary, view the series of animations at: http://coseenow.net/blog/2008/11/eutrophication-animation
3a. Where does most of the nitrogen that flows into an estuary come from?
3b. What is the relationship between microbial activity during algal decomposition and DO levels in an estuary?
17
Page 5 of 6
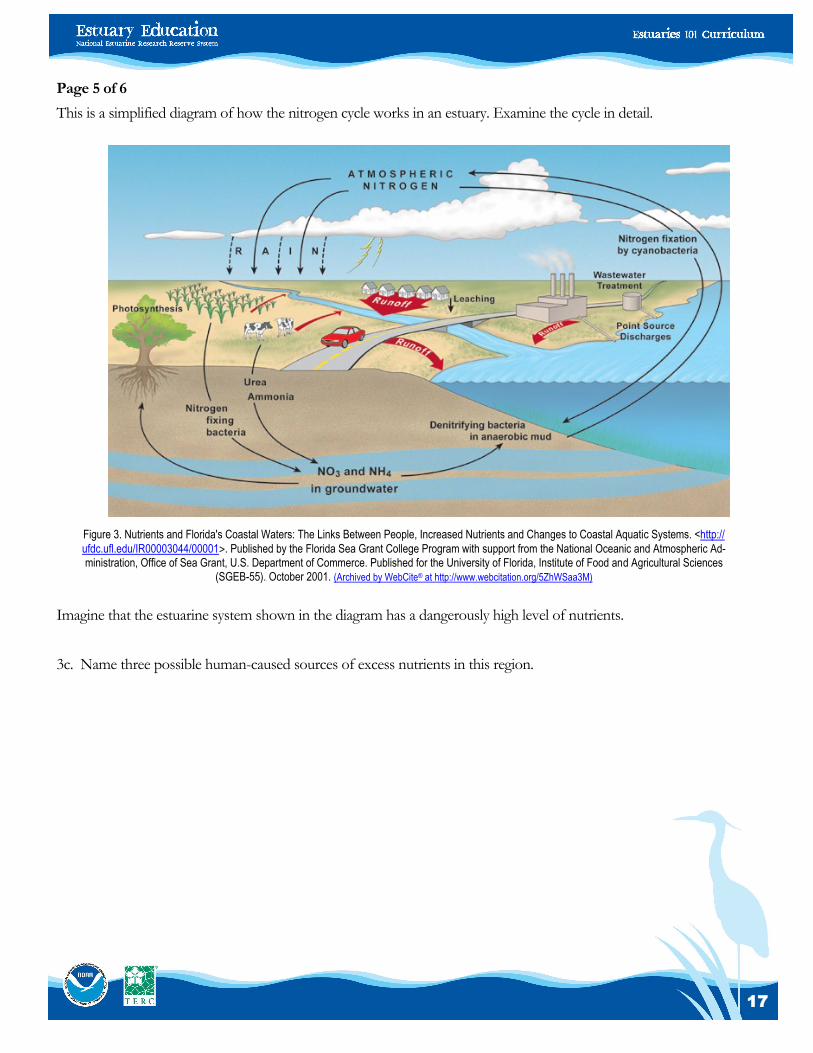
This is a simplified diagram of how the nitrogen cycle works in an estuary. Examine the cycle in detail.
Imagine that the estuarine system shown in the diagram has a dangerously high level of nutrients.
3c. Name three possible human-caused sources of excess nutrients in this region.
Figure 3. Nutrients and Florida's Coastal Waters: The Links Between People, Increased Nutrients and Changes to Coastal Aquatic Systems. <http://
ufdc.ufl.edu/IR00003044/00001>. Published by the Florida Sea Grant College Program with support from the National Oceanic and Atmospheric Ad-
ministration, Office of Sea Grant, U.S. Department of Commerce. Published for the University of Florida, Institute of Food and Agricultural Sciences (SGEB-55). October 2001. (Archived by WebCite® at http://www.webcitation.org/5ZhWSaa3M)
18
Page 6 of 6
3d. What do you think the effect of a heavy rainfall event in this region would have on the:
• level of nutrients in the estuary?
• level of dissolved oxygen in the estuary?
• development of seagrass and other aquatic plants?
• population of aquatic organisms such as clams, crabs, and snails?
Assessment
3e. As a summary assessment, write a short letter to the town council of this region outlining your recommenda-tions about steps to take to reduce the amount of nutrient flow into the estuary.
19
Student Data Sheet GTM NERR 2002-3 Nutrient Data
Page 1 of 4
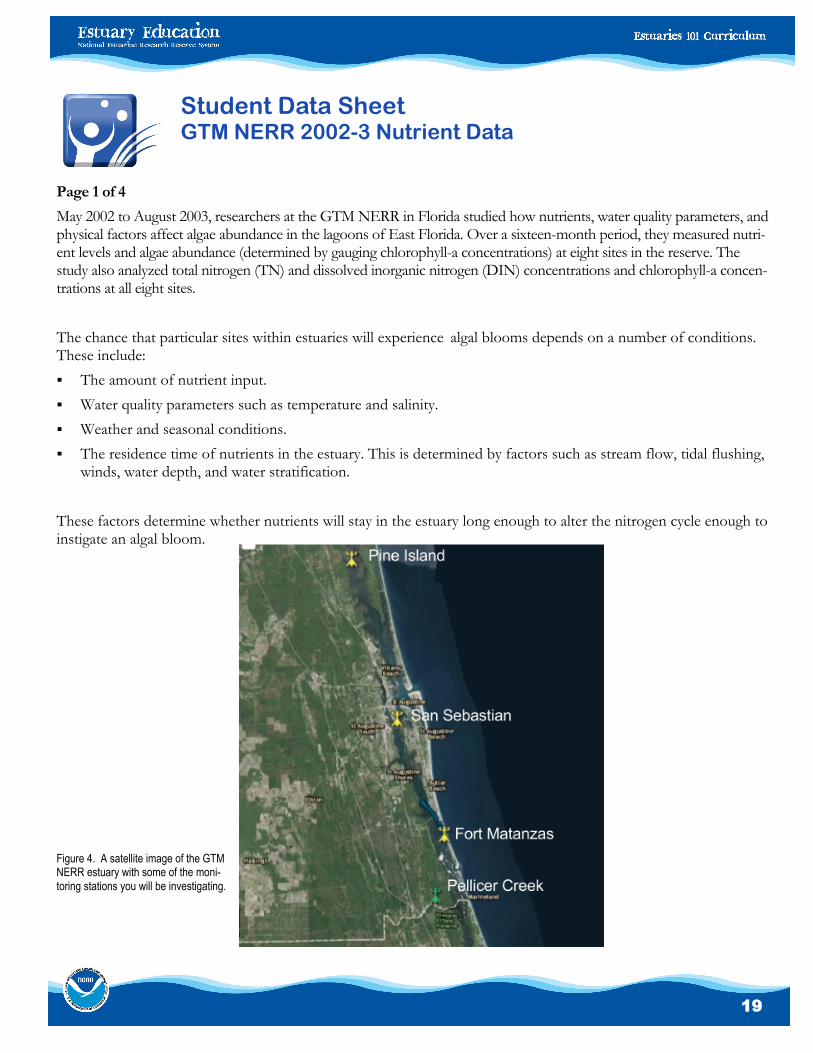
May 2002 to August 2003, researchers at the GTM NERR in Florida studied how nutrients, water quality parameters, and physical factors affect algae abundance in the lagoons of East Florida. Over a sixteen-month period, they measured nutri-ent levels and algae abundance (determined by gauging chlorophyll-a concentrations) at eight sites in the reserve. The study also analyzed total nitrogen (TN) and dissolved inorganic nitrogen (DIN) concentrations and chlorophyll-a concen-trations at all eight sites.
The chance that particular sites within estuaries will experience algal blooms depends on a number of conditions. These include:
The amount of nutrient input.
Water quality parameters such as temperature and salinity.
Weather and seasonal conditions.
The residence time of nutrients in the estuary. This is determined by factors such as stream flow, tidal flushing,winds, water depth, and water stratification.
These factors determine whether nutrients will stay in the estuary long enough to alter the nitrogen cycle enough to instigate an algal bloom.
Figure 4. A satellite image of the GTM NERR estuary with some of the moni-toring stations you will be investigating.
20
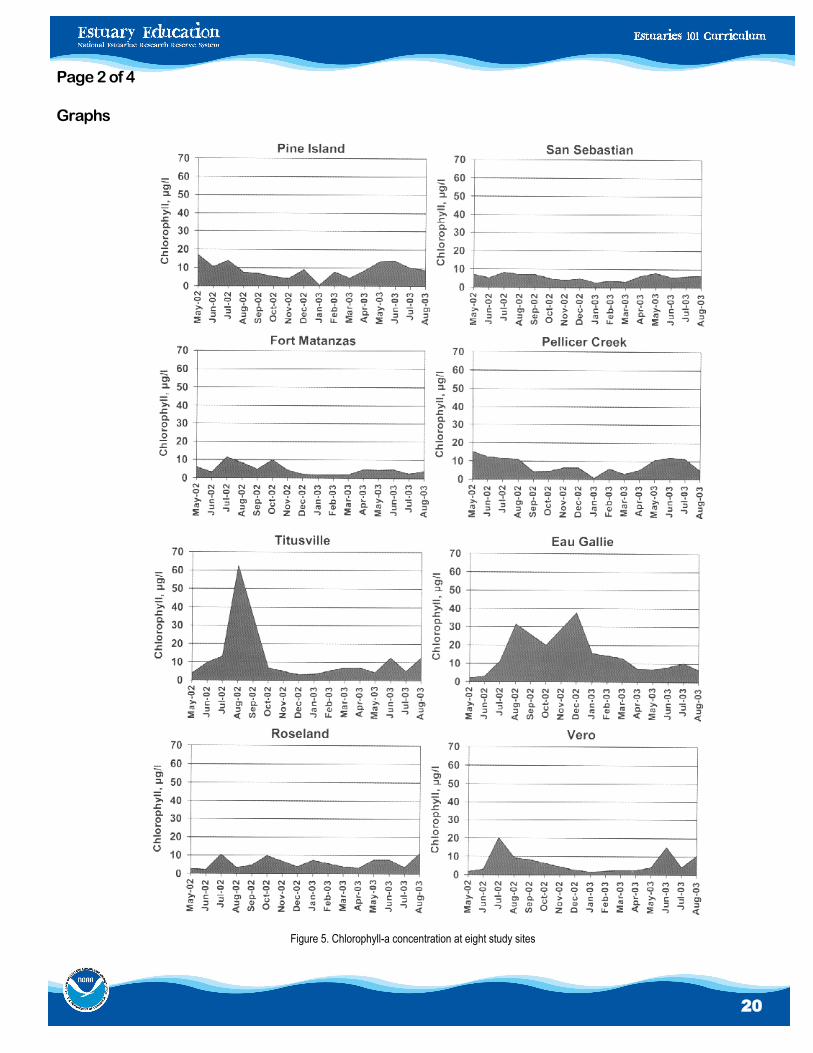
Figure 5. Chlorophyll-a concentration at eight study sites
Page 2 of 4
Graphs
21
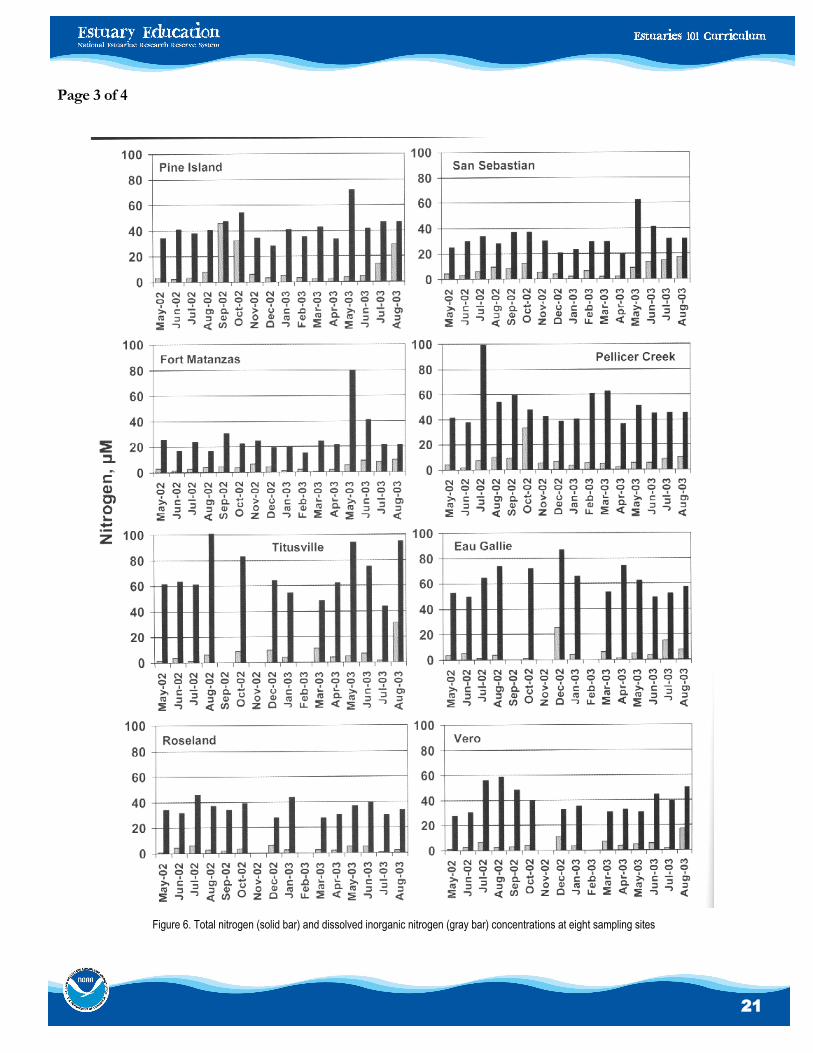
Figure 6. Total nitrogen (solid bar) and dissolved inorganic nitrogen (gray bar) concentrations at eight sampling sites
Page 3 of 4
22
Page 4 of 4
Chart
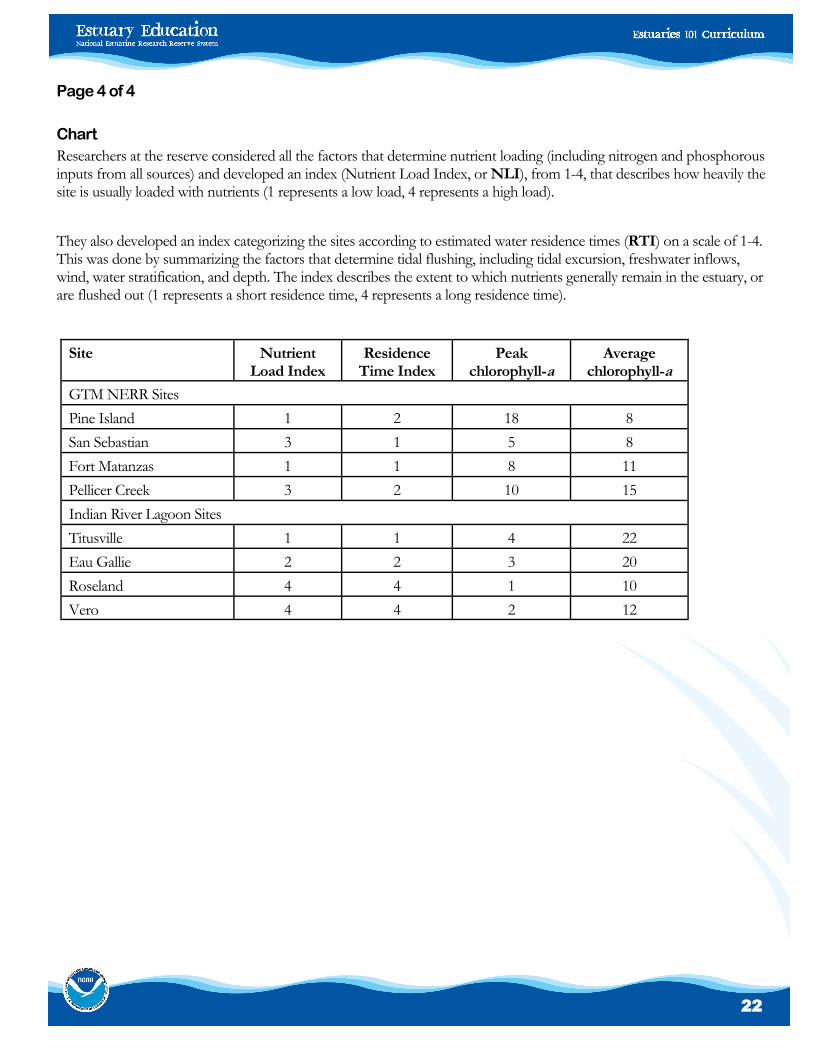
Researchers at the reserve considered all the factors that determine nutrient loading (including nitrogen and phosphorous inputs from all sources) and developed an index (Nutrient Load Index, or NLI), from 1-4, that describes how heavily the site is usually loaded with nutrients (1 represents a low load, 4 represents a high load).
They also developed an index categorizing the sites according to estimated water residence times (RTI) on a scale of 1-4. This was done by summarizing the factors that determine tidal flushing, including tidal excursion, freshwater inflows, wind, water stratification, and depth. The index describes the extent to which nutrients generally remain in the estuary, or are flushed out (1 represents a short residence time, 4 represents a long residence time).
Site Nutrient Load Index
Residence Time Index
Peak chlorophyll-a
Average chlorophyll-a
GTM NERR Sites
Pine Island 1 2 18 8
San Sebastian 3 1 5 8
Fort Matanzas 1 1 8 11
Pellicer Creek 3 2 10 15
Indian River Lagoon Sites
Titusville 1 1 4 22
Eau Gallie 2 2 3 20
Roseland 4 4 1 10
Vero 4 4 2 12