Embed Size (px)
Citation preview
1 | 2018 S M C S c o r e c a r d October 2018
Student Success Scorecard: An Accountability Framework for the California Community Colleges
An Analysis of Santa Monica College’s Performance on the 2018 Scorecard
In September of 2012, Governor Jerry Brown signed into law the Student Success Act of 2012, a
legislative bill aimed to improve educational outcomes for California Community College students, to
close the equity gap for historically underrepresented students, and to better prepare the workforce to
meet the changing landscape of the state’s economy. The Senate Bill was the product of the work done
by the California Community Colleges Board of Governors Student Success Task Force (SSTF), who
developed a comprehensive set of recommendations aimed to increase student success.
One of the recommendations directs the California Community College Chancellor’s Office (CCCCO)
and community colleges to design and implement a clearer and more focused accountability system
measuring performance on key student success indicators. The purpose of the recommendation was to
ensure that student success metrics were being presented in a clear and concise manner, and to make
equity gaps more transparent.
In April 2013, the CCCCO unveiled the statewide and college-level Student Success Scorecard. The
scorecard built on the existing accountability reporting system, the Accountability Reporting for the
Community Colleges (ARCC). The current report provides an analysis of Santa Monica College’s
performance on the scorecard metrics, including a description of the methodologies used to calculate the
metrics, a five-year trend analyses, and a comparison of student subgroups.
The scorecard system is intended to expand the populations being measured. However, one major
limitation of the scorecard methodology is the exclusion of students without valid social security numbers
(SSNs). This excludes many International students and AB540 students. In the fall of 2017 11.9% of
students enrolled in credit courses did not report a valid SSN. Because the scorecard excludes students
without valid SSNs in the dataset, the metrics do not provide a completely accurate picture of Santa
Monica College’s performance on the student success metrics, and the college’s performance on the
scorecard should be interpreted with care.
The scorecard metrics align with the college’s Institutional Effectiveness (IE) Report. Six of the eight scorecard metric categories are addressed in some way in the IE report (completion, persistence, remedial, and CTE completion). The college’s scorecard data are reported separately from the college’s annual discussion of institutional effectiveness as the legislation for the scorecard requires that a college’s local Board of Trustees annually review the college’s scorecard. No action is required by the Board; this narrative fulfills this legislative requirement. The scorecard, when paired with the more comprehensive IE report, is intended to stimulate dialogue about local trends, SMC students, educational practice and programs among various campus constituents. SMC’s performance on scorecard is best understood within the context of local conditions. Therefore, the scorecard is only the starting point in assessing college performance related to student learning and achievement.
2 | 2018 S M C S c o r e c a r d October 2018
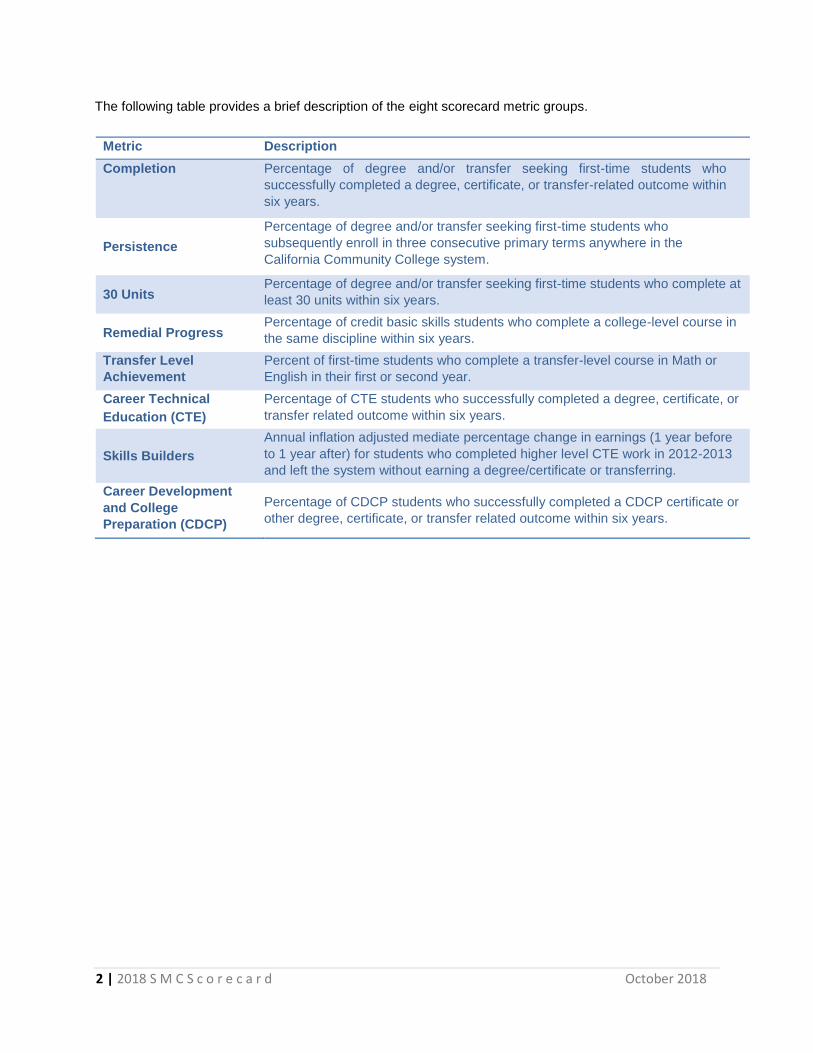
The following table provides a brief description of the eight scorecard metric groups.
Metric Description
Completion
Percentage of degree and/or transfer seeking first-time students who
successfully completed a degree, certificate, or transfer-related outcome within
six years.
Persistence
Percentage of degree and/or transfer seeking first-time students who
subsequently enroll in three consecutive primary terms anywhere in the
California Community College system.
30 Units Percentage of degree and/or transfer seeking first-time students who complete at
least 30 units within six years.
Remedial Progress Percentage of credit basic skills students who complete a college-level course in
the same discipline within six years.
Transfer Level
Achievement
Percent of first-time students who complete a transfer-level course in Math or
English in their first or second year.
Career Technical
Education (CTE)
Percentage of CTE students who successfully completed a degree, certificate, or
transfer related outcome within six years.
Skills Builders
Annual inflation adjusted mediate percentage change in earnings (1 year before
to 1 year after) for students who completed higher level CTE work in 2012-2013
and left the system without earning a degree/certificate or transferring.
Career Development
and College
Preparation (CDCP)
Percentage of CDCP students who successfully completed a CDCP certificate or
other degree, certificate, or transfer related outcome within six years.
3 | 2018 S M C S c o r e c a r d October 2018
Scorecard Summary
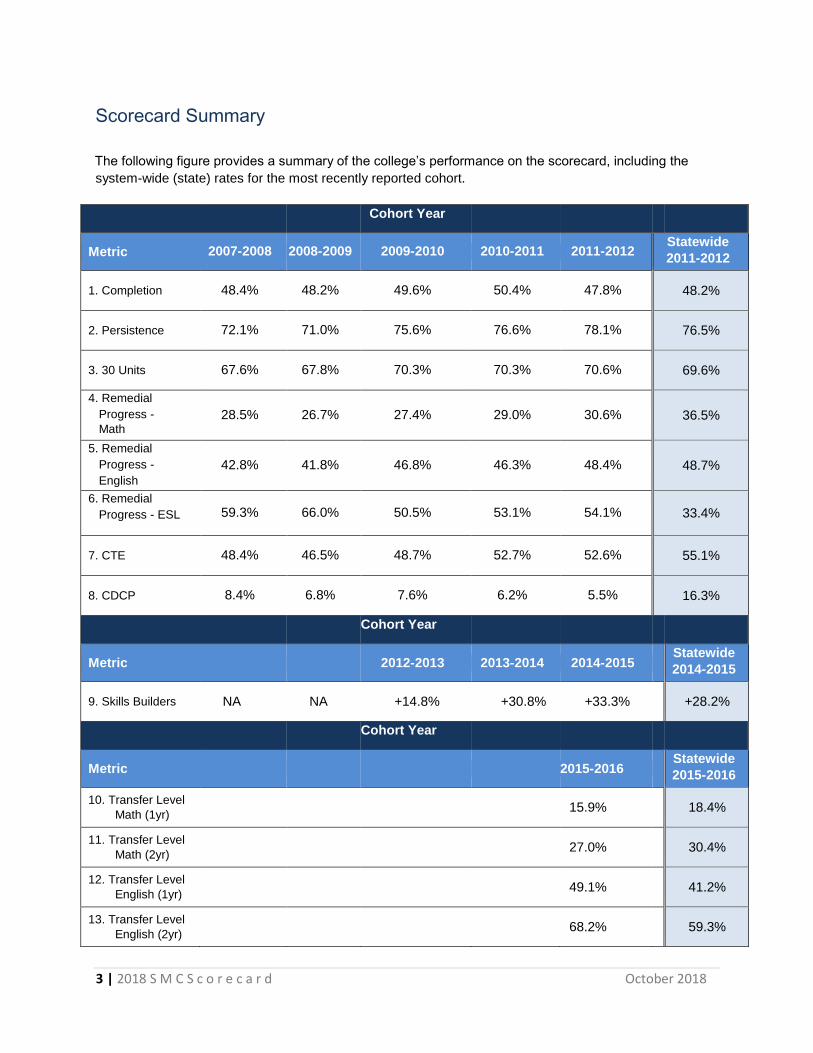
The following figure provides a summary of the college’s performance on the scorecard, including the
system-wide (state) rates for the most recently reported cohort.
Cohort Year
Metric 2007-2008 2008-2009 2009-2010 2010-2011 2011-2012 Statewide
2011-2012
1. Completion 48.4% 48.2% 49.6% 50.4% 47.8% 48.2%
2. Persistence 72.1% 71.0% 75.6% 76.6% 78.1% 76.5%
3. 30 Units 67.6% 67.8% 70.3% 70.3% 70.6% 69.6%
4. Remedial
Progress -
Math 28.5% 26.7% 27.4% 29.0% 30.6% 36.5%
5. Remedial
Progress -
English 42.8% 41.8% 46.8% 46.3% 48.4% 48.7%
6. Remedial
Progress - ESL 59.3% 66.0% 50.5% 53.1% 54.1% 33.4%
7. CTE 48.4% 46.5% 48.7% 52.7% 52.6% 55.1%
8. CDCP 8.4% 6.8% 7.6% 6.2% 5.5% 16.3%
Cohort Year
Metric 2012-2013 2013-2014 2014-2015 Statewide
2014-2015
9. Skills Builders NA NA +14.8% +30.8% +33.3% +28.2%
Cohort Year
Metric 2015-2016 Statewide
2015-2016
10. Transfer Level
Math (1yr) 15.9% 18.4%
11. Transfer Level
Math (2yr) 27.0% 30.4%
12. Transfer Level
English (1yr) 49.1% 41.2%
13. Transfer Level
English (2yr) 68.2% 59.3%
4 | 2018 S M C S c o r e c a r d October 2018
The following trends in scorecard performance are observed:
• The College demonstrated improvement in five of nine previously existing metrics, including
persistence, 30 units, remedial English, remedial math, remedial ESL, in 2011-2012 (when
compared to the prior year’s performance) this is down from seven of eight in 2016;
• Over the past five years, the rate of students completing remedial ESL decreased by 11%;
• The median percentage change in wages for students who completed higher level CTE work in
2014-2015 and left the system without earning a degree/certificate or transferring was +33.3%;
• The College outperformed the state average at Persistence, 30 Units, remedial ESL, Transfer
Level English (1yr), and Transfer Level English (2yr).
• The College trailed the state average at Completion, remedial math, remedial English, CTE,
career development and college preparation, Transfer Level English (1yr), and Transfer Level
English (2yr) in for the most recent years on file.
• The college’s transfer level completion rates for math were 2.5% below the state average after
one year and 3.4% below the state average after year two years.
• The college’s transfer level completion rates for English were 7.1% above the state average
after one year and 8.9% above the state average after two years.
5 | 2018 S M C S c o r e c a r d October 2018
Completion Rate
Completion (also known as the Student Progress and Attainment) rate describes the percentage of
degree and/or transfer seeking first-time students who successfully completed a degree, certificate, or
transfer related outcome within six years.
Denominator (Cohort):
SMC students who met the following criteria were included in the cohort:
• First-time college student at SMC;
• Reported a valid SSN;
• Earned six or more credit units at SMC and/or anywhere in the system during the first three
years of enrollment; and,
• Attempted any credit math or English course in the first three years of enrollment.
Numerator (Outcome):
Students in the cohort who met the following criteria within six years of entering the CCC system for the
first time were counted as having “completed”:
• Earned an Associate of Arts or Science degree at any CCC (California Community College);
• Earned a Chancellor’s Office approved Certificate of Achievement at any CCC;
• Transferred to a four-year institution; and/or,
• Completed 60 or more UC/CSU transferable units with a GPA of 2.0 or higher anywhere in the
CCC system.
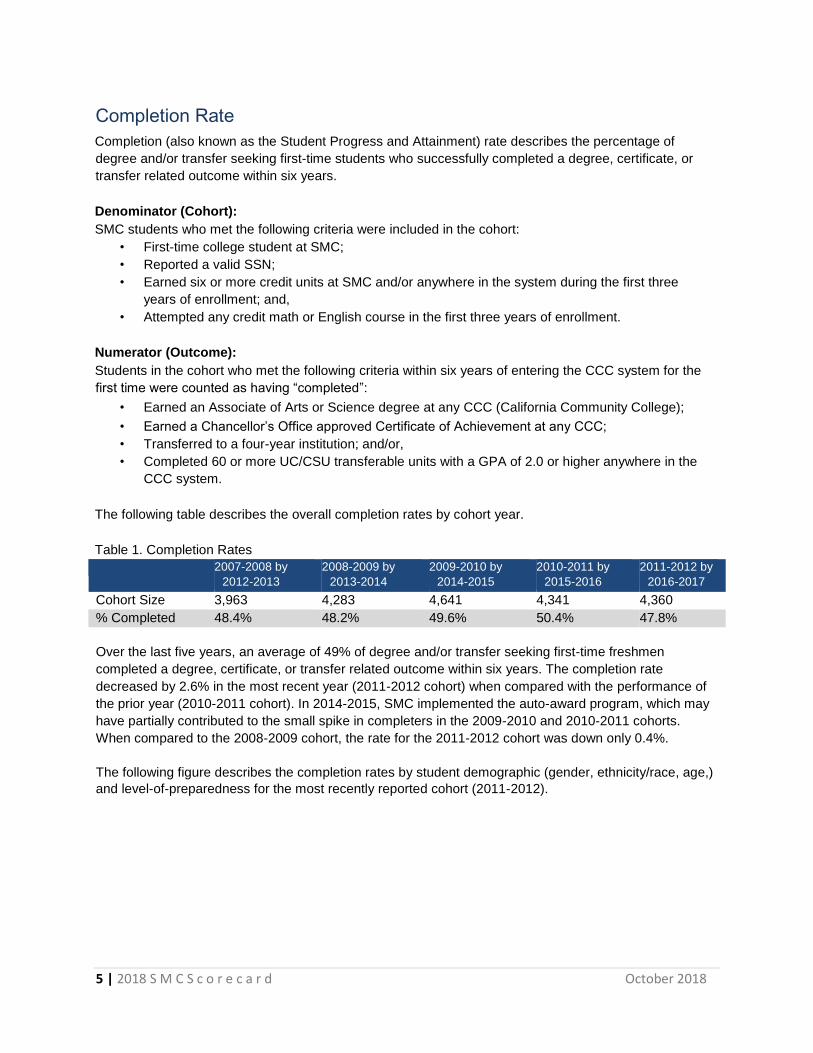
The following table describes the overall completion rates by cohort year.
Table 1. Completion Rates
2007-2008 by
2012-2013 2008-2009 by
2013-2014 2009-2010 by
2014-2015 2010-2011 by
2015-2016 2011-2012 by
2016-2017
Cohort Size 3,963 4,283 4,641 4,341 4,360
% Completed 48.4% 48.2% 49.6% 50.4% 47.8%
Over the last five years, an average of 49% of degree and/or transfer seeking first-time freshmen
completed a degree, certificate, or transfer related outcome within six years. The completion rate
decreased by 2.6% in the most recent year (2011-2012 cohort) when compared with the performance of
the prior year (2010-2011 cohort). In 2014-2015, SMC implemented the auto-award program, which may
have partially contributed to the small spike in completers in the 2009-2010 and 2010-2011 cohorts.
When compared to the 2008-2009 cohort, the rate for the 2011-2012 cohort was down only 0.4%.
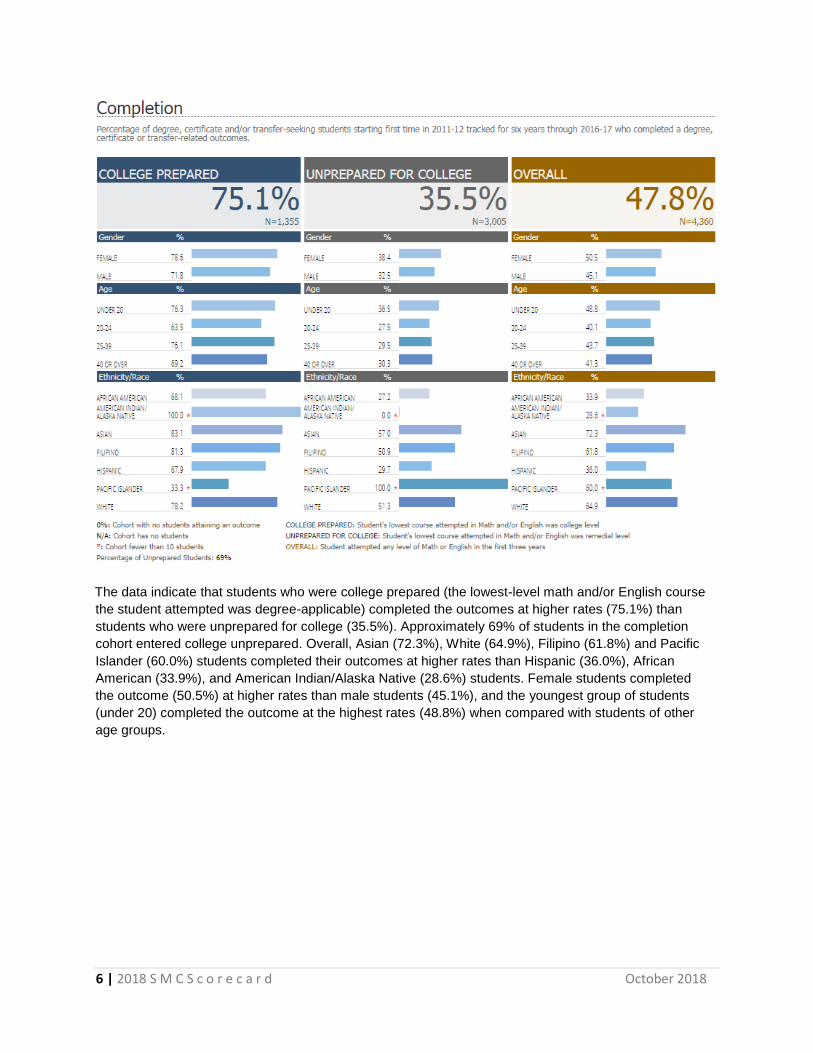
The following figure describes the completion rates by student demographic (gender, ethnicity/race, age,)
and level-of-preparedness for the most recently reported cohort (2011-2012).
6 | 2018 S M C S c o r e c a r d October 2018
The data indicate that students who were college prepared (the lowest-level math and/or English course
the student attempted was degree-applicable) completed the outcomes at higher rates (75.1%) than
students who were unprepared for college (35.5%). Approximately 69% of students in the completion
cohort entered college unprepared. Overall, Asian (72.3%), White (64.9%), Filipino (61.8%) and Pacific
Islander (60.0%) students completed their outcomes at higher rates than Hispanic (36.0%), African
American (33.9%), and American Indian/Alaska Native (28.6%) students. Female students completed
the outcome (50.5%) at higher rates than male students (45.1%), and the youngest group of students
(under 20) completed the outcome at the highest rates (48.8%) when compared with students of other
age groups.
7 | 2018 S M C S c o r e c a r d October 2018
Persistence Rate
Persistence rate describes the percentage of degree and/or transfer seeking first-time students who
enrolled in the first three consecutive terms. This metric is considered a milestone or momentum point.
Research indicates that students who stay enrolled in college are more likely to succeed.
Denominator (Cohort):
SMC students who met the following criteria were included in the cohort:
• First-time college student at SMC;
• Reported a valid SSN;
• Earned six or more credit units at SMC and/or anywhere in the system during the first three
years of enrollment; and,
• Attempted any credit math or English course in the first three years of enrollment.
Numerator (Outcome):
Students in the cohort who met the following criteria within six years of entering the CCC system for the
first time were counted as having “persisted”:
• Enrolled in a credit course in the first subsequent three primary semesters three (spring and fall
terms only). For example, a student who was a degree and/or transfer seeking first-time student in
fall of 2007, and subsequently was enrolled in a credit course in spring of 2008, fall of 2008, and
spring of 2009, was counted has having “persisted”; or,
• Completed any of the following within the first subsequent three primary semesters:
o Earned an Associate of Arts or Science degree at any CCC (California Community
College);
o Earned a Chancellor’s Office approved Certificate of Achievement at any CCC; and/or,
o Transferred to a four-year institution.
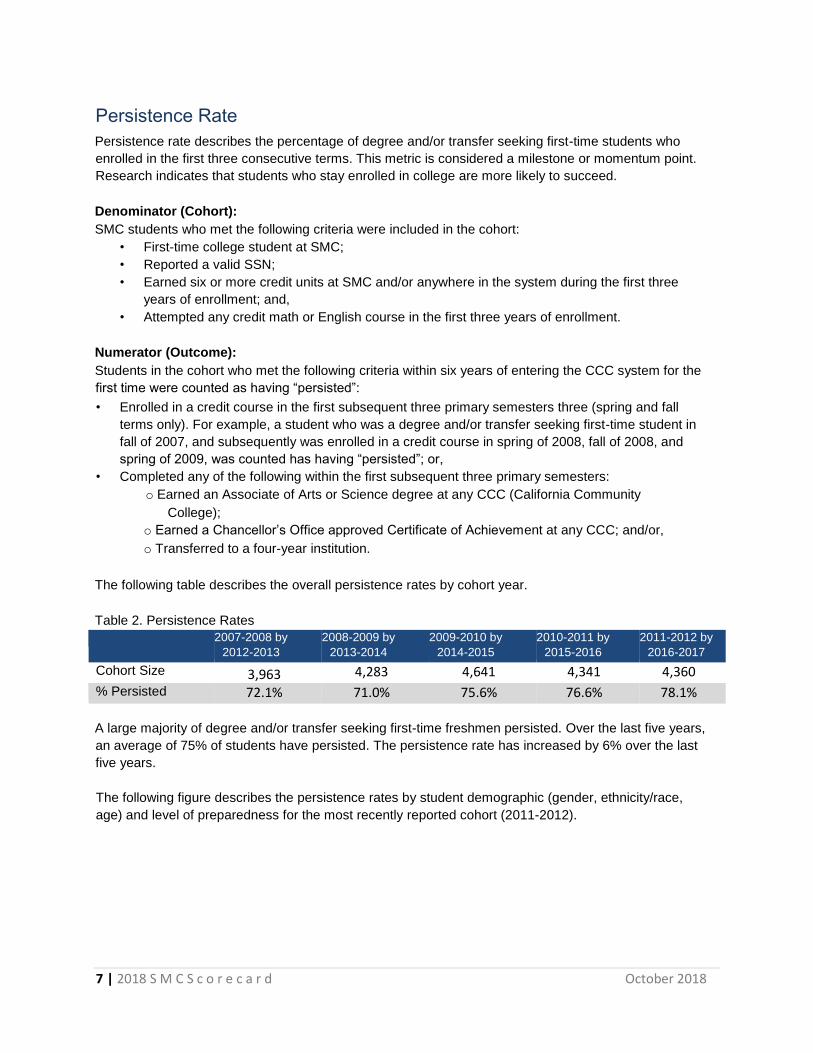
The following table describes the overall persistence rates by cohort year.
Table 2. Persistence Rates
2007-2008 by
2012-2013 2008-2009 by
2013-2014 2009-2010 by
2014-2015 2010-2011 by
2015-2016 2011-2012 by
2016-2017
Cohort Size 3,963 4,283 4,641 4,341 4,360
% Persisted 72.1% 71.0% 75.6% 76.6% 78.1%
A large majority of degree and/or transfer seeking first-time freshmen persisted. Over the last five years,
an average of 75% of students have persisted. The persistence rate has increased by 6% over the last
five years.
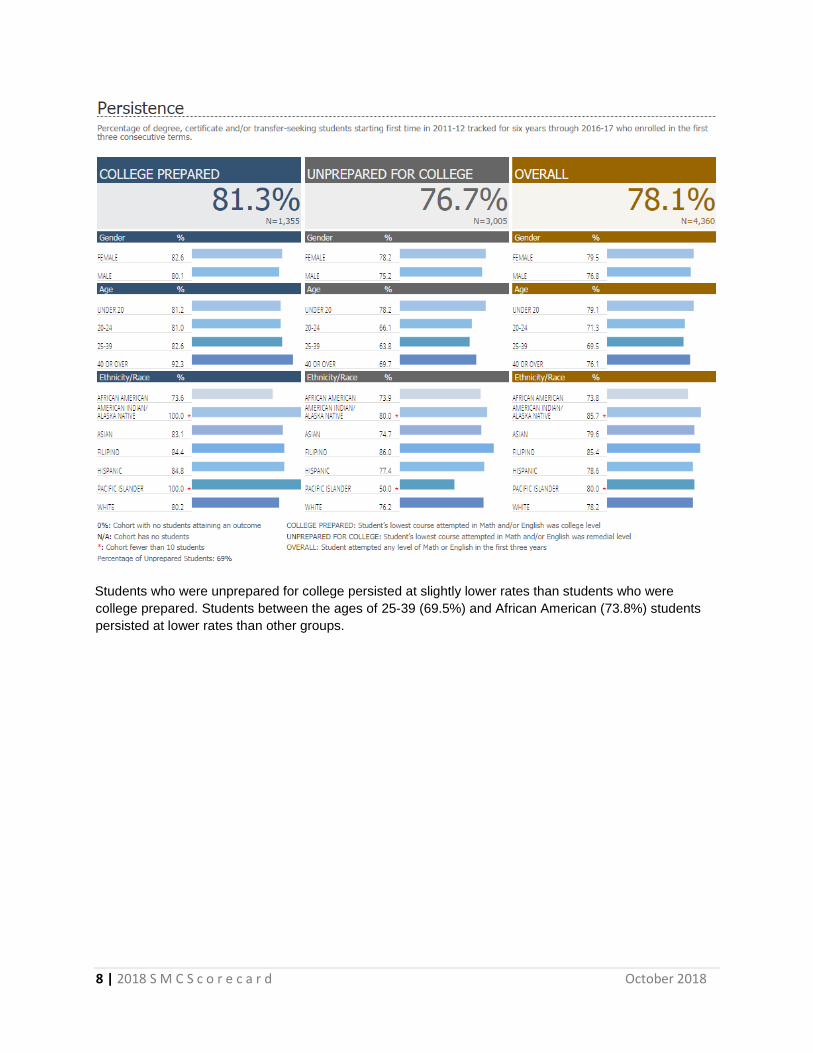
The following figure describes the persistence rates by student demographic (gender, ethnicity/race,
age) and level of preparedness for the most recently reported cohort (2011-2012).
8 | 2018 S M C S c o r e c a r d October 2018
Students who were unprepared for college persisted at slightly lower rates than students who were
college prepared. Students between the ages of 25-39 (69.5%) and African American (73.8%) students
persisted at lower rates than other groups.
9 | 2018 S M C S c o r e c a r d October 2018
30 Units Rate
The 30 units rate describes the percentage of degree and/or transfer seeking first-time students who
earned at least 30 units. Credit accumulation, 30 units specifically, tends to be positively correlated with
completion and wage gain.
Denominator (Cohort):
SMC students who met the following criteria were included in the cohort:
• First-time college student at SMC;
• Reported a valid SSN;
• Earned six or more credit units at SMC and/or anywhere in the system during the first three
years of enrollment; and,
• Attempted any credit math or English course in the first three years of enrollment.
Numerator (Outcome):
Students in the cohort who completed 30 or more credit units with a grade of A, B, C, D, or P anywhere
in the CCC were counted as having completed 30 units.
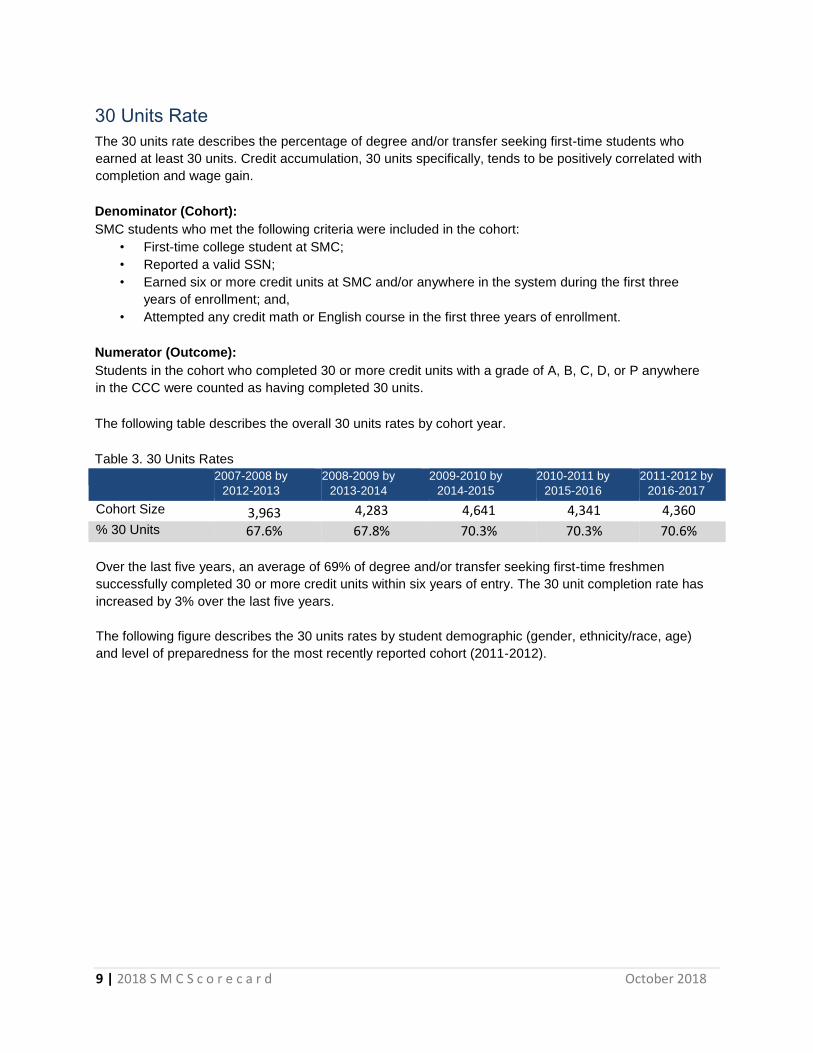
The following table describes the overall 30 units rates by cohort year.
Table 3. 30 Units Rates
2007-2008 by
2012-2013 2008-2009 by
2013-2014 2009-2010 by
2014-2015 2010-2011 by
2015-2016 2011-2012 by
2016-2017
Cohort Size 3,963 4,283 4,641 4,341 4,360
% 30 Units 67.6% 67.8% 70.3% 70.3% 70.6%
Over the last five years, an average of 69% of degree and/or transfer seeking first-time freshmen
successfully completed 30 or more credit units within six years of entry. The 30 unit completion rate has
increased by 3% over the last five years.
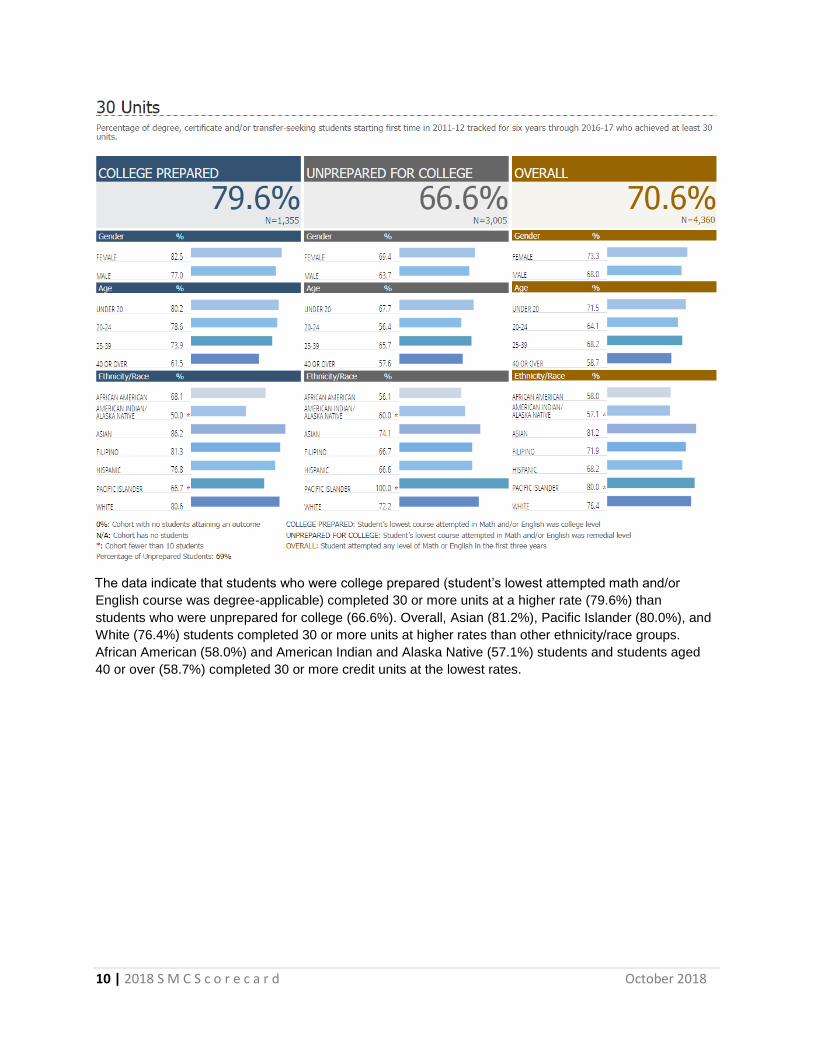
The following figure describes the 30 units rates by student demographic (gender, ethnicity/race, age)
and level of preparedness for the most recently reported cohort (2011-2012).
10 | 2018 S M C S c o r e c a r d October 2018
The data indicate that students who were college prepared (student’s lowest attempted math and/or
English course was degree-applicable) completed 30 or more units at a higher rate (79.6%) than
students who were unprepared for college (66.6%). Overall, Asian (81.2%), Pacific Islander (80.0%), and
White (76.4%) students completed 30 or more units at higher rates than other ethnicity/race groups.
African American (58.0%) and American Indian and Alaska Native (57.1%) students and students aged
40 or over (58.7%) completed 30 or more credit units at the lowest rates.
11 | 2018 S M C S c o r e c a r d October 2018
Remedial Progress Rate
The remedial progress rates describe the percentage of credit students who started below transfer level
in math, English, and/or ESL who completed a college-level course in the same discipline within six
years.
Denominator (Cohort):
SMC students who met the following criteria were included in the cohort:
• First attempt of a credit math, English, and/or ESL course was in a course that was two to four
levels below transfer, but not degree applicable;
o Math: MATH 85, MATH 81, MATH 84, or MATH 31;
o English writing: ENGL 81A, ENGL 81B, ENGL 84W, or ENGL 21A; and/or
o ESL: ESL 10G, ESL 10W, ESL 11A, ESL 15, ESL 17, or ESL 23.
The cohort is defined as the year the student attempts a course at “levels below transfer” in Math,
English and/or ESL.
Numerator (Outcome):
Students in the cohort who met the following criteria within six years were counted as having progressed
through the remedial sequence:
• Math cohort: Earned an A, B, C, or P grade in any UC/CSU transferable math course;
• English cohort: Earned an A, B, C, or P grade in any UC/CSU transferable English course;
and/or,
• ESL cohort: Earned an A, B, C, or P grade in any UC/CSU transferable English course or earned
an A, B, C, or P grade in ESL 11B, ESL 21A, ESL 21B, or ESL 25.
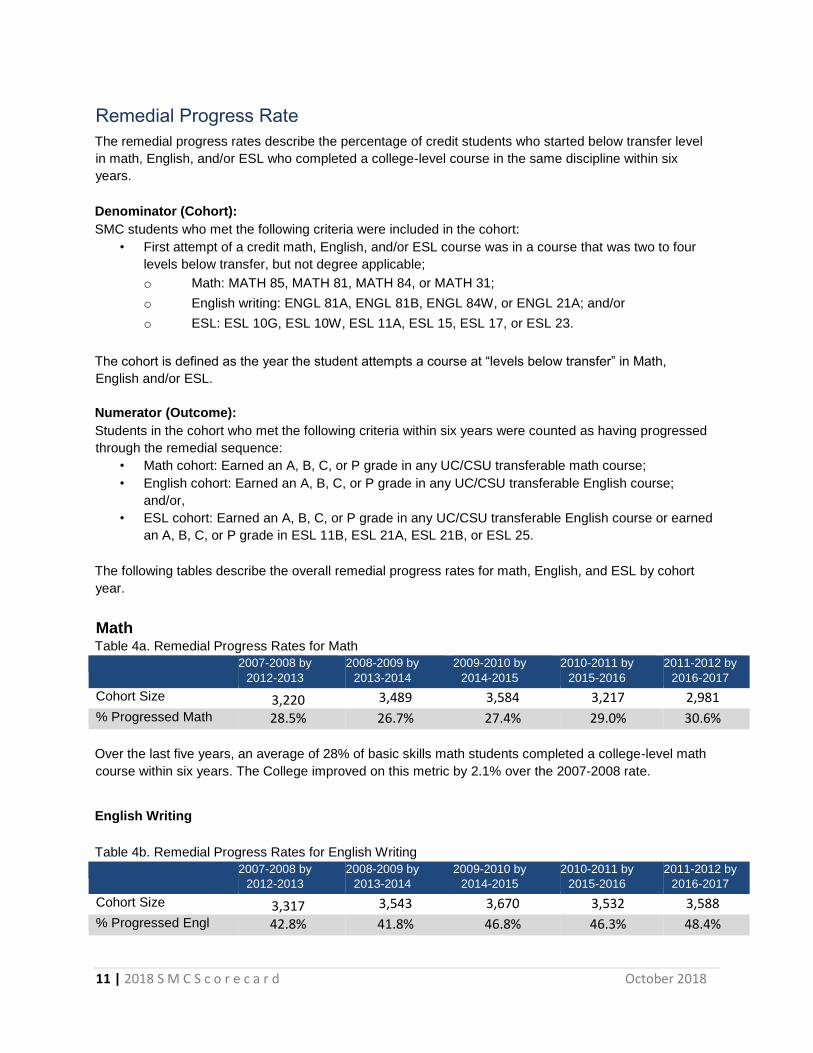
The following tables describe the overall remedial progress rates for math, English, and ESL by cohort
year.
Math Table 4a. Remedial Progress Rates for Math
2007-2008 by
2012-2013 2008-2009 by
2013-2014 2009-2010 by
2014-2015 2010-2011 by
2015-2016 2011-2012 by
2016-2017
Cohort Size 3,220 3,489 3,584 3,217 2,981
% Progressed Math 28.5% 26.7% 27.4% 29.0% 30.6%
Over the last five years, an average of 28% of basic skills math students completed a college-level math
course within six years. The College improved on this metric by 2.1% over the 2007-2008 rate.
English Writing
Table 4b. Remedial Progress Rates for English Writing
2007-2008 by
2012-2013 2008-2009 by
2013-2014 2009-2010 by
2014-2015 2010-2011 by
2015-2016 2011-2012 by
2016-2017
Cohort Size 3,317 3,543 3,670 3,532 3,588
% Progressed Engl 42.8% 41.8% 46.8% 46.3% 48.4%
12 | 2018 S M C S c o r e c a r d October 2018
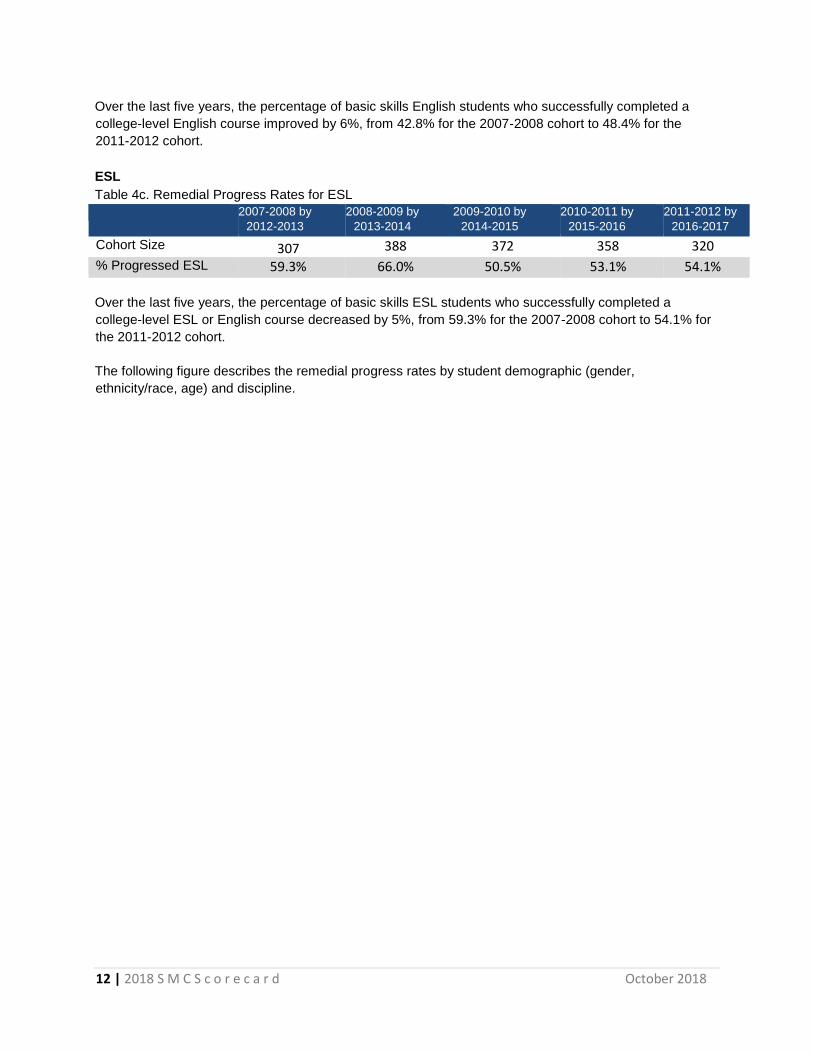
Over the last five years, the percentage of basic skills English students who successfully completed a
college-level English course improved by 6%, from 42.8% for the 2007-2008 cohort to 48.4% for the
2011-2012 cohort.
ESL
Table 4c. Remedial Progress Rates for ESL
2007-2008 by
2012-2013 2008-2009 by
2013-2014 2009-2010 by
2014-2015 2010-2011 by
2015-2016 2011-2012 by
2016-2017
Cohort Size 307 388 372 358 320
% Progressed ESL 59.3% 66.0% 50.5% 53.1% 54.1%
Over the last five years, the percentage of basic skills ESL students who successfully completed a
college-level ESL or English course decreased by 5%, from 59.3% for the 2007-2008 cohort to 54.1% for
the 2011-2012 cohort.
The following figure describes the remedial progress rates by student demographic (gender,
ethnicity/race, age) and discipline.
13 | 2018 S M C S c o r e c a r d October 2018
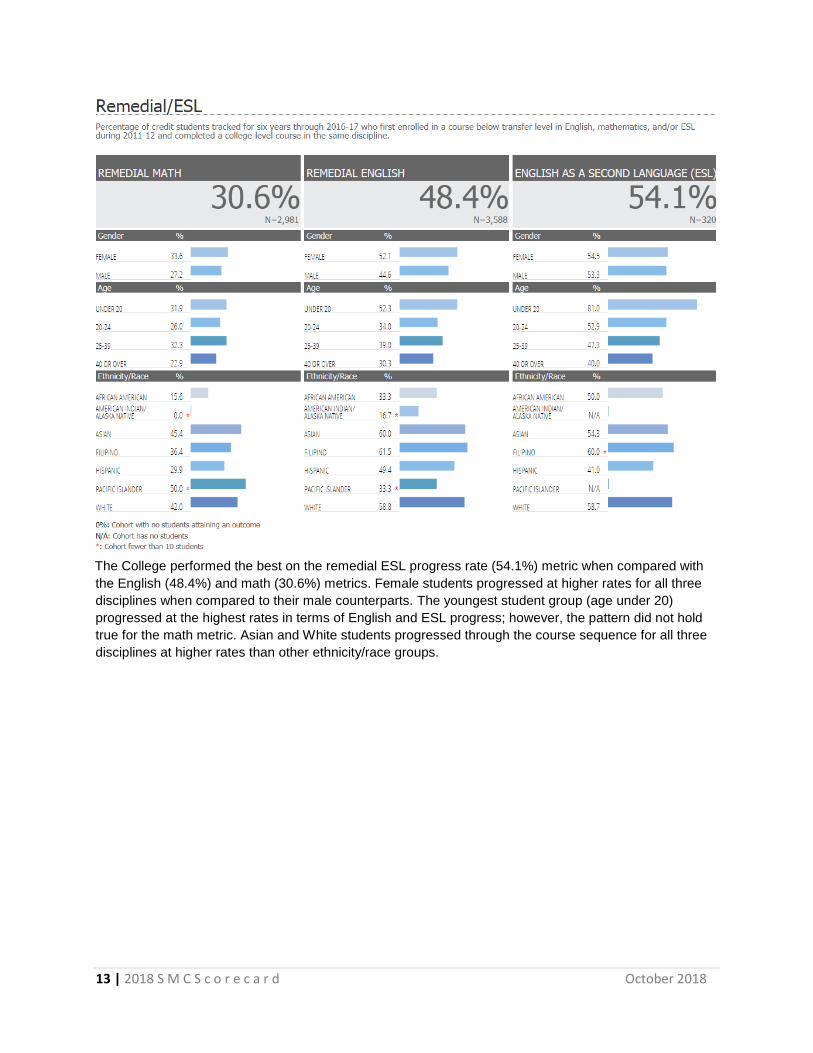
The College performed the best on the remedial ESL progress rate (54.1%) metric when compared with
the English (48.4%) and math (30.6%) metrics. Female students progressed at higher rates for all three
disciplines when compared to their male counterparts. The youngest student group (age under 20)
progressed at the highest rates in terms of English and ESL progress; however, the pattern did not hold
true for the math metric. Asian and White students progressed through the course sequence for all three
disciplines at higher rates than other ethnicity/race groups.
14 | 2018 S M C S c o r e c a r d October 2018
Career Technical Education (CTE) Rate
The CTE rate describes the percentage of CTE students who successfully completed a degree,
certificate, or transfer-related outcome within six years.
Denominator (Cohort):
SMC students who met the following criteria were included in the cohort:
• First-time college student at SMC;
• Reported a valid SSN; and,
• Earned eight or more credit units in a single discipline at SMC and/or anywhere in the system
during the first three years of enrollment.
o At least one of the courses is designated as “clearly” or “advanced” occupational; and,
o Units earned in courses with same 2-digit vocational TOP code.
Numerator (Outcome):
Students in the cohort who met the following criteria within six years of entering the CCC system for the
first time were counted as having completed a CTE outcome:
• Earned an Associate of Arts or Science degree at any CCC (California Community College);
• Earned a Chancellor’s Office approved Certificate of Achievement at any CCC;
• Transferred to a four-year institution;
• Completed of apprenticeship; and/or,
• Completed 60 or more UC/CSU transferable units with a GPA of 2.0 or higher anywhere in the
CCC system.
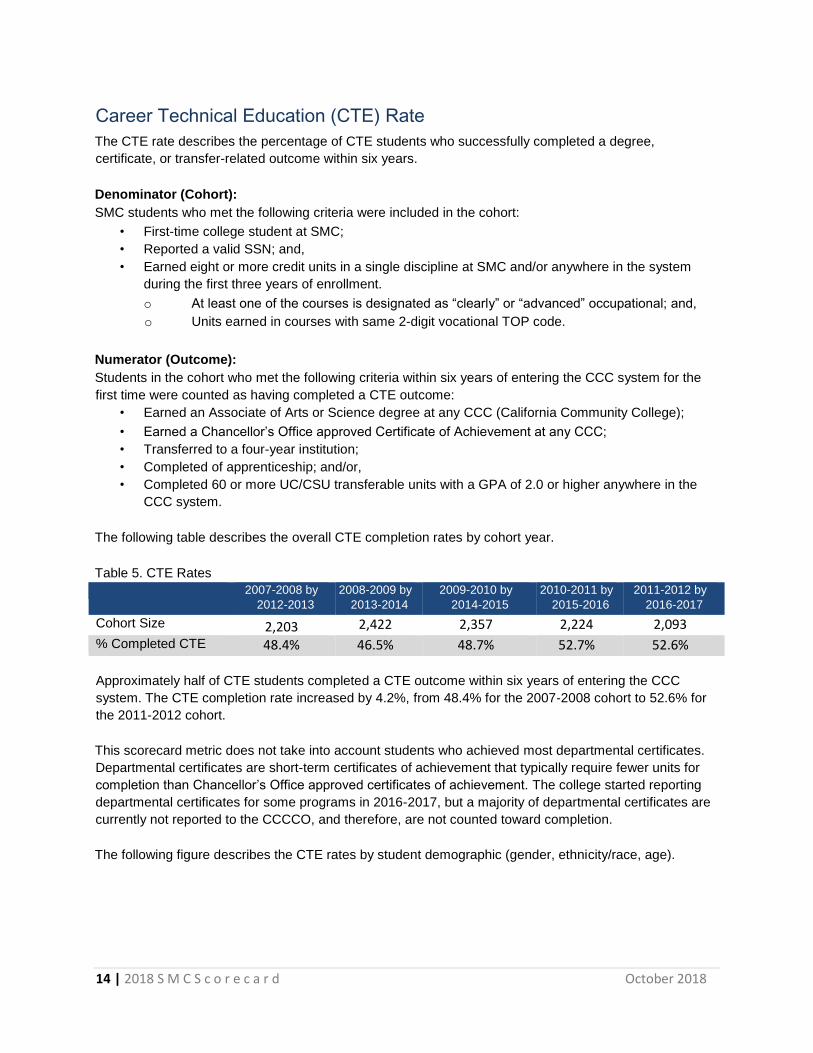
The following table describes the overall CTE completion rates by cohort year.
Table 5. CTE Rates
2007-2008 by
2012-2013 2008-2009 by
2013-2014 2009-2010 by
2014-2015 2010-2011 by
2015-2016 2011-2012 by
2016-2017
Cohort Size 2,203 2,422 2,357 2,224 2,093
% Completed CTE 48.4% 46.5% 48.7% 52.7% 52.6%
Approximately half of CTE students completed a CTE outcome within six years of entering the CCC
system. The CTE completion rate increased by 4.2%, from 48.4% for the 2007-2008 cohort to 52.6% for
the 2011-2012 cohort.
This scorecard metric does not take into account students who achieved most departmental certificates.
Departmental certificates are short-term certificates of achievement that typically require fewer units for
completion than Chancellor’s Office approved certificates of achievement. The college started reporting
departmental certificates for some programs in 2016-2017, but a majority of departmental certificates are
currently not reported to the CCCCO, and therefore, are not counted toward completion.
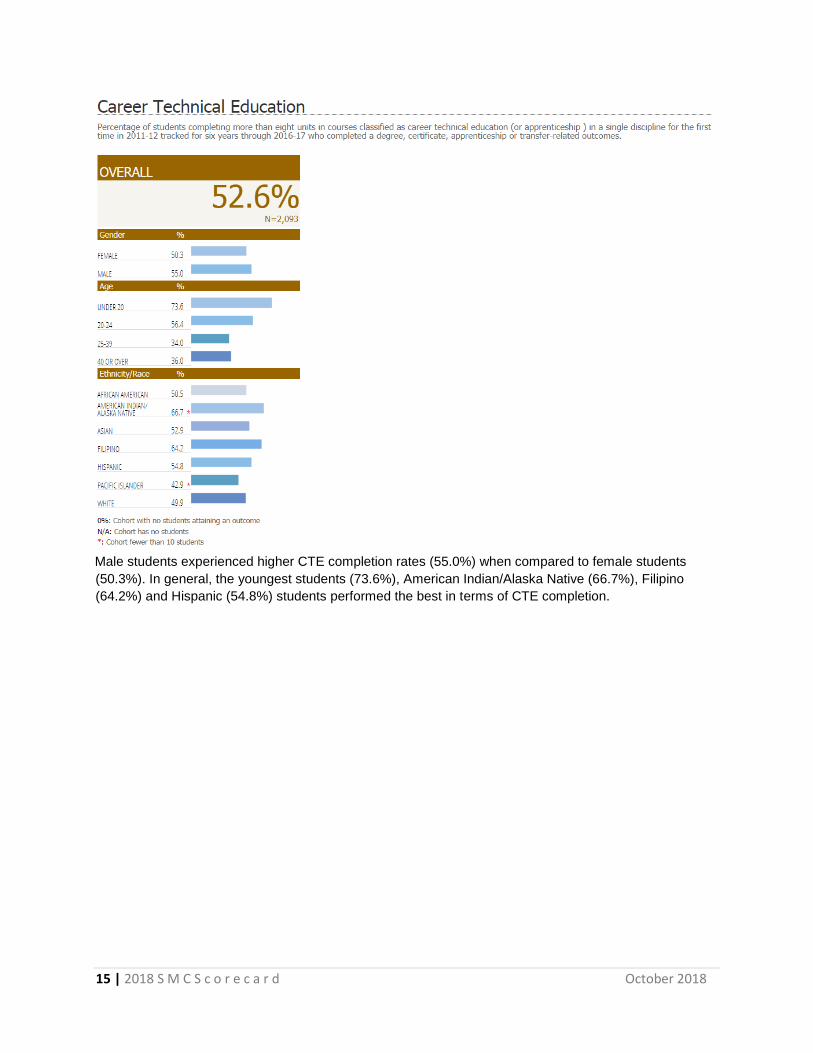
The following figure describes the CTE rates by student demographic (gender, ethnicity/race, age).
15 | 2018 S M C S c o r e c a r d October 2018
Male students experienced higher CTE completion rates (55.0%) when compared to female students
(50.3%). In general, the youngest students (73.6%), American Indian/Alaska Native (66.7%), Filipino
(64.2%) and Hispanic (54.8%) students performed the best in terms of CTE completion.
16 | 2018 S M C S c o r e c a r d October 2018
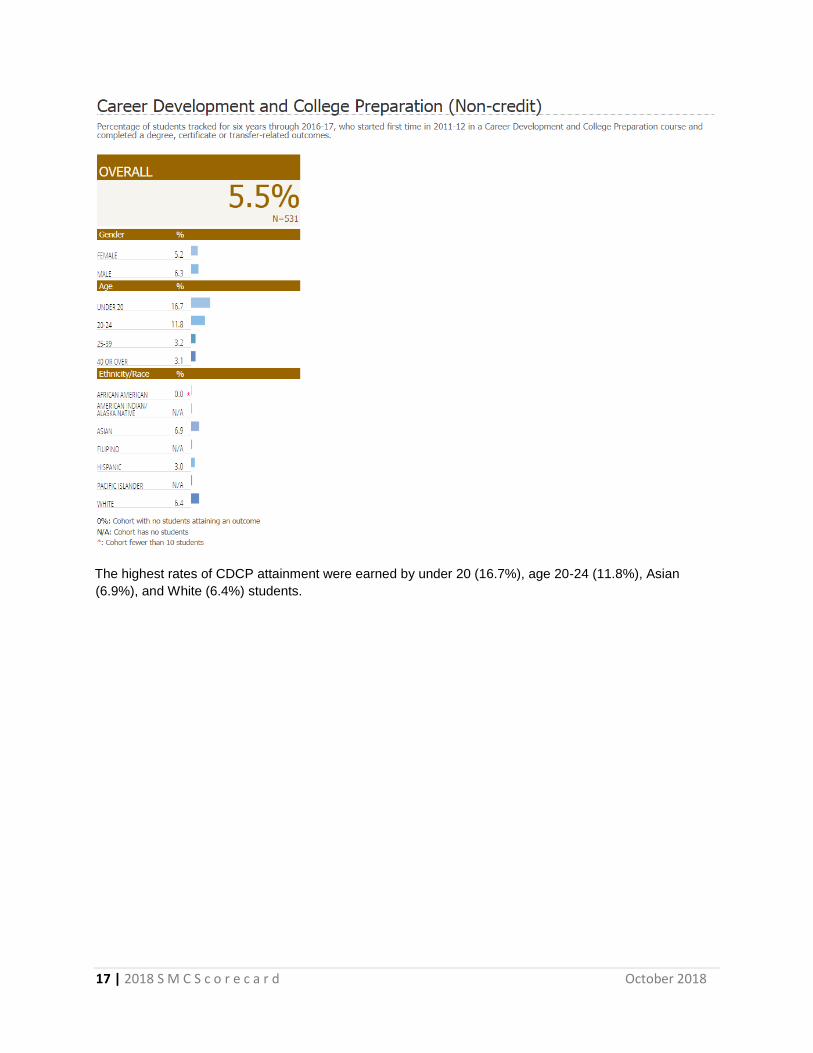
Career Development & College Preparation (CDCP) Rate
The CDCP rate describes the percentage of CDCP who successfully completed a degree, certificate, or
transfer related outcome within six years.
Denominator (Cohort):
SMC students who met the following criteria were included in the cohort:
• First-time college student at SMC;
• Reported a valid SSN; and,
• Enrolled in at least two or more CDCP courses, with a minimum of 4 attendance hours in each of
those courses within three years of initial enrollment.
o CDCP course is defined as a non-credit course classified as a workforce preparation or
basic skills (including ESL) necessary to participate in job-specific technical training.
Numerator (Outcome):
Students in the cohort who met the following criteria within six years of entering the CCC system for the
first time were counted as having completed a CTE outcome:
• Earned a CDCP certificate;
• Earned an Associate of Arts or Science degree at any CCC (California Community College);
• Earned a Chancellor’s Office approved Certificate of Achievement at any CCC;
• Transferred to a four-year institution; and/or,
• Completed 60 or more UC/CSU transferable units with a GPA of 2.0 or higher anywhere in the
CCC system.
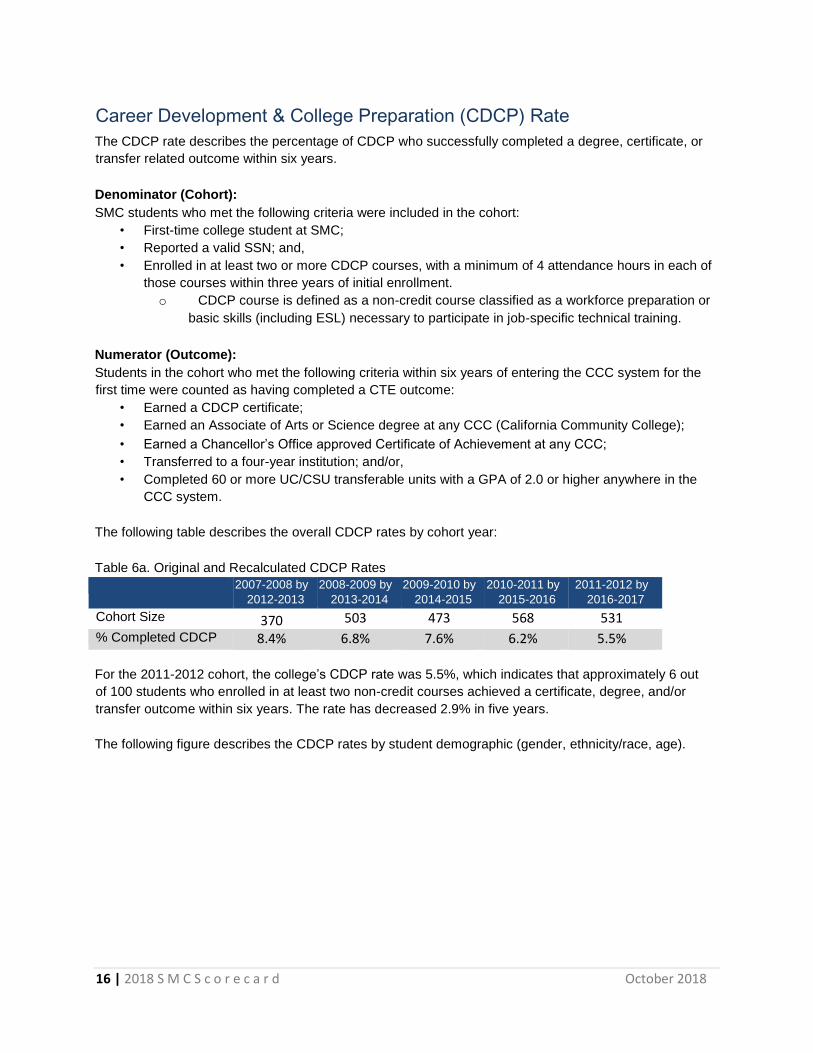
The following table describes the overall CDCP rates by cohort year:
Table 6a. Original and Recalculated CDCP Rates
2007-2008 by
2012-2013 2008-2009 by
2013-2014 2009-2010 by
2014-2015 2010-2011 by
2015-2016 2011-2012 by
2016-2017
Cohort Size 370 503 473 568 531
% Completed CDCP 8.4% 6.8% 7.6% 6.2% 5.5%
For the 2011-2012 cohort, the college’s CDCP rate was 5.5%, which indicates that approximately 6 out
of 100 students who enrolled in at least two non-credit courses achieved a certificate, degree, and/or
transfer outcome within six years. The rate has decreased 2.9% in five years.
The following figure describes the CDCP rates by student demographic (gender, ethnicity/race, age).
17 | 2018 S M C S c o r e c a r d October 2018
The highest rates of CDCP attainment were earned by under 20 (16.7%), age 20-24 (11.8%), Asian
(6.9%), and White (6.4%) students.
18 | 2018 S M C S c o r e c a r d October 2018
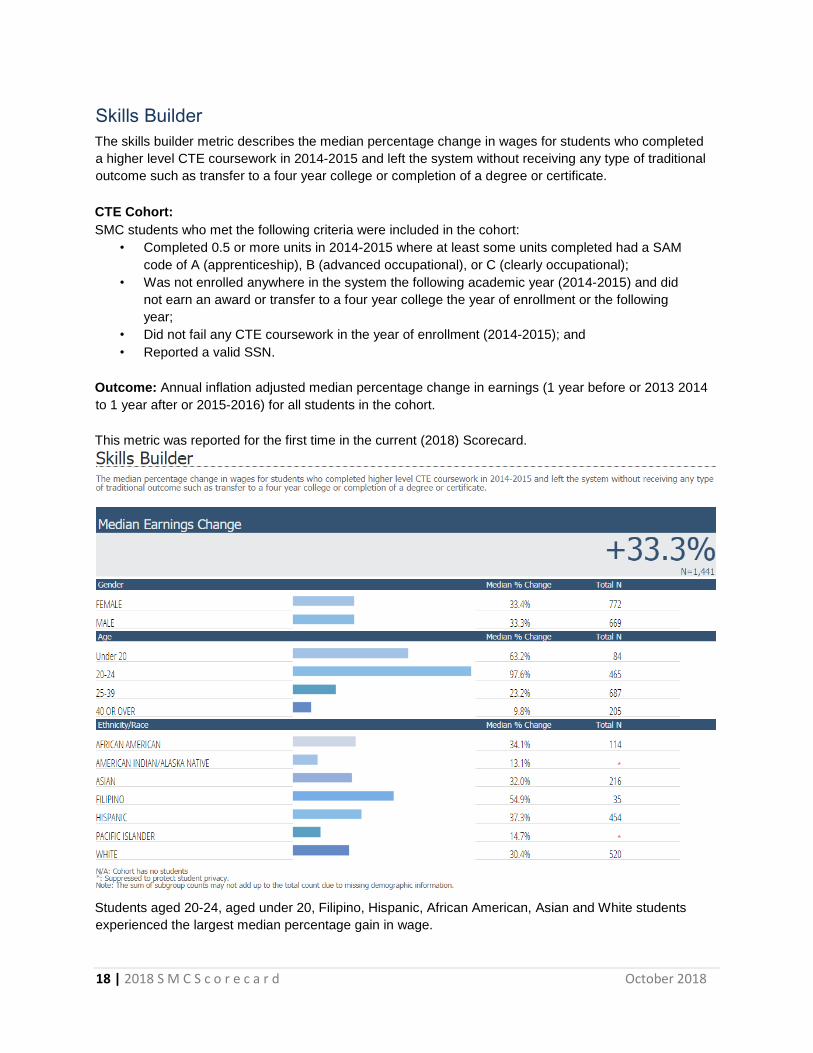
Skills Builder
The skills builder metric describes the median percentage change in wages for students who completed
a higher level CTE coursework in 2014-2015 and left the system without receiving any type of traditional
outcome such as transfer to a four year college or completion of a degree or certificate.
CTE Cohort:
SMC students who met the following criteria were included in the cohort:
• Completed 0.5 or more units in 2014-2015 where at least some units completed had a SAM
code of A (apprenticeship), B (advanced occupational), or C (clearly occupational);
• Was not enrolled anywhere in the system the following academic year (2014-2015) and did
not earn an award or transfer to a four year college the year of enrollment or the following
year;
• Did not fail any CTE coursework in the year of enrollment (2014-2015); and
• Reported a valid SSN.
Outcome: Annual inflation adjusted median percentage change in earnings (1 year before or 2013 2014
to 1 year after or 2015-2016) for all students in the cohort.
This metric was reported for the first time in the current (2018) Scorecard.
Students aged 20-24, aged under 20, Filipino, Hispanic, African American, Asian and White students
experienced the largest median percentage gain in wage.
19 | 2018 S M C S c o r e c a r d October 2018
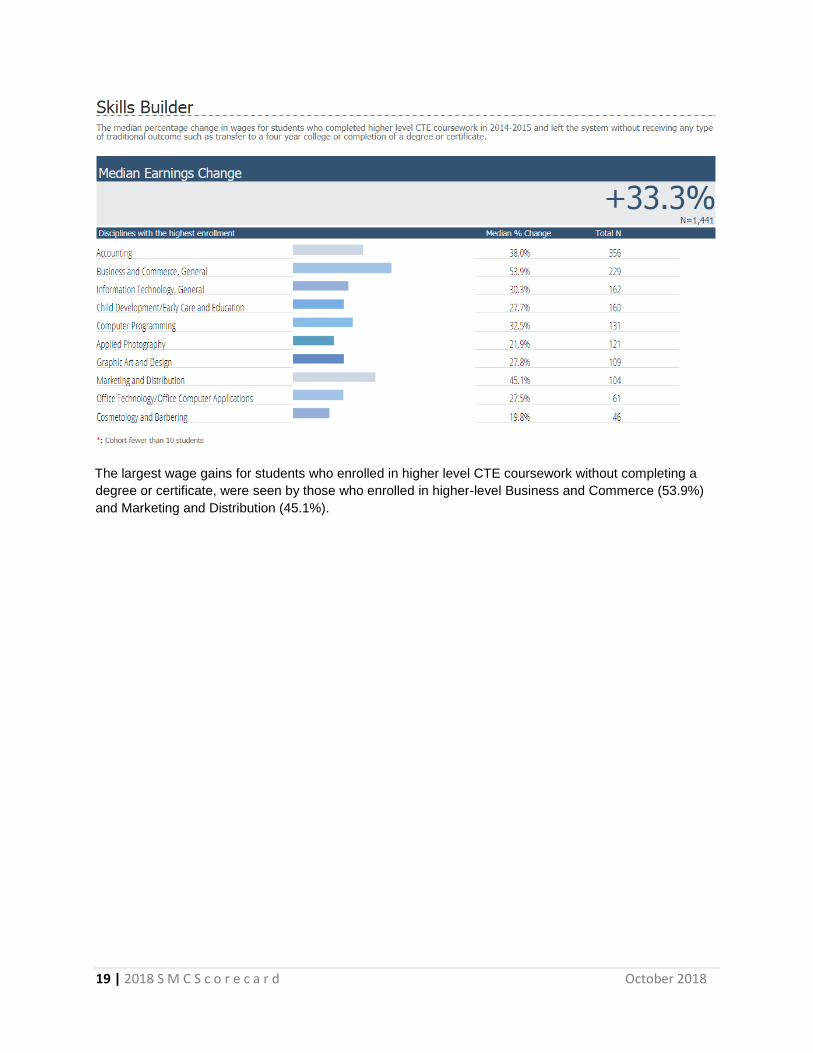
The largest wage gains for students who enrolled in higher level CTE coursework without completing a
degree or certificate, were seen by those who enrolled in higher-level Business and Commerce (53.9%)
and Marketing and Distribution (45.1%).
20 | 2018 S M C S c o r e c a r d October 2018
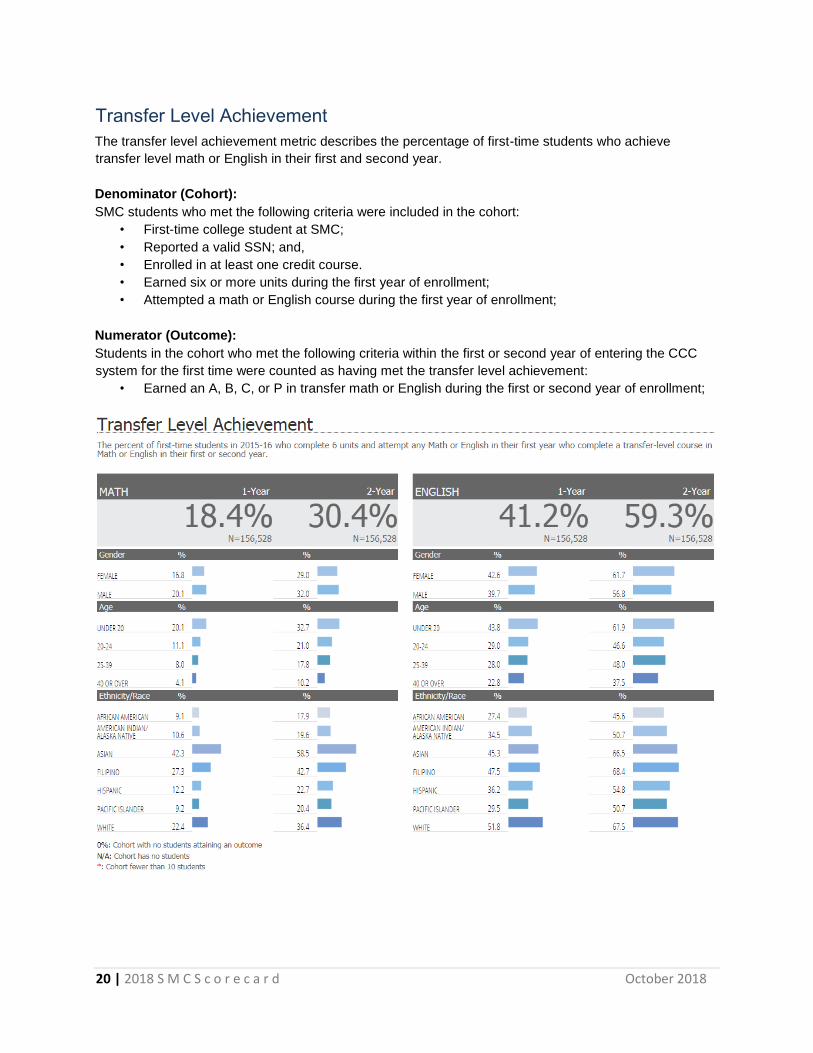
Transfer Level Achievement
The transfer level achievement metric describes the percentage of first-time students who achieve
transfer level math or English in their first and second year.
Denominator (Cohort):
SMC students who met the following criteria were included in the cohort:
• First-time college student at SMC;
• Reported a valid SSN; and,
• Enrolled in at least one credit course.
• Earned six or more units during the first year of enrollment;
• Attempted a math or English course during the first year of enrollment;
Numerator (Outcome):
Students in the cohort who met the following criteria within the first or second year of entering the CCC
system for the first time were counted as having met the transfer level achievement:
• Earned an A, B, C, or P in transfer math or English during the first or second year of enrollment;