Embed Size (px)
Citation preview
Studies of Diagnostic Tests
Thomas B. Newman, MD, MPH
October 16, 2008
Reminders/Announcements
Corrected page proofs of all of EBD are now on the web– Tell us if you find additional mistakes,
ASAP– Index is a mess; if you look for things there
and do not find them, let us know Final exam to be passed out 12/4,
reviewed 12/11– Send questions!
Overview Common biases of studies of diagnostic test
accuracy– Incorporation bias– Verification bias– Double gold standard bias– Spectrum bias
Prevalence, spectrum and nonindependence Meta-analysis of diagnostic tests Checklist & systematic approach Examples:
– Physical examination for presentation– Pain with percussion, hopping or cough for
appendicitis
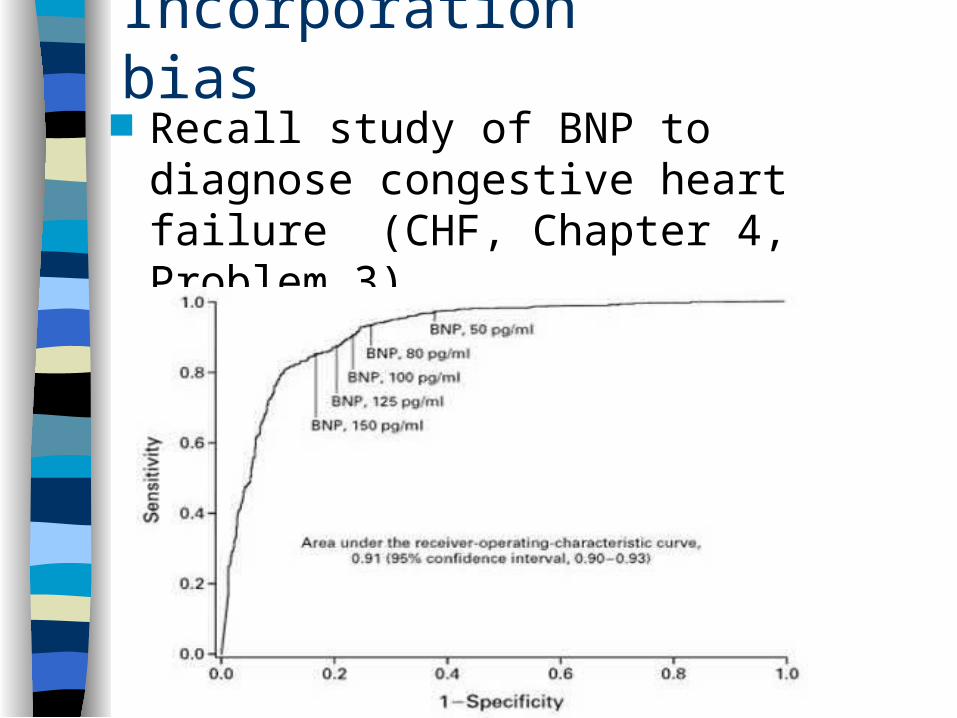
Incorporation bias Recall study of BNP to diagnose
congestive heart failure (CHF, Chapter 4, Problem 3)
Incorporation Bias
Gold standard: determination of CHF by two cardiologists blinded to BNP
Chest X-ray found to be highly predictive of CHF, but cardiologists not blinded to Chest X-ray
Incorporation bias for assessment of Chest X-ray, not BNP
*Maisel AS, Krishnaswamy P, Nowak RM, McCord J, Hollander JE, Duc P, et al. Rapid measurement of B-type natriuretic peptide in the emergency diagnosis of heart failure. N Engl J Med 2002;347(3):161-7.
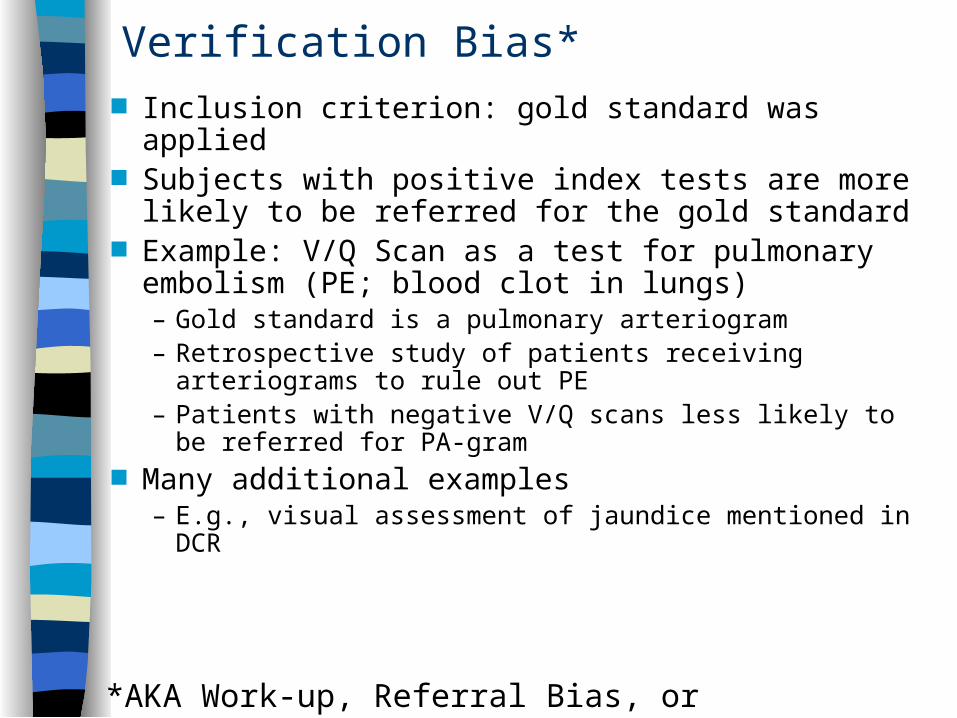
Verification Bias* Inclusion criterion: gold standard was applied Subjects with positive index tests are more likely to
be referred for the gold standard Example: V/Q Scan as a test for pulmonary
embolism (PE; blood clot in lungs) – Gold standard is a pulmonary arteriogram– Retrospective study of patients receiving arteriograms to
rule out PE – Patients with negative V/Q scans less likely to be
referred for PA-gram Many additional examples
– E.g., visual assessment of jaundice mentioned in DCR
*AKA Work-up, Referral Bias, or Ascertainment Bias
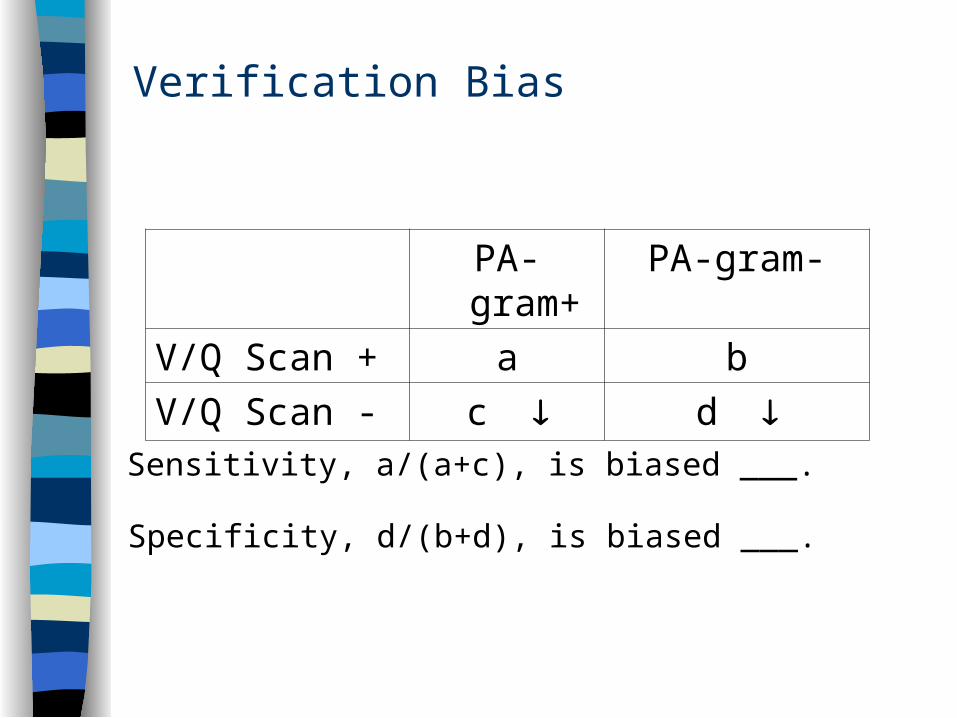
Verification Bias
PA-gram+ PA-gram-
V/Q Scan + a b
V/Q Scan - c d
Sensitivity, a/(a+c), is biased ___.
Specificity, d/(b+d), is biased ___.
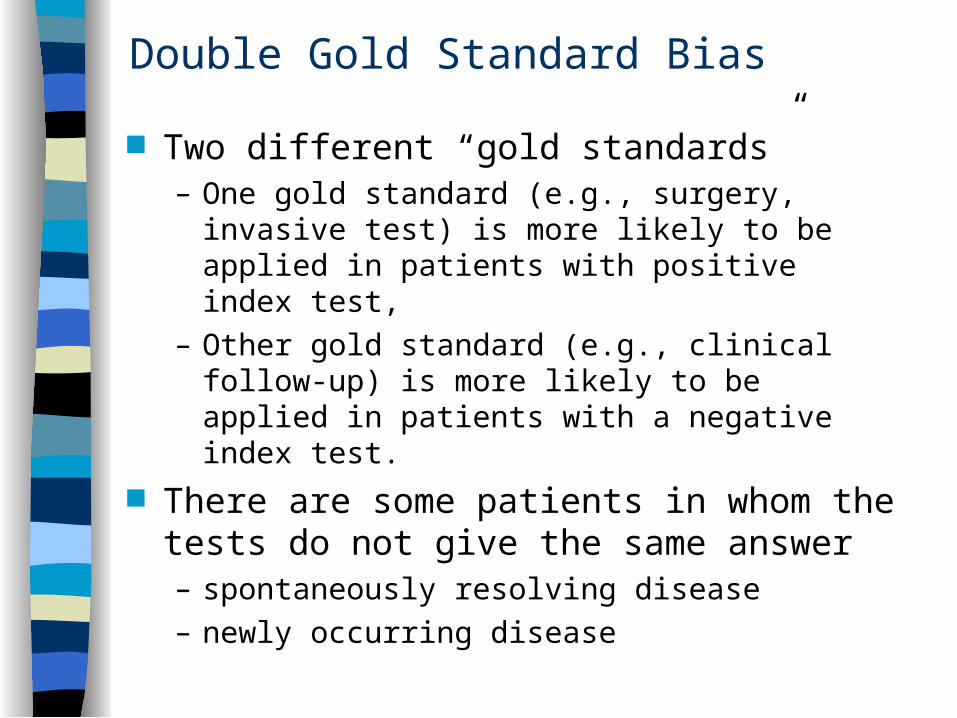
Double Gold Standard Bias
Two different “gold standards”– One gold standard (e.g., surgery, invasive test) is
more likely to be applied in patients with positive index test,
– Other gold standard (e.g., clinical follow-up) is more likely to be applied in patients with a negative index test.
There are some patients in whom the tests do not give the same answer– spontaneously resolving disease– newly occurring disease
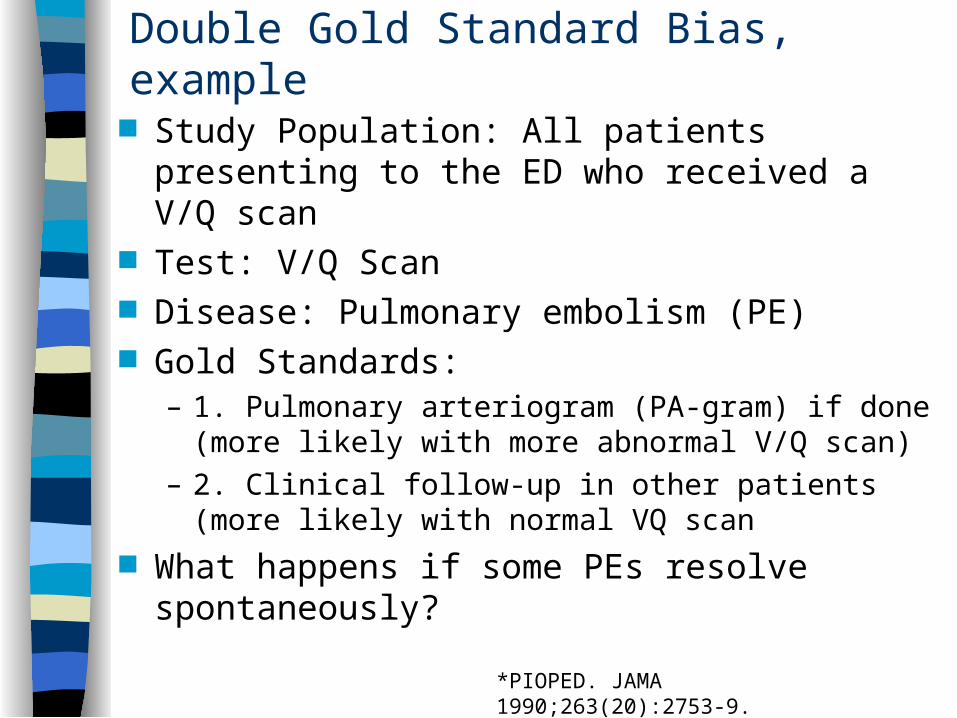
Double Gold Standard Bias, example
Study Population: All patients presenting to the ED who received a V/Q scan
Test: V/Q Scan Disease: Pulmonary embolism (PE) Gold Standards:
– 1. Pulmonary arteriogram (PA-gram) if done (more likely with more abnormal V/Q scan)
– 2. Clinical follow-up in other patients (more likely with normal VQ scan
What happens if some PEs resolve spontaneously?
*PIOPED. JAMA 1990;263(20):2753-9.
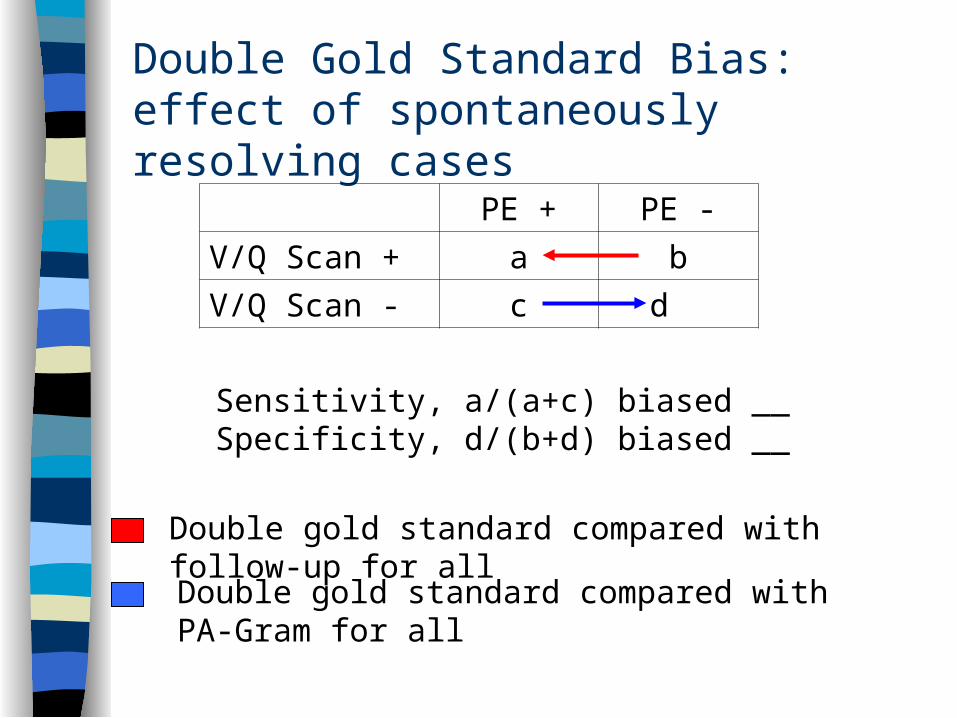
Double Gold Standard Bias: effect of spontaneously resolving cases
PE + PE -
V/Q Scan + a b
V/Q Scan - c d
Sensitivity, a/(a+c) biased __Specificity, d/(b+d) biased __
Double gold standard compared with PA-Gram for all
Double gold standard compared with follow-up for all
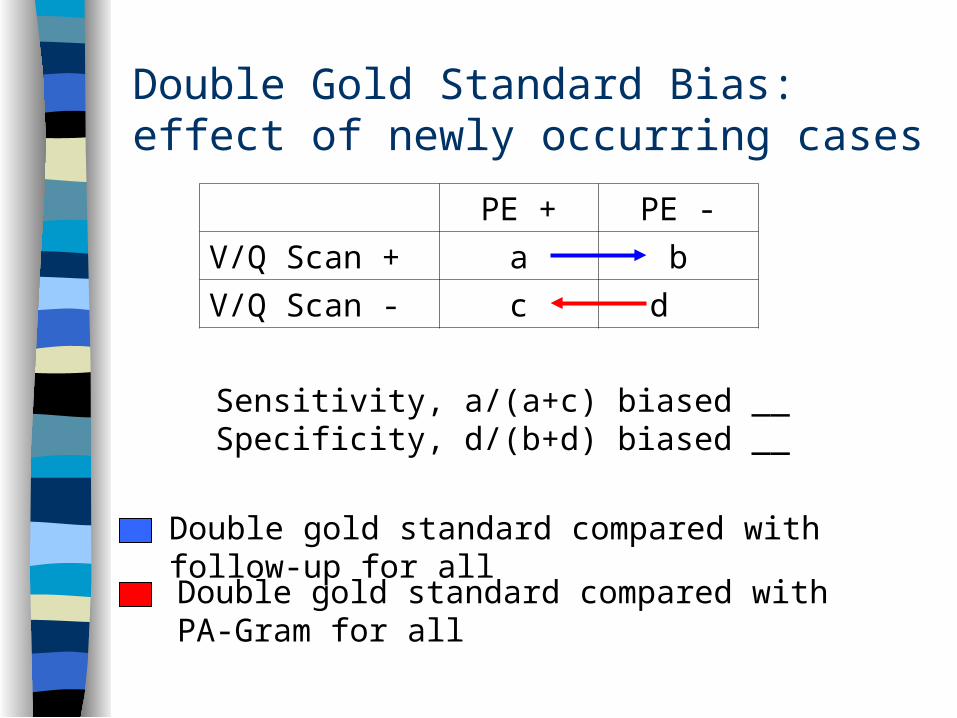
Double Gold Standard Bias: effect of newly occurring cases
PE + PE -
V/Q Scan + a b
V/Q Scan - c d
Sensitivity, a/(a+c) biased __Specificity, d/(b+d) biased __
Double gold standard compared with PA-Gram for all
Double gold standard compared with follow-up for all
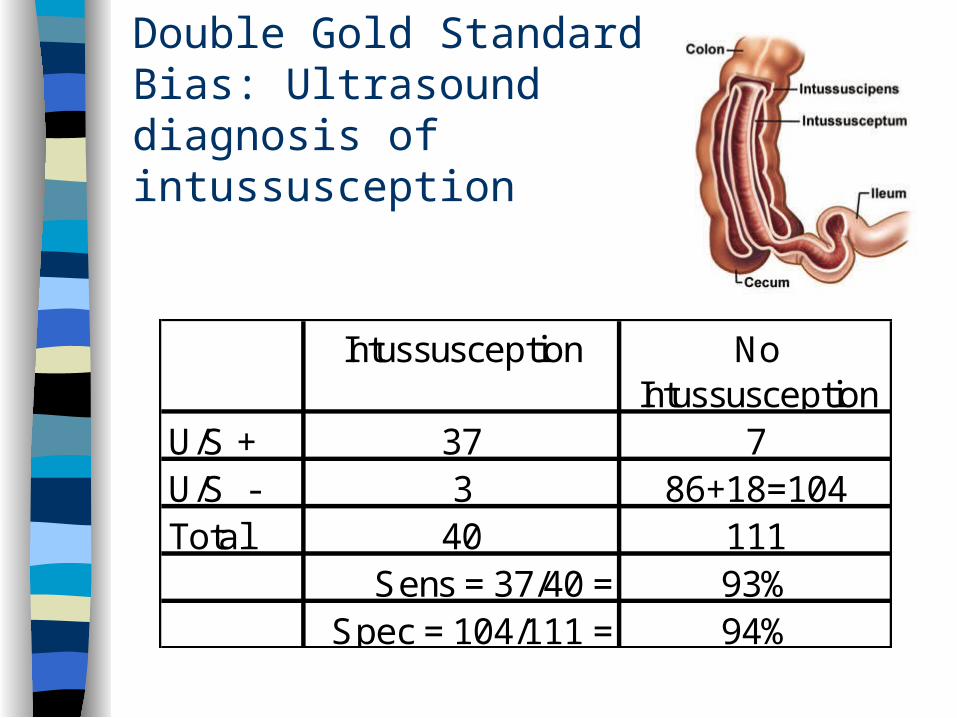
Double Gold Standard Bias: Ultrasound diagnosis of intussusception
Intussusception No Intussusception
U/S + 37 7U/S - 3 86+18=104Total 40 111
Sens = 37/40 = 93%Spec = 104/111 = 94%
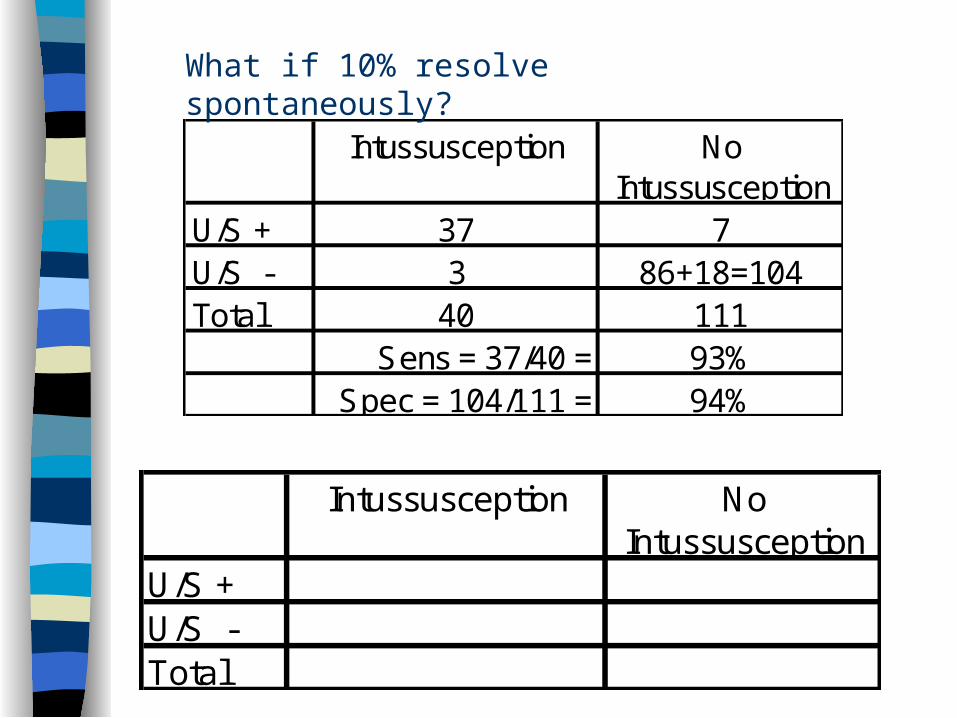
Intussusception No Intussusception
U/S + 37 7U/S - 3 86+18=104Total 40 111
Sens = 37/40 = 93%Spec = 104/111 = 94%
Intussusception No Intussusception
U/S +U/S -Total
What if 10% resolve spontaneously?
Spectrum of Disease, Nondisease and Test Results
Disease is often easier to diagnose if severe
“Nondisease” is easier to diagnose if patient is well than if the patient has other diseases
Test results will be more reproducible if ambiguous results excluded
Spectrum Bias
Sensitivity depends on the spectrum of disease in the population being tested.
Specificity depends on the spectrum of non-disease in the population being tested.
Example: Absence of Nasal Bone (on 13-week ultrasound) as a Test for Chromosomal Abnormality
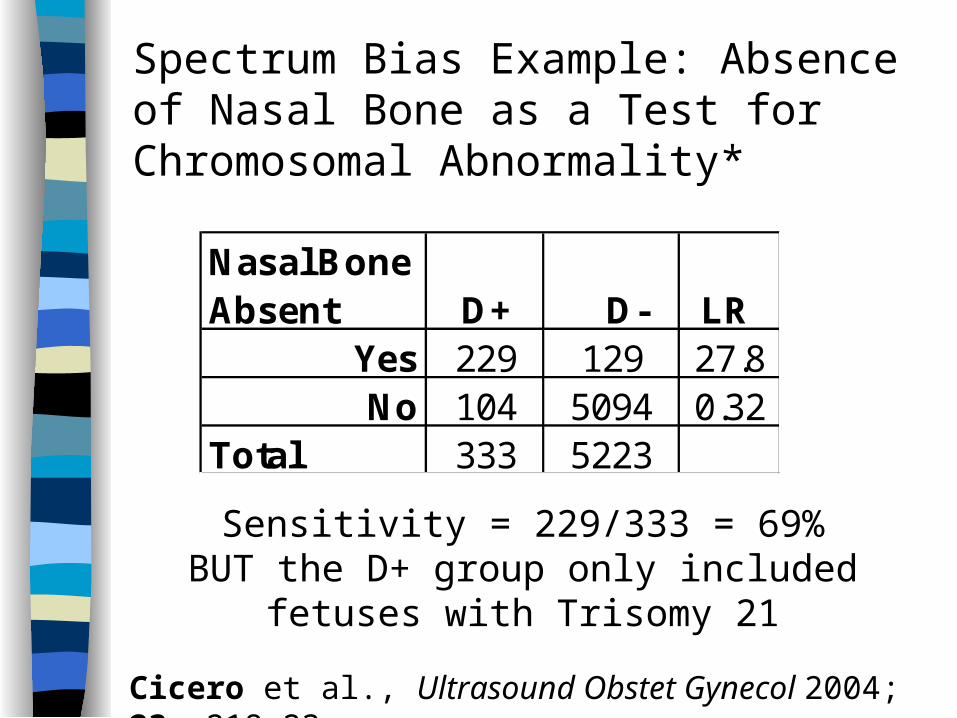
Spectrum Bias Example: Absence of Nasal Bone as a Test for Chromosomal Abnormality*
Sensitivity = 229/333 = 69%BUT the D+ group only included fetuses with
Trisomy 21
Nasal Bone Absent D+ D- LR
Yes 229 129 27.8No 104 5094 0.32
Total 333 5223
Cicero et al., Ultrasound Obstet Gynecol 2004; 23: 218-23
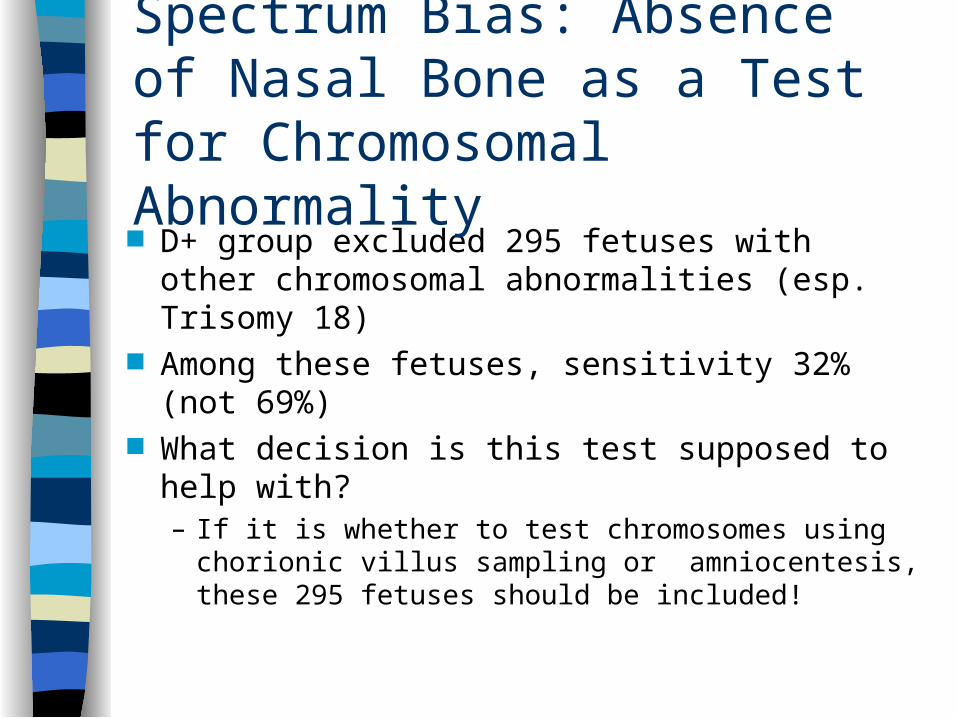
D+ group excluded 295 fetuses with other chromosomal abnormalities (esp. Trisomy 18)
Among these fetuses, sensitivity 32% (not 69%)
What decision is this test supposed to help with?– If it is whether to test chromosomes using
chorionic villus sampling or amniocentesis, these 295 fetuses should be included!
Spectrum Bias: Absence of Nasal Bone as a Test for Chromosomal Abnormality
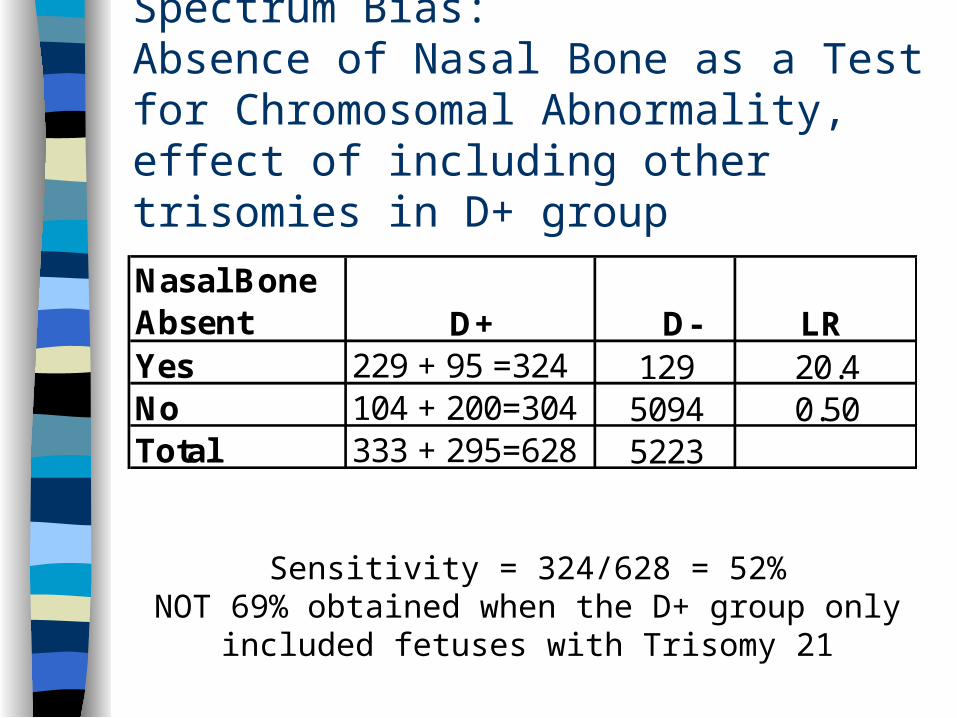
Sensitivity = 324/628 = 52%NOT 69% obtained when the D+ group only included
fetuses with Trisomy 21
Spectrum Bias:Absence of Nasal Bone as a Test for Chromosomal Abnormality, effect of including other trisomies in D+ group
Nasal Bone Absent D+ D- LR Yes 229 + 95 =324 129 20.4No 104 + 200=304 5094 0.50Total 333 + 295=628 5223
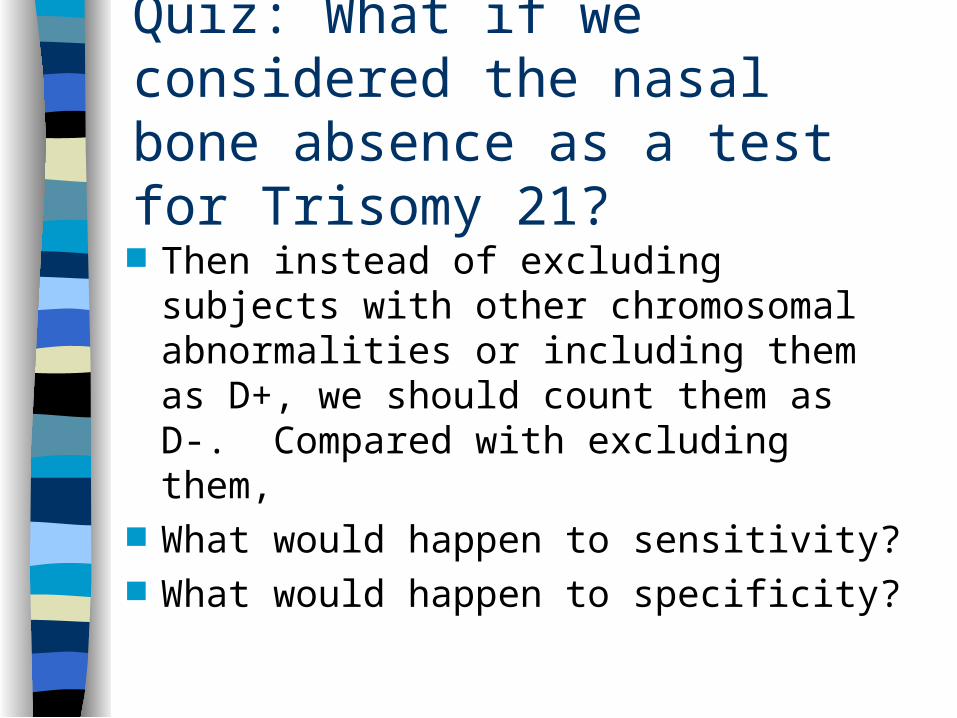
Quiz: What if we considered the nasal bone absence as a test for Trisomy 21?
Then instead of excluding subjects with other chromosomal abnormalities or including them as D+, we should count them as D-. Compared with excluding them,
What would happen to sensitivity? What would happen to specificity?
Prevalence, spectrum and nonindependence
Prevalence (prior probability) of disease may be related to disease severity
One mechanism is different spectra of disease or nondisease
Another is that whatever is causing the high prior probability is related to the same aspect of the disease as the test
Prevalence, spectrum and nonindependence
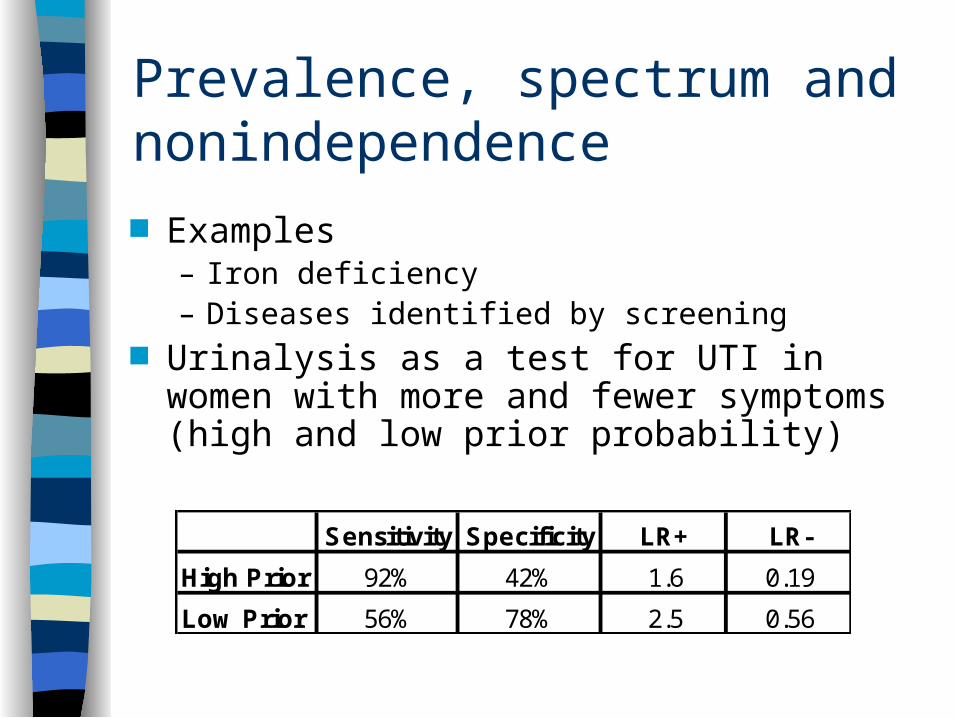
Examples– Iron deficiency– Diseases identified by screening
Urinalysis as a test for UTI in women with more and fewer symptoms (high and low prior probability)
Sensitivity Specificity LR+ LR-
High Prior 92% 42% 1.6 0.19
Low Prior 56% 78% 2.5 0.56
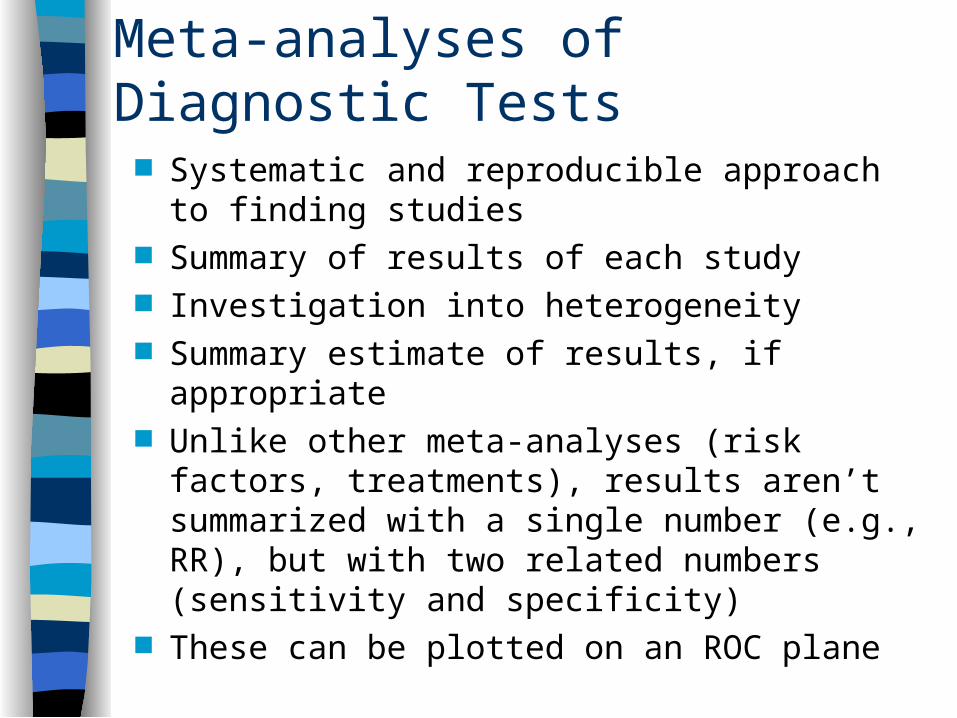
Meta-analyses of Diagnostic Tests
Systematic and reproducible approach to finding studies
Summary of results of each study Investigation into heterogeneity Summary estimate of results, if appropriate Unlike other meta-analyses (risk factors,
treatments), results aren’t summarized with a single number (e.g., RR), but with two related numbers (sensitivity and specificity)
These can be plotted on an ROC plane
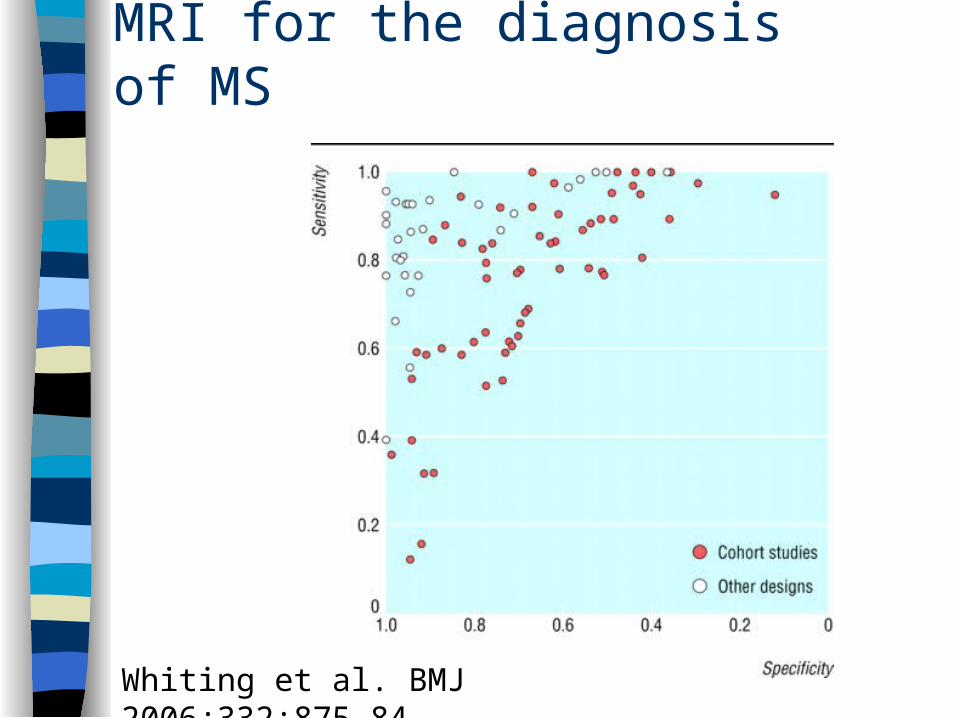
MRI for the diagnosis of MS
Whiting et al. BMJ 2006;332:875-84
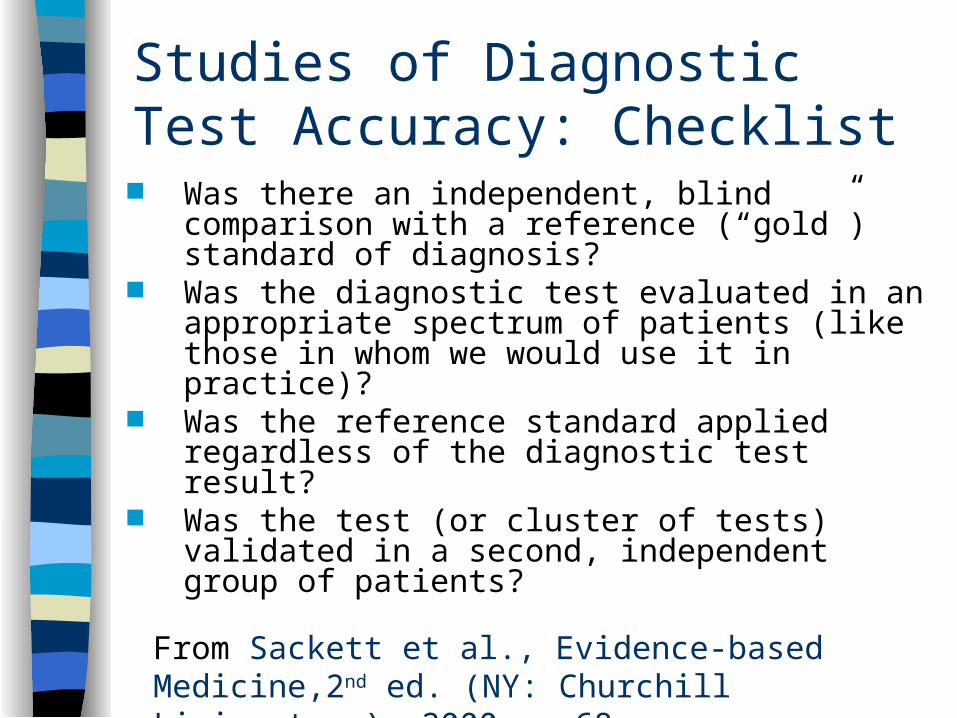
Studies of Diagnostic Test Accuracy: Checklist Was there an independent, blind
comparison with a reference (“gold”) standard of diagnosis?
Was the diagnostic test evaluated in an appropriate spectrum of patients (like those in whom we would use it in practice)?
Was the reference standard applied regardless of the diagnostic test result?
Was the test (or cluster of tests) validated in a second, independent group of patients?
From Sackett et al., Evidence-based Medicine,2nd ed. (NY: Churchill Livingstone), 2000. p 68
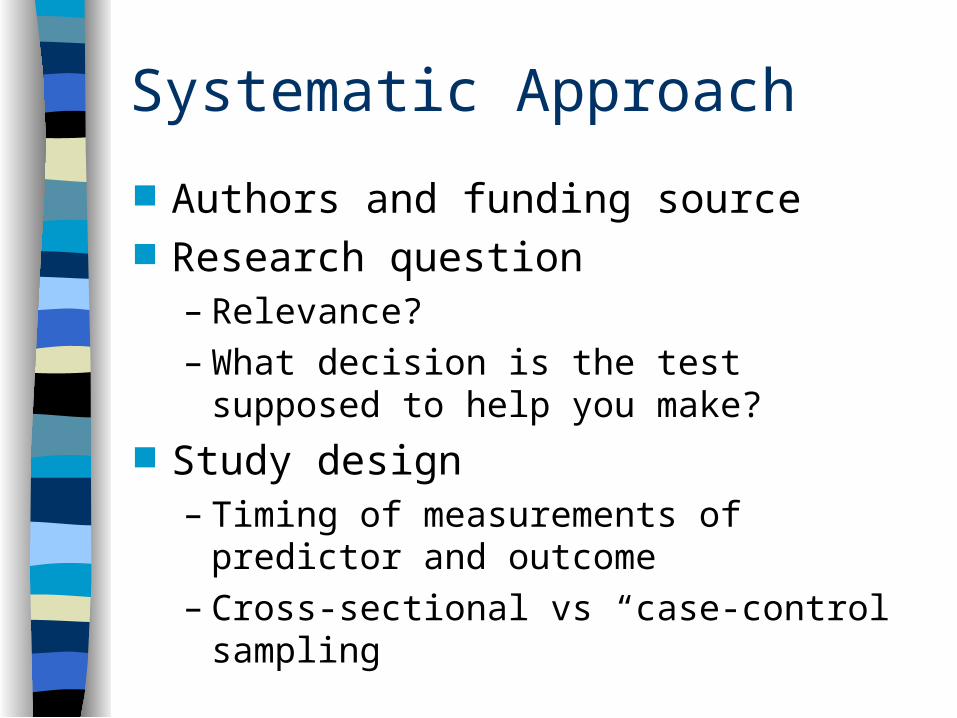
Systematic Approach
Authors and funding source Research question
– Relevance?– What decision is the test supposed to help
you make? Study design
– Timing of measurements of predictor and outcome
– Cross-sectional vs “case-control sampling
Systematic Approach, cont’d
Study subjects– Disease subjects representative?– Nondiseased subjects representative?– If not, in what direction will results be affected?
Predictor variable– How was the test done? – Is it difficult?– Will it be done as well in your setting?
Systematic Approach, cont’d Outcome variable
– Is the “Gold Standard” really gold?– Were those measuring it blinded to results of the
index test? Results & Analysis
– Were all subjects analyzed– If predictive value was reported, is prevalence
similar to your population– Would clinical implications change depending on
location of true result within confidence intervals? Conclusions
– Do they go beyond data?– Do they apply to patients in your setting?
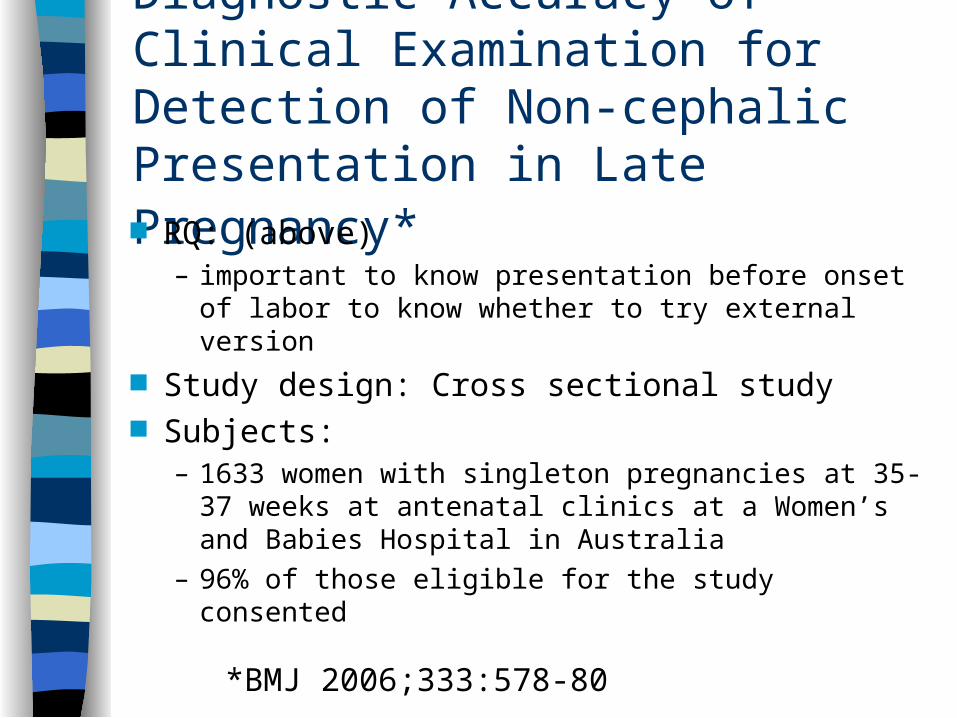
Diagnostic Accuracy of Clinical Examination for Detection of Non-cephalic Presentation in Late Pregnancy* RQ: (above)
– important to know presentation before onset of labor to know whether to try external version
Study design: Cross sectional study Subjects:
– 1633 women with singleton pregnancies at 35-37 weeks at antenatal clinics at a Women’s and Babies Hospital in Australia
– 96% of those eligible for the study consented
*BMJ 2006;333:578-80
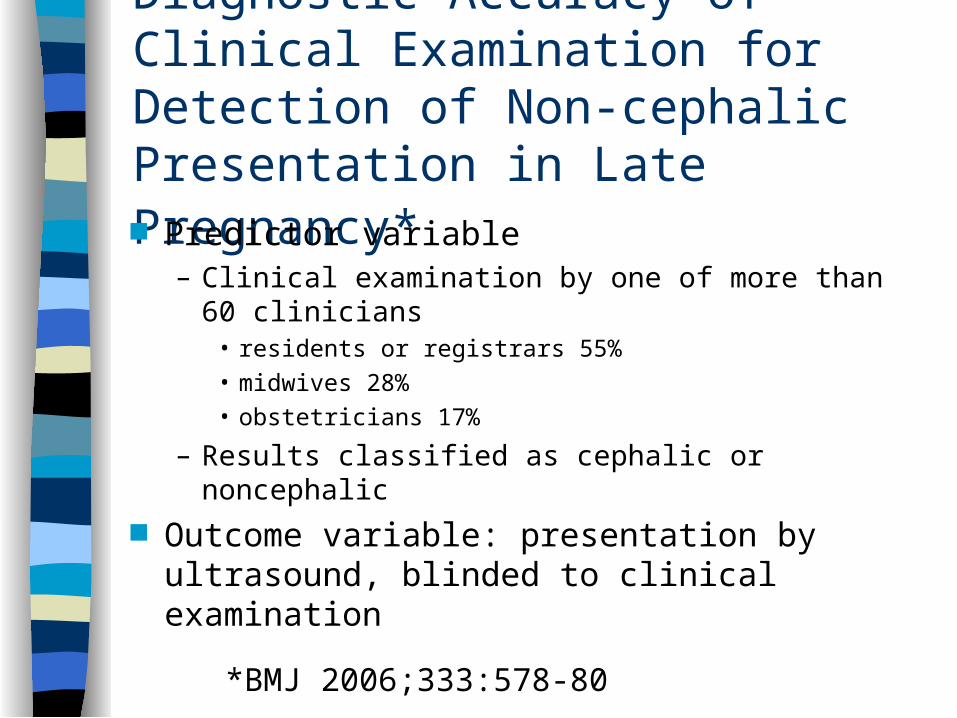
Diagnostic Accuracy of Clinical Examination for Detection of Non-cephalic Presentation in Late Pregnancy* Predictor variable
– Clinical examination by one of more than 60 clinicians
• residents or registrars 55%• midwives 28%• obstetricians 17%
– Results classified as cephalic or noncephalic Outcome variable: presentation by
ultrasound, blinded to clinical examination
*BMJ 2006;333:578-80
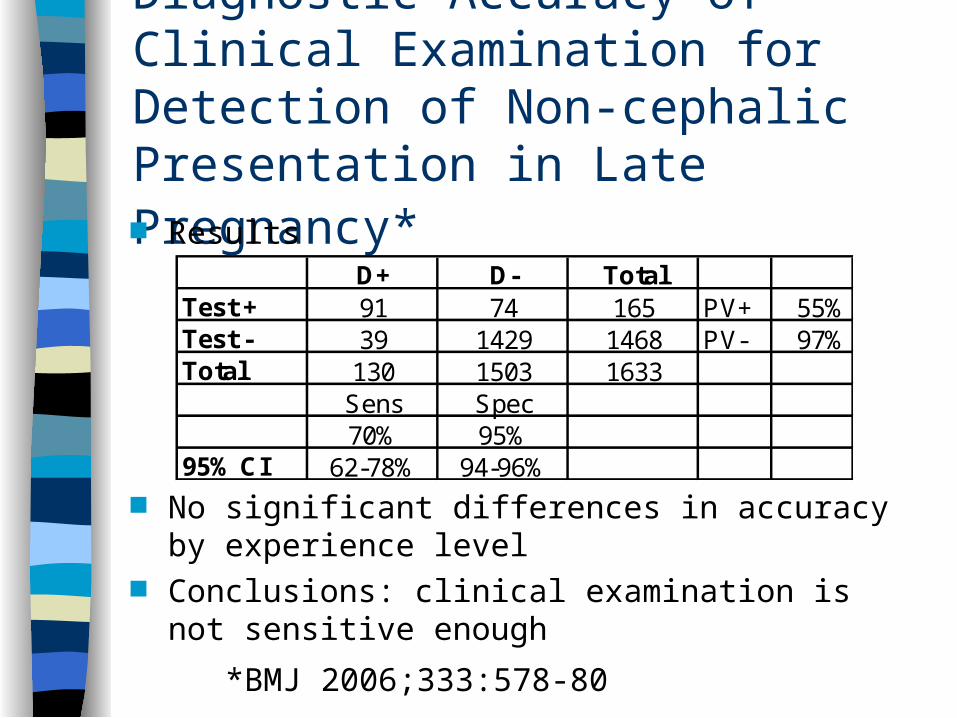
Diagnostic Accuracy of Clinical Examination for Detection of Non-cephalic Presentation in Late Pregnancy* Results
No significant differences in accuracy by experience level
Conclusions: clinical examination is not sensitive enough
*BMJ 2006;333:578-80
D+ D- TotalTest + 91 74 165 PV+ 55%Test - 39 1429 1468 PV- 97%Total 130 1503 1633
Sens Spec70% 95%
95% CI 62-78% 94-96%
Diagnostic Accuracy of Clinical Examination for Detection of Non-cephalic Presentation in Late Pregnancy: Issues: Issues* RQ Subjects Predictor Outcome Results Conclusions – what decision was the test
supposed to help with?
*BMJ 2006;333:578-80
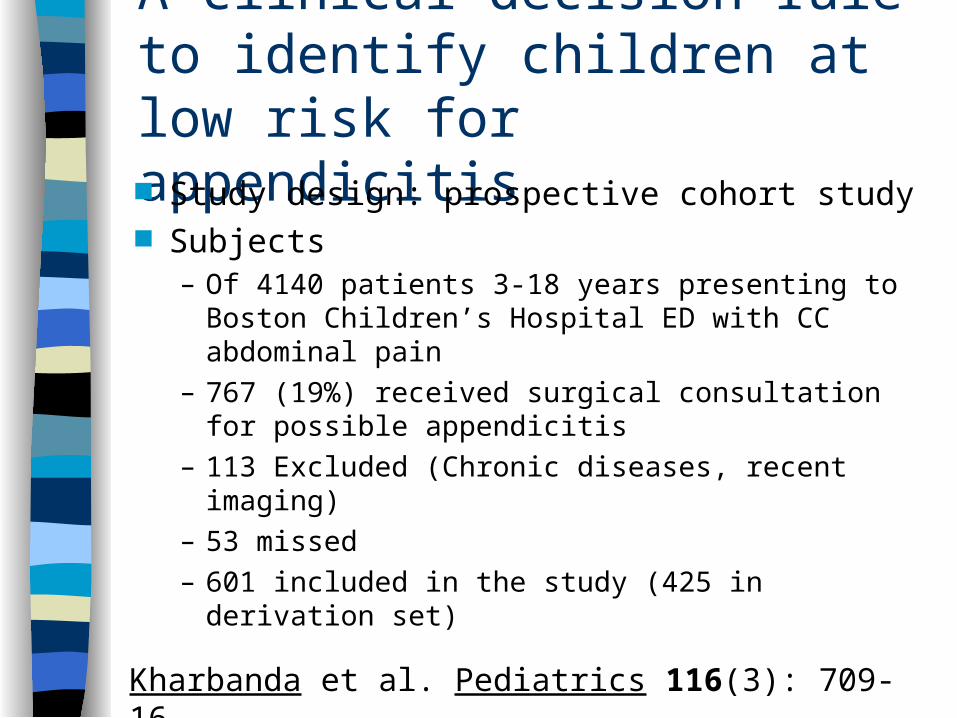
A clinical decision rule to identify children at low risk for appendicitis Study design: prospective cohort study Subjects
– Of 4140 patients 3-18 years presenting to Boston Children’s Hospital ED with CC abdominal pain
– 767 (19%) received surgical consultation for possible appendicitis
– 113 Excluded (Chronic diseases, recent imaging)– 53 missed– 601 included in the study (425 in derivation set)
Kharbanda et al. Pediatrics 116(3): 709-16
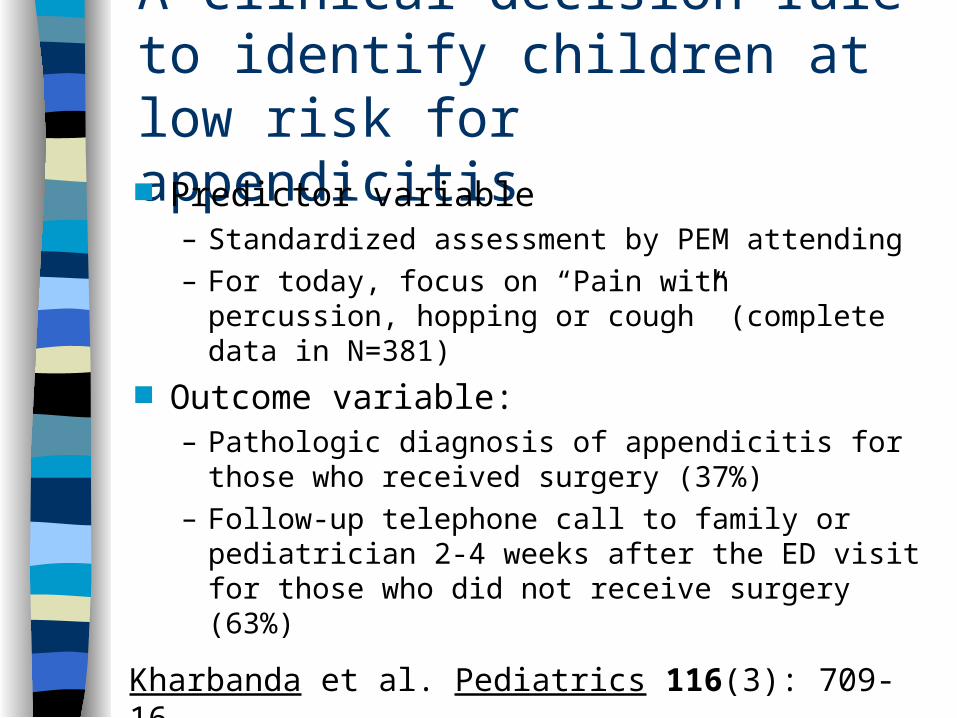
A clinical decision rule to identify children at low risk for appendicitis Predictor variable
– Standardized assessment by PEM attending– For today, focus on “Pain with percussion, hopping
or cough” (complete data in N=381) Outcome variable:
– Pathologic diagnosis of appendicitis for those who received surgery (37%)
– Follow-up telephone call to family or pediatrician 2-4 weeks after the ED visit for those who did not receive surgery (63%)
Kharbanda et al. Pediatrics 116(3): 709-16
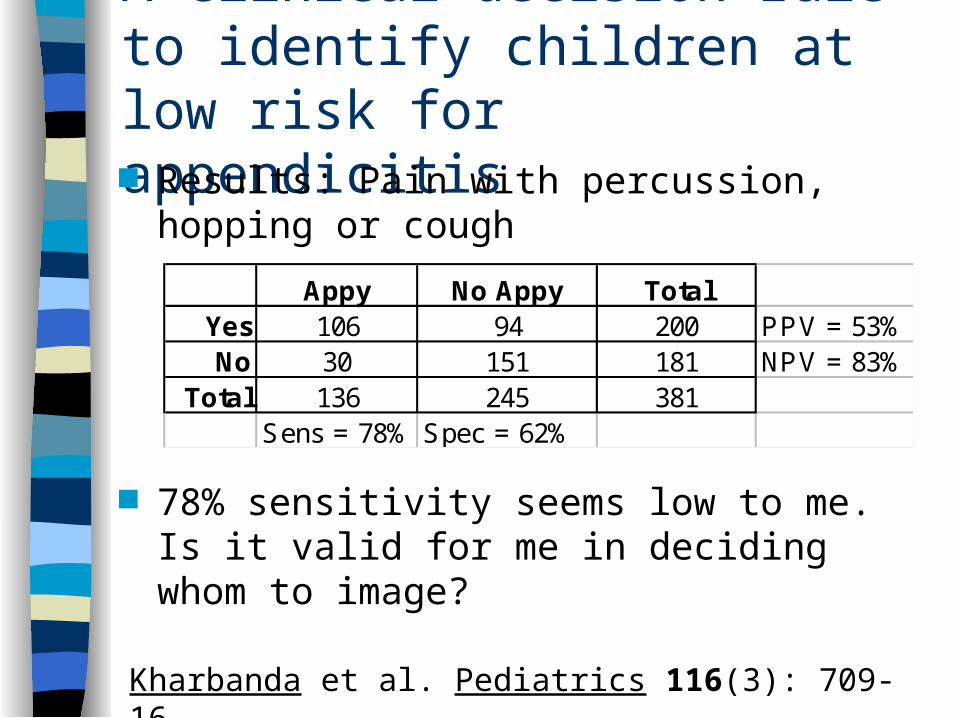
A clinical decision rule to identify children at low risk for appendicitis Results: Pain with percussion, hopping or
cough
78% sensitivity seems low to me. Is it valid for me in deciding whom to image?
Kharbanda et al. Pediatrics 116(3): 709-16
Appy No Appy TotalYes 106 94 200 PPV = 53%No 30 151 181 NPV = 83%
Total 136 245 381Sens = 78% Spec = 62%
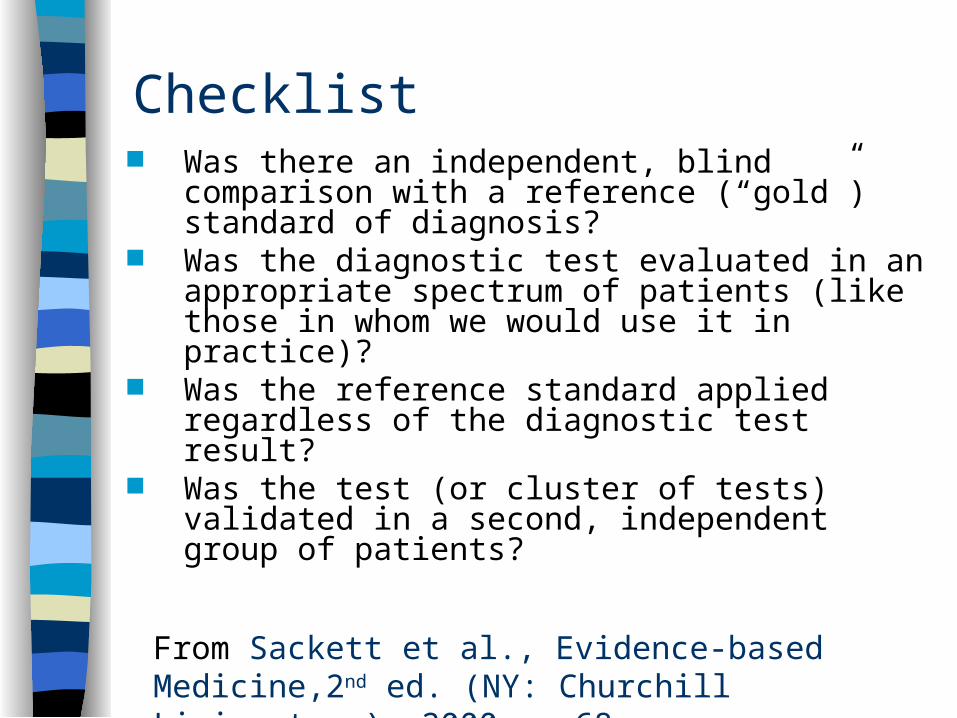
Checklist Was there an independent, blind
comparison with a reference (“gold”) standard of diagnosis?
Was the diagnostic test evaluated in an appropriate spectrum of patients (like those in whom we would use it in practice)?
Was the reference standard applied regardless of the diagnostic test result?
Was the test (or cluster of tests) validated in a second, independent group of patients?
From Sackett et al., Evidence-based Medicine,2nd ed. (NY: Churchill Livingstone), 2000. p 68
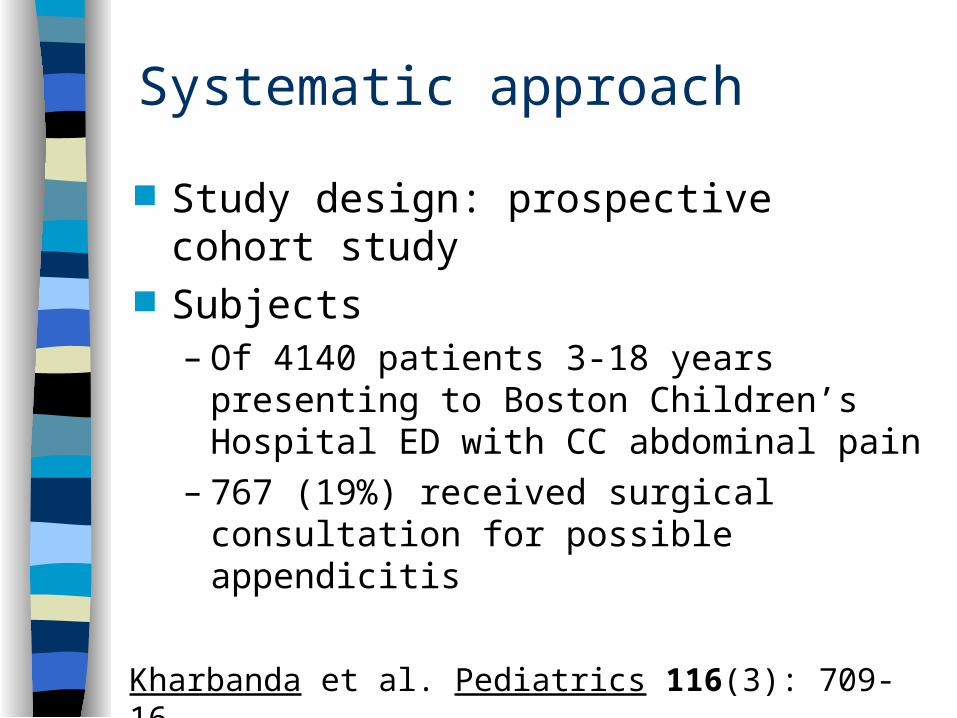
Systematic approach
Study design: prospective cohort study Subjects
– Of 4140 patients 3-18 years presenting to Boston Children’s Hospital ED with CC abdominal pain
– 767 (19%) received surgical consultation for possible appendicitis
Kharbanda et al. Pediatrics 116(3): 709-16
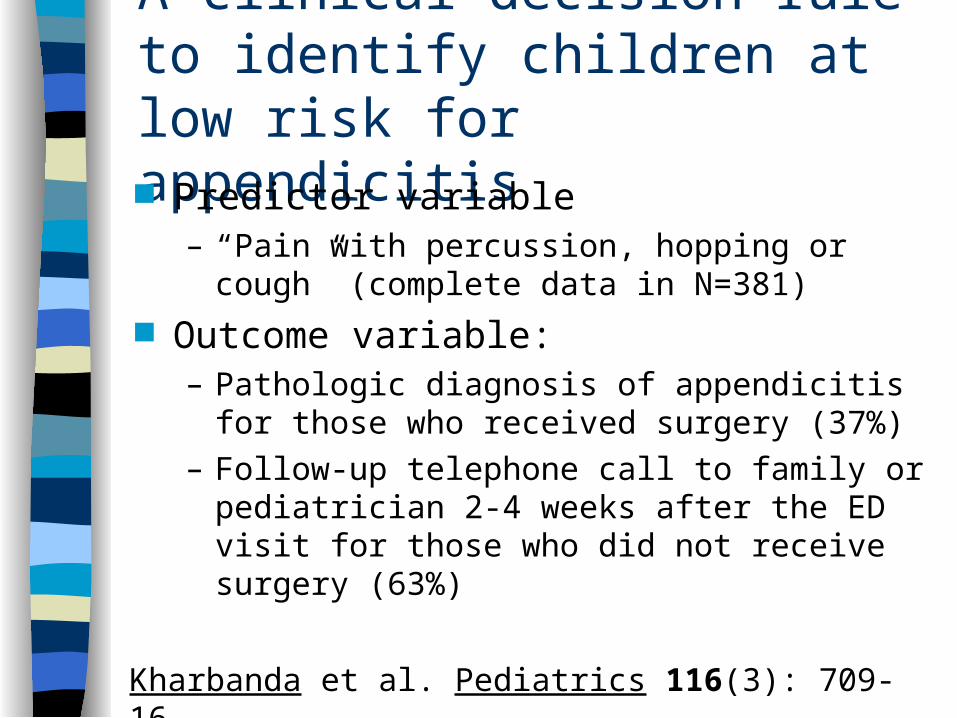
A clinical decision rule to identify children at low risk for appendicitis Predictor variable
– “Pain with percussion, hopping or cough” (complete data in N=381)
Outcome variable: – Pathologic diagnosis of appendicitis for those who
received surgery (37%)– Follow-up telephone call to family or pediatrician
2-4 weeks after the ED visit for those who did not receive surgery (63%)
Kharbanda et al. Pediatrics 116(3): 709-16
Issues
Sample representative? Verification bias? Double-gold standard bias? Spectrum bias
For children presenting with abdominal pain to SFGH 6-M
Sensitivity probably valid (not falsely low)– But whether all of them tried to hop is not
clear Specificity probably low PPV is high NPV is low