Embed Size (px)
Citation preview
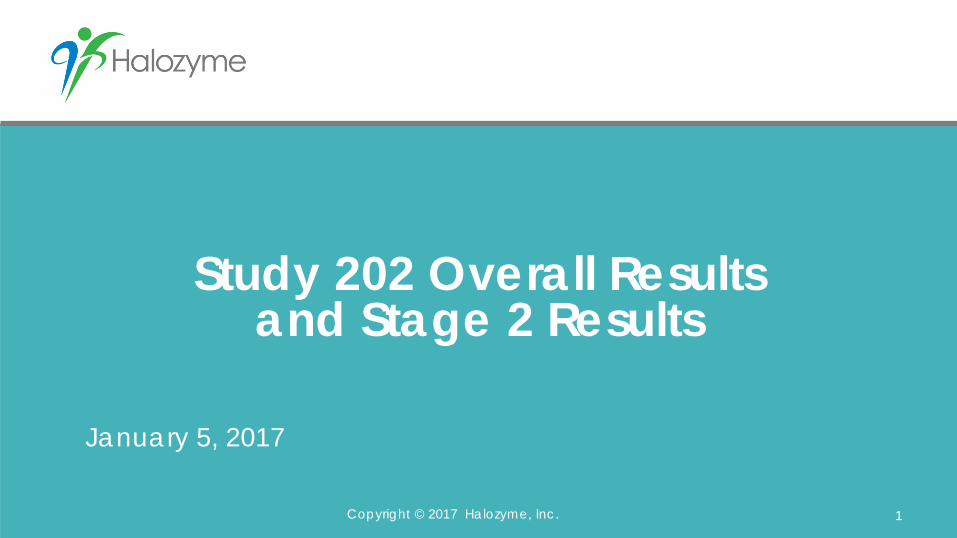
Study 202 Overall Results and Stage 2 Results
January 5, 2017
1Copyright © 2017 Halozyme, Inc.
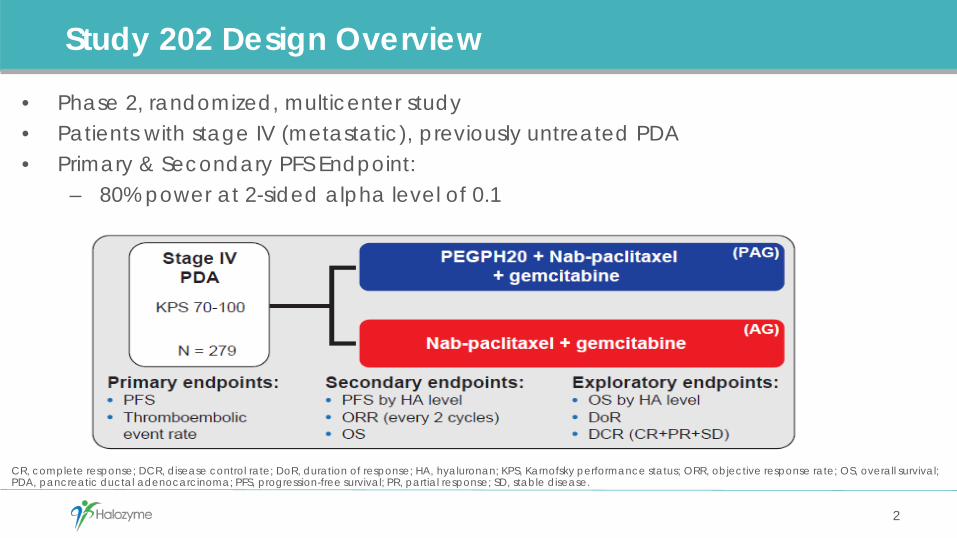
Study 202 Design Overview
2
• Phase 2, randomized, multicenter study • Patients with stage IV (metastatic), previously untreated PDA• Primary & Secondary PFS Endpoint:
– 80% power at 2-sided alpha level of 0.1
CR, complete response; DCR, disease control rate; DoR, duration of response; HA, hyaluronan; KPS, Karnofsky performance status; ORR, objective response rate; OS, overall survival; PDA, pancreatic ductal adenocarcinoma; PFS, progression-free survival; PR, partial response; SD, stable disease.
Halozyme/Ventana HA Companion Diagnostic (CDx)
3
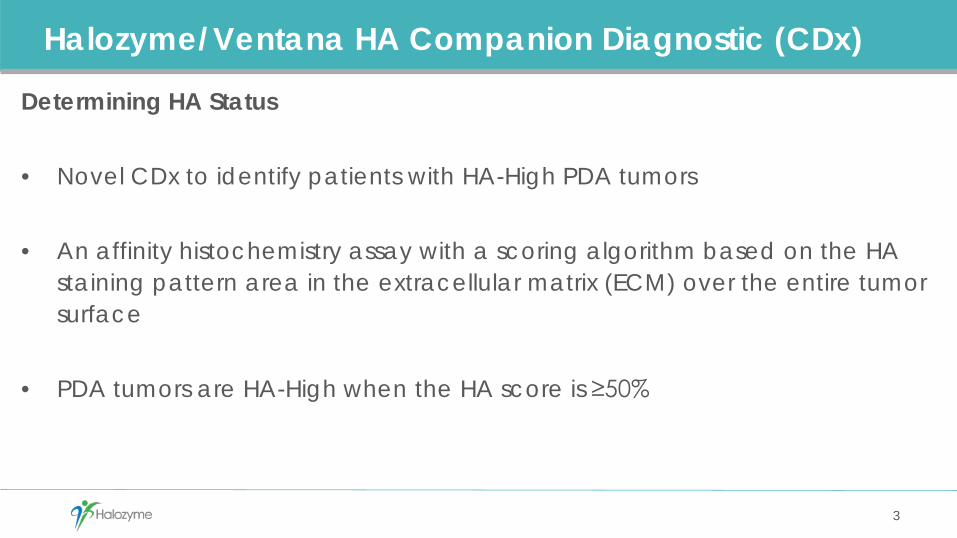
Determining HA Status
• Novel CDx to identify patients with HA-High PDA tumors
• An affinity histochemistry assay with a scoring algorithm based on the HA staining pattern area in the extracellular matrix (ECM) over the entire tumor surface
• PDA tumors are HA-High when the HA score is ≥50%

Study 202 Study Timeline
4
2013 2014 2015 2016
Mar April Aug Feb Dec
Stage 1: n=146
• Training Set for CDx
• Develop Ventana HA scoring algorithm and cut-point
• ~40% HA High patients treated on PAG arm discontinued PEGPH20 at the clinical hold
• Presented at ASCO 2016
Enrollment Clinical Hold
Protocol Amendment Hold Lifted
Stage 2: n=133
• Validation Set for CDx
• Prospectively validate Ventana HA scoring algorithm and cut-point used in Phase 3 study
• To be presented at Scientific Forum 2017
Enrollment Follow up Data Readout

Study 202: Modifications Since Stage 1 Clinical Hold
5
Statistical Analysis Plan
Planned Analysis Populations:- Intent-to-Treat: Combined Stage 1 + Stage 2 efficacy analyses- Efficacy Evaluable (requires post baseline assessment): Primary
endpoint (PFS) - Treated population: Separate analyses of Stage 1 and Stage 2
PFS event definition to include deaths occurring within 14 days of laststudy treatment
Protocol Added Stage 2 Cohort:- 2:1 PAG to AG randomization- Excluded high TE risk patients- Added Low Molecular Weight Heparin prophylaxis to both arms - Added primary endpoint: rate of TE events in PAG patients
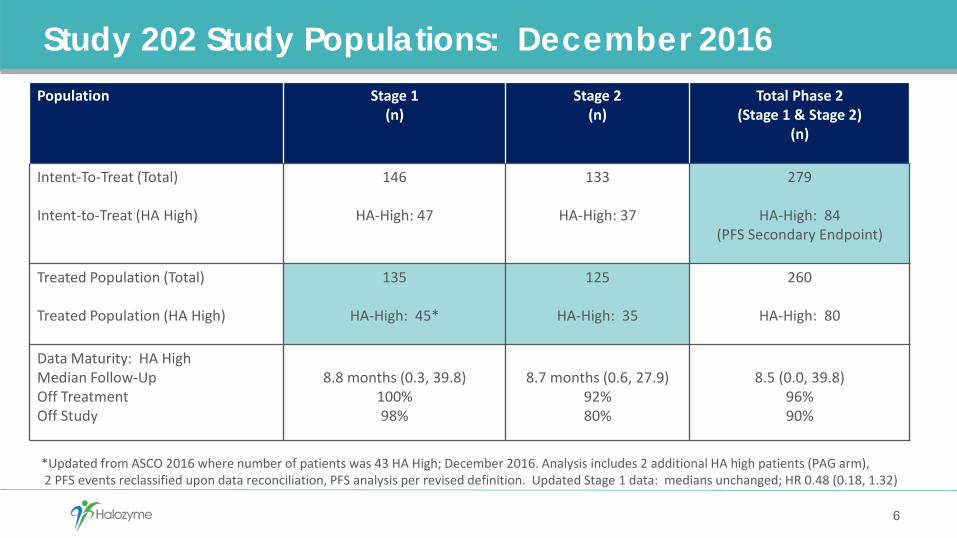
Study 202 Study Populations: December 2016
6
Population Stage 1(n)
Stage 2(n)
Total Phase 2(Stage 1 & Stage 2)
(n)
Intent-To-Treat (Total)
Intent-to-Treat (HA High)
146
HA-High: 47
133
HA-High: 37
279
HA-High: 84(PFS Secondary Endpoint)
Treated Population (Total)
Treated Population (HA High)
135
HA-High: 45*
125
HA-High: 35
260
HA-High: 80
Data Maturity: HA HighMedian Follow-UpOff TreatmentOff Study
8.8 months (0.3, 39.8)100%98%
8.7 months (0.6, 27.9)92%80%
8.5 (0.0, 39.8)96%90%
*Updated from ASCO 2016 where number of patients was 43 HA High; December 2016. Analysis includes 2 additional HA high patients (PAG arm), 2 PFS events reclassified upon data reconciliation, PFS analysis per revised definition. Updated Stage 1 data: medians unchanged; HR 0.48 (0.18, 1.32)
Study 202 Efficacy Summary
7
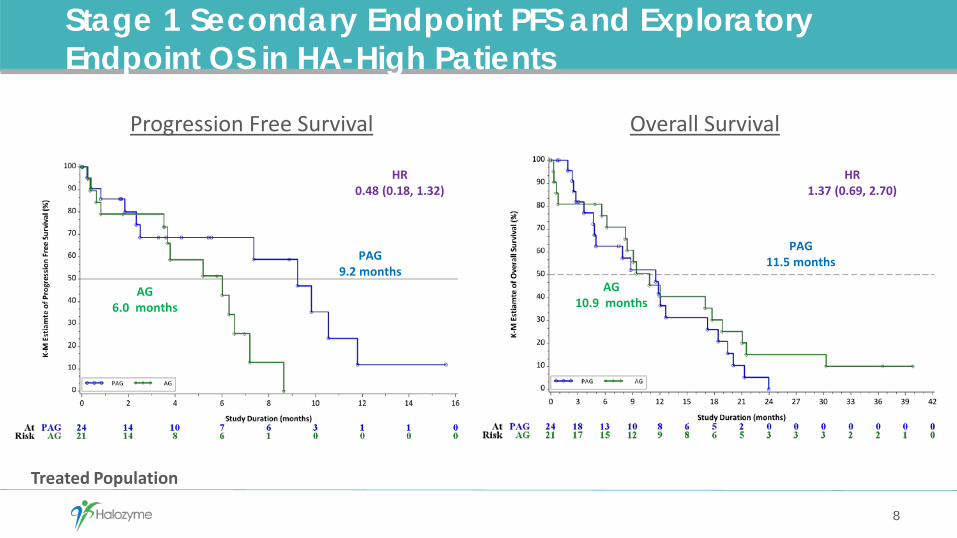
Stage 1 Secondary Endpoint PFS and Exploratory Endpoint OS in HA-High Patients
8
AG 10.9 months
AG 6.0 months
PAG 9.2 months
PAG 11.5 months
HR0.48 (0.18, 1.32)
HR1.37 (0.69, 2.70)
Progression Free Survival Overall Survival
Treated Population

Stage 2 Secondary Endpoint PFS and Exploratory Endpoint OS in HA-High Patients
9
AG 7.8 months
AG 4.5 months
PAG 8.6 months
PAG 11.7 months
HR0.63 (0.21, 1.93)
HR0.52 (0.22, 1.23)
Progression Free Survival Overall Survival
Treated Population

Study 202 (Stage 1 + Stage 2) Secondary Endpoint PFS and Exploratory Endpoint OS in HA-High Patients
10
AG 8.5 months
AG 5.2 months
PAG 9.2 months
PAG 11.5 months
HR: 0.51 (0.26, 1.00);P value: 0.048
HR0.96 (0.57, 1.61)
Progression Free Survival Overall Survival
ITT Population

Stage 2 Data
11
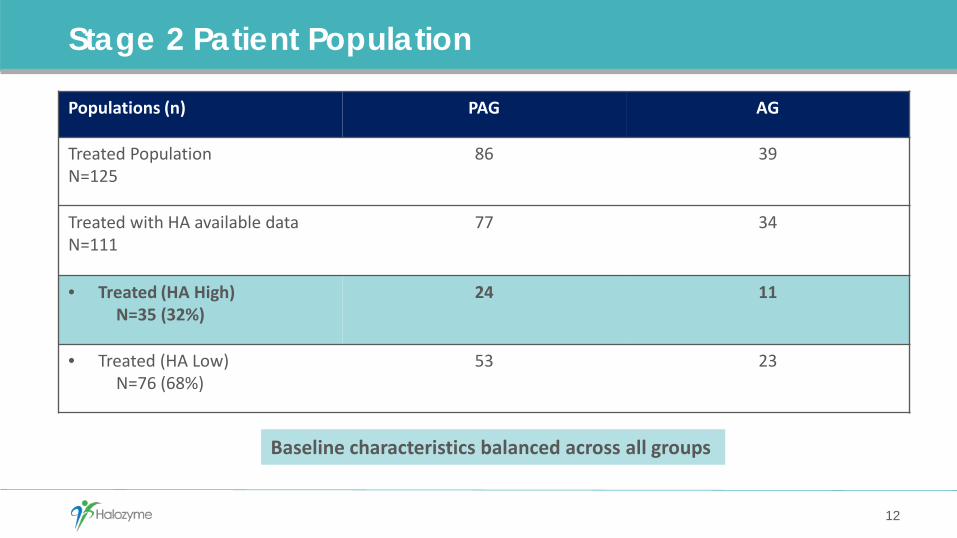
Stage 2 Patient Population
12
Populations (n) PAG AG
Treated Population N=125
86 39
Treated with HA available data N=111
77 34
• Treated (HA High)N=35 (32%)
24 11
• Treated (HA Low)N=76 (68%)
53 23
Baseline characteristics balanced across all groups
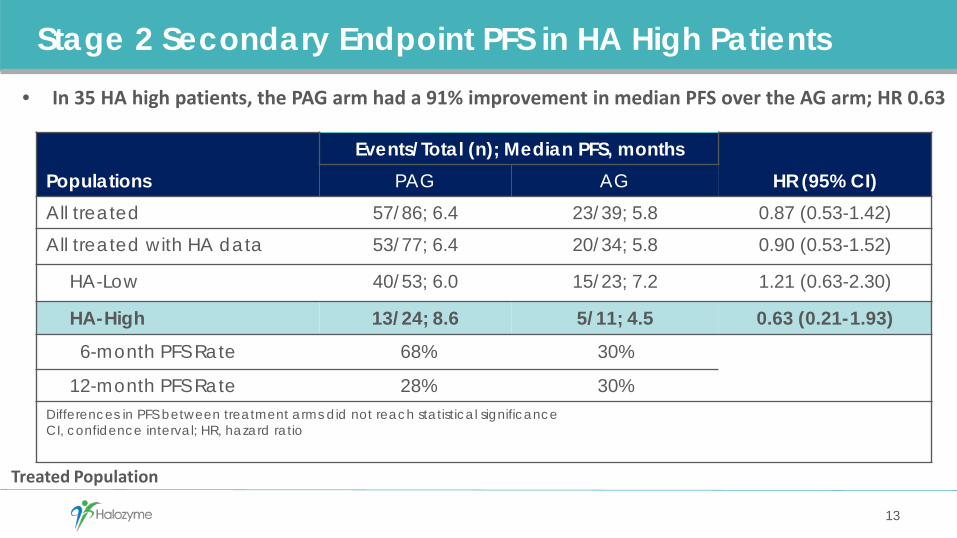
Stage 2 Secondary Endpoint PFS in HA High Patients
13
• In 35 HA high patients, the PAG arm had a 91% improvement in median PFS over the AG arm; HR 0.63
PopulationsEvents/Total (n); Median PFS, months
HR (95% CI)PAG AG
All treated 57/86; 6.4 23/39; 5.8 0.87 (0.53-1.42)
All treated with HA data 53/77; 6.4 20/34; 5.8 0.90 (0.53-1.52)
HA-Low 40/53; 6.0 15/23; 7.2 1.21 (0.63-2.30)
HA-High 13/24; 8.6 5/11; 4.5 0.63 (0.21-1.93)6-month PFS Rate 68% 30%
12-month PFS Rate 28% 30%Differences in PFS between treatment arms did not reach statistical significanceCI, confidence interval; HR, hazard ratio
Treated Population
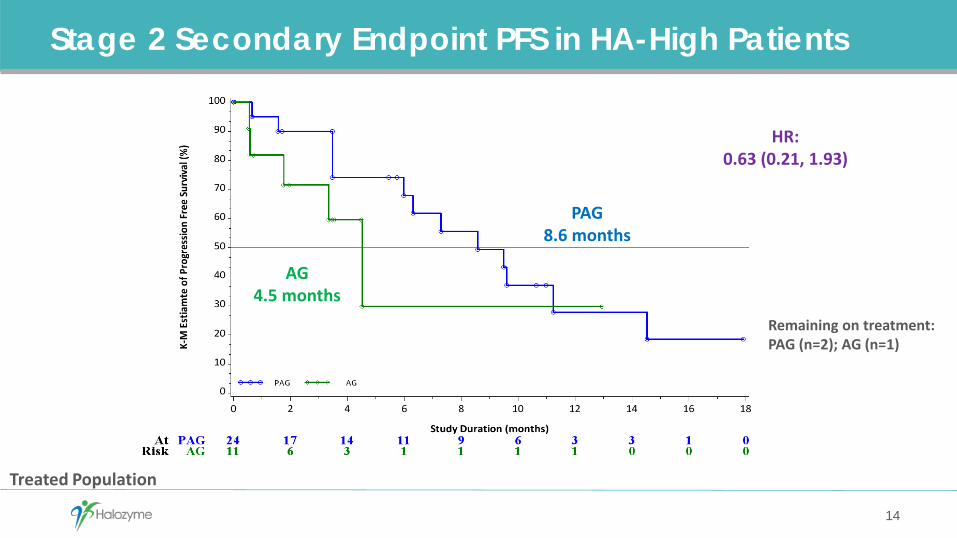
Stage 2 Secondary Endpoint PFS in HA-High Patients
14
Treated Population
Remaining on treatment:PAG (n=2); AG (n=1)
PAG 8.6 months
HR:0.63 (0.21, 1.93)
AG 4.5 months
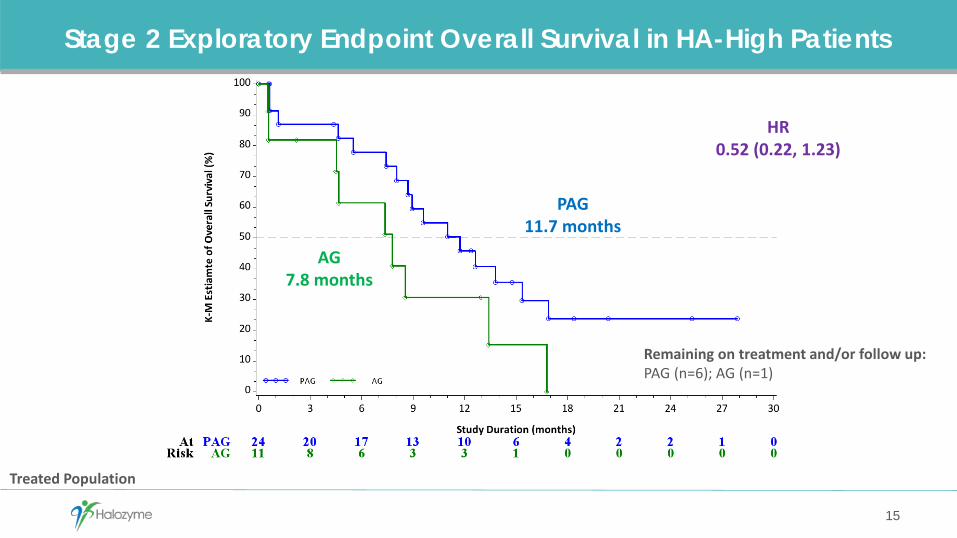
Stage 2 Exploratory Endpoint Overall Survival in HA-High Patients
15
Treated Population
Remaining on treatment and/or follow up:PAG (n=6); AG (n=1)
HR0.52 (0.22, 1.23)
PAG 11.7 months
AG 7.8 months

Stage 2 PFS and OS Results Support HA High As A Potential Predictive and Prognostic Biomarker
16
n = 24PFS: 8.6 months
OS: 11.7 months
n = 11PFS: 4.5 months
OS: 7.8 months
PAG AG
HA-High
HA-Low
n = 53PFS: 6.0 months
OS: 11.9 months
n = 23PFS: 7.2 months
OS: 10.2 months
HR = 0.63
HR = 0.52
HR = 1.21
HR = 0.69
Treated Population
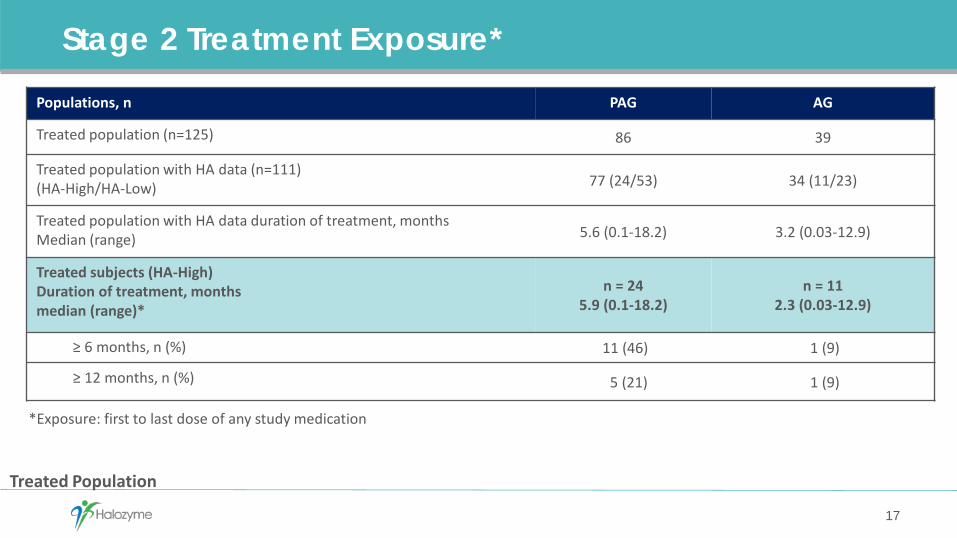
Stage 2 Treatment Exposure*
17
Populations, n PAG AG
Treated population (n=125) 86 39
Treated population with HA data (n=111)(HA-High/HA-Low) 77 (24/53) 34 (11/23)
Treated population with HA data duration of treatment, monthsMedian (range) 5.6 (0.1-18.2) 3.2 (0.03-12.9)
Treated subjects (HA-High)Duration of treatment, monthsmedian (range)*
n = 245.9 (0.1-18.2)
n = 112.3 (0.03-12.9)
≥ 6 months, n (%) 11 (46) 1 (9)
≥ 12 months, n (%) 5 (21) 1 (9)
*Exposure: first to last dose of any study medication
Treated Population

Stage 2 Treatment-Related Adverse Events (AEs) in ≥ 25% of Patients
18
Preferred Term
PAG (n = 86)Patients, n (%)
AG (n = 39)Patients, n (%)
Any Grade Grade ≥ 3 Any Grade Grade ≥ 3
Any AE 84 (97.7) 74 (86.0) 37 (94.9) 30 (76.9)
Fatigue 63 (73.3) 18 (20.9) 24 (61.5) 5 (12.8)Peripheral edema 57 (66.3) 6 ( 7.0) 7 (17.9) 0 ( 0.0)Muscle spasms 48 (55.8) 14 (16.3) 2 ( 5.1) 1 ( 2.6)Alopecia 36 (41.9) 1 ( 1.2) 14 (35.9) 0 ( 0.0)Anemia 36 (41.9) 12 (14.0) 14 (35.9) 10 (25.6)Nausea 36 (41.9) 3 ( 3.5) 16 (41.0) 2 ( 5.1)Diarrhea 33 (38.4) 5 ( 5.8) 15 (38.5) 3 ( 7.7)Decreased appetite 32 (37.2) 3 ( 3.5) 11 (28.2) 0 ( 0.0)Neutropenia 32 (37.2) 28 (32.6) 10 (25.6) 9 (23.1)Neuropathy peripheral 30 (34.9) 6 ( 7.0) 13 (33.3) 3 ( 7.7)Thrombocytopenia 28 (32.6) 16 (18.6) 7 (17.9) 2 ( 5.1)ALT increased 25 (29.1) 16 (18.6) 3 (7.7) 3 (7.7)Dysgeusia 25 (29.1) 0 9 (23.1) 0Myalgia 23 (26.7) 5 (5.8) 2 (5.1) 0Platelet Count Decreased 23 (26.7) 5 (5.8) 3 (7.7) 2 (5.1)Vomiting 22 (25.6) 1 (1.2) 11 (28.2) 2 (5.1)

Stage 2 Select Grade 3+ Laboratory Abnormalities: September 2016
19
Hematologic LaboratoryAbnormalities
PAGn = 86n (%)
AGn = 39n (%)
Anemia 20 (23) 11 (28)
Thrombocytopenia 14 (16) 5 (13)
Neutropenia 42 (49) 17 (44)
Hepatic LaboratoryAbnormalities
PAGn = 86n (%)
AGn = 39n (%)
ALT increased 13 (15) 3 (8)
AST increased 6 (7) 5 (13)
Total Bilirubin increased 3 (4) 4 (10)

Stage 2 Incidence of Thromboembolic (TE) Events
20
Enoxaparin Prophylaxis Dose
TE Rate
PAG AG
Stage 1*(Dec 2016) N/A
43%(32/74)
25%(15/61)
HAhigh: 42%(10/24)
HAhigh: 24%(5/21)
HAlow: 46%(21/46)
HAlow: 28%(9/32)
Stage 2**(Dec 2016)
Started with40 mg/day
28%(5/18)
29%(2/7)
Started on 1 mg/kg/day
10%(7/68)
6%(2/32)
*Stage 1 data reflects additional biopsies collected: 2 HA-High (2 PAG); and 3 HA-Low (2 PAG; 1 AG)**TE rates for all stage 2 patients are 14% (12/86) in PAG arm and 10% (4/39) in AG arm
Treated Population

Study 202 (Stage 1 and Stage 2 Data)
21
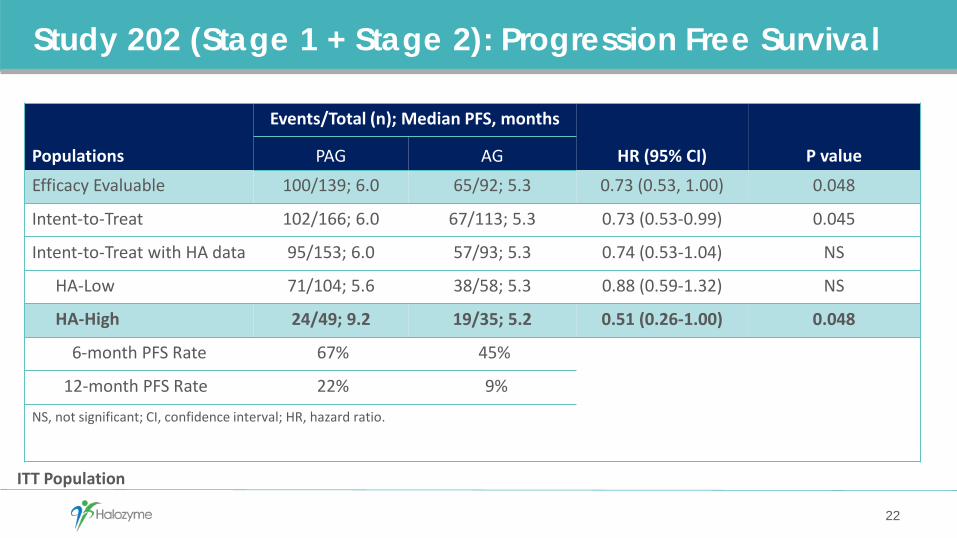
Study 202 (Stage 1 + Stage 2): Progression Free Survival
Populations
Events/Total (n); Median PFS, months
HR (95% CI) P valuePAG AGEfficacy Evaluable 100/139; 6.0 65/92; 5.3 0.73 (0.53, 1.00) 0.048
Intent-to-Treat 102/166; 6.0 67/113; 5.3 0.73 (0.53-0.99) 0.045
Intent-to-Treat with HA data 95/153; 6.0 57/93; 5.3 0.74 (0.53-1.04) NS
HA-Low 71/104; 5.6 38/58; 5.3 0.88 (0.59-1.32) NS
HA-High 24/49; 9.2 19/35; 5.2 0.51 (0.26-1.00) 0.048
6-month PFS Rate 67% 45%
12-month PFS Rate 22% 9%
NS, not significant; CI, confidence interval; HR, hazard ratio.
22
ITT Population

Study 202 (Stage 1 + Stage 2) Secondary Endpoint: PFS in HA-High Patients
23
PAG 9.2 months
HR: 0.51 (0.26, 1.00);P value: 0.048
Remaining on treatment:PAG (n=2); AG (n=1)
AG 5.2 months
ITT Population

Study 202 (Stage 1 + Stage 2) PFS by HA Cut-point Using VentanaAssay
24
50% HA High Cutoff Shows Robust SignalHA cutoff levelVentana Assay
Combined Study 202 DataPAG arm
Events/PatientsMedian
Combined Study 202 DataAG arm
Events/PatientsMedian
≥75% 9/189.2 months
10/153.8 months
≥ 50% 24/499.2 months
19/355.2 months
<50% 71/1045.6 months
38/585.3 months
ITT Population
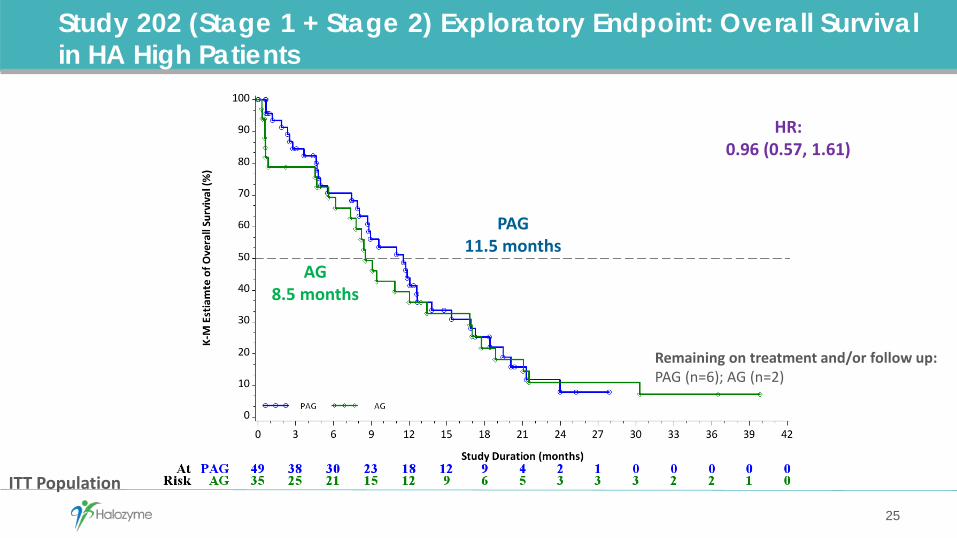
Study 202 (Stage 1 + Stage 2) Exploratory Endpoint: Overall Survival in HA High Patients
25
ITT Population
Remaining on treatment and/or follow up:PAG (n=6); AG (n=2)
AG 8.5 months
PAG 11.5 months
HR:0.96 (0.57, 1.61)

Study 202 (Stage 1 + Stage 2): Treatment Exposure*
26
Populations, n PAG AG
Treated Population (n=260) 160 100
Treated Population with HA data (n=234)(HA-High/HA-Low) 147 (48/99) 87 (32/55)
Treated subjects (HA-High)Duration of treatment, monthsmedian (range)
n = 483.3 (0.1-18.2)
n = 323.2 (0.03-12.9)
≥ 6 months, n (%) 19 (40) 3 (9)
≥ 12 months, n (%) 6 (13) 1 (3)
*Exposure: first to last dose of any study medication
Treated Population
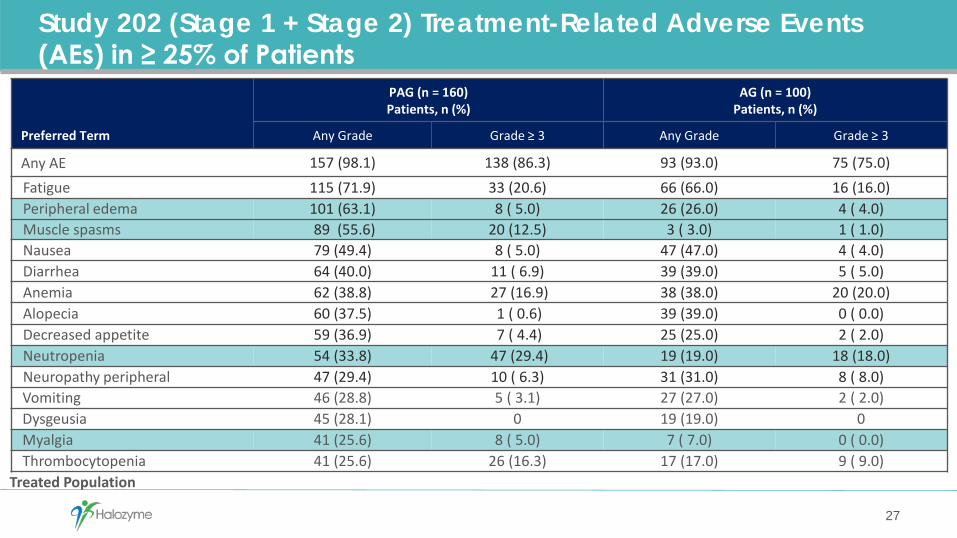
Study 202 (Stage 1 + Stage 2) Treatment-Related Adverse Events (AEs) in ≥ 25% of Patients
27
Preferred Term
PAG (n = 160)Patients, n (%)
AG (n = 100)Patients, n (%)
Any Grade Grade ≥ 3 Any Grade Grade ≥ 3
Any AE 157 (98.1) 138 (86.3) 93 (93.0) 75 (75.0)Fatigue 115 (71.9) 33 (20.6) 66 (66.0) 16 (16.0)Peripheral edema 101 (63.1) 8 ( 5.0) 26 (26.0) 4 ( 4.0)Muscle spasms 89 (55.6) 20 (12.5) 3 ( 3.0) 1 ( 1.0)Nausea 79 (49.4) 8 ( 5.0) 47 (47.0) 4 ( 4.0)Diarrhea 64 (40.0) 11 ( 6.9) 39 (39.0) 5 ( 5.0)Anemia 62 (38.8) 27 (16.9) 38 (38.0) 20 (20.0)Alopecia 60 (37.5) 1 ( 0.6) 39 (39.0) 0 ( 0.0)Decreased appetite 59 (36.9) 7 ( 4.4) 25 (25.0) 2 ( 2.0)Neutropenia 54 (33.8) 47 (29.4) 19 (19.0) 18 (18.0)Neuropathy peripheral 47 (29.4) 10 ( 6.3) 31 (31.0) 8 ( 8.0)Vomiting 46 (28.8) 5 ( 3.1) 27 (27.0) 2 ( 2.0)Dysgeusia 45 (28.1) 0 19 (19.0) 0Myalgia 41 (25.6) 8 ( 5.0) 7 ( 7.0) 0 ( 0.0)Thrombocytopenia 41 (25.6) 26 (16.3) 17 (17.0) 9 ( 9.0)
Treated Population

Summary & Conclusions
28
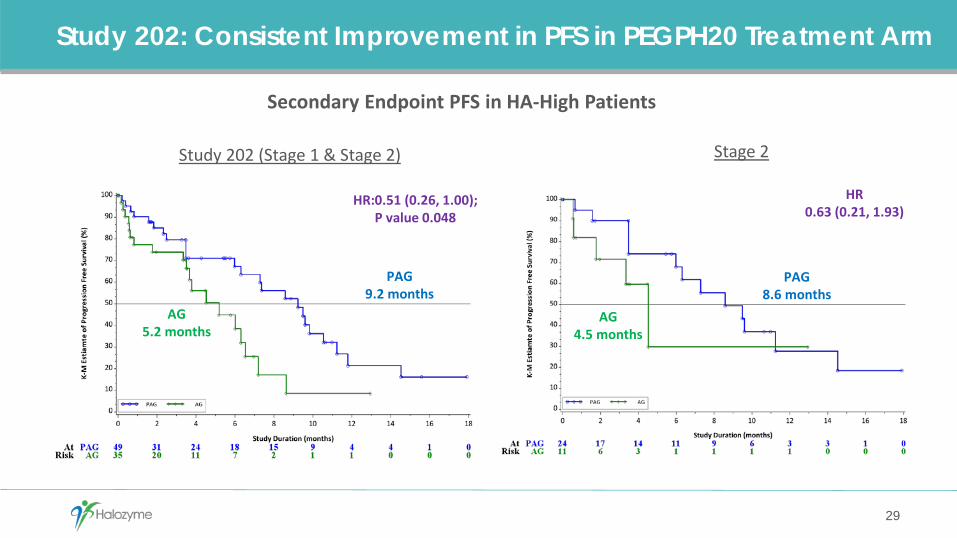
Study 202: Consistent Improvement in PFS in PEGPH20 Treatment Arm
29
AG 5.2 months
PAG 9.2 months
HR:0.51 (0.26, 1.00);P value 0.048
Study 202 (Stage 1 & Stage 2) Stage 2
PAG 8.6 months
AG 4.5 months
HR0.63 (0.21, 1.93)
Secondary Endpoint PFS in HA-High Patients
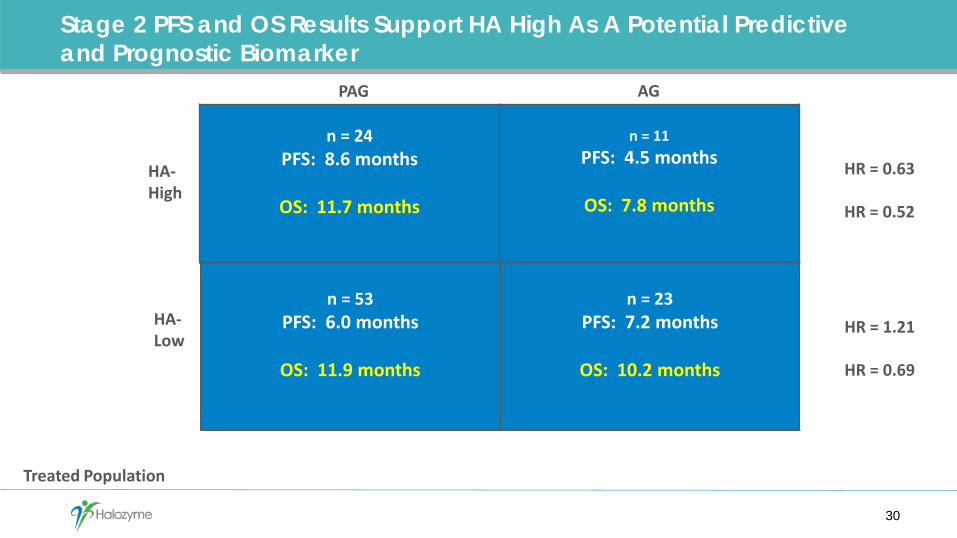
Stage 2 PFS and OS Results Support HA High As A Potential Predictive and Prognostic Biomarker
30
n = 24PFS: 8.6 months
OS: 11.7 months
n = 11PFS: 4.5 months
OS: 7.8 months
PAG AG
HA-High
HA-Low
n = 53PFS: 6.0 months
OS: 11.9 months
n = 23PFS: 7.2 months
OS: 10.2 months
HR = 0.63
HR = 0.52
HR = 1.21
HR = 0.69
Treated Population
Study 202 Conclusions
31
1. Randomized Phase 2 Study 202 met multiple key study objectives– Primary Endpoint (PFS) achieved– Secondary Endpoint (PFS in HA High patients) achieved
2. Stage 2 of Study 202 met primary safety endpoint & shows consistent improvement across PFS and OS in HA High patients
– Primary Safety Endpoint achieved: Decreased TE events with protocol modifications & LMWH prophylaxis – Secondary Endpoint: 91% improvement in median PFS – Exploratory Endpoint: 50% improvement in median OS– HA algorithm and cut-point of ≥ 50% validated
3. Randomized Phase 2 Study 202 results continue to support the Phase 3 HALO 301 trial– Same patient population as Stage 2 with LMWH prophylaxis– Same CDx cutoff as Phase 2 study– Two primary endpoints: PFS (Phase 2 statistically significant); and OS (Stage 2 signal)

Study 202 Overall Results and Stage 2 Results
January 5, 2017
32Copyright © 2017 Halozyme, Inc.