Embed Size (px)
Citation preview
CONGRESS OF THE UNITED STATESCONGRESSIONAL BUDGET OFFICE
S T U D Y

THE CHANGING BUSINESS OF BANKING:A STUDY OF FAILED BANKS
FROM 1987 TO 1992
The Congress of the United StatesCongressional Budget Office

NOTES
Numbers in the text and tables may not add to totals because of rounding.
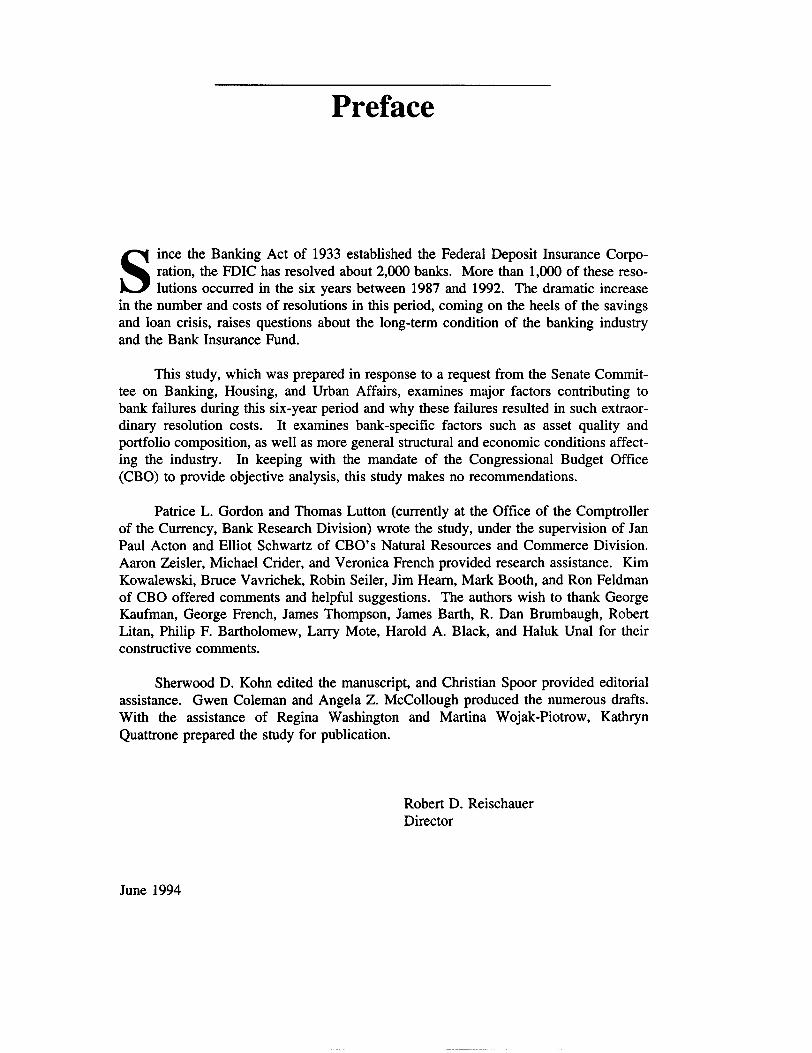
Cover photo shows a run on a bank in New York City in 1987 (The BettmannArchive).
Preface
S ince the Banking Act of 1933 established the Federal Deposit Insurance Corpo-ration, the FDIC has resolved about 2,000 banks. More than 1,000 of these reso-lutions occurred in the six years between 1987 and 1992. The dramatic increase
in the number and costs of resolutions in this period, coming on the heels of the savingsand loan crisis, raises questions about the long-term condition of the banking industryand the Bank Insurance Fund.
This study, which was prepared in response to a request from the Senate Commit-tee on Banking, Housing, and Urban Affairs, examines major factors contributing tobank failures during this six-year period and why these failures resulted in such extraor-dinary resolution costs. It examines bank-specific factors such as asset quality andportfolio composition, as well as more general structural and economic conditions affect-ing the industry. In keeping with the mandate of the Congressional Budget Office(CBO) to provide objective analysis, this study makes no recommendations.
Patrice L. Gordon and Thomas Lutton (currently at the Office of the Comptrollerof the Currency, Bank Research Division) wrote the study, under the supervision of JanPaul Acton and Elliot Schwartz of CBO's Natural Resources and Commerce Division.Aaron Zeisler, Michael Crider, and Veronica French provided research assistance. KimKowalewski, Bruce Vavrichek, Robin Seiler, Jim Hearn, Mark Booth, and Ron Feldmanof CBO offered comments and helpful suggestions. The authors wish to thank GeorgeKaufman, George French, James Thompson, James Earth, R. Dan Brumbaugh, RobertLitan, Philip F. Bartholomew, Larry Mote, Harold A. Black, and Haluk Unal for theirconstructive comments.
Sherwood D. Kohn edited the manuscript, and Christian Spoor provided editorialassistance. Gwen Coleman and Angela Z. McCollough produced the numerous drafts.With the assistance of Regina Washington and Martina Wojak-Piotrow, KathrynQuattrone prepared the study for publication.
Robert D. ReischauerDirector
June 1994

Contents
ONE
TWO
THREE
FOUR
FIVE
SUMMARY
INTRODUCTION
Bank Resolutions in HistoricalPerspective 2
The Economic Costs of BankFailures 6
THE STRUCTURAL TRENDS AND ECONOMICCONDITIONS UNDERLYINGBANK RESOLUTIONS
Enhanced Competition andFinancial Innovation 8
Macroeconomic Conditions, RegionalDisparities, and Asset Losses 14
THE ROLE OF MANAGEMENT ANDINSTITUTION-SPECIFIC FACTORSASSOCIATED WITH RESOLUTIONS
XI
1
19
Management and Bank FailureA Comparison of Resolved and
Surviving Banks 22
19
BANK RESOLUTIONS AND THE COSTSOF RESOLUTION
Resolution Costs as Estimatesof BIF Losses 27
Resolution Costs andRegulatory Effectiveness 29
FDICIA and Prompt Corrective Action 34
AN INDUSTRY OUTLOOK: GUARDEDOPTIMISM
The Exposure of the Bank InsuranceFund to Losses from Bank Resolutions 37
Reforms in FDICIA and SomeRemaining Policy Issues 43
21
31

vi THE CHANGING BUSINESS OF BANKING June 1994
APPENDIXES
A Methods of Evaluating the FinancialCondition of Banks 49
B Types of Resolutions: Data on ResolutionCosts and Bank Resolutions 53
C A Simulation of Embedded Costs 63
CONTENTS vii
TABLES
1. Resolutions by the Federal Deposit InsuranceCorporation, by Region, 1987-1992 14
2. The Incidence of Five Areas of Weakness ThatFigured Prominently in the Decline ofNational Banks Between 1979 and 1987 20
3. Internal Management Factors Contributing tothe Failure of National Banks ResolvedBetween 1979 and 1987 21
4. A Comparison of Portfolio Characteristicsof Small Resolved and Surviving Banks,1987-1989 22
5. Assets, Capitalization, and Profitability: AComparison of Historical Characteristics ofSmall Resolved and Surviving Banks, 1987-1989 23
6. Assets and Capitalization: A Comparison ofAnnual Growth Rates of Small Resolved andSurviving Banks, 1987-1989 24
7. Average Equity-to-Asset Ratios of BanksBefore Resolution by the Federal DepositInsurance Corporation, 1987-1992 35
8. Assets and Resolution Costs of ResolvedBanks, Grouped by Size, 1987-1992 38
9. An Analysis of Banks and Bank AssetsInsured by the Federal Deposit InsuranceCorporation, Grouped by CapitalizationRatios and Asset Size, 1986 and 1992 41
10. Assets and Resolution Costs of ResolvedBanks, Grouped by Size, 1992 and 1993 42
B-l. Summary Statistics for Banks Resolved by theFederal Deposit Insurance Corporation, byType of Resolution, 1987-1992 57
B-2. Number of Banks Resolved by the Federal DepositInsurance Corporation, by Year and Type ofResolution, 1987-1992 58
viii THE CHANGING BUSINESS OF BANKING June 1994
B-3. Resolution Costs as a Percentage of Assetsfor Banks Resolved by the Federal DepositInsurance Corporation, by Year and Typeof Resolution, 1987-1992 59
B-4. Average Asset Size of Banks Resolved by theFederal Deposit Insurance Corporation, byYear and Type of Resolution, 1987-1992 60
B-5. Total Assets of Banks Resolved by the FederalDeposit Insurance Corporation, by Year andType of Resolution, 1987-1992 61
B-6. Resolution Costs of Banks Resolved by the FederalDeposit Insurance Corporation, by Year and Typeof Resolution, 1987-1992 62
C-l. A Five-Year Profile of Some Average FinancialCharacteristics of Banks Resolved in 1990 65
C-2. Resolution Costs and Estimated Embedded LossesUsing Average Characteristics of 1990Resolutions 66
C-3. Three Simulated Cases Involving Embedded Losseson Assets Using Average Characteristics of1990 Resolutions 67
FIGURES
1. Average Annual Number of Bank Failures forSelected Periods Between 1900 and 1992 2
2. Number of Bank Resolutions, 1934-1992 4
3. Average Resolution Costs for Resolved Banks,1934-1992 4
4. Composition of Commercial and Savings BankLiabilities, 1960-1992 9
5. Composition of Commercial and Savings BankLoans and Leases, 1960-1992 10
6. Distribution of Resolved Banks Grouped byRatios of Resolution Costs to Bank Assets,1987-1992 30
CONTENTS ix
7. Distribution of Resolved Banks Grouped byEquity-to-Asset Ratios, Observed at the Endof Year Before Resolution, 1987-1992 33
BOXES
1. The Basics of Bank Regulation and Examination 31
2. An Actuarial Framework: Mortality RatesBased on Capitalization and Asset Size 40

Summary
T he history of banking in the United States islike a volatile stock market, characterizedby wide fluctuations in profitability and
decline. In the 35 years between 1885 and 1920,the number of U.S. banks tripled from 10,000 to30,000. It took only five years-from 1929 through1933-for the number of banks in the industry toshrink by one-half. This period of rapid declinewas associated with deteriorating industries, de-pressed regions, and to some extent with runs onbanks. Concern about the soundness of the industrywas a catalyst for the Banking Acts of 1933 and1934. These acts restricted competition and estab-lished the deposit insurance system.
The 1980s was also a turbulent decade for theU.S. banking industry. It ushered in intense domes-tic and international competition in financial mar-kets. A peculiar confluence of economic forces,technical innovation, and deregulation contributed toan unprecedented number of bank failures and sub-sequent resolutions during the late 1980s and early1990s. During the six years from 1987 through1992, more than 1,000 bank resolutions (commercialand savings banks) cost the Bank Insurance Fund(BIF) about $30 billion, exhausting an $18 billionreserve in the deposit insurance system. The sheernumber of bank failures and the extensive losses tothe deposit insurance fund during the 1987-1992period dwarfed the experience of the previous fivedecades. In conjunction with a crisis in the thriftindustry, the bank failures and losses caused by thebanks' resolutions brought about the first real chal-lenge to the deposit insurance system.
The banking crisis may indeed be over. Butwhat were the underlying causes of the failures, and
why were the costs of resolving these banks somuch higher than those in previous periods? Someof the factors associated with bank failures occur-ring over this six-year period could reemerge andonce again expose some banks to increased risk ofloss. Evidence from this turbulent period may bevaluable in assessing the condition of the industryas it undergoes continued structural change andconsolidation.
Why Did Banks Fail?
Banks failed for many reasons. Local market andmacroeconomic influences, the regulatory environ-ment, and management performance all contributedto the tendency of banks to fail and to the size ofassociated losses. Surveys reveal that fraud andabuse also contributed to failure, but those factorswere primary causes in only 25 percent of the cases.Most banks failed because a significant portion oftheir asset portfolios defaulted; in other words, thesebanks made what turned out to be bad loans.
Many of the problems with loans that becameapparent after the mid-1980s probably originated inthe late 1970s and early 1980s. Two dramaticsurges in inflation during the 1970s changed thebusiness of banking. Both inflationary periods ledto sharp rises in commodity prices, mercurial stockand bond prices, and particularly volatile interestrates. Initially, market interest rates climbed whileregulated interest rates on deposits remained cappedat 5.25 percent. Although ceilings on deposit inter-est rates had been in place for decades, banks had
xii THE CHANGING BUSINESS OF BANKING June 1994
still been able to attract depositors. But once mar-ket interest rates exceeded the caps, depositors be-gan to look elsewhere. By the early 1980s, disinter-mediation—the diversion of savings from accountshaving low interest rates to direct investment inhigh-yielding instruments-had become a problem.
The double-digit interest rates available onmoney market mutual funds, Treasury securities,and other nondepository financial instruments madethem popular alternatives to banks and thrifts.Banks could not legally compete with the productsor rates offered by other financial institutions. Afteran outcry from banks and thrifts, regulated interestrate ceilings were phased out over a six-year period,starting in 1980 with the Depository InstitutionsDeregulation and Monetary Control Act of 1980(DIDMCA). Banks were also permitted to offer abroader array of financial products. AfterDIDMCA, banks were better able to compete withother financial intermediaries for depository funds,but much of the damage was already done. At thebeginning of the 1980s banks were in a weakenedstate.
Advances in computers, telecommunications,and other forms of technology greatly improved thedissemination and flow of financial information.Competition by other banks, thrifts, money marketfunds, and other nonbank financial institutions in-tensified. Bank earnings and rates of return fromtraditional activities suffered throughout the 1980s.By the end of the 1980s, new financial instrumentsproliferated. Banks became more dependent on off-balance sheet activities such as interest rate swaps,loan commitments, and future markets for exchangerates for income. Shares of assets of nonbank fi-nancial institutions grew dramatically. Meanwhile,the share of financial assets held by banks decreasedsteadily throughout the 1980s.
Competition took many forms, but banks—espe-cially big banks with assets greater than $10 billion—lost ground in major markets, including that forlarge industrial borrowers with excellent creditratings. These "blue-chip borrowers," formerly themainstays of bank lending, defected for more favor-able lending rates in commercial paper markets.Banks had to adjust their asset portfolios. Theycould no longer look to less risky commercial and
industrial loans to bolster their earnings; the devel-opment of the commercial paper market had madethese loans more difficult to obtain. As a result,commercial and industrial loans declined as a per-centage of bank portfolios.
Faced with fewer investment alternatives, somebanks sought refuge in higher-risk assets, includingloans to developing countries and energy invest-ments in the 1970s and 1980s. When oil prices felland defaults on loans to developing countries in-creased in the 1980s, banks that had not properlydiversified lost large portions of their asset portfo-lios. In some cases, banks turned to highly lever-aged transactions and junk bonds in an effort tobolster sagging earnings. The subsequent softeningof these markets resulted in substantial losses inbank earnings and equity. Rates of return for manybanks dropped far below past averages. Bad loansbegan to surface, and provisions for bad loans be-gan to overwhelm the income on good loans. Re-turns on equity in some of the largest banks wereless than returns on government bonds.
Analysis of industry data reveals a strong pat-tern of higher-than-average bank failure associatedwith regions experiencing temporary economicdifficulties. Banks tied to regional markets sufferedfrom economic declines in energy, real estate, andagriculture. For example, bank failures in theSouthwestern states can be attributed in part toregional collapses in oil and real estate prices.Texas banks were hit particularly hard by sectoraldeclines in the local oil and gas market and subse-quent slumps in local real estate markets. Real-estate-related difficulties spread to the Northeast, theSoutheast, and finally the West Coast. Bank fail-ures in the West and Midwest regions can be linkedto a downturn in the agriculture sector during themid-1980s.
Although many of the problems that beset bankswere externally induced, the primary responsibilityfor bank failures rests squarely on the shoulders ofbank managers and boards of directors. This re-sponsibility does not negate ineffective regulation orunforeseen economic developments as causes offailure, but the bank manager is the agent whoreacts to economic conditions and the regulatoryenvironment. Some managers made mistakes be-
SUMMARY Xlll
cause they reacted incorrectly to a barrage of un-usual factors. In some cases, managers simplyfailed to diversify asset portfolios and boards ofdirectors did not insist on reasonable loan practices.Managers of failed banks often pursued aggressiveloan policies without reasonable precautions againstdefault. As a result, many bank managers whofailed to deal effectively with increased competitionand adverse economic shocks presided over thedemise of their institutions.
A comparison of the financial characteristics ofbanks that failed and banks that survived is reveal-ing. It shows that some of the traits that distinguishresolved and surviving banks began appearing in theinstitutions' balance sheets years before they failed.Industry data show that surviving banks were morelikely to have higher equity-to-asset ratios (mea-sured by book value) and lower loan-to-assets ratiosthan resolved banks had even three years beforetheir resolution. Even with the limited data avail-able, it is possible to infer that those banks thatsurvived this period did so by holding more liquidassets, managing modest growth in diversified as-sets, maintaining a suitable buffer of capital, andcomplying with regulatory requirements. Banks thatfailed and were resolved experienced dramaticlosses in book-value equity-to-asset ratios withinone year of resolution—a relatively short period oftime. Whatever caused the book-value equity ratiosto fall so rapidly, the event has implications forregulatory efficiency in recognizing losses on assetsand carrying out timely closure.
All resolutions were marked by one importantregulatory decision—banks that were resolved couldnot raise capital. Regulators did not resolve a bankif it proved that it was capable of raising capital.Capital is simply defined as the difference betweenassets and liabilities—the equity held at book value.The act of raising additional capital is an act ofvalidation—a market affirmation of the continuedexistence of a bank. Weakly capitalized banks mayraise capital either by increasing income for retainedearnings or by otherwise raising capital in the equitymarket. Surviving banks generated positive incomeand raised capital when it was required; failed bankswere unable to do so.
Why Did ResolutionsCost So Much?
During the 1980s, regulators faced not only anincrease in the number of bank failures requiringresolution, but also an increase in the average costof resolving a bank. The cost to the BIF of resolv-ing a bank depends on the value of liabilities cov-ered by deposit insurance and the value of assetsthat can be recovered during the resolution process.Covered liabilities mostly include insured deposits.A major factor determining the cost of resolution isthe loss on assets-that is, the difference between thebook value of assets at the time of resolution andthe net value that can be recovered if the assets aresold. As the recoverable value of assets decreases,the cost of resolving an institution increases. Ifbanks are resolved when they first become insolventon the basis of market value—that is, when liabilitiesare just greater than the market value of assets-losses to the fund can be held roughly to the admin-istrative costs required to process the resolutionthrough the FDIC system.
The average loss on assets for resolved banks inthe late 1980s was about 30 percent. In the 1980s,most banks were closed when they became book-value insolvent-that is, when the book value oftheir equity dropped to zero. When asset values aredeclining, banks will generally be insolvent on amarket-value basis before they display book-valueinsolvency. Because there was such a drain on theinsurance fund, recognition of bank insolvency anda timely exit policy for insolvent institutions becamea critical part of regulatory effectiveness.
The fact that losses were, on average, higher inthe 1980s than they were in the previous periodmay indicate diminished regulatory effectiveness.Two factors could have contributed to diminishedeffectiveness. First, examiners may not have beenable to identify potential failures early enough topermit regulators to avoid additional losses. Al-though bank examiners can usually determine whichbanks are financially distressed, judging when abank first becomes insolvent is very difficult.
xiv THE CHANGING BUSINESS OF BANKING June 1994
Also, during this interval an extraordinary numberof banks failed over a short period of time. Second,examiners may have identified severely undercapi-talized banks, but either practiced a policy of for-bearance or were unable to elicit compliancethrough supervision.
The process of classifying a bank as economi-cally incapable of surviving before it reaches bookvalue insolvency is fraught with uncertainty. Regu-lators can make two kinds of errors in classifying abank as insolvent. First, they may classify a bankthat is really functional as insolvent. In the secondcase, regulators may classify a bank that is reallyinsolvent as functional.
In the history of the insurance fund, the twoerrors have not been equally important. Since 1934,regulators have rarely resolved a bank that wassolvent by book-value measures. During the 1980s,regulators usually preferred to err on the side ofleaving a financially distressed bank operating ratherthan close a functional bank. The costs associatedwith behaving as though a bank is functional whenit is not can appear eventually as embedded coststhat show up as relatively high resolution costs perdollar of assets. Regulators also faced legal andeconomic pressures to avoid closing a bank before itbecame book-value insolvent. To close such institu-tions meant that the regulators would have had toendure immediate vocal disapproval from thosedirectly affected-owners of banks, boards of direc-tors, local communities, and their representatives.Beneficiaries of timely closures were conspicuouslysilent and typically unaware of the costs of regula-tory delay.
Along with the problem that regulators mayhave been uncertain about when an institution be-came insolvent, regulators may have been simplyoverwhelmed by the events of the 1980s. In thecontext of new financial instruments and the greaterlatitude afforded banks by deregulation in the early1980s, regulators may have been unable to keep upwith the technological changes caused by deregula-tion and increased competition in the industry. On-site examinations, conducted to assess the financialhealth of an institution, were less frequent (as aresult in part of budget cutbacks) at a time whenfinancial markets were changing faster than at virtu-
ally any other point in the nation's history. Withoutrelatively current assessments from examiners, regu-lators had to rely solely on quarterly call reportsbased on book-value data. Book-value data basedon past transactions can overstate the current marketvalue of a financially weak institution. Whenevents in the market affect the value of an institu-tion, book-value accounting does not reflect achange in value. Without data based on examina-tion and the true value of assets, regulators couldnot easily recognize asset losses and bank in-solvency.
A policy of forbearance gives economicallyfunctional banks—those that may be undergoingshort-term difficulties—a window of time in whichto adjust to market conditions without enforcingotherwise applicable bank regulations. Althoughnot every undercapitalized bank is a likely candidatefor resolution, all are unquestionably candidates forincreased regulatory oversight and supervision.Regulators have the authority to force banks to raiseequity, suspend dividends, reduce assets, issue newstock, force divestiture of affiliates, remove direc-tors or managers, demand increased allowances forloan losses, or charge off uncollectible loans. En-forcing such actions on these undercapitalized banksmay have resulted in even more failures. In somecases, regulators decided to forgo enforcement ofsupervisory actions—in particular, enforcing capitalrequirements-presumably because they felt thatthese banks would be more likely to survive ratherthan fail.
Post-FDICIA: An Outlook ofGuarded Optimism for theBanking Industry
The Congress intended the deposit insurance systemto be self-sustaining. Revenues collected frompremium assessments paid by insured banks areused to cover the costs of resolving insolvent banks.For almost 50 years, the fund's revenues exceededits costs. But the expense of resolving banks in thelate 1980s drained the Bank Insurance Fund. By1991, there was increasing concern about the num-bers and losses of bank resolutions.
SUMMARY xv
The financial condition of the banking industryand the ability of the federal deposit insurance fundto cover losses from the alarming number of resolu-tions in the 1980s were major motivating factors forpassage of the Federal Deposit Insurance Corpora-tion Improvement Act of 1991 (FDICIA). Alongwith recapitalizing the BIF (the FDIC is to recapi-talize the insurance fund by 2005), a major themeof this legislation is to foster "safety and soundness"in the banking industry.
Because only little more than two years haveelapsed since its passage, it is difficult to evaluatefully the effects of FDICIA. Nevertheless, thereforms put in place by this act appear to haveaddressed directly some of the major problemsidentified during the 1980s-a period that put con-siderable stress on the regulatory and deposit insur-ance systems. The FDICIA authorized the FederalDeposit Insurance Corporation to take prompt cor-rective action (or intervene earlier) to limit insur-ance losses. That is, bank regulators must employregulatory constraints depending on whether a bankmeets minimum prescribed capital levels. The actrequires prompt closure of severely undercapitalizedbanks. In FDICIA, the Congress also charged theFDIC with the responsibility of putting into place arisk-based capital system and developing a risk-based premium system. Properly designed risk-based premiums will provide increased insurancefunds to cover heightened risk in bank portfolios.A system of risk-based capital requirements, alongwith the mandated yearly on-site examinations, mayprovide a better buffer (to absorb losses on assets)between assets that default in a risky bank portfolioand bank insolvency that requires resolution.
After several years of poor performance, thebanking industry earned record profits in 1992 and1993. The average return on assets for commercialbanks was 1.21 percent in 1993, a year in which thereturn on assets in each quarter surpassed averagespreviously reported by the industry. At the sametime, the average annual return on equity for theindustry exceeded 15 percent. Several factors con-tribute to the improved health of the banking indus-try even as the industry undergoes continued struc-tural change and consolidation. In particular, favor-able interest rate conditions and a growing economyhave enabled banks to prosper. Banks have been
able to take advantage of the fact that they can payless for their liabilities and receive greater returnson assets. Moreover, the growing economy hashelped to reduce the amount of troubled assets—noncurrent loans declined in all regions of the coun-try and across all major loan categories—whichmeans that banks do not have to set aside as muchmoney to cover potential bad loans.
The outlook for the Bank Insurance Fund hasimproved as the banking industry continues to earnrecord profits. After incurring positive outlays from1988 to 1992, the fund is now in the black. Thefund's balance (net worth) rebounded to $6.8 billionin the second quarter of 1993, from a negative $100million at the end of 1992 and a negative $7 billionat the end of 1991. In its January 1994 baseline,the Congressional Budget Office projected that theBIF will take in $8 billion more than it spends infiscal year 1994 and continue in the black with asmaller excess in the next several years.
At the close of 1993, only 41 banks had beenresolved through the BIF, the fewest resolutions inany year since 1982, when there were 42. Theassets of banks resolved by the FDIC have beenfalling from a record $63.4 billion in 1991 to $44.2billion in 1992 and only $3.6 billion in 1993. As arule, larger banks are more costly to resolve. Theaverage size of a resolved bank in 1993 was $87million, down from $363 million in 1992.
The record profits in the two years followingFDICIA tend to obscure the fact that the bankingindustry has been losing ground to other types offinancial services. To some degree, however, banksare earning profits by taking advantage of low inter-est rates, which exposes them to increased interest-rate risk. Although favorable conditions for interestrates have allowed banks to increase profits andreplenish their capital, their increased exposure tointerest rate risk warrants a posture of guardedoptimism. When economic conditions change sothat the returns based on interest rate spreads nar-row, it could expose some banks to increased risk offailure. Given the possibility that the industry maybe susceptible to such periodic crises because ofchanging economic conditions, policymakers areexamining the need for further structural reform inthe banking industry. In particular, there is continu-

xvi THE CHANGING BUSINESS OF BANKING June 1994
ing interest in legislative reform that would enable bill currently under consideration by the Congressbanks to diversify, either geographically or through would permit banks to diversify their loan portfoliosvarious product offerings. An interstate branching across state lines.
Chapter One
Introduction
P roblems in the banking industry proliferateddramatically during the 1980s, and thenumber of bank resolutions reached levels
not seen since the Great Depression. Since theBanking Act of 1933 established the Federal De-posit Insurance Corporation (FDIC), more than2,000 troubled commercial and savings banks havebeen resolved. Banks resolved by the FDIC haveeither failed, requiring regulatory involvement intheir exit from the industry, or needed some finan-cial assistance to remain open. Between 1980 and1992, the FDIC resolved almost three times as manybanks (1,505 banks) as it resolved in the first 46years of its existence (at many times the cost to theinsurance fund). During the peak years between1987 and 1992, the FDIC resolved more than 1,000banks, seriously depleting the Bank Insurance Fund(BIF).
Before 1980, the solvency of the insurance fundwas never an issue. Until the mid-1980s, revenuesto the insurance fund, primarily derived from semi-annual assessments of premiums, invariably ex-ceeded losses. Regulators assessed premiums at thesame flat rate used since the creation of the fund-8.3 cents per $100 of insured deposits. At the time,the FDIC (with Congressional authorization) com-monly provided rebates of up to one-third of theoverall annual premium assessments to avoid gener-ating what was commonly thought of as an "exces-sive" insurance fund surplus.1 Regulators consid-ered the fund reserves more than sufficient to han-dle recognized fund losses, feeling that it was not
necessary to increase premiums. In 1987, the BIFhad an $18 billion reserve. But by 1991, the recordnumber of resolutions had caused such a drain oninsurance fund reserves that the General AccountingOffice pronounced the Bank Insurance Fund insol-vent.2
The dramatic increase in the number and costsof resolutions in the late 1980s, coming on the heelsof the savings and loan crisis, brought into questionthe long-term condition of the deposit insurancefund. Taxpayers have paid dearly for the savingsand loan insurance losses, a financial hemorrhagethat may cost more than $150 billion (expressed in1990 dollars) before it is finished.3 Speculation thattaxpayers would again have to come to the rescueof another ailing insurance fund sparked Congres-sional debate.
In addition to the immediate problem of lossesto the Bank Insurance Fund, industry analysts werealso concerned about the broad economic effects ofbank failures. The average loss in asset value ofbanks and thrifts resolved during the 1980s was un-precedented in the history of deposit insurance.These losses were symptomatic of poor decisions bymany depositories and weaknesses in the regulatorysystem of monitoring and supervision. Another
William E. Gibson, "Deposit Insurance in the United States: Eval-uation and Reform," Journal of Financial and Quantitative Analy-sis (March 1972), pp. 1575-1594.
2. General Accounting Office, "Financial Audit: Bank InsuranceFund's 1991 and 1990 Financial Statements" (report to the Boardof Directors, Federal Deposit Insurance Corporation, Washington,D.C., May 11, 1992). The insurance fund is insolvent when thereare not sufficient reserves on hand to manage bank failures. Tech-nically, however, the fund is never illiquid because the FDIC hasthe ability to borrow funds (up to $30 billion as of 1991) from theU.S. Treasury to handle resolutions and maintain working capital.
3. See Congressional Budget Office, The Economic and BudgetOutlook: Fiscal Years 1995-1999 (January 1994), p. 44.
2 THE CHANGING BUSINESS OF BANKING June 1994
cause of concern is that bad investments made withfunds from depository institutions may have contrib-uted to an overvalued capital stock and poor growthof productivity in the United States during the1980s.
The alarming increase in the number of bank(and thrift) resolutions revealed the necessity forbank reform legislation. The Financial InstitutionsReform, Recovery, and Enforcement Act of 1989and the Federal Deposit Insurance Corporation Im-provement Act of 1991 (FDICIA) were responses tothe pressure put on the deposit insurance system be-cause of the costs of resolving these institutions. Asa result of these legislative actions and an increasein banking industry profits in 1992 that continuedinto 1993, concerns have abated somewhat. Amongthe most interesting questions remaining are whythere was such an increase in bank failures and sub-sequent resolutions in the late 1980s and early1990s. Also, why did the costs to the governmentof resolving failed banks increase so dramatically,depleting the BIF in just a few years?
Figure 1.Average Annual Number of Bank Failures forSelected Periods Between 1900 and 1992
Years
1900-1920
1921-1929
1930
1931
1932
1933
1934-1940
1941-1980
1981-1986
1987-1992
1
•:ir:7T.:i: :. , ;;;,j: -.: :. j; "~1J " ;;
ji i i i i0 1,000 2,000 3,000 4,000
Number of Banks
SOURCE: Congressional Budget Office based on data from theFederal Deposit Insurance Corporation.
Bank Resolutions inHistorical Perspective
In the early history of the U.S. banking industry,from 1870 to 1919, banks failed at a rate slightlylower than that of firms in other sectors of theeconomy.4 In fact, the industry grew rapidly duringthis period. The number of commercial banks tri-pled in 35 years, growing from 10,000 in 1885 to30,000 in 1920. Almost 500 banks failed in 1893,but from 1900 to 1920 the average rate of failurewas less than 100 a year.5 Circumstances began tochange, however, in the 1920s.
4. George Kaufman, "Banking Risk in Historical Perspective," Re-search in Financial Services: Private and Public Policies, vol. 1(Chicago: JAI Press Inc., 1989), pp. 151-164.
5. George Benston and George Kaufman, "Risks and Failures inBanking: Overview, History, and Evaluation," in George G.Kaufman and Roger C. Kormendi, eds., Deregulation of FinancialServices: Public Policy in Flux (Cambridge, Mass.: BallingerPress, 1986).
During the 1920s, the banking industry began tocontract. As many as 5,400 banks suspended opera-tions and more than 4,000 never reopened. Nearly700 banks failed every year during the 1920s (seeFigure 1). A recession hit the agricultural sector inthe late 1920s, accounting for the failure of manysmall rural banks. The Great Depression struck theentire economy in the early 1930s, causing recordnumbers of bank failures.
Between 1930 and 1933, the average number ofannual bank failures reached an incredible 2,274.Within the five years from 1929 through 1933, thenumber of banks in the United States was cut al-most in half, to about 14,700. Even during thesecrisis years, annual losses to depositors rarely ex-ceeded 1 percent of total deposits at all banks.Losses at many of these banks were generallylimited to less than 10 cents on the dollar.6
James S. Lawrence, "What is the Average Recovery of Deposi-tors?" American Bankers Association Journal (February 1931), pp.655-656, 722-723.
CHAPTER ONE INTRODUCTION 3
During this period, in the absence of a systemof deposit guarantees, banks were declared legallyinsolvent and closed by their creditors much morequickly than they were after deposit insurance.7
Liquidity was much more costly in early financialmarkets because funds moved slowly through thesystem. If banks could not meet liquidity require-ments, they would often voluntarily suspend opera-tions. Bank examiners would then determinewhether a bank had sufficient capital to reopen.The fact that banks were closed fairly quickly in aliquidity crisis helped to limit depositors' losses.
It is popularly supposed that many of thesefailed banks had fallen victim to deposit runs. Butfrom 1865 to 1929, fewer than 15 percent of allbank failures occurred as a result of depositor runs.8
Surprisingly few solvent banks were drawn intofailure as depositors reacted in panic to losses atother insolvent banks.9 Although there were severesystemwide runs in the early 1930s, a large propor-tion of the banks that failed were insolvent. Banksthat the Federal Reserve supported (in the role oflender of last resort) tended to survive.10
Banking After the Depression
After the banking crisis of the early 1930s, theBanking Acts of 1933 and 1934 created the FDIC.
7. Kaufman, "Banking Risk in Historical Perspective," pp. 151-164.
8. George Thorndyke, "Fiction and Fact on Bank Runs," AmericanBankers Association Journal (June 1929), p. 1,269.
9. Kaufman, "Banking Risk in Historical Perspective," p. 152.
10. See Allan H. Meltzer, "Financial Failures and Financial Policies,"in George G. Kaufman and Roger C. Kormendi, eds., Deregula-tion of Financial Services: Public Policy in Flux (Cambridge,Mass.: Ballinger Press, 1986). Meltzer states that the FederalReserve in the role of a lender of last resort should act to preventilliquid but solvent banks from being forced to close by makingloans to them when they face heavy deposit withdrawals.
See also Milton Friedman and Anna J. Schwartz, A MonetaryHistory of the United States, 1867-1960 (Princeton, N.J.: PrincetonUniversity Press, 1963). The authors state that during the 1930sthe Federal Reserve did not provide sufficient liquidity, whetherthrough the discount window or open-market operations, andthousands of banks were forced to liquidate their assets simulta-neously in depressed markets.
These acts made the FDIC responsible for resolvingbanks when the state or federal chartering agencydeclared them insolvent, and for maintaining an in-surance fund to protect depositors. Deposit insur-ance was supposed to immunize the system as awhole against a contagious response to individualbank failures, but in so doing it transferred the bur-den of monitoring individual institutions from thecreditors of depositories to regulators. Before thedeposit insurance system put guarantees in place,several parties, including investors and depositors,were interested in reducing their risk of loss. Therisk of losing depositors and shareholders (in thecase of national banks) generally influenced banksto keep their portfolio risk low. Depositors alsopressured banks to hold more capital because thegreater the amount, the more losses the bank couldwithstand before becoming insolvent and forcinglosses on depositors.
The Post-Depression Incidence of Bank Resolu-tions. From 1934 onward, bank runs were virtuallynonexistent. The average annual rate of banks re-solved by the FDIC dropped well below preinsur-ance levels (see Figure 1). From 1934 to 1940, theaverage annual number of bank resolutions droppeddramatically to 64. During the next 40 years, from1941 to 1981, the average number of resolutions fellto only five banks a year. Bank resolutions beganto rise again in the 1980s as changes in financialmarkets, lingering inflation, regulatory reform, andnational and regional economic shocks contributedto an environment of structural change for financialinstitutions.
More than 100 banks had to be resolved everyyear between 1985 and 1992. The peak year duringthis period was 1989, when the FDIC resolved 207banks. In an industry composed of between 11,000and 12,000 commercial banks, even 200 resolutionsin any one year may seem slight-a failure rate ofless than 2 percent. But the number of resolutionsin any one year is not as significant as the trendover several years. Between 1980 and 1992, thenumber of commercial banks in the industry shrankby more than 16 percent. This period saw the high-est number of resolutions and the first significantchallenge to the deposit insurance system in the his-tory of the FDIC.
4 THE CHANGING BUSINESS OF BANKING June 1994
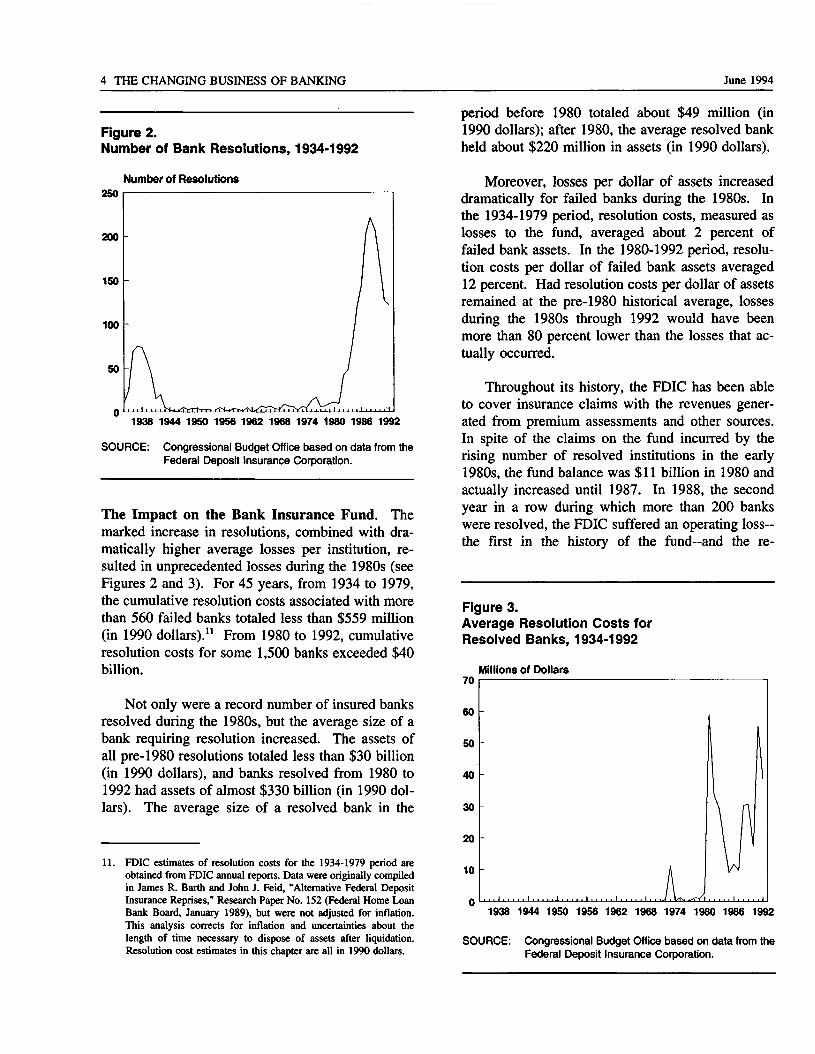
Figure 2.Number of Bank Resolutions, 1934-1992
Number of Resolutions250
200
1938 1944 1950 1956 1962 1968 1974 1980 1986 1992
SOURCE: Congressional Budget Office based on data from theFederal Deposit Insurance Corporation.
The Impact on the Bank Insurance Fund. Themarked increase in resolutions, combined with dra-matically higher average losses per institution, re-sulted in unprecedented losses during the 1980s (seeFigures 2 and 3). For 45 years, from 1934 to 1979,the cumulative resolution costs associated with morethan 560 failed banks totaled less than $559 million(in 1990 dollars).11 From 1980 to 1992, cumulativeresolution costs for some 1,500 banks exceeded $40billion.
Not only were a record number of insured banksresolved during the 1980s, but the average size of abank requiring resolution increased. The assets ofall pre-1980 resolutions totaled less than $30 billion(in 1990 dollars), and banks resolved from 1980 to1992 had assets of almost $330 billion (in 1990 dol-lars). The average size of a resolved bank in the
11. FDIC estimates of resolution costs for the 1934-1979 period areobtained from FDIC annual reports. Data were originally compiledin James R. Earth and John J. Feid, "Alternative Federal DepositInsurance Reprises," Research Paper No. 152 (Federal Home LoanBank Board, January 1989), but were not adjusted for inflation.This analysis corrects for inflation and uncertainties about thelength of time necessary to dispose of assets after liquidation.Resolution cost estimates in this chapter are all in 1990 dollars.
period before 1980 totaled about $49 million (in1990 dollars); after 1980, the average resolved bankheld about $220 million in assets (in 1990 dollars).
Moreover, losses per dollar of assets increaseddramatically for failed banks during the 1980s. Inthe 1934-1979 period, resolution costs, measured aslosses to the fund, averaged about 2 percent offailed bank assets. In the 1980-1992 period, resolu-tion costs per dollar of failed bank assets averaged12 percent. Had resolution costs per dollar of assetsremained at the pre-1980 historical average, lossesduring the 1980s through 1992 would have beenmore than 80 percent lower than the losses that ac-tually occurred.
Throughout its history, the FDIC has been ableto cover insurance claims with the revenues gener-ated from premium assessments and other sources.In spite of the claims on the fund incurred by therising number of resolved institutions in the early1980s, the fund balance was $11 billion in 1980 andactually increased until 1987. In 1988, the secondyear in a row during which more than 200 bankswere resolved, the FDIC suffered an operating loss-the first in the history of the fund—and the re-
Figure 3.Average Resolution Costs forResolved Banks, 1934-1992
70
60
50
40
30
20
10
Millions of Dollars
1938 1944 1950 1956 1962 1968 1974 1980 1986 1992
SOURCE: Congressional Budget Office based on data from theFederal Deposit Insurance Corporation.
CHAPTER ONE INTRODUCTION 5
serve ratio was less than 1 percent. The ratio of theinsurance fund reserves to total insured deposits is ameasure of the overall health of the fund. At thetime the law required the FDIC to maintain the in-surance fund at a minimum ratio of 1.16 percent.The reserve ratio continued to fall for the next threeyears and by the end of 1991 the fund had a nega-tive balance.
The Congress enacted special legislation toprovide the FDIC with sufficient funds to closeinsolvent banks and recapitalize the insurance fund.The Federal Deposit Insurance Corporation Im-provement Act of 1991 gives the BIF authority toborrow up to $30 billion from the U.S. Treasury tocover the losses from bank resolutions.12 FDICIAalso enables the BIF to borrow additional funds forworking capital~up to 90 percent of the value of theassets acquired from failed banks held by the FDIC—from the Federal Financing Bank (also a part ofthe U.S. Treasury). To recapitalize the BIF,FDICIA requires that the FDIC set assessment ratesthat will achieve a designated ratio of insurancefund reserves to total insured deposits of 1.25 per-cent by 2005. A minimum rate of 23 cents per$100 of insured deposits is required until the targetratio is achieved. In January 1993, the FDIC putinto effect a "risk-based" premium structure withaverage premiums of approximately 25 cents per$100 of qualified deposits.
Banking Industry Changes and Consolidation. Inone sense, industry analysts view the bank reso-lutions of the 1980s as the inevitable consequenceof an industry undergoing fundamental changeswhile moving toward greater competitiveness andefficiency. Bank failures, like failures in any otherbusiness, can occur as unfortunate by-products of anindustry experiencing intensive competition, deregu-lation, and structural change.
The deregulation of banking began in 1980 withthe removal of statutory interest rate caps. Suchindustries as railroads, trucking, airlines, petroleum,and natural gas experienced consolidation and firm
failures following deregulation. So, too, the bank-ing industry underwent a period of consolidationand failures. Less efficient banks fell into insol-vency as other banks and nonbank financial institu-tions competed to serve consumers in financial mar-kets.
The numbers and costs of bank resolutionsduring the last decade, however, carry more onerousimplications than a simple movement toward en-hanced efficiency might suggest. The banking sec-tor, despite partial deregulation, still operates underthe supervision of state and federal chartering agen-cies and FDIC regulators. It is therefore importantthat regulators have an efficient exit policy for in-solvent institutions because the longer an insolventbank is permitted to operate, the greater the poten-tial loss to the insurance fund. By the time regula-tors declared many failed banks legally insolventduring the 1980s, the value of assets had deterior-ated so much that the cost of resolution greatly ex-ceeded administrative costs. A bank is economic-ally insolvent when the market value of its liabilitiesexceeds the market value of its assets. Without reg-ulatory intervention, an insolvent bank can continueto operate independently until it cannot meet cashobligations; in other words, until insolvency be-comes clearly noticeable. The large margin of loss-es over administrative costs is one indication thatthese banks had operated in an insolvent state forsome time before they were resolved. Empiricalanalyses of the savings and loan crisis suggest thatinsolvent institutions that are closed earlier cost lessto resolve.13
The high resolution costs of the 1980s broughtinto question the efficiency of regulatory supervi-sion and the process of removing insolvent banksfrom the system. Regulators depended on tradi-tional book-value methods of accounting thatmasked potentially insolvent banks until resolutioncosts became extraordinary. Unanticipated resolu-
12. Section 101 of the Federal Deposit Insurance Corporation Im-provement Act of 1991, 12 U.S.C. 1824, 105 Stat. 2236.
13. R. Dan Brumbaugh, Jr., and Robert E. Litan, "A Critique of theFinancial Institutions Recovery, Reform and Enforcement Act(FIRREA) of 1989 and the Financial Strength of CommercialBanks," in James Barth and R. Dan Brumbaugh, eds., The Reformof Federal Deposit Insurance (New York: Harper Business, 1992).See also Congressional Budget Office, "The Cost of ForbearanceDuring the Thrift Crisis," CBO Staff Memorandum (June 1991).
6 THE CHANGING BUSINESS OF BANKING June 1994
tions raise fundamental concerns about the ability ofregulators to limit future losses. In addition, allow-ing insolvent banks to continue operating can hurthealthy banks in the same market. Insolvent banksthat remain open can increase the cost of doingbusiness as they bid for potential customers.
The Economic Costsof Bank Failures
The primary function of the nation's financial sys-tem is to facilitate the efficient allocation of re-sources in the economy. As an important compo-nent of the financial system, banks provide mecha-nisms for facilitating transactions, transmitting mon-etary policy, and transferring funds between saversand borrowers—a principal ingredient of economicgrowth. Banks have been a primary credit conduit,especially for such information-intensive borrowersas small businesses.
The most frequently stated goal of bankingregulation is to maintain the safety and soundness(or stability) of the financial system. As an impor-tant part of that system, banks provide a vital ser-vice to the economy and to society as a whole.Conditions that impede the ability of banks to oper-ate efficiently affect the allocation of resources. Ifbank closings create a shortage in the amount ofcredit available, society bears the cost of lost invest-ment opportunities and therefore lower economicgrowth. Circumstances that affect the stability ofbanking can also affect monetary policy.
The Direct and Indirect Costsof Bank Resolutions
The cost of bank failures involves more than justthe losses that the FDIC reports to the insurancefund. Most failures throw bank employees out of
work, causing them at least a temporary loss of fullwages. But on the whole, bank resolutions duringthe last decade did not cause a major loss of jobs inthe industry. Bank employment actually increasedduring most of the decade. Despite the reduction inthe number of banks providing financial services,the number of branches did not decrease over theperiod. It was not until the early 1990s that severalinstitutions started to contract and lay off workers,causing employment in the industry to fall slightly.
There may be, however, substantial indirectlosses, particularly in those regions where there arelarger numbers of resolved banks. Excessive bankfailures in a particular region can temporarily in-crease the difficulty and costs of obtaining credit forsmall-to-middle-sized firms in the area. These firmsusually depend on banks for commercial and indus-trial loans. Economic losses associated with bankresolutions can carry over to other industries ifcreditworthy businesses find it excessively costly toobtain credit as a result of a high rate of bank fail-ures in a region.
In addition to indirect losses suffered by otherbusinesses after bank failures, real economic lossescan occur even before a bank fails and is resolved.Most financially weakened banks get that way be-cause they lose money on poor-quality assets--mostly bad loans. For example, excessive invest-ment in commercial real estate throughout the 1980stook the place of other, potentially more valuable,investments. Bad loans, which eventually show upas relatively high losses on an asset, equate to mis-allocated investment and lower economic growth.Many economists believe that the lack of productiv-ity during the 1980s was, in part, the result of insuf-ficient investment in productive resources. A Con-gressional Budget Office study of the failures ofsome 1,000 savings and loans suggests that theopportunity costs of misdirected investment byfailed thrifts was substantial.14
14. See Congressional Budget Office, The Economic Effects of theSavings & Loan Crisis (January 1992).
Chapter Two
The Structural Trends and EconomicConditions Underlying
Bank Resolutions
B anks confronted significant changes in theeconomic and institutional environment inthe 1970s and 1980s, contributing to a
dramatic increase in the rate of failures. Regula-tions that were applied just after the Great Depres-sion limited the activities of most depository institu-tions for more than four decades. Regulators setprices and costs of doing business and limited com-petition; banks and thrifts usually earned profits andrelatively few failed. Banking in those days was amuch easier enterprise; markets were insulated andinflation was low.
Two dramatic surges in inflation during the1970s fundamentally changed the business of bank-ing. One occurred in the mid-1970s as a result of aspike in food and oil prices. The other occurred in1979 when oil prices surged again as a result ofevents tied to the revolution in Iran. These twoprice shocks, combined with an apparently overheat-ing economy, were primarily responsible for thesurges in the inflation rate. Both inflationary per-iods led to dramatic rises in commodity prices, mer-curial stock and bond prices, and particularly vola-tile interest rates.
Interest rate volatility, coupled with advances ininformation processing, changed bank competitionand depositor behavior fundamentally and irrevers-ibly. Volatile inflation raised market interest rateswell above regulated interest rate ceilings by theend of the 1970s. As a result, depositors withdrewfunds from banks (and thrifts) to invest in instru-
ments that promised to earn a higher rate of return.The draw of double-digit interest rates available onmoney market mutual funds and Treasury securitiesmade them popular alternatives to banks and thrifts.
Profitability in the banking industry, measuredby return on assets, increased moderately during thetwo decades before 1970.1 The return on assetsstarted to decline after 1979. Banks entered the1980s facing a set of structural and economic condi-tions that had weakened their position in relation toother financial intermediaries both here and abroad.In response to these pressures and the increased rateof bank failures in the latter half of the 1980s, theCongress and state legislators enacted major regula-tory changes by the end of the 1980s. Deregulationof depository institutions in the 1980s included alifting of interest rate ceilings on deposits, an expan-sion of product lines, and the spread of interstatebanking.2 The regulatory changes were intended toallow banks to compete better with nonbank finan-cial intermediaries. As a result, banks now operatein competitive rather than insulated markets.
1. Information on bank profitability throughout this chapter comesfrom the Federal Reserve Bulletin.
2. The Depository Institutions Deregulation and Monetary ControlAct of 1980 (DIDMCA) mandated the phasing out of depositinterest rate ceilings and allowed interest payment on transactionsaccounts; the Depository Institutions Act of 1982 (Garn-StGermain) allowed interstate mergers between banks and savingsand loans; and the Competitive Equality in Banking Act of 1987(CEBA) limited the growth of so-called nonbank banks.
8 THE CHANGING BUSINESS OF BANKING June 1994
Enhanced Competition andFinancial Innovation
Banks as a group lost ground to open-market creditsources and nondepository financial institutions interms of funds advanced in U.S. credit markets.Open-market credit increased dramatically duringthe 1980s, caused by growth in commercial paperand junk bonds. Finance companies led nonbankmediation of credit. Moreover, nondepository finan-cial institutions compete with banks in markets forassets and liabilities. Nonbanks now offer creditcards, residential mortgages, consumer and commer-cial loans, and transaction accounts. By 1990,subsidiaries of such retailers as Sears Roebuck andsuch manufacturers as the Ford Motor Company andGeneral Electric were financing one-third of con-sumer credit and one-quarter of commercial loans.3
Although the assets of the financial servicesindustry (including banks) have continued to grow,the share of domestic financial assets held by U.S.commercial and savings banks decreased from about50 percent in 1950 to 22 percent in 1991. Over thesame period, pension and mutual funds grew fromabout 5 percent to 30 percent of financial assets.Assets held by finance companies doubled duringthis period, accounting for 7 percent of assets in1991. Other depositories, life insurance firms, andnondepository institutions, including automobilecompanies, retail department stores, and telephonecompanies, make up the remaining share of assets.4
Increased competition and financial innovationmade banking less stable in the 1980s. Continuingadvances in computer technology, which increasethe speed and volume of information processing,have helped to popularize new kinds of financialassets, especially off-balance-sheet instruments. En-hanced technology also facilitated the development
3. See Roger Vaughan and Edward Hill, Banking on the Brink(Washington, D.C.: Washington Post Company, 1992), p. 19.
4. Herbert L. Baer and Larry R. Mote, The U.S. Financial System(Chicago: Federal Reserve Bank, December 1990). See alsoRobert E. Litan, "The Revolution in U.S. Finance: Past, Presentand Future" (paper presented as a Frank M. Engle lecture, TheAmerican College, Bryn Mawr, Pa., April 30, 1991).
of an increasingly international market for financialassets. Each day, global banking transactionsamount to more than $1 trillion. International com-petition continues to threaten the domestic bankingindustry's ability to vie for both deposits and assets.Many of the resulting changes in financial marketsdirectly contributed to falling revenues from interestincome.
The Changing Compositionof Bank Balance Sheets
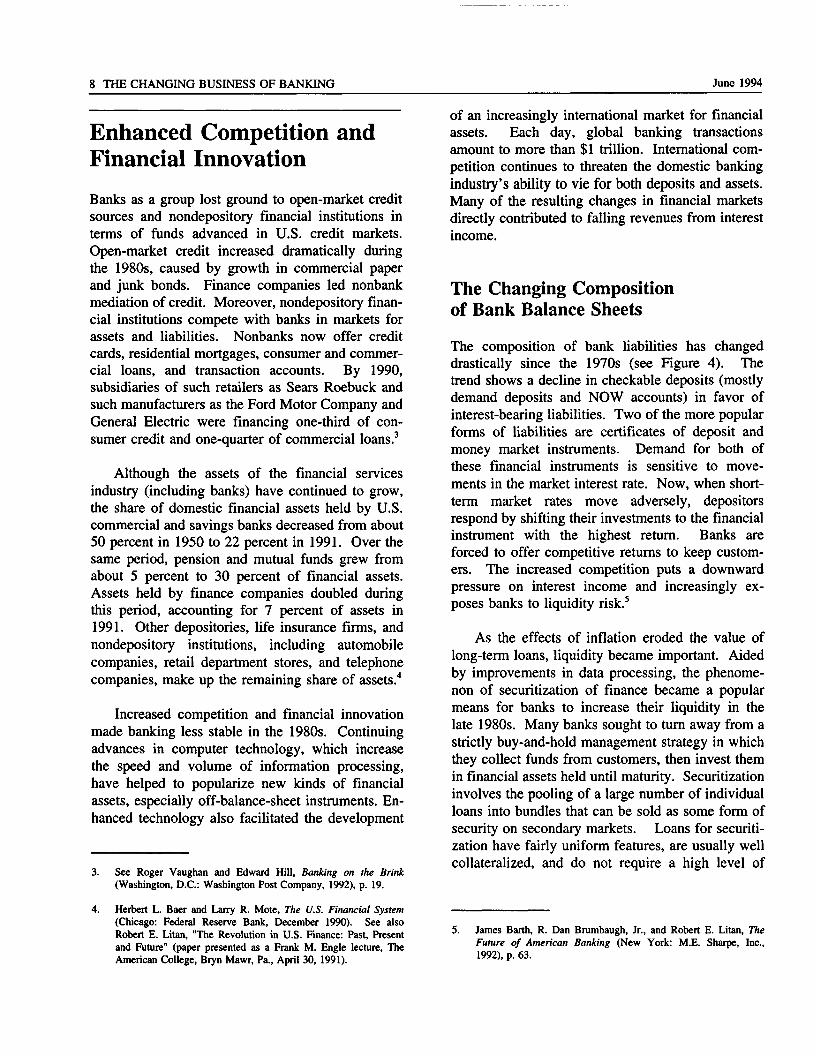
The composition of bank liabilities has changeddrastically since the 1970s (see Figure 4). Thetrend shows a decline in checkable deposits (mostlydemand deposits and NOW accounts) in favor ofinterest-bearing liabilities. Two of the more popularforms of liabilities are certificates of deposit andmoney market instruments. Demand for both ofthese financial instruments is sensitive to move-ments in the market interest rate. Now, when short-term market rates move adversely, depositorsrespond by shifting their investments to the financialinstrument with the highest return. Banks areforced to offer competitive returns to keep custom-ers. The increased competition puts a downwardpressure on interest income and increasingly ex-poses banks to liquidity risk.5
As the effects of inflation eroded the value oflong-term loans, liquidity became important. Aidedby improvements in data processing, the phenome-non of securitization of finance became a popularmeans for banks to increase their liquidity in thelate 1980s. Many banks sought to turn away from astrictly buy-and-hold management strategy in whichthey collect funds from customers, then invest themin financial assets held until maturity. Securitizationinvolves the pooling of a large number of individualloans into bundles that can be sold as some form ofsecurity on secondary markets. Loans for securiti-zation have fairly uniform features, are usually wellcollateralized, and do not require a high level of
5. James Earth, R. Dan Brumbaugh, Jr., and Robert E. Litan, TheFuture of American Banking (New York: M.E. Sharpe, Inc.,1992), p. 63.
CHAPTER TWO TRENDS AND CONDITIONS UNDERLYING BANK RESOLUTIONS 9
Figure 4.Composition of Commercial and Savings Bank Liabilities, 1960-1992
Percentage of Total Liabilities
1960 1964 1968 1972 1976 1980 1984 1988 1992
SOURCE: Congressional Budget Office based on data from the Federal Deposit Insurance Corporation, FDIC Historical Statistics on Banking,1934-1992 (September 1993).
NOTE: Demand deposits are all deposits subject to withdrawal on demand (checking); savings deposits include all savings deposits; timedeposits are all time certificates of deposit, time open accounts, and similar deposits; borrowed funds are federal funds, treasuries,mortgage indebtedness, and other liabilities for borrowed money.
of monitoring—for example, residential mortgages,automobile loans, and credit card balances.
With securitization, banks could better matchthe term structure of assets, transform loans to amore liquid type of asset, and eliminate some of theasset portfolio risk associated with liquidity. Banksnow have the flexibility to sell financial assets toother investors if they need to shrink their assetbase (and thereby increase the capital-to-asset ratio)to comply with capital standards or change strategyif operating needs or economic conditions dictate it.
Ultimately, in an increasingly competitive mar-ket, interest rates on loans become lower as themarket begins to reflect reduced risk in the pricingof securitized assets.6 Deeper secondary markets forthe formerly illiquid loans caused interest rates todecline on these loans and thereby lowered interestincome. As a result, securitization may have helped
banks cope with the events of the 1970s and 1980s,but over the longer term it may have also erodedbank profit margins.7 Bank profitability in the latterhalf of the 1980s was significantly below its aver-age for most of the 1970s.
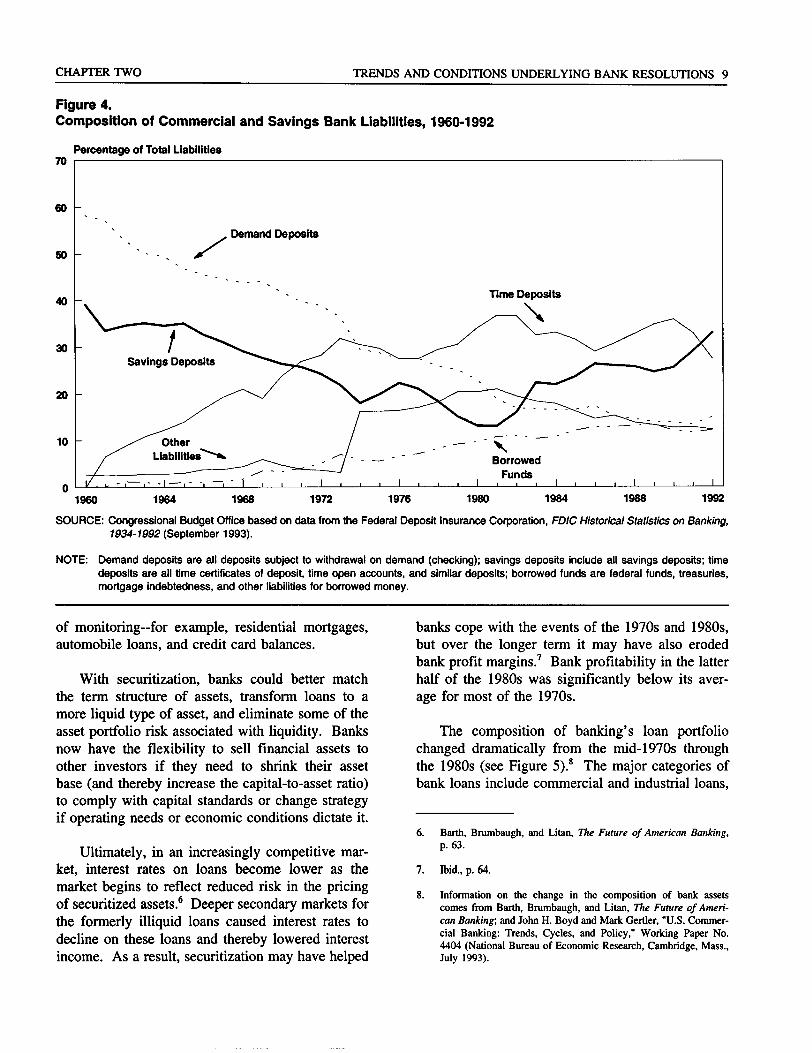
The composition of banking's loan portfoliochanged dramatically from the mid-1970s throughthe 1980s (see Figure 5).8 The major categories ofbank loans include commercial and industrial loans,
6. Earth, Brumbaugh, and Litan, The Future of American Banking,p. 63.
7. Ibid., p. 64.
8. Information on the change in the composition of bank assetscomes from Earth, Brumbaugh, and Litan, The Future of Ameri-can Banking', and John H. Boyd and Mark Gertler, "U.S. Commer-cial Banking: Trends, Cycles, and Policy," Working Paper No.4404 (National Bureau of Economic Research, Cambridge, Mass.,July 1993).
10 THE CHANGING BUSINESS OF BANKING June 1994
mortgages, and consumer credit. Commercial andindustrial loans decreased during the 1980s from 21percent to 19 percent of assets. The fall in commer-cial and industrial loans was caused in part by do-mestic competition (discussed above) and loans toU.S. firms by foreign banks. The rise in these off-shore loans in the 1980s reveals the increased im-portance of foreign banks to commercial lending inthe United States.
With the loss in share of commercial and indus-trial loans came a rise in the relative importance ofmortgage lending from the mid-1970s through the1980s. Banks picked up some business from sav-ings and loans, but the shift to mortgages had al-ready begun by the time these mortgages becameavailable. Mortgage loans include construction and
development loans as well as commercial and resi-dential mortgages. Real estate loans increased from15 percent to 23 percent of assets during the 1980s.The increased concentration in real estate loans ex-posed banks to fluctuations in the real estate market,causing the banking industry additional problems.The increase in commercial mortgages accounts formuch of the growth in mortgage lending for banksin the 1980s. Although this was true for commer-cial banks, it was not true in general. Many of theasset problems associated with bank failures in laterperiods came from bad commercial mortgages (no-tably in Texas).
Total loans and leases grew from 55 percent to62 percent of assets during the 1980s. Loans tendto be less liquid than securities and thus, as the
Figure 5.Composition of Commercial and Savings Bank Loans and Leases, 1960-1992
50
40
30
20
10
Percentage of Total Loans and Leases
Commercial andIndustrial Loans
Real EstateLoans
Other Loansand Leases
1960 1964 1968 1972 1976 1980 1984 1988 1992
SOURCE: Congressional Budget Office based on data from the Federal Deposit Insurance Corporation, FDIC Historical Statistics onBanking, 1934-1992 (Septemberl 993).
NOTE: Real estate loans include all loans secured by real estate such as single and multifamily mortgages, farmland mortgages, andmortgages or liens on business and industrial properties. Commercial and industrial loans include all loans and commercial paper forcommercial or industrial purposes. Loans to individuals include all loans for auto financing, home improvement, and personalexpenses.
CHAPTER TWO TRENDS AND CONDITIONS UNDERLYING BANK RESOLUTIONS 11
share of these assets increases, they increase the ex-posure of a portfolio to liquidity risk. The ratio ofloan losses to total industry loans has been risingsince 1960. Loan losses decreased moderately in1992, but the ratio of loan losses is still high com-pared with periods before 1960. During the 1980sbanks also reduced liquidity as cash, and cash duefrom other depositories, fell by one-half from 18percent of assets in 1980 to 9 percent in 1990.
Incentives for IncreasedRisk in Investments
Corporate borrowers had long been the mainstays ofcommercial bank lending and provided a goodsource of income. Banks typically charged theseborrowers 100 basis points (1 percentage point) overthe cost of funds. Blue-chip corporations with su-perior credit ratings soon found that uninsured in-vestment banks could provide them with access tothe commercial paper market—borrowers could at-tend to their short-term credit needs through corpo-rate bonds. As a result, corporate bonds increaseddramatically during the 1970s. By the end of the1970s, corporations had obtained $124 billionthrough debt financing. In addition, investmentbanks gave corporate borrowers more access tocommercial paper. They began to offer borrowersmedium-term notes and other sources of credit, aswell as making available to firms the ability to in-sure against large changes in equity value.
Rapid gains in telecommunications and comput-ers helped blue-chip borrowers seek credit else-where. During the 1980s, the volume of commer-cial paper tripled. Between 1960 and 1989, the pro-portion of nonbank commercial paper issued bycommercial firms grew from 10 percent to morethan 75 percent. Banks had little choice but to con-sider alternative types of assets to replace the lostbusiness.
As many of the high-quality assets moved offbank balance sheets, banks were left with fewerlow-risk customers. Moreover, bank profit marginswere challenged on both the asset and liability sidesof the balance sheet through increases in interestexpenses and downward pressures on interest in-
come. These challenges to bank operations movedbanks to pursue riskier management strategies in aneffort to augment returns.9 Before partial deregula-tion in the 1980s, regulations limited the incentiveand ability of banks to pursue excessively high-riskactivities. When regulations relaxed, it becameincreasingly important that regulators monitor banksafety, soundness, and risk and supervise banks thatposed a risk of loss to the Bank Insurance Fund.
Usually, if investors anticipate that the returnson an investment will vary, they will not lend un-less the expected return is high enough to compen-sate for the risk. It has long been recognized, how-ever, that a fixed-rate deposit insurance system canpose a moral hazard by encouraging excessive risktaking.10 Banks had an extra incentive to increasereturns through riskier instruments since, in effect,any increase in risk was subsidized by the depositguarantee system. The deposit insurance systemsubsidized risk taking by banks because during thisperiod insurance premiums were unrelated to risk offailure. (The Federal Deposit Insurance CorporationImprovement Act of 1991 mandates that insurancepremium rates take into account the risk of loss tothe insurance fund.)
Evidence of Increased RisksAssociated with Returns to Banks
Investment risk is defined as potential variation inexpected returns to the investor. The variance (astatistical measure of variation) of both the returnon assets and return on equity of banks increasedthroughout the 1980s, indicating the increased riski-ness associated with bank capital. The popular per-ception that the 1980s were marked by a dramaticincrease in banking risks is reinforced by an exami-
9. See Frederick T. Furlong and Michael C. Keeley, "Capital Regula-tion and Bank Risk-Taking: A Note," Journal of Banking andFinance (November 1989), pp. 883-891.
10. See Michael C. Keeley, "Deposit Insurance, Risk and MarketPower in Banking," American Economic Review (December 1990),pp. 1183-1200. Keeley concludes that the recent increase in bankfailures can be attributed to a rise in competition (resulting fromderegulation), causing franchise value to decline and creating anincentive for increased risk taking.
12 THE CHANGING BUSINESS OF BANKING June 1994
nation of the total variance of bank stock returns.11
From 1979 to 1990, the average return on bankstocks of a sample of 84 large bank holding compa-nies fell in relation to a sample of nonfinancialstocks and government bonds; at the same time, thevariance of stock returns increased.
Many banks began to seek returns in this com-petitive and fast-moving environment from whatproved to be not only risky but ill-advised invest-ments. At a time when competition was escalating,large banks, hit hardest by the loss of blue-chip cus-tomers, may have been tempted to pursue riskierforms of investment. The evidence shows that non-performing loans constituted about 2 percent of as-sets for the largest banks (banks with assets greaterthan $10 billion) through 1985 and rose to 2.5 per-cent on average for the last half of the decade. Bycontrast, banks with assets of less than $100 billionhad 1.5 percent of their assets invested in nonper-forming loans, falling to 1 percent by 1990. Twoexamples of investments that caused significantlosses—primarily for big banks with the technologyand access to these markets-were loans to develop-ing countries and junk bonds.12
Debt in Developing Countries. Mexico, Brazil,Chile, Argentina, and other developing countriesborrowed tens of billions of dollars from U.S. banksto finance social programs and oil imports in the1970s. These loans were fueled in part by the largeamount of money placed in international banks byoil-exporting countries after the oil-price rises in the1970s.13 U.S. banks required little or no collateralfor these loans. Many were based on tenuous as-sumptions about economic growth in developingcountries and as a gesture of international coopera-tion.
Banks clearly misread the borrowers' ability torepay. As time passed, the burden of debt repay-
11. Jonathan A. Neuberger, "Bank Stock Risk and Return," FederalReserve Bank of San Francisco Weekly Letter, no. 91-38 (Novem-ber 1, 1991).
12. See Vaughan and Hill, Banking on the Brink, p. 33.
13. David S. Holland, "The Bank and Thrift Crises-A Retrospective,"FDIC Banking Review, vol. 6, no. 1 (Spring/Summer 1993).
ment as a percentage of national income climbedsteadily. In the early 1980s, U.S. banks began tolend more funds to these countries in an effort tosalvage what would have been a guaranteed default.In 1982, Mexico, Brazil, and Argentina demandedrescheduling of their payments. By the mid-1980s,developing countries owed foreign investors ap-proximately $400 billion. U.S. money center banks—those holding more than $10 billion in assets withaccess to international markets—held about $50 bil-lion of Third-World debt. In 1987, at the request ofbank regulators, U.S. banks wrote off as lossesabout $40 billion in loans to developing countries.Compensation for these debt losses was especiallynoticeable because the return on assets for the bank-ing industry fell from 0.61 percent in 1986 to 0.09percent in 1987. By the early 1990s, the debt bur-den for many developing countries had been easedthrough debt restructuring, thereby reducing theproblem for U.S. banks.
Junk Bonds. So-called "junk" bonds are high-yielding but low-rated corporate debt securities.These bonds carry ratings of BB or lower, becausethey are judged to be of above-average default risk.In the 1980s, many companies issued them to fi-nance corporate acquisitions or to repay debt obliga-tions. Banks traditionally played an important rolein the financing of leveraged buyouts (LBOs) be-cause client information gave them an advantage.14
By requiring access to a client's cash flow and anadequate valuation of assets, traditional investmentsin LBOs were less risky than those that took placeduring the 1980s. Commercial credit companieswilling to take greater risks by allowing lower creditstandards began to compete very successfully withbanks. Equity yields of 35 percent to 50 percentand subordinated debt yields of 25 percent to 40percent were not uncommon for these investmentsin the early 1980s. With such high returns avail-able, this financial instrument grew enormously. Infact, the volume of junk bonds grew from $1.6 bil-lion to more than $300 billion before the collapse ofthe junk bond market in 1989.
14. Traditionally, banks had an advantage over virtually all otherintermediaries in information-intensive lending.

CHAPTER TWO TRENDS AND CONDITIONS UNDERLYING BANK RESOLUTIONS 13
Banks fueled this expansion by encouraginghigh interest rates and fees that amounted to 1 per-cent or 2 percent of principal. Concerns about cred-itworthiness began to erode. Loan officers foundthat they could more than double their banks' earn-ings by concentrating on LBOs rather than lendingto investment-grade (more creditworthy) firms.15
The subsequent downturn in this market imposedheavy losses on banks participating in these deals.
The Growth of Off-Balance-Sheet Activities: A SignificantSectoral Trend
The business of banking has changed considerablyover the last two decades. An increasing amount ofthe business done by banks does not show up aseither assets or liabilities—that is, it is not recordedon balance sheets. In fact, many of the traditionalactivities of commercial banking have moved offthe balance sheet. For example, a standby letter ofcredit is a financial instrument in which a bankguarantees a loan made by some third party, ratherthan funding the loan with depositor funds. Eventhough the loan does not appear on the asset side ofthe bank's balance sheet, the risk of loss is virtuallythe same as if it did.
Other examples of major off-balance-sheet ac-tivities include securitization (discussed above), loancommitments, and the rapidly growing category ofderivative instruments (primarily swaps and op-tions). Banks use loan commitments essentially likea line of credit to fund planned investments. Firmsanticipating needs for funds will arrange for a loancommitment. Derivative instruments involve thetrading (swapping) of risks. A common example ofa derivative security is an interest rate swap inwhich two parties exchange sequences of interestpayments. A foreign exchange contract involvingthe exchange of a sequence of interest paymentsamong different currencies is another derivative in-strument. Option contracts give the purchaser theright to buy or sell a specified amount of a financialasset at a particular price on or before a future dateof expiration.
In 1989, off-balance-sheet items accounted forapproximately four times the volume of balance-sheet items.16 Income from off-balance-sheet activi-ties (fee income) as a percentage of total income be-fore operating costs grew from 20 percent in 1979to 33 percent in 1991. Despite having a decreasedshare of industry assets on their balance sheets,banks remain important for originating information-intensive lending. Commercial banks remain in-volved (directly or indirectly) in the lending ofshort-term working capital and therefore continue toprovide an important service to businesses.17
Some regulators have expressed particular con-cern about the risk exposure of commercial banksoperating in the market for derivative instruments.18
These markets are largely unregulated, and as theyevolve and technology advances, new types of secu-rities continue to be developed at a rapid pace.There is also uneasiness that activity in derivativesis concentrated among a small group of very largecommercial banks. Substantial losses on trading inderivatives could force a large bank into insolvency,which could affect derivatives markets unfavorablyand perhaps damage money and exchange rate mar-kets as well.19 The data on derivative instrumentsare still preliminary and several agencies are evalu-ating these concerns.20
In addition to the recent structural changes inthe financial sector and the incentives to increasereturns by investing in riskier ventures, a series ofadverse economic events put more stress on the fi-nancial system. Not only did interest rates risesharply and the junk bond market collapse in the1980s, but the economy underwent periods of reces-sion, rapid inflation and deflation of energy prices,
15. Vaughan and Hill, Banking on the Brink.
16. Eileen Maloney and George Gregorash, "Banking 1989: Not Quitea Twice Told Tale," Economic Perspectives, Federal Reserve Bankof Chicago (July-August 1990).
17. Boyd and Gertler, "U.S. Commercial Banking."
18. E. Gerald Corrigan, "The Risk of a Financial Crisis," in MartinFeldstein, ed., The Risk of Economic Crisis (Chicago: Universityof Chicago Press, 1991), pp. 44-53.
19. Boyd and Gertler, "U.S. Commercial Banking," pp. 12-14.
20. General Accounting Office, Financial Derivatives: Actions Neededto Protect the Financial System (May 18, 1994).
14 THE CHANGING BUSINESS OF BANKING June 1994
and a stock market "break." Banks tied to regionalmarkets suffered from declines in agriculture, en-ergy, and real estate.
Macroeconomic Conditions,Regional Disparities,and Asset Losses
General economic conditions affect the financialcondition of bank customers and therefore influencebank profitability. The 1970s and 1980s share simi-lar business cycle patterns. Both decades beganwith modest recessions that grew more serious andwere followed by booms. The similarities in termsof lost production and unemployment are striking.But the recession of the 1980s was marked by moresevere regional dislocations than that of the 1970s.Some macroeconomists have characterized the eco-nomic environment of the 1980s as one big rollingregional recession hitting different geographic areasat different times over the decade. Lost steel pro-duction in the early 1980s preceded the oil and farmsector problems of the middle 1980s, which pre-ceded the economic problems in New England andCalifornia in the late 1980s.
There were periods in the 1980s when the valueof the dollar was high in relation to other curren-cies, export trade suffered, and industries such asagriculture, which rely heavily on exports, declined.During these periods, foreign competition increasedagainst some of the more labor-intensive industriesin which lower labor costs gave foreign firms acomparative advantage. In addition, changes inworld prices affected the demand for the products ofsome important domestic industries. For example,the steel and energy industries were hit by a price-induced decline in consumer demand for thosegoods.
Regional Variation in Bank Failure
During the 1987-1992 period, the FDIC resolvedsome 7 percent of those banks in existence at thebeginning of 1987, or 1,049 in all (see Table 1).
Analysis reveals a strong regional pattern of higher-than-average bank resolutions associated with re-gions experiencing temporary economic difficulties.The Southwestern states, principally the oil state ofTexas, accounted for 60 percent of the resolutionsover the six-year period. The majority of these 631resolutions occurred between 1987 and 1990,around the period when oil and real estate pricescollapsed in this region. The Northeast region,accounting for about 13 percent of resolutions (132banks) is a distant second in the number of failures.Most of the resolutions in this region occurred be-tween 1990 and 1992 and were associated with thedownturn in the real estate sector in the New Eng-land states. The West and Midwest regions com-bine to account for about 20 percent of resolvedinstitutions (119 and 97 banks, respectively) overthe period. These regions contain a high proportionof agricultural states. During the mid-1980s, theagriculture sector experienced a downturn that con-tributed to bank failures in subsequent years.
Comparing the national average of resolutionswith the incidence by region, the Southwest showeda disproportionately large number of resolutions andassets held by resolved banks. In the Southwest, 20percent of the banks in the region had to be re-solved between 1987 and 1992. These resolvedinstitutions held 32 percent of the industry assets inplace at the beginning of 1987. The only other re-gion that was significantly higher than the nationalaverage in both categories was the Northeast. It istherefore not surprising that these two regions domi-nated the number and costs of resolutions duringthis period. The Southwest and Northeast bank res-olutions (631 and 132 banks, respectively) com-bined to account for 73 percent of the number ofresolutions and about 90 percent of the losses to theBank Insurance Fund for the 1987-1992 period.
Texas: A Special Case. There is clearly substan-tial interstate variation in bank failure and resolutionexperiences. Two states escaped without any fail-ures between 1987 and 1992. Another 13 statesexperienced only one or two bank resolutions.21 By
21. Federal Deposit Insurance Corporation, Division of Finance, Fi-nancial Reporting Branch, Failed Bank Cost Analysis, 1986-1992(1993).
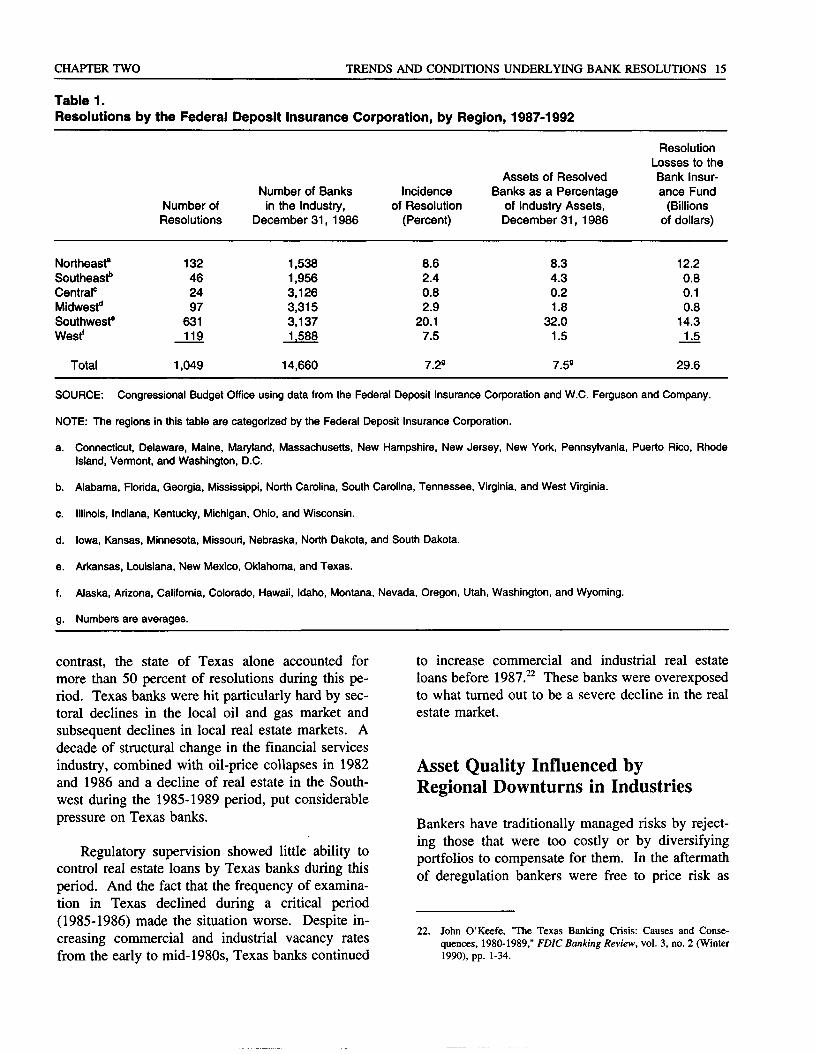
CHAPTER TWO TRENDS AND CONDITIONS UNDERLYING BANK RESOLUTIONS 15
Table 1.Resolutions by the Federal Deposit Insurance Corporation, by Region, 1987-1992
Northeast*Southeast5
Central0
Midwest"Southwest6
Westf
Number ofResolutions
132462497
631119
Number of Banksin the Industry,
December 31, 1986
1,5381,9563,1263,3153,1371.588
Incidenceof Resolution
(Percent)
8.62.40.82.9
20.17.5
Assets of ResolvedBanks as a Percentage
of Industry Assets,December 31, 1986
8.34.30.21.8
32.01.5
ResolutionLosses to theBank Insur-ance Fund
(Billionsof dollars)
12.20.80.10.8
14.31.5
Total 1,049 14,660 7.29 7.59 29.6
SOURCE: Congressional Budget Office using data from the Federal Deposit Insurance Corporation and W.C. Ferguson and Company.
NOTE: The regions in this table are categorized by the Federal Deposit Insurance Corporation.
a. Connecticut, Delaware, Maine, Maryland, Massachusetts, New Hampshire, New Jersey, New York, Pennsylvania, Puerto Rico, RhodeIsland, Vermont, and Washington, D.C.
b. Alabama, Florida, Georgia, Mississippi, North Carolina, South Carolina, Tennessee, Virginia, and West Virginia.
c. Illinois, Indiana, Kentucky, Michigan, Ohio, and Wisconsin.
d. Iowa, Kansas, Minnesota, Missouri, Nebraska, North Dakota, and South Dakota.
e. Arkansas, Louisiana, New Mexico, Oklahoma, and Texas.
f. Alaska, Arizona, California, Colorado, Hawaii, Idaho, Montana, Nevada, Oregon, Utah, Washington, and Wyoming.
g. Numbers are averages.
contrast, the state of Texas alone accounted formore than 50 percent of resolutions during this pe-riod. Texas banks were hit particularly hard by sec-toral declines in the local oil and gas market andsubsequent declines in local real estate markets. Adecade of structural change in the financial servicesindustry, combined with oil-price collapses in 1982and 1986 and a decline of real estate in the South-west during the 1985-1989 period, put considerablepressure on Texas banks.
Regulatory supervision showed little ability tocontrol real estate loans by Texas banks during thisperiod. And the fact that the frequency of examina-tion in Texas declined during a critical period(1985-1986) made the situation worse. Despite in-creasing commercial and industrial vacancy ratesfrom the early to mid-1980s, Texas banks continued
to increase commercial and industrial real estateloans before 1987.22 These banks were overexposedto what turned out to be a severe decline in the realestate market.
Asset Quality Influenced byRegional Downturns in Industries
Bankers have traditionally managed risks by reject-ing those that were too costly or by diversifyingportfolios to compensate for them. In the aftermathof deregulation bankers were free to price risk as
22. John O'Keefe, "The Texas Banking Crisis: Causes and Conse-quences, 1980-1989," FDIC Banking Review, vol. 3, no. 2 (Winter1990), pp. 1-34.
16 THE CHANGING BUSINESS OF BANKING June 1994
they saw fit-through interest rates charged to bor-rowers and paid to depositors. But increased com-petition left banks with razor-thin profit margins anda limited ability to raise prices as a way of compen-sating for risk.
The economic shocks of the 1980s and the early1990s jeopardized banks that violated some of thebasic principles of risk management. These institu-tions typically held portfolios that were inadequatelydiversified and composed of loans that were poorlypriced; loan officers granted loans to less credit-worthy customers. Managers who increase the riskof a portfolio by concentrating assets lose more ifthose sectors of the economy upon which it concen-trates experience a downturn. Real estate and ener-gy-related investment are two primary examples ofassets in which banks in various regions becameoverexposed.
Real Estate Investment. For most of the 1970sand early 1980s, real estate investment appeared tobe a perfect hedge against inflation. The stock andbond markets were crippled by inflation in the1970s. Commodity prices and exchange rates fluc-tuated, but real estate held its value, increasingsteadily over the 1973-1974 period of inflation andwell into the 1980s. Banks acted accordingly, di-verting larger portions of their portfolios to real-es-tate-based assets.
In the early 1980s, federal tax legislation con-tributed to the upswing in real estate by giving thereal estate industry deep tax subsidies. In particular,the Economic Recovery Tax Act of 1981 offeredlarge depreciation deductions for commercial realestate. The prevailing high interest rates createdboth large passive losses and a booming tax shelterto partnership investors in real estate. Passivelosses meant that investors could profitably syndi-cate losses through shell corporations to people withtax liabilities.
The tax subsidies that stimulated the demand forreal estate investment, along with the Garn-StGermain Depository Institutions Act of 1982, al-lowed banks to invest more of their portfolios inreal estate. The act eliminated margin limits on realestate lending. Banks and savings and loans rushedto fill the resulting demand for construction. Banks
began offering debt financing with little equity.They even began to pay closing costs to attract cus-tomers.
After the recession in early 1981 and 1982, thedemand for commercial space did not materialize asexpected. The vacancy rate for office buildings in31 major markets rose from 5 percent in 1980 toabout 14 percent in 1983.23 Some banks continuedto exercise little caution, real estate lending contin-ued, and credit standards began to erode. In thethree years after passage of the Garn-St GermainAct, Texas commercial banks tripled their construc-tion and land development loans. But the heavyinvestment in commercial real estate was not con-fined to Texas banks.
After partial deregulation of the industry in theearly 1980s, bankers across the country investedsome $350 billion in commercial real estate lendingthat produced 32 percent of all the existing officespace in America during the 1980s. Developerswere not required to demonstrate firm leases forcommercial real estate development. Savings andloans, a growing competitor of banks for both loansand deposits, became willing to act as real estateequity investors through their real estate service cor-porations. Appraisers continued to overvalue realestate investments, justifying continued bank lend-ing.
By 1986, vacancy rates in downtown officemarkets exceeded 16 percent.24 The Tax ReformAct of 1986 reversed generous tax depreciationallowances, increased capital gains tax rates, andrestricted passive loss deductions. It became evi-dent that the real estate boom was ending. Projectsonce economically viable, if only as tax shelters,became losses. By 1988, nine of the top 10 banksin Texas, all exhibiting portfolios with heavy con-centrations of real estate holdings, required FDICresolution. Commercial real estate investmentsbegan to decline as excess capacity became moreprominent in New England, New York, and Califor-
23. Holland, "The Bank and Thrift Crises."
24. Patric Hendershott and Edward Kane, "Office Market ValuesDuring the Past Decade: How Distributed Have Appraisals Been?"Working Paper No. 4128 (National Bureau of Economic Research,Cambridge, Mass., July 1992).
CHAPTER TWO TRENDS AND CONDITIONS UNDERLYING BANK RESOLUTIONS 17
nia. Real estate loans in these areas of the countrybecame nonperforming and eventually the defaultrate on them contributed to a number of bank fail-ures. Developers with high vacancy rates declaredbankruptcy and bankers had little choice but to ac-cept vacant and semi vacant properties. By 1991,the nationwide vacancy rate for commercial officespace had reached 20 percent.
At the beginning of the 1980s, real estate loansmade up 25 percent of the banking industry's loanportfolio. By the end of the decade, real estate con-stituted 43 percent of the loan portfolios of surviv-ing banks and an even greater portion of the loanportfolios of failed banks. Surviving banks heldmore than $1 trillion of their assets in real estate.By the end of 1991, banks were carrying $90 billionin nonperforming real estate loans, 75 percent ofwhich were held by 57 bank holding companies.Conservative estimates made in 1992 suggest thatexcess capacity in real estate sales may take 5 to 10years to work off.25 Economic losses associatedwith this overbuilding could cost $220 billion to$300 billion.
In retrospect, it is clear that some banks under-priced loans and real estate investments as theysought to increase asset volume and compete with
savings and loans. Many of these banks subse-quently failed. A former chairman of the FDIC,testifying before the Senate Banking Committee in1992, suggested that "we wouldn't have a problemif banks had been prevented from lending on rawland, forbidden to make commercial real estateloans without the borrower putting up 25 percent,and required to get personal guarantees from bor-rowers. Those were ironclad rules 20 years ago."26
Energy Investment. Real estate problems, likeinflation, were linked to the twin energy crises ofthe 1970s. The oil shortages produced a surge ofeconomic development and growth in the South-west. Oil companies with proven reserves under-took a flurry of domestic exploration. Banks beganto finance mineral leases, exploration, and construc-tion of corporate headquarters in the Southwest.Loans were backed by oil prices at $40 per barrel.In 1981, however, oil prices began to slide. By themid-1980s, oil fell to $20 a barrel. When energyprices began to decline in the middle 1980s, so didthe Southwest's economy. Banks that investedheavily in the oil fields of the Southwest sufferedenormous losses. A significant percentage of thebanks resolved in the Southwest between 1987 and1992 were located in the oil-producing states ofTexas, Oklahoma, and Louisiana.
25. Hendershott and Kane, "Office Market Values During the PastDecade," p. 69.
26. Statement of William Seidman before the Senate Banking Com-mittee, March 31, 1992.

Chapter Three
The Role of Management andInstitution-Specific FactorsAssociated with Resolutions
B ank resolutions in the late 1980s and early1990s followed or coincided with periods ofserious economic decline and structural
change in financial markets. It is easy to attributethe rash of bank resolutions in the 1980s entirely toadverse economic conditions, and the presumptionis reinforced by the inordinately large number offailures in particular geographic regions. But virtu-ally all banks underwent the adverse economicconditions and enhanced competition that troubledthe 1970s and early 1980s. A majority weatheredthese circumstances and some even prospered.Analyses of surviving and resolved banks revealthat under almost identical circumstances, manage-ment generally plays an important role in determin-ing why one bank survives and another fails.
Ultimately, a bank's management and board ofdirectors and their cumulative decisions are respon-sible for the success or failure of the institution.Although regulators play a role in shaping the envi-ronment in which banks must operate, they cannotclaim primary responsibility for the success or fail-ure of a bank.
directors before resolution. The study containsproprietary data that are generally available only toanalysts within banking regulatory agencies.1 Thesedata include information prepared by bank examin-ers of the Office of the Comptroller of the Currency(OCC) about the financial status of banks.
The sample used in the study includes 171resolved banks and represents 94 percent of the res-olutions of national banks from 1979 through 1987.In addition to resolutions, the study examines 51rehabilitated banks—that is, national banks thatrecovered from a weakened financial state. Thelocations, external problems, and asset sizes of therehabilitated banks are similar to those of the re-solved banks in the sample and therefore provide arelevant comparison of resolved banks to weakenedbanks that survived. This study also compares thetwo groups of rehabilitated and resolved banks to acontrol group of 28 banks that remained healthyduring the period.
The study found that so-called management-driven weaknesses played a "significant role" in the
Management andBank Failure
A study of banks that were resolved during the1980s identifies major causes of bank failures byusing data from examiners' reports that specificallycharacterize the quality of managers and boards of
F. Graham and J. Horner, "Bank Failure: An Evaluation of theFactors Contributing to the Failure of National Banks," BankStructure and Competition: Proceedings from the Federal ReserveBank of Chicago (1988). Studies testing similar hypotheses usingmore recent data are not available.
See also Gary Gorton and Richard Rosen, "Corporate Control,Portfolio Choice and the Decline of Banking," Finance and Eco-nomics Discussion Series No. 215 (Board of Governors of theFederal Reserve System, 1992). This study focuses on managerialentrenchment problems contributing to a decline in banks.
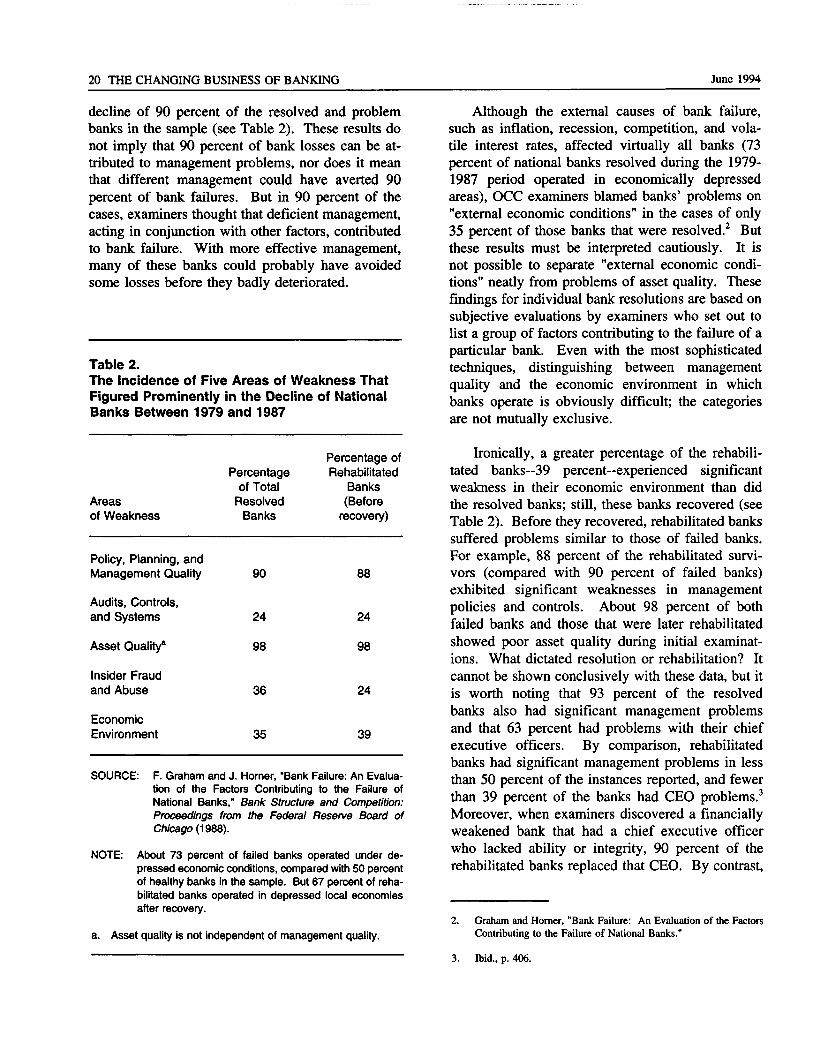
20 THE CHANGING BUSINESS OF BANKING June 1994
decline of 90 percent of the resolved and problembanks in the sample (see Table 2). These results donot imply that 90 percent of bank losses can be at-tributed to management problems, nor does it meanthat different management could have averted 90percent of bank failures. But in 90 percent of thecases, examiners thought that deficient management,acting in conjunction with other factors, contributedto bank failure. With more effective management,many of these banks could probably have avoidedsome losses before they badly deteriorated.
Table 2.The Incidence of Five Areas of Weakness ThatFigured Prominently in the Decline of NationalBanks Between 1979 and 1987
Areasof Weakness
Percentageof Total
ResolvedBanks
Percentage ofRehabilitated
Banks(Before
recovery)
Policy, Planning, andManagement Quality 90
Audits, Controls,and Systems 24
Asset Quality3 98
Insider Fraudand Abuse 36
EconomicEnvironment 35
88
24
98
24
39
SOURCE: F. Graham and J. Horner, "Bank Failure: An Evalua-tion of the Factors Contributing to the Failure ofNational Banks," Bank Structure and Competition:Proceedings from the Federal Reserve Board ofChicago (1988).
NOTE: About 73 percent of failed banks operated under de-pressed economic conditions, compared with 50 percentof healthy banks in the sample. But 67 percent of reha-bilitated banks operated in depressed local economiesafter recovery.
a. Asset quality is not independent of management quality.
Although the external causes of bank failure,such as inflation, recession, competition, and vola-tile interest rates, affected virtually all banks (73percent of national banks resolved during the 1979-1987 period operated in economically depressedareas), OCC examiners blamed banks' problems on"external economic conditions" in the cases of only35 percent of those banks that were resolved.2 Butthese results must be interpreted cautiously. It isnot possible to separate "external economic condi-tions" neatly from problems of asset quality. Thesefindings for individual bank resolutions are based onsubjective evaluations by examiners who set out tolist a group of factors contributing to the failure of aparticular bank. Even with the most sophisticatedtechniques, distinguishing between managementquality and the economic environment in whichbanks operate is obviously difficult; the categoriesare not mutually exclusive.
Ironically, a greater percentage of the rehabili-tated banks—39 percent—experienced significantweakness in their economic environment than didthe resolved banks; still, these banks recovered (seeTable 2). Before they recovered, rehabilitated bankssuffered problems similar to those of failed banks.For example, 88 percent of the rehabilitated survi-vors (compared with 90 percent of failed banks)exhibited significant weaknesses in managementpolicies and controls. About 98 percent of bothfailed banks and those that were later rehabilitatedshowed poor asset quality during initial examinat-ions. What dictated resolution or rehabilitation? Itcannot be shown conclusively with these data, but itis worth noting that 93 percent of the resolvedbanks also had significant management problemsand that 63 percent had problems with their chiefexecutive officers. By comparison, rehabilitatedbanks had significant management problems in lessthan 50 percent of the instances reported, and fewerthan 39 percent of the banks had CEO problems.3
Moreover, when examiners discovered a financiallyweakened bank that had a chief executive officerwho lacked ability or integrity, 90 percent of therehabilitated banks replaced that CEO. By contrast,
Graham and Horner, "Bank Failure: An Evaluation of the FactorsContributing to the Failure of National Banks."
3. Ibid., p. 406.
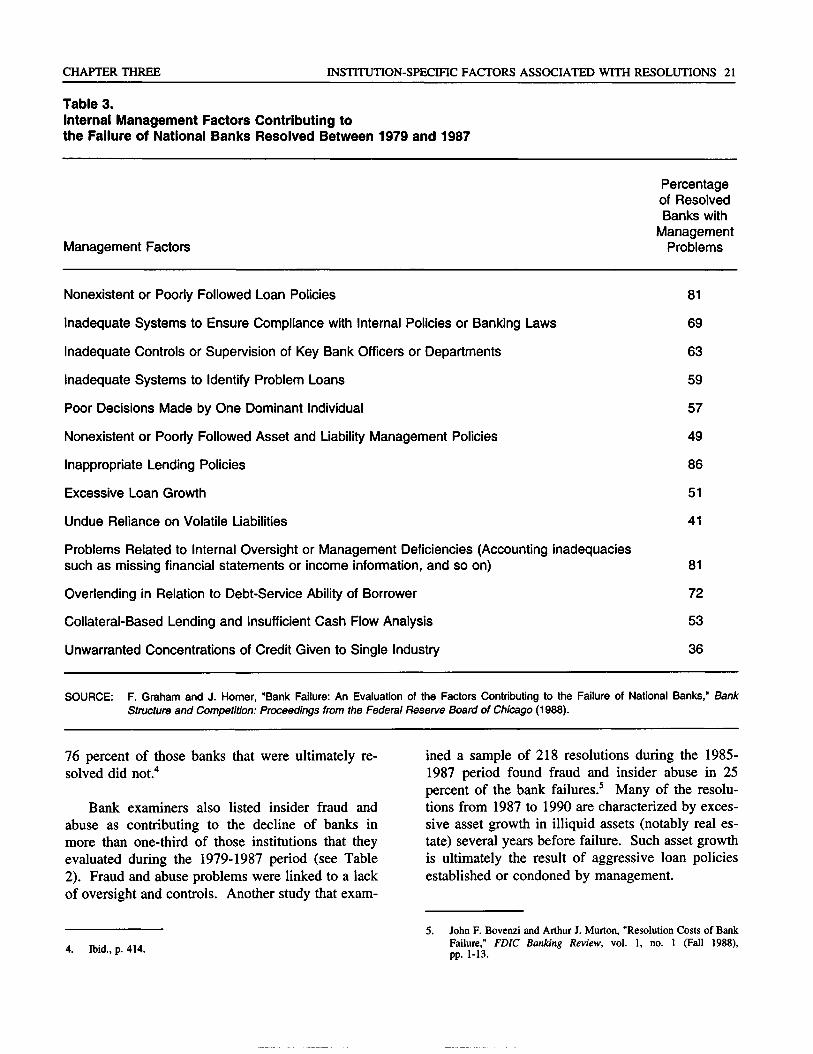
CHAPTER THREE INSTITUTION-SPECIFIC FACTORS ASSOCIATED WITH RESOLUTIONS 21
Table 3.Internal Management Factors Contributing tothe Failure of National Banks Resolved Between 1979 and 1987
Management Factors
Percentageof ResolvedBanks with
ManagementProblems
Nonexistent or Poorly Followed Loan Policies 81
Inadequate Systems to Ensure Compliance with Internal Policies or Banking Laws 69
Inadequate Controls or Supervision of Key Bank Officers or Departments 63
Inadequate Systems to Identify Problem Loans 59
Poor Decisions Made by One Dominant Individual 57
Nonexistent or Poorly Followed Asset and Liability Management Policies 49
Inappropriate Lending Policies 86
Excessive Loan Growth 51
Undue Reliance on Volatile Liabilities 41
Problems Related to Internal Oversight or Management Deficiencies (Accounting inadequaciessuch as missing financial statements or income information, and so on) 81
Overlending in Relation to Debt-Service Ability of Borrower 72
Collateral-Based Lending and Insufficient Cash Flow Analysis 53
Unwarranted Concentrations of Credit Given to Single Industry 36
SOURCE: F. Graham and J. Homer, "Bank Failure: An Evaluation of the Factors Contributing to the Failure of National Banks," BankStructure and Competition: Proceedings from the Federal Reserve Board of Chicago (1988).
76 percent of those banks that were ultimately re-solved did not.4
Bank examiners also listed insider fraud andabuse as contributing to the decline of banks inmore than one-third of those institutions that theyevaluated during the 1979-1987 period (see Table2). Fraud and abuse problems were linked to a lackof oversight and controls. Another study that exam-
4. Ibid., p. 414.
ined a sample of 218 resolutions during the 1985-1987 period found fraud and insider abuse in 25percent of the bank failures.5 Many of the resolu-tions from 1987 to 1990 are characterized by exces-sive asset growth in illiquid assets (notably real es-tate) several years before failure. Such asset growthis ultimately the result of aggressive loan policiesestablished or condoned by management.
5. John F. Bovenzi and Arthur J. Murton, "Resolution Costs of BankFailure," FD1C Banking Review, vol. 1, no. 1 (Fall 1988),pp. 1-13.
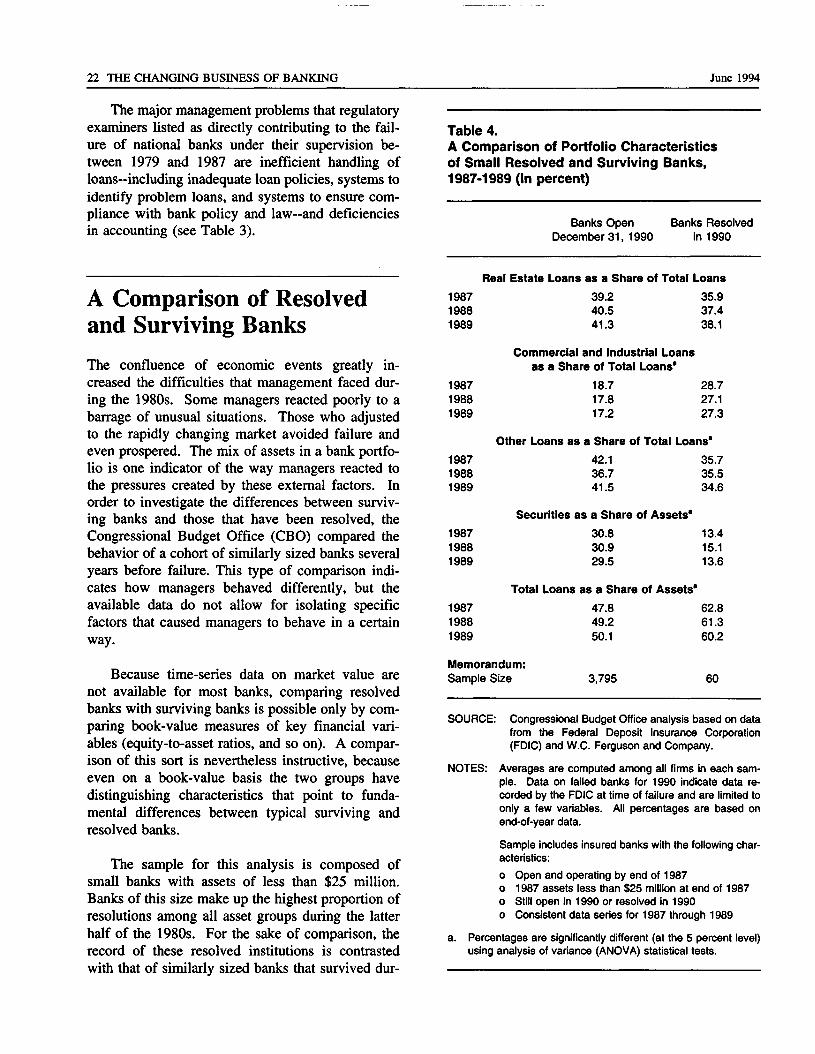
22 THE CHANGING BUSINESS OF BANKING June 1994
The major management problems that regulatoryexaminers listed as directly contributing to the fail-ure of national banks under their supervision be-tween 1979 and 1987 are inefficient handling ofloans—including inadequate loan policies, systems toidentify problem loans, and systems to ensure com-pliance with bank policy and law—and deficienciesin accounting (see Table 3).
A Comparison of Resolvedand Surviving Banks
The confluence of economic events greatly in-creased the difficulties that management faced dur-ing the 1980s. Some managers reacted poorly to abarrage of unusual situations. Those who adjustedto the rapidly changing market avoided failure andeven prospered. The mix of assets in a bank portfo-lio is one indicator of the way managers reacted tothe pressures created by these external factors. Inorder to investigate the differences between surviv-ing banks and those that have been resolved, theCongressional Budget Office (CBO) compared thebehavior of a cohort of similarly sized banks severalyears before failure. This type of comparison indi-cates how managers behaved differently, but theavailable data do not allow for isolating specificfactors that caused managers to behave in a certainway.
Because time-series data on market value arenot available for most banks, comparing resolvedbanks with surviving banks is possible only by com-paring book-value measures of key financial vari-ables (equity-to-asset ratios, and so on). A compar-ison of this sort is nevertheless instructive, becauseeven on a book-value basis the two groups havedistinguishing characteristics that point to funda-mental differences between typical surviving andresolved banks.
The sample for this analysis is composed ofsmall banks with assets of less than $25 million.Banks of this size make up the highest proportion ofresolutions among all asset groups during the latterhalf of the 1980s. For the sake of comparison, therecord of these resolved institutions is contrastedwith that of similarly sized banks that survived dur-
Table 4.A Comparison of Portfolio Characteristicsof Small Resolved and Surviving Banks,1987-1989 (In percent)
Banks OpenDecember 31, 1990
Banks Resolvedin 1990
Real Estate Loans as a Share of Total Loans
1987 39.2 35.919881989
198719881989
198719881989
198719881989
40.5 37.441.3 38.1
Commercial and Industrial Loansas a Share of Total Loans*
18.7 28.717.8 27.117.2 27.3
Other Loans as a Share of Total Loans"
42.1 35.736.7 35.541.5 34.6
Securities as a Share of Assets*
30.8 13.430.9 15.129.5 13.6
Total Loans as a Share of Assets'
198719881989
Memorandum:Sample Size
47.849.250.1
3,795
62.861.360.2
60
SOURCE: Congressional Budget Office analysis based on datafrom the Federal Deposit Insurance Corporation(FDIC) and W.C. Ferguson and Company.
NOTES: Averages are computed among all firms in each sam-ple. Data on failed banks for 1990 indicate data re-corded by the FDIC at time of failure and are limited toonly a few variables. All percentages are based onend-of-year data.
Sample includes insured banks with the following char-acteristics:
o Open and operating by end of 1987o 1987 assets less than $25 million at end of 1987o Still open in 1990 or resolved in 1990o Consistent data series for 1987 through 1989
a. Percentages are significantly different (at the 5 percent level)using analysis of variance (ANOVA) statistical tests.
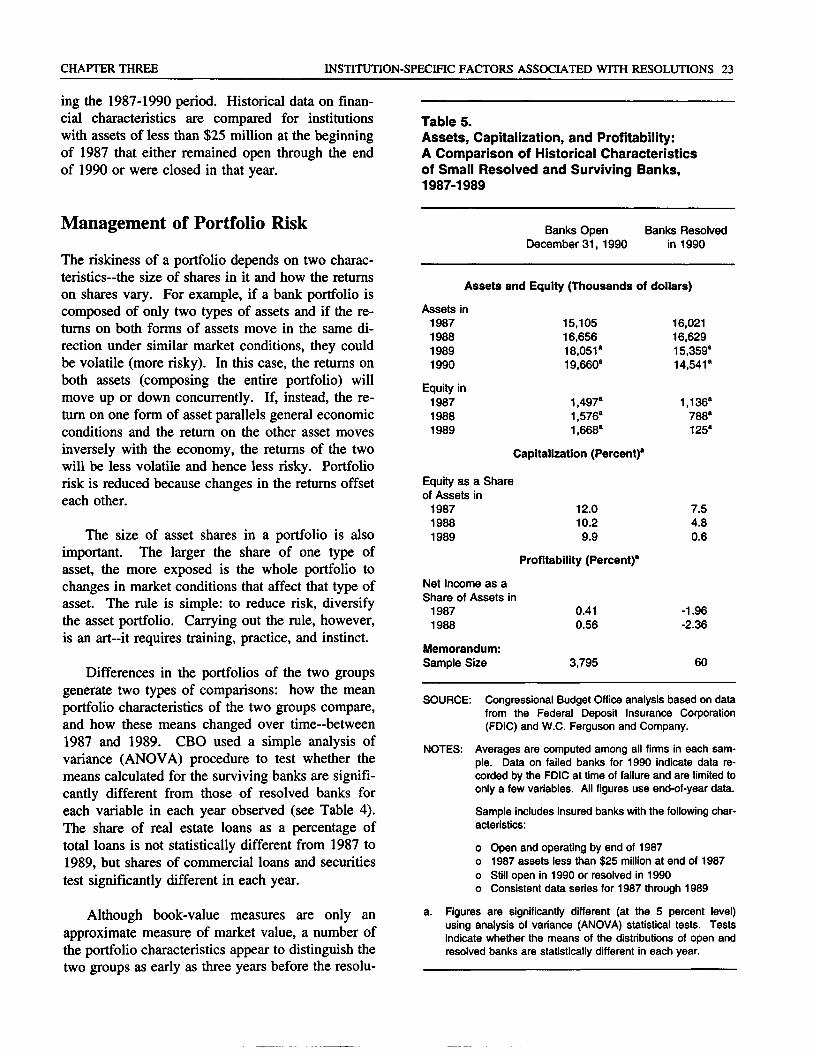
CHAPTER THREE INSTITUTION-SPECIFIC FACTORS ASSOCIATED WITH RESOLUTIONS 23
ing the 1987-1990 period. Historical data on finan-cial characteristics are compared for institutionswith assets of less than $25 million at the beginningof 1987 that either remained open through the endof 1990 or were closed in that year.
Table 5.Assets, Capitalization, and Profitability:A Comparison of Historical Characteristicsof Small Resolved and Surviving Banks,1987-1989
Management of Portfolio Risk
The riskiness of a portfolio depends on two charac-teristics—the size of shares in it and how the returnson shares vary. For example, if a bank portfolio iscomposed of only two types of assets and if the re-turns on both forms of assets move in the same di-rection under similar market conditions, they couldbe volatile (more risky). In this case, the returns onboth assets (composing the entire portfolio) willmove up or down concurrently. If, instead, the re-turn on one form of asset parallels general economicconditions and the return on the other asset movesinversely with the economy, the returns of the twowill be less volatile and hence less risky. Portfoliorisk is reduced because changes in the returns offseteach other.
The size of asset shares in a portfolio is alsoimportant. The larger the share of one type ofasset, the more exposed is the whole portfolio tochanges in market conditions that affect that type ofasset. The rule is simple: to reduce risk, diversifythe asset portfolio. Carrying out the rule, however,is an art—it requires training, practice, and instinct.
Differences in the portfolios of the two groupsgenerate two types of comparisons: how the meanportfolio characteristics of the two groups compare,and how these means changed over time—between1987 and 1989. CBO used a simple analysis ofvariance (ANOVA) procedure to test whether themeans calculated for the surviving banks are signifi-cantly different from those of resolved banks foreach variable in each year observed (see Table 4).The share of real estate loans as a percentage oftotal loans is not statistically different from 1987 to1989, but shares of commercial loans and securitiestest significantly different in each year.
Although book-value measures are only anapproximate measure of market value, a number ofthe portfolio characteristics appear to distinguish thetwo groups as early as three years before the resolu-
Banks OpenDecember 31, 1990
Banks Resolvedin 1990
Assets and Equity (Thousands of dollars)
Assets in1987198819891990
Equity in198719881989
15,10516,65618,051a
19,660a
1,497a
1,576a
1,668a
Capitalization (Percent)*
16,02116,62915,359a
14,541a
1,136a
788a
125a
Equity as a Shareof Assets in198719881989
12.010.29.9
Profitability (Percent)*
Net Income as aShare of Assets in
1987 0.411988 0.56
Memorandum:Sample Size 3,795
7.54.80.6
-1.96-2.36
60
SOURCE: Congressional Budget Office analysis based on datafrom the Federal Deposit Insurance Corporation(FDIC) and W.C. Ferguson and Company.
NOTES: Averages are computed among all firms in each sam-ple. Data on failed banks for 1990 indicate data re-corded by the FDIC at time of failure and are limited toonly a few variables. All figures use end-of-year data.
Sample includes insured banks with the following char-acteristics:
o Open and operating by end of 1987o 1987 assets less than $25 million at end of 1987o Still open in 1990 or resolved in 1990o Consistent data series for 1987 through 1989
a. Figures are significantly different (at the 5 percent level)using analysis of variance (ANOVA) statistical tests. Testsindicate whether the means of the distributions of open andresolved banks are statistically different in each year.
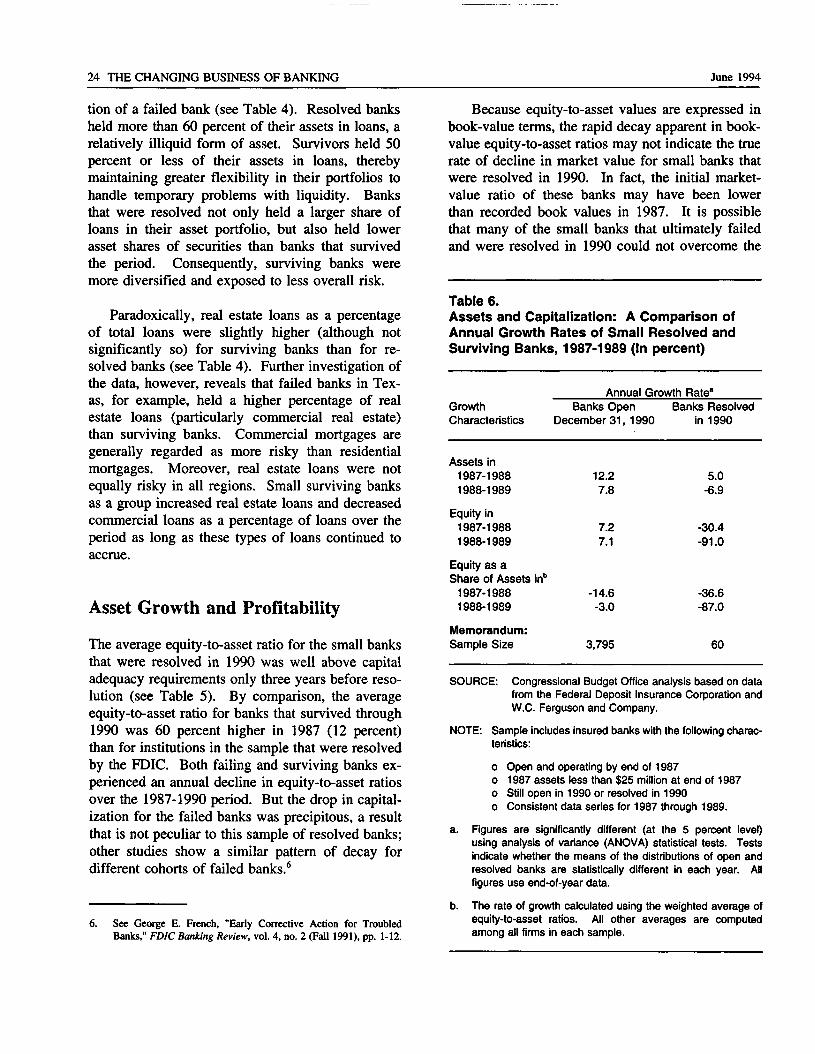
24 THE CHANGING BUSINESS OF BANKING June 1994
tion of a failed bank (see Table 4). Resolved banksheld more than 60 percent of their assets in loans, arelatively illiquid form of asset. Survivors held 50percent or less of their assets in loans, therebymaintaining greater flexibility in their portfolios tohandle temporary problems with liquidity. Banksthat were resolved not only held a larger share ofloans in their asset portfolio, but also held lowerasset shares of securities than banks that survivedthe period. Consequently, surviving banks weremore diversified and exposed to less overall risk.
Paradoxically, real estate loans as a percentageof total loans were slightly higher (although notsignificantly so) for surviving banks than for re-solved banks (see Table 4). Further investigation ofthe data, however, reveals that failed banks in Tex-as, for example, held a higher percentage of realestate loans (particularly commercial real estate)than surviving banks. Commercial mortgages aregenerally regarded as more risky than residentialmortgages. Moreover, real estate loans were notequally risky in all regions. Small surviving banksas a group increased real estate loans and decreasedcommercial loans as a percentage of loans over theperiod as long as these types of loans continued toaccrue.
Asset Growth and Profitability
The average equity-to-asset ratio for the small banksthat were resolved in 1990 was well above capitaladequacy requirements only three years before reso-lution (see Table 5). By comparison, the averageequity-to-asset ratio for banks that survived through1990 was 60 percent higher in 1987 (12 percent)than for institutions in the sample that were resolvedby the FDIC. Both failing and surviving banks ex-perienced an annual decline in equity-to-asset ratiosover the 1987-1990 period. But the drop in capital-ization for the failed banks was precipitous, a resultthat is not peculiar to this sample of resolved banks;other studies show a similar pattern of decay fordifferent cohorts of failed banks.6
Because equity-to-asset values are expressed inbook-value terms, the rapid decay apparent in book-value equity-to-asset ratios may not indicate the truerate of decline in market value for small banks thatwere resolved in 1990. In fact, the initial market-value ratio of these banks may have been lowerthan recorded book values in 1987. It is possiblethat many of the small banks that ultimately failedand were resolved in 1990 could not overcome the
Table 6.Assets and Capitalization: A Comparison ofAnnual Growth Rates of Small Resolved andSurviving Banks, 1987-1989 (In percent)
Annual Growth Ratea
GrowthCharacteristics
Banks OpenDecember 31, 1990
Banks Resolvedin 1990
Assets in1987-1988 12.21988-1989 7.8
Equity in1987-1988 7.21988-1989 7.1
Equity as aShare of Assets inb
1987-1988 -14.61988-1989 -3.0
Memorandum:Sample Size 3,795
5.0-6.9
-30.4-91.0
-36.6-87.0
60
6. See George E. French, "Early Corrective Action for TroubledBanks," FDIC Banking Review, vol. 4, no. 2 (Fall 1991), pp. 1-12.
SOURCE: Congressional Budget Office analysis based on datafrom the Federal Deposit Insurance Corporation andW.C. Ferguson and Company.
NOTE: Sample includes insured banks with the following charac-teristics:
o Open and operating by end of 1987o 1987 assets less than $25 million at end of 1987o Still open in 1990 or resolved in 1990o Consistent data series for 1987 through 1989.
a. Figures are significantly different (at the 5 percent level)using analysis of variance (ANOVA) statistical tests. Testsindicate whether the means of the distributions of open andresolved banks are statistically different in each year. Allfigures use end-of-year data.
b. The rate of growth calculated using the weighted average ofequity-to-asset ratios. All other averages are computedamong all firms in each sample.
CHAPTER THREE INSTITUTION-SPECIFIC FACTORS ASSOCIATED WITH RESOLUTIONS 25
embedded losses that they incurred before 1987.Without market data on individual banks, there isno clear way to determine which event bestdescribes reality. Data indicate that these bankswere suffering income losses as early as 1987, whenthe average return on assets was a negative 2 per-cent (see Table 5). Moreover, for the next twoyears the average return on assets for the institutionsresolved in 1990 remained negative.
It is also possible that losses may not have beenentirely embedded. Although earnings were suffer-ing, the average equity-to-asset ratio in the groupwas 7.5 percent in 1987. One year later, the aver-age equity-to-asset ratio was less than 5 percent.Generally, weakly capitalized banks attempt to in-crease capital ratios by increasing income or reduc-ing assets. At least initially, the banks destined forresolution in 1990 apparently did not opt to reduceassets; the average growth in assets between 1987and 1988 was 5 percent (see Table 6). By 1989,however, the small banks that were destined to failand be resolved in 1990 experienced a large declinein the value of assets. In some cases, banks mayhave sold profitable assets to improve capitalization.It is also very likely that as examiners began to rec-ognize problems, they forced these banks to writedown some of their bad assets as a loss. Assets ofthe average small bank that was resolved in 1990declined from more than $16.6 million in 1988 to$14.5 million by the time of resolution.
In this sample, the average bank that was re-solved in 1990 displayed losses in net income for atleast three consecutive years before resolution. Theaverage equity of small banks resolved in 1990 de-clined by 30 percent between 1987 and 1988 and bymore than 90 percent from 1988 to 1989. Equitygrew at an average annual rate of 7 percent forbanks that survived the period. Losses in net in-come and significant reductions in equity clearlyindicate that the average small bank that was re-solved in 1990 was in serious financial difficulty atleast three years before resolution. Although someasset reduction began as early as two years beforefailure, it was not sufficient to raise equity-to-assetratios or circumvent the income losses that eventu-ally took place in resolved banks.
Some institutions were able to recover from aposition of being poorly capitalized. The recovery
of a bank from a status of undercapitalization de-pends upon the institution's capability to generateprofits, reduce assets, and issue external equity.
Do Weakly CapitalizedBanks Recover?
In 1985, federal banking regulators established aminimum primary capital-to-asset ratio of 5.5 per-cent for all commercial banks. Primary capital canbe thought of as actual equity available to absorblosses in case of failure. It consists of commonequity, perpetual preferred stock, and minority inter-est in equity accounts of consolidated subsidiaries(it does not include goodwill).
A 1990 study shows that the number of banksthat fell below a primary capital ratio of 5.5 percentalmost tripled between 1985 and 1988, and as manyas 455 banks fell below the minimum equity-to-asset ratio at the end of 1988.7 From 1981 to 1988,capital-to-asset ratios of about 1,500 banks fellbelow 5.5 percent. About 45 percent of these banksrecovered fully, their capital-to-asset ratios exceed-ing 5.5 percent. Some 36 percent were resolvedand the remaining 19 percent remained weaklycapitalized. The 1990 study tests the hypothesisthat the likelihood and speed of recovery are notaffected by near-term earnings, nor are they influ-enced by the ability to raise capital by issuing exter-nal equity. The study rejects this hypothesis andconcludes that banks that have positive earnings andcan raise capital usually do not require resolution.
Another study published in 1991 examines agroup of commercial banks, the primary capitalratios of which remained less than 5.5 percent formore than four consecutive quarters between 1985and 1989.8 This study shows that only 24 percentof the banks that remained undercapitalized for
M. Spivey and D. Dahl, "An Examination of the Efforts of Com-mercial Banks to Recover from Undercapitalization" (paper pre-sented at the annual meeting of the Financial Management Associ-ation, Orlando, Florida, 1990).
R. Alton Gilbert, "Supervision of Undercapitalized Banks: IsThere a Case for Change?" in Federal Reserve Bank of Chicago,Rebuilding Banking: Proceedings of the 27th Annual Conferenceon Bank Structure and Competition, May 1-3, 1991, pp. 335-357.
26 THE CHANGING BUSINESS OF BANKING June 1994
more than a year were able to increase their capitalratio sufficiently to recover by the end of 1989.The study also adds an important regional insight.The ability to recover from weak capitalization wasmuch greater for banks outside those energy-pro-ducing states that were experiencing a decline at thetime. In this study, only 10 percent of the banks inLouisiana, Texas, and Oklahoma were able to re-cover, although the recovery rate was 46 percent forbanks located outside this region.
The Effectiveness of Early Closure. The FederalDeposit Insurance Corporation Improvement Act of1991 authorizes the FDIC to resolve banks that dipbelow tangible equity-to-asset ratios of 2 percentmeasured as book value. One way to assess thepotential effectiveness of a rigidly imposed earlyclosure rule is to examine the record of failure andrecovery of banks whose equity-to-asset ratios fellbelow 2 percent. Of the 235 banks in the industrythat dropped below equity-to-asset ratios of 2 per-cent at the end of 1988, only 36 banks, or 15 per-cent, were still operating as of June 30, 1991.
The financial characteristics of these 36 surviv-ing banks indicate that those that recovered frombelow the threshold of 2 percent equity were rela-tively small, holding less than $80 million in assets.Only one of these institutions held assets greaterthan $500 million. A prominent characteristic ofthe survivors was the ability to raise capital. Totalequity for the group was only $31 million by theend of 1988. By June 1991, surviving banks hadincreased their equity more than fourfold, to $152million. The average surviving bank was able toraise $3.9 million in two and one-half years.Equity-to-asset ratios for the average bank increasedfrom 1 percent by the end of 1988 to 5 percent byJune 1991.
These banks added equity largely by issuingnew common stock and selling bank-held stock atabove-par value. Book-value accounting conven-tions value stock at par value unless the stock issold. If the market value of stock exceeds parvalue, selling the stock will raise additional equity.Issues of new common stock amounted to about $21million, and the amount received from the sale ofold common stock in excess of par or stated valueamounted to $79 million.
Chapter Four
Bank Resolutions andthe Costs of Resolution
D uring the 1980s, regulators faced not onlyan increase in the number of bank failuresrequiring resolution, but an increase in the
average cost of resolving a bank. For the first 46years of the Bank Insurance Fund, resolution costs,measured as losses to the fund, averaged about 2percent of failed bank assets. The ratio of resolu-tion costs to bank assets increased to 8 percent inthe early 1980s and to about 17 percent between1986 and 1990. Resolution costs as a percentage offailed bank assets dropped to 11 percent in 1991and 1992, down from an average of more than 20percent in 1987 and 1989, the peak years of theperiod.
The cost to the insurance fund of resolving abank depends on the value of liabilities covered bydeposit insurance and the value of assets that can berecovered during the resolution process. Coveredliabilities include mostly insured deposits; uninsureddeposits may also be handled by the Federal De-posit Insurance Corporation, depending on the kindof resolution transaction. The loss on assets-thedifference between the book value of assets at thetime of resolution and the net value that can be re-covered if the assets are sold-is a major determi-nant of the cost of resolution. As the recoverablevalue of assets after resolution decreases, the cost ofresolving an institution increases. The average losson assets for resolved banks in the late 1980s wasabout 30 percent.1 The cost of resolving banks dur-
ing this period severely depleted the insurance fund.As the drain on the insurance fund continued, rec-ognition of bank insolvency and a timely exit policyfor insolvent institutions became a critical part ofregulatory efficiency.
Resolution Costs as Estimatesof BIF Losses
Although banks must answer to different charteringand supervisory regulators at the state and federallevel, each of which is charged with maintaining thesafety and soundness of the banking system, onlythe FDIC has the responsibility of selecting amethod of resolution that limits costs to the insur-ance fund. Methods for resolving banks can be di-vided into three general categories: payoffs andtransfers, including liquidations; purchase and as-sumptions or various types of mergers; and assis-tance transactions to ongoing institutions, such asopen-bank assistance.2 (See Appendix B for a de-tailed discussion of the categories of resolution.)
The choice of a method of resolution is gov-erned in large part by the FDIC's estimates of thepotential costs to the insurance fund. The FDIC isrequired by law to perform a cost test for proposedmethods of resolution. Before the Federal DepositInsurance Corporation Improvement Act of 1991,
Richard A. Brown and Seth Epstein, "Resolution Costs and BankFailures: An Update of the FDIC Historical Loss Model," FDICBanking Review, vol. 5, no. 1 (Spring/Summer 1992), pp. 1-16.
2. Open-bank assistance includes all forms of financial assistancebetween the FDIC and an ongoing bank.
28 THE CHANGING BUSINESS OF BANKING June 1994
the cost test required only that the chosen method ofresolution be no more costly to the insurance fundthan a payout of insured depositors and liquidationof assets (payout and liquidation), which would berequired to meet the FDIC's insurance obligation.Using this rule, the FDIC could select any feasiblemethod of resolution as long as the cost test wassatisfied. Under FDICIA, the FDIC is now requiredto consider all possible methods of resolution andchoose the least costly alternative. Usually theFDIC estimates the cost of payout and liquidation asa base case and compares it with costs of alternativemethods of resolution. The same techniques areused to calculate estimated costs for various meth-ods of resolution, but the new rule changes the wayin which the costs are compared.
Upon selecting the method of resolution, theFDIC provides an initial estimate of the resolutioncost based on the experience of the FDIC staff inresolving many other failed banks. The estimate isnot that of the full cost borne by all parties in thetransaction, but an estimate of the loss to the BIF.That is, it is an initial estimate of how much theinsurance fund will lose after the FDIC completesthe resolution of the bank and the disposition of itsassets. Estimates of losses require, at a minimum,that the FDIC appraise the market value of theassets and liabilities of the failed institution.
Insurance Costs and Methodsof Resolution
Resolution cost estimates represent the present valueof losses to the insurance fund and can be measuredby an accounting identity that includes market-valueassessments of the liabilities and assets and the ad-ministrative costs of resolution.3 The basic account-ing identity is:
Resolution Cost = Realized Liabilities - RealizedValue of Assets + Administrative Costs
The magnitude of this measure of cost depends onhow liabilities are defined and the realized value of
assets assessed. These terms mean different thingsfor different types of resolutions.
The way in which uninsured deposits are treatedaffects the size of realized liabilities. Realizedliabilities in a liquidation by the FDIC may belimited to insured deposits; if the bank is acquiredby another institution, however, realized liabilitiescould include a much broader set of liabilities. Dif-ferent methods of resolution can be characterized bywhether or not uninsured depositors are protected.In some resolution transactions, uninsured deposi-tors must absorb their proportionate share of lossesresulting from the closing of the failed bank. Com-mon examples of resolutions in which uninsureddepositors are not protected include insured deposittransfers and payouts. In other resolution methods,usually in the case of assumption transactions, unin-sured deposits are protected against loss resultingfrom bank failure.4
Aside from the treatment of uninsured deposits,the treatment of assets can significantly affect thecost to the BIF of resolving a bank. In the case ofa liquidation, the realized value of assets is simplythe value recovered for assets after disposal. In thecase of a merger, the total realized value of assetsmay also include a value for such intangibles asgoodwill; that is, the franchise value of the ongoingentity that the acquirer is willing to pay to obtainthe institution. Each method of resolution may han-dle failed-bank assets in as many as three ways.One way is to assign them to a receivership-dieentity that discharges the legal obligation of a re-solved institution. In this case the FDIC, as re-ceiver, is responsible for collecting and disposing ofthese assets. Another way of handling assets is thatsome portion (or all) of the assets of a resolvedbank may be assumed by the acquirer. In the thirdway, failed-bank assets are subject to a collectingpool or loss-sharing agreement. These assets aremanaged and collected by the acquirer on behalf ofthe FDIC. The acquirer generally receives manage-ment fees and in some cases enters into a loss-shar-
3. For this type of assessment, assets and liabilities include on- andoff-balance-sheet activities.
4. In an effort to comply better with the least-cost test imposed byFDICIA, in 1992 the FDIC deviated from the traditional use ofpurchase and assumption in which all deposits are usually as-sumed by the acquiring institution. The new method of resolutionis similar to the traditional purchase and assumption except thatonly insured deposits are transferred to the acquirer.
CHAPTER FOUR BANK RESOLUTIONS AND THE COSTS OF RESOLUTION 29
ing agreement with the FDIC. In an effort to re-duce losses to the BIF, the FDIC attempts to keepfailed bank assets under private control wheneverfeasible.
In practice, resolution costs are the differencebetween the initial disbursements that the FDICmakes to resolve a failed bank and the present valueof the amount that the FDIC expects to recover onassets.5 Whether liabilities are transferred or in-volved in a payout, it is easy to see that the amountthe FDIC is able to recover on assets of the failedbank to offset handling the liabilities is significantin determining the cost of resolution. Estimates ofresolution costs are based on forward-looking proce-dures that include the length of time it will take todispose of the assets of failed banks. Disposition ofassets may take seven years or more depending onthe type of resolution and the type of asset.6 TheFDIC generates initial estimates of expected recov-eries (and thereby, estimates of realized asset value)for each type of asset at the time of resolution andperiodically updates these estimates until the asset isfully recovered or written off.7
Resolution Costs andRegulatory Effectiveness
If banks are resolved on the basis of market valuewhen they first become insolvent~that is, when lia-bilities are just greater than the market value of as-sets-losses to the fund can be held roughly to theadministrative costs required to process the resolu-
5. The FDIC shares the proceeds of the sale of assets with othercreditors. Its share is determined by the amount of the insuredliabilities in relation to total liabilities of the bank at resolution.
6. Brown and Epstein, "Resolution Costs and Bank Failures," pp. 1-16. This study presents data on the time distribution of assetrecoveries for receiverships begun from 1986 through 1990. Thedata show that for such assets as securities and installment loans,most recoveries are made within one year of the receivership.Recoveries on commercial loans and mortgages tend to proceedless quickly.
7. Currently there is only one study that compares initial estimates ofloss on assets with realized values manifested after resolution.See Brown and Epstein, "Resolution Costs and Bank Failures," pp.1-16. This kind of information could be used to validate market-value formulas used at resolution.
tion through the FDIC system. Most banks wereclosed when they became book-value insolvent—thatis, when the book value of equity dropped to zero.Two FDIC studies found that the average loss onassets for resolved banks between 1985 and 1989was about 30 percent.8 These results imply that themarket value of assets to the FDIC was only about70 cents per dollar of recorded book value by thetime the resolution process began. Had the banks'problems been detected when the market value ofassets was equal to liabilities and promptly resolved,perhaps some of the loss on assets could have beenavoided.
One possible measure of the effectiveness of theoverall regulatory process is the extent to whichresolution costs exceed administrative costs. Forpurposes of analysis, embedded losses are defined asthe amount of resolution costs above the costs thatcan be attributed to administrative expenses. Al-though administrative expenses are not reported sep-arately by the FDIC in its estimates of total resolu-tion costs, some industry analysts estimate that theadministrative costs for small-to-moderate-sizedbanks during the 1980s were between 4 percent and10 percent of assets.9 Using the higher figure of 10percent, it is possible to generate a conservative es-timate of embedded losses per dollar of assets atresolution. For the 1987-1992 period, approx-imately 80 percent of bank resolutions cost morethan 10 cents per dollar of assets and therefore (us-ing the above definition) had embedded losses.Roughly 28 percent of the resolutions in this periodhad costs per dollar of assets that exceeded 30 per-cent of assets, and more than 3 percent of these res-olutions had costs that exceeded 50 percent of assets(see Figure 6). Data on earlier resolutions indicatethat for the period between 1934 and 1979, total
8. See John F. Bovenzi and Arthur J. Murton, "Resolution Costs ofBank Failure," FDIC Banking Review, vol. 1, no. 1 (Fall 1988),pp. 1-13; and Brown and Epstein, "Resolution Costs and BankFailures," pp. 1-16.
9. Christopher James, "The Costs of Resolving Bank Failures," Jour-nal of Finance (September 1991), estimates that administrativecosts average between 8 percent and 10 percent of failed bankassets. Conversations with George French, Associate Director ofthe Research and Statistics Division at the FDIC, in April 1992corroborate James's findings. James Thompson, Assistant VicePresident of the Federal Reserve Bank of Cleveland, disagreeswith this figure and suggests that administrative costs are closer to4 percent of assets.
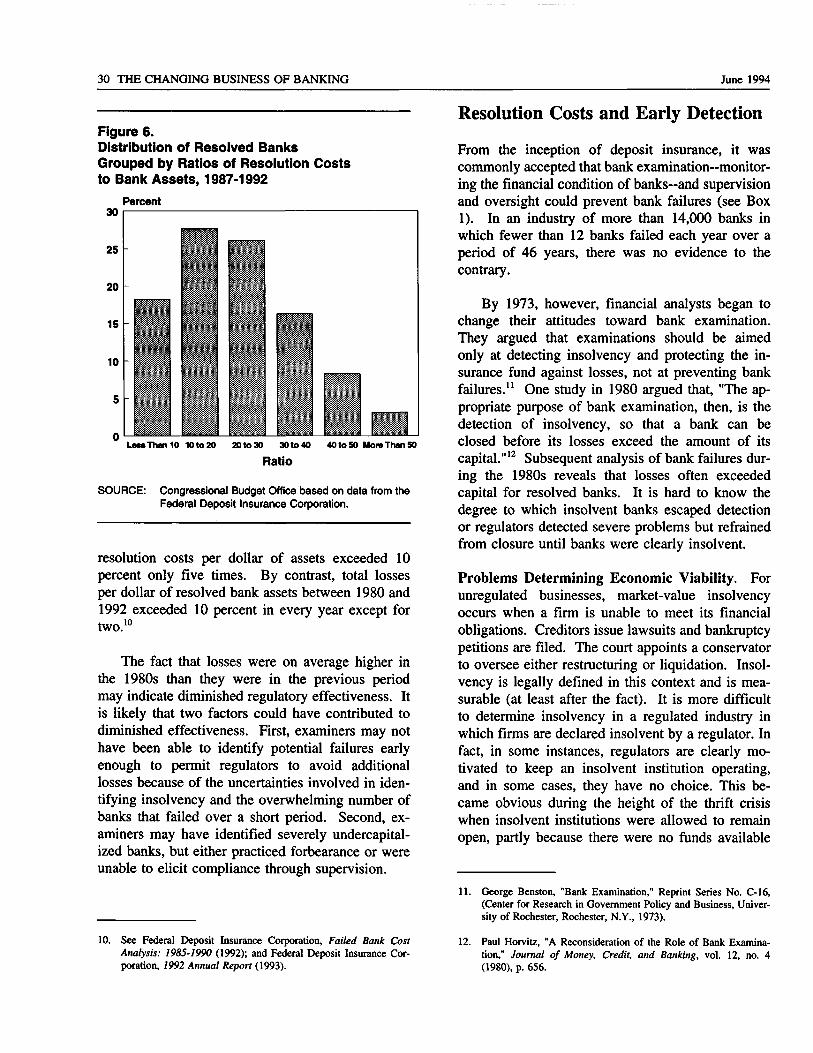
30 THE CHANGING BUSINESS OF BANKING June 1994
Figure 6.Distribution of Resolved BanksGrouped by Ratios of Resolution Coststo Bank Assets, 1987-1992
PercentJU
25
20
15
10
5
A
-
r^- ̂$. - - :
- •
MM., .boa/! :
•T1
\ '-V.
r 'V <
-v%H
•^ "•• v{
\^ %•" %
1̂
'« " °
*
K -•-
-
C' ^
..•:S A.
Lew Than 10 10 to 20 20 to 30 30 to 40 40 to 50 Mora Than 50
Ratio
SOURCE: Congressional Budget Office based on data from theFederal Deposit Insurance Corporation.
resolution costs per dollar of assets exceeded 10percent only five times. By contrast, total lossesper dollar of resolved bank assets between 1980 and1992 exceeded 10 percent in every year except fortwo. 10
The fact that losses were on average higher inthe 1980s than they were in the previous periodmay indicate diminished regulatory effectiveness. Itis likely that two factors could have contributed todiminished effectiveness. First, examiners may nothave been able to identify potential failures earlyenough to permit regulators to avoid additionallosses because of the uncertainties involved in iden-tifying insolvency and the overwhelming number ofbanks that failed over a short period. Second, ex-aminers may have identified severely undercapital-ized banks, but either practiced forbearance or wereunable to elicit compliance through supervision.
Resolution Costs and Early Detection
From the inception of deposit insurance, it wascommonly accepted that bank examination—monitor-ing the financial condition of banks-and supervisionand oversight could prevent bank failures (see Box1). In an industry of more than 14,000 banks inwhich fewer than 12 banks failed each year over aperiod of 46 years, there was no evidence to thecontrary.
By 1973, however, financial analysts began tochange their attitudes toward bank examination.They argued that examinations should be aimedonly at detecting insolvency and protecting the in-surance fund against losses, not at preventing bankfailures.11 One study in 1980 argued that, "The ap-propriate purpose of bank examination, then, is thedetection of insolvency, so that a bank can beclosed before its losses exceed the amount of itscapital."12 Subsequent analysis of bank failures dur-ing the 1980s reveals that losses often exceededcapital for resolved banks. It is hard to know thedegree to which insolvent banks escaped detectionor regulators detected severe problems but refrainedfrom closure until banks were clearly insolvent.
Problems Determining Economic Viability. Forunregulated businesses, market-value insolvencyoccurs when a firm is unable to meet its financialobligations. Creditors issue lawsuits and bankruptcypetitions are filed. The court appoints a conservatorto oversee either restructuring or liquidation. Insol-vency is legally defined in this context and is mea-surable (at least after the fact). It is more difficultto determine insolvency in a regulated industry inwhich firms are declared insolvent by a regulator. Infact, in some instances, regulators are clearly mo-tivated to keep an insolvent institution operating,and in some cases, they have no choice. This be-came obvious during the height of the thrift crisiswhen insolvent institutions were allowed to remainopen, partly because there were no funds available
10. See Federal Deposit Insurance Corporation, Failed Bank CostAnalysis: 1985-1990 (1992); and Federal Deposit Insurance Cor-poration, 7992 Annual Report (1993).
11. George Benston, "Bank Examination," Reprint Series No. C-16,(Center for Research in Government Policy and Business, Univer-sity of Rochester, Rochester, N.Y., 1973).
12. Paul Horvitz, "A Reconsideration of the Role of Bank Examina-tion," Journal of Money, Credit, and Banking, vol. 12, no. 4(1980), p. 656.
CHAPTER FOUR BANK RESOLUTIONS AND THE COSTS OF RESOLUTION 31
to resolve them. At the same time, however, somesavings and loans had themselves declared insolventby the courts.
In economic terms, insolvency occurs onlywhen the market value of liabilities exceeds themarket value of assets; that is, when the firm is nolonger economically functional. Put another way,insolvency occurs when a firm's expected dis-counted revenue stream is negative for the inde-terminate future. Unfortunately, there is no univer-
sally accepted procedure for determining the marketvalue of assets and liabilities for a bank withoutselling the assets in the market. This lack of aprocedure makes an economic assessment of themarket valuation of assets disputable and subject tomany assumptions. The standard system of book-value accounting, based on value at the last transac-tion, can hide the true value of assets. An insol-vency test based on book-value accounting can bemisleading because it may disguise an insolventinstitution as book-value solvent.
Box 1.The Basics of Bank Regulation and Examination
State or federal chartering agencies regulate banksfrom the time they apply for a charter until they closeand their last deposits are transferred or repaid. Bothfederal and state government agencies control entryinto the industry, as well as the location and operationof banks. A state chartering agency or comptroller ofthe currency can charter a bank. When assessing anew charter, the regulatory authority considers suchthings as the initial capital position of the bank, acommunity's need for a bank, and the bank's poten-tial for success, given the economy in which it willoperate. In exercising their chartering responsibilities,the comptroller and state banking commissioner regu-late both entry and exit.
Commensurate with their chartering responsibili-ties for operating a safe and sound banking system,regulatory agencies monitor bank operations by re-viewing detailed financial statements that all banksmust file quarterly. Examiners conduct on-site auditsand examinations. The criteria for safety and sound-ness require monitoring to identify financially weakinstitutions. By law there are overlapping jurisdic-tions between federal and state regulatory authorities.Regulators adhere to the following breakdown ofresponsibilities for bank examinations:
o Comptroller—all national banks;
o Federal Reserve-state-chartered banks that aremembers of the Federal Reserve;
o Federal Deposit Insurance Corporation—state-chartered banks that are not members of theFederal Reserve; and
o State agencies—all state-chartered banks.
Bank examiners consider a bank's financial con-dition, review its compliance with laws and regula-tions, and study its prospects for the future. Examin-ers try to identify emerging financial problems bychecking capital adequacy (C), asset quality (A),management practices (M), earnings (E), and liquidity(L). The so-called CAMEL rating is a numericalindex (from 1 to 5) based on an examiner's assess-ment of these categories and is used to identify prob-lem banks that may require supervisory action. Bankexaminers assign an index of 4 or 5 to banks thatthey regard as operating under unsatisfactory condi-tions. Examiners report to regulators who may de-mand that institutions increase capital, alter currentloan policies, or increase loan loss reserves to coverloans that are highly likely to default. Regulatorsmay remove management if necessary and ultimatelyforce resolution.
Once examiners and regulators determine that abank has problems, regulators act jointly with theinstitution to eliminate the need for resolution orrequest a timely resolution. During the 1980s, beforethe Federal Deposit Insurance Corporation Improve-ment Act of 1991 (FDICIA), the appropriate statechartering agency or the Office of the Comptroller ofthe Currency would authorize the Federal DepositInsurance Corporation to resolve a failed bank. TheFDIC could petition the chartering agency to requesta resolution, but this was a time-consuming process.With the advent of FDICIA, the FDIC may nowinitiate resolution procedures.
32 THE CHANGING BUSINESS OF BANKING June 1994
Although examiners can usually judge whichbanks are financially distressed, determining when abank first becomes insolvent is very difficult. Theprocess of classifying a bank as economically inca-pable of surviving before it reaches book-valueinsolvency is fraught with uncertainty. Regulatorscan make two kinds of errors in classifying a bankas insolvent: they may classify a bank that is reallyfunctional as insolvent. Conversely, they may clas-sify a bank that is really insolvent as functional.
In the history of the insurance fund, the twoerrors have not been equally important. Since 1934,regulators have rarely resolved a bank that wassolvent by book-value measures. During the 1980s,regulators usually preferred to err on the side ofleaving a financially distressed bank operating ratherthan close a functional bank. The costs associatedwith behaving as if a bank is functional when it isnot can appear eventually as embedded costs thatshow up as relatively high resolution costs per dol-lar of assets. The costs of the first type of error-classifying a bank as inoperable when it was not—would be associated with litigation and other costsof premature closing. In the 1987-1991 period, onlyone institution—the Southeast Bank of Florida-wasclosed before it was book-value insolvent.13 Thecosts of resolving Southeast Bank proved to be min-imal—only 3 percent of tangible assets (see Appen-dix A, which discusses methods of evaluating thefinancial condition of banks).
During the 1980s, regulators faced legal andeconomic pressures to avoid closing a bank before itbecame book-value insolvent.14 To close such insti-tutions meant that the regulators would have had toendure immediate vocal disapproval from those di-rectly affected—owners of banks, boards of direc-tors, local communities, and their representatives.Beneficiaries of timely closures were conspicuouslysilent and typically unaware of the costs of regula-tory delay.15 Not surprisingly, regulators were hesi-
tant to close banks before they became book-valueinsolvent. In most cases, it appears that regulatorspreferred to wait until "the death rattle was clearlyaudible."16
The evidence suggests that examiners and regu-lators during the 1980s may have been genuinelyuncertain about whether the banking problemsstemmed simply from temporary liquidity troublesor more substantial difficulties related to economicinsolvency. Even after a resolution, examiners canonly estimate the extent of embedded losses and areoften unable to pinpoint when the losses first oc-curred. Most of failed bank losses are associatedwith bad loans, but when did the loans become"bad"? Were these loans poor to begin with, or didbad loans only become bad when they becamenonperforming? Looking back, it is clear that bankspriced the loans poorly, required insufficient collat-eral, and neglected to diversify risk adequately.Before actual failure, however, the book-value ac-counting method did not serve regulators well be-cause they did not see what was coming until it wastoo late.
Approximately 13 percent of the banks thatfailed from 1987 to 1992 had equity-to-asset ratiosexceeding 6 percent at the end of the year beforethey were resolved (see Figure 7). These bankswere reasonably capitalized by book-value mea-sures. Regulators were most likely surprised whena significant percentage of the these seemingly well-capitalized banks failed. In the 1985-1991 period,the FDIC resolved about 140 banks that examinershad rated at the beginning of the year as being ingood condition-as either a CAMEL 1, 2, or 3 (seeBox I).17 The FDIC clearly had not expected these
13. Southeast Bank was resolved September 19, 1991. The estimatedloss was $350 million. Data supplied by Jeff Taylor of the FDIC,January 10, 1992.
14. Federal Deposit Insurance Corporation, Deposit Insurance for theNineties: Meeting the Challenge (1989).
15. James R. Earth, Philip F. Bartholomew, and Carol Labich, "MoralHazard and the Thrift Crisis: An Analysis of 1988 Resolutions,"Research Paper 150 (Federal Home Loan Bank Board, May 1989);and Congressional Budget Office, "The Cost of Forbearance Dur-ing the Thrift Crisis," CBO Staff Memorandum (June 1991).
16. L.J. Davis, "The Problem with Banks? Bankers: Bad Loans, NotBad Laws, Created the Current Crisis," Harpers (June 1991), pp.45-53.
17. CBO is grateful for data supplied by George French, AssociateDirector, Division of Research and Statistics, FDIC. Data onCAMEL ratings are not available for individual institutions. Onlysummary data on CAMEL ratings are provided by the FDIC.
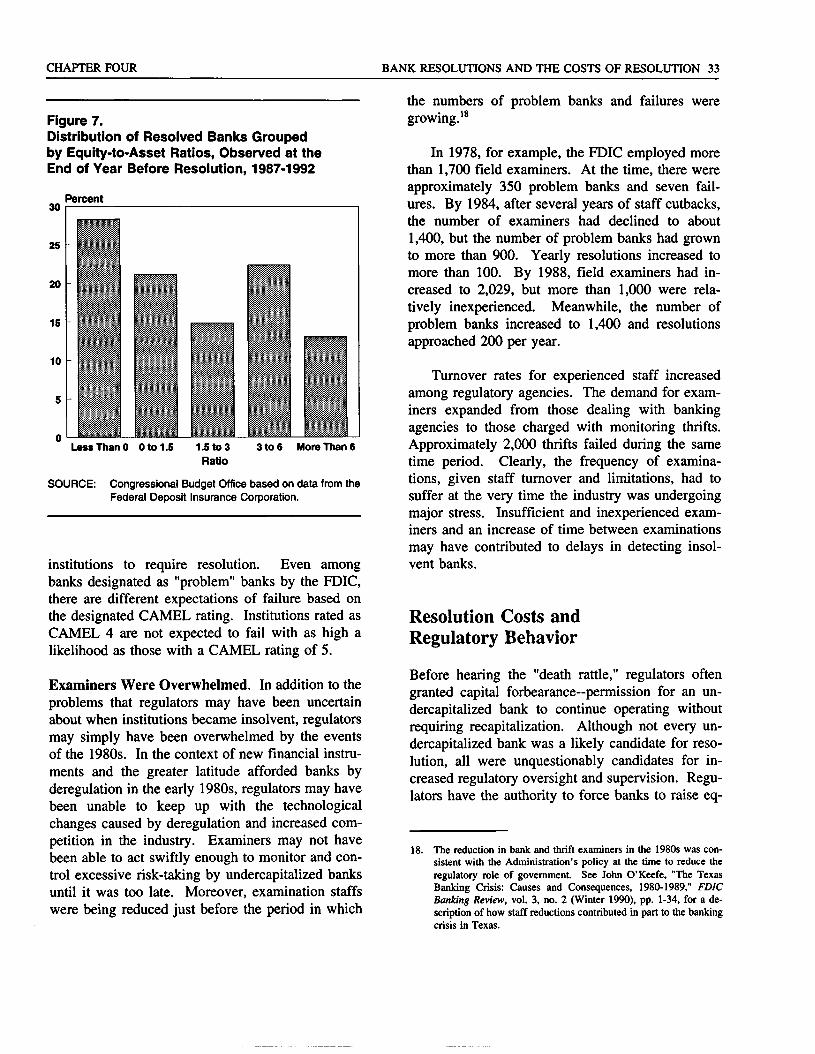
CHAPTER FOUR BANK RESOLUTIONS AND THE COSTS OF RESOLUTION 33
Figure 7.Distribution of Resolved Banks Groupedby Equity-to-Asset Ratios, Observed at theEnd of Year Before Resolution, 1987-1992
Percentou
25
20
•1C
10
5
A
-
-
i
-
-\
*
*• 1 :.
-"' "
£
Less Than 0 0 to 1.5 1.5 to 3 3 to 6 More Than 6Ratio
SOURCE: Congressional Budget Office based on data from theFederal Deposit Insurance Corporation.
institutions to require resolution. Even amongbanks designated as "problem" banks by the FDIC,there are different expectations of failure based onthe designated CAMEL rating. Institutions rated asCAMEL 4 are not expected to fail with as high alikelihood as those with a CAMEL rating of 5.
Examiners Were Overwhelmed. In addition to theproblems that regulators may have been uncertainabout when institutions became insolvent, regulatorsmay simply have been overwhelmed by the eventsof the 1980s. In the context of new financial instru-ments and the greater latitude afforded banks byderegulation in the early 1980s, regulators may havebeen unable to keep up with the technologicalchanges caused by deregulation and increased com-petition in the industry. Examiners may not havebeen able to act swiftly enough to monitor and con-trol excessive risk-taking by undercapitalized banksuntil it was too late. Moreover, examination staffswere being reduced just before the period in which
the numbers of problem banks and failures weregrowing.18
In 1978, for example, the FDIC employed morethan 1,700 field examiners. At the time, there wereapproximately 350 problem banks and seven fail-ures. By 1984, after several years of staff cutbacks,the number of examiners had declined to about1,400, but the number of problem banks had grownto more than 900. Yearly resolutions increased tomore than 100. By 1988, field examiners had in-creased to 2,029, but more than 1,000 were rela-tively inexperienced. Meanwhile, the number ofproblem banks increased to 1,400 and resolutionsapproached 200 per year.
Turnover rates for experienced staff increasedamong regulatory agencies. The demand for exam-iners expanded from those dealing with bankingagencies to those charged with monitoring thrifts.Approximately 2,000 thrifts failed during the sametime period. Clearly, the frequency of examina-tions, given staff turnover and limitations, had tosuffer at the very time the industry was undergoingmajor stress. Insufficient and inexperienced exam-iners and an increase of time between examinationsmay have contributed to delays in detecting insol-vent banks.
Resolution Costs andRegulatory Behavior
Before hearing the "death rattle," regulators oftengranted capital forbearance—permission for an un-dercapitalized bank to continue operating withoutrequiring recapitalization. Although not every un-dercapitalized bank was a likely candidate for reso-lution, all were unquestionably candidates for in-creased regulatory oversight and supervision. Regu-lators have the authority to force banks to raise eq-
18. The reduction in bank and thrift examiners in the 1980s was con-sistent with the Administration's policy at the time to reduce theregulatory role of government. See John O'Keefe, "The TexasBanking Crisis: Causes and Consequences, 1980-1989," FDICBanking Review, vol. 3, no. 2 (Winter 1990), pp. 1-34, for a de-scription of how staff reductions contributed in part to the bankingcrisis in Texas.
34 THE CHANGING BUSINESS OF BANKING June 1994
uity, suspend dividends, reduce assets, issue newstock, force divestiture of affiliates, remove direc-tors or managers, demand increased allowances forloan losses, or charge off uncollectible loans. En-forcing such actions on these undercapitalized banksmay have caused even more failures. It is not diffi-cult to imagine why many banks were initially per-mitted to continue to operate. In many cases, regu-lators decided not to enforce supervisory actions,presumably because they felt there was a higherprobability that these banks would survive than thatthey would fail.
Forbearance. Forbearance comes into play whenbank supervisors decide not to enforce some regula-tions, including capital requirements, under specialcircumstances.19 In theory, a policy of forbearancegives economically functional banks-those that maybe undergoing a short-term liquidity crisis-time toadjust to market conditions without triggering other-wise applicable bank regulations. Some forbearancepolicies are implicit, such as the treatment of banksdesignated for the FDIC problem banks list. Thus,problem banks are given time to comply with vari-ous supervisory actions intended to correct opera-tional deficiencies.
Other policies of forbearance are explicit. Forexample, as losses on agricultural and energy loansrose during the 1980s, in the Competitive EqualityBanking Act (CEBA) of 1987, the Congress"mandated capital forbearance" for agriculturalbanks—those banks with more than 25 percent ofassets devoted to the agricultural sector. One condi-tion for entry into the program was a formal plan(recognized by the bank's directors) for restoringthe capital-to-asset ratio to the regulatory minimumof 5.5 percent. Regulatory supervisors stipulatedthat banks in the forbearance program limit growthof total assets and high-risk investments, restrictdividends to shareholders, and limit insider loansduring forbearance.20
19. R. Alton Gilbert, "Supervision of Undercapitalized Banks: IsThere a Case for Change?" in Federal Reserve Bank of Chicago,Rebuilding Banking: Proceedings from the 27th Annual Confer-ence of Bank Structure and Competition, May 1-3, 1991, p. 338.
20. Dean Forrester Cobos, "Forbearance: Practices and Proposed Stan-dards," FDIC Banking Review vol. 2, no. 1 (Spring/Summer1989), pp. 20-28.
In practice, forbearance was granted to banksthat turned out to be incapable of surviving. Ap-proximately 63 percent of the banks that the FDICresolved between 1985 and 1989 were consideredundercapitalized for more than a year before failure.Approximately 28 percent of bank resolutions be-tween 1987 and 1992 were insolvent by book-valuemeasures at least one year before their resolution.Based on the resolution costs per dollar of assetsduring the 1980s, it is reasonable to suspect thatforbearance could have contributed to the increasedcosts of resolution. If the losses were already em-bedded, however, the costs of resolution need nothave increased.
A measure of the success or failure of a policyof forbearance can be obtained by examining howwell regulators were able to restrict the activities ofundercapitalized banks. One study examines a sam-ple of 531 undercapitalized banks between 1985 and1989 that were permitted to remain undercapitalizedfor at least one year.21 Although regulators wereable to restrict the majority of banks from engagingin questionable activities, regulators did not havecomplete control. For example, while they wereundercapitalized, 16 percent of these banks in-creased assets by more than 10 percent, 15 percentcontinued to pay dividends, and 24 percent reportedhigh levels of insider loans. Clearly, dividend pay-ments and insider loans contributed to an increase inresolution costs for those institutions that did notrecover.
FDICIA and PromptCorrective Action
The Federal Deposit Insurance Corporation Im-provement Act of 1991 authorizes a policy of"prompt corrective action" by bank supervisors indealing with financially weakened banks. InFDICIA, the kind of prompt corrective action that isrequired of regulators depends on how a bank israted in terms of minimum prescribed capital levels.
21. Gilbert, "Supervision of Undercapitalized Banks," p. 335. Gilbertdefines undercapitalized banks as those exhibiting primary capital-ization of less than 5.5 percent.
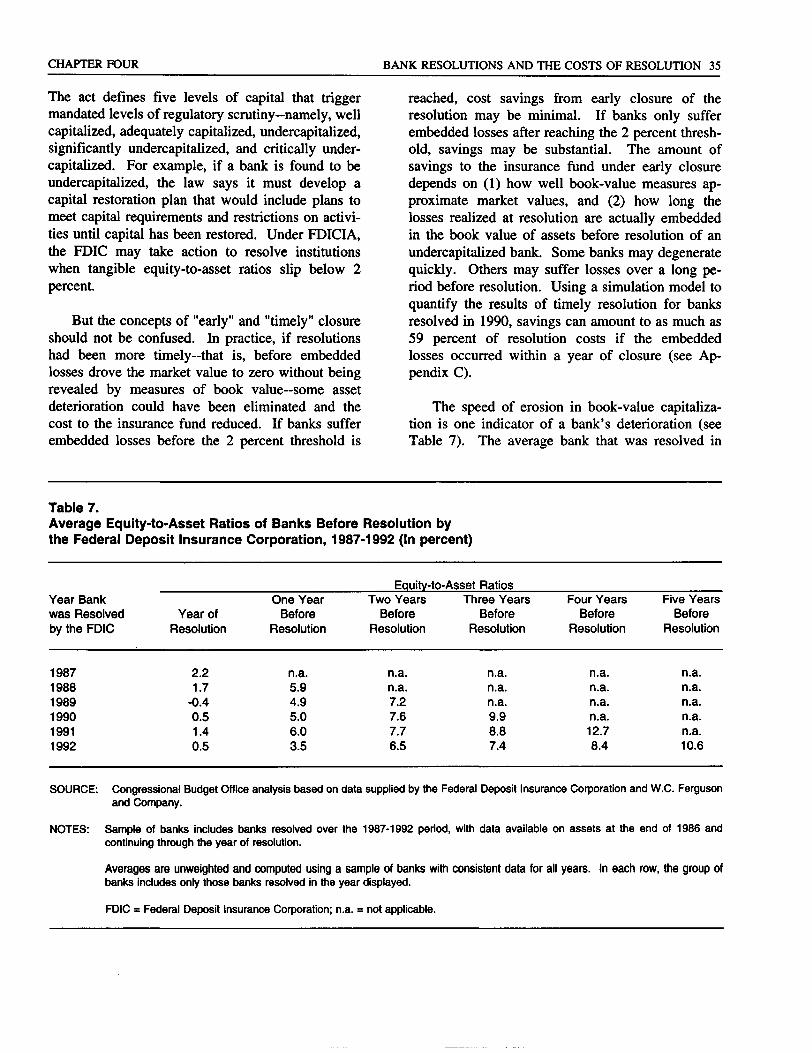
CHAPTER FOUR BANK RESOLUTIONS AND THE COSTS OF RESOLUTION 35
The act defines five levels of capital that triggermandated levels of regulatory scrutiny—namely, wellcapitalized, adequately capitalized, undercapitalized,significantly undercapitalized, and critically under-capitalized. For example, if a bank is found to beundercapitalized, the law says it must develop acapital restoration plan that would include plans tomeet capital requirements and restrictions on activi-ties until capital has been restored. Under FDICIA,the FDIC may take action to resolve institutionswhen tangible equity-to-asset ratios slip below 2percent.
But the concepts of "early" and "timely" closureshould not be confused. In practice, if resolutionshad been more timely-that is, before embeddedlosses drove the market value to zero without beingrevealed by measures of book value-some assetdeterioration could have been eliminated and thecost to the insurance fund reduced. If banks sufferembedded losses before the 2 percent threshold is
reached, cost savings from early closure of theresolution may be minimal. If banks only sufferembedded losses after reaching the 2 percent thresh-old, savings may be substantial. The amount ofsavings to the insurance fund under early closuredepends on (1) how well book-value measures ap-proximate market values, and (2) how long thelosses realized at resolution are actually embeddedin the book value of assets before resolution of anundercapitalized bank. Some banks may degeneratequickly. Others may suffer losses over a long pe-riod before resolution. Using a simulation model toquantify the results of timely resolution for banksresolved in 1990, savings can amount to as much as59 percent of resolution costs if the embeddedlosses occurred within a year of closure (see Ap-pendix C).
The speed of erosion in book-value capitaliza-tion is one indicator of a bank's deterioration (seeTable 7). The average bank that was resolved in
Table 7.Average Equity-to-Asset Ratios of Banks Before Resolution bythe Federal Deposit Insurance Corporation, 1987-1992 (In percent)
Year Bankwas Resolvedby the FDIC
198719881989199019911992
Year ofResolution
2.21.7
-0.40.51.40.5
One YearBefore
Resolution
n.a.5.94.95.06.03.5
Equity-to-Two Years
BeforeResolution
n.a.n.a.7.27.67.76.5
Asset RatiosThree Years
BeforeResolution
n.a.n.a.n.a.9.98.87.4
Four YearsBefore
Resolution
n.a.n.a.n.a.n.a.12.78.4
Five YearsBefore
Resolution
n.a.n.a.n.a.n.a.n.a.10.6
SOURCE: Congressional Budget Office analysis based on data supplied by the Federal Deposit Insurance Corporation and W.C. Fergusonand Company.
NOTES: Sample of banks includes banks resolved over the 1987-1992 period, with data available on assets at the end of 1986 andcontinuing through the year of resolution.
Averages are unweighted and computed using a sample of banks with consistent data for all years. In each row, the group ofbanks includes only those banks resolved in the year displayed.
FDIC = Federal Deposit Insurance Corporation; n.a. = not applicable.
36 THE CHANGING BUSINESS OF BANKING June 1994
1990, for example, had a book equity-to-asset ratioof almost 10 percent at the beginning of 1987, threeyears before resolution. By early 1988 the equity-to-asset ratios had declined but still appeared to berespectable, exceeding 7 percent. By 1989, how-ever, the ratio had slipped to 5 percent, and finally,by 1990, the ratio had dropped to 0.5 percent—barely solvent by book-value measures. In manycases, with the notable exception of 1991 resolu-tions, equity-to-asset ratios for the average resolvedbank were below the regulatory minimum one yearbefore failure, thus requiring some regulatory action.It is also true that while the equity-to-asset ratioswere declining on average for banks resolved duringthis period, the most significant deterioration oc-curred in the year before resolution. This mayindicate rapid erosion of equity or regulatory actionrequiring an enumeration of bad assets.
The main rationale for a policy of early closureis that a fixed-rate deposit insurance system cantempt banks to take excessive risks at the expenseof the insurance fund. But a policy shift in terms ofsupervisory actions has occurred under FDICIA.Whereas regulators tried in the past to avoid closinghealthy banks by waiting for book-value insolvency(the death rattle), FDICIA mandates that regulatorstake that risk by applying an early closure rule. Thegoal is to prohibit banks from operating at very lowlevels of capital—considered to be the region ofhighest moral hazard. Critics of the early closurerule argue that unless regulatory supervision andoversight keeps banks from taking excessive portfo-lio risks before reaching the 2 percent level, theywill simply gamble sooner than they would haveotherwise.22 Nevertheless, effective supervision andoversight should limit losses. FDICIA also empha-
sizes early intervention as part of a policy of promptcorrective action, requiring increasing levels ofsupervision at lower levels of bank capital.
Rigid adherence to the 2 percent closure rule,however, may force the resolution of solvent banksthat are merely undergoing a temporary crisis. It isdifficult to assess the costs of mistaken early resolu-tions, given that regulators up to this point did notclose banks before book-value insolvency. Two1991 studies indicate that most banks that wereundercapitalized between 1985 and 1989 did notrecover.23 One of these studies reports that only 24percent of the undercapitalized banks recovered inthe period examined. That study concludes that theprompt closing of banks with low but positive capi-tal ratios "would not result in premature closings oflarge numbers of banks that ultimately would re-cover if given enough time."24 To reduce the likeli-hood of incurring costs under premature closures, itmay be useful to employ a flexible set of criteria inwhich early closures are limited to banks that arealso displaying other characteristics of economicdecay, such as earnings losses in consecutive yearsor failure to comply with regulatory recommenda-tions.
22. Mark E. Levonian, "What Happens if Banks Are Closed Early," inFederal Reserve Bank of Chicago, Rebuilding Banking: Proceed-ings of the 27th Annual Conference on Bank Structure and Com-petition, May 1-3, 7997, pp. 273-295.
23. See George E. French, "Early Corrective Action For TroubledBanks," FDIC Banking Review, vol. 4, no. 2 (Fall 1991), p. 12;and Gilbert, "Supervision of Undercapitalized Banks," p. 345.
24. Gilbert, "Supervision of Undercapitalized Banks," p. 346.
Chapter Five
An Industry Outlook:Guarded Optimism
I n 1992 and 1993, after several years of poorperformance, the banking industry earned re-cord profits. The average return on assets for
commercial banks in 1993 was 1.2 percent-the firsttime since the creation of the Federal Deposit Insur-ance Corporation that the annual return exceeded 1percent. At the same time, the return on equity forthe industry exceeded 15 percent.
Several factors contribute to the improved healthof the banking industry, even as it undergoes con-tinued structural change and consolidation. In par-ticular, favorable interest rate conditions and agrowing economy have enabled banks to prosper.Banks have been able to take advantage of the factthat they can pay less for their liabilities and receivegreater returns on assets. Growth in noninterestincome also contributed to higher earnings. More-over, the growing economy has helped to reduce theamount of troubled assets—noncurrent loans declinedin all regions of the country and among all majorloan categories—which means that banks do nothave to set aside as much money to cover poten-tially bad loans. In 1993, commercial banks setaside $16.6 billion to cover loan losses, the lowestannual total since 1984.1
Although the banking industry has generallyimproved, some remnants of the troubled timesremain. As a group, money center banks ($10 bil-
lion or more in assets) have 4 percent of their realestate loans in noncurrent or past-due status, andhad 14 percent of their construction and develop-ment real estate loans in noncurrent status as of thefourth quarter of 1993. Also for this period, some570 troubled banks with $330 billion in assets, or 4percent of banks and 7 percent of bank assets in-sured by the Bank Insurance Fund, made theFDIC's problem bank list. Although favorable in-terest rate conditions have allowed banks to increaseprofits and replenish their capital, their increasedexposure to interest rate risk warrants guarded opti-mism.
The Exposure of the BankInsurance Fund to Lossesfrom Bank Resolutions
As the banking industry continues to earn recordprofits, the outlook for the BIF has improved. Afterincurring positive outlays from 1988 to 1992, thefund is now in the black. Its balance (net worth)rebounded to $6.8 billion at the second quarter of1993 from negative $100 million at the end of 1992and negative $7 billion at the end of 1991.2 In its
See Federal Deposit Insurance Corporation, Division of Researchand Statistics, Quarterly Banking Profile, Fourth Quarter, 1993(1994), pp. 1-2.
2. Federal Deposit Insurance Corporation, "Bank Insurance FundBalance Increased to $6.8 Billion at Mid-Year 1993, According toPreliminary Results from the FDIC" (press release, August 10,1993); and Barbara A. Rehm, "Bank Fund in the Black; TreasuryLoan Repaid," The American Banker (August 11, 1993), pp. 1 and22.
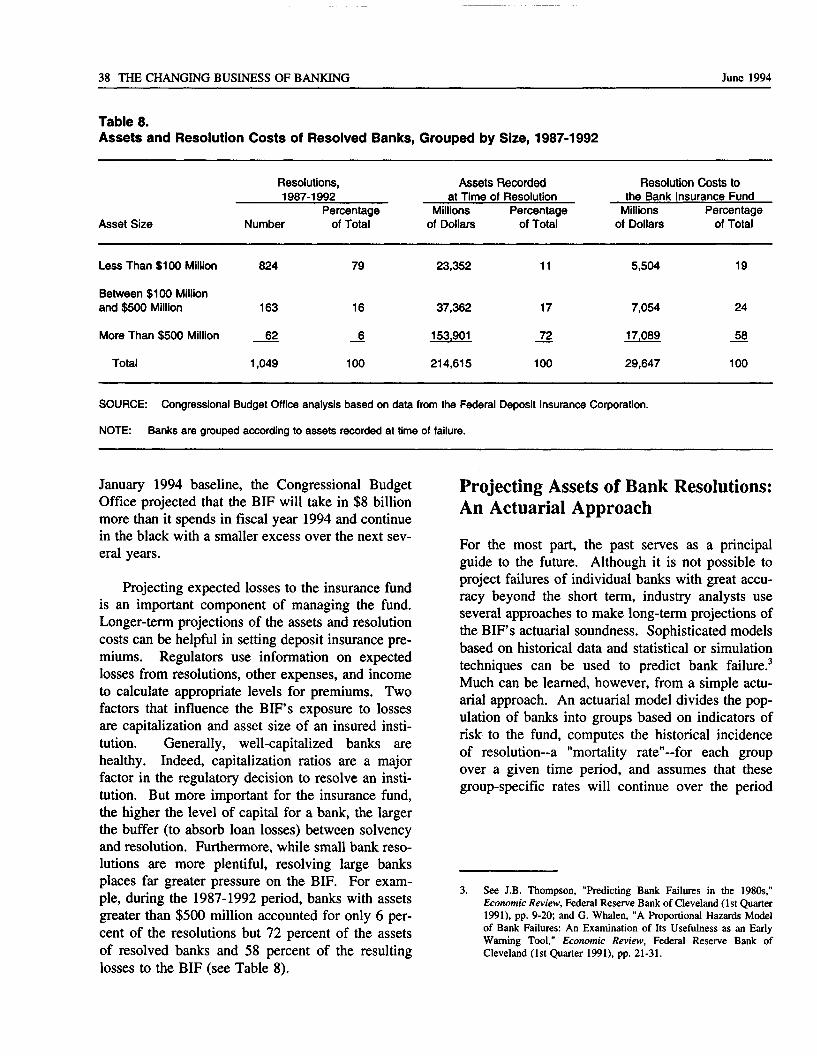
38 THE CHANGING BUSINESS OF BANKING June 1994
Table 8.Assets and Resolution Costs of Resolved Banks, Grouped by Size, 1987-1992
Asset Size
Resolutions,1987-1992
PercentageNumber of Total
Assets Recordedat Time of Resolution
Millions Percentageof Dollars of Total
Resolution Costs tothe Bank Insurance Fund
Millions Percentageof Dollars of Total
Less Than $100 Million
Between $100 Million
824 79 23,352 11 5,504
SOURCE: Congressional Budget Office analysis based on data from the Federal Deposit Insurance Corporation.
NOTE: Banks are grouped according to assets recorded at time of failure.
19
and $500 Million
More Than $500 Million
Total
163
62
1,049
16
6
100
37,362
153.901
214,615
17
72
100
7,054
17.089
29,647
24
58
100
January 1994 baseline, the Congressional BudgetOffice projected that the BIF will take in $8 billionmore than it spends in fiscal year 1994 and continuein the black with a smaller excess over the next sev-eral years.
Projecting expected losses to the insurance fundis an important component of managing the fund.Longer-term projections of the assets and resolutioncosts can be helpful in setting deposit insurance pre-miums. Regulators use information on expectedlosses from resolutions, other expenses, and incometo calculate appropriate levels for premiums. Twofactors that influence the BIF's exposure to lossesare capitalization and asset size of an insured insti-tution. Generally, well-capitalized banks arehealthy. Indeed, capitalization ratios are a majorfactor in the regulatory decision to resolve an insti-tution. But more important for the insurance fund,the higher the level of capital for a bank, the largerthe buffer (to absorb loan losses) between solvencyand resolution. Furthermore, while small bank reso-lutions are more plentiful, resolving large banksplaces far greater pressure on the BIF. For exam-ple, during the 1987-1992 period, banks with assetsgreater than $500 million accounted for only 6 per-cent of the resolutions but 72 percent of the assetsof resolved banks and 58 percent of the resultinglosses to the BIF (see Table 8).
Projecting Assets of Bank Resolutions:An Actuarial Approach
For the most part, the past serves as a principalguide to the future. Although it is not possible toproject failures of individual banks with great accu-racy beyond the short term, industry analysts useseveral approaches to make long-term projections ofthe BIF's actuarial soundness. Sophisticated modelsbased on historical data and statistical or simulationtechniques can be used to predict bank failure.3
Much can be learned, however, from a simple actu-arial approach. An actuarial model divides the pop-ulation of banks into groups based on indicators ofrisk to the fund, computes the historical incidenceof resolution-a "mortality rate"-for each groupover a given time period, and assumes that thesegroup-specific rates will continue over the period
See J.B. Thompson, "Predicting Bank Failures in the 1980s,"Economic Review, Federal Reserve Bank of Cleveland (1st Quarter1991), pp. 9-20; and G. Whalen, "A Proportional Hazards Modelof Bank Failures: An Examination of Its Usefulness as an EarlyWarning Tool," Economic Review, Federal Reserve Bank ofCleveland (1st Quarter 1991), pp. 21-31.
CHAPTER FIVE AN INDUSTRY OUTLOOK: GUARDED OPTIMISM 39
projected (see Box 2).4 Mortality rates can be basedon the number of resolutions or the assets of re-solved institutions. Projecting resolved-bank assetsprovides better information when assessing potentiallosses to the Bank Insurance Fund because resolu-tion costs are more directly related to assets.
At the end of 1986, banks faced a six-yearperiod during which more than 1,000 would beresolved. By 1992, the condition of the bankingindustry had changed (see Table 9). The industryshowed signs of consolidation as the number ofbanks fell from 14,660 in 1986 to fewer than 12,000in 1992 and industry assets grew from $3.2 trillionto $3.7 trillion.5 At the end of 1986, approximately16 percent of the banks in the industry were capital-ized at less than 6 percent. More important in termsof assessing the BIF's exposure to losses, only 53percent of industry assets resided in banks that werecapitalized at greater than 6 percent. By contrast, atthe end of 1992, more than 95 percent of banksholding 85 percent of the industry's assets hadequity-to-asset ratios greater than 6 percent.
One way to project assets of resolved banks forthe 1993-1998 period is to apply the mortality ratesderived from the incidence of resolutions during the1987-1992 period to industry data from the end of1992.6 After applying historical rates to each sub-group, total projected assets of resolved banks canbe derived as the total of all subgroups. Althoughthe condition of the banking industry has improved,if the historical rates of resolution from 1987through 1992 were to continue, the BIF would haveto resolve more than $240 billion in assets (an aver-
4. For applications of the actuarial method of projecting losses to theBank Insurance Fund, see Philip F. Bartholomew and Thomas J.Lutton, "Assessing the Condition of the Bank Insurance Fund," inFederal Reserve Bank of Chicago, Rebuilding Banking: Proceed-ings of a Conference on Bank Structure and Competition, May 1-3, 1991, pp. 87-111; and George E. French, "BIF Loss Exposure:A Simple Actuarial Approach," in Federal Reserve Bank ofChicago, FDICIA, An Appraisal: Proceedings of the 29th Confer-ence on Bank Structure and Competition, May 1993, pp. 98-112.
5. The decrease in the number of banks includes resolutions by theFDIC and private mergers. The trend in consolidation continues;there were about 480 mergers in 1993, driving the number ofcommercial banks below 11,000.
6. The latest available year-end data are for 1992. The six-yearmortality rates will give projections for 1993-1998. The observeddata for 1993 can be used to adjust these six-year projections togive estimates for the 1994-1998 period.
age of $40 billion a year) during the next six years.7
Estimates made using mortality rates derived fromthe 1987-1992 period on industry data split intosubgroups as of the second quarter of 1993 are veryclose to estimates using year-end 1992 industrydata. The six-year projection of resolved-bank as-sets using midyear 1993 data is $234 billion. Thetwo estimates are close because the distribution ofbank assets did not change much in the six-monthperiod. Depending on assumptions about resolutioncosts per dollar of assets, projections of losses to thefund based on this estimate of resolved-bank assetscould remain relatively high.
The six years of the 1987-1992 period includeda national recession, several regional downturns, andparticularly high losses on loans. There is evidence,however, that mortality rates have changed in thewake of two years of record profits in the bankingindustry and better overall economic conditions.Moreover, since the passage of the Federal DepositInsurance Corporation Improvement Act of 1991,there have been two years of phasing in prompt cor-rective action. At the close of 1993, there wereonly 41 bank resolutions, the fewest in any yearsince 1982, when there were 42 resolutions. Theassets of BIF-resolved banks have been falling froma record $63.4 billion in 1991 to $44.2 billion in1992 and only $3.6 billion in 1993 (see Table 10).The average size of a resolved bank in 1993 was$87 million, down from $363 million in 1992. Inaddition, only 26 percent of resolved-bank assets in1993 came from banks with assets greater than $500million, down from 74 percent in 1992.
Thus, alternative projections of the assets ofresolved banks can be made by extending mortalityrates derived from more recent periods. If the his-torical sample is adjusted, it may better show theeffect of recent structural and economic changes.For example, by extending the one-year mortalityrates derived from resolutions in 1993 to cover asix-year period, it is possible to calculate an alterna-
7. This six-year projection of $240 billion in assets of resolved banksis consistent with a three-year projection of $120 billion (1993-1995) reported by the FDIC in May 1993. See French, "BIF LossExposure: A Simple Actuarial Approach," p. 102. These estimatesare continually revised on the basis of examiner data and changingassumptions about economic conditions. FDIC and CBO esti-mates of assets of resolved banks have been revised downward afew times since this estimate was reported.
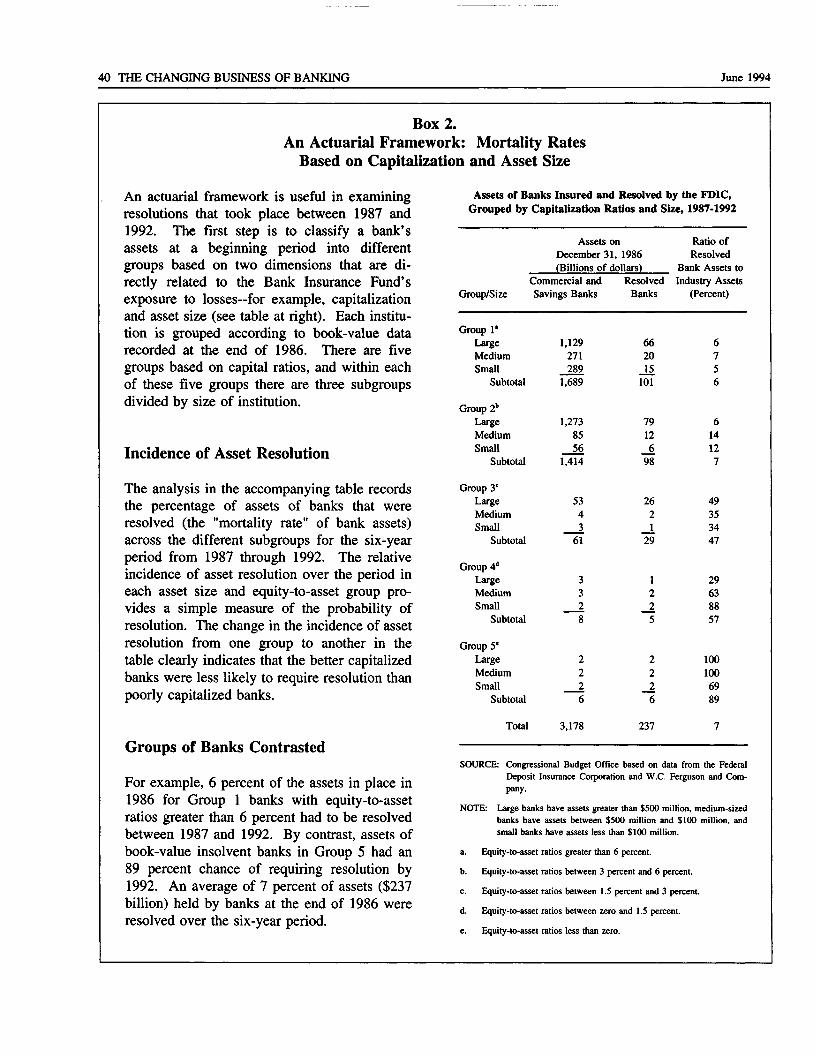
40 THE CHANGING BUSINESS OF BANKING June 1994
Box 2.An Actuarial Framework: Mortality Rates
Based on Capitalization and Asset Size
An actuarial framework is useful in examiningresolutions that took place between 1987 and1992. The first step is to classify a bank'sassets at a beginning period into differentgroups based on two dimensions that are di-rectly related to the Bank Insurance Fund'sexposure to losses—for example, capitalizationand asset size (see table at right). Each institu-tion is grouped according to book-value datarecorded at the end of 1986. There are fivegroups based on capital ratios, and within eachof these five groups there are three subgroupsdivided by size of institution.
Incidence of Asset Resolution
The analysis in the accompanying table recordsthe percentage of assets of banks that wereresolved (the "mortality rate" of bank assets)across the different subgroups for the six-yearperiod from 1987 through 1992. The relativeincidence of asset resolution over the period ineach asset size and equity-to-asset group pro-vides a simple measure of the probability ofresolution. The change in the incidence of assetresolution from one group to another in thetable clearly indicates that the better capitalizedbanks were less likely to require resolution thanpoorly capitalized banks.
Groups of Banks Contrasted
For example, 6 percent of the assets in place in1986 for Group 1 banks with equity-to-assetratios greater than 6 percent had to be resolvedbetween 1987 and 1992. By contrast, assets ofbook-value insolvent banks in Group 5 had an89 percent chance of requiring resolution by1992. An average of 7 percent of assets ($237billion) held by banks at the end of 1986 wereresolved over the six-year period.
Assets of Banks Insured and Resolved by the FDIC,Grouped by Capitalization Ratios and Size, 1987-1992
Assets onDecember 31, 1986(Billions of dollars)
Group/SizeCommercial andSavings Banks
ResolvedBanks
Ratio ofResolved
Bank Assets toIndustry Assets
(Percent)
Group 1"LargeMediumSmall
Subtotal
Group 2b
LargeMediumSmall
Subtotal
Group 3C
LargeMediumSmall
Subtotal
Group 4d
LargeMediumSmall
Subtotal
Group 5e
LargeMediumSmall
Subtotal
Total
1,129271289
1,689
1,2738556
1,414
5343
61
2226
3,178
662015
101
7912_698
262
_J_29
22
_26
237
614127
49353447
29638857
1001006989
SOURCE: Congressional Budget Office based on data from the FederalDeposit Insurance Corporation and W.C. Ferguson and Com-pany.
NOTE: Large banks have assets greater than $500 million, medium-sizedbanks have assets between $500 million and $100 million, andsmall banks have assets less than $100 million.
a. Equity-to-asset ratios greater than 6 percent.
b. Equity-to-asset ratios between 3 percent and 6 percent.
c. Equity-to-asset ratios between 1.5 percent and 3 percent.
d. Equity-to-asset ratios between zero and 1.5 percent.
e. Equity-to-asset ratios less than zero.
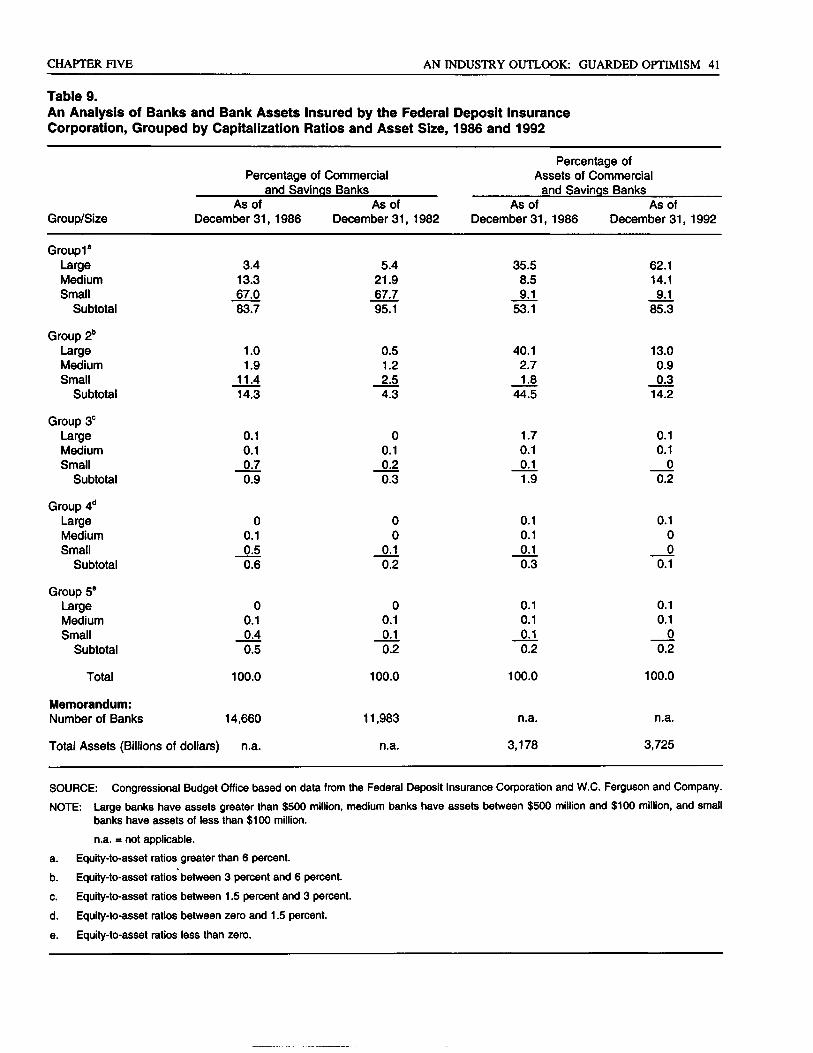
CHAPTER FIVE AN INDUSTRY OUTLOOK: GUARDED OPTIMISM 41
Table 9.An Analysis of Banks and Bank Assets Insured by the Federal Deposit InsuranceCorporation, Grouped by Capitalization Ratios and Asset Size, 1986 and 1992
Group/Size
Total
Memorandum:Number of Banks
Percentage of Commercialand Savings Banks
Percentage ofAssets of Commercial
and Savings BanksAs of
December 31, 1986As of
December 31, 1982As of
December 31, 1986As of
December 31, 1992
Group1a
LargeMediumSmall
Subtotal
Group 2b
LargeMediumSmall
Subtotal
Group 3C
LargeMediumSmall
Subtotal
Group 4d
LargeMediumSmall
Subtotal
Group 5e
LargeMediumSmall
Subtotal
3.413.367.083.7
1.01.9
11.414.3
0.10.10.70.9
00.10.50.6
00.10.40.5
5.421.967.795.1
0.51.22.54.3
00.10.20.3
00
0.10.2
00.10.10.2
35.58.59.1
53.1
40.12.71.8
44.5
1.70.10.11.9
0.10.10.10.3
0.10.10.10.2
62.114.19.1
85.3
13.00.90.3
14.2
0.10.1
00.2
0.100
0.1
0.10.1
00.2
100.0
14,660
Total Assets (Billions of dollars) n.a.
100.0
11,983
n.a.
100.0
n.a.
3,178
100.0
n.a.
3,725
SOURCE: Congressional Budget Office based on data from the Federal Deposit Insurance Corporation and W.C. Ferguson and Company.
NOTE: Large banks have assets greater than $500 million, medium banks have assets between $500 million and $100 million, and smallbanks have assets of less than $100 million.
n.a. = not applicable.
a. Equity-to-asset ratios greater than 6 percent.
b. Equity-to-asset ratios between 3 percent and 6 percent.
c. Equity-to-asset ratios between 1.5 percent and 3 percent.
d. Equity-to-asset ratios between zero and 1.5 percent.
e. Equity-to-asset ratios less than zero.
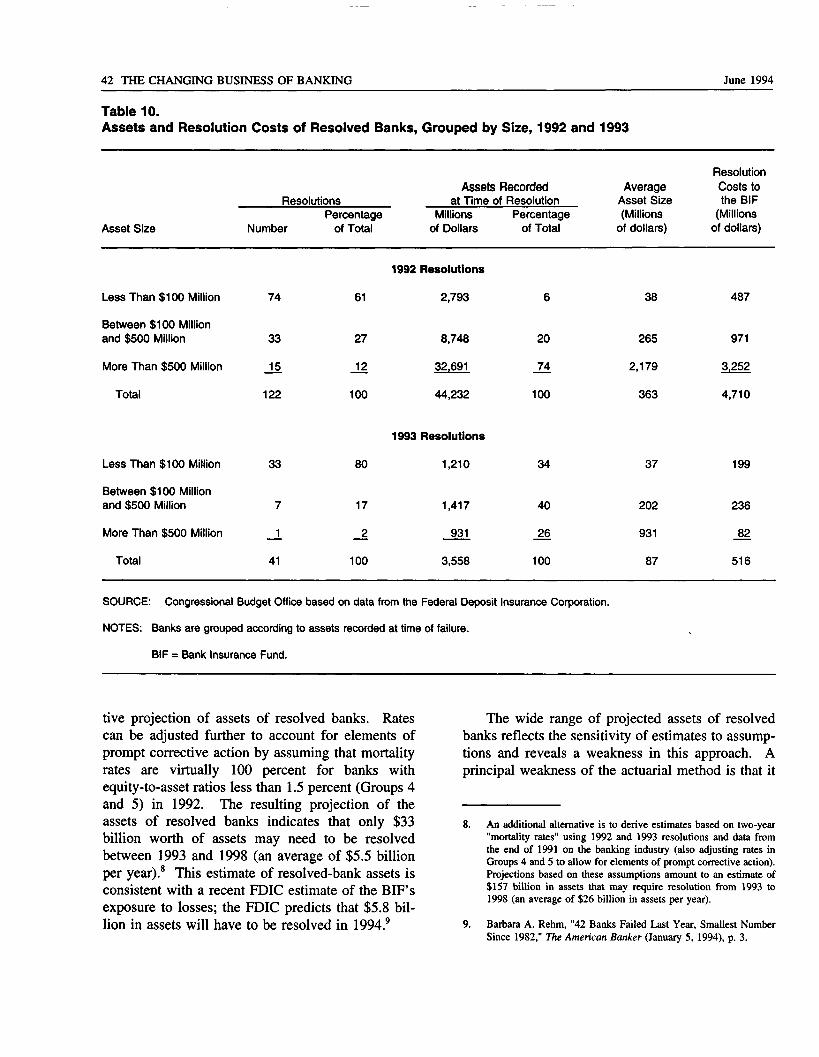
42 THE CHANGING BUSINESS OF BANKING June 1994
Table 10.Assets and Resolution Costs of Resolved Banks, Grouped by Size, 1992 and 1993
Asset Size
ResolutionsPercentage
Number of Total
Assets Recordedat Time of Resolution
Millions Percentageof Dollars of Total
AverageAsset Size(Millions
of dollars)
ResolutionCosts tothe BIF
(Millionsof dollars)
Less Than $100 Million 74
Between $100 Millionand $500 Million 33
More Than $500 Million 15
Total 122
61
1992 Resolutions
2,793 6
20
74
100
38
265
2,179
363
487
971
3.252
4,710
Less Than $100 Million
Between $100 Million
33
1993 Resolutions
80 1,210 34 37 199
and $500 Million
More Than $500 Million
Total
7
_1
41
17
_2
100
1,417
931
3,558
40
26
100
202
931
87
236
82
516
SOURCE: Congressional Budget Office based on data from the Federal Deposit Insurance Corporation.
NOTES: Banks are grouped according to assets recorded at time of failure.
BIF = Bank Insurance Fund.
tive projection of assets of resolved banks. Ratescan be adjusted further to account for elements ofprompt corrective action by assuming that mortalityrates are virtually 100 percent for banks withequity-to-asset ratios less than 1.5 percent (Groups 4and 5) in 1992. The resulting projection of theassets of resolved banks indicates that only $33billion worth of assets may need to be resolvedbetween 1993 and 1998 (an average of $5.5 billionper year).8 This estimate of resolved-bank assets isconsistent with a recent FDIC estimate of the BIF'sexposure to losses; the FDIC predicts that $5.8 bil-lion in assets will have to be resolved in 1994.9
The wide range of projected assets of resolvedbanks reflects the sensitivity of estimates to assump-tions and reveals a weakness in this approach. Aprincipal weakness of the actuarial method is that it
8. An additional alternative is to derive estimates based on two-year"mortality rates" using 1992 and 1993 resolutions and data fromthe end of 1991 on the banking industry (also adjusting rates inGroups 4 and 5 to allow for elements of prompt corrective action).Projections based on these assumptions amount to an estimate of$157 billion in assets that may require resolution from 1993 to1998 (an average of $26 billion in assets per year).
9. Barbara A. Rehm, "42 Banks Failed Last Year, Smallest NumberSince 1982," The American Banker (January 5, 1994), p. 3.
CHAPTER FIVE AN INDUSTRY OUTLOOK: GUARDED OPTIMISM 43
is sensitive to the period over which the historicalsample is chosen. The chance that the assets of aninstitution will be resolved in the future is basedentirely on rates from the previous period amongbanks with similar characteristics. Another weak-ness is that only a limited number of characteristicsare used to assign banks to groups reflecting risk ofloss. The characteristics that are chosen allow themodel to account implicitly for the ways in whichlocal and national economic trends affect the condi-tion of the industry. The reason is that, over time,banks move among groups based on changes inthese characteristics; for example, when there is animprovement in capitalization or growth in assets aninstitution may move to a group with reduced riskof resolution. Several factors, however, influencethe incidence of resolution for a particular subgroup.Because it has such a limited characterization ofinstitutions, the model cannot explicitly account forthe ways in which structural and economic changesaffect mortality rates. Thus, the choice of samplesignificantly determines projected estimates. Forexample, actuarial projections using mortality ratesderived from the 1960s would be very different(lower) than estimates using comparable rates fromthe 1980s.
One of the advantages of the actuarial approachis its simplicity. Using a limited amount of dataand some judgment about the appropriate historicalperiod to account for structural and other externaltime-varying factors, projections from this modelcan be used along with other indicators as a guideto estimates of the BIF's exposure to losses. Sepa-rating the industry into capitalization and size cate-gories also provides a useful method of comparingthe condition of the industry over a period of time(see Table 9).
Reforms in FDICIA andSome RemainingPolicy Issues
Concerns about the financial condition of the bank-ing industry and the ability of the Federal DepositInsurance Corporation to cover losses from thealarming number of resolutions in the 1980s were
major motivating factors for the Federal DepositInsurance Corporation Improvement Act of 1991.Along with recapitalization of the Bank InsuranceFund, a major theme of this legislation is to foster"safety and soundness" in the banking industry.Three of the five titles of FDICIA deal with safetyand soundness or regulatory improvement. Interest-ingly, safety and soundness was the major theme ofthe Banking Act of 1933 that established the Feder-al Deposit Insurance Corporation. As a follow-upto FDICIA, the Congress is engaged in continuousoversight of the health of the banking industry andthe deposit insurance fund.10
A little over two years since its passage, it isdifficult to evaluate fully the effects of FDICIA.Nevertheless, the reforms that the act put in placeappear to have addressed directly some of the majorproblems identified during the 1980s—a period thatput considerable stress on the regulatory and depositinsurance systems. For example, during the 1980sthere was evidence of increased risk in the assetportfolios of banks. The deposit insurance systemsubsidized risk taking by banks during this periodbecause insurance premiums were unrelated to riskof failure. Banks were particularly tempted to in-crease returns through riskier instruments because,in effect, any increase in risk was subsidized by thedeposit guarantee system. Under FDICIA, theFDIC is required to set premium levels that aresensitive to risk. Moreover, the FDIC must setpremiums at a level designed to recapitalize theBank Insurance Fund to a reserve ratio of 1.25percent within a 15-year period.
In 1988, the Basle Accord introduced the Bankfor International Settlement (BIS) capital standardsfor banks involved in international finance. TheBIS standards require that these banks maintain acapital ratio (based on a risk-weighted measure ofassets) of at least 8 percent. FDICIA extends theBIS standards to all banks covered by deposit insur-ance and requires that regulators periodically reviewand revise risk-based capital standards to take betteraccount of risks. Higher capital standards alsoaddress the deposit insurance system's implicit sub-
10. F. Jean Wells, "Banks and Thrifts: Post-FIRREA, Post-FDICIA,"CRS Issue Brief (Congressional Research Service, March 29,1993).
44 THE CHANGING BUSINESS OF BANKING June 1994
sidy of risk taking by forcing banks to improve theinternalizing of the costs of their portfolio decisions.Also, the larger buffer of capital between solvencyof an institution and resolution by the FDIC reducesthe risk that taxpayers will have to bail out the fundbecause failed banks have caused excessive losses.
FDICIA requires annual on-site examinations ofinsured institutions and generally tougher supervi-sion and regulation.11 Moreover, the act requiresthat bank regulators employ regulatory constraints-depending on how a bank is rated in the way itmeets minimum prescribed capital levels—andprompt closure of severely undercapitalized institu-tions. These requirements address the possibility ofsurprises caused by infrequent examination. Morefrequent examinations are necessary for prompt cor-rective action, especially during periods when condi-tions are deteriorating quickly. Regulators shouldbe better able to take timely supervisory actionswith the improved information from examinations.More timely supervision is an attempt to handle theproblems of poorly capitalized institutions beforethey can increase the risk of loss to the insurancefund.
Because banks are operating in a competitiveenvironment, it is uncertain whether the "safety andsoundness" provisions of FDICIA will interfere withthe ability of banks to make profits in the longterm. The share of financial assets held by com-mercial banks dropped from 57 percent in 1946 toabout 30 percent in 1990-and three of the top fiveissuers of credit cards are not banks-which showshow competitive the environment has become.
The record profits in the two years followingenactment of FDICIA tend to obscure the fact thatthe banking industry has been losing ground to oth-er types of financial services. But to a degree,banks are earning profits by taking advantage oflow interest rates, a strategy that exposes them toincreased risk in the interest rate market. Some in-dustry analysts are concerned that when economicconditions change so that the returns based on inter-
est rate spreads narrow, it will expose some banksto increased risk of failure. Given the possibilitythat changing economic conditions may make theindustry susceptible to such periodic crises, policy-makers are interested in making further structuralchanges in the banking industry.12 They are inter-ested in legislative reform that would enable banksto diversify, either geographically or through vari-ous product offerings. The Congress is consideringan interstate branching bill that would permit banksto diversify their loan portfolios across state lines.
Issues of Structural Reformon the Horizon
Currently, restrictions on interstate banking do notallow federally chartered banks to operate branchesacross state lines. Banks have developed ways tocircumvent these restrictions by using holding com-panies that may own banks in other states if permit-ted to by state law. The McFadden-Pepper Act of1927, as amended, prohibits national banks and statebanks that are members of the Federal Reserve Sys-tem from having branches outside their home state.13
Most states, however, permit expansion through thebank holding company arrangement. In this way,banks (usually large banks) can diversify their loanportfolios nationally by opening up loan productionoffices across state borders.
The argument for reducing further restrictionson interstate banking reasons that bank brancheswill enable banks to diversify their loan portfoliosacross geographic boundaries, increase customerconvenience, and facilitate lending to smaller bor-rowers. A customer moving from one state to an-other would not have to change accounts if branchesof the institution holding the account were availablein the new state. In addition, bank branches may bemore efficient than loan offices for lending acrossstate lines. Branches may be less expensive tomaintain than a similar number of incorporated sub-
11. Recent legislation (the Community Development Banking andFinancial Institutions Act of 1993, for example) specifically pro-vides for regulatory relief in some cases and could water downprovisions in FDICIA that call for annual examinations.
12. Barbara A. Rehm, "Policymakers Renewing the Call for Overhaulof Bank Regulations," The American Banker (February 17, 1994).
13. Donald T. Savage, "Interstate Banking: A Status Report," FederalReserve Bulletin, vol. 79 (December 1993), pp. 1075-1089.

CHAPTER FIVE AN INDUSTRY OUTLOOK: GUARDED OPTIMISM 45
sidiary banks necessary under a holding companyarrangement. Alternatively, there are concerns thatfederal legislation removing interstate banking re-strictions would impair loan service to local com-munities because of an increased tendency towardindustry consolidation, perhaps yielding fewer small,community banks. There are also related concernsthat reduced branching restrictions would make itdifficult to guard against monopolization of depositsby large banks at the state, regional, and nationallevels.
Two of the pieces of legislation proposing inter-state branching introduced in the 103rd Congressare S. 1963 and H.R. 3841. (The Senate BankingCommittee approved S. 1963 on February 24, 1994,and the House of Representatives passed H.R. 3841on March 9, 1994.) These bills would permit inter-state acquisitions by adequately capitalized banksone year after enactment and interstate branchingwithin two to three years. They also address con-
cerns about monopolization by prohibiting any bankfrom holding more than 25 percent or 30 percent(the Senate and House limits, respectively) of theinsured deposits in any state or 10 percent of na-tional insured deposits.
The issues of increased competition and thedecline of assets held by banks in relation to non-banks have led to a call for legislation that wouldallow banks to diversify their assets further—specifi-cally, by allowing banks to offer securities andinsurance products. Opinions differ as to whethersuch changes would remove barriers to profitableenterprises or increase the risk of loss to the public.Mortality rates might increase because risky non-banking enterprises impose larger losses on banks.Alternatively, better diversification could reduce therisk of loss. The issue remains controversial andthere are, at present, no bills before the Congressthat would allow banks to diversify their productlines.


Appendixes

Appendix A
Methods of Evaluatingthe Financial Condition of Banks
T he criteria for safety and soundness requirethat regulators monitor banks to target fi-nancially weak institutions. Regulators
employ two methods to monitor the financial condi-tion of banks and identify banks that are in dangerof failing: on-site examinations and off-site monitor-ing through the use of economic models. Althoughbanks must submit financial reports to regulatoryauthorities every quarter, the on-site examinationprocess remains the primary method of monitoringbanks. The Federal Deposit Insurance CorporationImprovement Act (FDICIA) of 1991 requires on-siteexaminations at least once a year.1
On-Site Examinations
Regulatory agencies conduct periodic audits and on-site examinations at banks under their jurisdiction.Bank examiners consider a bank's financial condi-tion, review its compliance with laws and regula-tions, and project its prospects for the future. Ex-aminations usually include (1) an analysis and ap-praisal of the bank's assets, (2) an analysis of itsearnings, (3) an evaluation of the bank's manage-ment and review of management policies, (4) anevaluation of audit and internal and external controlprocedures, and (5) a determination of the bank'scapital and liquidity positions. Part of the examina-tion process is designated solely for purposes of cer-tifying safety and soundness. The intent of the
1. Section 111 of the Federal Deposit Insurance Corporation Im-provement Act of 1991, 12 U.S.C. 1820, 105 Stat. 2240.
safety and soundness examination is to verify thatan institution has adequate capital and liquidity toconduct business within safe operating guidelines.
The three federal bank regulatory agencies-theOffice of the Comptroller of the Currency, the Fed-eral Deposit Insurance Corporation (FDIC), and theFederal Reserve-have a method of incorporating theresults of an examination into a uniform interagencysystem for rating the condition and soundness ofbanks. The system involves an assessment of fivecritical aspects of a bank's operations and conditionand is generally known by the acronym CAMEL—capital, asset quality, management, earnings, andliquidity. First, the examiner determines a numeri-cal index from 1 to 5 for each of the five criteriacategories—an index of 1 being the most favorable.The second part of the evaluation system involvescombining these five indexes into a compositeCAMEL rating of the bank's condition and sound-ness.
The FDIC uses the CAMEL rating to rankbanks insured by the Bank Insurance Fund accord-ing to the financial risk they impose on the fund.Institutions with financial, operational, or manage-rial weaknesses that threaten their continued finan-cial vitality are given a composite rating of 4 or 5,depending on the degree of risk and supervisoryconcern. The FDIC places banks in this categoryon its list of "problem" institutions, and they aremonitored more frequently. Meanwhile, regulatorsmove to address problems identified by the exam-iner and mandated by provisions in FDICIA forprompt corrective-action.
50 THE CHANGING BUSINESS OF BANKING June 1994
The process of on-site examination is expensive.It is labor-intensive and incurs heavy travel ex-penses for examiners. How effective the on-sitesystem of monitoring banks is depends on the judg-ment, experience, and training of the examiners, thesize of the examination staff, and the frequency ofthe examinations. Various methods have been usedover the years to help reduce the expense of theexamination process, such as alternating examina-tions with qualified state agencies.
In order to monitor bank operations betweenexaminations, regulatory agencies review detailedfinancial and operating data-essentially book-valueincome and balance-sheet information~that banksmust supply to the authorities on a quarterly basis.These detailed financial statements are known as"call reports." Beginning in the 1970s, the threefederal regulatory agencies developed computerizedinformation systems based primarily on call-reportdata. Transfer of the call-report data to computersmade it possible to use electronic information pro-cessing for detecting emerging weaknesses.2 Whenused for this purpose, the information system isgenerally known as an early-warning system (EWS).
Off-Site Detection:Early-Warning Systems
Computer-based models designed to act as early-warning systems complement the on-site examina-tion process for detecting problem banks. As apractical matter, the time lapse between examina-tions makes it desirable for regulatory authorities tohave more current information on a bank's underly-ing financial condition. Regulatory agencies useearly-warning systems to determine which institu-tions may require more frequent examinations andwhich may present excessive risks to the depositinsurance fund.
There are two major categories of EWS models.One consists of models that measure degrees of risk
or financial condition associated with individualbanks. Examples of EWS models in this categoryinclude both discriminant models and options-pric-ing models. The second category includes varioustypes of econometric models that estimate the prob-ability of resolution of an institution based on its fi-nancial, structural, and economic characteristics.The logit statistical model and proportional hazardsmodel are examples of econometric procedures usedto estimate the probability of resolution.
Discriminant analyses represents one of theearliest attempts at using call-report data to spotpossible problem banks. The discriminant modelgenerates a statistical formula that separates banksinto various categories of financial soundness basedon an index value derived from the formula.3 Thevariables used in estimating the formula are gener-ally related to factors that examiners assess whendetermining a CAMEL rating. The factors includemanagement quality (net earnings, dividends, andborrowing as a percentage of capital), asset quality,and capital adequacy (equity-to-asset measures). Inorder to calibrate the model and measure its useful-ness for projections, the results of the off-sitediscriminant model can be compared with CAMELratings from on-site examinations. This kind ofcomparison was done by Eric Hirshorn, a financialanalyst at the FDIC.4 (CAMEL ratings are notavailable to the public). In his analysis, Hirshorndeveloped a risk-index formula using discriminantanalysis to compare with CAMEL ratings. Theindex correctly classified about 70 percent of thefinancially weakened banks that the examiner as-signed a CAMEL rating of 3, 4, or 5.
2. John F. Bovenzi, James A. Marino, and Frank E. McFadden,"Early Warning Systems and Financial Analysis in Book Monitor-ing," Economic Review of the Federal Reserve Bank of Atlanta(November 1983), pp. 1-34.
3. David P. Stuhr and Robert Van Wickler, "Rating the FinancialCondition of Banks: A Statistical Approach to Aid Bank Supervi-sion, Monthly Review, Federal Reserve Bank of New York (Sep-tember 1974). See also Edward Altman and others, Applicationsof Competitive Techniques in Business and Finance (Greenwich,Conn.: JAI Press Inc., 1981); and Joseph Sinkey, Jr., "AMultivariate Statistical Analysis of the Characteristics of ProblemBanks," Journal of Finance, vol. 30, no. 1 (March 1975), pp. 21-36. One analysis by John Myers and Howard W. Pifer, "Produc-tion of Bank Failure," Journal of Finance, vol. 25, no. 4 (Sep-tember 1970), pp. 853-869, uses a discriminant analysis to demon-strate that real estate lending may lead to bank failure.
4. Eric Hirshorn, "Risk Related Deposit Insurance Premiums," Bank-ing and Economic Review (Federal Deposit Insurance Corporation,1986).
APPENDIX A METHODS OF EVALUATING THE FINANCIAL CONDITION OF BANKS 51
The options-pricing models are an outgrowth ofthe discriminant models. These models use datafrom the stock market and call reports to estimatethe market value of assets for openly traded banks,which tend to be large banks and bank holdingcompanies. These models can also be used to eval-uate changes in risk over time. One study uses theoptions-pricing approach to examine risk for a sam-ple of nine bank holding companies over the 1985-1991 period. Their results indicate little change inrisk for these nine institutions during the seven-yearperiod.5
Statistical techniques including the logit andproportional hazards models are used to help iden-tify potential resolutions by estimating the contribu-tion of various factors to the probability of failure.6
Variables describing the financial condition and eco-nomic environment facing a bank are used in thesestatistical formulas to derive an index indicating thelikelihood of failure for an institution over a particu-lar time period. These models are a useful comple-ment to other methods of projecting failures in theshort run.
Type I and Type II Errors inPredicting Bank Failure
The process of identifying an institution at risk offailure is somewhat uncertain. It is important tounderstand that early-warning system models canerroneously predict the future status of an institu-tion. A model can make two types of errors in pro-jecting whether or not an institution will fail. It ispossible to predict that a bank will not fail when, infact, it does—this is known as a Type I error. Alter-natively, it is possible to classify an institution thatdoes not fail in the time period being considered asa failure—this is known as a Type II error.
5. Congressional Budget Office, "The Asset Risk of Money CenterBanks," unpublished draft (June 1992).
6. Recent studies using logit and proportional hazards methods areJ.B. Thompson, "Predicting Bank Failures in the 1980s," Eco-nomic Review, Federal Reserve Bank of Cleveland (1st Quarter1991), pp. 9-20; and G. Whalen, "A Proportional Hazards Modelof Bank Failure: An Examination of its Usefulness as an EarlyWarning Tool," Economic Review, Federal Reserve Bank ofCleveland (1st Quarter 1991), pp. 21-31.
In using an EWS, an analyst must choose acritical level (R) below or above which a bank canbe classified as sound. In discriminant analysis, ifthe index of a bank exceeds a certain discriminantlevel (as the index rises the risk of failure in-creases), it is classified as a failure. Similarly,using logit analysis, the analyst must choose anindex level of probability above which the bank isassumed to fail. For example, for a critical level of0.5, any bank evaluated at a probability of 50 per-cent or more using the logit function will be classi-fied as a failure.
The choice of the critical level (R) should notbe arbitrary. Certain costs are associated with com-mitting both classes of errors. If the value of R istoo low, the model will tend to commit more TypeII errors (predicting more nonfailures as failures)and fewer Type I errors (predicting fewer failures asnonfailures). The converse is true if the R value istoo high. If increased exams or other supervisoryactions are based on EWS projections of failuresthat turn out to be false alarms, the cost to regula-tory agencies could increase unnecessarily. Andyet, if banks that require supervisory actions be-tween examinations are missed because of a highlevel of Type I errors, it could be costly to the BankInsurance Fund.
One way to calibrate an EWS model is to use itto project failures for the historical sample period.By recording the number of correct and incorrectclassifications at alternative levels of R, it becomespossible to choose a critical level that in principleminimizes the expected costs of misclassification.If the costs of classifying a failure as a nonfailuregreatly exceed the costs of classifying a nonfailureas a failure, it may be reasonable to choose a lowcritical value. If the costs of committing a Type IIerror (classifying a nonfailure as a failure) areviewed as higher, choosing a relatively high R valuewill reduce the probability of committing a Type IIerror.
Given the uncertainty involved in spotting trou-bled banks, regulators do not rely on a single tech-nique to evaluate an institution. They use reportsfrom on-site examinations, CAMEL ratings, andvarious types of off-site early-warning system mod-els to monitor the condition of banks.

Appendix B
Types of Resolutions:Data on Resolution Costs
and Bank Resolutions
T he incidence and size of failed banks andthe least-cost criteria of resolving them haveled to three general types of resolutions:
payoffs and transfers, purchase and assumptions,and assistance transactions. As the need arises, theFederal Deposit Insurance Corporation (FDIC) de-velops methods of resolving institutions based ontheir legislative mandate and the condition of themarket. (Table B-l on page 57 presents summarymeasures for banks resolved by the FDIC over the1987-1992 period by type of resolution transaction.Tables B-2 through B-6 provide information on thenumber, assets, and costs of resolved institutionsover the period by year and by type of resolutiontransaction.)
Payoffs and Transfers
Payoffs and transfers are used here to describe aresolution in which virtually all of the liabilities ofan institution are retained by the FDIC as receiver.As the receiver, the FDIC determines how the liabil-ities will be handled—in particular, whether to payoff insured depositors directly or transfer their ac-counts to a paid agent bank. The FDIC may alsoact as a receiver of some part or all of the assets ofa failed bank in this or other methods of resolution.Generally, the FDIC chooses to become a receiveras a last resort—when it is unable to sell a bank to aprivate party. If insured deposits are relativelysmall, the bank may be a likely candidate for liqui-dation simply because the FDIC may be unable toattract competitive bids from other banks. Com-
pared with other methods of resolving an institution,payoffs can require a large initial payout for cov-ered liabilities.
The FDIC must perform a statutory cost test forall proposed resolution transactions. Before theFederal Deposit Insurance Corporation ImprovementAct of 1991 (FDICIA), the cost test required that amethod of resolution be no more costly than thepayoff (of insured depositors) and liquidation (ofassets) method. FDICIA requires that the FDICnow consider all feasible methods of resolution andchoose the least costly alternative.
The average-size bank that was resolved using apayoff or transfer over the 1987-1992 period heldapproximately $66 million in assets (see Table B-l).During this period, payoffs and transfers accountedfor 18 percent of all resolutions and an estimated$3.8 billion in losses to the Bank Insurance Fund.
Payoffs. A payoff is a receivership in which theFDIC issues checks to insured depositors up to the$100,000 limit per account. The FDIC seeks torecover as much of this initial disbursement aspossible by selling the assets of the failed bank.Disposition of the assets of a failed bank usuallytakes between five and seven years.1
For a discussion of the time distribution of recoveries on failed-bank assets, see Richard A. Brown and Seth Epstein, "ResolutionCosts and Bank Failures: An Update of the FDIC Historical LossModel," FDIC Banking Review, vol. 5, no. 1 (Spring/Summer1992), p. 4.
54 THE CHANGING BUSINESS OF BANKING June 1994
Payoffs have generally been used for smallbanks with less than $100 million in assets; theaverage failed institution in this category held $63million in assets by the time it was resolved. Dur-ing the 1987-1992 period, losses per dollar of assetsfor payoffs were higher than for any other form ofresolution, averaging 33 percent (see Table B-l).Even with such a high recorded cost per dollar ofassets, since the institutions involved were small,these payoffs represented less than 3 percent of thecumulative resolution costs during this period.
Deposit Transfers. Another type of resolution inwhich the FDIC acts as a receiver of liabilities isthe deposit transfer. Rather than pay out fundsdirectly, the FDIC finds an agent bank to assumethe insured and secured liabilities of the insolventbank. In this case, the FDIC may pay the agentbank a premium with the expectation of recoupingsome of these losses from the assets of the failedinstitution. This method of resolution is called aninsured deposit transfer and could be less costlythan a payoff if an agent bank perceives some fran-chise value associated with the insured deposits. Ifthe agent bank also acquires some portion of theassets of the failed bank, the resolution is referred toas a deposit insurance transfer and asset purchase.
In a deposit transfer transaction, the insolventbank is closed and the insured and secured depositsoften remain in the community in which they origi-nated. Other eligible creditors share in the FDICasset liquidation and may recoup some portion oftheir losses. In general, deposit transfers are costlyin relation to other forms of nonreceivership resolu-tions, and losses averaged 31 percent of assets inthe 1987-1992 period (see Table B-l).
Purchase and Assumptions
The second class of resolutions used by the FDICare called purchase and assumption (P&A) transac-tions. In this method of resolution, solvent banksare permitted to bid on the assets and liabilities of afailed bank with the objective of assuming them. Ina traditional purchase and assumption transaction,the failed bank is closed and an acquiring institutionbuys some of its assets, assuming its deposits andcertain other liabilities (including nonsubordinated
liabilities) with or without FDIC assistance. BeforeFDICIA, it was usual for all depositors, includingthose who were uninsured, to receive full paymenton claims. In many cases, the failed institution issimply merged with another bank or reopened undernew ownership and management. The main benefitof this form of purchase and assumption settlementis that it can to some degree avoid interruption inthe availability of funds to all depositors.
Typically, purchase and assumption transactionsinvolve smaller disbursements from the FDIC andlower losses per dollar of assets than payoffs ortransfers. Acquiring banks usually pay a premiumfor a failed bank's charter that is large enough to re-duce the estimated cost of a P&A transaction belowthat of a deposit payoff. For the P&A to be morecost-effective than a liquidation or deposit transfer,the franchise value of the failed-bank assets must begreater than the additional uninsured and securedliabilities that the acquiring bank must assume. In1992, the FDIC developed a form of purchase andassumption in which only insured deposits are trans-ferred. This relatively new form of resolution cameabout as a way of meeting the statutory least-costrequirements of FDICIA. It may encourage morebids for an institution because potential acquirers ofa failed institution can balance failed-bank assetsagainst covered liabilities only.
As a general class of resolutions, P&As madeup 78 percent of resolutions between 1987 and1992. For that period, average losses on assets forP&As was 13 percent (see Table B-l). The averagesize of P&A transactions was about $228 million,and this class of resolution accounted for 81 percentof the losses over the period.
Total Bank Purchase and Assumption. In a "totalbank" or "total assets" purchase and assumption(TAPA), the FDIC sells virtually all of the assets ofthe closed insolvent bank to the assuming institu-tion. In a TAPA transaction, all assets and liabili-ties-the insured and secured deposits as well asother liabilities—are removed from FDIC respon-sibility. Approximately 28 percent of resolutionsfrom 1987 to 1992 were TAPAs. These resolutionsmade up 33 percent of total Bank Insurance Fundlosses and averaged 14 percent of losses per dollarof assets over the period. The average size of a
APPENDIX B TYPES OF RESOLUTIONS: DATA ON RESOLUTION COSTS AND BANK RESOLUTIONS 55
bank resolved using the TAPA method was about$250 million at resolution.
As a way of minimizing losses, the FDIC triesto keep as many of the assets of a failed bank underprivate control as possible. In a TAPA transaction,virtually all assets are assumed by the acquirer inexchange for one-time financial assistance. That is,the assuming bank is paid a "negative premium" bythe FDIC to assume the risks associated with assetsof the failed bank. In a total bank P&A, the acquir-ing institution faces uncertainty about the value oftroubled assets. Because of the risk of loss associ-ated with some of the assets in the portfolio, apotential acquirer may request a larger premiumthan the least-cost test can justify. Some of theuncertainty can be reduced if the FDIC retains theproblem assets and allows the purchaser to assumethe "clean" assets in the transaction.
Clean Bank and Other P&As. At the other ex-treme from a TAPA is the "clean bank" transactionin which only assets that are assessed to be of rela-tively low risk are transferred to the acquiring insti-tution. In other variations of purchase and assump-tion transactions, the FDIC agrees to purchase backsome or all of the risky assets, if the assuming bankchooses to "put back" these loans in a specifiedtime period. In some cases, the assuming bankagrees to keep all loans under a predetermined sizewith a no putback option. The larger the originalloans and the higher the risk determination, themore putbacks a P&A will probably involve. Asmore putback options are invoked, a greater amountof assets must be held by the FDIC.
Clean banks and non-TAPA forms of assump-tions were the most common resolution methodsused during the 1987-1992 period, averaging 46percent of all resolutions and 42 percent of BIFlosses. Losses per dollar of assets averaged 13percent and the average size of a failed bank in thiscategory was $200 million (see Table B-l).
P&As Covering Insured Deposits Only. AfterFDICIA, the FDIC deviated from the traditionalpurchase and assumption transaction in which alldeposits are assumed by the acquiring bank. In thenewly developed form of P&A, the acquiring bankassumes only insured deposits (Pis). This type of
transaction may make an institution more attractiveto potential acquirers and can reduce losses to theinsurance fund. The PI method of resolution wasused for 42 banks with an average size of more than$400 million during the first year it became avail-able (1992). The cost per dollar of failed bankassets is lowest among all forms of resolutions usedover the 1987-1992 period. Losses to the insurancefund from these transactions amount to almost $2billion, however, because of the asset size of failedbanks in this class of resolutions.
Assistance Transaction Resolutions
The third class of resolutions involves assistance tobanks that are experiencing temporary financialproblems or are on the verge of failing for whichthe FDIC has become a conservator. This is themost controversial form of resolution because itmay either subsidize the stockholders of potentiallyinsolvent banks-open-bank assistance (OBA)--or, inthe case of bridge banks, involve government in-vestment, ownership, and operation of insolventbanks. The FDIC used assistance transactions toresolve 47 banks from 1987 to 1992, causing about$1.8 billion in losses to the Bank Insurance Fund.These banks were larger than banks that were re-solved through either traditional P&As or receiver-ships. Although assistance transactions made uponly 4 percent of recent resolutions, they accountedfor 6 percent of estimated losses to the insurancefund over the period. Estimated losses per dollar ofassets were, on average, the second lowest of anyresolution method during the period.
Open-Bank Assistance. All forms of direct finan-cial assistance by the FDIC to an operating bank areknown as open-bank assistance. Such assistancecan take the form of promissory notes, net worthcertificates, cash, assumptions of debt, guaranteesagainst loss, and infusions of equity. In OBAs,unlike all other forms of resolution, the originalcharters are not revoked.
The FDIC first used its OB A authority in 1971.Before 1982, OB A was not considered a method ofresolution. But the use of OBA as a method ofresolution became more prominent after the FederalDepository Institutions Act of 1982, which allowed
56 THE CHANGING BUSINESS OF BANKING June 1994
the FDIC to grant financial assistance in the form ofOBA to any bank in a weakened condition, as longas the cost of OBA was less than the cost of liqui-dation. Granting aid under open-bank assistancegenerally requires less capital than either P&As orliquidations.
The government declared no losses in four ofthe first five cases of OBA. Open-bank assistancehas usually been used for larger institutions thatrequire assistance (for example, Continental Illinois,a $33.6 billion bank resolved in September 1984,and First City BanCorporation, an $11.2 billionbank resolved in April 1988). This resolutionmethod has been criticized because, although man-agement often changes under OBAs, it may subsi-dize stockholders of a potentially insolvent institu-tion by allowing it to continue to operate.
Bridge Banks. The Competitive Equality BankingAct of 1987 expanded the FDIC's powers to handlebank failures by temporarily granting "bridge bankauthority." Under this authority, the FDIC operatesa failed institution for up to two years, with options
to extend operation for up to three years. Twoexamples of bridge bank transactions are the FirstRepublic Bancorporation, a $33.7 billion bank re-solved in 1988, and MCorp, a $15.4 billion bankresolved in 1989. Bridge banks are a type of con-servatorship in which prospective buyers can assessthe bank's condition.
Under a bridge bank transaction, management isreplaced and holding company creditors and share-holders lose their investments. This option givesthe FDIC additional time to arrange a merger orpurchase and assumption transaction, the expectedcosts of which are included in the initial estimate ofbridge bank losses. Bridge banks are only tempo-rary resolutions. The potential for moral hazardproblems associated with operating a collection offailing institutions is, in principle, limited becausethe FDIC is technically managing bank operations.Bridge banks, however, are not without their prob-lems. If the FDIC applies a bridge bank solution toa local bank, other banks in the region are placed incompetition with a government-run bank.
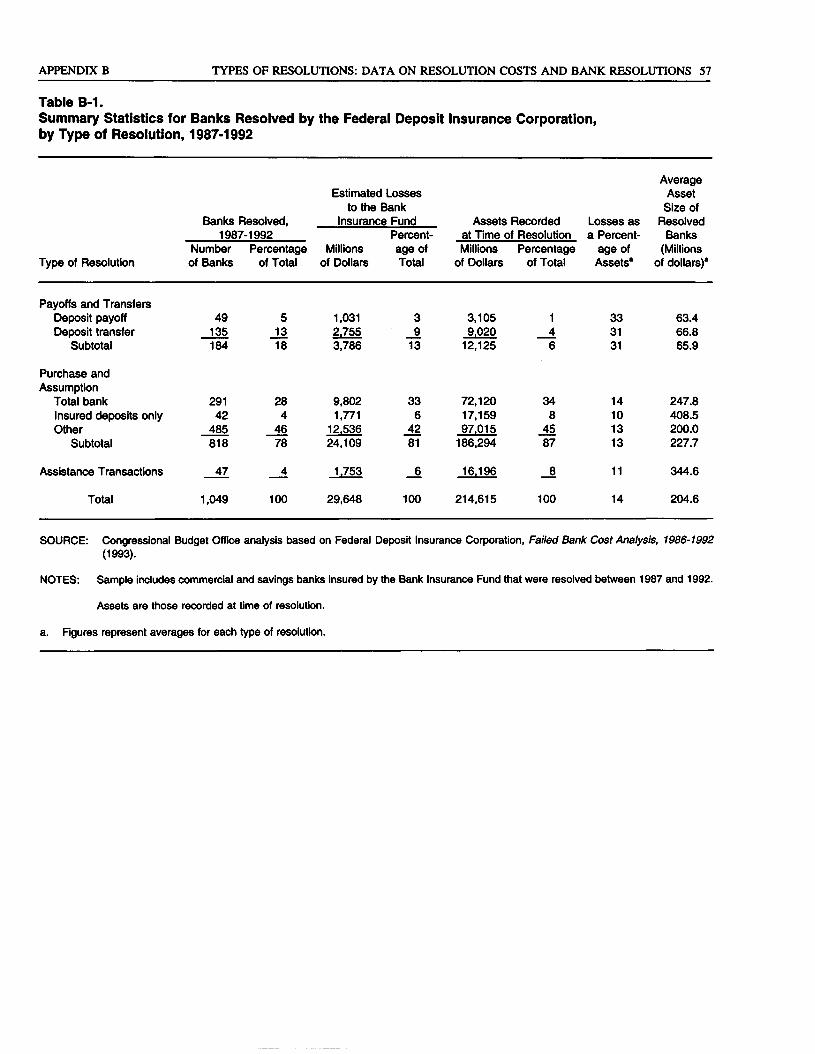
APPENDIX B TYPES OF RESOLUTIONS: DATA ON RESOLUTION COSTS AND BANK RESOLUTIONS 57
Table B-1.Summary Statistics for Banks Resolved by the Federal Deposit Insurance Corporation,by Type of Resolution, 1987-1992
Estimated Lossesto the Bank
Banks Resolved, Insurance1987-1992
Type of Resolution
Payoffs and TransfersDeposit payoffDeposit transfer
Subtotal
Purchase andAssumption
Total bankInsured deposits onlyOther
Subtotal
Assistance Transactions
Total
Numberof Banks
49135184
29142
485818
47
1,049
Percentageof Total
51318
284
4678
4
100
Millionsof Dollars
1,0312,7553,786
9,8021,771
12,53624,109
1,753
29,648
FundPercent-age ofTotal
39
13
336
4281
6
100
Assets Recordedat Time of ResolutionMillions
of Dollars
3,1059,020
12,125
72,12017,15997,015
186,294
16,196
214,615
Percentageof Total
146
348
4587
8
100
Losses asa Percent-
age ofAssets8
333131
14101313
11
14
AverageAssetSize of
ResolvedBanks
(Millionsof dollars)*
63.466.865.9
247.8408.5200.0227.7
344.6
204.6
SOURCE: Congressional Budget Office analysis based on Federal Deposit Insurance Corporation, Failed Bank Cost Analysis, 1986-1992(1993).
NOTES: Sample includes commercial and savings banks insured by the Bank Insurance Fund that were resolved between 1987 and 1992.
Assets are those recorded at time of resolution,
a. Figures represent averages for each type of resolution.
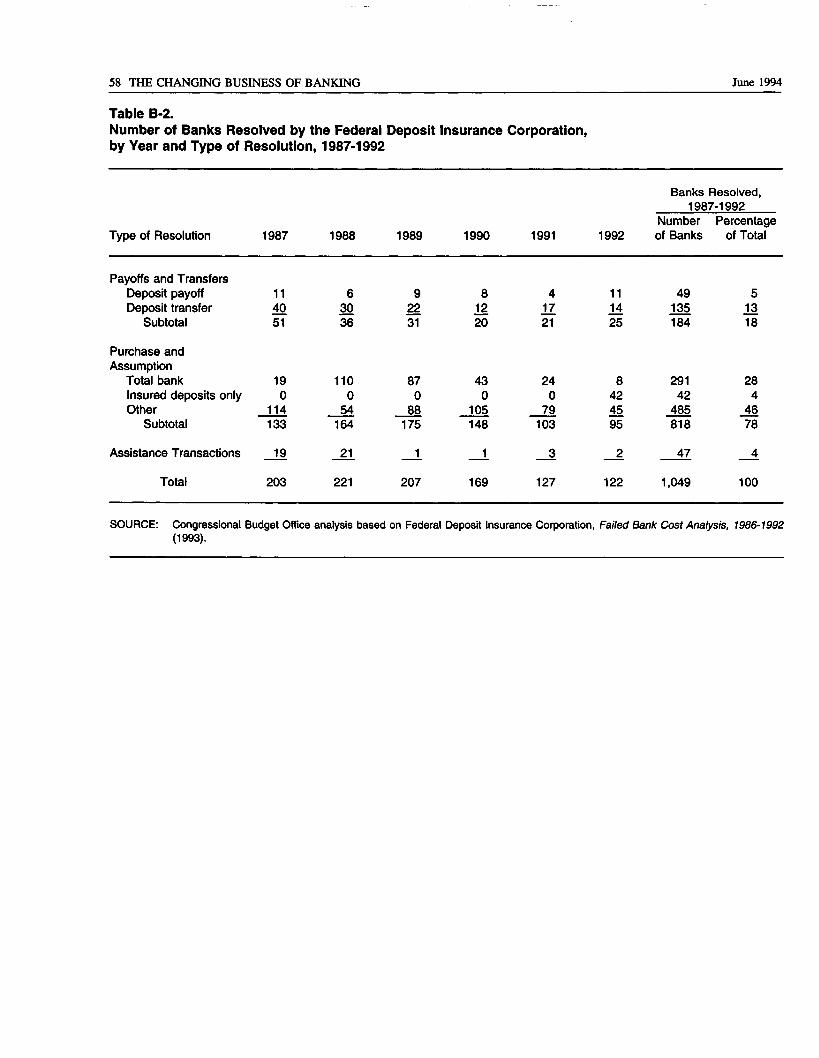
58 THE CHANGING BUSINESS OF BANKING June 1994
Table B-2.Number of Banks Resolved by the Federal Deposit Insurance Corporation,by Year and Type of Resolution, 1987-1992
Banks Resolved,1987-1992
Type of Resolution
Payoffs and TransfersDeposit payoffDeposit transfer
Subtotal
Purchase andAssumption
Total bankInsured deposits onlyOther
Subtotal
Assistance Transactions
Total
1987
114051
190
114133
19
203
1988
63036
1100
54164
21
221
1989
92231
870
88175
1
207
1990
81220
430
105148
1
169
1991
41721
240
79103
3
127
1992
111425
8424595
2
122
Numberof Banks
49135184
29142
485818
47
1,049
Percentageof Total
51318
284
4678
4
100
SOURCE: Congressional Budget Office analysis based on Federal Deposit Insurance Corporation, Failed Bank Cost Analysis, 1986-1992(1993).
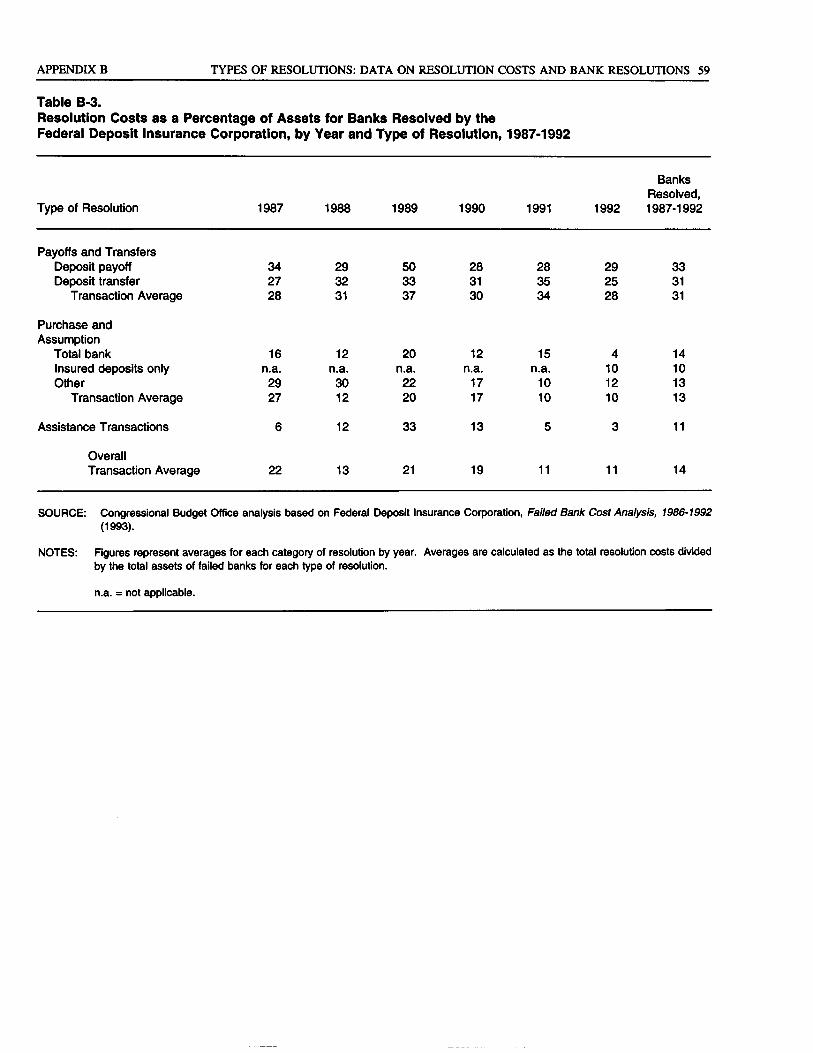
APPENDIX B TYPES OF RESOLUTIONS: DATA ON RESOLUTION COSTS AND BANK RESOLUTIONS 59
Table B-3.Resolution Costs as a Percentage of Assets for Banks Resolved by theFederal Deposit Insurance Corporation, by Year and Type of Resolution,
Type of Resolution
Payoffs and TransfersDeposit payoffDeposit transfer
Transaction Average
Purchase andAssumption
Total bankInsured deposits onlyOther
Transaction Average
Assistance Transactions
OverallTransaction Average
1987
342728
16n.a.2927
6
22
1988
293231
12n.a.3012
12
13
1989
503337
20n.a.2220
33
21
1990
283130
12n.a.
1717
13
19
1987-1992
1991
283534
15n.a.
1010
5
11
1992
292528
4101210
3
11
BanksResolved,1987-1992
333131
14101313
11
14
SOURCE: Congressional Budget Office analysis based on Federal Deposit Insurance Corporation, Failed Bank Cost Analysis, 1986-1992(1993).
NOTES: Figures represent averages for each category of resolution by year. Averages are calculated as the total resolution costs dividedby the total assets of failed banks for each type of resolution.
n.a. = not applicable.
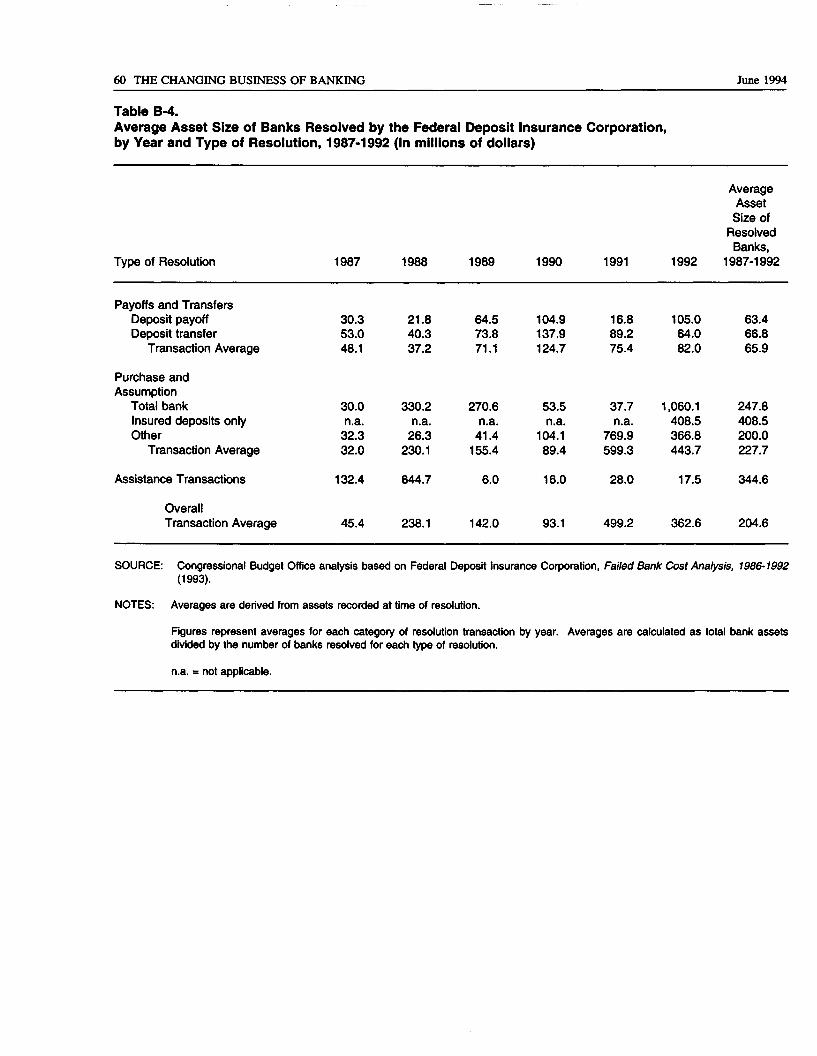
60 THE CHANGING BUSINESS OF BANKING June 1994
Table B-4.Average Asset Size of Banks Resolved by the Federal Deposit Insurance Corporation,by Year and Type of Resolution, 1987-1992 (In millions of dollars)
Type of Resolution
Payoffs and TransfersDeposit payoffDeposit transfer
Transaction Average
Purchase andAssumption
Total bankInsured deposits onlyOther
Transaction Average
1987
30.353.048.1
30.0n.a.
32.332.0
1988
21.840.337.2
330.2n.a.
26.3230.1
1989
64.573.871.1
270.6n.a.
41.4155.4
1990
104.9137.9124.7
53.5n.a.
104.189.4
1991
16.889.275.4
37.7n.a.
769.9599.3
1992
105.064.082.0
1,060.1408.5366.8443.7
AverageAssetSize of
ResolvedBanks,
1987-1992
63.466.865.9
247.8408.5200.0227.7
Assistance Transactions
OverallTransaction Average
132.4
45.4
644.7
238.1
6.0
142.0
16.0
93.1
28.0
499.2
17.5
362.6
344.6
204.6
SOURCE: Congressional Budget Office analysis based on Federal Deposit Insurance Corporation, Failed Bank Cost Analysis, 1986-1992(1993).
NOTES: Averages are derived from assets recorded at time of resolution.
Figures represent averages for each category of resolution transaction by year. Averages are calculated as total bank assetsdivided by the number of banks resolved for each type of resolution.
n.a. = not applicable.
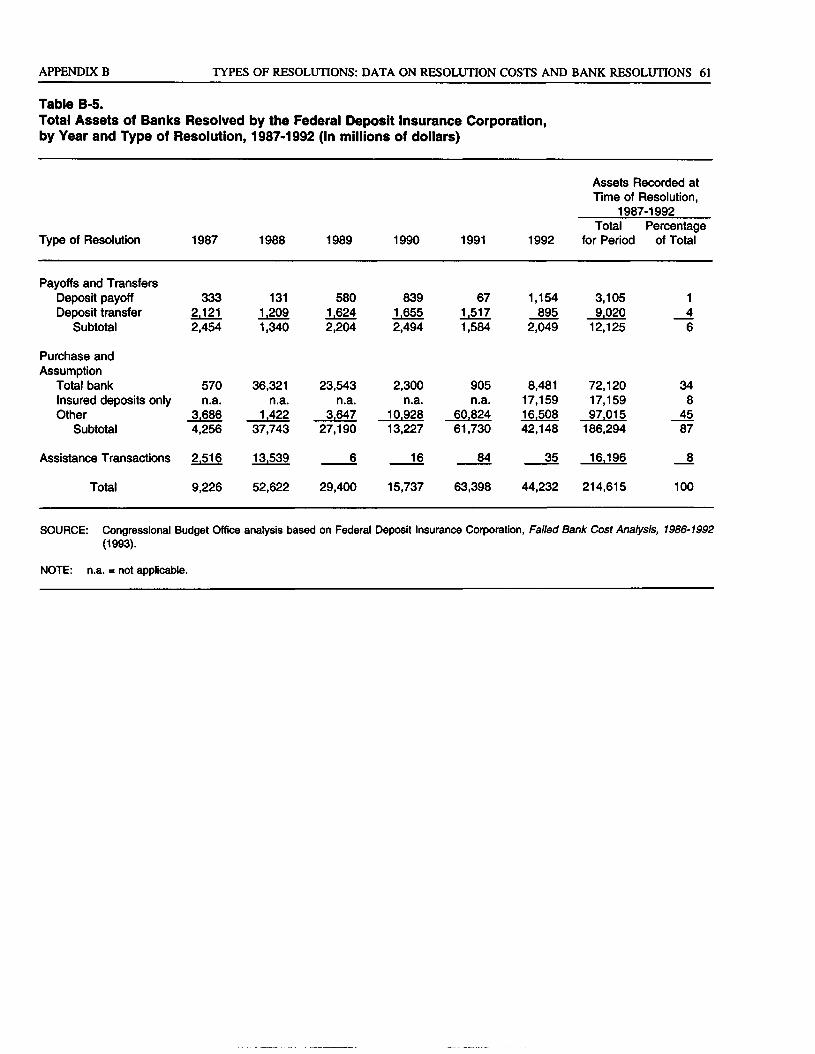
APPENDIX B TYPES OF RESOLUTIONS: DATA ON RESOLUTION COSTS AND BANK RESOLUTIONS 61
Table B-5.Total Assets of Banks Resolved by the Federal Deposit Insurance Corporation,by Year and Type of Resolution, 1987-1992 (In millions of dollars)
Assets Recorded atTime of Resolution,
1987-1992
Type of Resolution
Payoffs and TransfersDeposit payoffDeposit transfer
Subtotal
Purchase andAssumption
Total bankInsured deposits onlyOther
Subtotal
Assistance Transactions
Total
1987
3332.1212,454
570n.a.
3,6864,256
2.516
9,226
1988
1311.2091,340
36,321n.a.
1.42237,743
13.539
52,622
1989
5801.6242,204
23,543n.a.
3.64727,190
6
29,400
1990
8391.6552,494
2,300n.a.
10.92813,227
16
15,737
1991
671.5171,584
905n.a.
60.82461,730
84
63,398
1992
1,154895
2,049
8,48117,15916.50842,148
35
44,232
Totalfor Period
3,1059.020
12,125
72,12017,15997.015
186,294
16.196
214,615
Percentageof Total
146
348
4587
8
100
SOURCE: Congressional Budget Office analysis based on Federal Deposit Insurance Corporation, Failed Bank Cost Analysis, 1986-1992(1993).
NOTE: n.a. = not applicable.
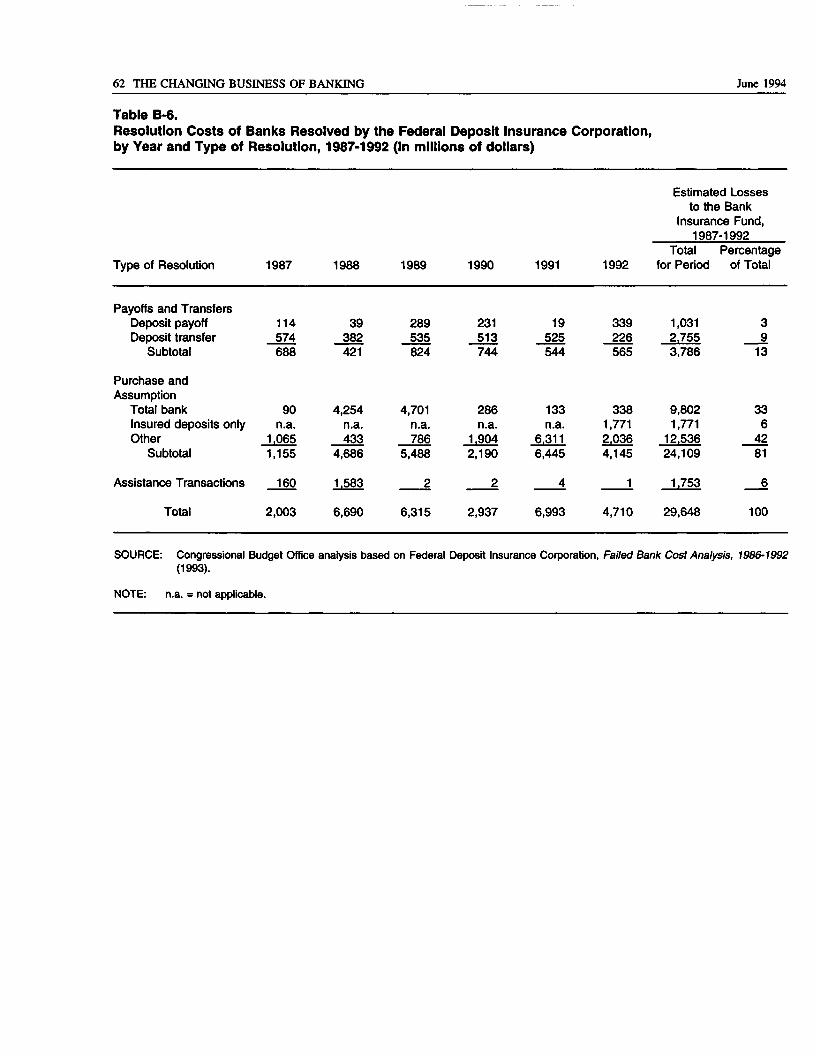
62 THE CHANGING BUSINESS OF BANKING June 1994
Table B-6.Resolution Costs of Banks Resolved by the Federal Deposit Insurance Corporation,by Year and Type of Resolution, 1987-1992 (In millions of dollars)
Type of Resolution 1987 1988 1989 1990 1991 1992
Estimated Lossesto the Bank
Insurance Fund,1987-1992
Total Percentagefor Period of Total
Payoffs and TransfersDeposit payoffDeposit transfer
Subtotal
Purchase andAssumption
Total bankInsured deposits onlyOther
Subtotal
Assistance Transactions
Total
114574688
90n.a.
1,0651,155
160
2,003
39382421
4,254n.a.433
4,686
1,583
6,690
289535824
4,701n.a.786
5,488
2
6,315
231513744
286n.a.
1,9042,190
2
2,937
19525544
133n.a.
6,3116,445
4
6,993
339226565
3381,7712,0364,145
1
4,710
1,0312,7553,786
9,8021,771
12,53624,109
1,753
29,648
39
13
336
4281
6
100
SOURCE: Congressional Budget Office analysis based on Federal Deposit Insurance Corporation, Failed Bank Cost Analysis, 1986-1992(1993).
NOTE: n.a. = not applicable.
Appendix C
A Simulation of Embedded Costs
T he process of determining when a bank hasfailed, thereby requiring resolution by regu-lators, has many uncertainties. In most
cases, before the Federal Deposit Insurance Corpo-ration Improvement Act of 1991 (FDICIA) regula-tors closed banks when they became book-valueinsolvent-that is, when the book value of equitydropped to zero. An insolvency test based on book-value accounting, however, can be misleading be-cause it may disguise an insolvent institution asbook-value solvent for some time before book val-ues reveal insolvency. At least two studies implythat the actual market value of assets revealedthrough the resolution process was only about 70cents per dollar of the recorded book value at thetime the resolution process began.1 Had the condi-tion of the banks been detected when the marketvalue of assets was equal to liabilities and promptlyresolved, perhaps some of the loss on assets (em-bedded losses) could have been avoided, thus reduc-ing the costs to the Bank Insurance Fund.
FDICIA authorizes a policy of prompt correc-tive action under which the kind of action requiredof regulators is guided by the way in which a bankis rated in terms of minimum prescribed capitallevels. Under FDICIA, the FDIC may take ac-
tion to resolve institutions when their equity-to-assetratios slip below 2 percent. If banks suffer embed-ded losses before the 2 percent threshold is reached,resolution-cost savings from early closure may beminimal. If banks suffer only embedded losses afterreaching the 2 percent threshold, savings may besubstantial. The possible savings under early clo-sure rules depend on (1) how well book-value mea-sures approximate market values, and (2) how longthe losses realized at resolution are actually embed-ded in the book value of assets before the resolutionof an undercapitalized bank.
As an illustrative exercise, this appendix uses asimulation model to examine the extent to whichearly closure might mitigate losses to the insurancefund. The model uses FDIC data on resolutioncosts, assets, and a few other financial variablesfrom a sample of 140 banks that operated between1986 and 1990 and were resolved sometime in1990.2 By making assumptions about when theselosses actually occurred-as early as the end of 1986or as late as 1990—it is possible to gauge marketvalues and possible resolution costs to provide arange of estimates for the potential savings asso-ciated with early closure.
See John F. Bovenzi and Arthur J. Murton, "Resolution Costs ofBank Failure," FDIC Banking Review, vol. 1, no. 1 (Fall 1988),pp. 1-13; and Richard A. Brown and Seth Epstein, "ResolutionCosts and Bank Failures: An Update of the FDIC Historical LossModel," FDIC Banking Review, vol. 5, no.l (Spring/Summer1992), pp. 1-16.
The banks making up this sample of 140 resolutions represent 83percent of the resolutions in 1990. The remaining 17 percent wereexcluded because of data limitations on some variables necessaryfor the simulation. Hence, the average values reported here aredifferent from those recorded in the tables in Appendix B.
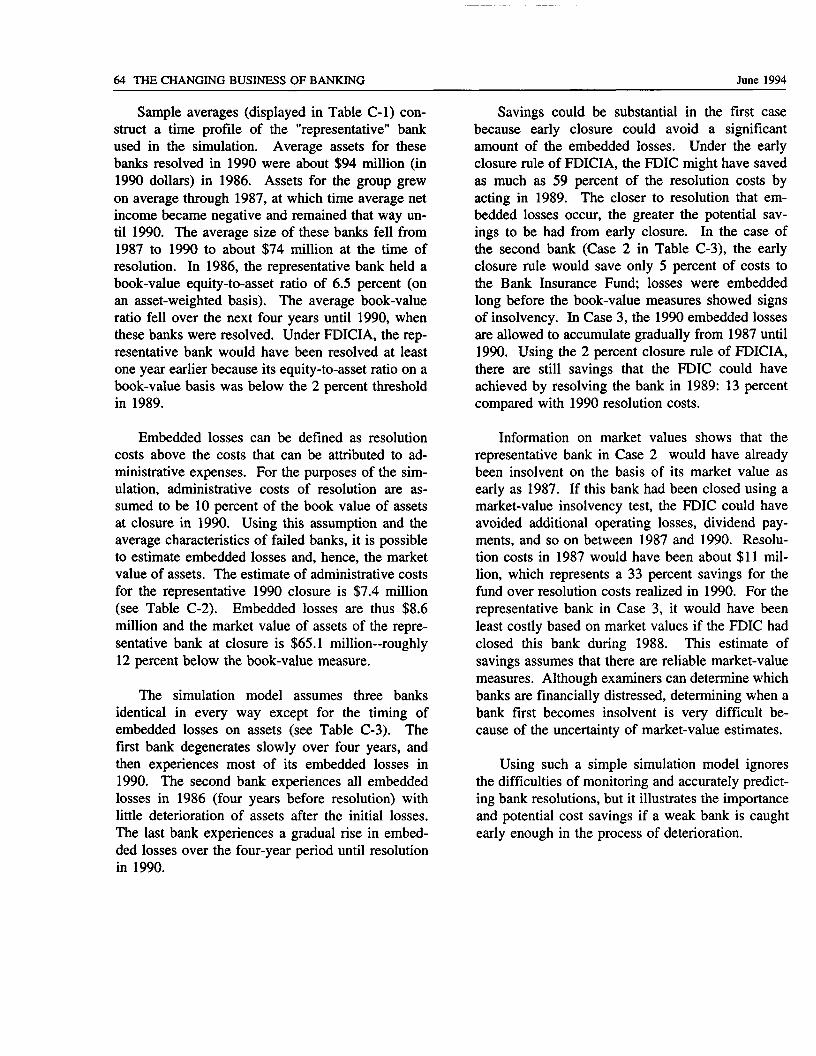
64 THE CHANGING BUSINESS OF BANKING June 1994
Sample averages (displayed in Table C-l) con-struct a time profile of the "representative" bankused in the simulation. Average assets for thesebanks resolved in 1990 were about $94 million (in1990 dollars) in 1986. Assets for the group grewon average through 1987, at which time average netincome became negative and remained that way un-til 1990. The average size of these banks fell from1987 to 1990 to about $74 million at the time ofresolution. In 1986, the representative bank held abook-value equity-to-asset ratio of 6.5 percent (onan asset-weighted basis). The average book-valueratio fell over the next four years until 1990, whenthese banks were resolved. Under FDICIA, the rep-resentative bank would have been resolved at leastone year earlier because its equity-to-asset ratio on abook-value basis was below the 2 percent thresholdin 1989.
Embedded losses can be defined as resolutioncosts above the costs that can be attributed to ad-ministrative expenses. For the purposes of the sim-ulation, administrative costs of resolution are as-sumed to be 10 percent of the book value of assetsat closure in 1990. Using this assumption and theaverage characteristics of failed banks, it is possibleto estimate embedded losses and, hence, the marketvalue of assets. The estimate of administrative costsfor the representative 1990 closure is $7.4 million(see Table C-2). Embedded losses are thus $8.6million and the market value of assets of the repre-sentative bank at closure is $65.1 million-roughly12 percent below the book-value measure.
The simulation model assumes three banksidentical in every way except for the timing ofembedded losses on assets (see Table C-3). Thefirst bank degenerates slowly over four years, andthen experiences most of its embedded losses in1990. The second bank experiences all embeddedlosses in 1986 (four years before resolution) withlittle deterioration of assets after the initial losses.The last bank experiences a gradual rise in embed-ded losses over the four-year period until resolutionin 1990.
Savings could be substantial in the first casebecause early closure could avoid a significantamount of the embedded losses. Under the earlyclosure rule of FDICIA, the FDIC might have savedas much as 59 percent of the resolution costs byacting in 1989. The closer to resolution that em-bedded losses occur, the greater the potential sav-ings to be had from early closure. In the case ofthe second bank (Case 2 in Table C-3), the earlyclosure rule would save only 5 percent of costs tothe Bank Insurance Fund; losses were embeddedlong before the book-value measures showed signsof insolvency. In Case 3, the 1990 embedded lossesare allowed to accumulate gradually from 1987 until1990. Using the 2 percent closure rule of FDICIA,there are still savings that the FDIC could haveachieved by resolving the bank in 1989: 13 percentcompared with 1990 resolution costs.
Information on market values shows that therepresentative bank in Case 2 would have alreadybeen insolvent on the basis of its market value asearly as 1987. If this bank had been closed using amarket-value insolvency test, the FDIC could haveavoided additional operating losses, dividend pay-ments, and so on between 1987 and 1990. Resolu-tion costs in 1987 would have been about $11 mil-lion, which represents a 33 percent savings for thefund over resolution costs realized in 1990. For therepresentative bank in Case 3, it would have beenleast costly based on market values if the FDIC hadclosed this bank during 1988. This estimate ofsavings assumes that there are reliable market-valuemeasures. Although examiners can determine whichbanks are financially distressed, determining when abank first becomes insolvent is very difficult be-cause of the uncertainty of market-value estimates.
Using such a simple simulation model ignoresthe difficulties of monitoring and accurately predict-ing bank resolutions, but it illustrates the importanceand potential cost savings if a weak bank is caughtearly enough in the process of deterioration.
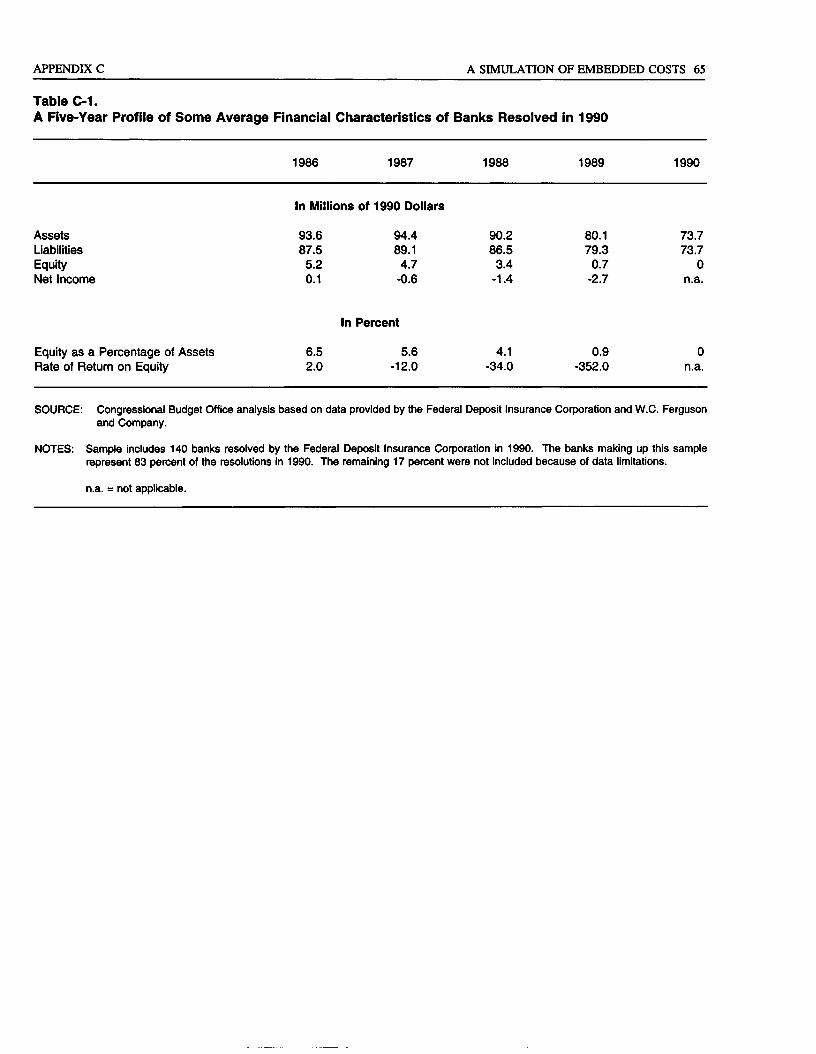
APPENDIX C A SIMULATION OF EMBEDDED COSTS 65
Table C-1.A Five-Year Profile of Some Average Financial Characteristics of Banks Resolved in 1990
1986 1987 1988 1989 1990
In Millions of 1990 Dollars
AssetsLiabilitiesEquityNet Income
Equity as a Percentage of AssetsRate of Return on Equity
93.687.55.20.1
6.52.0
94.489.14.7
-0.6
In Percent
5.6-12.0
90.286.53.4
-1.4
4.1-34.0
80.179.30.7
-2.7
0.9-352.0
73.773.7
0n.a.
0n.a.
SOURCE: Congressional Budget Office analysis based on data provided by the Federal Deposit Insurance Corporation and W.C. Fergusonand Company.
NOTES: Sample includes 140 banks resolved by the Federal Deposit Insurance Corporation in 1990. The banks making up this samplerepresent 83 percent of the resolutions in 1990. The remaining 17 percent were not included because of data limitations.
n.a. = not applicable.
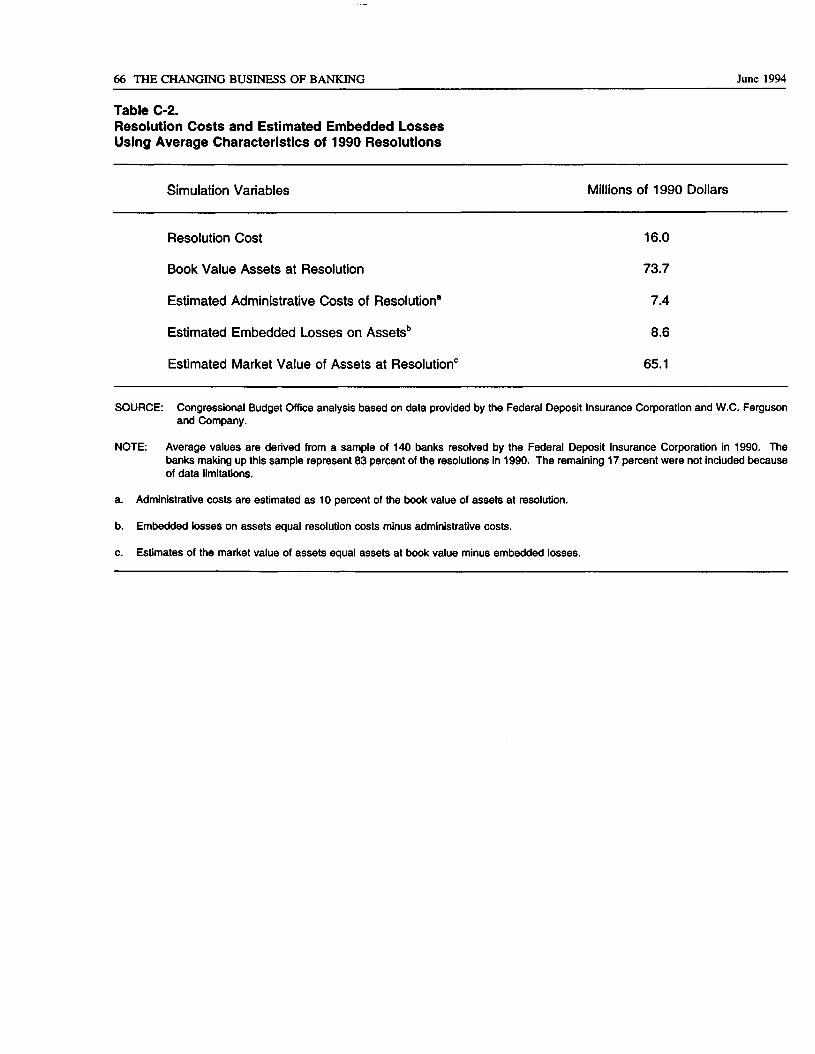
66 THE CHANGING BUSINESS OF BANKING June 1994
Table C-2.Resolution Costs and Estimated Embedded LossesUsing Average Characteristics of 1990 Resolutions
Simulation Variables Millions of 1990 Dollars
Resolution Cost
Book Value Assets at Resolution
Estimated Administrative Costs of Resolution8
Estimated Embedded Losses on Assetsb
Estimated Market Value of Assets at Resolution0
16.0
73.7
7.4
8.6
65.1
SOURCE: Congressional Budget Office analysis based on data provided by the Federal Deposit Insurance Corporation and W.C. Fergusonand Company.
NOTE: Average values are derived from a sample of 140 banks resolved by the Federal Deposit Insurance Corporation in 1990. Thebanks making up this sample represent 83 percent of the resolutions in 1990. The remaining 17 percent were not included becauseof data limitations.
a. Administrative costs are estimated as 10 percent of the book value of assets at resolution.
b. Embedded losses on assets equal resolution costs minus administrative costs.
c. Estimates of the market value of assets equal assets at book value minus embedded losses.
APPENDIX C A SIMULATION OF EMBEDDED COSTS 67
Table C-3.Three Simulated Cases Involving Embedded Losses on AssetsUsing Average Characteristics of 1990 Resolutions (In millions of 1990 dollars)
1986 1987 1988 1989 1990
Case 1. Asset Losses Embedded in 1990
Estimated Market Value of Assets8
Estimated Market Value of Equity5
Estimated Resolution Costs0
Estimated Savings (Percent)
93.66.1n.a.n.a.
94.45.3n.a.n.a.
90.23.7n.a.n.a.
Case 2. Asset Losses Completely Embedded Starting in 1987
Estimated Market Value of Assets*Estimated Market Value of Equity*Estimated Resolution Costs0
Estimated Savings (Percent)
93.66.1n.a.n.a.
85.8-3.310.733.0e
81.6•4.912.323.0e
Case 3. Rising Embedded Asset Losses from 1987 to 1990
Estimated Embedded Loss on AssetsEstimated Market Value of Assets3
Estimated Market Value of Equity5
Estimated Resolution Costs0
Estimated Savings (Percent)
Memorandum:Value of Liabilities Used for All Cases
093.66.1n.a.n.a.
87.5
2.591.92.8n.a.n.a.
89.1
5.085.2-1.38.7
46.0e
86.5
80.10.86.6
59.0d
71.5-7.815.2
5.0d
7.472.7-6.614.013.0d
79.3
65.1-8.616.0
0
65.1-8.616.0
0
8.665.1-8.616.0
0
73.7
SOURCE: Congressional Budget Office analysis based on data provided by the Federal Deposit Insurance Corporation and W.C. Fergusonand Company.
NOTES: Administrative costs remain fixed at $7.4 million. The estimate of full embedded losses on assets is equal to $8.6 million; embed-ded losses remain constant at this amount except as stated in Case 3. This analysis assumes all liabilities are covered by depositinsurance.
Estimates are derived from average values of a sample of 140 banks resolved by the Federal Deposit Insurance Corporation in1990. The banks making up this sample represent 83 percent of the resolutions in 1990. The remaining 17 percent were notincluded because of data limitations.
n.a. = not applicable.
a. Estimates of the market value of assets equal book value of assets minus embedded losses in each period.
b. Estimates of the market value of equity equal market value of assets minus liabilities.
c. Estimated resolution costs equal liabilities minus market value of assets plus administrative costs.
d. Savings in resolution cost if bank was closed using 2 percent capital threshold of the Federal Deposit Insurance Corporation Improve-ment Act of 1991.
e. Savings in resolution cost if bank was closed on the basis of market-value insolvency.


CONGRESSIONALBUDGET OFFICESecond and D Streets, S.W.
Washington, D.C. 20515
OFFICIAL BUSINESSPENALTY FOR PRIVATE USE, $300
THIRD-CLASS MAILPOSTAGE & FEES PAID
C.B.O.WASHINGTON, D.C.
PERMIT No. G-70