Embed Size (px)
DESCRIPTION
In Partial Fulfilment of the Requirements for the Course MATH600A ( STATISTICS )
Citation preview
STUDY HABITS OF ADVERTISING ARTS STUDENTS OF THE COLLEGE
OF FINE ARTS OF DESIGN.
Submitted to the
Faculty of Advertising Arts
University of Santo Tomas
In Partial Fulfilment
of the Requirements for the Course
MATH600A ( STATISTICS )
Karmina de Jesus
Joshua Lagman
Jill Liao
2AD4
March 2013
Introduction
College is a training ground for most Advertising Arts' students, as they are obliged to
meet certain deadlines for each of their course. These dates are essential at the outside network
of jobs that they will face in the future. Time affects the quality of work; this is where deadlines
play its role best. An indicator of how a student manages his time and skill. To measure how well
you are doing is summed up to grades. Grades indicate how well you cope up and learn but there
are many factors that can affect these values.
The study is about the study habits of Advertising Arts students of the College of Fine
Arts and Design. The researchers would like to examine the preference of students in dealing
with their course curriculum requirements. The study will focus mainly on class schedule
selections, manner of following requirement instructions and preferred place to work.
The study that we will be doing will help us to distinguish and dissect the things that a
typical CFAD student prefers to do, in what ways they prefer it to do it, and if they are able to
grasp the lectures of their professors even if they have plates to do, and how many times do they
procrastinate before they do their homework, assignments, projects and plates and if they prefer
to do the hard ones before the easy tasks first. We will also tackle how they handle their
deadlines by keeping track of their timetable and how do they efficiently keep track of their
timetable, what is their technique to be productive despite of the limited time and deadlines that
are already set. How do they still manage to socialize and interact with their family and friends,
and what does the typical CFAD student do on their free time or weekends and what is their
usual routine and do they religiously follow their routine.
Study Habits
Each student’s study habit differs from another. Some may take too many breaks and
some may choose to do their tasks a night before the submission date. Regardless of their options
it is necessary to follow a certain kind of routine to finish the work.
Another aspect that plays a vital role in each student’s academic performance is
Motivation. Motivation according to Psychology Today is the desire to do things. It is necessary
in getting and attaining a student’s goal.
In order to stay productive and to finish the work in time, one must take into
consideration time management. Balancing time is the key to any task and neglecting this aspect
may cause trouble because deadlines are always part of the task. Lack of time management leads
to cramming. Cramming is considered to be an ineffective mode of study lifestyle but opposing
to this fact is that cramming or procrastination has yield students to get the job done in minimal
or less time for some students. Outputs are as good as or a little bit better than those worked on
time. According to Somner, students are adept in working in this kind of situation however, it
comes with different facets such as calculated procrastination, preparatory anxiety, climactic
cramming nick-of-time deadline-making, and a secret, if often uncelebrated, victory. He also said that
these aspects are not widely adapted by other students who find it difficult and stressful.
Effective Study Habits
According to Jacoby there is an effective way or if not effective, are useful attempts to improve a
student’s lifestyle in his years in college. First is time. Time is a discipline method to prioritize academic
tasks than mere leisure activities. Complement that with goals that one needs to achieve. Mass, it speaks
about your workload for a semester. A student must never overload his schedule if his time does not
permit. Energy on the other hand is to take in with all might any task given. Concentrate and never let
your focus go astray. Second to the last is Space, no matter how many deadlines must be finished, breaks
are essential to get you off the hook and rest your mind for a small amount of time. Last is Speed. Take a
little bit effort to work fast without lessening the output.
Academic Calendar
Universities adapting a two semester program may benefit from accepting more students
but a serious concern can be seen among students performance. The schedule of preliminary and
final exams are subjected to long gaps of learning and sometimes short due to unexpected natural
disasters. Included to this academic calendar are student’s personal schedules which must adapt
to the semester’s schedule. According to Di Pietro’s research, new academic calendars like ones
who adapt semestral programmes makes students work on several tasks that pile up at the end.
What’s it like to study Fine Arts?
Most people think that art students rely on their talents to succeed in college but truth be
told it’s not just about the talent, it is a mixture of a lot of things. According to Creon, there is a
level of uncertainty with an art degree - it’s not like a mathematical equation where there is a
right or a wrong answer. You could pour your heart and soul in to a piece of work for viewers to
just not get it. This could be heartbreaking, but it definitely helps you build a thick skin.
Studying an art degree revolves around a heavy workload and this may be a hard thing
for most students. Each student is considered professional from his first day. This could be
overwhelming and at the same time a risk. They are expected to work independently and be
smart in handling their output.
Everything sums up with the student’s degree or thesis. This is the time for you to show
yourself as a professional ready to take the industry you are studying and getting ready for all
your years in college.

CHAPTER 3
ESEARCH METHODOLOGY
The chapter presents the research methodology used in this study, research design, the
subjects and the sources of data, researcher instrument construction and validation of instruments
and the statistical treatment of data.
RESEARCH DESIGN
This study employed the descriptive method in gathering information regarding the
students’ of the College of Fine Arts and Design Major in Advertising Arts study habits for the
school year 2012 – 2013.
SUBJECTS AND SOURCES OF DATA
The subjects of this study were drawn from sixty (60) Advertising Arts students from the
College of Fine Arts and Design of the University of Santo Tomas. Thirty-six percent (36%) of
the total population were taken and used as student-respondents of the study.
Data were gathered through survey questionnaire. The researchers chose the respondents through
random sampling so that each member of the population has an equal chance of being selected.
REASEARCH INSTRUMENT
The research instrument used in conducting this study was the questionnaire survey type
with the instruction that can be easily understood by the respondent, this questionnaire was
constructed for the purpose of knowing the student’s study habits for the whole school year.
CONSTRUCTION AND VALIDATION OF INSTRUMENT
The questionnaire has been formulated after a thorough reading of related literature and
studies about factors that may affect student’s study habits and preferences in accomplishing
their tasks, homeworks and plates on time.
The first draft of questionnaire was forwarded to the research adviser for corrections and
suggestions. After the research adviser validated and enriched the questionnaires, the researchers
prepared the final draft.
DISTRIBUTION AND RETRIEVAL OF DATA
The distribution of the survey questionnaires were handed out randomly to first to fourth
year students on February 2013. The researcher clarified the directions to be followed, the
researcher made sure that respondents answered all of the items on the questionnaire. The survey
questionnaires were collected right after the respondents finished answering the questionnaire.
TREATMENT OF DATA
The data were treated using this formula:
F= f/N x 100
P= Percentage
F= Frequency
N= Total number of respondents
.
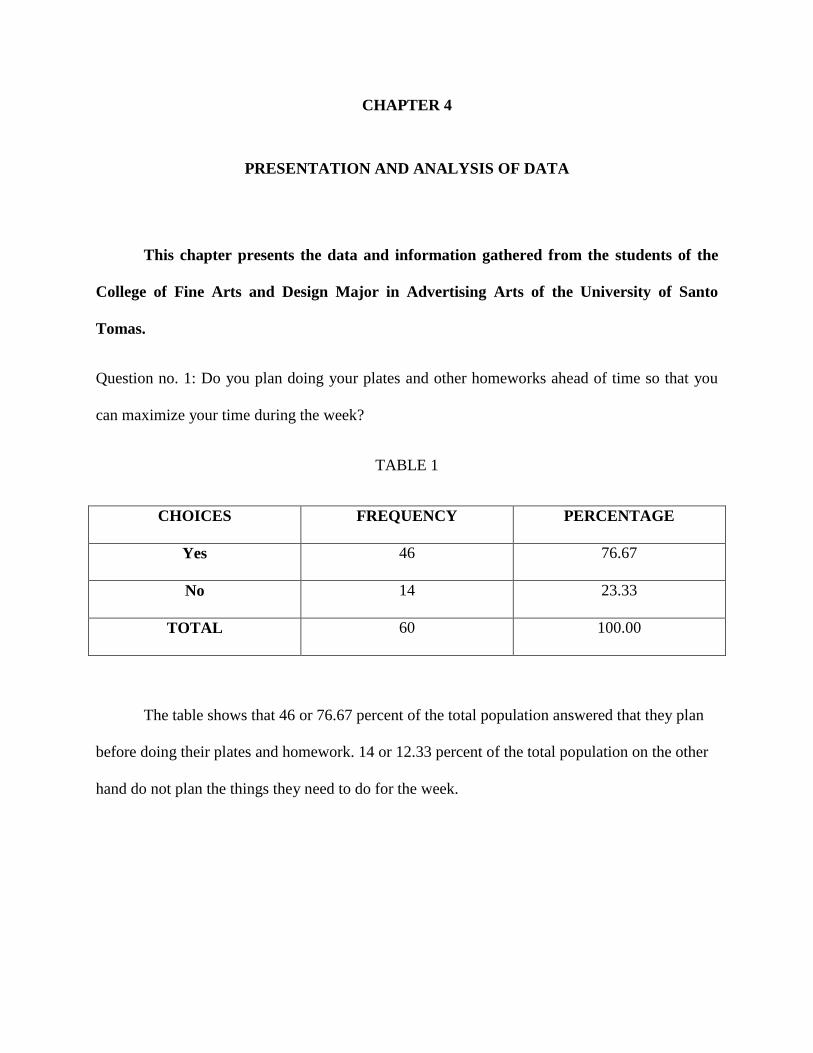
CHAPTER 4
PRESENTATION AND ANALYSIS OF DATA
This chapter presents the data and information gathered from the students of the
College of Fine Arts and Design Major in Advertising Arts of the University of Santo
Tomas.
Question no. 1: Do you plan doing your plates and other homeworks ahead of time so that you
can maximize your time during the week?
TABLE 1
CHOICES FREQUENCY PERCENTAGE
Yes 46 76.67
No 14 23.33
TOTAL 60 100.00
The table shows that 46 or 76.67 percent of the total population answered that they plan
before doing their plates and homework. 14 or 12.33 percent of the total population on the other
hand do not plan the things they need to do for the week.
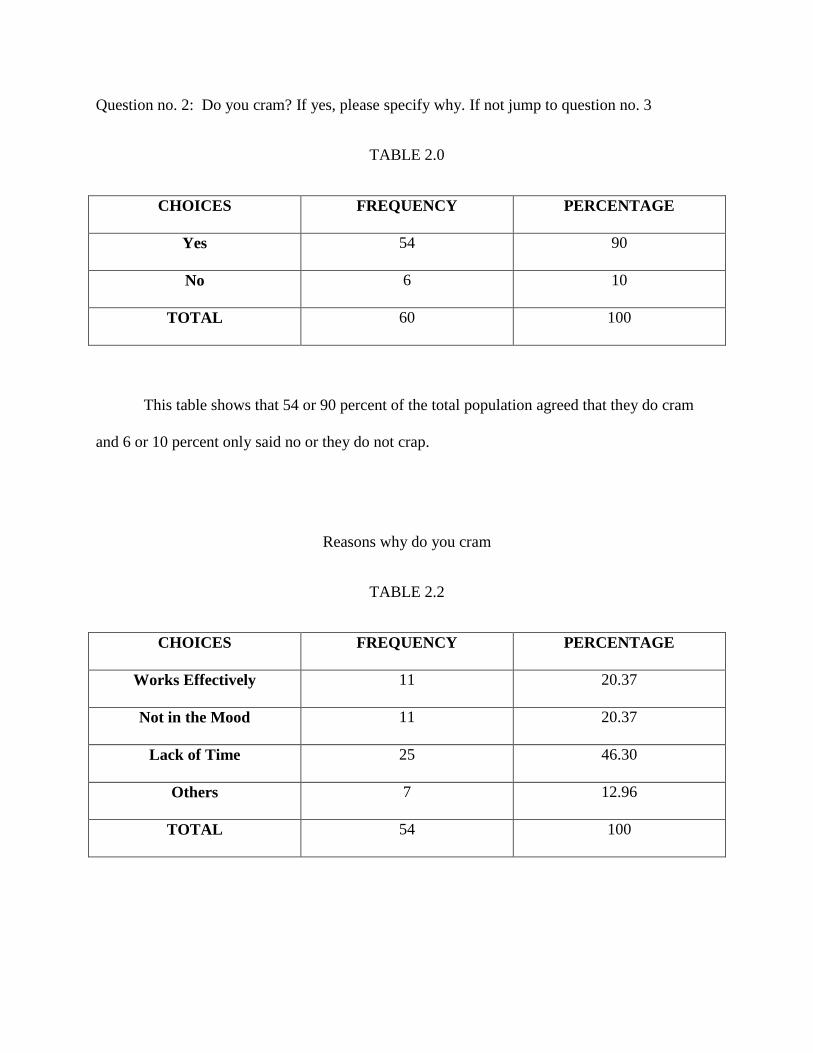
Question no. 2: Do you cram? If yes, please specify why. If not jump to question no. 3
TABLE 2.0
CHOICES FREQUENCY PERCENTAGE
Yes 54 90
No 6 10
TOTAL 60 100
This table shows that 54 or 90 percent of the total population agreed that they do cram
and 6 or 10 percent only said no or they do not crap.
Reasons why do you cram
TABLE 2.2
CHOICES FREQUENCY PERCENTAGE
Works Effectively 11 20.37
Not in the Mood 11 20.37
Lack of Time 25 46.30
Others 7 12.96
TOTAL 54 100
This table is a follow up question which states the reason why students cram their work.
11 or 20.37 among those who answered yes on the previous question works effectively, the other
11 or 20.37 answered that they were not in the mood, 25 or 46.30 said they lack time. While the
remaining 7 or 12.96 percent chose others with specified answers.
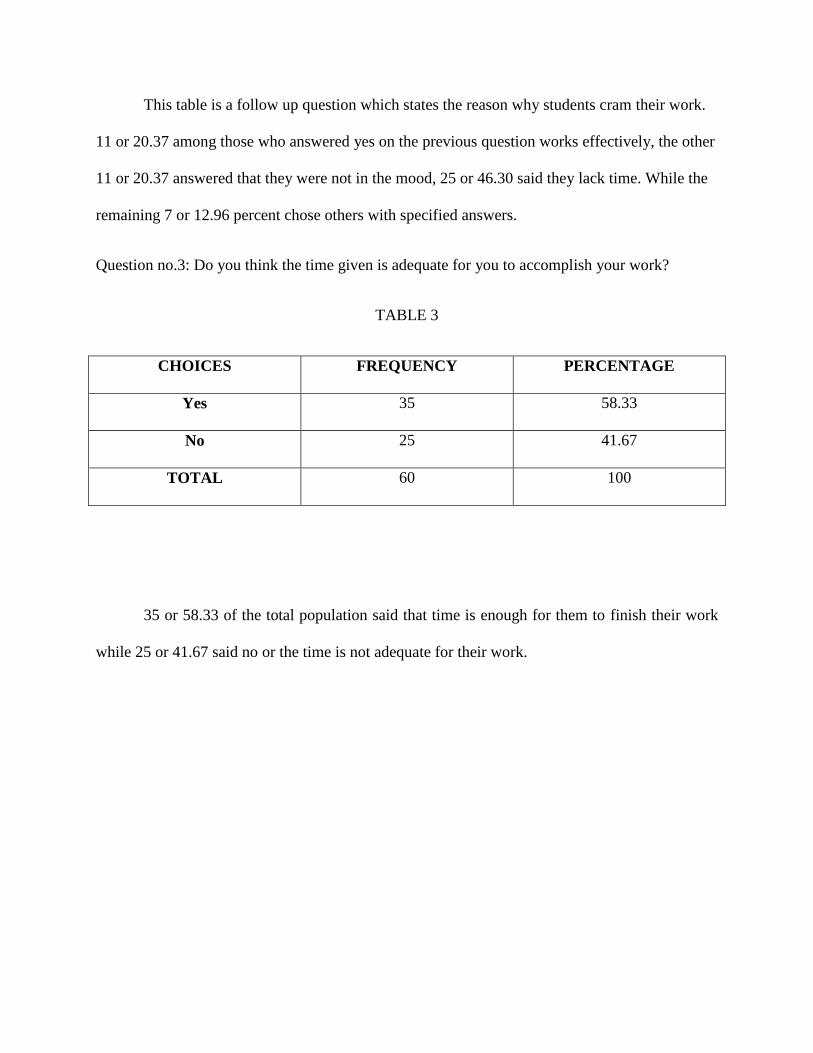
Question no.3: Do you think the time given is adequate for you to accomplish your work?
TABLE 3
CHOICES FREQUENCY PERCENTAGE
Yes 35 58.33
No 25 41.67
TOTAL 60 100
35 or 58.33 of the total population said that time is enough for them to finish their work
while 25 or 41.67 said no or the time is not adequate for their work.
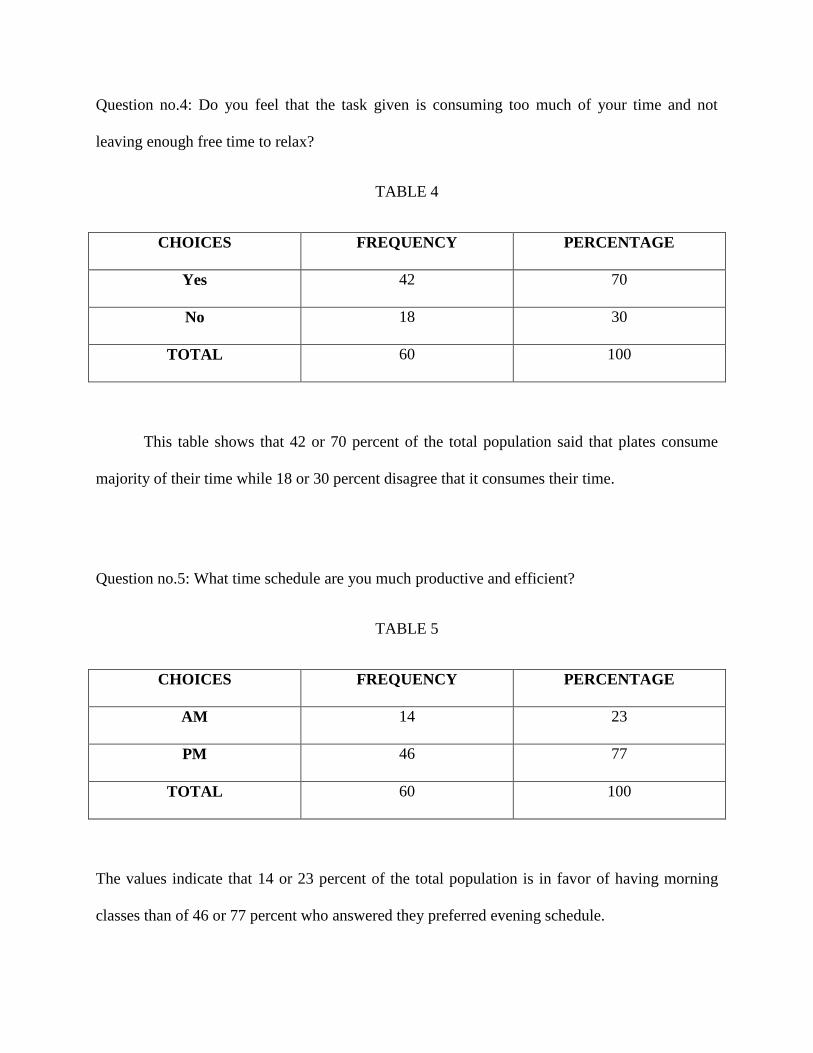
Question no.4: Do you feel that the task given is consuming too much of your time and not
leaving enough free time to relax?
TABLE 4
CHOICES FREQUENCY PERCENTAGE
Yes 42 70
No 18 30
TOTAL 60 100
This table shows that 42 or 70 percent of the total population said that plates consume
majority of their time while 18 or 30 percent disagree that it consumes their time.
Question no.5: What time schedule are you much productive and efficient?
TABLE 5
CHOICES FREQUENCY PERCENTAGE
AM 14 23
PM 46 77
TOTAL 60 100
The values indicate that 14 or 23 percent of the total population is in favor of having morning
classes than of 46 or 77 percent who answered they preferred evening schedule.
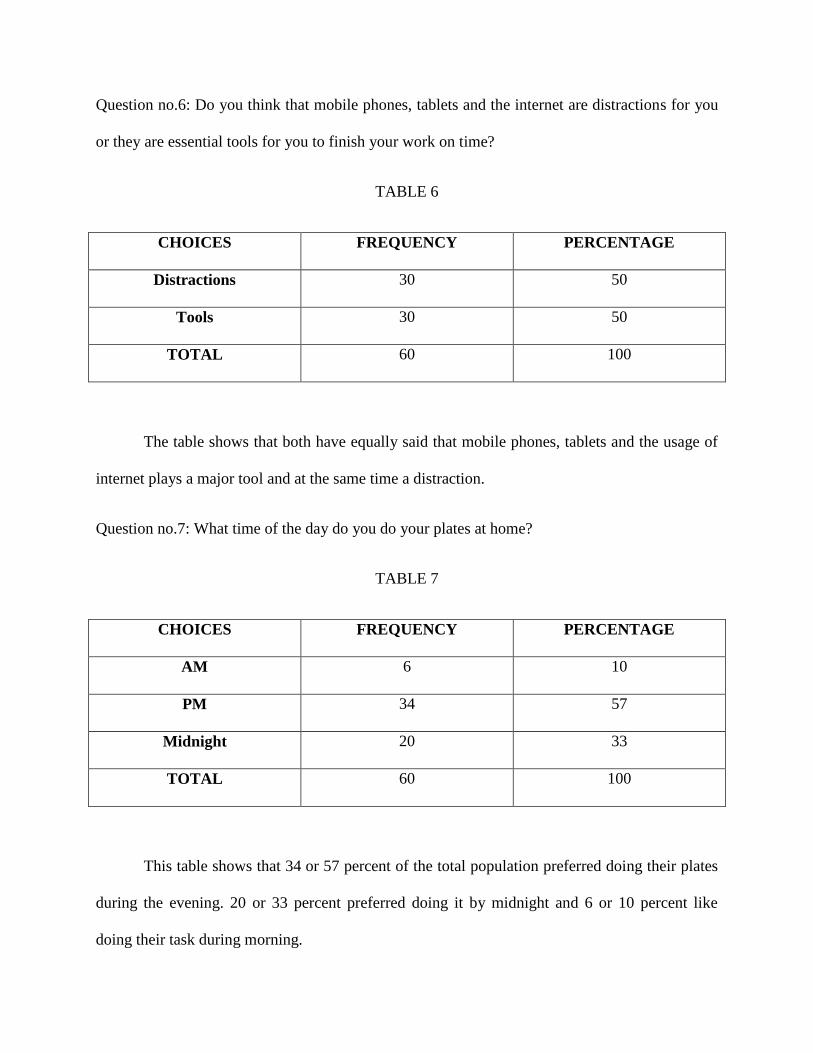
Question no.6: Do you think that mobile phones, tablets and the internet are distractions for you
or they are essential tools for you to finish your work on time?
TABLE 6
CHOICES FREQUENCY PERCENTAGE
Distractions 30 50
Tools 30 50
TOTAL 60 100
The table shows that both have equally said that mobile phones, tablets and the usage of
internet plays a major tool and at the same time a distraction.
Question no.7: What time of the day do you do your plates at home?
TABLE 7
CHOICES FREQUENCY PERCENTAGE
AM 6 10
PM 34 57
Midnight 20 33
TOTAL 60 100
This table shows that 34 or 57 percent of the total population preferred doing their plates
during the evening. 20 or 33 percent preferred doing it by midnight and 6 or 10 percent like
doing their task during morning.
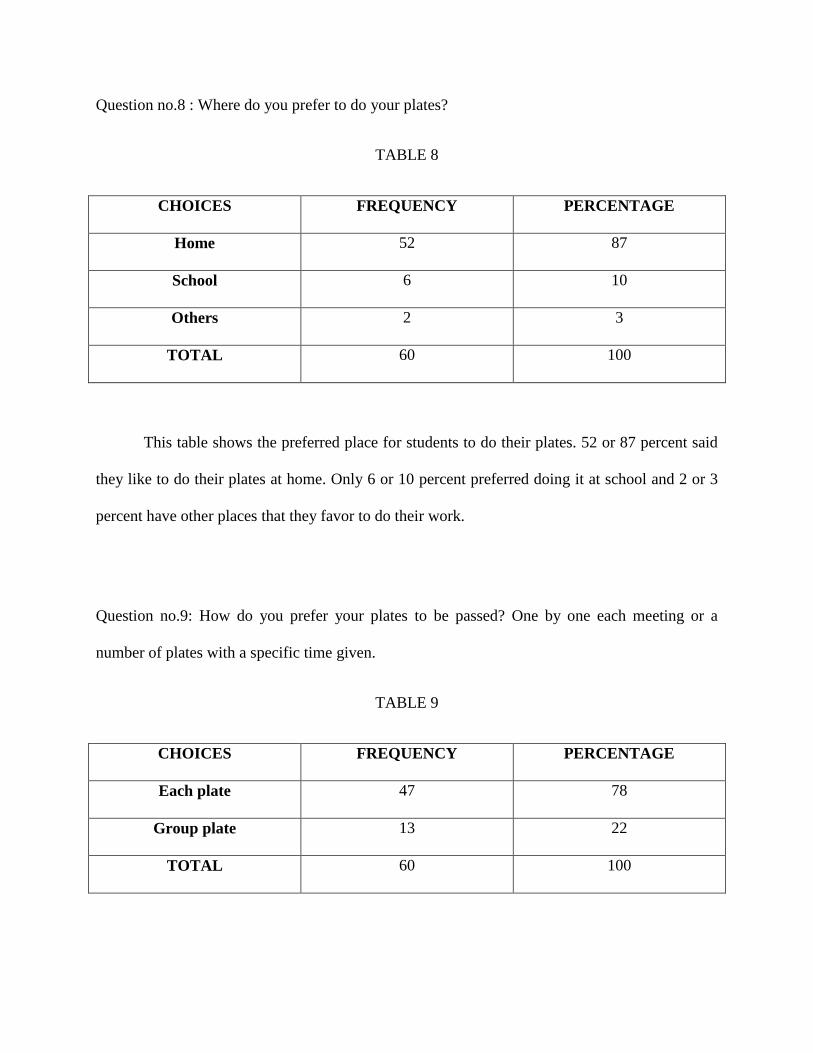
Question no.8 : Where do you prefer to do your plates?
TABLE 8
CHOICES FREQUENCY PERCENTAGE
Home 52 87
School 6 10
Others 2 3
TOTAL 60 100
This table shows the preferred place for students to do their plates. 52 or 87 percent said
they like to do their plates at home. Only 6 or 10 percent preferred doing it at school and 2 or 3
percent have other places that they favor to do their work.
Question no.9: How do you prefer your plates to be passed? One by one each meeting or a
number of plates with a specific time given.
TABLE 9
CHOICES FREQUENCY PERCENTAGE
Each plate 47 78
Group plate 13 22
TOTAL 60 100
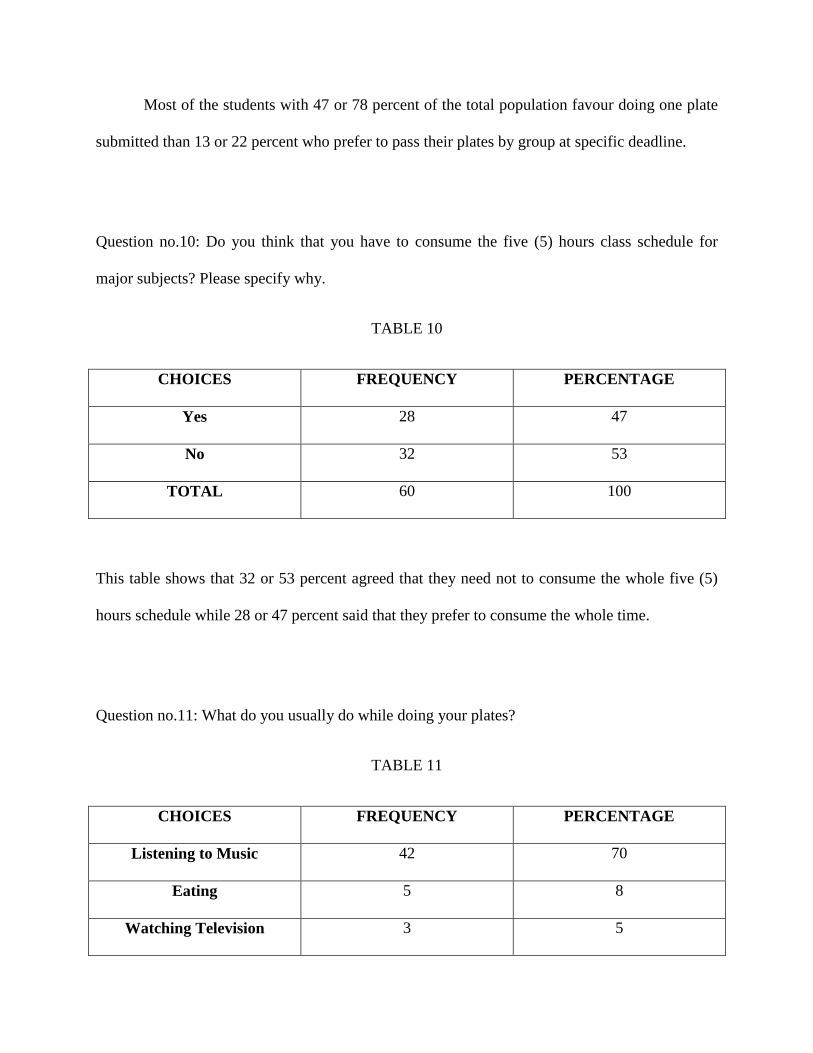
Most of the students with 47 or 78 percent of the total population favour doing one plate
submitted than 13 or 22 percent who prefer to pass their plates by group at specific deadline.
Question no.10: Do you think that you have to consume the five (5) hours class schedule for
major subjects? Please specify why.
TABLE 10
CHOICES FREQUENCY PERCENTAGE
Yes 28 47
No 32 53
TOTAL 60 100
This table shows that 32 or 53 percent agreed that they need not to consume the whole five (5)
hours schedule while 28 or 47 percent said that they prefer to consume the whole time.
Question no.11: What do you usually do while doing your plates?
TABLE 11
CHOICES FREQUENCY PERCENTAGE
Listening to Music 42 70
Eating 5 8
Watching Television 3 5
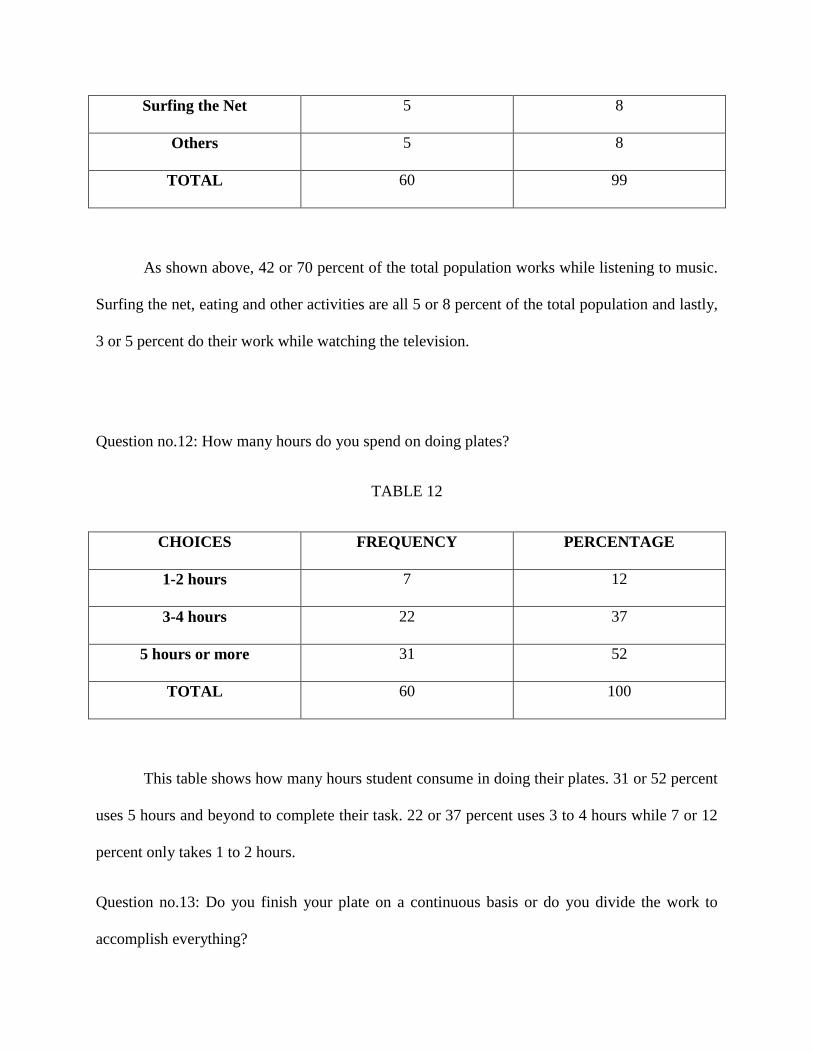
Surfing the Net 5 8
Others 5 8
TOTAL 60 99
As shown above, 42 or 70 percent of the total population works while listening to music.
Surfing the net, eating and other activities are all 5 or 8 percent of the total population and lastly,
3 or 5 percent do their work while watching the television.
Question no.12: How many hours do you spend on doing plates?
TABLE 12
CHOICES FREQUENCY PERCENTAGE
1-2 hours 7 12
3-4 hours 22 37
5 hours or more 31 52
TOTAL 60 100
This table shows how many hours student consume in doing their plates. 31 or 52 percent
uses 5 hours and beyond to complete their task. 22 or 37 percent uses 3 to 4 hours while 7 or 12
percent only takes 1 to 2 hours.
Question no.13: Do you finish your plate on a continuous basis or do you divide the work to
accomplish everything?
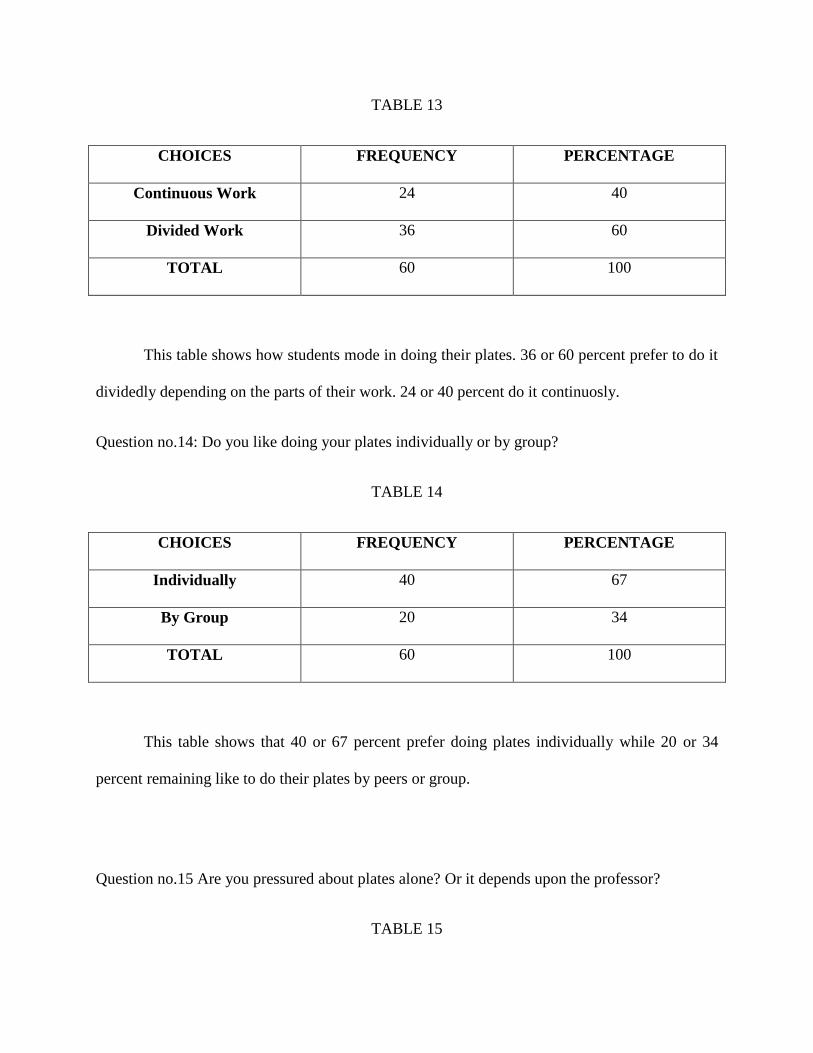
TABLE 13
CHOICES FREQUENCY PERCENTAGE
Continuous Work 24 40
Divided Work 36 60
TOTAL 60 100
This table shows how students mode in doing their plates. 36 or 60 percent prefer to do it
dividedly depending on the parts of their work. 24 or 40 percent do it continuosly.
Question no.14: Do you like doing your plates individually or by group?
TABLE 14
CHOICES FREQUENCY PERCENTAGE
Individually 40 67
By Group 20 34
TOTAL 60 100
This table shows that 40 or 67 percent prefer doing plates individually while 20 or 34
percent remaining like to do their plates by peers or group.
Question no.15 Are you pressured about plates alone? Or it depends upon the professor?
TABLE 15
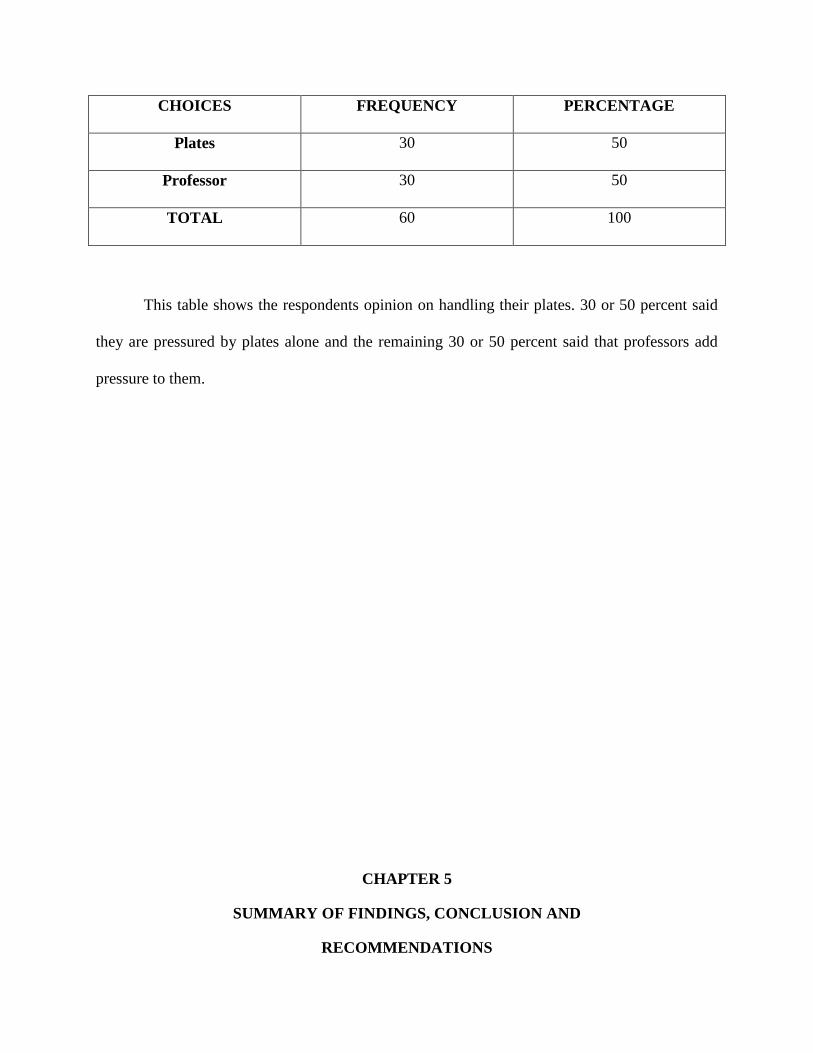
CHOICES FREQUENCY PERCENTAGE
Plates 30 50
Professor 30 50
TOTAL 60 100
This table shows the respondents opinion on handling their plates. 30 or 50 percent said
they are pressured by plates alone and the remaining 30 or 50 percent said that professors add
pressure to them.
CHAPTER 5
SUMMARY OF FINDINGS, CONCLUSION AND
RECOMMENDATIONS

SUMMARY
The following are the findings based on the data of the research.
1. Time Management
Majority or the 46 or 76.67 percent of the total population answered that they plan ahead of
time the things they need to accomplish for the whole week. The remaining 14 or 12.33 percent
do not plan the things they need to do for the week, some manages to accomplish their and
sometimes they don’t get the job done
2. . Cramming
Most of the students included in the survey answered that they usually cram having 4 or
90 percent of the total population with varied reasons explained in the next findings.
Surprisingly, 6 or 10 percent manages not to cram in order to finish their task.
2.1 Reasons for Cramming
Among the many reasons which the respondents chose, Lack of time is the preferred
reason having 25 or 46.30 percent, followed by personal reasons of not being in the mood to do
with 11 or 20.37 percent same as the reason for working effectively under time pressure. Others
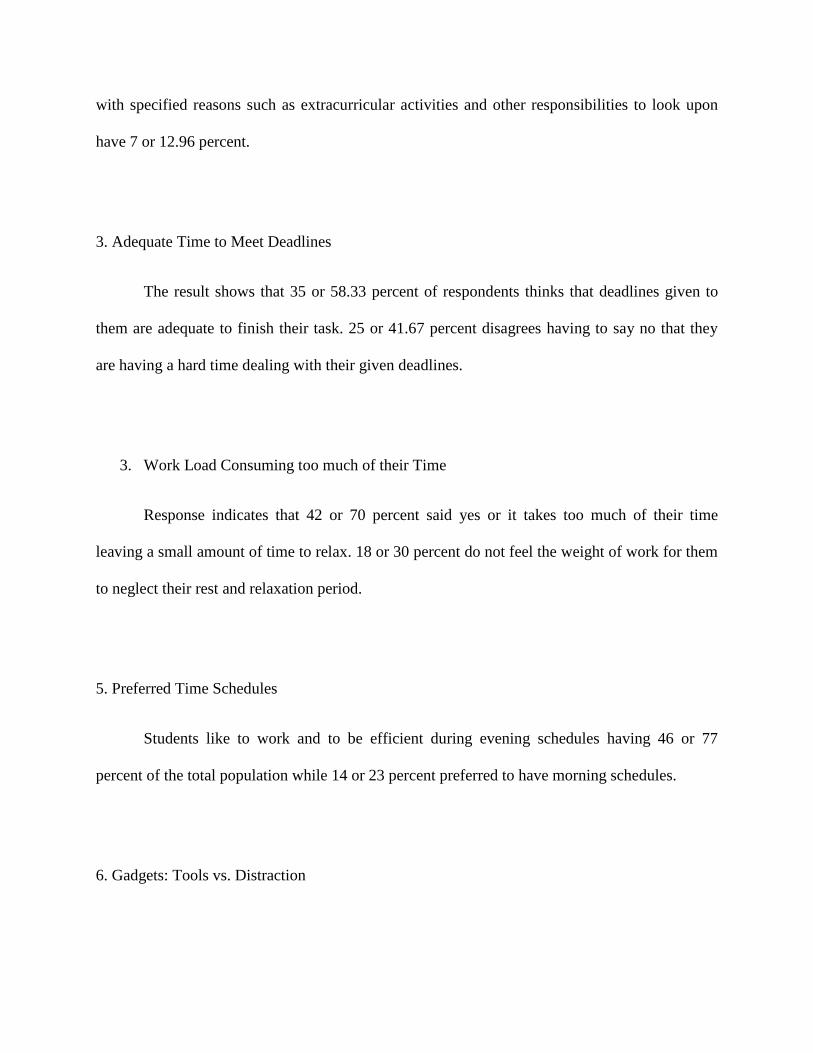
with specified reasons such as extracurricular activities and other responsibilities to look upon
have 7 or 12.96 percent.
3. Adequate Time to Meet Deadlines
The result shows that 35 or 58.33 percent of respondents thinks that deadlines given to
them are adequate to finish their task. 25 or 41.67 percent disagrees having to say no that they
are having a hard time dealing with their given deadlines.
3. Work Load Consuming too much of their Time
Response indicates that 42 or 70 percent said yes or it takes too much of their time
leaving a small amount of time to relax. 18 or 30 percent do not feel the weight of work for them
to neglect their rest and relaxation period.
5. Preferred Time Schedules
Students like to work and to be efficient during evening schedules having 46 or 77
percent of the total population while 14 or 23 percent preferred to have morning schedules.
6. Gadgets: Tools vs. Distraction

Respondents equally answered that gadgets such as mobile phones, tablets and the use of
internet could both be a problem and an advantage.
7. Efficient Work Schedule
Students’ response indicates that 34 or 57 percent work effectively during evening. 20 or
33 percent works during midnight and 6 or 10 percent works during the morning.
8. Preferred Place to Work
Majority or having 52 or 87 percent of the respondents would likely do things at home
than school with 6 or 10 percent of the total population. The remaining 2 or 3 percent preferred
to do it in some other place such as a friend’s house.
9. Preferred Type of Submission
Mostly, or 47 or 78 percent likes to submit a one plate right after the discussion week
than those who prefer to pass by bulk their work with a condition of giving the student enough
time to do the plate with 13 or 22 percent.
10. Consuming Five (5) Hours Course Time
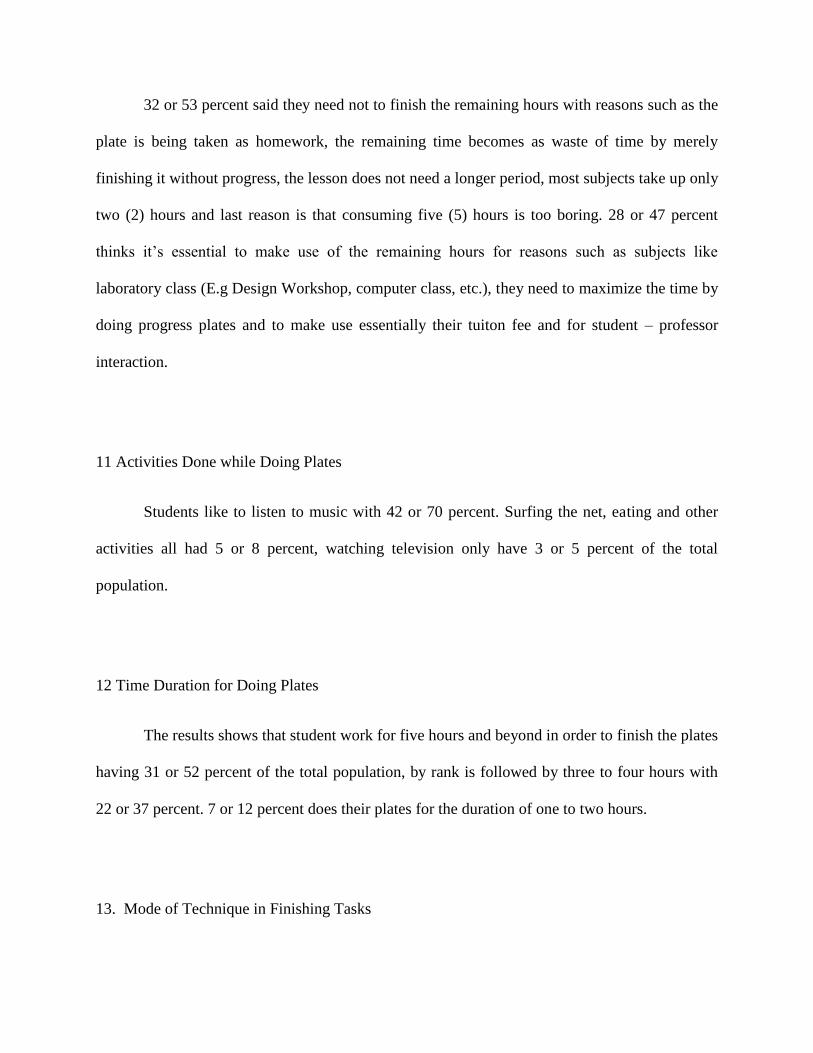
32 or 53 percent said they need not to finish the remaining hours with reasons such as the
plate is being taken as homework, the remaining time becomes as waste of time by merely
finishing it without progress, the lesson does not need a longer period, most subjects take up only
two (2) hours and last reason is that consuming five (5) hours is too boring. 28 or 47 percent
thinks it’s essential to make use of the remaining hours for reasons such as subjects like
laboratory class (E.g Design Workshop, computer class, etc.), they need to maximize the time by
doing progress plates and to make use essentially their tuiton fee and for student – professor
interaction.
11 Activities Done while Doing Plates
Students like to listen to music with 42 or 70 percent. Surfing the net, eating and other
activities all had 5 or 8 percent, watching television only have 3 or 5 percent of the total
population.
12 Time Duration for Doing Plates
The results shows that student work for five hours and beyond in order to finish the plates
having 31 or 52 percent of the total population, by rank is followed by three to four hours with
22 or 37 percent. 7 or 12 percent does their plates for the duration of one to two hours.
13. Mode of Technique in Finishing Tasks

36 or 60 percent said they divide the work into parts or through skipped parts in order to
finish their plates while 24 or 40 percent finish their work in a continuous basis.
14. Choice of Doing Work Individually or By Group
Majority answered that they prefer to do it individually with 40 or 67 percent. Others
prefer to do it by peers or other blockmates with 20 or 34 percent.
15. Student Pressure
30 or 50 percent said that plates plainly are the reason while the other 30 or 50 percent
also thinks that it depends upon the professor’s instruction that makes the work graver.
CONCLUSIONS
Based on the data gathered and response accumulated, the researchers have come
up with the following conclusions:
A common Advertising Arts student cram in order to finish their work with varied
reasons starting with time problems, other personal reasons and responsibilities to be taken care
of. Yes, they think that deadlines are adequate for them to meet yet some are also having a hard
time to cope with such time duration.
Time Management plays a role among students who plan ahead the weeks giving them
enough time for each task for them to finish. It’s a fact that artworks take time yet some finds a
way to ease a bit of their stress but majority have less rest and sleep thus making students cranky
and deprived of sleep.
Students prefer to work during the night; this follows class schedules and efficient time
schedule in doing homeworks and plates. This is continuously followed all through midnight to
get their plates done. It takes them more than 5 hours which tends to make their work all through
midnight. Majority likes to do their work at home due to convenience of workplace, easy access
of materials and other reasons. They do their work accompanied by listening to music, watching
television, eating, surfing the net and other multitasking activities. They feel more productive
through the use of gadgets such as tablets, computer, mobile phones and others. Besides this,
they prefer to divide the work equally than continuously finishing it immediately.
When handling with the bulk of plates they have to deal with, students prefer to work
individually rather than by peers with conditions of passing the work one by one instead of being
given a number of plates to be submitted on specific deadlines. This allows them to work their
decisions towards their work with undivided opinion.
Students have varied answers when asked about plates or professors adding burden to
their work.
RECOMMENDATIONS
1.) Students
Though every student’s study habits differ from another, one must take their obligations
at school professionally through meeting their deadlines. Reasons of having less time given
are petty to be taken as your proof for poor work performance.
It depends on how you handle your time efficiently disregarding attitude of being lazy.
Make use of your time wisely and maximize it.
2.) Professors
Professors should make use of their student’s time wisely by teaching and not merely by
posing problems for them to answer or being unaware of taking too much time with
unnecessary talking. They should also take into consideration that there are also other
professors who give the same amount of work.
3.) Researchers
A research should be conducted to know the different reasons behind students study
habits.
REFERENCES
Di Pietro, G., The Impact of the Academic Calendar on Student Performance: Evidence from the
UK. Retrived 2009 from www.eale.nl/Conference2009/PapersF/EALE-2009-DiPietro-14-08-
09.pdf
Crean, S. What is it like to study Fine Art? Retrieved September 27, 2012 from The Independent
:www.independent.co.uk
Misra, R., McKean, M. College Students (Psychological Aspects) Universities and Colleges
Health Aspects). Retrieved January 1, 2000 from American Journal of Health Studies:
http://www.biomedsearch.com/article/College-students-academic-stress-its/65640245.html
Sommer, WG. ,Procastination and Cramming: How Adept Students Ace the System (1990).
Retrieved July 9, 2010 from Journal of American College Health:
http://www.tandfonline.com/doi/citedby/10.1080/07448481.1990.9936207#tabModule
Jacoby, D., (1997) General Study Habits. Retrieved from Disciples on Capus:
www.douglasjacoby.com