Embed Size (px)
Citation preview
Journal of Physics Conference Series
OPEN ACCESS
Study of Gadolinium-doped cerium oxide by XRDTG-DTA impedance analysis and positronlifetime spectroscopyTo cite this article S Ohta et al 2010 J Phys Conf Ser 225 012043
View the article online for updates and enhancements
You may also likeDiffusion and Interaction between ion Ca2+
and ion Gd3+ in a Model Synapse AMonte Carlo StudyAdita Sutresno Freddy HaryantoSparisoma Viridi et al
-
Application of Plackett-Burman and Box-Behnken experimental designs indifferential voltammetry for determiningGadolinium concentrationS Wyantuti F W Harahap Y W Hartati etal
-
Self-identified gadolinium toxicitycomparison of gadolinium in bone andurine to healthy gadolinium-based contrastagent exposed volunteersMichelle L Lord Fiona E McNeill James LGraumlfe et al
-
Recent citationsAnalysis of Ferroelectric Dielectric andMagnetic Properties of GdFeO3NanoparticlesB Jaya Prakash et al
-
Thermal Magnetic and ElectricalProperties of Multiferroic GdMnO3NanoParticles by a Co-Precipitation MethodB Jaya Prakash et al
-
Free Volumes Associated with Sintering inGadolinium Doped Ceria Solid SolutionsTomomi Kosaka and Kiminori Sato
-
This content was downloaded from IP address 11821921654 on 11012022 at 0755
Study of Gadolinium-doped Cerium Oxide by XRD TG-DTA
impedance analysis and positron lifetime spectroscopy
S Ohta1 T Kosaka
1 and K Sato
2
1 Department of Chemistry Tokyo Gakugei University Nukuikita 4-1-1 Koganei
Tokyo 184-8501 Japan 2 Department of Environmental Sciences Tokyo Gakugei University Nukuikita 4-1-1
Koganei Tokyo 184-8501 Japan
E-mail tkosakau-gakugeiacjp
Abstract X-ray diffraction thermogravimetry differential thermal analysis impedance
analysis and positron lifetime spectroscopy were conducted for Gadolinium-doped cerium
oxides (GDC) prepared using oxalate coprecipitation method XRD revealed the fluorite
structure indicating that gadolinium is successfully doped into cerium oxide Prior to sintering
the vacancy-sized free volume and nanovoid were observed at grain boundaries The vacancy-
sized free volumes shrank with increasing sintering temperatures and finally got dominant
1 Introduction
Solid oxide fuel cells have been intensively studied due to their high power conversion efficiency
There has been a long-standing problem of extremely high operating temperature for solid oxide fuel
cells Gadolinium-doped cerium oxides are one of the most promising candidates as the electrolytes
operated at intermediate temperature [1-3] The total ionic conductivity of GDC is governed by the
local atomic structure of transgranular [4] which is expected to be correlated with sintering Song et al
[5] reported that the points defect is an important factor which influences the evolution of structure
and chemical changes in hydrogen irradiated CeO2 Zhang et al [6] investigated the effect of transition
metal oxide loading on sintering behaviour and ion conductivity of GDC It is thus of significance to
investigate the local structural change induced by sintering In this paper we investigated GDC
prepared using oxalate coprecipitation method by XRD TG-DTA impedance analysis and positron
lifetime spectroscopy
2 Experimental
Gadolinium-doped cerium oxides (GDC) were prepared using oxalate coprecipitation method [7] The
cerium and gadolinium nitrate mixed solution at a molar ratio of Ce3+
Gd3+
= 41 was dropped into a
stirred oxalate acid solution to produce the oxalate precipitate The precipitates were calcined at 873K
for 1 h in the air to form oxides They were compacted into a pellet by uniaxial pressing (20MPa) and
sintered in the wide temperature range (873 - 1473K) for 6 h in air The lattice constant of GDC was
determined by XRD using NaCl as internal standard The relative density was measured by
Archimedes method The Pt electrodes were formed on the both side of GDC pellet by heating at 1473
K using Pt paste (Tanaka Kikinzoku TR-7070) The ionic conductivity of the pellet was measured
International Symposium on Advanced Science Research 2009 IOP PublishingJournal of Physics Conference Series 225 (2010) 012043 doi1010881742-65962251012043
ccopy 2010 IOP Publishing Ltd 1
from 673K to 973K conducted by AC impedance analyzer (Princeton applied research corp
VersaSTAT3) in the frequency range from 100 μHz to 1MHz Positron lifetime spectroscopy was
conducted using 22
Na positron source at room temperature The positron lifetime spectra were
numerically analyzed using the POSITRONFIT code [8]
3 Results and discussion
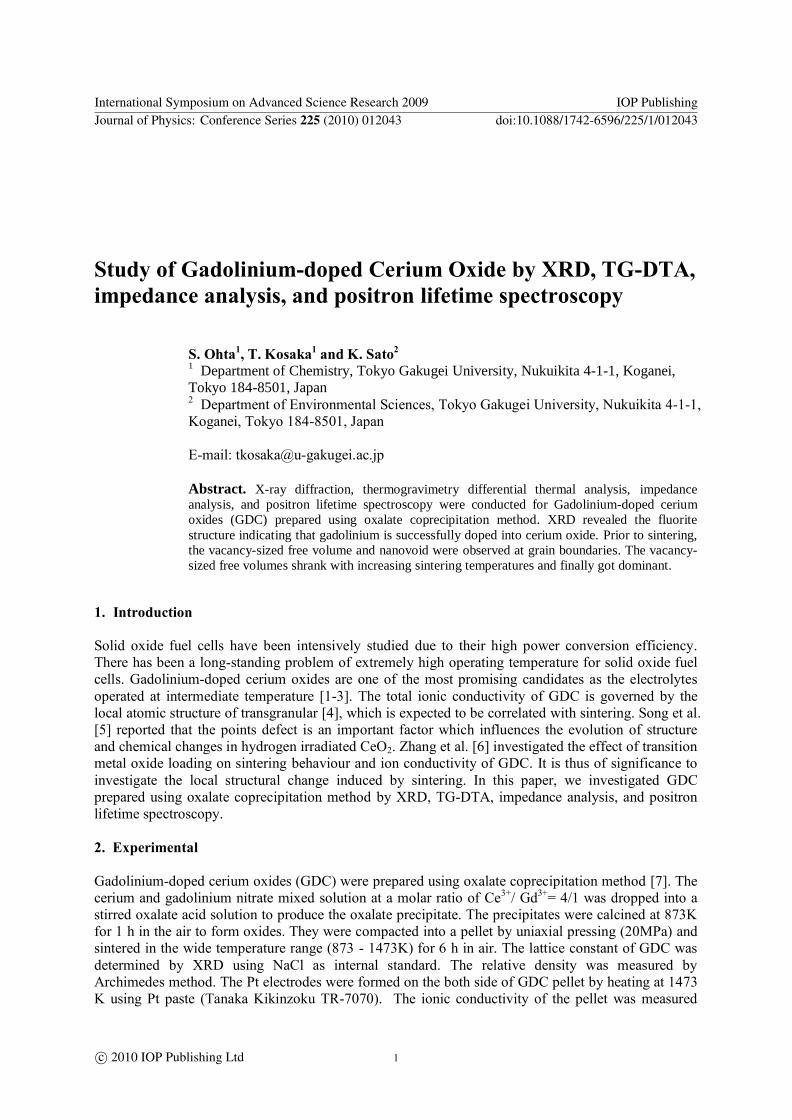
Figure 1 shows the XRD patterns of GDC and CeO2 sintered at 1073K for 6h in air The XRD pattern
indicates that GDC has a fluorite type structure without any other phases All peaks of GDC are
shifted to low angle region against to the corresponded ones of CeO2 indicating the expansion of
interplanar spacing for GDC by Gd doping The lattice constants calculated for GDC and CeO2 are
05429 nm and 05415 nm respectively This implies that it is partially substituted Ce4+
with Gd3+
and
formed of an oxygen vacancy successfully
The results of TG-DTA analysis for Ce and coprecipitated oxalate are shown in Figure 2 They lost
chemically adsorbed water at 473K and began to decompose to oxides with the producing CO CO2
and O2 gases at 573K The exothermic peak in DTA curves was detected at a higher temperature for
coprecipitated than for Ce oxalate
Figure 3 shows the temperature dependence of the total ionic conductivity for GDC The data was
fitted with least-square method Sameshima et al reported that CeO2 sintered at 1873K for 4 h in dried
air shows the total ionic conductivity of 49times10-5
S cm at 773 K lower by 20 times than the value for
GDC sintered at 1473 K in the present study The activation energy of GDC (81kJ mol) is higher
than that of CeO2 (617kJ mol) measured by Sameshima et al [9] This indicates that the substitution
of Ce4+
with Gd3+
with larger ionic radius than that of Ce4+
is caused to form the high potential energy
barrier The total ionic conductivity is explained by oxygen ion diffusion and is influenced by the
number of oxygen vacancies existed in the samples
Figure 1 XRD patterns of GDC and
CeO2
Figure 2 TG-DTA curves of Ce and
coprecipitated oxalate
International Symposium on Advanced Science Research 2009 IOP PublishingJournal of Physics Conference Series 225 (2010) 012043 doi1010881742-65962251012043
2
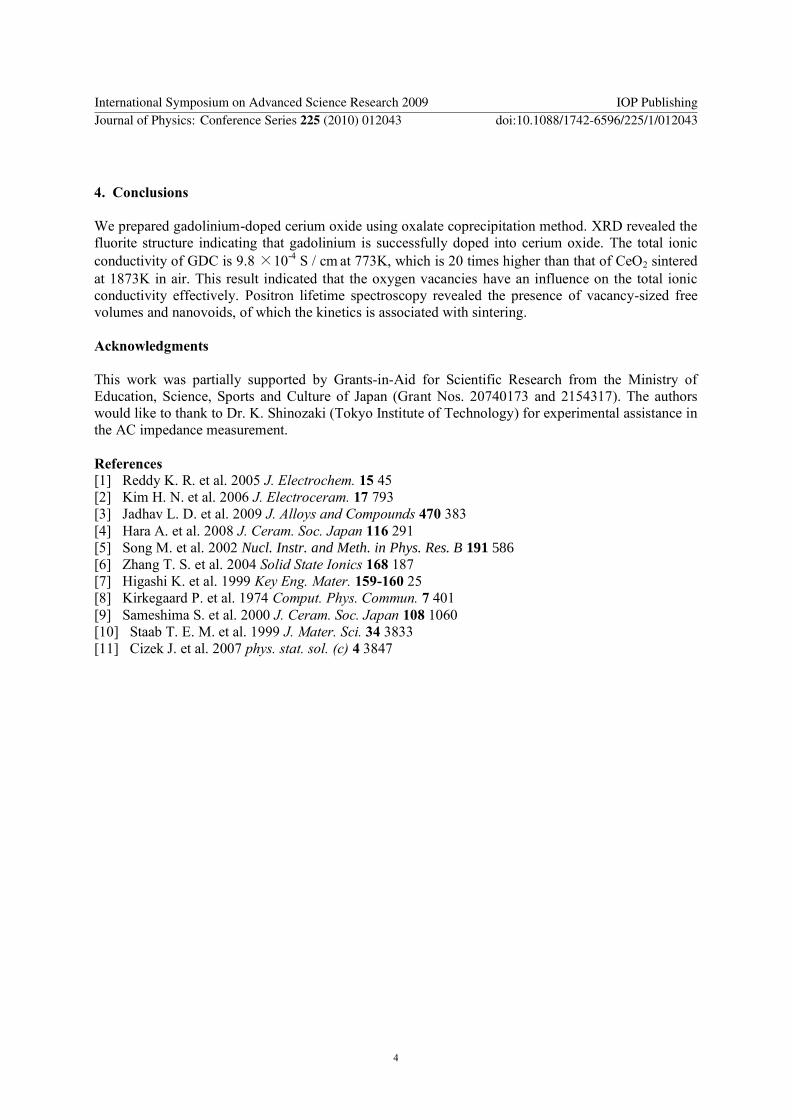
Figure 4 shows the results of positron lifetime spectroscopy for GDC Prior to sintering two
components τ1 (~ 260 ps) and τ2 (~ 500 ps) corresponding to a vacancy-sized free volume and a
nanovoid were obtained with their relative intensities I1 (~ 80 ) and I2 (~ 20 ) The average size of
GDC crystallite evaluated from 311 peak broadening using Scherrers equation is 128 nm before
sintering which is by far smaller than the typical positron diffusion length in solids of ~ 300 nm [10]
Positrons implanted in GDC crystallite can thus efficiently diffuse out and annihilate at grain
boundaries We therefore conclude that the vacancy-sized free volumes and nanovoids detected by the
present positron lifetime spectroscopy are present at grain boundaries Similar observation was
reported for yttria-stabilized zirconia by Cizek et al [11]
Upon increasing temperatures the positron lifetime τ1 decreases and its relative intensity I1 increased
signifying shrinkage of vacancy-sized free volumes together with sintering The lifetime τ2 and its
relative intensity I2 exhibit the opposite tendency to those of vacancy-sized free volume (see right hand
in Figure 4) The vacancy-sized free volumes got dominant at the sintering temperature of 1473 K
while the nanovoids almost disappear The results suggest that a substantial increase of local electron
density at grain boundaries occurs as a result of sintering and the process of sintering follows the
kinetics of vacancy-sized free volumes and nanovoids at grain boundaries
Figure 4 Plot of positron lifetimes against sintering temperature for GDC
Figure 3 Arrhenius plots of total
conductivity of GDC and CeO2
Solid lines are results of the least-
square fit
International Symposium on Advanced Science Research 2009 IOP PublishingJournal of Physics Conference Series 225 (2010) 012043 doi1010881742-65962251012043
3
4 Conclusions
We prepared gadolinium-doped cerium oxide using oxalate coprecipitation method XRD revealed the
fluorite structure indicating that gadolinium is successfully doped into cerium oxide The total ionic
conductivity of GDC is 98 times10-4
S cm at 773K which is 20 times higher than that of CeO2 sintered
at 1873K in air This result indicated that the oxygen vacancies have an influence on the total ionic
conductivity effectively Positron lifetime spectroscopy revealed the presence of vacancy-sized free
volumes and nanovoids of which the kinetics is associated with sintering
Acknowledgments
This work was partially supported by Grants-in-Aid for Scientific Research from the Ministry of
Education Science Sports and Culture of Japan (Grant Nos 20740173 and 2154317) The authors
would like to thank to Dr K Shinozaki (Tokyo Institute of Technology) for experimental assistance in
the AC impedance measurement
References
[1] Reddy K R et al 2005 J Electrochem 15 45
[2] Kim H N et al 2006 J Electroceram 17 793
[3] Jadhav L D et al 2009 J Alloys and Compounds 470 383
[4] Hara A et al 2008 J Ceram Soc Japan 116 291
[5] Song M et al 2002 Nucl Instr and Meth in Phys Res B 191 586
[6] Zhang T S et al 2004 Solid State Ionics 168 187
[7] Higashi K et al 1999 Key Eng Mater 159-160 25
[8] Kirkegaard P et al 1974 Comput Phys Commun 7 401
[9] Sameshima S et al 2000 J Ceram Soc Japan 108 1060
[10] Staab T E M et al 1999 J Mater Sci 34 3833
[11] Cizek J et al 2007 phys stat sol (c) 4 3847
International Symposium on Advanced Science Research 2009 IOP PublishingJournal of Physics Conference Series 225 (2010) 012043 doi1010881742-65962251012043
4
Study of Gadolinium-doped Cerium Oxide by XRD TG-DTA
impedance analysis and positron lifetime spectroscopy
S Ohta1 T Kosaka
1 and K Sato
2
1 Department of Chemistry Tokyo Gakugei University Nukuikita 4-1-1 Koganei
Tokyo 184-8501 Japan 2 Department of Environmental Sciences Tokyo Gakugei University Nukuikita 4-1-1
Koganei Tokyo 184-8501 Japan
E-mail tkosakau-gakugeiacjp
Abstract X-ray diffraction thermogravimetry differential thermal analysis impedance
analysis and positron lifetime spectroscopy were conducted for Gadolinium-doped cerium
oxides (GDC) prepared using oxalate coprecipitation method XRD revealed the fluorite
structure indicating that gadolinium is successfully doped into cerium oxide Prior to sintering
the vacancy-sized free volume and nanovoid were observed at grain boundaries The vacancy-
sized free volumes shrank with increasing sintering temperatures and finally got dominant
1 Introduction
Solid oxide fuel cells have been intensively studied due to their high power conversion efficiency
There has been a long-standing problem of extremely high operating temperature for solid oxide fuel
cells Gadolinium-doped cerium oxides are one of the most promising candidates as the electrolytes
operated at intermediate temperature [1-3] The total ionic conductivity of GDC is governed by the
local atomic structure of transgranular [4] which is expected to be correlated with sintering Song et al
[5] reported that the points defect is an important factor which influences the evolution of structure
and chemical changes in hydrogen irradiated CeO2 Zhang et al [6] investigated the effect of transition
metal oxide loading on sintering behaviour and ion conductivity of GDC It is thus of significance to
investigate the local structural change induced by sintering In this paper we investigated GDC
prepared using oxalate coprecipitation method by XRD TG-DTA impedance analysis and positron
lifetime spectroscopy
2 Experimental
Gadolinium-doped cerium oxides (GDC) were prepared using oxalate coprecipitation method [7] The
cerium and gadolinium nitrate mixed solution at a molar ratio of Ce3+
Gd3+
= 41 was dropped into a
stirred oxalate acid solution to produce the oxalate precipitate The precipitates were calcined at 873K
for 1 h in the air to form oxides They were compacted into a pellet by uniaxial pressing (20MPa) and
sintered in the wide temperature range (873 - 1473K) for 6 h in air The lattice constant of GDC was
determined by XRD using NaCl as internal standard The relative density was measured by
Archimedes method The Pt electrodes were formed on the both side of GDC pellet by heating at 1473
K using Pt paste (Tanaka Kikinzoku TR-7070) The ionic conductivity of the pellet was measured
International Symposium on Advanced Science Research 2009 IOP PublishingJournal of Physics Conference Series 225 (2010) 012043 doi1010881742-65962251012043
ccopy 2010 IOP Publishing Ltd 1
from 673K to 973K conducted by AC impedance analyzer (Princeton applied research corp
VersaSTAT3) in the frequency range from 100 μHz to 1MHz Positron lifetime spectroscopy was
conducted using 22
Na positron source at room temperature The positron lifetime spectra were
numerically analyzed using the POSITRONFIT code [8]
3 Results and discussion
Figure 1 shows the XRD patterns of GDC and CeO2 sintered at 1073K for 6h in air The XRD pattern
indicates that GDC has a fluorite type structure without any other phases All peaks of GDC are
shifted to low angle region against to the corresponded ones of CeO2 indicating the expansion of
interplanar spacing for GDC by Gd doping The lattice constants calculated for GDC and CeO2 are
05429 nm and 05415 nm respectively This implies that it is partially substituted Ce4+
with Gd3+
and
formed of an oxygen vacancy successfully
The results of TG-DTA analysis for Ce and coprecipitated oxalate are shown in Figure 2 They lost
chemically adsorbed water at 473K and began to decompose to oxides with the producing CO CO2
and O2 gases at 573K The exothermic peak in DTA curves was detected at a higher temperature for
coprecipitated than for Ce oxalate
Figure 3 shows the temperature dependence of the total ionic conductivity for GDC The data was
fitted with least-square method Sameshima et al reported that CeO2 sintered at 1873K for 4 h in dried
air shows the total ionic conductivity of 49times10-5
S cm at 773 K lower by 20 times than the value for
GDC sintered at 1473 K in the present study The activation energy of GDC (81kJ mol) is higher
than that of CeO2 (617kJ mol) measured by Sameshima et al [9] This indicates that the substitution
of Ce4+
with Gd3+
with larger ionic radius than that of Ce4+
is caused to form the high potential energy
barrier The total ionic conductivity is explained by oxygen ion diffusion and is influenced by the
number of oxygen vacancies existed in the samples
Figure 1 XRD patterns of GDC and
CeO2
Figure 2 TG-DTA curves of Ce and
coprecipitated oxalate
International Symposium on Advanced Science Research 2009 IOP PublishingJournal of Physics Conference Series 225 (2010) 012043 doi1010881742-65962251012043
2
Figure 4 shows the results of positron lifetime spectroscopy for GDC Prior to sintering two
components τ1 (~ 260 ps) and τ2 (~ 500 ps) corresponding to a vacancy-sized free volume and a
nanovoid were obtained with their relative intensities I1 (~ 80 ) and I2 (~ 20 ) The average size of
GDC crystallite evaluated from 311 peak broadening using Scherrers equation is 128 nm before
sintering which is by far smaller than the typical positron diffusion length in solids of ~ 300 nm [10]
Positrons implanted in GDC crystallite can thus efficiently diffuse out and annihilate at grain
boundaries We therefore conclude that the vacancy-sized free volumes and nanovoids detected by the
present positron lifetime spectroscopy are present at grain boundaries Similar observation was
reported for yttria-stabilized zirconia by Cizek et al [11]
Upon increasing temperatures the positron lifetime τ1 decreases and its relative intensity I1 increased
signifying shrinkage of vacancy-sized free volumes together with sintering The lifetime τ2 and its
relative intensity I2 exhibit the opposite tendency to those of vacancy-sized free volume (see right hand
in Figure 4) The vacancy-sized free volumes got dominant at the sintering temperature of 1473 K
while the nanovoids almost disappear The results suggest that a substantial increase of local electron
density at grain boundaries occurs as a result of sintering and the process of sintering follows the
kinetics of vacancy-sized free volumes and nanovoids at grain boundaries
Figure 4 Plot of positron lifetimes against sintering temperature for GDC
Figure 3 Arrhenius plots of total
conductivity of GDC and CeO2
Solid lines are results of the least-
square fit
International Symposium on Advanced Science Research 2009 IOP PublishingJournal of Physics Conference Series 225 (2010) 012043 doi1010881742-65962251012043
3
4 Conclusions
We prepared gadolinium-doped cerium oxide using oxalate coprecipitation method XRD revealed the
fluorite structure indicating that gadolinium is successfully doped into cerium oxide The total ionic
conductivity of GDC is 98 times10-4
S cm at 773K which is 20 times higher than that of CeO2 sintered
at 1873K in air This result indicated that the oxygen vacancies have an influence on the total ionic
conductivity effectively Positron lifetime spectroscopy revealed the presence of vacancy-sized free
volumes and nanovoids of which the kinetics is associated with sintering
Acknowledgments
This work was partially supported by Grants-in-Aid for Scientific Research from the Ministry of
Education Science Sports and Culture of Japan (Grant Nos 20740173 and 2154317) The authors
would like to thank to Dr K Shinozaki (Tokyo Institute of Technology) for experimental assistance in
the AC impedance measurement
References
[1] Reddy K R et al 2005 J Electrochem 15 45
[2] Kim H N et al 2006 J Electroceram 17 793
[3] Jadhav L D et al 2009 J Alloys and Compounds 470 383
[4] Hara A et al 2008 J Ceram Soc Japan 116 291
[5] Song M et al 2002 Nucl Instr and Meth in Phys Res B 191 586
[6] Zhang T S et al 2004 Solid State Ionics 168 187
[7] Higashi K et al 1999 Key Eng Mater 159-160 25
[8] Kirkegaard P et al 1974 Comput Phys Commun 7 401
[9] Sameshima S et al 2000 J Ceram Soc Japan 108 1060
[10] Staab T E M et al 1999 J Mater Sci 34 3833
[11] Cizek J et al 2007 phys stat sol (c) 4 3847
International Symposium on Advanced Science Research 2009 IOP PublishingJournal of Physics Conference Series 225 (2010) 012043 doi1010881742-65962251012043
4
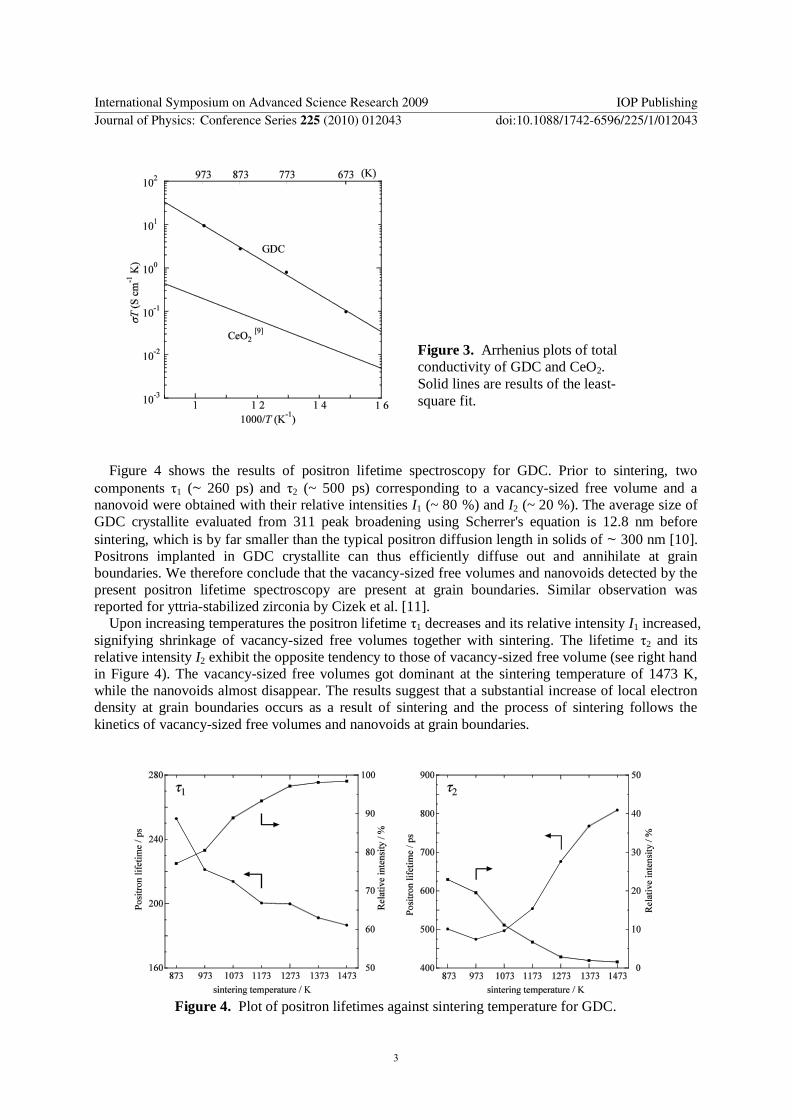


![Antioxidant Cerium Oxide Nanoparticles in Biology and … · Antioxidant Cerium Oxide Nanoparticles in Biology ... dermal burn cream (Flammacerium) [5] ... Antioxidant Cerium Oxide](https://img.pdfslide.net/doc/110x75/5ade477c7f8b9ae1408e286b/antioxidant-cerium-oxide-nanoparticles-in-biology-and-cerium-oxide-nanoparticles.jpg)