Embed Size (px)
Citation preview

Study of the application of pharmacokinetic-pharmacodynamic
modeling to optimize propofol administration
during anaesthesia
Studie over het gebruik van farmacokinetische-farmacodynamische modellen om de toediening van propofol te
optimaliseren tijdens anesthesie.
Thesis submitted to obtain the degree of Doctor in Medical Science
Marc COPPENS
Promotor: Prof. Dr. Michel M.R.F. STRUYS
Co-Promotor: Prof. Dr. Peter DE PAEPE

Aan An, Lien en Sam

Volgend jaar ben ik 20 jaar actief in anesthesie. Wat mij vanaf de start boeide was het belang
van basiswetenschappen als fysiologie en farmacologie. Gaandeweg liet ik mij echter graag
opslorpen door het vele klinische werk en kwam wetenschappelijk werk op het tweede plan.
Onder de auspiciën van Prof. dr. G. Rolly startte ik mijn specialisatie opleiding, het was
samen met hem dat ik mijn eerste anesthesie voor keizersnede uitvoerde.
Prof. dr. Linda Versichelen deelde met mij haar enthousiasme voor het Chirurgisch
Dagziekenhuis. Zij was het ook die de vele theorie- en praktijklessen EHBO van de vakgroep
anesthesiologie met grote toewijding verzorgde en samen met haar gaf ik mijn eerste lessen
anesthesie en reanimatie aan talrijke jonge studenten van onze faculteit geneeskunde.
Ondertussen ondernamen de professoren Eric Mortier en Patrick Wouters verwoede en
intense pogingen om mij te overtuigen tot het schrijven van een doctoraat. Het woord
‘doctoraat’ bleef echter lang als een bedreiging klinken maar werd uiteindelijk een
persoonlijke uitdaging.
Het zijn echter Prof. dr. Michel Struys en Prof. dr. Hugo Vereecke en met hen de coauteurs
van de artikels, die het resultaat, zoals het vandaag hier voorligt, mogelijk hebben gemaakt.
Prof. dr. Peter De Paepe heeft mee gewaakt over de kwaliteit van het manuscript en zorgde
ervoor op zijn rustige manier dat het werk nooit stil viel. De leden van de leescommissie (de
professoren Stefan De Hert en Koen Boussery), en de leden van de examenjury (de
professoren Walter Buylaert, Luc Van Bortel, Karel Allegaert en Patrick Wouters) lazen het
werk aandachtig door, hun aanmerkingen kwamen de thesis alleen ten goede.
Tandartsen bleven een rode draad doorheen het werk. Prof. dr. Luc Marks zorgde mee voor
inclusie van patiënten. Prof. dr. Luc Martens leidde op bijna poëtische wijze de ceremonie.
Maar mijn mooiste dankwoord is voor An, mijn echtgenote, die mij blijvend steunt en mij
reeds 20 jaar deelt met het UZGent.
Een thesis schrijven is dus vooral teamwork !!! Mijn naaste collega’s namen regelmatig het
werk over in de kliniek want jonge moeders konden en wilden eenmaal niet wachten! Het
CDC bleef perfect op koers dankzij Kristof Tassenoy en z’n team. Frieda en de medewerkers
van het secretariaat anesthesie droegen hun steentje bij tot de layout van dit werk en waren
door hun administratieve ondersteuning een fantastische hulp.
Thuis kon ik rekenen op dochter Lien: met enkele snelle maar efficiënte muisclicks hielp ze
mij vaak uit de knoei. Zoon Sam nam heel wat taken thuis van mij over.
Bovenal geven ze mij dagelijks de ruimte om professioneel bezig te zijn.
Aan allen van harte bedankt !!!
3

INDEX
LIST of ABBREVIATIONS ..................................................................................................................................................... 5
CHAPTER 1 ........................................................................................................................................................................ 6
OUTLINE AND AIMS OF THE THESIS ............................................................................................................................... 6
CHAPTER 2 ......................................................................................................................................................................... 9
BASIC PRINCIPLES AND REVIEW OF THE LITERATURE ................................................................................................... 9
2.1. Controlling the dose-response relationship ............................................................................................... 10
2.2 Developing a compartmental kinetic model for TCI. .................................................................................. 12
2.3 Measuring cerebral drug effect as a pharmacodynamic end-point ............................................................ 17
2.4 Linking kinetics and dynamics using the concept of the effect-site concentration : .................................. 19
2.5 Non Linear Mixed Effects Modeling ............................................................................................................ 26
2.6 Accuracy analysis of a TCI model ................................................................................................................. 29
2.7 ................................................................................................ 33
2.8 Front-end kinetics and re-circulatory models .............................................................................................. 41
REFERENCES ..................................................................................................................................................................... 47
CHAPTER 3 ....................................................................................................................................................................... 54
Influence of Administration Rate on Propofol Plasma-Effect Site Equilibration ................................................. 54
CHAPTER 4 ...................................................................................................................................................................... 81
Study of the time course of the clinical effect of propofol compared with the time course of the predicted
effect-site concentration: performance of three pharmacokinetic dynamic models ...................................... 81
CHAPTER 5 ....................................................................................................................................................................... 95
An Evaluation of Using Population Pharmacokinetic Models to Estimate Pharmacodynamic Parameters for
Propofol and Bispectral Index in Children ........................................................................................................... 95
CHAPTER 6 ..................................................................................................................................................................... 116
DISCUSSION AND GENERAL CONCLUSIONS ............................................................................................................... 116
SUMMARY ...................................................................................................................................................................... 122
SAMENVATTING ............................................................................................................................................................. 123
CURRICULUM VITAE ....................................................................................................................................................... 125
4

LIST of ABBREVIATIONS
AEP auditory evoked potentials
BIS bispectral index
Ce effect-site concentration
Ce50 effect-site concentration for 50% effect
Cl clearance
Cp plasma concentration
EEG electro encephalography
Emax maximal possible drug effect
IQR interquartile range
IV intravenous
Ke0 effect-site concentration equilibration constant
LBM lean body mass
LOC loss of consciousness
LORNC loss of respone to name calling
MDAPE median of absolute values of performance errors
MDPE median performance error
NONMEM non linear mixed effects modeling
OBJFN objective function
PD pharmacodynamics
PE performance/prediction error
PK pharmacokinetics
PWT population median weight
ROC return of consciousness
SD standard deviation
SE standard error
TCI target controlled infusion
TIVA total intravenous anaesthesia
TTPE time to peak effect
steepness of the concentration-versus-response curve
5

CHAPTER 1
OUTLINE AND AIMS OF THE THESIS
6

CHAPTER 1 OUTLINE AND AIMS OF THE THESIS
The goal of administering propofol as a hypnotic drug is to obtain and maintain a desired time course of clinical and thera-
peutic effect as accurately as possible: e.g. loss of response to name calling (LORNC) or predefined bispectral index values
(BIS). The specific effect-site drug concentrations to evoke this effect, can be obtained through different dosing regimens.
The key question remains which dosing regimen provides optimal control of the time course of the effect of propofol.
Standard dosing guidelines ignore the large inter-individual variability in dose-response relationship. Pharmacokinetic-
pharmacodynamic (PK-PD) models used in TCI (target controlled infusion) systems reduce this variability by incorporating
different co-variates but still model inaccuracy limits universal application of a specified PK-PD model. This thesis discusses
several sources of model inaccuracy.
The dose-response relationship can be divided into three parts. The first part involves the relationship between the adminis-
tered dose and the plasma concentration (pharmacokinetics) and the second part the relationship between plasma or effect
site concentration and clinical effect (pharmacodynamics). The final part is the coupling between PK and PD. Additionally,
it is important to recognize that these relationships are subject to population variability. It has been proven that incorporating
PK-PD information as an additional input to guide clinical anaesthesia can result in better patient care1-8
. As such, it is im-
portant that anaesthetists learn and understand basic anaesthetic pharmacological principles and apply the available pharma-
cology-based technology into their daily clinical practice9.
Optimized patient-individual dosing may be achieved by the application of pharmacokinetic and pharmacodynamic models
with real-time estimation of the dose-response relationship online. For intravenous anesthetics such as propofol, target-
controlled infusion (TCI) techniques based on compartmental models have been developed and are used frequently in daily
clinical practice. A target controlled infusion (TCI) aims to achieve a user- t-
-compartmental PK-PD models to calculate
the infusion rates required to achieve the specific target concentration. A clinician using a TCI system to administer an intra-
measurements of drug effect. A computer or microprocessor performs the complex calculations, and controls the infusion
pump. Classically, plasma or effect-site concentrations are targeted10
.
7

The development of target-controlled infusion (TCI) technology, has enabled clinicians to manage more pre-
cisely the complex relationship between dose, blood-concentration, effect-site concentration and clinical effect.
One of the most important components of TCI is an accurate PK-PD model describing the time course of drug
plasma concentration and effect-site concentration. The search for the optimal PK-PD model has a long stand-
ing history and is continuously developing. Investigators are still searching for the optimal PK-PD model pre-
dicting the time course of propofol concentrations and hence hypnotic effect.
This thesis aims at guiding the clinician who makes use of target controlled infusion (TCI) in daily clinical
practice through different PK-PD models. The choice of the model is crucial as an inaccurate model choice can
result in a lack of effect or too much effect. However, (possible known) various sources of modeling inaccura-
cies may bias the TCI concept and may therefore be relevant for clinical practice. As these are not well docu-
mented in the literature we aimed to investigate the impact of these inaccuracies.
1) We hypothesized that especially during the first minutes following bolus administration of propofol the pre-
diction error using three compartmental PK models may be large. Due to failure to describe the very early drug
distribution in the central compartment: the mixing within the vascular volume, blood flow and subsequently
the distribution of the drug to both active and inactive tissues. We tested the hypothesis that different injection
rates of propofol correspond with different ke0 tions were used, in a se-
cond stage we performed frequent arterial blood sampling (and measure propofol concentrations) during the
first minutes following propofol bolus administration.
2) We hypothesized that available PK-PD models for propofol would be able to accurately estimate the effect-
site concentration of propofol at loss-of-consciousness and consequently that the effect would remain stable
once this concentration is maintained. We tested this hypothesis comparing clinically applied compartmental
PK-PD models for propofol.
3) We hypothesized that the estimation of the PD model, using published PK models, does not ensure accurate
estimates for PK and PD parameters. An accurate estimation of ke0, linking the kinetic and dynamic model,
demands an integrated PK-PD study, combining measurement of blood concentrations and drug effect which
are then used to construct a PK-PD model within the same specific population. This results in an overall model
describing the dose-response behavior of the drug, with an accurate estimation of the ke0. We tested this hy-
pothesis by constructing a PK-PD model in a pediatric patient-population based on measured blood concentra-
tions and BIS values. In a second step we used published PK models to re-estimate the PD model. We tested
the hypothesis that these predicted PK parameters would be able to identify the best-performing PK model and
to provide accurate estimations for the true PD parameters.
8

CHAPTER 2
BASIC PRINCIPLES AND REVIEW OF THE LITERATURE
9
CHAPTER 2 BASIC PRINCIPLES AND REVIEW OF THE LITERATURE
2.1. Controlling the dose-response relationship
The main drugs used to provide general anaesthesia are hypnotics, analgesics and muscle relaxants. These
drugs induce unconsciousness, analgesia, suppression of the hemodynamic response and suppression of reflex
movements11
. This thesis will focus mainly on pharmacological properties of propofol as the hypnotic compo-
nent of anaesthesia.
Controlling the time course and the degree of hypnotic drug effect is a very important goal in anaesthetic prac-
tice. The patient should loose consciousness rapidly during induction and the level of consciousness should be
easily titrated to the level of surgical stimulation.
i-
dental awakening12-14
of the patient during surgery, which is a very distressing event for both the patient and
anaesthetist and is to be absolutely avoided.
On the other hand, excessive doses of hypnotic will increase the incidence and the degree of side effects and
possibly accounts for long-term morbidity and mortality15
.
Once the surgical procedure is finished the drug effect should dissipate so that the patient wakes up as rapidly
as possible. From this moment on any residual hypnotic or sedative effect is deemed as
delays early recovery and transit times from high dependency to low care units. In ambulatory anaesthesia any
-16
(Table 1).
Optimal patient-individual dosing may be achieved by the application of pharmacokinetic-pharmacodynamic
principles. Using the dose-response relationship, drug titration should be done as close as possible to the drug
effect. Titrating a specific effect or, if not possible, a specific effect-site concentration offers advantages. As the
effect-site or plasma concentrations are not continuously measurable on-line for most intravenous drugs used
during anaesthesia (in contrast to inhaled anaesthetics17-19
), it requires a pharmacokinetic and/or pharmacody-
namic drug model and a computer continuously updating the administration rate to maintain an estimated drug
effect or drug concentration. If a specific plasma or effect-site concentration is titrated, this technique is called
target-controlled infusion (TCI). TCI is an infusion controlled in such a manner as to achieve a user-defined
estimated drug concentration in a body compartment or tissue of interest. A clinician using a TCI system to
administer an anaesthetic agent is thus able to set and adjust a desired drug concentration, usually referred to as
-
compartmental pharmacokinetic-dynamic models are used by TCI systems to calculate the infusion rates re-
10

quired to achieve the target concentration. A computer or microprocessor is required to perform the complex
calculations, and to control the infusion pump. Classically, plasma or effect-site concentrations are targeted.
When the effect-site is targeted, the classical multi-compartmental pharmacokinetic model has to be extended
with an effect-site compartment.
In experimental conditions it is already possible to quantitate expiratory propofol concentrations. These tech-
niques range from discontinuous techniques to fast and very fast analysing techniques. As these very fast tech-
niques result in analytical times within seconds to milliseconds, on-line detection of expiratory propofol con-
centration will possibly become available in the future. Several authors have shown good correlation between
propofol concentration in the brain, blood and exhaled breath.20-23
Advantages and disadvantages of Total Intravenous Anesthesia with propofol
Advantages Disadvantages
Induction is very rapid in onset Pain during injection of propofol
Rapid onset of action independent from alveolar
ventilation
Need sophisticated infusion pumps with algorithms
for the TCI software
Improved quality of emergence from anesthesia Greater pharmacokinetic and pharmacodynamic
interindividual variability
Very smooth and peaceful recovery Difficult to estimate blood concentration of propofol
in real time at the moment
No risk of environmental pollution Propofol infusion syndrome
Reduction in the incidence of postoperative nausea
and vomiting
Method of choice in patients at risk of malignant
hyperthermia
Method of choice in some patients with congenital
myopathies
Can be reliably administered to maintain anesthesia
in patients undergoing airway procedures
Table 1. Advantages and disadvantages of TIVA with propofol
11

2.2 Developing a compartmental kinetic model for TCI.
‘Like paintings pharmacokinetic models range from the completely abstract to the naturalistic.’24
In order to target a specific plasma concentration of propofol one must know what happens when a specific
amount of drug is administered to a patient in a specific time frame. For this, one needs pharmacokinetics de-
scribing the time course of the plasma concentration, or stated otherwise “what does the body with the drug ?”
Typically a bolus or short-lasting infusion can be given and than blood samples are taken to describe the time
course of the plasma concentration. With this information one can try to predict what will probably be the
plasma concentration when a certain amount of propofol is injected.
If the human body was one single compartment, it would be easy to describe the time course of the concentra-
tion of a hypothetical drug. A basic assumption of the concept of a one-compartment representation of distribu-
tion is that equilibration of drug between tissues and blood occurs spontaneously and immediately. Knowing
the volume of that compartment would enable us to know the concentration of a given amount (dose) of a spe-
cific drug (equation 1).
equation 1
Where C0 is the concentration at time 0, x0 is the initial dose of drug, V is the volume of the compartment.
The clearance of a drug is typically a first-order process. The rate of change for a first-order process is :
equation 2
x is the amount of drug, k is the rate constant for drug elimination, the unit of k is time-1
.
12

If a value of x at time t is needed, x(t), it can be found as:
x(t)=x0.e-kt
equation 3
x0 is the amount of drug concentration at t=t0 or the initial dose, x(t) is the amount of drug at time t,
by using equation 1 the plasma concentration can be found as:
C(t)= C0 . e -kt
equation 4
However in reality drug distributes from the plasma to different groups of tissues, a process that takes time. A
multi-compartmental model is needed to describe this phenomenon. The time required for distribution depends
on tissue perfusion, permeability characteristics of tissue membranes for the drug, lipid solubility and its parti-
tioning between tissues and blood. The drug is also distributed to eliminating organs, so clearance starts imme-
diately.
When the anaesthetist injects a given amount of drug, e.g. propofol, the drug will initially dilute in a certain
volume, the central volume of distribution (V1 or Vc) (fig1). This volume reflects the volume of the heart, great
vessels and the venous volume of the upper arm. The drug passes through the lungs and eventually meets the
arterial circulation. Immediately however propofol fades to peripheral tissues away from the plasma. Two
groups of tissues, compartments, receive propofol from the central volume of distribution.
13

Fig 1 A three compartmental pharmacokinetic model. The drug is administered in the central compartment (small container in the
middle), from which it is eliminated and distributed to a rapid equilibrating peripheral compartment (right hand container) and a
slow equilibrating peripheral compartment (left hand, largest container). In the y axis the log (plasma concentration) is plotted
against time in the x axis. Figure from S. Shafer25
and hence is called the second compartment (V2) and rapidly equilibrates with the central volume.
i-
3) is much slower.
The volumes and equilibration constants of a three-compartmental pharmacokinetic (PK) model can be esti-
mated by administering an amount of propofol in a standardized population. Subsequently blood samples are
drawn at specific time-points for measuring propofol plasma concentrations. The results are depicted in a log
(plasma concentration) over time graph. Three distinct phases can be distinguished (fig1). The initial distribu-
tion phase following bolus injection describes distribution from plasma to the rapidly equilibrating tissues. A
slower second distribution phase is explained by a movement of the drug into more slowly equilibrating tissues
and a return of the drug from the most rapidly equilibrating tissue. The terminal phase is a straight line when
plotted on a semi logarithmic graph and is often called the elimination phase because the primary mechanism
for decreasing drug concentration during the terminal phase is elimination from the body.
The rates of drug metabolism and distribution can be interchangeably described by rate constants or clearances.
A rate constant describes a proportion of drug in a compartment undergoing a process during a unit of time, and
14

is thus reported with the units min-1
or hr-1
. By convention k10 is used to denote the rate constant for metabo-
lism or elimination. The symbols k12, k21, k13, k31 are used to denote the rate constants for drug transfer from V1
to V2, from V2 back to V1, from V1 to V3, and from V3 back to V1 respectively.
Clearances describe a
are thus ml/min or ml/hr.
For a three-compartmental model it is more difficult to calculate the inter-compartmental rate constants. Anal-
ogous to equation 2 and 3 the equations for a three-compartmental model are:
dx1/dt = I dx2/dt dx3/dt x1k10 equation 5
dx2/dt = x1k12 x2k21 equation 6
dx3/dt = x1k13 x3k31 equation 7
Integration of equations 6 and 7 in equation 5 and rearrangement yields equation 8
dx1/dt = I + x2k21 + x3k31 x1k10 - x1k12 - x1k13 equation 8
Where I is the rate of drug input, x is the amount of drug for a specific compartment and k is a micro-rate con-
stant
The dataset gives rise to a pharmacokinetic model, a mathematical fitting of measured concentrations. The
model not only describes the time course of drug concentration in a studied population but subsequently it can
be used to predict the blood concentration profile of a drug after a bolus dose or an infusion of varying duration
in a subject that corresponds to the typical patient of the original study population.
We developed our own pharmacokinetic model for propofol in children26
. In this example (table 2) V1 is the
central volume for propofol in a 20 kg child. V2 and V3 are the volumes of the second and third compartment.
Cl is the elimination clearance, the amount of the central volume that is cleared from propofol per min. Q2 is an
intercompartmental clearance, the amount of V2 that is cleared from propofol per min. Q3 is the amount of V3
that is cleared from propofol per min.
15

Table 2 The Coppens PK model for propofol as an example. Values are calculated for a 20 kg child
Parameter Units Typical value
V1 L 3,5
V2 L 4,7
V3 L 19
Cl l * min-1
0,79
Q2 l * min-1
2
Q3 l * min-1 0,67
16

Fig 2 BIS Range guidelines. as included in the user guide of BIS XP® (Aspect Medical, MA, USA)
2.3 Measuring cerebral drug effect as a pharmacodynamic end-point
The hypnotic effect of propofol can be measured with bispectral index monitoring (BIS)27,28
. BIS measures a
selected part of a classical EEG signal that is highly associated with sedation/hypnosis, regardless of which
type of agent is used to produce that clinical state. BIS index is a processed EEG parameter derived from mul-
tiple advanced signal processing techniques. The BIS algorithm provides a reliable processed EEG parameter
of anaesthetic and sedative effect29-31
. BIS generates a figure from 0 to 100. The awake patient typically has a
BIS CLINICAL ENDPOINTS &
SEDATION RANGES
CLINICAL SITUATION
100 ---------- AWAKE -------------------------------------- ------------------------------------------------Sedated - Awake or resting state
- Sedated for special procedures; conscious
sedation
- Response to vigorous stimulation during
surgery
- Emergence from general anesthesia
----------------- LIGHT HYPNOTIC EFFECTS--------- Very Low Probability of Recall
------------------------------------------------ Short surgical procedures requiring deep
sedation or light anesthesia
- Results from a multi-center study demon-
strated when the BIS was below 70 there
was very low probability of recall
------------------ MODERATE HYPNOTIC EFFECTS-
Unconscious
-----------------------------------------------
- Maintenance range during general surgi-
cal procedures
- Results from a multi-center study demon-
strated when the BIS was below 60 subjects
were unconscious
40------------ DEEP HYPNOTIC EFFECTS----------- -----------------------------------------------
- High dose opioid anesthesia
- Surgical procedures where deep anesthe-
sia is required
- Barbiturate coma
- Profound hypothermia
0 ----------- EEG SUPPRESSION---------------------- ------------------------------------------------
70
60
17

BIS value of 100. The value drops as the patient falls asleep. BIS values between 60 and 40 are associated with
an appropriate anaesthetic level. Values lower than 40 are deemed as a too deep level of anaesthesia (fig 2).
Anesthetic depth is the result of hypnosis, amnesia, anti-nociception and reflex suppression. Soon after BIS
monitoring was developed many studies appeared in the literature to validate the technique. Correlation studies
try to link depth of anesthesia to specific BIS values. Sebel et al.32
performed a multicenter trial where two
groups of patients were included; in the control group patients were only monitored with BIS, in the treatment
group anesthesia was titrated to a BIS value below 60. Primary endpoint of the study was the rate of patient
movement as response to skin incision. In the control group, the mean BIS value was 66 (±19) and 43% of
patients moved. In the treatment group the mean BIS value was 51 ±19 and only 13% of patients moved on
skin incision. Movement on skin incision is a very rudimentary surrogate of depth of anesthesia. So other au-
thors tried to correlate BIS values with levels of consciousness.
With increasing sedation33
there was a progressive decrease in BIS during sedation with midazolam; Observ-
OAAS/O scores of 5
mean an awake state. OAAS/O of 1 means no response to tactile stimulation. OAAS/O scores of 5 correlated to
BIS values of 95.4 ±2.3, scores of 4 to BIS values of 90.3 ±4.5, scores of 3 to BIS values of 86.6 ±4.6,scores of
2 to BIS values of 75.6 ±9.7 and an OAAS/O score of 1 corresponded with BIS values of 69.2 ±13. During
recovery from midazolam sedation BIS values increased together with OAAS/O scores.
34 compared measured propofol concentrations with BIS in volunteers. The mean propofol concen-
tration to suppress learning by 50% was 0.66 µg/ml. BIS decreased linearly as propofol blood concentration
increased. (r=0.69). Doi et al35
also found a good correlation of BIS values with propofol blood concentrations.
m-
ized trial36
(302 patients) studied patients under routine care versus patients guided under BIS monitoring. BIS
monitoring led to a reduction in propofol requirements and earlier recovery. A meta-analysis of trials37
(1383
day surgery patients) concluded that use of BIS monitoring significantly reduced anaesthetic consumption by
19%, reduced the incidence of nausea and vomiting by 23%, and reduced recovery time by 4 min.
A third kind of studies look at
awareness during anesthesia. For most anesthetists this remains a major objective. Ekman et al38
. did a before
and after comparison of the use of BIS monitoring (4945 patients undergoing general anesthesia with muscle
relaxation, BIS monitored versus 7826 patients not BIS monitored). They found a 5-fold reduction in risk of
awareness, 0.04% vs 0.18%. Myles et al39
. found a reduced risk of awareness by 82% in a study of 2643 adult
patients at high risk of awareness. However in an effectiveness study40
(three hospitals, 21.601 patients) no
significant difference in intraoperative awareness with explicit recall was detected between bispectral index and
anesthetic concentration protocols. It concerned an unselected surgical population.
A Cochrane analysis41
included 31 trials. In studies using clinical signs as control, the analysis demonstrates a
significant effect of the BIS-guided anaesthesia: a risk reduction of intraoperative recall, a risk reduction of
18
Leslie et al

awareness among surgical patients with high risk of awareness (2493 participants; OR 0.24). This effect was
not demonstrated in studies using end tidal anaesthetic gas monitoring as standard practice (1981 participants;
OR 1.01). BIS-guided anaesthesia reduced the requirement for propofol by 1.44 mg/kg/hr (662 participants),
and for volatile anaesthetics (desflurane, sevoflurane, isoflurane) by 0.14 minimal alveolarconcentration equiv-
alents (MAC) in 928 participants. Irrespective of the anaesthetics used, BIS reduced the following recovery
times: time for eye opening (2446 participants; by 2.14 min), response to verbal command (777 participants; by
2.73 min), time to extubation (1488 participants; by 2.87 min) and orientation (316 participants; by 2.57 min).
BIS shortened the duration of postanaesthesia care unit stay by 7.63 min in 1940 participants.
2.4 Linking kinetics and dynamics using the concept of the effect-site concentration :
The standard pharmacokinetic model assumes that after bolus injection there is a complete mixing within the
central compartment resulting in the peak plasma concentration occurring at time 0. Following bolus admin-
istration it takes 30 to 45 seconds for the drug to pass from the venous circulation to the arterial site.
However a hypnotic drug like propofol does not exert its effect in the arterial circulation. Propofol exerts its
effect in the brain and so additional time is required for the drug to reach the target organ, penetrate the tissue
and induce an intracellular process which will lead to the onset of drug effect (i.e. unconsciousness). This delay
between peak plasma concentration and peak concentration in the brain is called hysteresis (fig 3).
The concentration of propofol in the brain can not be measured in every day clinical practice. In experimental
conditions microdialysis techniques can be used when brain tissue becomes or is made accessible.
Microdialysis probes measure free drug concentrations, which from a pharmacodynamic point of view is the
concentration surrounding receptors42
.
However we can measure the hypnotic effect of propofol, and hence the time course of drug effect can be char-
acterized. Knowing the time course of drug effect, the apparent rate of drug inflow into and from the effect site
can be characterized. The time course of drug effect is a reflection of the time course of the effect site concen-
tration.
19

Fig 3 Hysteresis. The anaesthetic effect is measured continuously. Estimated effect-site concentration, Ce is calculated from the
estimated plasma concentration and different ke0 e0 of 0.38 min-1 there is a collapse of the hysteresis loop. Figure from
Absalom et al43
The effect site44,45
is the hypothetical compartment that mathematically links the time course of plasma drug
concentration to the time course of drug effect and ke0 is the rate constant of drug elimination from the effect
site (fig 4). The ke0 defines the proportional change in each unit of time of the concentration gradient between
plasma and effect-site. The effect-site compartment is assumed to have negligible volume. Hence uptake of
drug into the effect-site should have negligible influence on the plasma concentration of a drug, so that the
calculated plasma concentration profile following an infusion of drug is identical for any value of ke0.
Fig 4. A three compartmental pharmacokinetic-pharmacodynamic model extended with an effect-site compartment. Figure from
Mani46
20

An accurate estimation of ke0 demands an integrated pharmacokinetic-dynamic study combining blood sam-
pling with frequent measurement of drug effect, resulting in an overall model for the dose response behavior of
the drug.
Mathematically the effect-site concentration is the convolution of an input function (in this case, the plasma
concentration over time) and the disposition function of the effect-site.
Ceffect-site(t)=Cplasma(t) * Deffect-site(t) equation 9
The disposition function of the biophase is typically modeled as a single exponential decay:
Deffect-site(t)=ke0 e-ke0t
equation 10
The mono-exponential disposition function is simply an additional compartment that is connected to the central
compartment.
We cannot measure directly the Ceffect-site or Deffect-site but we can measure the drug effect. Knowing that the
observed drug effect is a function of the drug concentration in the effect-site, it is possible to predict the drug
effect as:
Effect=fPD (Cplasma(t)*Deffect-site(t), PPD, ke0) equation 11
Where fPD is a pharmacodynamic model (typically sigmoidal in shape), PPD represents the parameters of the
pharmacodynamic (PD) model and ke0 is the rate constant for equilibration between plasma and the effect-site.
Nonlinear regression programs are used to link values of PPD and ke0 that best predicts the time course of drug
effect. This method is called loop collapsing (fig 5).
21

If no integrated pharmacokinetic-dynamic model exists, the time to peak effect after a bolus injection can be
used to recalculate ke0 using the pharmacokinetic model to yield the correct time to peak effect. After a
propofol bolus there is a rapid increase in plasma concentration followed by a tri-exponential decline. As long
as the plasma concentration of propofol is greater than the concentration in the effect-site, the effect-site con-
centration increases. After a bolus dose the maximum effect site concentrations occurs at the point where the
plasma and effect-site concentration curves cross (fig 6). As the hypnotic effect of propofol is determined by
the effect-site concentration, the time delay between a bolus dose injection and the time at which the plasma
and effect- (TTPE).
22

Fig 5 : Hysteresis loop collapsing: broken lines represent calculated effect-site concentrations, circles are observed measures of
effect, full lines are plasma concentrations, an effect-site concentration vs effect hysteresis loop is generated by plotting each
observed effect against the effect-site concentration predicted for the same time and connecting these points (by line segments) in
time order; an effect versus effect site concentration curve is obtained for the trial ke0. The final ke0 estimate is the value that best
collapses the hysteresis loop in the effect versus effect-site concentration curve with superimposition of both limbs of the curve.
Figure from Bührer47
23

Constructing curves for estimated effect-site concentrations with different ke0 and comparing them with the
curve for the measured effect allows to choose the ke0 value that best predicts the time course of effect.
Fig 6 Estimation of ke0 using TTPE methodology. Estimated plasma concentrations and a measure of anaesthetic effect are plot-
ted over time. The estimated effect-site concentrations resulting from different ke0 values are then calculated and plotted, to de-
termine which ke0 value is associated with a peak effect-site concentration that matches the peak clinical effect. Figure from
Absalom43
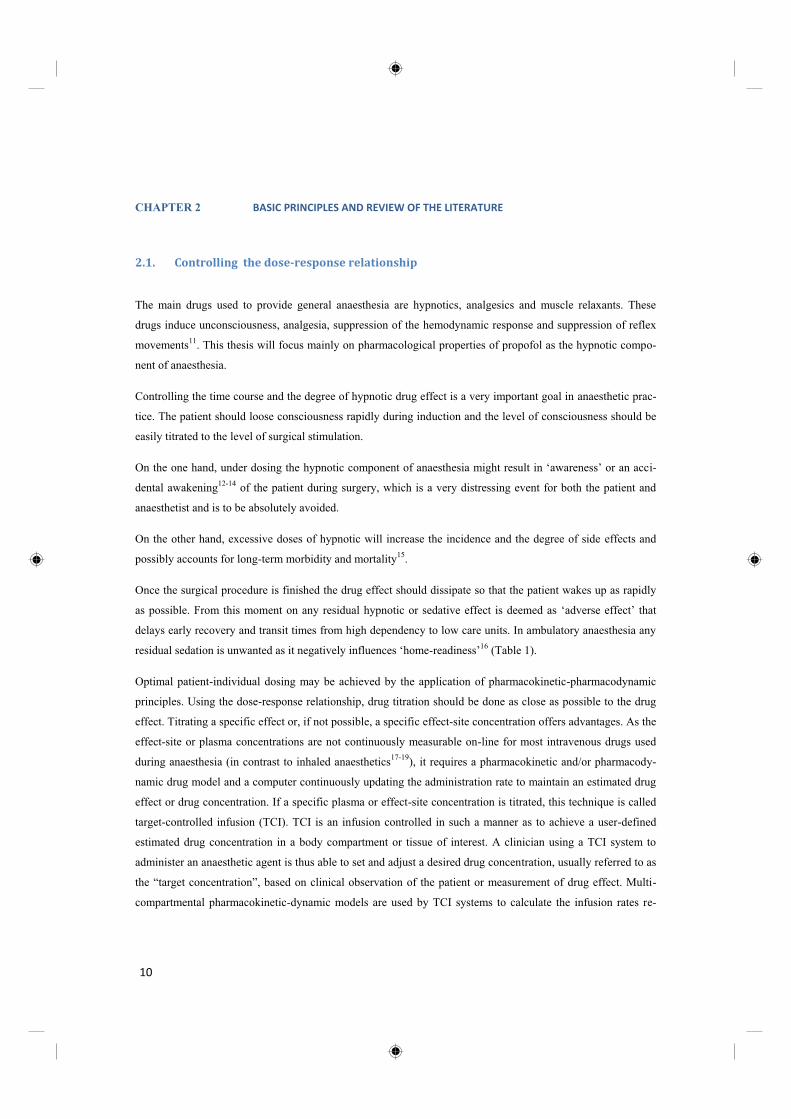
When targeting the effect site, the TCI system manipulates the plasma concentration to achieve the effect-site
concentration as rapidly as possible, but without an overshoot at this effect-site level. The magnitude of the
plasma concentration overshoot estimated by the system depends critically on the ke0 and also on the estimated
rate of decline in the plasma concentration. If a slower ke0 is used, a greater overshoot in the peak plasma con-
centration will be required to produce a larger concentration gradient between the blood and effect-site and
thereby to hasten plasma-effect-site equilibration.(Fig 7)
24
Fig 7 Effect-site targeted TCI for propofol (Marsh model), showing the effect of the choice of ke0. If a slow ke0 is used, then a
large overshoot in plasma concentration will result when the target concentration is increased. Figure from Absalom43
25
2.5 Non Linear Mixed Effects Modeling
Basically this thesis handles the time course of propofol concentrations in plasma or effect site in different
study populations. Also the nature and magnitude of drug effect in relation to the concentration is being inves-
tigated.
Classical pharmacology tends to describe the dose-response relationship in a group of patients without taking
into account the intra-individual and/or inter-individual physiological and pharmacological variation. Starting
from measured plasma concentrations, data are pooled together as if all doses and all observations describe a
to every individual subject; sample values from significant outliers will have a significant effect on one or more
of the average parameters in the final model. This approach suggests that many samples are taken in a large
study population.
Population pharmacokinetics study the variability in drug concentrations among individuals who are the target
patient population receiving clinically relevant doses of a drug of interest. Certain patient demographics (e.g.
body weight, gender, height, hair color48
(!?) functions (e.g. cardiac output, liver and kidney
-concentration
relationships.
An advantage of population pharmacokinetic modeling is its ability to analyze sparse data sets (sometimes only
one concentration measurement per patient is available). Basically, there are two approaches to population
modeling, defined as the standard two stage approach and the non-linear mixed effect approach.
In the standard two stage approach, as a first step, the individual concentration-time profile is appreciated to
generate parameters as volumes and clearances. In a second step, these parameters are summarized by calculat-
ing the mean, median and the variability between subjects (SE or IQR). A major drawback of this approach is
that it requires a relatively high number of samples in each individual, while each patient has to contribute
roughly the same number of samples. Moreover it is more difficult to distinguish between inter-individual (var-
iability between subjects) and intra-individual or residual variability (variability within one subject, measure-
ment error and model misspecification) and as a result inter-individual variability is often overestimated.
The population approach using non-linear mixed effects modeling to obtain pharmacokinetic parameters is the
preferred approach, because the analysis is based on simultaneous analysis of all data of the entire population
while still taking into account that different observations come from different patients49
. Both the inter-
individual and intra-individual variability are separately estimated in the dataset using this approach. The term
-linear mixed effects modeling represents a mixture of fixed and random effects. For the fixed
effects, a structural model describing the PK or PD is chosen (eg a three compartmental model for PK or an
Emax model for PD). The random effects quantify the variability that is not explained by the fixed effects. These
26

random effects include inter-subject and intra-subject random variability, which are both simultaneously and
separately estimated.
In general model building requires three different steps:
A structural model (fixed effects) has to be designed
A statistical sub-model (random effects) has to be developed
A covariate sub-model has to be identified
Fixed effects
The structural model contains descriptors of a process (disposition of propofol in the body, elimination, clear-
ance, volume of distribution ) (e.g. a three compartmental model for PK or an Emax model for PD) that vary
among individuals. The population values for these parameters are called typical values and are expressed as
individuals that cause these parameters to vary across the population
population. Covariates can be demographic (age, body weight, gender), pathophysiological (renal or hepatic
function) and genetic/environmental. For example, if we know that clearance is proportional to weight, then
we simply express clearance in the model as a scalar times weight. Weight has a fixed effect on clearance.
Random effects
After selecting the structural model, the statistical sub-model, which accounts for the inter-individual as well as
the residual variability is chosen and tested. The random effects quantify the variability that is not explained by
the fixed ef
sources of random variability when dealing with biological data.
One kind of random effects is the unexplained differences between individuals. This is called inter-individual
or between subject variability. It is often assumed that the variability between subjects follows a normal distri-
I TV . e i equation 12
i TV is the typical value of the parameter in the population and
i2.
27

The second source of variability is the residual error This is the difference between the prediction of
- within-subject
variability. This is the result of noise in the dataset, error in the assay, errors in drug dose, etc (fig 8).
Yobs equation 13
Where Yobs is the observed value of Y, TY is the true value of Y and is the error, a normally distributed
random variable with a mean of zero and a variance of 2.
Fig 8 In a, the inter-individual variability among three individuals who received the same dose is shown. b presents the intra-
individual or residual variability by showing the concentration time profile after repeated administration. Figure from De Cock49
In this thesis NONMEM was used to explore the pharmacokinetic-dynamic relationship between BIS meas-
urements (measures of cerebral hypnotic drug effect (=dependent variable)) and the calculated effect-site con-
centration of propofol (= independent variable). This relationship classically is described by a sigmoidal Emax
model.
28

This model is determined by four variables: the baseline effect (E0 ), the maximum effect (Emax), the effective
dose compatible with 50% of the maximal effect (ED50 ), and the slope of the sigmoidal curve ( ).
Effect = E0 + (Emax – E0 ) equation 14
Additionally we quantified the intra- and inter-individual variability, by estimating the respective variances for
these random effects. Finally NONMEM provides a tool (‘objective function’) that allows to compare several
estimated models on the same dataset, in order to determine the most optimal parameter estimation. Greatly
simplified, the ‘objective function’ value should be decreased or minimized, as it reflects the mathematical
process that aims to minimize the -2 log likelihood of the fit of the model to the observed dataset. We used this
method in our studies to find the optimal set of parameters for describing a sigmoidal Emax model with our
dataset.
2.6 Accuracy analysis of a TCI model
Acceptance of target-controlled drug delivery of propofol requires evaluation of both accuracy and outcome
among patients in whom TCI has been used. Sources of inaccuracy with pharmacokinetic model-driven devices
include software and hardware problems, and pharmacokinetic variability. Problems with software and hard-
ware became rather exceptional. Biologic variability still is the major source of inaccuracy. Firstly, the phar-
macokinetic model may be inaccurate, resulting in a difference between the predicted and the observed concen-
trations in an individual (residual error, noise). Individuals are far more complex than implied by simple com-
partmental models, and thus no such model can precisely predict the concentrations. Secondly the pharmacoki-
netic parameters of a patient may differ from the model, simply as a result of ‘between-subject’ variability, due
to intrinsic biological inter-individual differences.
Accounting for as much as possible specific patients characteristics, i.e. covariates, is an attempt to compensate
for biologic variability. The ultimate model still has to be developed50
.
The variability with TCI technology will always be less than the variability observed after a single manual
bolus injection, or a continuous infusion at a fixed rate. The mechanism by which a TCI device decreases bio-
logic variability is by incorporating patient covariates such as weight, height, sex, liver function, cardiac out-
put,…The patient-specific model is subsequently used to control the drug administration according to the char-
acteristics of the patient. Another mechanism by which TCI decreases variability is by accounting for drug
accumulation in peripheral tissues. Targeting a specific concentration typically results in a steady concentra-
29

tion. The choice for a fixed infusion rate results in increasing plasma concentrations over time. Hu51
et al. simu-
lated a 10 mg bolus of propofol, a continuous infusion of 10 mg/min or a TCI regimen with a target of 1µg/ml.
Plasma propofol concentrations were simulated with the Schnider model. Hu showed that the variability in
estimated concentrations following bolus administration was twice the variability of concentration achieved
with conventional infusion or TCI administration.
Performance of a pharmacokinetic model is the ability to estimate a specific drug plasma concentration. Nu-
merically, the primary concern is how far the measured concentration deviates from the predicted concentra-
tion. A classical graphical representation of model performance is an XY plot depicting predicted versus meas-
ured plasma drug concentrations or the relationship measured/predicted drug concentration ratio versus time.
The most straightforward measure of good performance would be to simply estimate the size of the typical
miss of the measured concentration from the targeted or predicted concentration. The smaller the size of the
typical miss, the greater the accuracy of the TCI system, and the closer the predicted concentration is to the
measured concentration.
The basis for quantification of performance is: the percentage performance error (PE):
equation 15
Where Cpij is the jth prediction of the plasma drug concentration in the ith patient and Cmij the jth measure-
ment of the plasma concentration in the ith patient.
Subsequently four measures are used to quantify the predictive performance of TCI systems and PK/PD mod-
els: median absolute performance error (MDAPE), median performance error (MDPE), divergence and
wobble52.
The first measure of TCI/model performance, reflecting the inaccuracy, is the median absolute performance
error
equation 16
Where Ni is the number of performance errors in the ith individual.
Another characteristic of TCI performance is whether the device produces measured drug concentrations that
are systematically above or below the targeted concentrations, this is termed ‘bias’. Bias is measured by the
30

median prediction error (MDPE). MDPE is a signed (positive or negative) value and thus represents the direc-
tion (over- or underprediction) of the performance error.
equation 17
Some individuals may differ from the general patient population and show a gradual worsening (or improve-
ment) of TCI performance over time. This is ‘divergence’, the performance of the TCI deteriorates (or im-
proves) systematically with time.
Divergence is calculated for each individual as the slope of the linear regression of that individual’s absolute
performance errors over time. A negative value indicates that the measured concentrations are converging with
the predicted values over time. A positive value indicates the opposite.
Wobble is a measure of the variability of the PEij in ith individual. Wobble measures the total intra-individual
variability in performance error.
Wobblei =median absolute deviation of j=1,…,Ni } from MDPEi equation 18
As an example of how PK model performance is expressed an article by Sepulveda is discussed. Sepulveda53
and colleagues investigated the performance of different currently available PK models for propofol in chil-
dren. In a group of 41 children (3-26 months), they administered a bolus of 2,5 mg propofol, followed by an
infusion of 8 mg/kg/h. Arterial blood samples were collected at regular intervals (fig.9 a.). For different PK
models plasma concentrations were estimated by simulation using each individual weight and dose profile. For
each measured plasma concentration the corresponding estimated plasma concentration was used to calculate
the PE. For any individual this results in an MDPE and MDAPE. Overall for the whole group of patients this
results in an MDPE and MDAPE for the model. One of the models investigated was the Coppens model.
MDPE and MDAPE was calculated after bolus administration, during infusion and recovery. The Coppens
model resulted in a MDPE of -13,-11,-32, and in a MDAPE of 23, 15 and 36, after bolus administration, during
infusion and recovery respectively. MDPE and MDAPE during the test period for the model was -16,47 and
21,01 (fig 9). The negative value for MDPE reflects an overestimation of the model.
31

Fig. 9 a. Measured arterial propofol concentration versus time for each individual.
Fig 9 b. Time profile of the measured/predicted (with Coppens) propofol plasma concentrations for each individual. The dotted
lines represent an acceptable range. The bold line indicates perfect prediction. MDPE = median performance error, MDAPE =
median absolute performance error. Figure from Sepulveda53
Recovery
Infusion
Bolus
32
2.7
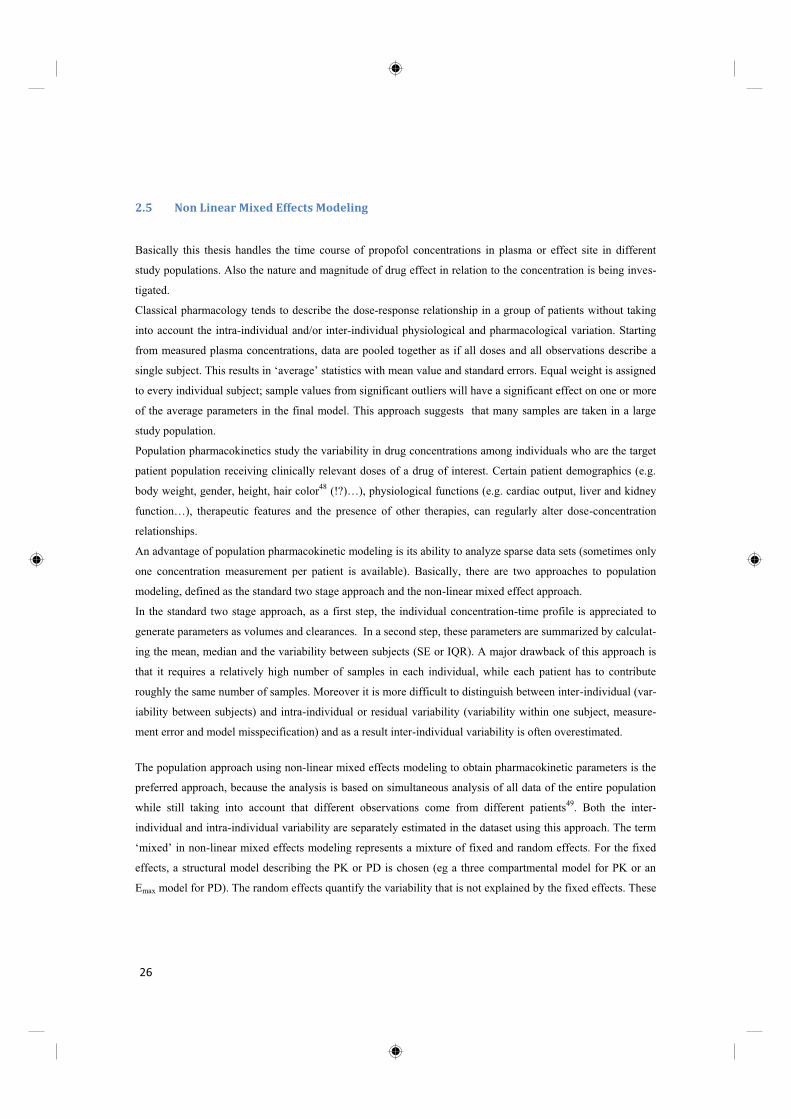
For propofol various multi-compartmental pharmacokinetic-dynamic models have been published. Coetzee et
al.54
compared the accuracy of some of the models published before 1995 and found that propofol TCI using
the model published by Marsh resulted in acceptable performance (MDPE -7%; MDAPE18%).
The Marsh55
model for propofol was first published in 1991. Compartmental volumes (V1 , V2 and V3 ) and
clearances are proportional to body weight, whereas rate constants for redistribution are fixed. The Marsh mod-
el was adapted from the Gepts56
three-compartmental model, developed from a study involving three groups of
six patients who each received constant rate infusions of propofol at either 3,6 or 9 mg kg-1
h-1
.
The Marsh model was incorporated in the first commercially available TCI system. This device, the
Diprifusor®, was originally developed for targeting plasma concentration of propofol. Early models only dis-
played the target and the estimated plasma concentration. The Diprifusor® microprocessor controlled a syringe
recognition system that only allowed the use of glass pre-filled 50 ml syringes of 1% or 2% propofol
(Diprivan® 1%TM or Diprivan® 2%TM, AstraZeneca). The major drawback of the Marsh model is the lack of
effect compartmental information and the fact that weight is the only covariate.
A ke0 value of 0.26 min-1
was used with the Marsh model in first generation TCI pumps, to enable effect-site
estimations to be made and displayed as additional information. The data on which this ke0 was based were
never published in the literature, although it is quite similar to the value of 0.2 min-1
found by Billard et al.57
Struys and colleagues published evidence that a ke0 of 1.2 min-1
used in conjunction with the Marsh pharmaco-
kinetic parameters more accurately predicted the time course of clinical effect (BIS) than the ke0 of 0.26 min-1
.
A ke0 of 1.2 min-1
used with the Marsh model results in an estimated time to peak effect of approximately 1.6
min, which is consistent with the findings of other groups. This combination is used in the Base Primea TCI
system4 and results in more gentle manipulations of the plasma concentration when effect-site targeting mode
is used. In the pump, it is defined as the
Schnider58
et al. evaluated age, height, weight and lean body mass (LBM) as covariates in a new combined
pharmacokinetic-dynamic three-compartmental model. The large variability of the study population (18-81
years and 44-123 kg) provides a wide applicability of the model.
The Schnider model has fixed values for V1,V3,k13, and k31, adjusts V2, k12, k21, for age and adjusts k10, accord-
ing to total body weight, lean body mass (LBM), and height. In plasma targeting mode, the small, fixed V1
results in very small initial doses on starting the system. The Schnider model however also describes the dose-
effect relationship for propofol and hence has a pharmacodynamic component.
33

Schnider used semi-
data recorded from the volunteers in his study, and used this to track the time course of the pharmacodynamic
effect of propofol. The median TTPE of a propofol bolus, determined by this parameter, was 1.69 min. Based
on visual inspection of the EEG the TTPE ranged from 1.0 to 2.4 min (median 1.6 min). When a TTPE of 1.6
min was used to calculate the keo for each of their volunteers, the median keo was 0.456 min-1
. The authors con-
cluded that a keo of 0.456 min-1
used with the pharmacokinetic parameters determined in the same group of
volunteers provided the best description of the time course of clinical effect of propofol.
Most pediatric anaesthetists still prefer inhalation anaesthetics for both the induction and maintenance of anaes-
thesia because of the ease of use and the rapid reversibility59
. Although, propofol is infrequently used in chil-
dren, propofol anaesthesia may present some clinical advantages: reduced incidence of postoperative nausea
and vomiting60,61
, decrease in emergence agitation compared to volatile agents62,63
. Total Intravenous Anaes-
thesia (TIVA) has demonstrated advantages in ambulatory surgery for short procedures but also for sedation
and spontaneous breathing procedures. In some procedures where the airway is manipulated by the surgeon or
pediatrician, the use of intravenous anaesthesia is obligatory as administration of inhalational anaesthetic is not
possible such as in situations where jet ventilation is performed or intermittent manual ventilation by face
mask64
.
In patients who are at risk of malignant hyperthermia propofol is the only safe option65,66
. Environmental issues
could convince the anesthesiologist to use intravenous anesthesia: inhalational anesthetics are detrimental for
the ozon layer67
. Nitrous oxide is partially responsible for the greenhouse effect68
.
Unfortunately intravenous induction of anesthesia with propofol causes pain, apnea and occasionally hypoten-
sion in children. Prolonged administration of propofol has resulted in severe life threatening side-effects and
death associated with rhabdomyolysis, lactic acidosis, myocardial toxicity and malignant dysrythmias (propofol
infusion syndrome)69-75
. This unpredictable and potentially lethal complication of propofol resulted in some
reluctance towards the use of propofol for long term sedation in children.
34

Table 3 Pharmacokinetic models for propofol in adults: Marsh and Schnider
Two pharmacokinetic models for propofol in children are available in clinical TCI systems.
In 1999 Kataria76
et al. published a three compartmental model in a healthy pediatric population between 3 and
11 years. 658 venous plasma samples were taken. In this model compartmental volumes are a linear function of
body weight, while rate constants are fixed. They incorporated in their model various covariates (age, weight,
gender and body surface area) to investigate the improvement of its accuracy. Weight adjusting the volumes
and clearances significantly improved the accuracy of the pharmacokinetics. Age as an additional covariate for
the volume of the rapid distribution compartment only slightly improved the model and therefore was ultimate-
ly left out the final model. The weight proportional model predicts that children will need infusion rates 50-
100% higher than adults to maintain any desired propofol concentration during the first 30 minutes.
Murat77
et al found that the pharmacokinetics of propofol in children aged 1-3 years of age differ from those
reported in older children and adults. They reported poor prediction of the Kataria model in small children.
Marsh Schnider
General
model
70 kg
individual
General
model
70 kg male
170 cm
height
V1
V2
V3
K10 min-1
K12 min-1
K13 min-1
K21 min-1
K31 min-1
Ke0 min-1
TTPE min
0.228 litre kg-1
0.463 litre kg-1
2.893 litre kg-1
0.119
0.112
0.042
0.055
0.0033
0.26
4.5 min
15.9 litre
32.4 litre
202.0 litre
0.119 min-1
0.112
0.042
0.055
0.0033
0.26
4.5
4.27 litre
238 litre
0.196
[1.29
0.0035
0.456
1.69
4.27 litre
24.0 litre
238 litre
0.384 min-1
0,375 min-1
0.196
0.067
0.004
0.0456
1.69
35

The larger central compartment together with the higher clearance explain the increased requirements for
propofol for both induction and maintenance of anaesthesia in young children compared to older children; the
latter will also require more propofol than adults. Age-related pharmacokinetic differences may explain why
adult pharmacokinetic model-driven algorithms systematically overpredict the measured blood concentrations
in children aged 2-10 years. Our group was the first to prospectively validate the Kataria model.
In 1991 Marsh et al. studied the accuracy of their adult pharmacokinetic model (as used in Diprifusor®) in 20
children55
. They found a consistent overprediction of the blood concentrations; measured blood concentrations
were significantly less than those predicted by the model. The Marsh model was then revised to produce a
model specific for children: the size of the central volume was increased approximately by 50%, but remained a
linear function of body weight. The clearance of propofol was found 25% higher compared to adults. The ini-
tial bolus should be increased by 50% compared to adults and maintenance infusion at equilibrium should also
be increased by 25%. This new model performed better when tested prospectively in 10 children. Marsh and
t-
ics of propofol differ between children and adults.
Marsh adult Marsh pediatric
Vc ml kg-1 228 343
K10 min-1 0,119 0,1
K12 min-1 0,112 0,0855
K13 min-1 0,0419 0,021
K21 min-1 0,055 0,033
K31 min-1 0,0033 0,0033
Table 4 Marsh adult versus pediatric PK model for propofol
Short et al78
evaluated prospectively the Marsh model in 10 Chinese children aged 4-10 yr and found a lower
precision and a large negative bias. In their revised model (20 Chinese children) the volume of the central com-
partment is larger than that of Marsh et al.
Schüttler79
analyzed 4112 propofol plasma concentrations of 270 individuals (age 2-88 years). The data came
from 9 studies covering pediatric, adult and geriatric patients. Propofol was administered as a bolus or infu-
sion, and venous or arterial blood samples were drawn. The effect of age, weight, type of administration and
sampling site were investigated. The inclusion of age and weight as covariates improved their model.
36

Weight was found to be a significant covariate for elimination clearance (fig 10), the two inter-compartmental
clearances and the volumes of the central compartment and the volume of V2. Nearly all parameters were found
to alter with bolus administration compared to infusion data. The model described more accurately the pharma-
cokinetics when sampling site was accounted for in the equation for Cl2 . Also V1, V2, and Cl2 were larger after
bolus then after infusion. Cl3 was decreased.
Fig 10 elimination clearance as a function of body weight Figure from Schüttler79
The final Schüttler model was able to describe the pharmacokinetics with sufficient precision for concentra-
tions below 8 µg/ml. At higher concentrations the model underestimates the plasma concentration; the meas-
ured concentrations are systematically higher. This underestimation may indicate nonlinear pharmacokinetics
of propofol, in the sense that the total body clearance decreases with increasing concentration. The authors
suggest that this may be explained by the fact that propofol reduces liver blood flow, particularly at high con-
centrations such as shortly after bolus administration. This also reflects the problem of the assumption of in-
stantaneous mixing of propofol in the initial distribution volume.
The Paedfusor is a prototype target-controlled infusion system developed by Absalom80
et al in 1998 using a
preliminary model developed by Schüttler before the publication of his final model. In the Paedfusor the central
compartment volume and clearance have a nonlinear correlation with weight, and the size of the central com-
partment is quite larger compared to Marsh pediatric and Schüttler model. To validate the model 29 children
aged 1-15 years were investigated. As the children were scheduled for cardiac surgery or cardiac catheteriza-
tion, the researchers were able to obtain arterial samples (9 per patient). The predictive indices of median per-
formance error (MDAPE) of the Paedfusor system, and median absolute performance error were found to be
4.1% and 9.7% respectively and the median value for wobble was 8.3%.
37

All the pediatric models listed in table 5 show distribution volumes two times greater than in adult models with
a wide inter-individual variability and a moderate increase in the metabolic clearance with moderate inter-
individual variability81
Marsh Kataria Short Schüttler Paedfusor Schnider
V1 litre
V2 litre
V3 litre
Cl1 l . min-1
Cl2 l . min-1
Cl3 l . min-1
K10 min-1
K12 min-1
K13 min-1
K21 min-1
K31 min-1
6.8
17.6
40.68
0.68
0.58
0.14
0.1
0.0855
0.021
0.033
0.00351
7.6
17.4
122.34
0.74
1.26
0.5
0.097
0.166
0.066
0.072
0.0041
8.6
11.13
68.8
0.83
1.22
0.34
0.0967
0.1413
0.0392
0.1092
0.0049
7.6
20
266
0.56
1.04
0.46
0.073
0.135
0.059
0.052
0.0017
9.2
19
117.1
0.58
1.05
0.39
0.063
0.114
0.042
0.055
0.0033
4.27
37.3
238
0.37
2.42
0.83
0.086
0.565
0.196
0.065
0.0035
Table 5 Comparison between the variables calculated with the different pediatric models and the Schnider model for a 6 year
old child (20 kg)
The original analyses leading to the derivation of the Kataria and Paedfusor models were based on pharmaco-
kinetic data only. However, values for ke0 and the blood-brain equilibration rate constant have been retrospec-
tively generated for both models using the time to peak effect technique.
Traditionally target-controlled infusion in children was limited to plasma targeted infusion. Targeting the effect
site concentration may offer advantages. In adults several studies have demonstrated that a TCI device control-
ling the concentration at the effect site, produces a desired time course of drug effect more efficiently than a
device that only controls plasma concentration2,4,82
.
Muñoz83
et al. determined the tpeak of propofol in children. As Schnider found that tpeak is higher with increasing
age, Muñoz hypothesized a shorter tpeak in children. Additionally they calculated plasma effect site equilibra-
tion rate constant, ke0, for propofol both in children and adults, using the time to peak effect method published
by Minto84
et al. The authors used auditory evoked potentials (AEP) as a measure of the hypnotic effect of
38

propofol. central nervous system (cerebral cortex).
generated as a response to an acoustic signal or sound through the ascending auditory pathway. This has been
extensively investigated as another measure of anaesthetic effect of hypnotics.
The pharmacokinetic parameters were based on the Kataria and Paedfusor (Schüttler preliminary) model for the
pediatric patients and the Schnider model for the adult patients.
They observed a tpeak of 80 s in adults and 132 s in children.Using the corresponding PK model they estimated a
median ke0 of 0.56 min-1
in adults (Schnider) and a median ke0 of 0.41 min-1
(Kataria) or 0.91 min-1
(Paedfusor)
in children. This results in a predicted peak effect of propofol occurring significantly later in children compared
with adults: the mean tpeak after a submaximal dose of propofol in adults is 82 ± 2s versus 131 ± 25s (Kataria)
or 128 ± 3s (Paedfusor) in children. There is a good correlation between observed and estimated tpeak .
Fig 11. A-Line ARX index (AAI) values after propofol (thick line) of an adult (upper graph) and child (lower graph). AAI re-
cordings have been turned upside-
plasma (Cp) and effect site (Ce) concentration of propofol after 100-mg and 60-mg bolus doses in the adult and child, respective-
ly. In the adult, Cp and Ce have been estimated with the parameters of Schnider and the individual plasma effect site equilibration
rate constant (0.502 min-1). In the child, Cp and Ce have been estimated with the parameters of Kataria and the individual plasma
effect site equilibration rate constant (0.229 min-1). Ce s peak 6 s earlier than time to peak effect measured from the AAI record-
ing because we subtracted the 6-s delay in the signal of the monitor for calculation of Ce peak. Figure from Munoz 83
Rigouzzo85
et al. tried to identify the best model to describe pharmacokinetics and pharmacodynamics of
propofol in children. Children were treated with plasma target controlled infusion based on the Kataria model,
adults with the Schnider model. They also measured BIS values during induction. They simulated several
39

pharmacokinetic models in children: Kataria, pediatric Marsh, Schüttler and Schnider. The relationschip be-
tween BIS values and the predicted concentrations were analyzed as the basis for pharmacodynamic variables:
the time to peak effect, Tpeak, ke0, Ce50 .
They identified the Schnider model for adults as the model that best predicted concentration/effect relationships
in prepubertal children. The Schnider model is unique in that both age and lean body mass are included as co-
variates, thus allowing a more precise tailoring of individual predicted propofol concentrations. In the same
study, puberty as a covariate, further improved the model. The time to peak effect is shorter in children (0.71
min vs 1.73 min in adults).The ke0 is higher in children than in adults (1.17 vs 0.375). The Ce50 is approximately
20% higher in children. This could reflect the fact that there is a lower sensitivity for propofol in children ver-
sus adults. Venous blood samples were drawn to analyse the pharmacokinetic performance. The pharmacoki-
netic predictive performances of Kataria and Schnider model in children were low.
Jeleazcov et al86
. also found PD parameters to be age dependent: ke0 decreased with age, tpeak increased with
age. Indeed growth and maturation are likely to induce changes on PK and PD characteristics. Also in adults it
has been shown that the required propofol concentration decreases with increasing age87
. However in the previ-
ous studies PD parameters were calculated, starting from estimated in stead of measured plasma concentrations
with possible bias in resulting parameters.
We performed our own PK/PD model for propofol in children and compared its performance to the existing
models26
. We made use of blood samples and BIS to correlate propofol dose to effect and for that reason our
PD parameters possibly may be more accurate. Results are shown in chapter 5.
40

Dataset N sampling Age yr Weight kg ref
Coetzee Validation study 30 patients arterial 21-58 42-38 54
Gepts 16 patients arterial 25-65 48-84 56
Kataria 53 patients venous 3-11 15-60 76
Schnider 24 volunteers arterial 18-81 44-123 58
Coppens 28 patients venous 3-11 15-54 26
Marsh 37 patients venous 2-17 12-54 55
Billard 51 patients venous 26-69 40-89 57
Struys 10 volunteers arterial 22-48 51-86 102
Short 10 patients 4-10 78
Short revised 20 patients 78
Schüttler 270 pat/vol art/venous 2-88 12-100 79
Absalom 29 patients arterial 1-15 5-53 80
Table 6 PK models for propofol
2.8 Front-end kinetics and re-circulatory models
The drugs we use in anesthesia typically have a rapid onset of effect ( e.g. hypnotics, opiates ) and have a low
margin of safety (depression of the cardiovascular and respiratory system !). Furthermore there is a large inter-
individual variability both on a pharmacokinetic and pharmacodynamic base. The effects appear rapidly (se-
conds to minutes after injection) but in contrast traditional pharmacokinetic models are based on blood samples
that are drawn after maximal or peak effect occurred. Understanding the pharmacokinetics of early drug distri-
bution is essential for explaining the variability in response.
41
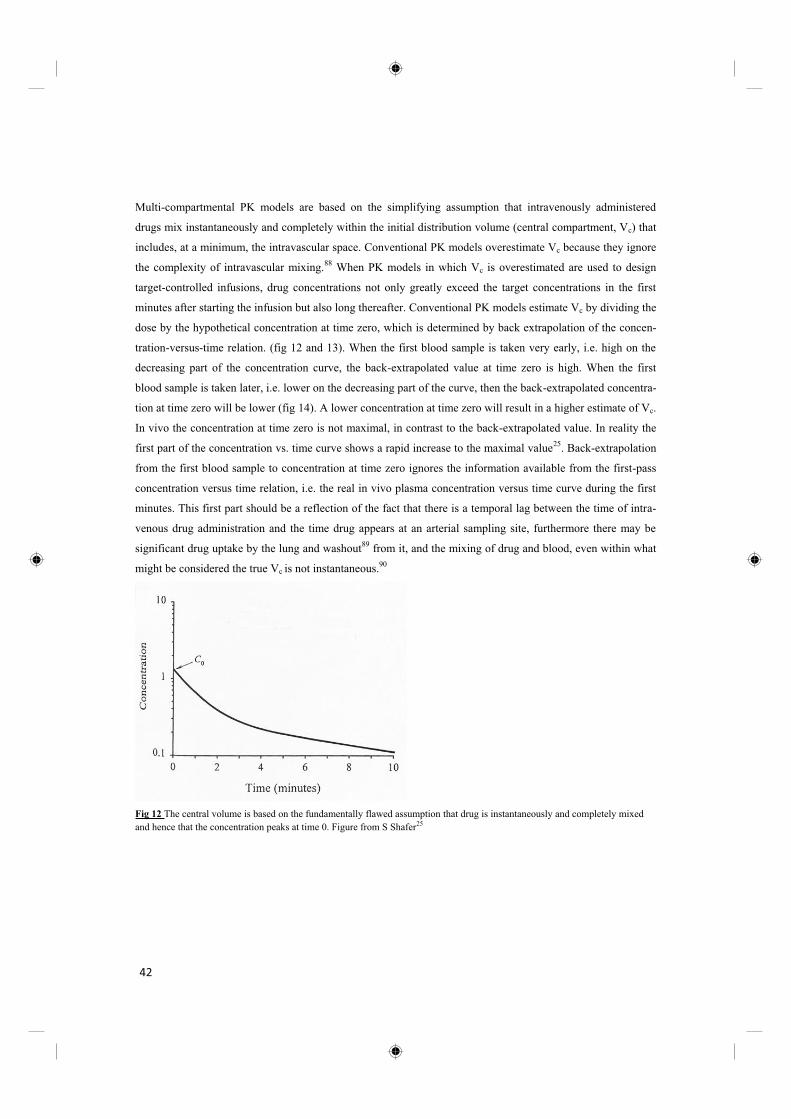
Multi-compartmental PK models are based on the simplifying assumption that intravenously administered
drugs mix instantaneously and completely within the initial distribution volume (central compartment, Vc) that
includes, at a minimum, the intravascular space. Conventional PK models overestimate Vc because they ignore
the complexity of intravascular mixing.88
When PK models in which Vc is overestimated are used to design
target-controlled infusions, drug concentrations not only greatly exceed the target concentrations in the first
minutes after starting the infusion but also long thereafter. Conventional PK models estimate Vc by dividing the
dose by the hypothetical concentration at time zero, which is determined by back extrapolation of the concen-
tration-versus-time relation. (fig 12 and 13). When the first blood sample is taken very early, i.e. high on the
decreasing part of the concentration curve, the back-extrapolated value at time zero is high. When the first
blood sample is taken later, i.e. lower on the decreasing part of the curve, then the back-extrapolated concentra-
tion at time zero will be lower (fig 14). A lower concentration at time zero will result in a higher estimate of Vc.
In vivo the concentration at time zero is not maximal, in contrast to the back-extrapolated value. In reality the
first part of the concentration vs. time curve shows a rapid increase to the maximal value25
. Back-extrapolation
from the first blood sample to concentration at time zero ignores the information available from the first-pass
concentration versus time relation, i.e. the real in vivo plasma concentration versus time curve during the first
minutes. This first part should be a reflection of the fact that there is a temporal lag between the time of intra-
venous drug administration and the time drug appears at an arterial sampling site, furthermore there may be
significant drug uptake by the lung and washout89
from it, and the mixing of drug and blood, even within what
might be considered the true Vc is not instantaneous.90
Fig 12 The central volume is based on the fundamentally flawed assumption that drug is instantaneously and completely mixed
and hence that the concentration peaks at time 0. Figure from S Shafer25
42

Fig 13 More realistic representation of the concentration vs time curve (solid line). The dashed line represents an estimation by
back-extrapolation. Figure from S Shafer25
Fig 14 The influence of study design on the estimate of the concentration at time 0 and hence the estimate of V1. Studies with
rapid early sampling typically have smaller estimates of V1 than studies in which the first samples are drawn many minutes after
drug administration. Figure from S. Shafer25
Front-end kinetics were more accurately described by Masui et al91
. He used a conventional two compart-
mental PK model extended with a LAG and TRANSIT model, describing the time required for the venously
injected drug to reach the sampling site of arterial blood. He showed that propofol administration rate influ-
ences the early phase kinetics but not the dynamics, resulting in equal keo a-
tion.
The mixing period may be better described with physiologic pharmacokinetic models that account for cardiac
output, and hence drug distribution, among tissues with similar perfusion and drug solubility characteristics.
Physiological PK models analyze volumes and clearances for each organ in the body, assuming that blood
43

flows throughout the system according to zero-order processes and that blood transfer between blood and tis-
sues occurs according to first-order processes.
The recirculatory pharmacokinetic model also addresses concerns about traditional mammillary
multicompartmental analysis. The model fits early arterial drug concentrations of samples frequently obtained
soon after rapid intravenous input that resemble a drug concentration profile resulting from a zero-order infu-
sion. In the fit of the model to the data, the concentration is 0 at time 0, and there is a delay between the time
drug is administered and its appearance at the sampling site. Pulmonary drug uptake is an integral part of the
model. Intravascular mixing is characterized, as is the role of cardiac output in drug distribution. Finally, the
model accounts for arterial-mixed venous concentration differences.
The lungs are pharmacologically active organs and affect the blood concentrations of drugs given intravenous-
ly. The lungs can take up, retain, metabolize and delay the release of many drugs. It has been shown that the
first-pass pulmonary retention of a single dose of propofol is 28%. There probably is no extra hepatic
propofol metabolism in the human lung.
Upton and Lundbrook developed a physiologically based re-circulatory (fig 15) model of propofol kinetics in a
sheep model , later extended to humans . In the model particular attention was paid to representing those
physiologic features that influence propofol bolus kinetics (vascular mixing during cardiac output) and
propofol dynamics (cerebral kinetics, cerebral blood flow, cerebral concentration effect relationships). The
incorporation of blood flow terms into the model was considered important because surgery and anesthetic
management affects the state of the circulation, which may affect the disposition of propofol (Fig 16).
44
92
93
94 95

Fig 15 A taxonomy of pharmacokinetic models Compartmental mammillary models are just one approach; an over-simplification
of a complex biological process. Other models account for more physiological phenomena but at the expense of more complicated
mathematical descriptions and the requirement of large amount of data. Figure from Stoeckel24
Linear
MODELS
Non - Linear
Time - invariantTime - variant
Compartmental PhysiologicalEmpirical
CatenarySimple Mannillary
[stochastic][deterministic]
[ deterministic & stochastic ]
/
Complex Partial
45

Fig 16 A schematic representation of the physiologically based recirculatory model (Upton model). The compartments of the
model each have defined apparent distribution volumes (V) and associated blood flows (Q). The lungs were represented as a 3-
a-
bility terms for linking 2 compartments of these membrane-limited submodels. Delay(pre) and Delay(post) are delay terms ac-
counting for intravascular transport. Vmix is a vascular mixing compartment. The symbols used are: Cpa = pulmonary artery drug
concentration; Cart ven = mixed venous propofol concentration; Qco = cardiac output; Qbrn =
brain blood flow; Qhep= liver and gut blood flow; Qfast = fast tissues blood flow; Qslow = slow tissues blood flow; PSdeep= permea-
bility term for slow tissues; Elng=propofol extraction across the lungs; Ehep= propofol extraction across the liver and gut;
Efast=propofol extraction across the fast tissues (includes kidney). Figure from Upton
46
95
= arterial propofol concentration; C

REFERENCES
47

REFERENCES
1 Struys MM, De Smet T, Mortier EP. Simulated drug administration: an emerging tool for teaching clinical
pharmacology during anesthesiology training. Clinical pharmacology and therapeutics 2008; 84: 170-4
2 Passot S, Servin F, Allary R, et al. Target-controlled versus manually-controlled infusion of propofol for direct
laryngoscopy and bronchoscopy. Anesthesia and analgesia 2002; 94: 1212-6, table of contents
3 Passot S, Servin F, Pascal J, Charret F, Auboyer C, Molliex S. A comparison of target- and manually controlled
infusion propofol and etomidate/desflurane anesthesia in elderly patients undergoing hip fracture surgery. Anesthesia
and analgesia 2005; 100: 1338-42, table of contents
4 Struys MM, De Smet T, Depoorter B, et al. Comparison of plasma compartment versus two methods for effect
compartment--controlled target-controlled infusion for propofol. Anesthesiology 2000; 92: 399-406
5 Sakaguchi M, Higuchi H, Maeda S, Miyawaki T. Dental sedation for patients with intellectual disability: a
prospective study of manual control versus Bispectral Index-guided target-controlled infusion of propofol. Journal of
clinical anesthesia 2011; 23: 636-42
6 De Vito A, Agnoletti V, Berrettini S, et al. Drug-induced sleep endoscopy: conventional versus target controlled
infusion techniques--a randomized controlled study. European archives of oto-rhino-laryngology : official journal of
the European Federation of Oto-Rhino-Laryngological Societies 2011; 268: 457-62
7 Solanki A, Puri GD, Mathew PJ. Bispectral index-controlled postoperative sedation in cardiac surgery patients: a
comparative trial between closed loop and manual administration of propofol. European journal of anaesthesiology
2010; 27: 708-13
8 Agarwal J, Puri GD, Mathew PJ. Comparison of closed loop vs. manual administration of propofol using the
Bispectral index in cardiac surgery. Acta anaesthesiologica Scandinavica 2009; 53: 390-7
9 Struys MM, Sahinovic M, Lichtenbelt BJ, Vereecke HE, Absalom AR. Optimizing intravenous drug
administration by applying pharmacokinetic/pharmacodynamic concepts. British journal of anaesthesia 2011; 107:
38-47
10 Sahinovic MM, Absalom AR, Struys MM. Administration and monitoring of intravenous anesthetics. Current
opinion in anaesthesiology 2010; 23: 734-40
11 Kissin I. General anesthetic action: an obsolete notion? Anesthesia and analgesia 1993; 76: 215-8
12 Schwender D, Kunze-Kronawitter H, Dietrich P, Klasing S, Forst H, Madler C. Conscious awareness during
general anaesthesia: patients' perceptions, emotions, cognition and reactions. British journal of anaesthesia 1998; 80:
133-9
13 Lennmarken C, Sandin R. Neuromonitoring for awareness during surgery. Lancet 2004; 363: 1747-8
14 Lennmarken C, Sydsjo G. Psychological consequences of awareness and their treatment. Best practice &
research Clinical anaesthesiology 2007; 21: 357-67
48

15 Sessler DI, Sigl JC, Kelley SD, et al. Hospital stay and mortality are increased in patients having a "triple low" of
low blood pressure, low bispectral index, and low minimum alveolar concentration of volatile anesthesia.
Anesthesiology 2012; 116: 1195-203
16 Chung F. Recovery pattern and home-readiness after ambulatory surgery. Anesthesia and analgesia 1995; 80:
896-902
17 Kreuer S, Bruhn J, Wilhelm W, Bouillon T. [Pharmacokinetic-pharmacodynamic models for inhaled
anaesthetics]. Der Anaesthesist 2007; 56: 538-56
18 Kennedy R. Effect-site estimation of volatile anaesthetic agents: beyond MAC fractions as a target for anaesthesia
delivery. Trends in Anaesthesia and Critical Care 2013; In Press, Available online 20 March 2013
19 Kennedy RR. The effect of using different values for the effect-site equilibrium half-time on the prediction of
effect-site sevoflurane concentration: a simulation study. Anesthesia and analgesia 2005; 101: 1023-8, table of
contents
20 Grossherr M, Hengstenberg A, Meier T, et al. Propofol concentration in exhaled air and arterial plasma in
mechanically ventilated patients undergoing cardiac surgery. British journal of anaesthesia 2009; 102: 608-13
21 Hornuss C, Wiepcke D, Praun S, Dolch ME, Apfel CC, Schelling G. Time course of expiratory propofol after
bolus injection as measured by ion molecule reaction mass spectrometry. Analytical and bioanalytical chemistry
2012; 403: 555-61
22 Hornuss C, Praun S, Villinger J, et al. Real-time monitoring of propofol in expired air in humans undergoing total
intravenous anesthesia. Anesthesiology 2007; 106: 665-74
23 Miekisch W, Fuchs P, Kamysek S, Neumann C, Schubert JK. Assessment of propofol concentrations in human
breath and blood by means of HS-SPME-GC-MS. Clinica chimica acta; international journal of clinical chemistry
2008; 395: 32-7
24 Stoeckel H. Quantitation, Modelling and Control in Anaesthesia. Stuttgart New York: George Thieme Verlag
Thieme Inc., 1985
25 D.E. Longnecker JHT, G.E. Morgan. Principles and Practice of Anesthesiology. 1997
26 Coppens MJ, Eleveld DJ, Proost JH, et al. An evaluation of using population pharmacokinetic models to estimate
pharmacodynamic parameters for propofol and bispectral index in children. Anesthesiology 2011; 115: 83-93
27 Ludbrook GL, Visco E, Lam AM. Propofol: relation between brain concentrations, electroencephalogram, middle
cerebral artery blood flow velocity, and cerebral oxygen extraction during induction of anesthesia. Anesthesiology
2002; 97: 1363-70
28 Bruhn J, Myles PS, Sneyd R, Struys MM. Depth of anaesthesia monitoring: what's available, what's validated and
what's next? British journal of anaesthesia 2006; 97: 85-94
29 Kelley SD. Monitoring Level of Consciousness during Anesthesia and Sedation.
30 Anesthesiologists ASo. Practice Advisory for Intraoperative Awareness and Brain Function Monitoring. October
2005. Available from www.ASAhq.org
31 Rampil IJ. A primer for EEG signal processing in anesthesia. Anesthesiology 1998; 89: 980-1002
32 Sebel PS, Lang E, Rampil IJ, et al. A multicenter study of bispectral electroencephalogram analysis for
monitoring anesthetic effect. Anesthesia and analgesia 1997; 84: 891-9
49

33 Liu J, Singh H, White PF. Electroencephalogram bispectral analysis predicts the depth of midazolam-induced
sedation. Anesthesiology 1996; 84: 64-9
34 Leslie K, Sessler DI, Schroeder M, Walters K. Propofol blood concentration and the Bispectral Index predict
suppression of learning during propofol/epidural anesthesia in volunteers. Anesthesia and analgesia 1995; 81: 1269-
74
35 Doi M, Gajraj RJ, Mantzaridis H, Kenny GN. Relationship between calculated blood concentration of propofol
and electrophysiological variables during emergence from anaesthesia: comparison of bispectral index, spectral edge
frequency, median frequency and auditory evoked potential index. British journal of anaesthesia 1997; 78: 180-4
36 Gan TJ, Glass PS, Windsor A, et al. Bispectral index monitoring allows faster emergence and improved recovery
from propofol, alfentanil, and nitrous oxide anesthesia. BIS Utility Study Group. Anesthesiology 1997; 87: 808-15
37 Liu SS. Effects of Bispectral Index monitoring on ambulatory anesthesia: a meta-analysis of randomized
controlled trials and a cost analysis. Anesthesiology 2004; 101: 311-5
38 Ekman A, Lindholm ML, Lennmarken C, Sandin R. Reduction in the incidence of awareness using BIS
monitoring. Acta anaesthesiologica Scandinavica 2004; 48: 20-6
39 Myles PS, Leslie K, McNeil J, Forbes A, Chan MT. Bispectral index monitoring to prevent awareness during
anaesthesia: the B-Aware randomised controlled trial. Lancet 2004; 363: 1757-63
40 Mashour GA, Shanks A, Tremper KK, et al. Prevention of intraoperative awareness with explicit recall in an
unselected surgical population: a randomized comparative effectiveness trial. Anesthesiology 2012; 117: 717-25
41 Punjasawadwong Y, Boonjeungmonkol N, Phongchiewboon A. Bispectral index for improving anaesthetic
delivery and postoperative recovery. The Cochrane database of systematic reviews 2007: CD003843
42 Upton RN. Cerebral uptake of drugs in humans. Clinical and experimental pharmacology & physiology 2007; 34:
695-701
43 Absalom AR, Mani V, De Smet T, Struys MM. Pharmacokinetic models for propofol--defining and illuminating
the devil in the detail. British journal of anaesthesia 2009; 103: 26-37
44 Hull CJ, Van Beem HB, McLeod K, Sibbald A, Watson MJ. A pharmacodynamic model for pancuronium. British
journal of anaesthesia 1978; 50: 1113-23
45 Sheiner LB, Stanski DR, Vozeh S, Miller RD, Ham J. Simultaneous modeling of pharmacokinetics and
pharmacodynamics: application to d-tubocurarine. Clinical pharmacology and therapeutics 1979; 25: 358-71
46 Mani V, Morton NS. Overview of total intravenous anesthesia in children. Paediatric anaesthesia 2010; 20: 211-
22
47 Buhrer M, Maitre PO, Crevoisier C, Stanski DR. Electroencephalographic effects of benzodiazepines. II.
Pharmacodynamic modeling of the electroencephalographic effects of midazolam and diazepam. Clinical
pharmacology and therapeutics 1990; 48: 555-67
48 Doufas AG, Orhan-Sungur M, Komatsu R, et al. Bispectral index dynamics during propofol hypnosis is similar in
red-haired and dark-haired subjects. Anesthesia and analgesia 2013; 116: 319-26
49 De Cock RF, Piana C, Krekels EH, Danhof M, Allegaert K, Knibbe CA. The role of population PK-PD modelling
in paediatric clinical research. European journal of clinical pharmacology 2011; 67 Suppl 1: 5-16
50

50 Dennis Fisher SS. Nonmem Workshop Pharmacokinetic and Pharmacodynamic Analysis with NONMEM, Basic
Concepts. 2007
51 Hu C, Horstman DJ, Shafer SL. Variability of target-controlled infusion is less than the variability after bolus
injection. Anesthesiology 2005; 102: 639-45
52 Varvel JR, Donoho DL, Shafer SL. Measuring the predictive performance of computer-controlled infusion
pumps. Journal of pharmacokinetics and biopharmaceutics 1992; 20: 63-94
53 Sepulveda P, Cortinez LI, Saez C, et al. Performance evaluation of paediatric propofol pharmacokinetic models in
healthy young children. British journal of anaesthesia 2011; 107: 593-600
54 Coetzee JF, Glen JB, Wium CA, Boshoff L. Pharmacokinetic model selection for target controlled infusions of
propofol. Assessment of three parameter sets. Anesthesiology 1995; 82: 1328-45
55 Marsh B, White M, Morton N, Kenny GN. Pharmacokinetic model driven infusion of propofol in children. British
journal of anaesthesia 1991; 67: 41-8
56 Gepts E, Camu F, Cockshott ID, Douglas EJ. Disposition of propofol administered as constant rate intravenous
infusions in humans. Anesthesia and analgesia 1987; 66: 1256-63
57 Billard V, Gambus PL, Chamoun N, Stanski DR, Shafer SL. A comparison of spectral edge, delta power, and
bispectral index as EEG measures of alfentanil, propofol, and midazolam drug effect. Clinical pharmacology and
therapeutics 1997; 61: 45-58
58 Schnider TW, Minto CF, Gambus PL, et al. The influence of method of administration and covariates on the
pharmacokinetics of propofol in adult volunteers. Anesthesiology 1998; 88: 1170-82
59 Lerman J, Johr M. Inhalational anesthesia vs total intravenous anesthesia (TIVA) for pediatric anesthesia.
Paediatric anaesthesia 2009; 19: 521-34
60 Tramer M, Moore A, McQuay H. Propofol anaesthesia and postoperative nausea and vomiting: quantitative
systematic review of randomized controlled studies. British journal of anaesthesia 1997; 78: 247-55
61 Apfel CC, Kranke P, Katz MH, et al. Volatile anaesthetics may be the main cause of early but not delayed
postoperative vomiting: a randomized controlled trial of factorial design. British journal of anaesthesia 2002; 88:
659-68
62 Chandler JR, Myers D, Mehta D, et al. Emergence delirium in children: a randomized trial to compare total
intravenous anesthesia with propofol and remifentanil to inhalational sevoflurane anesthesia. Paediatric anaesthesia
2013; 23: 309-15
63 Bong CL, Ng AS. Evaluation of emergence delirium in Asian children using the Pediatric Anesthesia Emergence
Delirium Scale. Paediatric anaesthesia 2009; 19: 593-600
64 Shen X, Hu CB, Ye M, Chen YZ. Propofol-remifentanil intravenous anesthesia and spontaneous ventilation for
airway foreign body removal in children with preoperative respiratory impairment. Paediatric anaesthesia 2012; 22:
1166-70
65 Wappler F. Malignant hyperthermia. European journal of anaesthesiology 2001; 18: 632-52
66 Hayes J, Veyckemans F, Bissonnette B. Duchenne muscular dystrophy: an old anesthesia problem revisited.
Paediatric anaesthesia 2008; 18: 100-6
51

67 Ishizawa Y. Special article: general anesthetic gases and the global environment. Anesthesia and analgesia 2011;
112: 213-7
68 Wuebbles DJ. Atmosphere. Nitrous oxide: no laughing matter. Science 2009; 326: 56-7
69 Pothineni NV, Hayes K, Deshmukh A, Paydak H. Propofol-Related Infusion Syndrome: Rare and Fatal.
American journal of therapeutics 2013
70 Haase R, Sauer H, Eichler G. Lactic acidosis following short-term propofol infusion may be an early warning of
propofol infusion syndrome. Journal of neurosurgical anesthesiology 2005; 17: 122-3
71 Vasile B, Rasulo F, Candiani A, Latronico N. The pathophysiology of propofol infusion syndrome: a simple
name for a complex syndrome. Intensive care medicine 2003; 29: 1417-25
72 Murdoch SD, Cohen AT. Propofol-infusion syndrome in children. Lancet 1999; 353: 2074-5
73 Bray RJ. Propofol infusion syndrome in children. Paediatric anaesthesia 1998; 8: 491-9
74 Hatch DJ. Propofol-infusion syndrome in children. Lancet 1999; 353: 1117-8
75 Bray RJ. Propofol-infusion syndrome in children. Lancet 1999; 353: 2074-5
76 Kataria BK, Ved SA, Nicodemus HF, et al. The pharmacokinetics of propofol in children using three different
data analysis approaches. Anesthesiology 1994; 80: 104-22
77 Murat I, Billard V, Vernois J, et al. Pharmacokinetics of propofol after a single dose in children aged 1-3 years
with minor burns. Comparison of three data analysis approaches. Anesthesiology 1996; 84: 526-32
78 Short TG, Aun CS, Tan P, Wong J, Tam YH, Oh TE. A prospective evaluation of pharmacokinetic model
controlled infusion of propofol in paediatric patients. British journal of anaesthesia 1994; 72: 302-6
79 Schuttler J, Ihmsen H. Population pharmacokinetics of propofol: a multicenter study. Anesthesiology 2000; 92:
727-38
80 Absalom A, Amutike D, Lal A, White M, Kenny GN. Accuracy of the 'Paedfusor' in children undergoing cardiac
surgery or catheterization. British journal of anaesthesia 2003; 91: 507-13
81 Constant I, Rigouzzo A. Which model for propofol TCI in children. Paediatric anaesthesia 2010; 20: 233-9
82 Wakeling HG, Zimmerman JB, Howell S, Glass PS. Targeting effect compartment or central compartment
concentration of propofol: what predicts loss of consciousness? Anesthesiology 1999; 90: 92-7
83 Munoz HR, Cortinez LI, Ibacache ME, Altermatt FR. Estimation of the plasma effect site equilibration rate
constant (ke0) of propofol in children using the time to peak effect: comparison with adults. Anesthesiology 2004;
101: 1269-74
84 Minto CF, Schnider TW, Gregg KM, Henthorn TK, Shafer SL. Using the time of maximum effect site
concentration to combine pharmacokinetics and pharmacodynamics. Anesthesiology 2003; 99: 324-33
85 Rigouzzo A, Servin F, Constant I. Pharmacokinetic-pharmacodynamic modeling of propofol in children.
Anesthesiology 2010; 113: 343-52
86 Jeleazcov C, Ihmsen H, Schmidt J, et al. Pharmacodynamic modelling of the bispectral index response to
propofol-based anaesthesia during general surgery in children. British journal of anaesthesia 2008; 100: 509-16
87 Schnider TW, Minto CF, Shafer SL, et al. The influence of age on propofol pharmacodynamics. Anesthesiology
1999; 90: 1502-16
52

88 Chiou WL. Potential pitfalls in the conventional pharmacokinetic studies: effects of the initial mixing of drug in
blood and the pulmonary first-pass elimination. Journal of pharmacokinetics and biopharmaceutics 1979; 7: 527-36
89 Takita A, Masui K, Kazama T. On-line monitoring of end-tidal propofol concentration in anesthetized patients.
Anesthesiology 2007; 106: 659-64
90 Avram MJ, Krejcie TC. Using front-end kinetics to optimize target-controlled drug infusions. Anesthesiology
2003; 99: 1078-86
91 Masui K, Upton RN, Doufas AG, et al. The performance of compartmental and physiologically based
recirculatory pharmacokinetic models for propofol: a comparison using bolus, continuous, and target-controlled
infusion data. Anesthesia and analgesia 2010; 111: 368-79
92 Boer F. Drug handling by the lungs. British journal of anaesthesia 2003; 91: 50-60
93 He YL, Ueyama H, Tashiro C, Mashimo T, Yoshiya I. Pulmonary disposition of propofol in surgical patients.
Anesthesiology 2000; 93: 986-91
94 Upton RN, Ludbrook GL. A physiological model of induction of anaesthesia with propofol in sheep. 1. Structure
and estimation of variables. British journal of anaesthesia 1997; 79: 497-504
95 Upton RN, Ludbrook G. A physiologically based, recirculatory model of the kinetics and dynamics of propofol in
man. Anesthesiology 2005; 103: 344-52
53

CHAPTER 3
Influence of Administration Rate on Propofol Plasma-Effect Site Equilibration
Anesthesiology 2007; 107:386-96
Michel M. R. F. Struys M.D., Ph.D., Marc J. Coppens, M.D, Nikolaas De Neve M.D., Eric P.
Mortier, M.D., D.Sc., Anthony G. Doufas, M.D., Ph.D., Jan F.P. Van Bocxlaer, Pha.,
Ph.D., Steven L. Shafer, M.D.
Introduction
Classic multicompartmental mammillary models assume that drug added to the central compartment is instan-
taneously and completely mixed both at the venous and arterial site of the circulation. The biological phenome-
non is more complex and classic models have difficulties to describe the time course of arterial drug concentra-
tions in the very first minutes after intravenous drug administration.
When using estimated drug concentrations for a combined PK-PD model to describe the complete dose rela-
tionship, misspecification of the PK model over the first minutes could lead to misspecification of the pharma-
codynamics and a less accurate interpretation of the plasma effect-site equilibration. PK-PD modeling without
blood-sampling can be a source of error.
.
54

Influence of Administration Rate on Propofol Plasma Effect Site Equilibration
Anesthesiology
Struys, Michel M. R. F. M.D., Ph.D.; Coppens, Marc J. M.D.; De Neve, Nikolaas M.D.; Mortier, Eric P.
M.D., D.Sc.; Doufas, Anthony G. M.D., Ph.D.; Van Bocxlaer, Jan F. P. Pha., Ph.D. Shafer, Steven L.
M.D.
This article is accompanied by an Editorial View. Please see: Fisher DM: Take it to the limit (one more
time). Anesthesiology 2007; 107:367 8.
ABSTRACT
Background: The authors hypothesized a difference in plasma effect site equilibration, depicted by a
first-order constant ke0, depending on the injection rate of propofol.
Methods: Sixty-one patients received 2.5 mg/kg propofol given as a bolus or as a 1-, 2-, or 3-min infu-
sion. The Bispectral Index was used to monitor drug effect. Propofol predicted plasma concentration was
calculated using a three-compartment model and the effect site concentration over time as the convolu-
tion between the predicted plasma concentration and the disposition function of the effect site concentra-
tion. The authors evaluated the influence of the infusion rate on the ke0 by comparing the model with one
ke0 for all groups with models estimating different ke0 values for each group. The authors also assessed
the accuracy of two pharmacokinetic models after bolus injection.
Results:
Index < 90) with two values of ke0, one for the bolus (t½ ke0 = 1.2 min) and one for the infusions (t½ ke0 =
2.2 min). However, the tested pharmacokinetic models poorly predicted the arterial concentrations in the
first minutes after bolus injection. Simulations showed the requirement for two ke0 values for bolus and
infusion was mostly a compensation for the inaccurate prediction of arterial concentrations after a bolus.
55

Conclusion: Propofol plasma effect site equilibration occurs more rapidly after a bolus than after rapid
infusion, based on the electroencephalogram as a drug effect measure, mostly because of misspecifica-
tion of the pharmacokinetic model in the first minutes after bolus.
PROPOFOL transfer between the plasma and effect site can be modeled as a first-order process char-
acterized by ke0.1,2 The standard model of ke0 assumes that the rate of equilibration between the plas-
ma and the site of drug effect is independent of the rate of drug administration. However, there are
conflicting data on the rate of equilibration between the plasma and the site of propofol drug effect.
In a study involving both bolus injections and intravenous infusions, Schnider et al.3 found that the
rate of equilibration was rapid, with a half-time of equilibration, t½ ke0, of 1.5 min, and a peak effect,
tpeak, of 1.7 min. Schnider's finding of rapid equilibration was subsequently validated by Struys et al.4
However, using continuous infusions of propofol, Doufas et al.5 found a much slower rate of plasma
effect site equilibration, with a t½ ke0 of 4.1 min, and a tpeak of 2.7 min. They also found that infusion
rate had no influence on ke0.5
The maximum propofol infusion rate in the study of Doufas et al.5 was 60 mg/min, far lower than the
maximum rate of approximately 500 mg/min required for Schnider et al. to give a 2.5-mg bolus over
20 s. Doufas et al.5 proposed that there could be a fundamental difference in plasma effect site equi-
libration depending on whether propofol was given as a bolus or continuous infusion. We
investigated this hypothesis.
Materials and Methods
Clinical Protocol
After institutional ethics committee approval, written informed consent was obtained from 61 female
patients with American Society of Anesthesiologists physical status I, aged 18 45 yr, scheduled to un-
dergo ambulatory gynecologic surgery. Exclusion criteria included weight less than 70% or more than
130% of ideal body weight, neurologic disorder, and recent use of psychoactive medication, including
alcohol.
56

All patients were randomly assigned to one of four groups to receive 2.5 mg/kg propofol (Diprivan 1%;
AstraZeneca, London, United Kingdom) given as a bolus (within 10 s) (group 1) or given as a continu-
ous infusion over 1, 2, or 3 min (groups 2, 3, and 4, respectively). Bolus administration was performed
manually. The continuous infusions were administered using a Fresenius Modular DPS Infusion Pump
connected to a Fresenius Base A (Fresenius Vial Infusion Systems, Brézins, France). To ensure synchro-
nized data recording, all monitor and infusion data were continuously captured by a computer running
RUGLOOP II (Demed, Temse, Belgium) via multiple RS 232 interfaces. By tracking the infused
propofol volume continuously in groups 2, 3, and 4, RUGLOOP II calculated the corresponding plasma
concentration using the three-compartment model previously published by Schnider et al.6 This model
was selected because of its optimal performance in previous studies.5 For group 1, the plasma concentra-
tion was calculated post hoc using RUGLOOP II simulation mode and the Schnider propofol pharmaco-
kinetic model.6
Propofol was infused via a large left forearm vein. Every patient received approximately 100 ml crystal-
loid fluid during the study period. No fluid load was given before induction. No patient received
preanesthetic medication. No other drugs were given. All patients maintained spontaneous ventilation
via a facemask delivering 100% O2. Before starting the drug administration, all patients were asked to
close their eyes and relax for 2 min. Thereafter, baseline measures were taken. The operating room was
kept silent to avoid noise-related stimulation and artifact.
Propofol drug effect was continuously monitored using the Bispectral Index (BIS; version 4.0; Aspect
Medical Systems, Inc., Newton, MA). The BIS was derived from the frontal electroencephalogram and
calculated by the A-2000 BIS® monitor using the four BIS®-Sensor electrodes. Electrode impedance
p-
tured in real time on a laptop computer using RUGLOOP II. Heart rate, noninvasive blood pressure,
oxygen saturation measured by pulse oximetry, and capnography were recorded at 1-min time intervals
using an S-5 monitor (Datex-Ohmeda, Helsinki, Finland) and were also captured electronically using
RUGLOOP II. Averaging of the data was performed using 10-s intervals. All patients were monitored
until return of consciousness after propofol administration, defined as spontaneous eye opening (without
a stimulus).
57
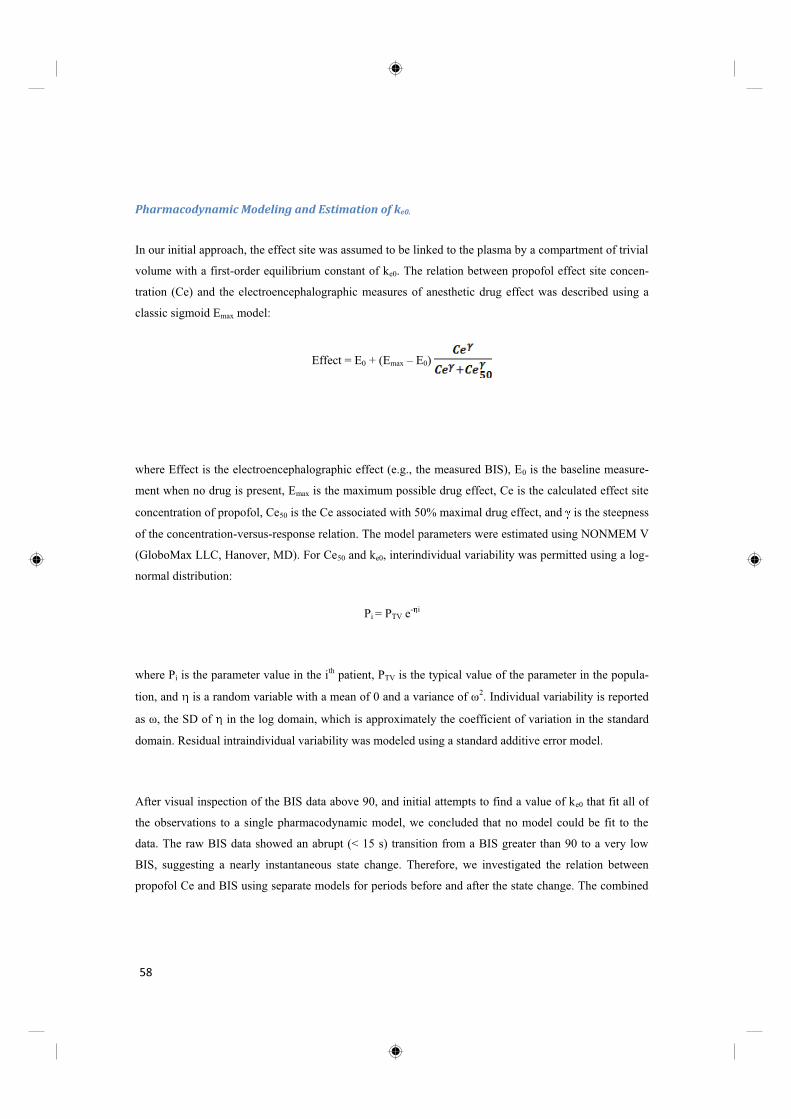
Pharmacodynamic Modeling and Estimation of ke0.
In our initial approach, the effect site was assumed to be linked to the plasma by a compartment of trivial
volume with a first-order equilibrium constant of ke0. The relation between propofol effect site concen-
tration (Ce) and the electroencephalographic measures of anesthetic drug effect was described using a
classic sigmoid Emax model:
Effect = E0 + (Emax E0)
where Effect is the electroencephalographic effect (e.g., the measured BIS), E0 is the baseline measure-
ment when no drug is present, Emax is the maximum possible drug effect, Ce is the calculated effect site
concentration of propofol, Ce50 is the Ce associated with 50% maximal drug effect, and is the steepness
of the concentration-versus-response relation. The model parameters were estimated using NONMEM V
(GloboMax LLC, Hanover, MD). For Ce50 and ke0, interindividual variability was permitted using a log-
normal distribution:
Pi = PTV e- i
where Pi is the parameter value in the ith patient, PTV is the typical value of the parameter in the popula-
tion, and 2. Individual variability is reported
in the log domain, which is approximately the coefficient of variation in the standard
domain. Residual intraindividual variability was modeled using a standard additive error model.
After visual inspection of the BIS data above 90, and initial attempts to find a value of ke0 that fit all of
the observations to a single pharmacodynamic model, we concluded that no model could be fit to the
data. The raw BIS data showed an abrupt (< 15 s) transition from a BIS greater than 90 to a very low
BIS, suggesting a nearly instantaneous state change. Therefore, we investigated the relation between
propofol Ce and BIS using separate models for periods before and after the state change. The combined
58

data of 90 or
less using the classic sigmoid Emax model.
For both model approaches (classic sigmoidal model or the combined fixed plus sigmoidal model), we
assumed that the underlying sigmoidal model which describes the relation between the effect site con-
centration and the drug effect is not influenced by the method of drug administration. Indeed, this is a
fundamental assumption underlying the standard model of the effect site. Therefore, we concurrently
estimated the model parameters for all four groups, only permitting the value of ke0 to differ between
groups. We evaluated the influence of the administration rate on the ke0 by comparing the log likelihood
between a model with one ke0 for all administration rates with models estimating different ke0 values for
each group. The addition of infusion rate specific values of ke0 was considered statistically significant
when the log likelihood decreased by at least 6.63 (P < 0.01, chi-square test with 1 degree of freedom).7
NONMEM had difficulty simultaneously estimating the parameters of the structural model (e.g., the
parameters) and the variance model (the parameters). Specifically, estimating both the structural and
variance models simultaneously produced highly biased estimates of the parameters, as demonstrated by
Therefore, we chose the best model using the naive pooled data method as described by Kataria et al.8
After identifying the best structural model, we fixed the parameters of the structural model at the naive
pooled data estimates and estimated the parameters of the intersubject and intrasubject variability mod-
els. This approach comes very close to the generalized least-squares method. The generalized least-
values of
from step 2, and the typical values of the structural model (i.e., ) are estimated for the last time. Our
approach was to implement the first two steps of the generalized least-squares method.
The effect site concentrations over time were calculated as the convolution of the predicted plasma con-
centrations over time with the disposition function of the effect site, ke0 e-ke0t. The convolution was based
-the- 3 In brief, increasing plasma concen-
59

trations were modeled using a linear interpretation between adjacent plasma concentrations. As such,
when concentrations are increasing, the slope in the concentration from time t1 to time t2 can be modeled
as
where Cp is the plasma concentration, and thus the plasma concentrations from time t1 to time t2 are
described by the formula
The convolution of this with ke0 e-ke0t calculates the effect site concentration at time t2 as a function of
the effect site concentration at time t1 and the plasma concentrations over the interval
Similarly, when concentrations are decreasing, the slope of the log of the concentrations from time t1 to
time t2 can be modeled as
and thus the plasma concentrations from time t1 to time t2 are described by the formula
The convolution of this with ke0 e-ke0t calculates the effect site concentration at time t2 as a function of the
60

effect site concentration at time t1 and the plasma concentrations over the interval
The observed BIS value has a time delay for the measurement, which we fixed at 10 s and defined as lag
time. This lag time is approximately the sum of half of the smoothing interval within the BIS® monitor
and the time for the automated data collection.
We assessed the model performance by calculating the prediction error (PE) between measured (BISmeas)
and post hoc Bayesian predicted BIS (BISpred) values, as
We also calculated median prediction error (MDPE) and absolute median prediction error, (MDAPE),
for each patient.9 Differences among groups for MDPE and MDAPE were tested using a Student t test
with Bonferroni correction for multiple testing.
To observe whether the model reflects reality, we compared the observed time of maximum BIS re-
sponse (tmax,BIS) with the time to reach maximum Ce (tmax,Ce) after the specific administration of propofol
in each group.
Bolus Validation Study
The three-compartment pharmacokinetic model published by Schnider et al.6 was used to predict the
time course of the propofol plasma concentration in our study. For slowly administered continuous infu-
sion of propofol, Doufas et al.5 found that the pharmacokinetic model published by Schnider et al.6 accu-
rately predicted the propofol plasma concentrations in arterial blood. However, the accuracy of this
model in the first 3 min after bolus injection is not described in the literature.
61

We therefore performed a study to validate the pharmacokinetics after bolus injection. In this study, we
collected propofol arterial blood samples from 10 additional patients to evaluate the accuracy of the
pharmacokinetic models published by Schnider et al.6 and by Marsh et al.10 in the first 5 min after intra-
venous propofol bolus. After additional ethics committee approval and written informed consent, 10
patients received a bolus dose of propofol (2.5 mg/kg) within 10 s in a large forearm vein. Propofol arte-
rial blood samples were collected (contralateral from the injection of propofol) at 0, 30, 60, 120, 180,
240, and 300 s after injection. Propofol (bound and free) plasma concentrations were analyzed using a
validated gas chromatographic mass spectrometric method with solid-phase micro extraction. The time
course of the propofol plasma concentration as predicted by both pharmacokinetic models (Schnider and
Marsh) was simulated using RUGLOOP II. We calculated the PE of the predicted concentration and the
MDAPE for both models for the first 5 min after injection.
The arterial concentrations in the first 5 min after bolus injection were compared with the predictions
based on the pharmacokinetics reported by Schnider et al.6 and by Marsh et al.10 As described in the
Results, neither pharmacokinetic parameter set accurately predicted the concentrations in the first 5 min
after bolus injection. To see whether this misspecification might affect the estimation of ke0, we calculat-
ed the effect site concentrations over time after bolus injection as a convolution of the median concentra-
tions in these 10 individuals with ke0 e-ke0t, the disposition function of the effect site. We then calculated
the value of ke0 that predicted the observed time of peak BIS response.
Validation of the Applied Lag Time in the BIS Measurement
We fixed the lag time of the BIS at 10 s. Based on literature reports,11 a longer lag time might be more
appropriate. Therefore, we applied a post hoc analysis on our final selected model in an attempt to ex-
plore whether longer lag times would result in a better model for both the sigmoidal model and the fixed
BIS plus sigmoidal model. Lag times between 10 and 25 s were evaluated, and the NONMEM objective
functions were compared.
Validation of the Modeling Methods Using Another Data Set
We validated our final model results against the data previously published by Doufas et al.5 In brief,
62

Doufas et al. analyzed the pharmacokinetics and pharmacodynamics of propofol in 18 healthy volunteers
receiving five consecutive target-controlled propofol infusions. During each infusion, predicted Ce in-
creased linearly at a rate of 0.1, 0.3, 0.5, 0.7, or 0.9 µg · ml-1 · min-1 based on the Schnider pharmacoki-
netic pharmacodynamic model. BIS was collected continuously during the infusions. Doufas et al.5 fit a
combined pharmacokinetic dynamic model to their data. To describe the pharmacodynamics of
propofol, a classic sigmoid Emax model was used. No lag time in the BIS was included in the model. The
study results can be seen in the original publication.5
We validated four models: (1) a sigmoid Emax model without a lag time (same as the model used in the
Doufas article; (2) a sigmoidal Emax model with a 10-s lag time (equivalent to our sigmoidal Emax model);
(3) a model consisting of a fixed estimate of BIS values of 90 or greater and a sigmoidal Emax model for
BIS values less than 90, with no lag time; and (4) a model consisting of a fixed estimate of BIS values of
90 or greater and a sigmoidal Emax model for BIS values less than 90, with a 10-s lag time (equivalent to
our best model). We encountered identical problems with concurrent identification of the structural and
variance models that we described when fitting our own data, and so we used the naive pooled data ap-
proach to identify the best model among the four structural models considered. After identification of the
best structural model, we fixed the structural parameters and estimated the interindividual variability.
We assessed the performance of the optimal model by calculating the PE between BISmeas and BISpred
values, as well as the MDPE and MDAPE for each patient.9
63

Results
Model Estimation and Validation
All recorded data were used. No patients experienced hemodynamic or respiratory instability during the
study. The demographics for patient in the four groups are shown in table 1. The amount of propofol
given and the infusion rates are shown in table 2.
Figures 1A D show the relation between the measured BIS and calculated plasma concentrations, Cp,
versus time for the four groups, respectively. The dashed line shows the cutoff value of 90 used in the
combined fixed plus sigmoidal model approach. Figures 1E H show the relation between BIS and plas-
ma concentration, revealing the hysteresis in the plasma concentration versus response relation.
Table 3 shows the NONMEM objective function (-2 log likelihood) for all investigated models. The
NONMEM objective function improved by 46 points (P << 0.001) when the bolus group (group 1) was
64

given a ke0 distinct from the ke0 used for the three infusion groups (groups 2, 3, and 4). There was no
significant benefit to adding distinct values of ke0 for the three infusion groups. Therefore, we selected
the model with two values of ke0, one for the bolus (t½ ke0 = 1.2 min) and one for the infusions (t½ ke0 =
2.2 min).
Our final model included estimates of interindividual variability on ke0 and Ce50. In our final model, BIS
values of 90 or greater were typically 95.6. BIS values less than 90 were described by a sigmoidal curve
with ranging from a maximum value of 74 to a minimum of 25. The Ce50 for the sigmoidal portion was
50 and ke0 were 0.27 and 0.83, respectively,
which approximately correspond to the coefficient of variation in the standard domain. Additive residual
intraindividual error was 7.2.
65

Fig. 1 Relation between the measured Bispectral Index (BIS) and propofol plasma concentration (Cpprop) versus time (s) for the
four groups, in A-D. The dashed line shows the cutoff value for modeling when the two consecutive model approach was used
(fixed 90, sigmoidal < 90), fixed at a BIS of 90. E-H show the relation between BIS and Cp, thereby revealing the hysteresis in
the relation.
66

Fig. 2 Results from the best-fitting model (including estimates of interindividual variability on ke0 and effect site concentration
associated with 50% maximal drug effect (Ce50). Individual measured Bispectral Index (BIS) values and the calculated Ce
versus time for the four groups, in A-D. E-H show the BIS versus Ce, based on the ke0 estimate by NONMEM. To visualize the
source data and results for the fixed number model, we showed the measured BIS data 90 as black circles. The second part (the
sigmoid Emax model using BIS < 90) data are shown as straight lines.
Figures 2A D show the raw BIS values and the calculated effect site concentration, Ce, versus time,
showing the parallel between the time course of BIS and Ce. Figures 2E H show the BIS versus Ce.
BIS values of 90 or greater are depicted as black circles. BIS values less than 90 are shown as connect-
ed lines. Two individuals receiving the bolus injection had baseline BIS values below 90 (fig. 2E),
67

which escaped our efforts to censor the initial unresponsive portion of the BIS response. We did not
decrease our censoring value (90) to censor these data because we did not wish to lose informative BIS
values in other subjects.
Table 4 shows the median (range) results for the post hoc Bayesian estimates of Ce50 and t½ ke0 for each
individual in the four groups. Table 4 also shows the time of maximum BIS change (tmax,BIS), the time
of maximum Ce (tmax,Ce) after the specific propofol infusion, and the absolute value of the difference
between these times (terror). The difference in the time of maximum BIS change and the time of the
highest Ce can be used to assess the performance of the model. The median terror was 0.6 min or less for
all groups. For all patients, the individual results for the post hoc Bayesian estimates of Ce50 and t½ ke0
in the four groups, tmax,BIS and tmax,Ce after the specific propofol infusion, and the absolute value of the
difference between these times (tabs,error) can be found in a supplement on the Anesthesiology Web site
(http://www.anesthesiology.org).
The performance accuracy for the final model was assessed by calculating the PE. Figures 3A D show
the individual PE versus time for the four groups, respectively. Median (range) MDPE and MDAPE
for each group was calculated as shown in table 4. The MDAPE was 18% or less for all groups. No
group showed significant bias (MDPE). All individual MDPE and MDAPE calculations can be found
on the Anesthesiology Web site (http://www.anesthesiology.org).
Bolus Validation Study
Ten female patients were included, and all blood samples were analyzed. Demographics were similar
68

in study groups 1 through 4 (age, 34 ± 8 yr; weight, 63 ± 10 kg; height, 163 ± 7 cm). For both models,
measured versus predicted propofol plasma concentrations and individual PE% versus time are plotted
in figure 4. The mean (SD) PEs were -40.50 (53.08) and -25.90 (36.80)% for the Marsh and Schnider
models, respectively. The mean MDAPEs were 60.22 (28.24) and 39.45 (21.38)% for the Marsh and
Schnider models, respectively.
Figure 5 shows the median arterial concentrations from the bolus. The effect site concentrations were
computed based on a t½ ke0 of 2.0 min and predict a peak effect site concentration of 1.9 min, consistent
with the time of peak BIS effect in our bolus study (table 4, group 1). All data can be found on the
Anesthesiology Web site (http://www.anesthesiology.org).
Validation of the Applied Lag Time in the BIS Measurement
Table 5 shows the -2 log likelihood values (the NONMEM objective function) when applying different
lag times. The best result is obtained when implementing a 10-s lag time in the combined fixed plus
sigmoidal model approach.
69

Fig. 3 Individual prediction errors (PEs) versus time for the four groups, in A-D.
Method Validation
All data from the 18 volunteers in the original publication by Doufas et al. were included in the model
validation. Figure 6A shows the relation between BIS and Cp for the Doufas validation data set. Table
70

6 shows the -2 log likelihood values (the NONMEM objective function) and the typical values for all
investigated models. Doufas' data were best described by a single estimate for those BIS observations
of 90 or greater, and a sigmoidal Emax model for BIS values less than 90, with a 10-s delay, exactly as
was the case for our data. Most critically, this model estimated a t½ ke0 of 2.1 min, very close to our
estimate of 2.2 min for infusions. The SDs in the log domain of Ce50 and ke0 were 0.31 and 1.29, re-
spectively. Additive residual intraindividual error was 9 (i.e., residual variance = 81).
Figure 6B shows the relation between BIS and Ce for each individual, based on the best model and the
post hoc Bayesian estimates of Ce50 and ke0. The individual PEs are shown in figure 6C.
The median (range) post hoc Bayesian parameter estimates for all subjects in the validation data set
are shown in table 7, as well as the individual MDPE and MDAPE. The model performed well, with
an MDAPE less than 9% and minimal bias (5%). The Ce50 in the validation set is less than in our data
set (3.6 vs. 5.1 µg/ml) but is similar to that seen in our bolus group (3.7 µg/ml; table 4).
Fig. 4 The bolus injection validation set. The relation between the individual measured propofol plasma concentration (Cp)
and the plasma concentration predicted by the Marsh and Schnider pharmacokinetic models ( A). The time course of the
prediction error (PE%) for both applied models (B).
71

tion set is less than in our data set (1.3 vs. 3.4). For all patients, individ-
ual data can be found on the Anesthesiology Web site (http://www.anesthesiology.org).
Fig. 5 The median plasma concentrations (Cp) from the 10 patients in the bolus validation study, and the effect site concen-
trations (Ce) predicted by a t1/2 ke0 of 2.0. The time of peak effect, 1.9 min, matches the median time of peak Bispectral
Index in the bolus study ( table 4).
Discussion
Our goal was to determine whether the equilibration rate between plasma and effect site was influ-
enced by rate of propofol administration. If so, this must be considered when designing drug infusions,
and is particularly relevant for target-controlled infusion systems. We tested this by examining the
time course of electroencephalographic (BIS) response to a bolus and three infusion rates. The appar-
ent plasma effect site equilibration for bolus injections is faster than for infusions. This is consistent
with the hypothesis of Doufas et al.5 who speculated that this might be the explanation for the differ-
ence between plasma effect site equilibration in their study versus the study by Schnider et al.3 The
accuracy of the pharmacodynamic models is demonstrated by the reasonable values of MDAPE and
the agreement between the observed time to maximum BIS changes and the calculated time to the
highest effect site concentration after a specific propofol administration (depending on the group).
72

Because this study aimed at answering the question of why different ke0s are found in the literature,
even when using the same pharmacokinetic model, we wanted to explore bolus injections (as used by
Schnider et al.3) and various infusion rates covering published work and clinical practice. Our bolus
was 2.5 mg/kg given over 10 s. Our slowest administration was an infusion of 2.5 mg/kg given over 3
min, which is 50 mg kg-1 h-1. This is lower than the critical infusion rate of 80 mg kg-1 h-1 that Kazama
et al.12 postulate causes incomplete mixing in the central compartment.
Classically, the sigmoid Emax model has been applied successfully for pharmacodynamic modeling of
propofol. However, when observing our raw BIS data, we found that the BIS values showed no
change during the initial increase in effect site propofol concentration, until there was an abrupt de-
crease. This may reflect an acute change in BIS with loss of consciousness, although the article by
Doufas et al. examined BIS at loss of consciousness and did not detect any abrupt state change. This
might be due to the fact that they used an Observers' Assessment of Anesthesia/Sedation score of less
than 2 (= loss of responsiveness to shaking and shouting) as their endpoint.5 Alternatively, this delay
may reflect the combination of the averaging algorithm to calculate BIS (i.e., smoothing rate) and the
delay in adaptation of one of the artifact rejection preprocessing steps, that rejects large changes in the
electroencephalogram as artifact until those changes persist for approximately 5 s (Scott Greenwald,
Ph.D., Vice President of Research, Aspect Medical Systems, Newton, MA, verbal personal communi-
cation, April 2005). We found that the inclusion of a lag time of 10 s into our model resulted in the
best fit. Longer lag times resulted in worse fits of the model to the data. Regardless, the initial obser-
vations when the BIS was unambiguously unresponsive to changing propofol concentrations (figs.
1E H) were censored from the sigmoidal model by introducing a separate model for BIS values of 90
or greater and BIS values less than 90. This model significantly improved the quality of the fit with
our data (P << 0.001 for the 2 ke0 model; table 3) and with the validation data set from Doufas et al.5
(P << 0.001 for the models with 10-s delays; table 6).
73

Fig. 6 The validation data set. A shows the relation between the measured Bispectral Index (BIS) and propofol plasma con-
centration (Cpprop). B shows BIS versus effect site concentration (Ceprop), based on ke0 estimate by NONMEM. To visual-
ize the source data and results for the fixed number model, we showed the measured BIS data 90 as black circles. The
second part (the sigmoid Emax model using BIS<90) data are shown as straight lines. C shows the individual prediction error
(PE) from the best fitting model (fixed 90, sigmoidal <90, 10 s delay; including estimates of interindividual variabililty on
ke0 and Ce50).
If propofol administration rate is influencing the time course of drug effect, a model incorporating
different estimates of ke0 for different infusion rates would yield a better model fit than a model
whereby one ke0 was used to describe the time course of effect site concentration independent of drug
74

administration rate. We found that the model discriminating the bolus injection group from the three
continuous infusion groups yielded a significantly better fit than a model with a single ke0 for all four
groups. In our bolus group, the value of t½ ke0 was 1.2 min, very close to the value of 1.5 min reported
by Schnider et al.3 whose value of ke0 was primarily based on bolus propofol administration. In the
Schnider study, the bolus was administered in a mean time of 18 s (range, 13 24 s), which is some-
what slower than in our study (table 2). In addition, our calculated time of maximum BIS effect in the
bolus group was 1.7 min (table 4), exactly the same as reported by Schnider et al.3 Our t½ ke0 of 2.2
min for propofol administration by infusion is in agreement with the value computed from the valida-
tion data set of Doufas et al.5 of 2.1 min, both of which reflect fast infusions, but obviously less rapid
than bolus injections.
Our findings are consistent with propofol modeling studies using a conventional continuous infusion,
which have reported propofol t½ ke0s between 2.3 and 3.5 min. In the first commercial target-
controlled infusion device (Diprifusor; AstraZeneca), the kinetic model described by Marsh et al.10
was linked to a t½ ke0 of 2.65 min as described by Schwilden et al.13 and based on slow continuous
infusion data. Billard et al.14 administered propofol (continuous infusion of 0.5 mg · kg-1 · min-1 until
burst suppression) and measured the electroencephalographic effect using three different electroen-
cephalographic measures. The estimates of t½ ke0 were significantly higher (mean, 2.6 min) for delta
power than those for spectral edge 95% (mean, 3.5 min) and Bispectral Index version 1.1 (mean, 3.5
min). White et al.15 used midlatency auditory evoked potentials to measure propofol drug effect, when
administered as a continuous infusion (0.5 mg · kg-1 · min-1), and calculated a ke0 of 3.5 min (mean
value). All of these effect measures were modeled without including any delay in the electroencepha-
lographic measure.
75

Ke0 is dependent on the accuracy of the underlying pharmacokinetic model, and if the pharmacokinetic
model is biased, the estimate of ke0 will be biased by that error. One limitation of our study is that we
did not include measurement of propofol plasma concentrations over time in our four groups. Similar
to previously published work,5,16 18 we applied the three-compartment model published by Schnider et
al.6 to predict the time course of the propofol plasma concentration. In the study by Doufas et al.,5 the
pharmacokinetic performance of the propofol pharmacokinetics reported by Schnider et al.3 was vali-
dated with rapid arterial samples and found to be accurate. Because our study was designed specifical-
ly to test the hypothesis in the Doufas article that the difference in values of ke0 might depend on the
difference between a bolus and a continuous infusion of propofol, we did not believe it was necessary
to collect arterial blood samples in all patients during the bolus (similar to the infusion scheme used by
Schnider in deriving the pharmacokinetics 6) or the infusions (where the pharmacokinetics have been
validated by both Doufas and Schnider).
However, the literature has not documented the accuracy of the Schnider pharmacokinetic model in
the first minutes after bolus injection. Therefore, we added the bolus validation study and documented
that neither model performed well in the first 3 min (fig. 4). The failure of both models in the first 3
min is an expected consequence of a flawed fundamental assumption with mammillary compartment
76

models: instantaneous mixing in the central compartment. Conventional two- and three-compartment
mammillary compartment models assume that drug added to the central compartment is instantaneous-
ly completely mixed, and that this mixed plasma instantaneously appears in the arterial circulation.
This is not the case, as extensively reported by Henthorn et al.19 21 and others.22,23 The reason that more
complex models have not been integrated into target-controlled infusion systems is that incorporating
this into target-controlled infusion algorithms introduces considerable mathematical complexity. Be-
cause the problem with model misspecification is limited to the first few minutes after bolus injection,
there is limited incentive to develop hybrid models to correct the fundamentally flawed assumption of
instantaneous mixing.
The initial error in the pharmacokinetic models is evident for the full 5 min with the Marsh model but
seems to be resolving by 3 min with the Schnider model. Therefore, the Schnider model comes closest
to fitting the bolus validation data and would be the better of the two models to use for this purpose.
The simulation results from the bolus validation study (fig. 5) show that a t½ ke0 of 2.0 min, coupled to
a more accurate pharmacokinetic model, predicts a peak effect site concentration of 1.9 min, as ob-
served with our bolus data (table 4). This is fairly close to the t½ ke0 of 2.2 min that we estimated for
the three infusion groups, and demonstrates that most of the difference in ke0 between bolus and infu-
sion administration is an artifact caused by the inability of mammillary models to accurately describe
the concentrations in the first few minutes after bolus injection. The actual rate of blood brain equili-
bration may not differ between bolus and infusion methods of administration.
This does not preclude the possibility that there are physiologic reasons the rate of plasma effect site
equilibration might change with infusion rate. Upton and Ludbrook 24,25 demonstrated that propofol
decreases cerebral blood flow in a dose-dependent manner. This might explain why the plasma effect
site equilibration time of propofol could change between a bolus, whose high early concentrations
acutely decrease cerebral blood flow, and an infusion, where the changes in cerebral blood flow would
be small.
The rate of propofol administration influences the apparent rate of plasma effect site equilibration.
This is partly, and perhaps mostly, a result of the inability of conventional pharmacokinetic models to
accurately describe the first few minutes after bolus injection. Target-controlled infusion devices need
77

to select the value of ke0 that will most accurately represent the effect site concentrations over time.
The error in the pharmacokinetic model with rapid administration can be partly compensated for by
the selection of ke0. If the maximum infusion rate is between 300 and 900 ml/h, this corresponds to the
infusion rates in our three infusion groups, and the t½ ke0 should be approximately 2.2 min (ke0 = 0.32).
However, if the infusion is closer to our bolus rate (2.5 mg/kg over 10 s almost equal to 6,300 ml/h),
the faster t½ ke0 of 1.2 min will better approximate the time course of drug effect. These values of ke0
are for use with the Schnider pharmacokinetics. If these data are to be implemented with other phar-
macokinetics, then they should be implemented to achieve the predicted time of peak effect of 1.5 min
if the device delivers an induction dose of propofol over a minute or less. If the pump is unable to
infuse propofol that quickly, selecting ke0 based on a peak effect of 1.8 min is appropriate.2
We conclude that the observation of Doufas et al. is correct, although the explanation is surprising.
There is a difference in the apparent rate of plasma effect site equilibration between propofol boluses
and propofol infusions. The difference is mostly caused by misspecification in the pharmacokinetic
model over the first few minutes after bolus injection. A pharmacokinetic model that accurately pre-
dicted propofol concentration in the first few minutes after bolus injection, and for many hours after
infusion, might improve the accuracy of target-controlled infusion administration when targeting the
site of drug effect. If propofol infusion rate affects the apparent ke0 even when the pharmacokinetic
model is unbiased, there may also be a physiologic basis for dependence of ke0 on propofol infusion
rate.
78

References
1. Sheiner LB, Stanski DR, Vozeh S, Miller RD, Ham J: Simultaneous modeling of pharmacokinetics and
pharmacodynamics: Application to d-tubocurarine. Clin Pharmacol Ther 1979; 25:358 71
2. Minto CF, Schnider TW, Gregg KM, Henthorn TK, Shafer SL: Using the time of maximum effect site con-
centration to combine pharmacokinetics and pharmacodynamics. Anesthesiology 2003; 99:324 33
3. Schnider TW, Minto CF, Shafer SL, Gambus PL, Andresen C, Goodale DB, Youngs EJ: The influence of
age on propofol pharmacodynamics. Anesthesiology 1999; 90:1502 16
4. Struys MM, De Smet T, Depoorter B, Versichelen LF, Mortier EP, Dumortier FJ, Shafer SL, Rolly G: Com-
parison of plasma compartment versus two methods for effect compartment controlled target-controlled infu-
sion for propofol. Anesthesiology 2000; 92:399 406
5. Doufas AG, Bakhshandeh M, Bjorksten AR, Shafer SL, Sessler DI: Induction speed is not a determinant of
propofol pharmacodynamics. Anesthesiology 2004; 101:1112 21
6. Schnider TW, Minto CF, Gambus PL, Andresen C, Goodale DB, Shafer SL, Youngs EJ: The influence of
method of administration and covariates on the pharmacokinetics of propofol in adult volunteers.
Anesthesiology 1998; 88:1170 82
7. Beal S, Sheiner L: NONMEM User's Guide. San Francisco, NONMEM Project Group, University of Cali-
fornia, 1992
8. Kataria BK, Ved SA, Nicodemus HF, Hoy GR, Lea D, Dubois MY, Mandema JW, Shafer SL: The pharma-
cokinetics of propofol in children using three different data analysis approaches. Anesthesiology 1994; 80:104
22
9. Varvel JR, Donoho DL, Shafer SL: Measuring the predictive performance of computer-controlled infusion
pumps. J Pharmacokinet Biopharm 1992; 20:63 94
10. Marsh B, White M, Morton N, Kenny GN: Pharmacokinetic model driven infusion of propofol in children.
Br J Anaesth 1991; 67:41 8
11. Pilge S, Zanner R, Schneider G, Blum J, Kreuzer M, Kochs EF: Time delay of index calculation: Analysis
of cerebral state, Bispectral, and Narcotrend indices. Anesthesiology 2006; 104:488 94
12. Kazama T, Ikeda K, Morita K, Kikura M, Ikeda T, Kurita T, Sato S: Investigation of effective anesthesia
induction doses using a wide range of infusion rates with undiluted and diluted propofol. Anesthesiology 2000;
92:1017 28
13. Schwilden H, Stoeckel H, Schuttler J: Closed-loop feedback control of propofol anaesthesia by quantitative
EEG analysis in humans. Br J Anaesth 1989; 62:290 6
14. Billard V, Gambus PL, Chamoun N, Stanski DR, Shafer SL: A comparison of spectral edge, delta power,
79

and bispectral index as EEG measures of alfentanil, propofol, and midazolam drug effect. Clin Pharmacol Ther
1997; 61:45
15. White M, Schenkels MJ, Engbers FH, Vletter A, Burm AG, Bovill JG, Kenny GN: Effect-site modelling of
propofol using auditory evoked potentials. Br J Anaesth 1999; 82:333 9
16. Vanluchene AL, Vereecke H, Thas O, Mortier EP, Shafer SL, Struys MM: Spectral entropy as an electro-
encephalographic measure of anesthetic drug effect: A comparison with Bispectral Index and processed
midlatency auditory evoked response. Anesthesiology 2004; 101:34 42
17. Vereecke HE, Struys MM, Mortier EP: A comparison of bispectral index and ARX-derived auditory
evoked potential index in measuring the clinical interaction between ketamine and propofol anaesthesia.
Anaesthesia 2003; 58:957 61
18. Struys MM, Vereecke H, Moerman A, Jensen EW, Verhaeghen D, De Neve N, Dumortier FJ, Mortier EP:
Ability of the Bispectral Index, autoregressive modelling with exogenous input-derived auditory evoked poten-
tials, and predicted propofol concentrations to measure patient responsiveness during anesthesia with propofol
and remifentanil. Anesthesiology 2003; 99:802 12
19. Henthorn TK, Avram MJ, Krejcie TC: Intravascular mixing and drug distribution: The concurrent disposi-
tion of thiopental and indocyanine green. Clin Pharmacol Ther 1989; 45:56 65
20. Henthorn TK, Krejcie TC, Shanks CA, Avram MJ: Time-dependent distribution volume and kinetics of the
pharmacodynamic effector site (letter). J Pharm Sci 1992; 81:1136 8
21. Krejcie TC, Henthorn TK, Niemann CU, Klein C, Gupta DK, Gentry WB, Shanks CA, Avram MJ:
Recirculatory pharmacokinetic models of markers of blood, extracellular fluid and total body water adminis-
tered concomitantly. J Pharmacol Exp Ther 1996; 278:1050 7
22. Upton RN, Ludbrook GL: A physiological model of induction of anaesthesia with propofol in sheep: I.
Structure and estimation of variables. Br J Anaesth 1997; 79:497 504
23. Upton RN, Grant C, Martinez AM, Ludbrook GL: Recirculatory model of fentanyl disposition with the
brain as the target organ. Br J Anaesth 2004; 93:687 97
24. Upton RN, Ludbrook GL, Grant C, Doolette DJ: The effect of altered cerebral blood flow on the cerebral
kinetics of thiopental and propofol in sheep. Anesthesiology 2000; 93:1085 94
25. Ludbrook GL, Visco E, Lam AM: Propofol: Relation between brain concentrations, electroencephalogram,
middle cerebral artery blood flow velocity, and cerebral oxygen extraction during induction of anesthesia.
Anesthesiology 2002; 97:1363 70
80
CHAPTER 4
Study of the time course of the clinical effect of propofol compared with the time course of the predicted effect-site concentration: performance of three pharmacoki-netic dynamic models
British Journal of Anaesthesia 104 (4): 452 8 (2010)
M. Coppens, J. G. M. Van Limmen, T. Schnider, B. Wyler, S. Bonte, F. Dewaele, M. M. R. F.
Struys and H. E. M. Vereecke
Introduction
In this study we investigated the performance of 3 effect-site controlled drug titration algorithms in an ASA 1
and 2 population. One would expect that in such a population the estimated effect-site concentration has a con-
stant function with the desired clinical effect. We studied whether the respective effect-site controlled titration
algorithms allow to maintain this desired clinical effect over time, once the corresponding effect-site concentra-
tion in the individual patient is known and targeted. We therefore expected the BIS to stay at a constant level
corresponding with loss of response to name calling in every patient. Nevertheless this was not the case. Pa-
tients woke up (Marsh) or BIS decreased (Schnider). The models are developed in different ways, have differ-
ent parameters and hence generate different infusion rates when used in effect-site controlled TCI.
PK and PD estimates are closely linked to one another, they contribute to the (in-) accuracy of the estimated
effect-site concentration to correlate with a clinical effect. Therefore optimal PK-PD model building should
always be estimated simultaneously within one study population.
81

Study of the Time Course of the Clinical Effect of Propofol versus the Time Course of the Predicted
Effect-site Concentration of Propofol. Performance of Three Pharmacokinetic-dynamic Models in
Steady-State Conditions.
Marc Coppens, MD, Jurgen Van Limmen, MD, Thomas Schnider, Prof. Dr. med., Barbara Wyler, MSc,
Sjoert Bonte, BSc, Frank Dewaele, MD, Michel MRF Struys, Prof., M.D, PhD, Hugo EM Vereecke, MD,
PhD
Abstract
Background: In the ideal pharmacokinetic-dynamic (PK-PD) model for calculating the predicted effect-
site concentration of propofol (CePROP), for any CePROP the corresponding hypnotic effect should be con-
stant. We compared three PKPD models (Marsh PK with Shüttler PD, Schnider PK with fixed ke0, and
Schnider PK with Minto PD) in their ability to maintain a constant bispectral index (BIS), while using the
respective effect-site controlled target controlled infusion (TCI) algorithms.
Methods: e0= 0.26 min-1), Group S1 or
th a fixed ke0 = 0.456 min-1 or a ke0 adapted to a fixed time to peak effect =
1.6 min, respectively). All patients received propofol at constant rate until loss of consciousness. The cor-
responding CePROP, as calculated by the respective models, was set as target for effect-site controlled TCI.
We observed BIS for 20min. We hypothesized that BIS remains constant if CePROP remains constant over
time.
Results: All patients in group M woke up, one in group S1 and none in group S2. In groups S1 and S2,
BIS remained constant after 11 minutes of constant CePROP, at a more pronounced level of hypnotic drug
effect than intended.
Conclusions: Targeting CePROP at which patients lose consciousness with effect-site controlled TCI does
not translate into an immediate constant effect.
82

Introduction
Three compartmental pharmacokinetic (PK) models are used in target controlled infusion (TCI) pumps to
predict plasma-concentrations of propofol (CpPROP), based on drug input1-4. As the plasma is not the site of
drug effect, hysteresis exists between CpPROP and clinical effect. Extending the PK model with an effect
compartment enables modeling of the effect-site concentration of propofol (CePROP
5. The extension of the PK model with a PD model requires one addi-
tional transfer constant, called ke0. The relationship between CePROP and effect is governed by a static (time
independent) non-linear (sigmoidal) relationship. Therefore, a change in CePROP should directly translate
into a change of effect without time delay.
In TCI pumps, concentrations at the effect site are calculated with different pharmacokinetic models and
different ke0. In this study, we investigate differences in time course between CePROP and clinical effect
between models. We compare three PK-PD models to predict CePROP corresponding with loss of response
to name calling (LORNC). Subsequently, we use the respective effect-site controlled TCI algorithms to
maintain a constant CePROP. We hypothesized that by targeting CePROP compatible with LORNC, the clini-
cal signs of consciousness and bispectral index (BIS) should remain constant.
Materials and Methods
After institutional Ethics Committee approval (University Hospital, Ghent, Belgium), informed consent
was obtained from 60 American Society of Anesthesiologists I patients, aged between 18 and 65 years,
scheduled for minor ambulatory surgery. Exclusion criteria were weight less than 70% or more than 130%
of ideal body weight, neurological disorder, and recent use of psychoactive medication, including alcohol.
All measurements for this study were performed before surgery.
An 18 gauge intravenous line was positioned at a large forearm vein. Every patient received about 300ml
of crystalloid fluid during the study period. No fluid load was given before induction of anesthesia. No
patient received preoperative medication. No other drugs, including opioids, were given during the study
period. All patients maintained spontaneous breathing with the use of a face mask delivering 100% of
oxygen at 6 L/min.
83

Heart rate and non-invasive blood pressure, arterial oxygen saturation and capnography were recorded at
1-min time intervals using an S-5 monitor (GE Healthcare, Helsinki, Finland). Capnography was moni-
tored by putting the side stream sample line in the face mask of the patient. This implies an error for quan-
tification of the partial pressure of carbon dioxide, but it enabled monitoring of respiratory rate and free
airway.
During the study period, bispectral Index (BIS) was derived from the frontal electroencephalogram (At-
Fpzt) and calculated by a BIS® XP Monitor(version 4.0) (Aspect Medical Systems, Norwood, MA, USA)
using a BIS-Sensor electrode (Aspect Medical Systems, Inc., Norwood, MA, USA). The smoothening
time of the BIS monitor was set at 15 seconds.
All data was captured using RUGLOOPII (Demed, Temse, Belgium), a computer-assisted data manage-
ment device, that simultaneously drives and controls an Asena GH Infusion Pump (Carefusion, Basing-
stoke, UK) for the administration of propofol. At the start of the study, propofol 1% is administered at
300 ml/h. Meanwhile, the corresponding effect-site concentration of propofol (CePROP) is calculated in a
time synchronized way by RUGLOOPII using one of the studied PK-PD models, defined by randomiza-
tion. At any given time, the researcher was able to switch this regular propofol administration to an effect-
site controlled target controlled infusion (TCI) setting, using the same PK-PD parameters.
Before starting the drug administration, all patients were asked to close their eyes and relax for two
minutes. During that time, signal quality, impedance of the electrodes and the adequate capturing of all
parameters by RUGLOOPII was verified. Propofol 1% was started at 300 ml/h. The propofol infusion was
maintained until we observed loss of response to name calling (LORNC). At LORNC, the corresponding
CePROP, as calculated by one of the three studied PK-PD models, was set as a target for effect-site con-
trolled TCI administration, using the same PK-PD model as defined by the randomization process. This
effect-site controlled TCI of propofol was maintained for an additional 20 minutes if feasible. During that
time the clinical level of consciousness was verified by repeated name calling every 15 seconds. BIS was
also observed during the entire study period as an objective quantification of cerebral hypnotic effect.6
The study period ended after 20 minutes of measurements or when a patient regained consciousness
(ROC) defined as a return of responsiveness on name calling.
LORNC was defined as a transition from level 3 to 2 on the modified Observers Assessment of Alertness
and Sedation (OAA/S) scale.6-7 To avoid inter-observer differences for defining LORNC, the methodology
was standardized according to a predefined sequence of actions. Before induction, the patients were asked
84

on the RUGLOOPII case time) until no response was observed. If the patient did not respond within 5
seconds after name calling, the name was repeated twice. When the patient did not respond to the second
name calling, the OAA/S was set at 2. A positive response to the second name calling was classified as
OAA/S = 3. In that case, an additional 15 seconds delay was respected before repeating the name calling.
We randomized all patients to one of three study groups. For Group M, the effect-site concentration was
calculated by the PK model of Marsh extended with a ke0 = 0.26 min-1.3,4,8,9 This model has been com-
mercialized for plasma controlled TCI in the Diprifusor® Infusion module. (AstraZeneca, Brussels, Bel-
gium). In this commercialized device the calculated CePROP is only available as background information.
The Marsh PK-PD parameters are currently not commercially available for effect-site controlled TCI, but
RUGLOOPII overruled this limitation, and was set to allow effect-site controlled TCI with this parameter
set.
For Group S1 and S2, the pharmacokinetic parameters as described by Schnider were used. In group S1,
the original PK-PD model of Schnider was used. In this model ke0 is constant for all individuals (0.456
min-1)2. This model is commercially available in the Fresenius Base Primea (Fresenius Vial Infusion Sys-
tems, Brézins, France).
For Group S2, the pharmacokinetic parameters are identical to group S1, but CePROP was computed using
the time-to-peak effect (TTPE) method as described by Minto et al.10 CePROP is calculated to yield a con-
stant TTPE between individuals of 1.6 min (=101sec) after bolus injection, resulting in a individually var-
iable ke0.10 This model is commercially available in the Asena PK pump for effect-site controlled TCI.
(Carefusion, Basingstoke, UK)
All parameters of the PK-PD models can be found in detail in table 1.
85

Tab
le 1
: T
he
thre
e st
ud
ied
PK
PD
mod
els.
LB
M =
Lea
n b
od
y m
ass
Ta
ble
1:
PK
PD
Mo
del
para
mete
rs
V1
(L/k
g)
k10 (
min
-1)
k12
(min
-1)
k21
(min
-1)
k13
(min
-1)
k31
(min
-1)
ke0
(min
-1)
TT
PE
(sec)
Mars
h/
Sh
ütt
ler
0.2
28
0.1
19
0.1
12
0.0
55
0.0
42
0.0
033
0.2
6
270
V1 (
L)
V2 (
L)
V3 (
L)
Cle
ara
nce 1
C
leara
nce 2
C
leara
nce 3
ke0
(min
-1)
TT
PE
(sec)
Sch
nid
er
PK
PD
4.2
7
18.9
-[0
.39
x(a
ge
-53)]
23
8
1.8
9+
[(h
eig
ht -
17
7)
x0.0
264]+
[(w
eig
ht-
77)
x0.0
456] +
[(LB
M-5
9)
x
(-0.0
681)]
0.3
02 -
0.0
056 x
(age-5
3)
[1.2
9 -
0.0
24x
(age -
53)]
/[1
8.9
- 0
.39 x
(age-5
3)]
0.4
56
92
(+/-
4)
V1 (
L)
V2 (
L)
V3 (
L)
Cle
ara
nce 1
C
leara
nce 2
C
leara
nce 3
ke0
(min
-1)
TT
PE
(sec)
Sch
nid
er
PK
/ M
in-
to P
D
4.2
7
18.9
-[0
.39
x(a
ge
-53)]
23
8
1.8
9+
[(h
eig
ht -
17
7)
x0.0
264]+
[(w
eig
ht-
77)
x0.0
456] +
[(LB
M-5
9)
x
(-0.0
681)]
0.3
02 -
0.0
056 x
(age-5
3)
[1.2
9 -
0.0
24x
(age -
53)]
/[1
8.9
- 0
.39 x
(age-5
3)]
0.3
62
(+/-
0.0
4)
10
1
86

Statistical analysis
Statistical significance was set at p<0.05 except mentioned otherwise. Differences in demographics
between groups are tested using Anova except mentioned otherwise. All haemodynamic and electro-
encephalographic data are extracted from RUGLOOPII using LABGRAB software (Demed, Temse,
Belgium) in 5 seconds intervals. We compared the CePROP compatible with LORNC in all groups, us-
ing Anova.
For BIS, we averaged all individual BIS values per minute and calculated the mean population BIS
and standard deviation per minute for the duration of the study. Steady-state in BIS was defined as a
non significant difference between the respective mean BIS over consecutive minutes, as found by a
repeated measures ANOVA with Tukey-Kramer post hoc test.
Results
Demographics are shown in table 2. Groups are not significantly different for age, weight, length and
LBM. Group S2 contains a higher number of male participants compared to group M and S1. The time
to LORNC and the BIS compatible with LORNC were also not significantly different between groups.
(Table 2)
Figure 1 (A, B and C) shows the individual CpPROP and CePROP versus time for group M, S1 and S2
respectively. The mean CePROP compatible with LORNC was significantly different between groups
(p<0.0001), being 1.96 (+/-0.55), 5.54 (+/-0.75) and 5.08 (+/-1.20) µg/ml for group M, S1 and S2 re-
spectively. The mean CePROP at LORNC was not significantly different between groups S1 and S2.
In group M, we found that all patients regained consciousness after a mean duration of 401 (+/-102)
sec. In contrast, in Group S1, only one patient regained consciousness after 505 seconds of propofol
titration and all patients remained unconscious in group S2 throughout the entire study period.
Figure 2 shows the individual BIS measurements over time (figure 2A,C,E) and the corresponding
mean BIS values for every minute of measurement (figure 2 B,D,F). Steady state in BIS values was
found after respectively 6 minutes in group M, and 11 minutes in both S1 and S2. (Indicated by stars
in figure 2B, 2D and 2E) For group M, this steady-state in BIS was only found after return of con-
sciousness occurred in all patients, at a clinically relevant lighter level of hypnotic drug effect than
intended. For group S1 and S2,
87

Fig 1 The individual plasma-(dotted line) and effect-site concentration (full line) versus time in Group M
model with a fixed ke0) (B), and Group S2 ( model with a
fixed TTPE) (C)
88

e0) (
with a fixed TTPE) (E and F).*steady state condition in BIS (non significant BIS changes).
89

BIS showed a more pronounced hypnotic drug effect during steady-state (min 11) compared with the
mean BIS at LORNC. (Table 3) Additionally, between minutes 11 and 20, BIS of group S1 was al-
ways significantly lower compared to BIS in group S2. (Table 3)
Discussion
In an accurate PK-PD model for propofol, any predicted CePROP should be time independently and
unequivocally related to hypnotic effect. Although the estimated CePROP at LORNC was kept constant
in our study, we found that all three studied PK-PD models failed to maintain a constant hypnotic ef-
fect over time. When using the Marsh PK-PD parameter set, all patients woke up and BIS increased
over time. In contrast, when using two PD variations of the Schnider PK model, BIS decreased for
several minutes, indicating a progressively intensifying hypnotic effect. Only after 11 minutes of ef-
fect-site controlled TCI titration, both CePROP and BIS remained constant over time.
The discrepancy in performance results from differences between models, both on a PK and PD level.
First, Schnider et al.2 estimated a smaller central compartment volume for propofol compared with
Marsh et al. When the volume of the central compartment of any PK-PD model is decreased, a contin-
uous infusion of propofol will result in a faster increase of CpPROP, provided that the other volumes and
equilibration constants remain identical. Therefore, the larger central compartment of the Marsh model
might be a determinant of the slower increase in CpPROP in group M compared with groups S1 and S2.
The significantly lower CpPROP at LORNC in group M unavoidably affects CePROP at LORNC, which
was also significantly lower in group M compared with the other groups.
90

After LORNC, we switched to effect-site controlled TCI, using the respective predicted CePROP at
LORNC as a target. At that time, the pump will temporarily stop infusing propofol until CpPROP and
CePROP are in equilibrium. The time to equilibrate CpPROP and CePROP is determined both by the charac-
teristics of the three compartmental PK model and ke0. A higher ke0 reflects a more rapid equilibration
between the central compartment and the effect-site. The fixed ke0=0.456min-1 of group S1, and the
variable ke0=0.362 (+/-0.04) min-1 of group S2 are both considerably larger than the ke0=0.26 min-1 of
group M.8-9 Theoretically, the combination of both PK and PD model differences between groups,
might have resulted in a comparable equilibration time. However, in our study, the pump in groups S1
and S2 was prompted to restart propofol administration before return of consciousness could occur,
whereas in group M, the pump did not deliver any propofol for a long time and all patients regained
consciousness. (Table 4)
We stopped measuring once ROC occurred, as our patients were undergoing elective surgery. We
manually administered additional propofol after ROC to evoke anesthesia compatible with the planned
surgery. One can only speculate what would have happened if we had continued the TCI titration in
group M. Either patients might have remained responsive while experiencing a light level of sedation
(in steady-state) or at the other hand, we might equally observe patients who lose consciousness
again, once propofol restarts, as instructed by the PK-PD model. Our study design does not allow a
conclusive statement on this possibility.
Comparing results in group S1 and S2, we observed a comparable behaviour in clinical observations
and BIS. In group S1, one patient woke up after 505 sec, whereas, in group S2, all patients remained
unconscious. Apart from the only exception in group S1, mean BIS decreased in both groups during
11 minutes, indicating a progressively intensified hypnotic drug effect over time in most patients. This
observation can be a reflection of inaccuracy of the PK-PD model. On the other hand it might equally
be a
91

occurred
concentration of propofol for falling asleep compared with maintaining the unresponsiveness, the BIS
is expected to go down even when CePROP at LORNC is kept constant over time. Some evidence is
available that loss of consciousness and return of consciousness are the result of separate neuro-
physiological pathways.11 Additionally, the level of adrenergic activity in the awake might be involved
in a higher need for propofol to evoke LORNC compared to maintaining a comparable level of unre-
sponsiveness when the adrenergic tone is suppressed. If these assumptions are confirmed in future
studies, a temporary decrease in BIS is to be expected in our study setting. After reconsideration of
these assumptions, we conclude that an overlapping time course of the BIS effect and CePROP as hy-
pothesized in this study is not something we can expect as a proof of accuracy of the PK-PD model.
PROP a-
tionship) between each other over time. (e.g. Effect = some parameter x CePROP)
A better understanding of the covariates that determine the duration of inconsistency between a con-
stant CePROP and an observed hypnotic effect could help researchers to better target anesthetic steady
state conditions. Many covariates can be suspected that affect the time to obtain steady state. First, a
Table 4: Time of the pump inactivity after LORNC *P<0.001(ANOVA) between
Groups M and S1, and Groups M and S2. $
P>0.05(ANOVA) between Groups S1 and S2
Group M Group S1 Group S2
Mean pump inactivity time (s) 233* 102*$ 81*$
SD 105 32 20
n 20 20 20
high induction speed (of more than 6000 ml/h) interferes with the estimation of ke0, as published by
Struys et al.12 In contrast, moderate induction speeds appear to be a relevant covariate in the PK rather
than in the PD part of the model.13 In our study, we administered propofol at moderate speed of 3000
mg/h. The time to reach steady state could therefore be different with induction speeds other than 3000
mg/h. Secondly, the value of the measurement of hypnotic drug effect must be considered. Different
clinical endpoints or surrogate measures of cerebral hypnotic drug effect relate differently with CePROP
and will affect time to reach steady state. When using solitary effect-site controlled TCI of propofol, it
remains challenging to predict the time course of a corresponding effect. It seems inevitable to use a
surrogate quantification of cerebral hypnotic drug effect (such as BIS) to detect the exact onset time of
the steady-state condition. Additionally, such measurements can help to readjust CePROP towards a
predefined hypnotic drug effect. The major strength of the effect-site controlled TCI technology lies
92

not in predicting the resulting hypnotic effect in the individual patient, but rather in its ability to main-
tain the pharmacological condition once a predefined clinical effect has been reached.
In conclusion, when targeting a constant CePROP at LORNC by means of effect-site controlled TCI
using three different PKPD models, we observed either recovery (Marsh model) or intensifying hyp-
notic effect (Schnider PK model with fixed ke0 or fixed TTPE). Therefore, surrogate measures of hyp-
notic drug effect, such as bispectral index (BIS), remain a valuable tool to provide the clinician with
additional information on the correlation between time courses of CePROP versus the observed clinical
effect.
93

REFERENCES
1.Schnider TW, Minto CF, Gambus PL, et al. The influence of method of administration and covariates on
the pharmacokinetics of propofol in adult volunteers. Anesthesiology 1998; 88: 1170-82
2.Schnider TW, Minto CF, Shafer SL, et al. The influence of age on propofol pharmacodynamics. Anesthe-
siology 1999; 90: 1502-16
3.Coetzee JF, Glen JB, Wium CA, Boshoff L. Pharmacokinetic model selection for target controlled infu-
sions of propofol. Assessment of three parameter sets. Anesthesiology 1995; 82: 1328-45
4.Marsh B, White M, Morton N, Kenny G. Pharmacokinetic model driven infusion of propofol in children.
Br J Anaesth 1991; 67: 41-8
5.Verotta D, Sheiner LB. Simultaneous modeling of pharmacokinetics and pharmacodynamics: an improved
algorithm. Comput Appl Biosci 1987; 3: 345-9
6.Struys MM, Vereecke H, Moerman A, et al. Ability of the bispectral index, autoregressive modelling with
exogenous input-derived auditory evoked potentials, and predicted propofol concentrations to measure pa-
tient responsiveness during anesthesia with propofol and remifentanil. Anesthesiology 2003; 99: 802-12
7.Chernik D, Gillings D, Laine H, et al. Validity and reliability of the Observer's Assessment of Alert-
ness/Sedation Scale: study with intravenous midazolam. J Clin Psychopharmacol 1990; 10: 244-51
8.Schuttler J, Ihmsen H. Population pharmacokinetics of propofol: a multicenter study. Anesthesiology
2000; 92: 727-38
9.Schuttler J, Stoeckel H, Schwilden H. Pharmacokinetic and pharmacodynamic modelling of propofol
('Diprivan') in volunteers and surgical patients. Postgrad Med J 1985; 61 (Suppl 3): 53-4
10.Minto CF, Schnider TW, Gregg KM, Henthorn TK, Shafer SL. Using the time of maximum effect site
concentration to combine pharmacokinetics and pharmacodynamics. Anesthesiology 2003; 99: 324-33
11.Kelz MB, Sun Y, Chen J, et al. An essential role for orexins in emergence from general anesthesia. Proc
Natl Acad Sci U S A 2008; 105: 1309-14
12.Struys MM, Coppens MJ, De Neve N, et al. Influence of Administration Rate on Propofol Plasma-Effect
Site Equilibration. Anesthesiology 2007; 107: 386-96
13.Masui K, Kira M, Kazama T, Hagihira S, Mortier EP, Struys MM. Early Phase Pharmacokinetics but Not
Pharmacodynamics Are Influenced by Propofol Infusion Rate. Anesthesiology 2009
94
CHAPTER 5
An Evaluation of Using Population Pharmacokinetic Models to Estimate Pharmacodynamic Parameters for Propofol and Bispectral Index in Children
Anesthesiology 2011; 115:83 93
Marc J. Coppens, M.D.,Douglas J. Eleveld, Ph.D., Johannes H. Proost, Pharm.D., Ph.D.,Luc A.
M. Marks, D.D.S., Ph.D.,Jan F. P. Van Bocxlaer, Pharm.D., Ph.D.,
Hugo Vereecke, M.D., Ph.D.,Anthony R. Absalom, M.D., Michel M. R. F. Struys, M.D., Ph.D.
Introduction
In the first study it was shown that using flawed estimated plasma concentrations could result in
pharmacodynamic parameters of poor accuracy.
The following article is a validation of the Kataria model. We showed that the Kataria model is biased and
inaccurate. When the Kataria model (just like any other currently used model) is used to estimate plasma
concentrations the PD parameters of the combined PK-PD model are also inaccurate.
Rigouzzo used the Schnider model to estimate plasma concentrations and concluded that the Schnider
model is accurate to describe the PD of propofol in children. We agree with Rigouzzo that the model is
accurate in describing the PD of propofol but warn for the complete inaccuracy of the Schnider model for
describing the PK of propofol..Additionally we propose a new combined PK-PD model for propofol TCI in
children.
95

An Evaluation of Using Population Pharmacokinetic Models to Estimate Pharmacodynamic
Parameters for Propofol and Bispectral Index in Children
Marc J. Coppens, M.D., Douglas J. Eleveld, Ph.D., Johannes H. Proost, Pharm.D., Ph.D., Luc A. M.
Marks, D.D.S., Ph.D., Jan F. P. Van Bocxlaer, Pharm.D., Ph.D., Hugo Vereecke, M.D., Ph.D., Antho-
ny R. Absalom, M.D., Michel M. R. F. Struys, M.D., Ph.D.
ABSTRACT
Background: To study propofol pharmacodynamics in a clinical setting a pharmacokinetic model
must be used to predict drug plasma concentrations. Some investigators use a population pharmacoki-
netic model from existing literature and minimize the pharmacodynamic objective function. The pur-
pose of the study was to determine whether this method selects the best-performing pharmacokinetic
model in a set and provides accurate estimates of pharmacodynamic parameters in models for
bispectral index in children after propofol administration.
Methods: Twenty-eight children classified as American Society of Anesthesiologists physical status 1
who were given general anesthesia for dental treatment were studied. Anesthesia was given using tar-
get-controlled infusion of propofol based on the Kataria model. Propofol target plasma concentration
was 7 µg/ml for 15 min, followed by 1 µg/ml for 15 min or until signs of awakening, followed by 5
µg/ml for 15 min. Venous blood samples were taken 1, 2, 5, 10, and 15 min after each change in tar-
get. A classic pharmacokinetic-pharmacodynamic model was estimated, and the methodology of other
studies was duplicated using pharmacokinetic models from the literature and (re-)estimating the
pharmacodynamic models.
Results: There is no clear relationship between pharmacokinetic precision and the pharmacodynamic
objective function. Low pharmacodynamic objective function values are not associated with accurate
estimation of the pharmacodynamic parameters when the pharmacokinetic model is taken from other
sources.
Conclusion: Minimization of the pharmacodynamic objective function does not select the most accu-
rate pharmacokinetic model. Using population pharmacokinetic models from the literature
i
incorrectly estimating the pharmacodynamic parameters.
96

PROPOFOL is widely used to manage the hypnotic component of anesthesia in children because of its
beneficial pharmacologic characteristics, although caution is warranted in relation to side effects such
as the propofol infusion syndrome.1
Pharmacokinetic-pharmacodynamic (PK-PD) models predicting
the time course of drug concentration and effect might be helpful to optimize drug administration if
found to be an accurate prediction of reality. A number of population pharmacokinetic models have
been developed to predict propofol plasma concentrations in children for arterial blood samples,2 4
venous blood samples,5 7 or both.8 In two recent studies, Rigouzzo et al.9,10 suggested that a propofol
model describing the PK-PD relationship in adults11,12 might be used in children. Some of these popu-
lation pharmacokinetic models are used in target-controlled infusion (TCI) regimens to modulate pre-
dicted propofol plasma concentrations. However, plasma concentrations are only of secondary im-
portance in anesthesia because plasma is not the site of drug effect. For propofol anesthesia, cerebral
drug effects can be measured and are quantal (e.g., loss and return of consciousness, tolerance to nox-
ious stimulus) or continuous (e.g., electroencephalographic data) in nature. The Bispectral Index (BIS,
Covidien, Norwood, IL), a quantitative parameter derived from the frontal electroencephalogram, has
been validated as a measure of propofol cerebral drug effect in children older than 1 yr.9,10,13,14
To study propofol pharmacodynamics in a clinical setting, where dosing varies according to patient
requirements, a pharmacokinetic model must be used to predict drug plasma concentrations. The
methodologically best approach is the classic PK-PD approach in which population and individualized
pharmacokinetic models are estimated using blood samples drawn from the study patients and the
individualized pharmacokinetic model used for subsequent pharmacodynamic estimation. However,
drawing blood samples is not always practical or possible in some clinical situations. Some investiga-
tors have instead applied what we describe in this investigation as the PK(predicted)-PD approach,
where the individualized pharmacokinetic model is replaced by a population pharmacokinetic model
obtained from existing literature. This fixed population model is then used to produce the pharmacoki-
netic predictions necessary to study the pharmacodynamics. In this investigation, to clarify the particu-
can be changed to indicate the origin of the
pharmacokinetic model. For example, a PK (Kataria)-PD model indicates that the Kataria model6 was
used for pharmacokinetic predictions.
The PK (predicted)-PD approach leads to questions about the accuracy of the population predictions
for individuals in a particular clinical situation. One approach is to simply take the accuracy for grant-
ed.15 This seems difficult to justify because a number of pharmacokinetic models
97

are available in the literature, each giving different predictions for a given situation. Another approach
is to consider a number of pharmacokinetic models and choose the best one based on some quality of
the corresponding pharmacodynamic estimation, such as the objective function.10,16 This approach
assumes that the best-performing pharmacokinetic model can be identified by the lowest objective
function from the corresponding pharmacodynamic estimation. However, this relationship has not yet
been experimentally demonstrated. Studies using this approach also estimate important pharma-
codynamic model parameters, such as effect-site equilibration constant (ke0) or the effect-site concen-
tration for 50% effect (Ce50), by minimization of the pharmacodynamic objective function. However,
there is no evidence that low values for the objective function are associated with accurate estimation
of these parameters when the pharmacokinetic model is taken from other sources. It has been recently
shown that fundamental flaws can be introduced when applying predicted instead of measured
propofol plasma concentration when investigating the half-life for the effect-site equilibration in
adults.17 19
The purpose of the current study was to test two hypotheses: that the PK (predicted)-PD approach
selects the best-performing pharmacokinetic model from those considered, and that the PK (predict-
ed)-PD approach provides accurate estimates of pharmacodynamic model parameters. We performed
propofol TCI-driven anesthesia on children and obtained propofol plasma concentrations from blood
samples and BIS values as a measure of cerebral drug effect. From these data we estimated a classic
PK-PD model, where both a pharmacokinetic and pharmacodynamic model is estimated. We also du-
plicated the methodology of other studies by estimating PK (predicted)-PD models, i.e., using phar-
macokinetic models from the literature and (re-)estimating only the pharmacodynamic models. By
comparing the estimation results of the different approaches we determined the ability of the PK (pre-
dicted)-PD approach to identify the best-performing pharmacokinetic model and provide informative
estimates for the true pharmacodynamic parameters.
Materials and Methods
Clinical Protocol
After Ethics Committee approval (Ghent University Hospital, Gent, Belgium), clinical trial registra-
tion (EUDRACT 2005-001797-27), written informed consent of the parents or legal representative
obtained by the dentist, and a clinical examination done by the anesthesiologist, 28 children classified
as American Society of Anesthesiologists physical status 1 were enrolled in the study. Patients were
divided in four groups according to age: 7 children age 3 5 yr in group 1, 7 children age 5 7 yr in
group 2, 7 children age 7 9 yr in group 3, and 7 children age 9 11 yr in the fourth group. All children
98

Exclusion criteria were allergy to any of the constituents of propofol or local anesthetics, previous
adverse anesthetic experience, evidence of major preexisting disease, suspected difficult airway, con-
comitant disease, or antibiotic treatment. No premedication was offered to the patients. The skin was
locally anesthetized by applying eutectic mixture of local anesthetic cream (EMLA, AstraZeneca,
Ukkel, Belgium) over the site of the peripheral veins 1 h before the procedure.
Noninvasive monitoring (heart rate, noninvasive blood pressure monitoring, saturation, end-tidal car-
bon dioxide) was established before induction of anesthesia. The propofol cerebral drug effect was
continuously monitored using the bispectral index (BIS). BIS (version 4.0, XP) was derived from the
frontal electroencephalogram and calculated by the A-2000 BIS Monitor® (Covidien, Newton, MA)
using three BIS-Sensor electrodes (pediatric size) or the four-sensor electrode, depending on the pa-
f the BIS monitor was set to
15s.
Venous access was established with two 20-or 22-gauge peripheral intravenous cannulae. The first
cannula was connected to the infusion pump, and the second cannula was used for blood sampling.
The TCI system used to control the propofol infusion comprised a syringe infusion pump (Asena,
Carefusion, Basingstoke, United Kingdom) controlled by a computer programmed with RUGLOOPII
(Demed, Temse, Belgium) using a pharmacokinetic model for propofol administration in children, in a
study previously published by Kataria et al.6. Propofol was started at a target plasma concentration of 7
µg/ml for 15 min, followed by a target concentration of 1 µg/ml for another 15 min or until signs of
awakening (BIS more then 80, movement, eye opening). Finally, the infusion was followed by a target
plasma concentration of 5 µg/ml for 15 min. After initial loss of consciousness a laryngeal mask was
inserted. No opioid was administered. All children received a crystalloid infusion of 4 5 ml/kg/h dur-
ing the study. Each blood sample (2 ml per sample) was replaced by 2 ml of crystalloid solution. Dur-
ing the procedure the children were kept warm with a Bair Hugger (Arizant Healthcare, Eden Prairie,
MN). The complete study was executed before the start of surgery.
Venous blood samples were collected at baseline (upon placement of the cannula) and after 1, 2, 5, 10,
and 15 min at a target of 7 µg/ml. After decreasing the target concentration to 1 µg/ml, blood was
withdrawn after 1, 2, 5, 10, and 15 min when possible. After increasing the target concentration to 5
µg/ml, blood samples were obtained at 1, 2, 5, 10, and 15 min. At that time the study period was com-
pleted and the anesthesia was continued at the discretion of the anesthesiologist in charge. The collect-
ed blood samples (EDTA) of each child were centrifuged, and the obtained plasma was stored in a
refrigerator at a temperature at -80°C for further analyses. Propofol (bound and free) plasma concen-
trations were analyzed using a validated liquid chromatographic fluorescence detection method.
99
were scheduled for dental treatment under general anesthesia.
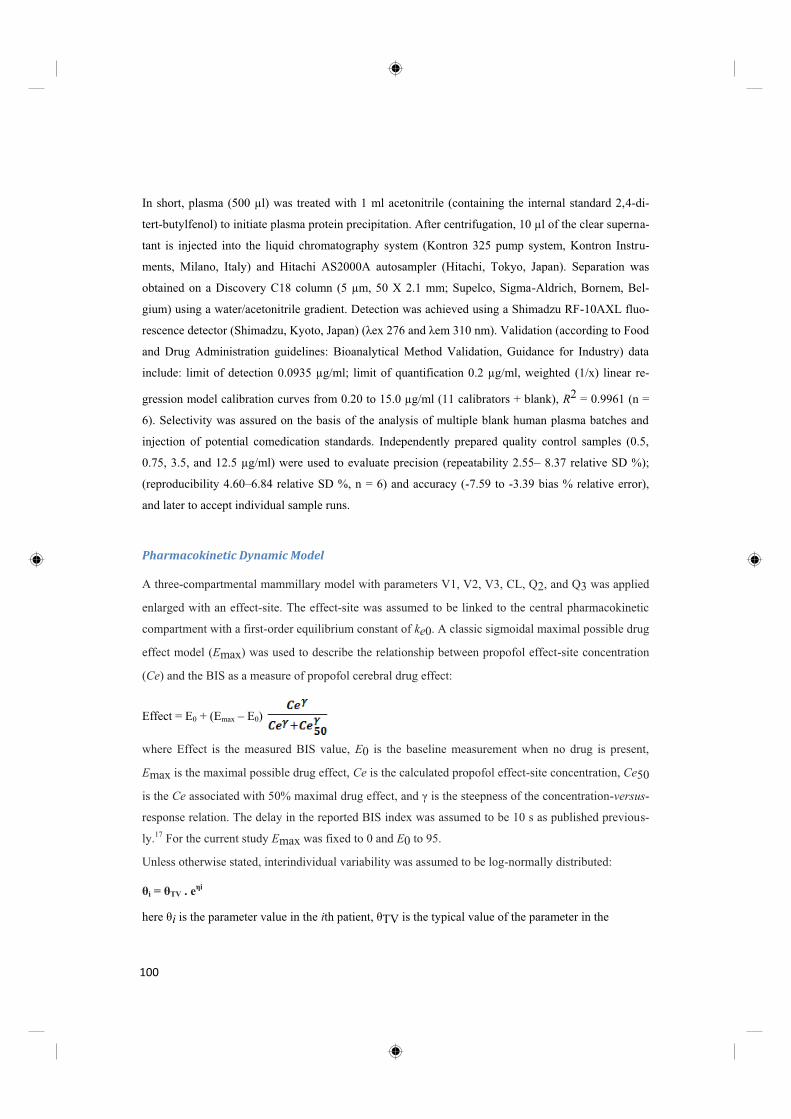
In short, plasma (500 µl) was treated with 1 ml acetonitrile (containing the internal standard 2,4-di-
tert-butylfenol) to initiate plasma protein precipitation. After centrifugation, 10 µl of the clear superna-
tant is injected into the liquid chromatography system (Kontron 325 pump system, Kontron Instru-
ments, Milano, Italy) and Hitachi AS2000A autosampler (Hitachi, Tokyo, Japan). Separation was
obtained on a Discovery C18 column (5 µm, 50 X 2.1 mm; Supelco, Sigma-Aldrich, Bornem, Bel-
gium) using a water/acetonitrile gradient. Detection was achieved using a Shimadzu RF-10AXL fluo-
rescence detector (Shimad
and Drug Administration guidelines: Bioanalytical Method Validation, Guidance for Industry) data
include: limit of detection 0.0935 µg/ml; limit of quantification 0.2 µg/ml, weighted (1/x) linear re-
gression model calibration curves from 0.20 to 15.0 µg/ml (11 calibrators + blank), R2 = 0.9961 (n =
6). Selectivity was assured on the basis of the analysis of multiple blank human plasma batches and
injection of potential comedication standards. Independently prepared quality control samples (0.5,
0.75, 3.5, and 12.5 µg/ml) were used to evaluate precision (repeatability 2.55 8.37 relative SD %);
(reproducibility 4.60 6.84 relative SD %, n = 6) and accuracy (-7.59 to -3.39 bias % relative error),
and later to accept individual sample runs.
Pharmacokinetic Dynamic Model
A three-compartmental mammillary model with parameters V1, V2, V3, CL, Q2, and Q3 was applied
enlarged with an effect-site. The effect-site was assumed to be linked to the central pharmacokinetic
compartment with a first-order equilibrium constant of ke0. A classic sigmoidal maximal possible drug
effect model (Emax) was used to describe the relationship between propofol effect-site concentration
(Ce) and the BIS as a measure of propofol cerebral drug effect:
Effect = E0 + (Emax E0)
where Effect is the measured BIS value, E0 is the baseline measurement when no drug is present,
Emax is the maximal possible drug effect, Ce is the calculated propofol effect-site concentration, Ce50
is the Ce is the steepness of the concentration-versus-
response relation. The delay in the reported BIS index was assumed to be 10 s as published previous-
ly.17 For the current study Emax was fixed to 0 and E0 to 95.
Unless otherwise stated, interindividual variability was assumed to be log-normally distributed:
i TV . e
i is the parameter value in the i TV is the typical value of the parameter in the
100

population, and i is a random variable in the ith patient with a mean of 0 and 2.
coefficient of variation in the standard domain.
Residual intraindividual variability for the observed propofol central compartment concentration was
modeled using constant coefficient of variance model, and for BIS index this was modeled using an
additive error model. Model estimation was performed using NONMEM VI 2.0 (ICON, Dublin, Ire-
land).
Classic PK-PD Approach. The sequential method20,21 was used. More specifically, a population
o-
ducing a population pharmacokinetic model and individual (post hoc) pharmacokinetic estimates. In
the second stage, the pharmacodynamic model population parameters are estimated with the individual
pharmacokinetic model parameters fixed to their post hoc estimates.
PK (Predicted)-PD Approach. In this approach, the patient pharmacokinetic model is fixed to one of
the previously published population pharmacokinetic models; these are shown in table 1. No pharma-
cokinetic estimation is performed because the time course of the propofol plasma concentration is
calculated from the fixed pharmacokinetic model, the patient covariates in the model, and the given
propofol dose per time. The pharmacodynamic model is estimated with a population approach using
Indices for Assessment
For all pharmacokinetic models, goodness-of-fit plots were constructed for each data set using each
model. The plots depict the predicted concentrations versus the observed concentrations of propofol.
In addition, the predictive performances of the pharmacokinetic models were analyzed using predic-
tion error analysis, as described by Varvel et al.22
Prediction error (PE) for plasma concentrations was calculated using the following equation:
Prediction error for BIS values was calculated using the following equation:
PE = BIS observed -BIS predicted
PE is an indication of the bias of the achieved concentrations, and the absolute value of the PE (|PE|)
is a measure of the precision.
101

PK model Parameters
Kataria 7 V1 = 0.41 * WGT
V2 = 0.78 * WGT _ 3.1 * AGE _ 16
V3 = 6.9 * WGT CL _ 0.035 * WGT
Q2 = 0.077 * WGT
Q3 = 0.026 * WGT
Paedfusor 2,29
V1 = 0.4584 * WGT
K10 = 0.1527 * WGT-0.3
K12 = 0.114
K21 = 0.055
K13 = 0.0419
K31 = 0.0033
Marsh 5
V1 = 0.343 * WGT
K10 = 0.1
K12 = 0.0855
K21 = 0.033
K13 = 0.021
K31 = 0.0033
Short 8
V1 = 0.432 * WGT
K10 = 0.0967
K12 = 0.1413
K21 = 0.1092
K13 = 0.0392
K31 = 0.0049
Rigby-Jones 3
V1 = 0.584 * WGT
V2 = 1.36 * WGT
V3 = 5.67 * WGT + 103
CL = 0.0302 * WGT
Q2 = 0.0160 * WGT
Q3 = 0.0133 * WGT
Rigby-Jones (multicenter) V1 = 7.76 * PWT
V2 = 14.4 * PWT
V3 = 83.9 * PWT
CL = 0.614 * PWT0.75
Q2 = 0.839 * PWT0.75
Q3 = 0.252 * PWT0.75
PWT = WGT / 15
Schuttler 9
V1 = 9.3 * PWT0.71
* (AGE / 30)-0.39
* (1 + BOL * 1.61)
V2 = 44.2 * PWT0.61
* (1 + BOL * 0.73)
V3 = 266
CL = 1.44 * PWT0.75
Q2 = 2.25 * PWT0.62
* (1 VEN * 0.40) * (1 + BOL * 2.02)
Q3 = 0.92 * PWT0.55
* (1 + BOL * (-0.48))
PWT = WGT / 70
VEN = 1 (venous samples)
BOL = 0 (infusion dosing, not bolus)
ShangGuan 4
V1 = 7.41 * PWT
V2 = 54.6 * PWT
V3 = 7.2 * PWT
CL = 0.185 * PWT0.75
Q2 = 0.614 * PWT0.75
Q3 = 0.692 * PWT0.75
PWT = WGT / 13.7
Schnider13,14
V1 = 4.27
V2 = 18.9 - 0.391 * (AGE - 53)
V3 = 238
CL = 1.89 + 0.0456 * (WGT - 77) - 0.0681 * (LBM - 59) + 0.0264 * (HGT - 177)
Q2 = 1.29 - 0.024 * (AGE - 53)
Q3 = 0.836
LBMmale = 1.1 * WGT - 128 * (WGT / HGT)2
LBMfemale = 1.07 * WGT - 148 * (WGT / HGT)2
Table 1 Propofol pharmacokinetic models from the literature.
102

For each individual, median prediction error (MDPE) and median absolute prediction error (MDAPE)
were calculated as measures of the accuracy and precision of the Cplasma prediction. In the ith sub-
ject:
MDPEi = median{PEij, j Ni}
where Ni is the number of PE values obtained for the ith subject. Hereby, an MDPE value of 0 means
no bias.
MDAPE indicates the precision of the Cplasma prediction. In the ith subject:
MDAPEi = median{| PEij |, j Ni}
where Ni is the number of PE values obtained for the ith subject. The closer to 0, the more precise is
the model.
To reflect the quality of the pharmacodynamic model and predictions the NONMEM objective func-
tion value was used. All of the objective function value comparisons concern estimation of the
pharmacodynamic model using the BIS pharmacodynamic observations from the current study in con-
junction with a fixed pharmacokinetic model, so the comparisons are valid.
Parameter units Typical value Relative standard deviation
V1 l/kg 0.174 84%
V2 l/kg 0.234 0 fixed
V3 l/kg 0.951 0 fixed
CL l/min/kg 0.0393 15.2%
Q2 l/min/kg 0.102 0 fixed
Q3 l/min/kg 0.0333 24.7%
Residual SD % 18.4
Table 2 PK model estimated from the plasma concentration observations from the current study
Results. reasons Data from all included 28 patients were used in the analysis. In total, 443 venous
blood samples were obtained and used for the analysis. In 5 patients, 1 blood sample was missing due
to technical reasons (1-min sample at plasma concentration [Cp] 1 in patient 1, 1-min sample at Cp7 in
patient 9, 15-min sample at Cp1 in patient 11, 1-min sample at Cp7 in patient 18, 1-min sample at Cp1
in patient 21). Nineteen boys and nine girls were included.
103

Their demographics were (median [min max]) age, 6.5 y (range, 4 11 y); weight, 21.5 kg (range, 18
54 kg); height, 119 cm (range, 105 152 cm). All NONMEM runs successfully completed the covari-
ance step and reported a condition number less than 1,000.
PK model PK performance PD estimation
MDPE MDAPE
Objective
function keo Ce50 SD(res)
(%) (%) (1/min) ( g/ml)
Posthoc 0.8 8.6 77385.25 0.79 3.85 1.50 7.9
population -0.6 14.0
asymptotic standard error 0.12 0.11 0.06 2.2
Table 3 PK predictive performance and results from PD model estimation
Classic PK-PD Approach
For the classic PK-PD approach, a three-compartment model fit the data. The typical values,
intraindividual and residual variability for the estimated population model, are shown in table 2. The
2,V3, and Q2 were fixed to 0 to obtain a stable estimation.
For all patients, the observed, population-predicted, and post hoc predicted plasma concentrations are
shown in figure 1. The observed/population predicted and observed/post hoc predicted plasma concen-
trations versus time and versus observed plasma concentrations graphs are shown in figure 1. Except
for some rather high plasma concentrations, an overall accurate fit was found as indicated by the
smoothed curves. This is reflected by the population and post hoc median (absolute) prediction errors
as shown in table 3.
104
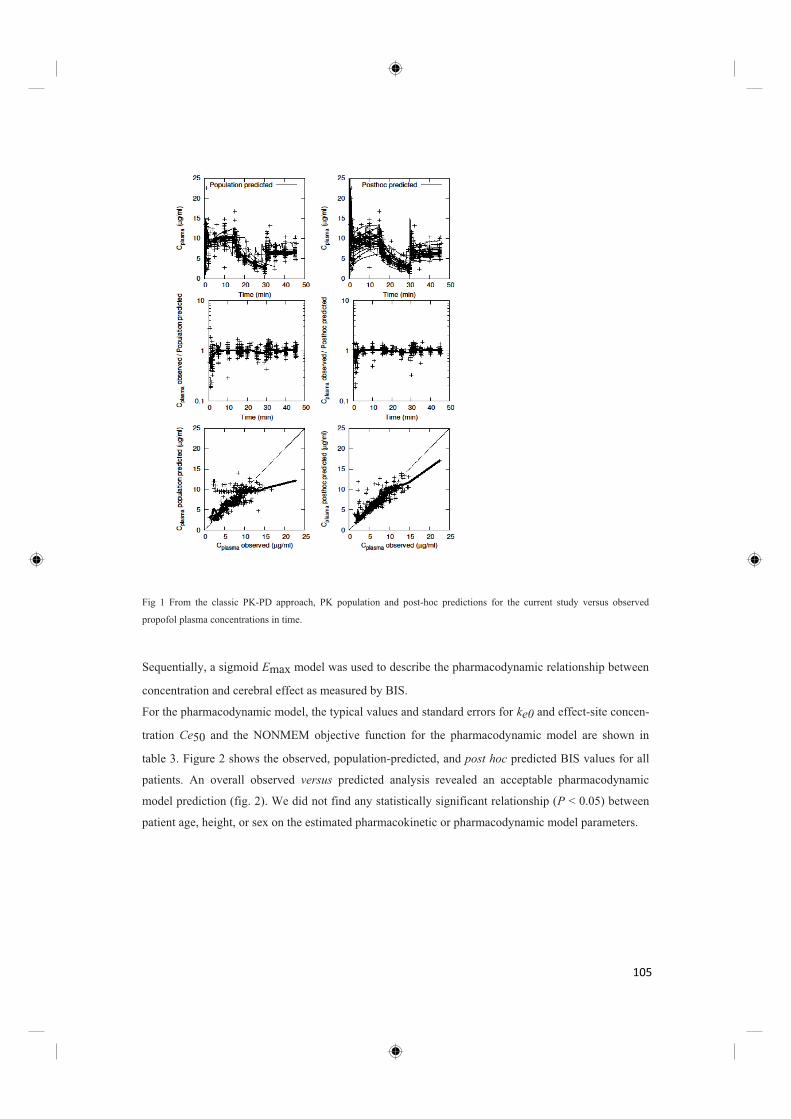
Fig 1 From the classic PK-PD approach, PK population and post-hoc predictions for the current study versus observed
propofol plasma concentrations in time.
Sequentially, a sigmoid Emax model was used to describe the pharmacodynamic relationship between
concentration and cerebral effect as measured by BIS.
For the pharmacodynamic model, the typical values and standard errors for ke0 and effect-site concen-
tration Ce50 and the NONMEM objective function for the pharmacodynamic model are shown in
table 3. Figure 2 shows the observed, population-predicted, and post hoc predicted BIS values for all
patients. An overall observed versus predicted analysis revealed an acceptable pharmacodynamic
model prediction (fig. 2). We did not find any statistically significant relationship (P < 0.05) between
patient age, height, or sex on the estimated pharmacokinetic or pharmacodynamic model parameters.
105

PK (Predicted)-PD Approach
For the PK (predicted)-PD approach, the pharmacokinetic predictions are obtained from the fixed
Fig 2 From the classic PK-PD approach, PD population and post hoc predictions for the current study vs observed BIS and
time. Observations are marked as (+) or as (smoothed) dotted line.
models described in table 1. For these applied pharmacokinetic models, figure 3 shows the relationship
between predicted versus observed propofol plasma concentrations and also depicts the ratio between
predicted/observed propofol plasma concentration versus time. The predictive performance of the
applied pharmacokinetic models is shown in table 4. The Marsh model shows the best and the
Schnider model the worst pharmacokinetic performance as measured by MDPE and MDAPE. We did
not see any advantage of pharmacokinetic models developed with venous samples to predict our (ve-
nous) samples. This suggests arterial versus venous sampling is dominated by other sources of varia-
tion. Differences in assay handling23 between studies and the distinction between blood and plasma
drug concentrations24 may also influence model performance.
A sigmoid Emax model was used to describe the pharmacodynamic relationship between concentra-
tion and cerebral effect as measured by BIS. The typical values for ke0 and effect-site concentration
Ce50 and the NONMEM objective function for the pharmacodynamic model are shown in table 4. The
PK (Schnider)-PD model gave the best pharmacodynamic fit, and the PK (Rigby-Jones)-PD model
gave the worst pharmacodynamic fit as indicated by the NONMEM objective function values.
106

Fig 3 From the PK (predicted)-PD approach, predicted versus observed graphs for propofol plasma concentrations for the PK
(predicted) models described in table 1.
107

Table 4: From the PK(predicted)-PD approach, pharmacokinetic predictive performance and results from pharmacodynamic
model estimation. MD(A)PE is median (absolute) performance error.
This PK (predicted)-PD approach assumes that the best-performing pharmacokinetic model can be iden-
tified by the lowest objective function from the corresponding pharmacodynamic estimation. Figure 4
shows these relationships for the data from the current study. There does not seem to be a clear relation-
ship between MDPE or MDAPE with the objective function from pharmacodynamic estimation. Thus,
it should not be assumed that this approach selects the best-performing pharmacokinetic model. In fact,
in our study, it selected the worst-performing pharmacokinetic model. Alternatively, one could rank the
models based on root mean squared error of the predictions; this can be seen as the SD of the residuals
(SD[res]) in table 4. In this case the ranking of models is identical to that from objective function value,
and the findings are same. Yet another ranking could be based on the MDAPE of the predictions, also
shown in table 4.
PK model PK performance PD estimation
MDPE MDAPE
Objective
function keo Ce50 SD(res) MDAPE
(%) (%) (1/min) ( g/ml) (BIS)
Kataria 31.3 34.1 75619.64 0.89 2.98 1.53 7.5 5.26
Paedfusor 10.4 19.0 75334.11 1.38 3.53 1.53 7.4 5.17
Marsh -1.3 15.9 76976.42 0.93 3.33 1.12 7.8 5.50
Short 17.0 23.1 76206.88 1.24 3.41 1.58 7.6 5.50
Rigby-Jones 4.4 21.6 80904.49 2.64 3.61 1.33 8.9 6.86
Rigby-Jones Multicenter 20.9 25.8 76001.34 1.47 3.18 1.47 7.6 5.36
Schuttler 10.2 21.8 77214.12 0.72 2.78 1.02 7.9 5.48
ShangGuan -1.0 20.7 74351.15 3.30 4.52 2.07 7.2 4.96
Schnider 41.4 46.9 74334.83 0.33 2.80 1.58 7.1 4.85
108

In this case the ranking of models is nearly identical, and the findings the same.
Fig 4 For the PK (predicted)-PD approach, the relationship between objective function and MD(A)PE for the PK models as
decribed in table 1. The point from the classic PK-PD approach is included. There is no clear relationship between PK preci-
sion and the PD objective function.
Studies using the PK (predicted)-PD approach also estimate pharmacodynamic parameters ke0, Ce50,
that low objective function values are associated with accurate estimation of these pharmacodynamic
parameters when the pharmacokinetic model is taken from other sources. Figure 5 shows the relation-
ship between objective function from the PK (predicted)-PD approach and its ability to estimate the
c parameters estimated by the classic PK-PD approach, which are marked by
crosshairs. It seems that for the PK(predicted)-PD approach, i.e., using a population pharmacokinetic
model taken from other sources, that minimization of the pharmacodynamic objective function does
not necessarily result in accurate estimates of the pharmacodynamic parameters.
109
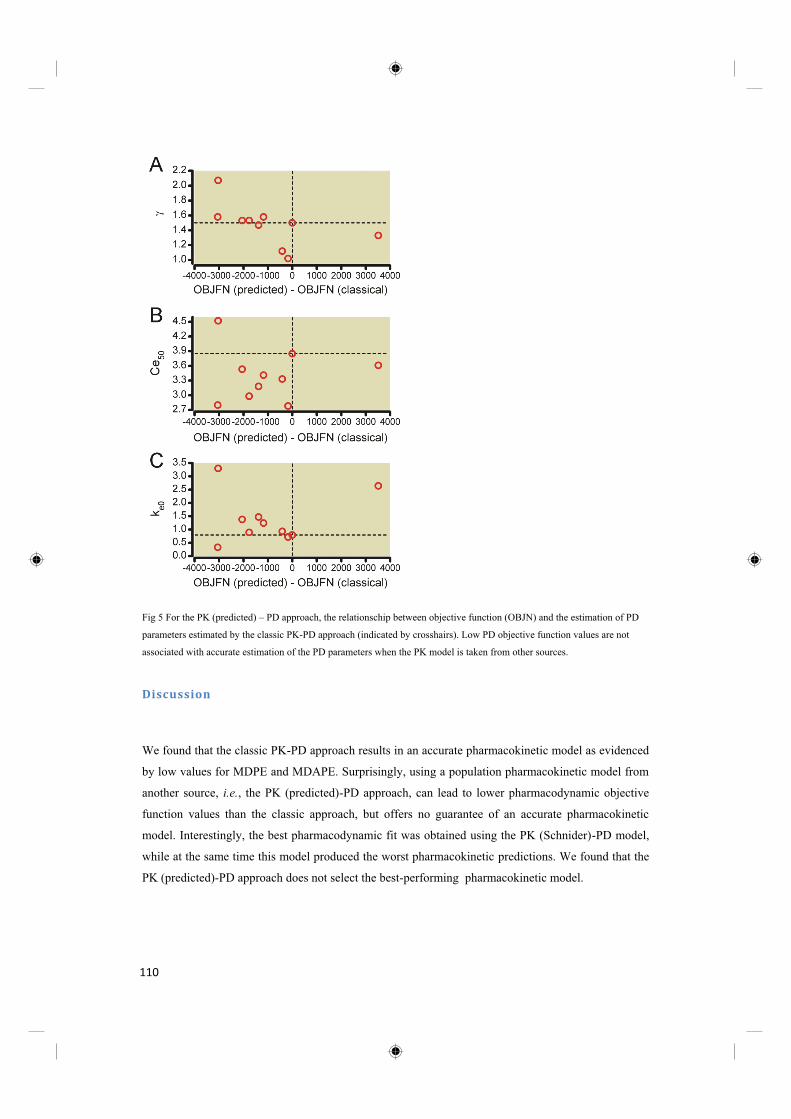
Fig 5 For the PK (predicted) PD approach, the relationschip between objective function (OBJN) and the estimation of PD
parameters estimated by the classic PK-PD approach (indicated by crosshairs). Low PD objective function values are not
associated with accurate estimation of the PD parameters when the PK model is taken from other sources.
Discussion
We found that the classic PK-PD approach results in an accurate pharmacokinetic model as evidenced
by low values for MDPE and MDAPE. Surprisingly, using a population pharmacokinetic model from
another source, i.e., the PK (predicted)-PD approach, can lead to lower pharmacodynamic objective
function values than the classic approach, but offers no guarantee of an accurate pharmacokinetic
model. Interestingly, the best pharmacodynamic fit was obtained using the PK (Schnider)-PD model,
while at the same time this model produced the worst pharmacokinetic predictions. We found that the
PK (predicted)-PD approach does not select the best-performing pharmacokinetic model.
110
Shafer et al. stated that the final validation of a model for TCI should be to apply it in a TCI setting
and to measure the plasma concentration.25 These validations have been performed for adults,11,12 but
not for children. Our study is a validation of the previously applied15 Kataria model6 for propofol
plasma-controlled, TCI-driven anesthesia on children. Similar to other models,10 we found that the
Kataria pharmacokinetic model was biased and inaccurate, evidenced by poor MDPE and MDAPE.
The Marsh and ShangGuan models showed low pharmacokinetic bias (MDPE) and the Marsh model
the best precision (MDAPE). We also considered the Schnider model, despite its derivation from an
adult population, because a recent publication suggested it may provide acceptable PK-PD perfor-
mance in children.26 However, in our study it showed pharmacokinetic bias and was inaccurate. Our
results are in agreement with others,10 who found an MDPE and MDAPE for the Schnider model of
44.3% and 44.3% and for the Kataria model of 52.2% and 52.5%, respectively. For the Paedfusor
model, Absalom et al.2 found lower values for MDPE (4.1%) and MDAPE (9.7%) compared with our
studies. This might be because of the difference between arterial and venous blood sampling in their
study and ours, respectively. The pharmacokinetic accuracy for the Short model are worse than ex-
pected, possibly because this model was developed in Chinese children, who may have altered kinetics
compared with the European children used in our study.7 On the other hand, the ShangGuan pharma-
cokinetic model developed in Chinese children was nearly unbiased and showed reasonable precision.
We were able to develop a three-compartmental model from the pharmacokinetic data scaled to total
body weight. It showed unbiased population and post hoc individual predictions with an acceptable
accuracy.27 The difficulties we experienced in estimating the population variances for V2,V3, and Q2
may be related to the fact that the pharmacokinetic observations were made during TCI-driven anes-
thesia. TCI dosing has been mathematically proven to have lower inter-individual variability com-
pared with bolus dosing.28 This reduced uncertainty in plasma propofol observations across the popu-
lation makes the data less informative for estimation of a population pharmacokinetic model, thereby
making the previously mentioned simplifications to the model structure necessary.
The pharmacokinetics and dynamics of a drug should be modeled within the same patient group to
obtain an unbiased description of the dose-response relationship of a drug,29 and the classic PK-PD
-PD model. In the current study we
found a Ce50 50 of 4.03 µg/ml found by Rigouzzo
et al.9 Rigouzzo et al. 50 using the Kataria pharmacokinetic model to be 2.94
µg/ml, which can be compared with that from our PK (Kataria)-PD model, 2.98 µg/ml.
111
In a different study,10 the same authors found a Ce50 of 2.64 µg/ml when the Schnider pharmacokinet-
ic model was used. This value can be compared with that of our PK (Schnider)-PD model, where a
Ce50 of 2.80 µg/ml was found. It seems that the underprediction of the Kataria and Schnider pharma-
cokinetic models leads to too-low estimates of Ce50. There does not seem to be any relationship indi-
cating any particular Ce50 value. This suggests that the PK (predicted)-PD approach does not accu-
rately estimate the true value of Ce50. The same must also apply to covariate relationships with Ce50,
although this is claimed in other studies.16
A wide variability of ke0 values between the PK (predicted)-PD models is demonstrated, clearly illus-
trating the influence of the applied pharmacokinetic model on the estimated value of ke0. There does
not seem to be any relationship indicating any particular ke0 value. This suggests that the PK (predict-
ed)-PD approach does not accurately estimate the true value of ke0. We used a 10-s BIS delay in our
calculations, which will influence the absolute value of ke0, a previously described approach.17 Similar
to other studies,19 we fixed the BIS values for E0 and Emax to 0 and 95, respectively, although in oth-
er studies these values have been estimated.16
One may be tempted to argue that the limitations of the pharmacokinetic estimation may degrade the
estimation of the true pharmacodynamic parameters, and thus the inability of the PK(predicted)-PD
models to find the same values as the classic PK-PD approach, does not necessarily mean that the
PK(predicted)-PD approach did not find the true pharmacodynamic parameters. However, it should be
noted that for the PK (predicted)-PD models considered, there is no clear relationship between model
fit (objective function or residual error) and any particular estimated pharmacodynamic parameter
value. For example, the best two PK (predicted)-PD models estimate very different values for all of
the pharmacodynamic parameters. Because the PK (predicted)-PD approach fails to indicate any par-
ticular pharmacodynamic value, it must also have failed at indicating the true pharmacodynamic pa-
rameter.
It was an unexpected result that the classic PK-PD approach did not lead to the lowest objective func-
tion from pharmacodynamic estimation because it does provide the best estimates of the true pharma-
cokinetic model for each individual. The reason for this is probably the shortcomings of ke0 and the
sigmoidal Emax model to describe the relationship between BIS and plasma compartment concentra-
tion. BIS is a complex variable measured from the brain, a very complex organ. There may be time-
dependent and/or level-dependent components to the BIS that are not properly described with the sig-
moidal Emax model. When such pharmacodynamic model misspecification is present, some specific
pattern of misprediction of the pharmacokinetic model might lead to better pharmacodynamic predic-
cific shortcomings of the pharmacodynamic model.
112

This phenomenon may be occurring in the PK-PD models studied here. The evidence for this is that
the PK (Schnider)-PD model performs quite well for predicting pharmacodynamic responses but poor-
ly predicts the pharmacokinetic responses. Therefore, an improved pharmacodynamic model for BIS
may allow the PK (predicted)-PD approach to perform better, and it also would improve the classic
PK-PD approach. Another study9 did not find pharmacodynamic model misspecification; however,
only nearly steady-state conditions were considered. At the same time, other pharmacokinetic model
structures, such as physiologically-based models30 or the use of transit compartments,31 may also help
nd pharmacodynamic accuracy within a single model but these need to be
properly scaled for application in children. Rigouzzo et al.10 suggested that the adult Schnider model
might be useful for TCI of propofol in children. Their reasoning was based on good results from the
PK (Schnider)-PD approach, which they used in their study. The current study confirmed the good
pharmacodynamic performance of this model but found that its pharmacokinetic accuracy in children
is poor, worse than all other models tested. Therefore, one cannot argue for use of the Schnider phar-
macokinetic model in children on the grounds of its pharmacokinetic accuracy. On the other hand, one
could argue that for some anesthesiologic applications, pharmacokinetic accuracy is of little im-
portance provided the pharmacodynamic accuracy is good. This approach represents a paradigm shift
in the application of TCI systems where, instead of a target constant drug concentration, the target is
some desired pharmacodynamic response. Drug-dosing profile is then adjusted to achieve a constant
pharmacodynamic target, possibly requiring a non-constant time course of drug concentration. The
good pharmacodynamic performance of the PK (Schnider)-PD model coupled with its poor pharma-
cokinetic accuracy gives us a hint that these drug dosing profiles may exist. Of course, the Schnider
pharmacokinetic model may not be optimal for this purpose and other optimized models could be ap-
plied. Future studies may address whether this approach has any advantages to the current TCI ap-
proach in anesthesiologic applications.
We conclude that for PK-PD models of BIS in children after propofol administration using fixed
pharmacokinetic models from the literature and estimating the pharmacodynamic model does not en-
sure good pharmacokinetic accuracy or provide informative estimates for pharmacodynamic parame-
ters. It can, however, provide for better pharmacodynamic model fit than the classic PK-PD approach.
It seems that there is some misspecification of the sigmoidal Emax pharmacodynamic model for BIS
response in children. If the sigmoidal Emax pharmacodynamic model is used, then some specific pat-
tern of misprediction of the pharmacokinetic model might lead to better pharmacodynamic predic-
ic shortcomings of the pharmacodynamic model. For applications
where pharmacodynamic accuracy is of primary importance these dosing profiles may prove useful.
113

References
1. Nørreslet J, Wahlgreen C: Propofol infusion for sedation of children. Crit Care Med 1990; 18:890-2
cardiac surgery or catheterization. Br J Anaesth 2003; 91:507 13
3. Rigby-Jones AE, Nolan JA, Priston MJ, Wright PM, Sneyd JR, Wolf AR: Pharmacokinetics of propofol infu-
sions in critically ill neonates, infants, and children in an intensive care unit. ANESTHESIOLOGY 2002;
97:1393 400
4. Shangguan WN, Lian Q, Aarons L, Matthews I, Wang Z, Chen X, Freemantle N, Smith FG: Pharmacokinetics
of a single bolus of propofol in Chinese children of different ages. ANESTHESIOLOGY 2006; 104:27 32
5. Marsh B, White M, Morton N, Kenny GN: Pharmacokinetic model driven infusion of propofol in children. Br
J Anaesth 1991; 67:41 8
6. Kataria BK, Ved SA, Nicodemus HF, Hoy GR, Lea D, Dubois MY, Mandema JW, Shafer SL: The pharmaco-
kinetics of propofol in children using three different data analysis approaches. ANESTHESIOLOGY 1994;
80:104 22
7. Short TG, Aun CS, Tan P, Wong J, Tam YH, Oh TE: A prospective evaluation of pharmacokinetic model
controlled infusion of propofol in paediatric patients. Br J Anaesth 1994; 72:302 6
8. Schüttler J, Ihmsen H: Population pharmacokinetics of propofol: A multicenter study. ANESTHESIOLOGY
2000; 92: 727 38
9. Rigouzzo A, Girault L, Louvet N, Servin F, De-Smet T, Piat V, Seeman R, Murat I, Constant I: The relation-
ship between bispectral index and propofol during target-controlled infusion anesthesia: A comparative study
between children and young adults. Anesth Analg 2008; 106:1109 16
10. Rigouzzo A, Servin F, Constant I: Pharmacokinetic-pharmacodynamic modeling of propofol in children.
ANESTHESIOLOGY 2010; 113:343 52
11. Schnider TW, Minto CF, Gambus PL, Andresen C, Goodale DB, Shafer SL, Youngs EJ: The influence of
method of administration and covariates on the pharmacokinetics of propofol in adult volunteers. ANESTHESI-
OLOGY 1998; 88:1170 82
12. Schnider TW, Minto CF, Shafer SL, Gambus PL, Andresen C, Goodale DB, Youngs EJ: The influence of
age on propofol pharmacodynamics. ANESTHESIOLOGY 1999; 90:1502 16
13. McDermott NB, VanSickle T, Motas D, Friesen RH: Validation of the bispectral index monitor during con-
scious and deep sedation in children. Anesth Analg 2003; 97:39 43
14. Blusse´ van Oud-Alblas HJ, Peters JW, de Leeuw TG, Tibboel D, Klein J, Weber F: Comparison of
bispectral index and composite auditory evoked potential index for monitoring depth of hypnosis in children.
ANESTHESIOLOGY 2008; 108: 851 7
15. Drover DR, Litalien C, Wellis V, Shafer SL, Hammer GB: Determination of the pharmacodynamic interac-
tion of propofol and remifentanil during esophagogastroduodenoscopy in children. ANESTHESIOLOGY 2004;
100:1382 6
16. Jeleazcov C, Ihmsen H, Schmidt J, Ammon C, Schwilden H, Schuttler J, Fechner J: Pharmacodynamic mod-
elling of the bispectral index response to propofol-based anaesthesia during general surgery in children. Br J
Anaesth 2008; 100:509 16
17. Struys MM, Coppens MJ, De Neve N, Mortier EP, Doufas AG, Van Bocxlaer JF, Shafer SL: Influence of
114

administration rate on propofol plasma-effect site equilibration. ANESTHESIOLOGY 2007; 107:386 96
18. Fisher DM: Take it to the limit (one more time). ANESTHESIOLOGY 2007; 107:367 8
19. Masui K, Kira M, Kazama T, Hagihira S, Mortier EP, Struys MM: Early phase pharmacokinetics but not
pharmacodynamics are influenced by propofol infusion rate. ANESTHESIOLOGY 2009; 111:805 17
20. Zhang L, Beal SL, Sheinerz LB: Simultaneous vs. sequential analysis for population PK/PD data II: Robust-
ness of methods. J Pharmacokinet Pharmacodyn 2003; 30:405 16
21. Zhang L, Beal SL, Sheiner LB: Simultaneous vs. sequential analysis for population PK/PD data I: Best-case
performance. J Pharmacokinet Pharmacodyn 2003; 30:387 404
22. Varvel JR, Donoho DL, Shafer SL: Measuring the predictive performance of computer-controlled infusion
pumps. J Pharmacokinet Biopharm 1992; 20:63 94
23. Dawidowicz AL, Fornal E, Fijalkowska A: Determining the influence of storage time on the level of
propofol in blood samples by means of chromatography. Biomed Chromatogr 2000; 14:249 55
24. Levitt DG, Schnider TW: Human physiologically based pharmacokinetic model for propofol. BMC
Anesthesiol 2005; 5:4
25. Barr J, Egan TD, Sandoval NF, Zomorodi K, Cohane C, Gambus PL, Shafer SL: Propofol dosing regimens
for ICU sedation based upon an integrated pharmacokinetic-pharmacodynamic model. ANESTHESIOLOGY
2001; 95:324 33
26. Constant I, Rigouzzo A: Which model for propofol TCI in children. Paediatr Anaesth 2010; 20:233 9
27. Glass PS, Shafer S, Reves JG: Intravenous drug delivery sys
Philadelphia, Pennsylvania, Elsevier (Churchill Livingstone), 2005, pp 439 80
28. Hu C, Horstman DJ, Shafer SL: Variability of target-controlled infusion is less than the variability after bolus
injection. ANESTHESIOLOGY 2005; 102:639 45
29. Sheiner LB, Stanski DR, Vozeh S, Miller RD, Ham J: Simultaneous modeling of pharmacokinetics and
pharmacodynamics: Application to d-tubocurarine. Clin Pharmacol Ther 1979; 25:358 71
30. Upton RN, Ludbrook G: A physiologically based, recirculatory model of the kinetics and dynamics of
propofol in man. ANESTHESIOLOGY 2005; 103:344 52
31. Masui K, Upton RN, Doufas AG, Coetzee JF, Kazama T, Mortier EP, Struys MM: The performance of com-
partmental and physiologically based recirculatory pharmacokinetic models for propofol: A comparison using
bolus, continuous, and target-controlled infusion data. Anesth Analg 2010; 111: 368 79
115

CHAPTER 6
DISCUSSION AND GENERAL CONCLUSIONS
116
CHAPTER 6 DISCUSSION AND GENERAL CONCLUSIONS
The aim of drug titration in anaesthesia is to reach and maintain a stable therapeutic drug
concentration at the site of drug effect. In inhalational anaesthesia the measured end-tidal
concentration of the gaseous agent is a reliable estimate of its concentration in the brain. For propofol,
as an intravenous anaesthetic, we have to rely on estimated/calculated concentrations. The basis for the
estimations of propofol plasma concentrations are PK models. Furthermore we want to be in control of
the time course and degree of the hypnotic effect of propofol which necessitates the use of PD models.
The essential link between a PK and PD model is the ke0 the mathematical representation of the
plasma/effect-site equilibration rate. Essential for TCI is the accuracy of the applied model. PK-PD
models have been developed in rather low numbered populations, most often healthy volunteers, with
limited demographic variability which limits their universal application in patients not resembling the
typical patient.
The goal of the research we included in this thesis was to study the performance of popular and
frequently used PK-PD models We showed that PK and PD estimations are closely linked to one
another and that optimal PK-PD model building should always be estimated simultaneously within
one study population. We pointed out major differences between models as choice of a wrong model
can have detrimental consequences for the patient; either inadequate hypnotic effect or to much effect
with potentially harmful side-effects. At the same time we warned for model inaccuracies that arise
when models are built without blood sampling.
In chapter 3 we hypothesized1 a different plasma-effect site equilibration time depending on the
injection rate of propofol. To face this problem we administered 2,5 mg/kg propofol as either a bolus
or a rapid infusion ( duration of 1,2 or 3 minutes). BIS was measured and a PD model was developed
(classic sigmoidal and combined fixed plus sigmoidal model). Propofol concentrations were estimated
using the Schnider model. We initially concluded that plasma-effect site equilibration for bolus
injection is faster than for infusions because two ke0’s , one for bolus injection and another for the
three infusion groups best fitted our data. Yet otherwise stated the time course of drug effect is
different for bolus injection versus infusion.
However one of the reviewers2 assessing the original manuscript suggested that these results were
potentially flawed because of misspecification of propofol concentrations during the very first minutes
after bolus administration. Additional ethics committee approval was requested for the collection of
propofol arterial concentrations in 10 additional patients to evaluate the accuracy of the Marsh and
Schnider PK models in the first 5 minutes after intravenous propofol bolus. We showed poor
performance of these models to predict arterial propofol concentrations in the first minutes after
propofol bolus. This is not surprising as it is merely a reflection of the misassumption that there is an
117

instantaneous mixing of drug in the central compartment. So the definitive conclusion was that the
actual rate of blood-brain equilibration may not differ between bolus and infusion methods of
administration. Analogous to chapter 5, this reflects the inaccuracy that arises when PD data are linked
to PK data generated by poorly performing models.
Masui3 and colleagues studied the front-end PK and PD of propofol and conclude that a combined
PK/PD model consisting of a multi-compartmental model with a lag-time, presystemic compartments,
and a sigmoidal maximum possible drug effect model accurately described the early phase
pharmacology of propofol.
In chapter 4 we showed4 that both the Marsh model and the Schnider model failed to maintain a
constant hypnotic effect over time. We hypothesized that these models would be able to accurately
estimate the Ce of propofol at loss-of-consciousness and consequently that targeting this Ce using TCI
would result in a stable effect, i.e. unconsciousness at the same level of anesthesia. Using the Marsh
PK-PD parameter set all patients woke up and BIS increased over time. The opposite effect was
observed using two PD variations of the Schnider model; a decrease in BIS was observed for several
minutes, indicating a progressively intensifying hypnotic effect. The question arises whether this is
due to inaccuracy of the PK-PD model or to a lack of understanding the exact underlying neuro-
physiological pathways.
On a PK level there are essential differences between the Marsh and Schnider model. Marsh used slow
infusion rates in his original population and hence found a large Vc, whereas Schnider used boluses
and subsequently found a lower Vc. When the Vc of any PK model is decreased, a continuous infusion
of propofol will result in a faster increase in Cp. In our study the ‘Marsh group’ and the two ‘Schnider
groups’ were administered a continuous infusion of propofol with comparable times to loss of
response to name calling (LORNC) and hence comparable doses. Due to the large Vc in the Marsh
model the predicted plasma and effect-site concentrations were lower in the ‘Marsh group’. The
plasma and effect-site concentrations were higher in the two ‘Schnider groups’ as the Vc is typically
lower for the Schnider model. After switching to effect-site controlled TCI, PD differences arose; the
ke0 of Marsh (0.26 min-1) is lower then the ke0’s in our Schnider groups ( ke0 = 0.456 min-1 and 0.362
min-1). Therefore the equilibration between plasma and effect site concentration is slower for the
Marsh group and so the infusion pump waits considerably longer to restart propofol infusion in the
Marsh group. The Schnider groups started from higher Ce concentrations and together with higher
ke0’s and hence more rapid equilibration times, this resulted in the pump to restart much earlier and
therefore deeper levels of anesthesia.
118

In the Schnider groups there was a progressively intensified hypnotic drug effect over time. One may
hypothesize that the conditions to induce unconsciousness are different from those required to
maintain unconsciousness. For instance higher adrenergic activity in the awake may result in a higher
need for propofol to induce LOC compared to the dose needed to maintain a comparable level of
unconsciousness in the unresponsive patient in whom adrenergic tone is suppressed. The neural
mechanisms that play a role in anesthesia induction and emergence are insufficiently resolved for the
moment but are continuously under investigation5,6. It is now accepted that emergence of anesthesia is
not simply the reverse process of induction due to the elimination of anesthetic drugs from the effect-
site concentration. At least in inhalation anesthesia, it has been shown that for sevoflurane the
parameters of the sigmoidal EMAX model ( EC50 , slope ) are different for induction and recovery. In
the mean time it seems inevitable to use surrogate measures of hypnotic effect such as BIS to detect
the exact onset time of steady-state conditions and hence keep the hypnotic effect at a constant level.
In the study, discussed in chapter 5 we validated the Kataria PK model7 for propofol in TCI for
children. 28 children were anesthetized using TCI, plasma controlled according to the Kataria model,
which was very popular at that time. 448 venous blood samples were drawn, and analysed for propofol
concentration. Subsequently our own PK model was developed using NONMEM. BIS values were
monitored and a PD model was developed. A ke0 of 0,79 min-1 links PK and PD model. We found that
the Kataria model was biased and inaccurate. The Coppens’ model resulted in an accurate PK
prediction. In a next phase we estimated plasma concentrations and BIS values with PK-PD models
found in the literature. Using the same approach Rigouzzo8 concluded that the Schnider model for
adults is useful for TCI in children. However in our study we showed that the Schnider model in
children was biased and inaccurate on a PK level but performed fairly well at a PD level. Other PK-
PD models were also simulated and we concluded that the use of estimates of plasma propofol
concentrations using published PK models and estimating the PD model does not ensure good
pharmacokinetic accuracy or provide estimates for PD parameters. An accurate estimation of ke0
demands an integrated PK-PD study, combining blood samples with frequent measurements of drug
effect, resulting in an overall model for the dose-response behavior of the drug. The relationship
between the effect-site concentration and clinical drug effect is thought to be governed by a static
(time-independent), non-linear (sigmoidal) relationship. Probably the biologic reality is more complex
and the Emax model is an oversimplification to generate a ke0 and to describe the relationship between
BIS and plasma concentration. BIS is a complex variable from the brain, a very complex and yet not
well understood organ. With such pharmacodynamic model misspecification, some pattern of
misprediction of the PK model might lead to better PD predictions, by ‘compensating’ for specific
shortcomings of the PD model. Although the literature suggest that the adult Schnider model might be
useful for TCI of propofol in children, our study confirms the good PD performance but evenly
119

demonstrated that its PK performance in children is poor. One could argue and state that in anesthesia
practice TCI should focus more on some desired PD response as target, rather than trying to predict
and simulate concentrations, both plasma and effect-site concentrations.
A way to counteract the inaccuracy of PK/PD models is the use of these models in closed-loop
circuits9,10. A closed loop controlled drug delivery system uses a PK/PD model, which forms the basis
for drug input. A continuous measure of drug effect (BIS) delivers feedback to the drug delivery
device. A control system measures the error between the target and observed effects and adapts the
drug infusion rate in a manner that is proportional to the magnitude of the error. This is a promising
method to deal with PK/PD model inaccuracy caused by inter-individual pharmacological variability.
The development of a ‘universal’ model covering a wide patient population ( extremes of age, co-
morbidities, obese,…) will definitely end the discussion on which model is best performing.
120

References:
1.Struys MM, Coppens MJ, De Neve N, Mortier EP, Doufas AG, Van Bocxlaer JF, Shafer SL: Influence of
administration rate on propofol plasma-effect site equilibration. Anesthesiology 2007; 107: 386-96
2.Fisher DM: Take it to the limit (one more time). Anesthesiology 2007; 107: 367-8
3.Masui K, Upton RN, Doufas AG, Coetzee JF, Kazama T, Mortier EP, Struys MM: The performance of
compartmental and physiologically based recirculatory pharmacokinetic models for propofol: a comparison
using bolus, continuous, and target-controlled infusion data. Anesth Analg 2010; 111: 368-79
4.Coppens M, Van Limmen JG, Schnider T, Wyler B, Bonte S, Dewaele F, Struys MM, Vereecke HE: Study of
the time course of the clinical effect of propofol compared with the time course of the predicted effect-site
concentration: Performance of three pharmacokinetic-dynamic models. Br J Anaesth 2010; 104: 452-8
5.Kelz MB, Sun Y, Chen J, Cheng Meng Q, Moore JT, Veasey SC, Dixon S, Thornton M, Funato H,
Yanagisawa M: An essential role for orexins in emergence from general anesthesia. Proc Natl Acad Sci U S A
2008; 105: 1309-14
6.Absalom AR, De Keyser R, Struys MM: Closed loop anesthesia: are we getting close to finding the holy grail?
Anesth Analg 2011; 112: 516-8
7.Coppens MJ, Eleveld DJ, Proost JH, Marks LA, Van Bocxlaer JF, Vereecke H, Absalom AR, Struys MM: An
evaluation of using population pharmacokinetic models to estimate pharmacodynamic parameters for propofol
and bispectral index in children. Anesthesiology 2011; 115: 83-93
8.Rigouzzo A, Servin F, Constant I: Pharmacokinetic-pharmacodynamic modeling of propofol in children.
Anesthesiology 2010; 113: 343-52
9.Struys MM, Sahinovic M, Lichtenbelt BJ, Vereecke HE, Absalom AR: Optimizing intravenous drug
administration by applying pharmacokinetic/pharmacodynamic concepts. Br J Anaesth 2011; 107: 38-47
10.M. Neckebroek, M.M.R.F. Struys: Automated Drug Delivery in Anesthesia. Curr Anesthesiol Rep 2012;
published online 13 december 2012
121

SUMMARY
When the anaesthetist injects a particular dose of a hypnotic drug, he aims a specified clinical effect.
To obtain this effect a specific therapeutic drug concentration in the blood and subsequently in the
brain of the patient is necessary. Anaesthetists are able to gain control over the blood concentration of
the inhalational agents by using a vaporizer to administer the volatile anaesthetic, with measured end-
tidal concentration as immediate feedback.
For intravenous anesthesia it is impossible to measure on-line the plasma concentration so we have to
rely on pharmacokinetic models to estimate the plasma concentration. If we want to control the time
course of drug effect we need pharmacodynamic models, and link them with the pharmacokinetic
models.
PK-PD models have been studied for decades. Different models have been built in very specific pa-
tient populations and are therefore difficult to use in other patient groups. PK-PD models try to reduce
patient intervariability by identifying and incorporating covariates. The models are used in target con-
trolled anesthesia where a plasma concentration or effect-site concentration is chosen.
PK-PD models sometimes are inaccurate. Comparing the Marsh and Schnider models in effect site
controlled TCI, we found significant shortcomings. When the predicted effect-site concentration was
maintained at the moment of loss of consciousness, the patients woke up in the Marsh group, while the
effect was even more pronounced in the Schnider group. We proved that PD models of BIS in children
developed by predictions of plasma propofol concentrations using published PK models and estimat-
ing the PD model does not ensure good PK accuracy or provide informative predictions for PD param-
eters. We also confirmed that three compartmental models fail to accurately predict arterial propofol
concentrations in the first minutes following bolus administration. This is the result of the flawed as-
sumption that a drug, added to the central compartment is instantaneously and completely mixed.
PK-PD models will be studied further in the future. Further fine-tuning of TCI will be the goal. The
information of hypnotic-analgesic drug interactions with data from estimated drug concentration is
used in advisory systems that provide real-time information concerning the full dose-response curve.
These online display systems informs the anaesthetist about the anaesthetic depth, degree of sedation,
the expected wakeup time, extent of muscle relaxation The ultimate goal is to develop the ideal
model that can be universally used in children, adults, obese patients, patients with comorbidities or
critical illnesses. This will bring us to a closed-loop system completely covering the dose-effect rela-
tionship. We hopefully expect that this will make anesthesia even safer than it ever was before.
In somno maxima securitas !
122

SAMENVATTING
Wanneer de anesthesist een welbepaalde dosis van een hypnoticum toedient, verwacht hij een
specifiek effect bij de patiënt. Om dit effect te bekomen moet een welbepaalde concentratie van het
hypnoticum bereikt worden in het bloed en de hersenen. Wanneer een patiënt in slaap gedaan wordt
met een inhalatieanestheticum kan de anesthesist zeer gemakkelijk de bloedspiegel controleren door
middel van de verdamper en bovendien kan hij de concentratie meten in de uitgeademde lucht om
onmiddellijk de verdamper instellingen aan te passen.
Bij intraveneuze anesthesie is het niet mogelijk om onmiddellijk de plasmaconcentratie van het
product te meten, en dus moeten we gebruik maken van wiskundige farmacokinetische modellen om
de plasmaconcentratie te schatten. Als we het effect willen voorspellen in de tijd moeten we gebruik
maken van farmacodynamische modellen en combineren met het farmacokinetisch model.
PK-PD modellen worden reeds zeer lang bestudeerd. Een model wordt bestudeerd in een welbepaalde
patiëntenpopulatie en is soms moeilijk te gebruiken voor een groep patiënten die sterk verschilt van de
oorspronkelijke populatie. PK-PD modellen trachten de variabiliteit tussen verschillende patiënten te
verminderen door rekening te houden met zoveel mogelijk patëntgebonden eigenschappen. Deze
modellen worden
concentratie van het anestheticum die hij wil bereiken in het bloed of thv de hersenen van de patiënt.
Een wiskundig model is soms niet voldoende accuraat. Wij vergeleken het model van Schnider met
dat van Marsh en vonden enkele belangrijke tekortkomingen. We brachten patiënten in slaap met een
propofol infuus tot ze het bewustzijn verloren. De concentratie thv de hersenen werd geschat met het
Schnider of Marsh model en op het moment van bewustzijnsverlies werd de geschatte concentratie
verder aangehouden. In de Marsh groep werden de patiënten wakker. De patiënten in de Schnider
groep gingen nog dieper slapen.
Wij brachten kinderen in slaap en ontwikkelden een farmacokinetisch model op basis van gemeten
plasmaconcentraties. Tegelijk maten we de BIS waarden en gebruikten deze voor het opstellen van
een farmacodynamisch model. Nadien schatten we de plasmaconcentratie door middel van een aantal
niet
in staat waren om een accuraat farmacokinetisch en farmacodynamisch model te bepalen.
We bevestigen tevens dat drie compartimentele modellen niet in staat zijn om de arteriële
plasmaconcentraties te schatten in de eerste minuten na propofol toediening. Deze modellen gaan er
verkeerdelijk vanuit dat propofol zich onmiddellijk en gelijk verdeelt over het ganse bloedvolume.
Het onderzoek naar PK-
gecontroleerde toediening van intraveneuse anesthetica zal hierdoor nog verder verfijnd worden. De
123

modellen zullen tevens gebruikt worden om voorspellingen te doen van het verloop van de
concentratie en het bijhorend effect van het hypnoticum om het verloop van de anesthesie nog beter te
sturen. Deze systemen zullen de anesthesist informeren over de graad van sedatie, diepte van
een model ontwikkeld worden dat universeel toepasbaar is voor kinderen, volwassenen, obese
patiënten, patiënten met co-morbiditeit, kritisch zieke patiënten
Deze evolutie leidt naar een gesloten systeem waar de ganse dosis-effect curve gemonitord en
automatisch gecontroleerd wordt. Hopelijk maakt dit de anesthesie nog veiliger dan ze al was.
In somno maxima securitas.
124

CURRICULUM VITAE
125

CURRICULUM VITAE
1. PERSONALIA
Naam: COPPENS
Voornaam: Marc
Geboorteplaats: Sint-Niklaas, Belgium
Geboortedatum: 29/09/1968
Privé adres: Oostkouterlaan 34, 9800 Deinze
Privé telefoon: 09/386.68.86
Werkadres: Universitair Ziekenhuis Gent
Dienst Anesthesie
De Pintelaan 185
B 9000 Gent
Diensttelefoon: 09/332.58.07
E-mail: [email protected]
Burgerlijke staat: Gehuwd met An Verhaeghe
Vader van Lien (°2/4/97) en Sam (°6/01/00)
Nationaliteit: Belg
126

2. OPLEIDING
Secundair onderwijs:
Sint-Jozef-Klein-Seminarie, Sint-Niklaas, Afdeling Latijn-Grieks, 1980-1986
Academisch (Universitair) Onderwijs:
Diploma 2de cyclus:
Dokter in de genees-, heel- en verloskunde, Rijksuniversiteit Gent: 4/07/1994
Voortgezette Academische Opleidingen (3de cyclus) en Postacademische Vorming
- Opleiding tot geneesheer-specialist in Anesthesie en Reanimatie : 1/08/1994 31/07/1999
- 1ste jaar : UZ Gent
- 2de jaar: AZ Heilige Familie, Gent
- 3de, 4de en 5de jaar: UZ Gent
Erkenning als specialist in Anesthesie-reanimatie: 6/08/1999
Aanvullende opleidingen
- 3 Day Course on Obstetric Anaesthesia and Analgesia: 6 12/12/1999
London,
- Cursus Basic Life Support, Automated External Defibrillation: mei 2000
European Resuscitation Council, Antwerpen
- Fellowship Obstetrische anesthesie : 10/02-30/04/2003
Queen Charlotte and Chelsea Hospital/ Londen, Departement van Dr. J Crowhurst,
- 3 Day Course on Obstetric Anaesthesia and Analgesia: 22-24/11/2004
OAA, Church House Conference Centre Westminster London
- 3 Day Course on Obstetric Anaesthesia and Analgesia: 5-7/11/2007
OAA, Church House Conference Centre Westminster London
127

3. BEROEPSLOOPBAAN
- Resident Dienst Anesthesie UZGent: 1/08/1999 - 31/07/2002
- Adjunct-kliniekhoofd UZGent: 1/08/2002 - heden
- 1999: actief betrokken bij oprichting en dagelijks beleid Chirurgisch Dagziekenhuis (CDZ)
UZG, in samenwerking met het Afdelingshoofd
Supervisie CDZ bij afwezigheid van Afdelingshoofd
- 2001: actief in diverse disciplines
- specialisatie in obstetrische anesthesie
- oftalmologische anesthesie (incl. loco-regionale)
- beheer en organisatie van operatiezalen (OK-coördinator UZ1)
- 2009: Afdelingshoofd Chirurgisch Dagcentrum UZGent
- Bestuurslid BARA: Belgian Association of Regional Anesthesia
- Bestuurslid BAAS: Belgian Association Ambulatory Surgery
- Verslaggever LOK
128

4. ONDERWIJS
Onderwijs UGent
- EHBO en Reanimatie: medelesgever en examinator aan de
studenten Geneeskunde,Tandheelkunde en Revalidatie en Kinesitherapeutische
wetenschappen (REVAKI):
Theorie en practica EHBO en Reanimatie voor
1e ba Gen.,1e baTandhlk. en 1e ba REVAKI
Facultatief:Toegepaste wetenschappen, Pedagogische wetenschappen,
Voedings- en dieetleer
Practica EHBO en Reanimatie voor 2e, 3e ba Gen., 1e, 2e en 3e mast Gen.
Academiejaar 1999-2000 tot 2008-2009
- Examinator examen en stationsproeven EHBO en Reanimatie voor
1e, 2de en 3de ba Gen, 1ste, 2de en 3de mast Gen ; 1e ba THK
Academiejaar 1999-2000 tot heden
- Examinator Stationsproef 4de proef Gen.
Februari 2000, 2001, 2002
- Examinator Longcases GKE, 3e mast gen, 4u, 2013
- Tandheelkundige anesthesie: voor 3e ba Tandhlk.
4 theorielessen , 4u en 2 practicalessen, 2x4u
1999 tot heden
- Capita Selecta 4e mast ziekenhuisarts:
Anesthesie en Reanimatie, keuzevak
- abdominale en thoraco-
keuzevak 4e master ziekenhuisarts
les: Preoperatief onderzoek en anesthesie, 1u,
- Medical Humanities (E-
lessen: Wat is anesthesie en Beademingsapparaat, 3,5u, 2010-heden
-
Postgraduaat Revaki
Theorie en praktische training, 4 uur/ jaar
Academiejaren 1999-2000, 2000-2001, 2001-2002
- AVU interuniversitaire cursus voor ASO 2de opleidingsjaar: vanaf 2004 tot heden
30/09/2006; UZGent, 29/09/2007
13/09/2008
UZGent 13/09/2008
Basic and Advanced Life Support ; VUB 16/01/2010
Basic life support and advanced life support; e-learning 2011
129

Anesthesie voor de pathologische zwangerschap, 22/10/2011; ZOL
Basic life support and advanced life support; e-learning 2012
Anesthesie voor de pathologische zwangerschap, e-learning 2012
-
Praktijklessen ABC, nascholing voor tandartsen (organisator prof. dr. Luc Marks)
Faculteitszaal UGent , jaarlijks van 2008 tot heden
- Stagebegeleider voor een 10-tal studenten (jaarlijks) uit 1e, 2e en 4e mast Geneeskunde
Onderwijs UZGent
- -
Postgraduaat Anesthesie
December 1999
- Basic life support, provider
Automated external defibrillation
Basic life support en Automated external defibrillation, instructor
European Resuscitation Council
Medelesgever
Nederoverheembeek, 8, 9 en 10/10/2000
- -, Keel-
27/01/2001
- -
Bijscholing voor verpleegkundigen
Februari 2001
-
Bijscholing voor vroedvrouwen
UZGent: 12-13/01/2002 en 24/04/2002
-
Bijscholing voor verpleegkundigen
UZGent : 8/02/2002
- Introductie van de cursus EHBO als onderdeel van de V-lijn op
RUG opendeurdagen,
Gent, 2/03/2002
-
Antwerpen, september 2002
-
5/10/2002, 4/10/2003, 1/10/2005
-
Vorming verpleegkundigen verloskwartier en materniteit
UZGent, 4/03/2008
130

5. WETENSCHAPPELIJK CURRICULUM
PUBLICATIES
Boeken
(b1) co-auteur van boeken
1. L. Versichelen, M. Coppens
EHBO / First Aid
Handboek voor studenten
Academia Press, herwerkte en vernieuwde uitgave 2001
2. L. Versichelen, M. Coppens
EHBO / First Aid
Handboek voor studenten
Academia Press, herwerkte en vernieuwde uitgave 2002
3. Versichelen L F M, Coppens MJ, et al.
EHBO / First Aid
Handboek voor studenten
Academia Press, herwerkte en vernieuwde uitgave 2007
(b2) hoofdstukken in boeken
1. Coppens M
In Jaarboek 2006 : Binnenste buiten, Intensief bekeken.
International centre for reproductive health, Gent: p73-80.
2. Coppens M
De gecombineerde spinale-
In Reproductieve geneeskunde, gynaecologie en obstetrie anno 2007.
Editor. Dr. E. Slager c.s., DCHG, Medische Uitgeverij: 461-4.
Artikels
a1) artikels in tijdschriften opgenomen in Science Citation Index
1. V Capouet, C De Pauw, B Vernet, D Ivens, V Derijcke, L Versichelen
H Van Aken, B Ickx, L Ritter, F Hulstaert. Acknowledgements to G Rolly,
M Coppens
Single dose intravenous tropisetron in the prevention of postoperative nausea and vom-
iting following gynaecological surgery: a double blind, multicentre, dose-comparison
study.
British Journal of Anaesthesia 1996, 76: 54-60
131

2. E Alon, E Buchser, E Herrera, F Christiaens, C De Pauw, L De Ritter,
F Hulstaert, V Grimaudo
Single dose intravenous tropisetron in the treatment of established
postoperative nausea and vomiting: a double blind, multicentre, dose-comparison
study.
Co-investigator M Coppens
Anesthesia& Analgesia 1998, 86 :617-23
3. L Versichelen, G Rolly, M Struys, K Fonck, M Coppens
Automatic online computing of delivered inhalation anaesthetics is now possible in clini-
cal practise.
Anaesthesiology and Intensive Therapy 1999; 29:14
4. Coppens M, Versichelen L, Mortier E
Treatment of postoperative pain after ophthalmologic surgery.
Bull Soc Belge Ophtalmol. 2002;(285):27-32
5. Coppens MJ, Versichelen LFM et al.
The mechanisms of carbon monoxide production by inhalational agents.
Anaesthesia 2006, 61: 462-8
6. MJ Coppens, LFM Versichelen, E Mortier and M Struys
Do we need inhaled anaesthetics to blunt arousal, haemodynamic responses to intuba-
tion after i.v. induction with propofol, remifentanil, rocuronium?
British Journal of Anaesthesia 2006, 97(6): 835-41.
7. Struys MMRF, Coppens MJ, De Neve N, Mortier EP, Doufas AG, Van Bocxlaer JFP, and
Shafer SL
Influence of administration rate on propofol plasma - effect site equilibration. Anesthesi-
ology 2007, 107(3): 386-96
8. Femke Delporte, Kristien Roelens, Marc Coppens, Annick Viaene, Karel Everaert, Hans
Verstraelen, Marleen Temmerman
Obstetrisch handelen bij tetraplegische patiënte
Tijdschrift voor Geneeskunde. 2009 65(10). p.468-469
9. Marc Coppens, Jurgen Van Limmen, Thomas Schnider, Barbara Wyler, Sjoert Bonte,
Frank Dewaele, Michel MRF Struys, Hugo EM Vereecke.
Study of the Time Course of the clinical effect of propofol versus the time course of the
predicted effect-site concentration of propofol. performance of three pharmacoki-
netic-dynamic models in steady-state conditions.
British Journal of Anaesthesia 2010, 104 (4):452-8
10. Marc Coppens, DouglasJ Eleveld, Johannes H Proost, Luc Marks, Jan Van Bocxlaer, Hugo
Vereecke, Anthony R Absalom and Michel Struys
An evaluation of using population pharmacokinetic models to estimate
pharmacodynamic parameters for propofol and bispectral index in children.
Anesthesiology 2011; 115 (1):83-93
11. Alicia Borderé, Annelies Stockman, Barbara Boone, Ann-Sophie Franki, Marc J. Coppens,
Hilde Lapeere and Jo Lambert
A case of anaphylaxis caused by macrogol 3350 after injection of a corticosteroid (pages
376 378)
Contact Dermatitis 2012,vol 67, issue 6
132

a3) artikels in nationale tijdschriften die gebruik maken van een leescomité
1/ G. Rolly, L Versichelen, M Coppens
Het belang van de anesthesie voor de ontwikkeling van heelkunde in dagopname.
The role of anesthesiology in the development of ambulatory surgery.
Tijdschrift voor Geneeskunde 2001, 57(12):854-8
2/ Verbraeken H and M Coppens
Postoperatieve zorgen en verwikkelingen bij cataractchirurgie: de rol van de huisarts na
de daghospitalisatie.
Tijdschrift voor Geneeskunde 2004, 60(8): 552-8
3/ Pijnbestrijding gedurende de partus
X Schyns-van den Berg, M Coppens
A&I,nr 2, 2010
a4) artikels in tijdschriften niet begrepen in (a1), (a2) en (a3)
1)
Inge Tency, Ellen Roets, Marc Coppens,and Marleen Temmerman
Tijdschrift voor vroedvrouwen 2010; 16(5): 279-86
c) artikels in Proceedings van wetenschappelijke congressen
1. Single dose intravenous tropisetron in the treatment of established postoperative nausea
and vomiting: a double-blind, multicentre, dose-comparison study.
M Coppens, F Christiaens, C De Pauw, M Van Boven, V Capouet, B Ickx,
L De Ritter, V Grimaudo, F Hulstaert
Acta Anaesthesiol. Belgica 1997, 48 (3):195
2. Do we need inhaled anaesthetics to blunt arousal and haemodynamic responses to intuba-
tion after intravenous induction with propofol, remifentanul and rocuronium?
Ndjekembo Shango D, Coppens M, Versichelen L, Mortier E, Struys M
Acta Anaesthesiologica Belgica 2007, 58(1): 75
3. Comparison of the ability of two pharmacokinetic models to maintain a predicted effect-site
concentration of propofol compatible with loss of consciousness.
J Van Limmen, H Vereecke, M Coppens, E Mortier, M Struys
Acta Anaesthesiologica Belgica 2008, 59 (3): 211
4. Tramadol IV: influence of dose and intervals on the therapeutic accuracy and side effects
when used for postoperative pain relief after ambulatory surgery.
D Devriese, B Vandervennet, L Van Praet, M Coppens, E Mortier, M Struys
Acta Anaesthesiologica Belgica 2009, 60 (2):131
5. Combined spinal epidural for labor using sufentanil epidurally versus intrathecally: influ-
ence on fetal heart rate.
N Everaert and M Coppens
European Journal of Anaesthesiology 2012; 29 (suppl 50):172
133

WETENSCHAPPELIJKE ACTIVITEITEN
(a) studieverblijf in het buitenland van langere duur (minimum 1 maand)
Queen Charlotte and Chelsea Hospital/ Londen
Departement van Dr. J Crowhurst
Fellowship Obstetrische anesthesie: 10/02-30/04/2003
(b) door mezelf georganiseerde internationale of nationale congressen en symposia
Gent, 18/02/2009
(c) internationale congressen en lezingen waarop een actieve bijdrage
1. i-
ble in clinical pra
L Versichelen, G Rolly, M Struys, K Fonck, M Coppens.
21st Annual Meeting of the European Academy of Anaesthesiology.
Boedapest, 26-28/08/1999
2.
International Winter Symposium, Update in Anesthesia, Intensive Care Medicine and
Emergency Medicine
Leuven 10-11/01/2003
3.
Chairman session 1: Anesthesia for the Obstetric patient
20th
UZ Leuven, 6/01/2005
4.
Voordracht sessie 2 op 22nd International Winter Symposium Update in Anesthesia, In-
tensive Care Medicine, Emergency Medicine and Algology
Leuven, 12-13/01/2007
5.
Voordrachten 4th Annual Meeting of Indonesian Society of Obstetric Anesthesia
16-17/02/2007
6.
Chairman Sessie 3 op 23th International Winter Symposium Update in Anesthesia, Inten-
sive Care Medicine, Emergency Medicine and Algology
Leuven, 11-12/01/2008
134

(d) idem voor nationale congressen en symposia
1) Single dose intravenous tropisetron in the treatment of established postop-
erative nausea and vomiting: a double-blind, multicentre, dose-
M Coppens, F Christiaens, C De Pauw, M Van Boven, V Capouet, B Ickx,
L De Ritter, V Grimaudo, F Hulstaert
Annual Meeting BVAR (Belgische Vereniging voor Anesthesie en Reanimatie)
Louvain-La-Neuve, 30 /11/1996
2) Single dose intravenous tropisetron in the treatment of established postopera-
tive nausea and vomiting: a double-blind, multicentre, dose-
M Coppens, F Hulstaert, C De Pauw, M Van Bever, V Capouet, B Ickx,
L De Ritter, V Grimaudo, F Christiaens.
ng BVAR
Gent, 21/06/1997
3)
L Versichelen, M Coppens, L Veeckman
Annual Meeting BSAR (Belgian Society of Anesthesia and Resuscitation) :
Women in Anesthesia, Anesthesia for women
Brussel, 30/11/2002
4) Abstract e-
dicted effect-
J Van Limmen, H Vereecke, M Coppens, E Mortier, M Struys
Research Meeting SARB
Sint-Lambrechts Woluwe, 14/06/2008
5) t-
en Chairman sessie : Miscellaneous
Brussel, 04/10/2008
6)
D Devriese, B Vandervennet, L Van Praet, M Coppens, E Mortier, M Struys
Research meeting SARB
Leuven, 20/06/2009
7) G-ENT Rounds georganiseerd door dienst Neus-, Keel- en Oorheelkunde van het UZGent.
Inleiding: Basisprincipes van het pre-operatief onderzoek. Dr. Marc Coppens. Chirurgisch
dagcentrum. UZ Gent, Locatie: Zaal Oude Infirmerie, Het Pand, Onderbergen 1, 9000 Gent,
26/04/2012
e) lezingen aan universiteiten en wetenschappelijke instellingen
1.
Postacademische bijscholing Anesthesie UZG
UZGent, 20/10/1999
135

2.
Postgraduaat heelkunde UZG
UZGent, 8/11/1999
3. Pre-
4.
Postacademische bijscholing Anesthesie UZG
UZGent, december 1999
5.
Lokgroep Anesthesie Kortrijk
Kortrijk, oktober 2000
6.
Postacademische bijscholing Anesthesie UZG
UZGent, november 2000
7.
Voordracht ter gelegenheid van cursus Allergology
15.09.2001
8. Behandeling van de postoperatieve pijn in o
Voordracht voor Academia Ophtalmologica Belgica
23.11.2001
9.
Gemeenschappelijke Staffvergadering: Verloskunde Neonatologie Genetica -
Anesthesie
January 2002
10. Aspecten van bifasische
Postacademische bijscholing Anesthesie UZG
UZ Gent, 6/03/2002
11.
LOK vergadering Neus- Keel- en Oorheelkunde
Gent, 24/04/2002
12.
Perinatale stafvergadering voor verloskunde-neonatologie-genetica-anesthesie
UZGent, 30/09/2003
13.
Voordracht voor LOK 0703
Gent, 16/12/2003
14.
Vlaamse Wetenschappelijke Vereniging voor Tandheelkunde - Scientific Association of
Gent, 7/02/2004
136

15.
Perinatale stafvergadering verloskunde-neonatologie-genetica-anesthesie
UZGent, 24/02/2004
16. -
Perinatale stafvergadering verloskunde-neonatologie-genetica-anesthesie
UZGent, 11/05/2004
17.
Postacademische vorming Anesthesie
UZGent, 29/09/2004
18. Wintersymposium Leuven
7/1/2005
19.
Postacademische vorming Anesthesie
UZGent, 12/01/2005
20.
Perinatale stafvergadering verloskunde-neonatologie-genetica-anesthesie
UZGent, 25/01/2005
21.
voordracht voor LOK 0703
UZGent, 18/06/2005
22.
Postacademsiche bijscholing anesthesie
UZGent, 22/06/2005
23.
Perinatale stafvergadering verloskunde-neonatologie-genetica-anesthesie
UZGent, 20/09/2005
24.
Obstetrie en Gynaecologie
Diegem, 14-15/10/2005
25.
Perinatale stafvergadering verloskunde-neonatologie-genetica-anesthesie
UZGent, 27/12/2005
26.
Postacademische bijscholing anesthesie
UZGent, 22/02/2006
27. -
Postacademische bijscholing anesthesie UZG
UZGent, 22/03/2006
137

28. Nieuwe richtlijnen in
Voordracht voor LOK 1667
UZGent, 30/03/2006
29.
Jaarlijks congres van de Vlaamse Vereniging van Intensieve Zorgen voor
Gent, 24/11/2006
30. V
Vlaamse Wetenschappelijke Vereniging voor Tandheelkunde - Scientific Association of
licaties tijdens de
Gent, 25/11/2006
31.
Voordracht Bara-meeting
Tienen, 30/11/2006
32.
Perinatale stafvergadering verloskunde-neonatologie-genetica-anesthesie
UZGent, 05/12/2006
33. Congres Gynaecologie De Doelen Rotterdam
Rotterdam 4/2007
34.
102e Reeks Avondcolloqui
UZGent, 23/05/2007
35.
Postacademische bijscholing Anesthesie
UZ Gent, 20/06/2007
36.
Moderator Journal Club Assistenten - casusbesprekingen
Postacademische bijscholing Anesthesie
UZGent, 05/09/2007
37.
VVOG ( Vlaamse Vereniging voor Obstetrie en Gynecologie), cursus Praktische
Vaardigheden in de Verloskunde
Zemst, 23/11/2007
38.
Voordracht KUL: Academie voor Kindertandheelkunde
Leuven, 29/11/2007
39.
Voordracht Perinatale stafvergadering verloskunde-neonatologie-genetica-anesthesie
UZGent, 11/12/2007
138

40. -
Voordracht op uitnodiging van The Surgical Company
Den Haag/ NL, 24/01/08
41.
Postacademische bijscholing Anesthesie
UZGent, 27/02/2008
42.
Voordracht LOK 0703
UZGent, 17/06/2008
43.
Postacademische bijscholing Anesthesie UZG
UZ Gent, 24/09/2008
44.
Stafvergadering ZNA Middelheim
Antwerpen, 26/09/2008
45.
Perinatale stafvergadering verloskunde-neonatologie-genetica-anesthesie
UZGent, 14/10/2008
46.
ABC voor de tandartspraktijk (organisator prof. dr. Luc Marks)
UZ Gent, 28/11/2008
47.
Postacademische bijscholing Anesthesie
UZ Gent, 10/12/2008
48.
Postacademische bijscholing Anesthesie
UZ Gent, 21/01/2009
49.
Postgraduaat meeting Anesthesiologie
UZ Brussel, 30/04/2009
50. Congres BARA
Voordracht: Bloedingen in de verloskundige anesthesie
3/9/2009
51.
Postacademische bijscholing Anesthesie
UZ Gent, 21/10/2009
52.
ABC voor de tandartspraktijk (organisator prof. dr. Luc Marks)
UZ Gent, 03/12/2009
53. Wintersymposium Leuven, januari 2010
139

54. Refresher course obstetrische anesthesie BARA en NVA
Voordracht: Pijn en pijnbestrijding tijdens normale arbeid en verlossing
19/3/2010
55.
Postacademische bijscholing Anesthesie
UZ Gent, 28/04/10
56.
Postacademische bijscholing Anesthesie
UZ Gent, 15/09/2010
57. Congres reanimatie in tandheelkunde L Marks
2/12/2010
voordracht Medische urgenties in de tandheelkunde
58. Voorstelling van het nieuw Chirurgisch DagCentrum UZGent
voordracht voor LOK 0703
Gent, 7/12/2010
59. Openingssymposium Chirurgisch Dagcentrum
19/3/2011
60. Congres vroedvrouwen Oostende
29/3/2011
Voordracht: Nieuwe tendensen in pijnstilling na sectio
61. Refresher course obstetrische anesthesie NVA en BARA
8/4/2011
62. Cursus lachgassedatie Tandheelkunde: 3/5/2011
voordracht: Biologische, chemische en fysische aspecten van lachgas
Voordracht: Medische urgenties in de tandheelkunde
63. Studieclub Tandheelkunde
voordracht medische urgenties in de tandheelkunde
64. Studieclub Tandheelkunde Kortrijk
1/9/2011
voordracht Medische urgenties in de Tandheelkunde
65. Congres Luc Marks Reanimatie in de Tandheelkunde
1/12/2011
voordracht: Medische urgenties in de tandheelkunde
66. Cursus Lachgassedatie in de Tandheelkunde
8/5/2012
67.
voordracht voor LOK 1667
Gent, 31/01/2012
140

68.
voordracht voor LOK 0703
UZGent, 24/09/2012
69. Symposium georganiseerd door het Allergienetwerk
25/10/2012
70.
Postacademische bijscholing Anesthesie
UZ Gent, 21/11/2012
71. Congres van de Royal Belgian Society for Ear Nose Throat
24/11/2012
72. Cursus Vlaamse Vereniging voor Wetenschappelijke Tandheelkunde
Voordracht: Medische urgenties in de tandheelkunde
10/11/2012
73. Cursus L Marks Tandheelkunde
Voordracht: Medische urgenties in de tandheelkunde
6/12/2012
74. Refresher course obstetrische anesthesie. Nederlandse Vereniging voor Anesthesie en
BARA
75. Cursus Lachgassedatie in de Tandheelkunde
23/4/2013
(d) promotorschap of dagelijkse leiding van scripties en doctoraatsproefschriften
Co-promotor scriptie Pauline De Bruyne, 2e
Academiejaar 2003-2004
Co-promotor Tramadolstudie studenten 2e proef Gen: B Vandervennet, L Van Praet,
peutische accuraatheid van perorale versus intraveneuze toediening van
-2008
Co-promotor Tramadolstudie van Heleen Apostel, 2e mast Gen, Academiejaar 2008 -2009
Begeleider van Nele Everaert voor de Z-lijn Masterproef 1 1ste
foetale bradycardie tijdens locoregionale analgesie voor bevalling: sufentanil epiduraal
2011
Co- l: impact op epidurale anesthesie
Van den Daele Daphne, Academiejaar 2011-2012
141

Dienstverlening
Wetenschappelijke en maatschappelijke dienstverlening, adviesverlening, lidmaatschap
wetenschappelijke commissies, editoraat wetenschappelijke tijdschriften, lidmaatschap
beroepsorganisaties e.d.
Vertegenwoordiger Stuurgroep Reanimatie UZGent vanaf 1/8/2007
Werkgroep Reanimatie UZGent, lesgever ALS voor verpleegkundigen
Afgevaardigde Anesthesie in de Werkgroep P3 P4, sector Man-Vrouw-Kind 2008
Lid van BARA Board (Belgian Association for Regional Anesthesia), 8 oktober 2005
Lid van de BVAR (Belgische Vereniging voor anesthesie en reanimatie)
Lid van The European Society of Regional Anaesthesia (ESRA)
Lid van the Obstetric Anaesthetists Association (OAA), UK
Verslaggever LOK 1667: sinds 2005
Lid Kernteam Anesthesie
Lid Kernteam Chirurgisch Dagcentrum
Reviewer British Journal of Anaesthesia
Reviewer Acta Anaesthesiologica Belgica
Lid Werkgroep Pediatrie CDZ
Lid Multidisciplinaire werkgroep van het project Acute Pijn bij Kinderen
Lid Commissie Heelkunde
Lid Werkgroep CDZ
MEDEWERKING AAN STUDIES
- Co-investigator bij de klinische studie:
m-
iting following gynaecological surgery: a double blind, multicentre, dose-comparison
V Capouet, C De Pauw, B Vernet, D Ivens, V Derijcke, L Versichelen, H Van Aken,
B Ickx, L Ritter, F Hulstaert.
Acknowledgements to G Rolly, M Coppens etc. (BJA 1996; 76: 54-60)
142

- Co-Investigator in multicentre study: USB 31- -blind, compara-
tive study to investigate the safety and efficacy of Ultiva versus Fentanyl for patients un-
A Moerman, M Coppens juni-december 1997.
- Co-investigator klinische studie:
u-
sea and vomiting: a double blind, multicentre, dose-
E. Alon, E. Buchser, E. Herrera, F. Christiaens, C. De Pauw, L. De Ritter,
F. Hulstaert, V. Grimaudo. (Anesthesia Analgesia 1998 ; 86 :617-23)
- Co-investigator multi-centre, randomised, double blind, double dummy, placebo con-
trolled, parallel group, phase II study to evaluate the safety, efficacy and pharmacokinet-
ics of oral (25 mg) and intravenous (3 mg and 18 mg) formulations of the neurokinin-1
receptor antagonist, GW597599, when administered with intravenous ondansetron hy-
drochloride for the prevention of post-operative nausea and vomiting and post-
discharge nausea and vomiting in female subject with known risk factors for PONV who
are undergoing surgical procedures associated with an increased emetogenic risk. Pro-
ject 2004/370, 2005
M Struys, M Coppens
- Co-investigator multicentrische, gerandomiseerde, parallelle groep, vergelijkende, actief
gecontroleerde, geblindeerde veiligheidsadviseur, fase IIIa, centrale studie, in volwassen
patiënten die org 25969 vergelijkt met neostigmine administratie als omkering agens
voor een neuromusculaire blok geïnduceerd door toediening van rocuronium of
vecuronium bij herverschijning van T2. Number 2005-001135-30, project . 2005/339,
december 2005
M Struys, M Coppens, 12.12.2005
143