Embed Size (px)
Citation preview
8/8/2019 Studying Communication Networks With Agna
http://slidepdf.com/reader/full/studying-communication-networks-with-agna 1/8
Cognitie, Creier, Comportament / Cognition, Brain, Behavior
Vol. IX(3), 567-574, 2005
©Romanian Association of Cognitive Sciences
STUDYING COMMUNICATION NETWORKS WITH
AGNA 2.1 Marius I. BENTA
*
University College Cork, Ireland
A BSTRACT
This paper gives a general description of the functionality and use of Version
2.1 of an application employed in the study of communication networkscalled Applied Graph and Network Analysis. Along with some elementary
notions related to this field, the graphical user interface and the main tools
available in Agna are presented. Various computational commands, such as
network transformations or analyses, are described in the second part of the
article.
K EY-WORDS: communication networks, social networks, behavior analysis
software
Social Networks Analysis (henceforth SNA) is a powerful methodology
that has known tremendous developments in the past decades (for a general-scopeintroduction to SNA, see Hanneman, 2005; Watts, 2003; Barabasi, 2002; Scott,
2000; Wasserman, 1994; Hoffman, 1992; Knoke, 1982). It has emerged from the
studies in the social psychology of small groups done by Alex Bavelas, Harold
Leavitt, Harrison White, and Claude Flament in the 50s and 60s coupled with the
techniques employed in the sociometry school. More recently, SNA techniques
have begun to be applied to studying non-human social behavior, particularly
social structures and communication networks in mammals (see, for example,
Newman, 2004; Lusseau, 2003; McComb, 2001; Wells, 1987).
The main assumption of the SNA framework is that the systemic and sub-
systemic properties of a communication group—be it a human, an animal, an
institutional, or an economic relational structure—depend to a large extent on the
topological and quantitative descriptors thereof. In other words, the shape of agroup communication structure determines such attributes of the group as the
efficiency in performing a given task, the degree of moral satisfaction of its
members, or the chances of a given member to reaching a leadership position.
SNA has developed its specific terminology largely borrowed from graph
theory. Accordingly, a network is a set of nodes (or actors) connected among them
*Corresponding address:
E-mail: [email protected]
8/8/2019 Studying Communication Networks With Agna
http://slidepdf.com/reader/full/studying-communication-networks-with-agna 2/8
Septembrie 2005 • Cogni ţ ie, Creier, Comportament 568
by ties (or edges). The size of a network is the number of its nodes. A network isvalued (or weighted ) when each of its edges has an associated numeric value and
binary when its edges merely reflect the presence of connections between nodes.
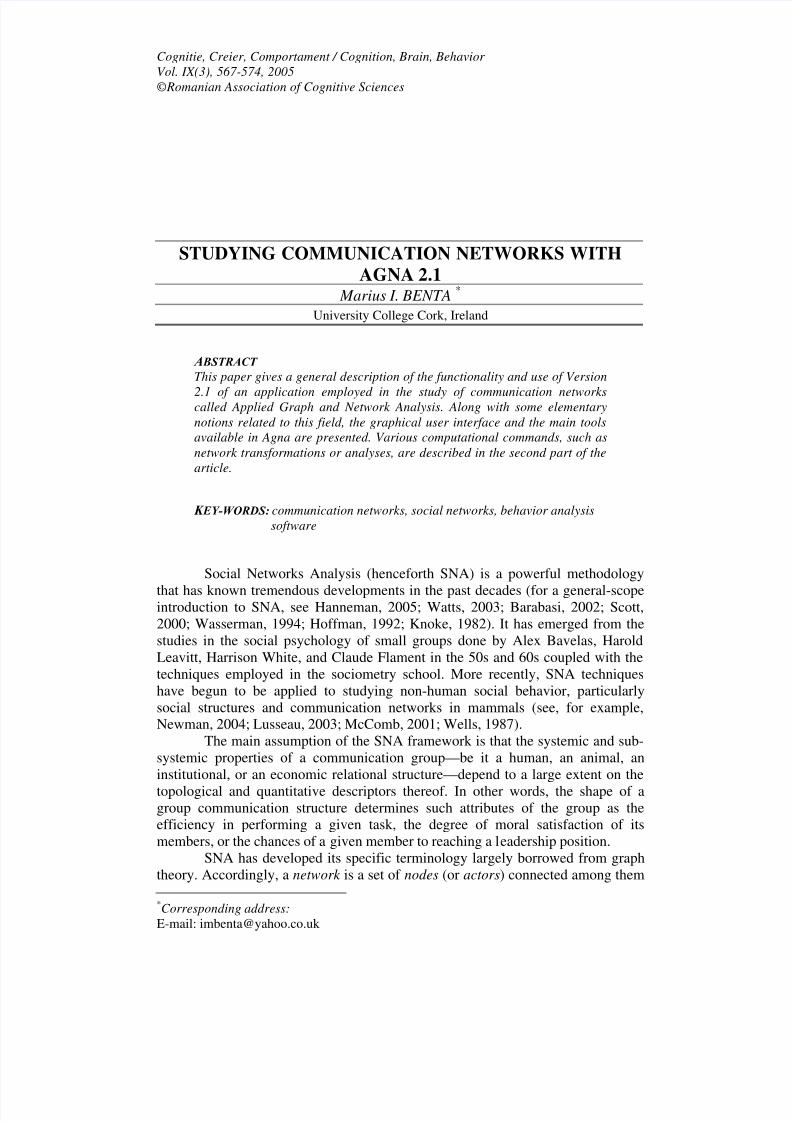
For instance, Figure 1 represents a binary network with six actors (John,
Liz, Alice, Phil, Yvonne and Mike).
Figure 1. A simple network of six actors
An important concept in SNA is that of sociomatrix. The sociomatrix of a
network of size n is a square matrix (n x n) whose elements represent the ties. The
sociomatrix associated to the network in Figure 1 is shown in the following table:
John Liz Alice Phil Yvonne Mike
John 0 1 0 1 0 0
Liz 1 0 0 0 0 0
Alice 0 0 0 1 0 0
Phil 1 0 1 0 1 1
Yvonne 0 0 0 1 0 1
Mike 0 0 0 1 1 0
Networks can also be directed or undirected . In an undirected network , the
communication link between two actors is represented by a single, non-oriented tie,whereas in a directed network the communication relations between two actors are
represented by oriented arcs.
The User Interface
Agna is a general SNA desktop application for small and medium sized
networks. It is a platform-independent framework and allows creating, editing, and
analyzing social networks, as well as producing text and graphical output.
8/8/2019 Studying Communication Networks With Agna
http://slidepdf.com/reader/full/studying-communication-networks-with-agna 3/8
Septembrie 2005 • Cogni ţ ie, Creier, Comportament 569
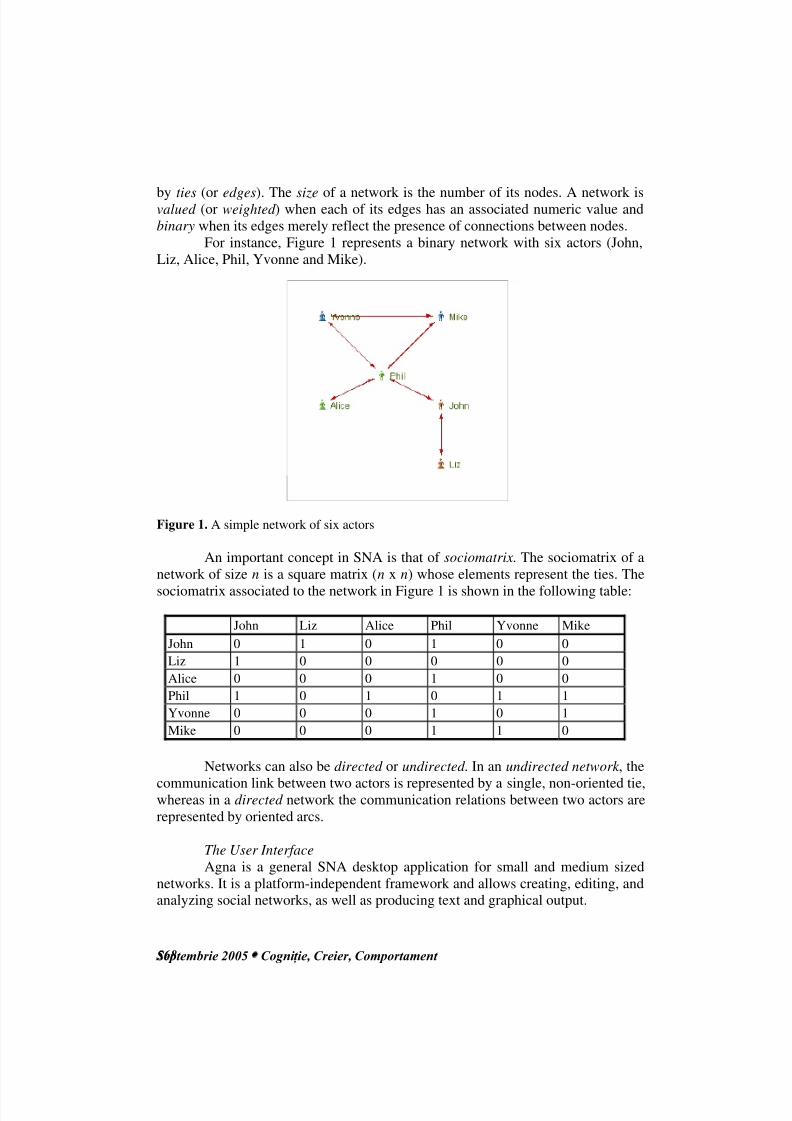
The main window (or the Main Frame, see Figure 2) of the Agna graphicalinterface contains a spreadsheet-like grid, which allows the user to easily enter and
modify sociomatrix data. Agna always stores the sociomatrix data of a network as
real numbers. Also, Agna always forces diagonal elements to zero, which means
that self-connections are never allowed. The decision whether a network is binary,
valued, directed, or non-directed is made by the application at run time.
Figure 2. Agna 2.1 main window
Data can be entered by clicking on the desired cell or by keyboard arrow
movements. The grid also allows selecting ranges of data, as well as exchanging
data with other applications (such as Microsoft Excel) via copy and paste
functions. Clicking on the left-side vertical header allows the user to edit the names
of the actors.
The Main Frame contains a basic text editor (the Output Area), which
provides some functionality in manipulating the reports that Agna generates
automatically when the user selects a command from the Analysis menu.
The File menu in the Main Frame offers three options to saving the
currently open network: Agna Data Format (.agn), Text Tab-Separated (.dat or
.txt), and Comma Separated Values (.csv). The native Agna file format (.agn)
contains all the information related to a network created with this application,
8/8/2019 Studying Communication Networks With Agna
http://slidepdf.com/reader/full/studying-communication-networks-with-agna 4/8
Septembrie 2005 • Cogni ţ ie, Creier, Comportament 570
including the graphical information. The CSV format only saves sociomatrix dataand node names, while TTS saves nothing but the sociomatrix.
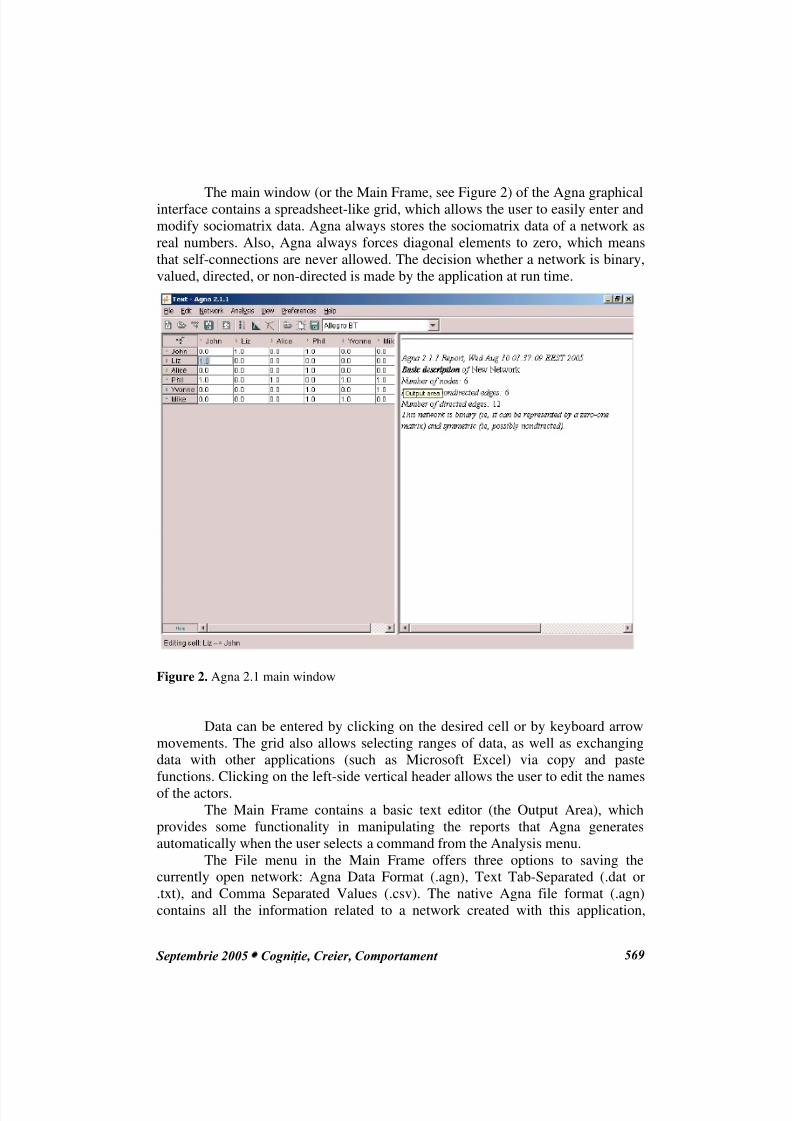
The secondary window of the application is a visual network editor (the
Network Viewer), which is by default inactive and can be made active by pressing
Ctrl + Z (see Figure 3).
Figure 3. The visual network editor
The Network Viewer offers various capabilities to editing networks (the
Data menu), to modifying their graphic appearance (Image, Node, and Edge), and
to exporting the images thus created (the File menu). It also allows the user tosearch actors by their name.
Connections among nodes can be created or edited in the visual network
editor by clicking successively on two nodes then pressing Ctrl + E. New nodes
can be added to the network by double-clicking anywhere in the free area; existing
nodes can be removed, isolated, or cloned using the commands from the Data
menu.
Every data change performed in the Network Viewer will automatically be
reflected in the sociomatrix grid and vice-versa.
8/8/2019 Studying Communication Networks With Agna
http://slidepdf.com/reader/full/studying-communication-networks-with-agna 5/8
Septembrie 2005 • Cogni ţ ie, Creier, Comportament 571
Transforming NetworksOnce a network has been created, several transformations can be applied to
it. Network transformations can be accessed from the Network Menu in the Main
Frame, and the most frequently used are:
! Remove Outsiders: deletes from current network all isolated nodes (i.e.,
nodes completely disconnected);
! Scalar Multiplication: multiplies every connection value in the current
network by a given number;! Transpose: reverses the arrow orientation of every tie in the network;
! Symmetrize: transforms the current network into a symmetric network
following a symmetrization criterion, such as: Minimum, Maximum,
Below Diagonal, Above Diagonal, Sum, Mean, etc.
! Binarize: transforms the current network into a binary network byreplacing every non-zero connection value with 1.
Analyzing Networks
The Analysis menu in the Main Frame provides several options to
performing SNA-specific computations over the currently open network. The
results are generated into the Output Area, which is a very simple text editor
provided with an HTML export function (File | Save Output As…).
Apart from Basic Description, which produces elementary information
about the current network—such as type, size, and number of edges—, Agna can
compute two categories of parameters: centrality coefficients and sociometric
indexes, and can perform some distance-related analyses.
Centrality
This is one of the first concepts to have been studied in SNA experiments.
Centrality as an actor-level coefficient reflects the degree of access to information
(or resources) of an actor and hence the probability of that actor to acquire a
leadership position in the group.
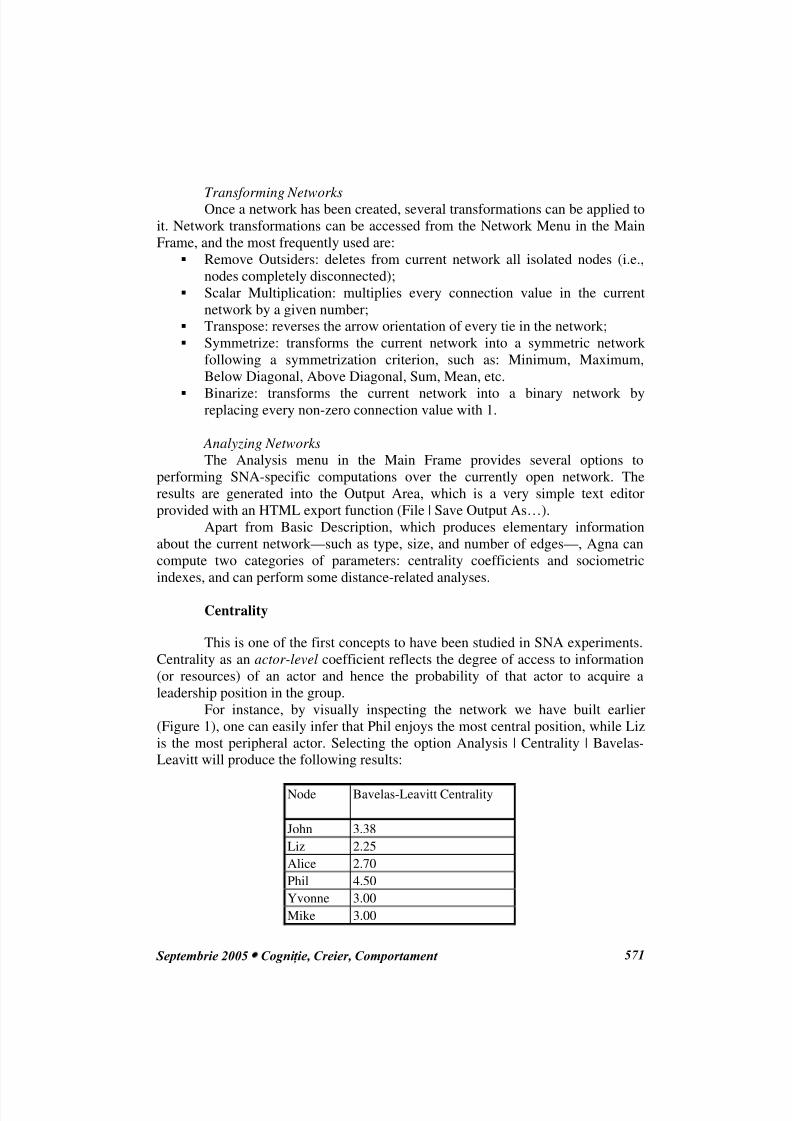
For instance, by visually inspecting the network we have built earlier
(Figure 1), one can easily infer that Phil enjoys the most central position, while Liz
is the most peripheral actor. Selecting the option Analysis | Centrality | Bavelas-
Leavitt will produce the following results:
Node Bavelas-Leavitt Centrality
John 3.38
Liz 2.25
Alice 2.70
Phil 4.50
Yvonne 3.00
Mike 3.00

8/8/2019 Studying Communication Networks With Agna
http://slidepdf.com/reader/full/studying-communication-networks-with-agna 6/8
Septembrie 2005 • Cogni ţ ie, Creier, Comportament 572
Indeed, Phil has the highest score (4.50), which gives him the highestchances to becoming the leader of the group, whereas Liz (2.25) appears to cast the
least influence over the network.
We were able to disclose the centrality positions of the actors within this
network at a glance because the network only has six members. In the case of
larger networks, however, visual estimations are much more difficult if not
impossible, and the use of computed centrality estimates is obviously required.
As a network-level coefficient, centrality measures the distribution of
information (or power) within the group. In a highly centralized network,
information is localized in a single actor or in a small number of actors. For the
network in Figure 1, the Freeman General Coefficient computed for the Bavelas-
Leavitt centrality coefficients has the value of 1.15, whereas in a six-actor network
in which everyone is connected to everyone this coefficient has the value 0.0because all the actors have equal centrality coefficients.
Given that they account for the degree of uniformity/non-uniformity in the
distribution of information within a group, the various measures of network-level
centrality can be thought as different versions of entropy. For this reason, Agna
computes the informational entropy itself as a network-level property apart from
Freeman General Coefficient. In particular, the relative entropy can be an efficient
centrality measure, as it ensures comparability among networks of different size.
It is important to note that centrality operations only apply to binary
networks. If applied to valued networks, Agna tacitly converts the connection
values to binary data.
Sociometric Coefficients
In a communication network, actor-level sociometric coefficients measure
the level of communicational activity of a specific actor. Unlike centrality
coefficients, sociometric coefficients do take into account the weighting
information contained in a network. On the other hand, the sociometric coefficients
of an actor only take into account the information about connections with its
immediate neighbors.
Among various sociometric coefficients, the emission degree and the
outdegree indicate the level of information emitted by an actor. The reception
degree and the indegree reflect quantitatively the informational input of an actor.
The emission and reception degrees give absolute values, whereas the indegree and
outdegree are relative to the size of the network. The sociometric status and the
determination degree are also relative measures. While the sociometric status
reflects the overall communicational activity of an actor, the determination degree
is an index of the influence or dominance an actor receives from the other members
of the network. The latter index can have both positive and negative values. When
the determination degree is positive, the actor is mostly a dominated actor or a
consumer of information. When this degree is negative, the actor is a rather
dominating agent or a producer of information.
8/8/2019 Studying Communication Networks With Agna
http://slidepdf.com/reader/full/studying-communication-networks-with-agna 7/8
Septembrie 2005 • Cogni ţ ie, Creier, Comportament 573
At network level, Agna computes density and cohesion. Density refers tothe degree of connectedness of a network; in different words, it shows if a network
is dense in connections or scarce. Cohesion is an index that measures the amount of
symmetry contained in a directed network.
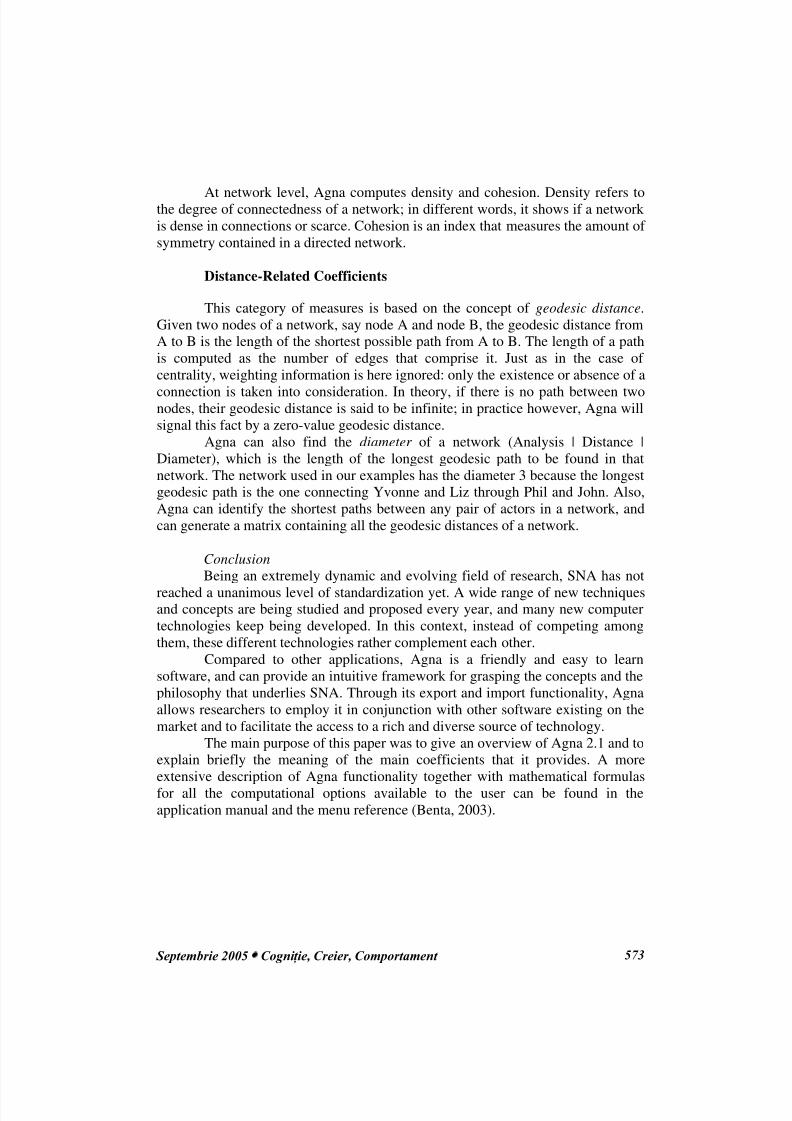
Distance-Related Coefficients
This category of measures is based on the concept of geodesic distance.
Given two nodes of a network, say node A and node B, the geodesic distance from
A to B is the length of the shortest possible path from A to B. The length of a path
is computed as the number of edges that comprise it. Just as in the case of
centrality, weighting information is here ignored: only the existence or absence of a
connection is taken into consideration. In theory, if there is no path between twonodes, their geodesic distance is said to be infinite; in practice however, Agna will
signal this fact by a zero-value geodesic distance.
Agna can also find the diameter of a network (Analysis | Distance |
Diameter), which is the length of the longest geodesic path to be found in that
network. The network used in our examples has the diameter 3 because the longest
geodesic path is the one connecting Yvonne and Liz through Phil and John. Also,
Agna can identify the shortest paths between any pair of actors in a network, and
can generate a matrix containing all the geodesic distances of a network.
Conclusion
Being an extremely dynamic and evolving field of research, SNA has not
reached a unanimous level of standardization yet. A wide range of new techniquesand concepts are being studied and proposed every year, and many new computer
technologies keep being developed. In this context, instead of competing among
them, these different technologies rather complement each other.
Compared to other applications, Agna is a friendly and easy to learn
software, and can provide an intuitive framework for grasping the concepts and the
philosophy that underlies SNA. Through its export and import functionality, Agna
allows researchers to employ it in conjunction with other software existing on the
market and to facilitate the access to a rich and diverse source of technology.
The main purpose of this paper was to give an overview of Agna 2.1 and to
explain briefly the meaning of the main coefficients that it provides. A more
extensive description of Agna functionality together with mathematical formulas
for all the computational options available to the user can be found in the
application manual and the menu reference (Benta, 2003).
8/8/2019 Studying Communication Networks With Agna
http://slidepdf.com/reader/full/studying-communication-networks-with-agna 8/8
Septembrie 2005 • Cogni ţ ie, Creier, Comportament 574
REFERENCES
Barabasi, A.-L. (2002). Linked—The New Science of Networks. Cambridge, MA: Perseus
Publishing.Benta, M. I. (2003). Agna 2.1 User Manual. Retrieved August 2nd, 2005, from
http://www.geocities.com/imbenta/agna/doc/User_Manual.htm.
Hanneman, R. A. & Riddle, M. (2005). Introduction to Social Network Methods. Riverside,
CA: University of California.
Hoffman, C., Wilcox, L., Gomez, E., & Hollander, C. (1992). Sociometric Applications in a
Corporate Environment. Journal of Group Psychotherapy, Psychodrama &Sociometry, 45, 3-16.
Knoke, D. & Kuklinski, J. H. (1982). Network Analysis, Sage University Paper, 07-028.
Lusseau D. (2003). The Emergent Properties of a Dolphin Social Network. Proceedings of
the Royal Society of London Series B-Biological Sciences, 270, S186-S188.McComb K., Moss C., Durant S.M., Baker L., & Sayialel S. (2001). Matriarchs as
Repositories of Social Knowledge in African Elephants. Science, 292, 491-494.
Newman M.E.J. & Girvan M. (2004). Finding and Evaluating Community Structure in
Networks. Physical Review E, 69, 026113.
Scott, J. (2000). Social Network Analysis: A Handbook . London: Sage Publications.
Wasserman, S. & Faust, K. (1994). Social Network Analysis: Methods and Applications,
Cambridge, MA: Cambridge University Press.
Watts, D. (2003). Six Degrees: The Science of a Connected Age. New York: W.W. Norton
and Company.
Wells R.S., Scott M.D. & Irvine A.B. (1987). The Social Structure of Free Ranging
Bottlenose Dolphins. In H. H. Genoways (Ed.), Current Mammalogy (pp. 247-305).
New York: Plenum Press.