Embed Size (px)
Citation preview
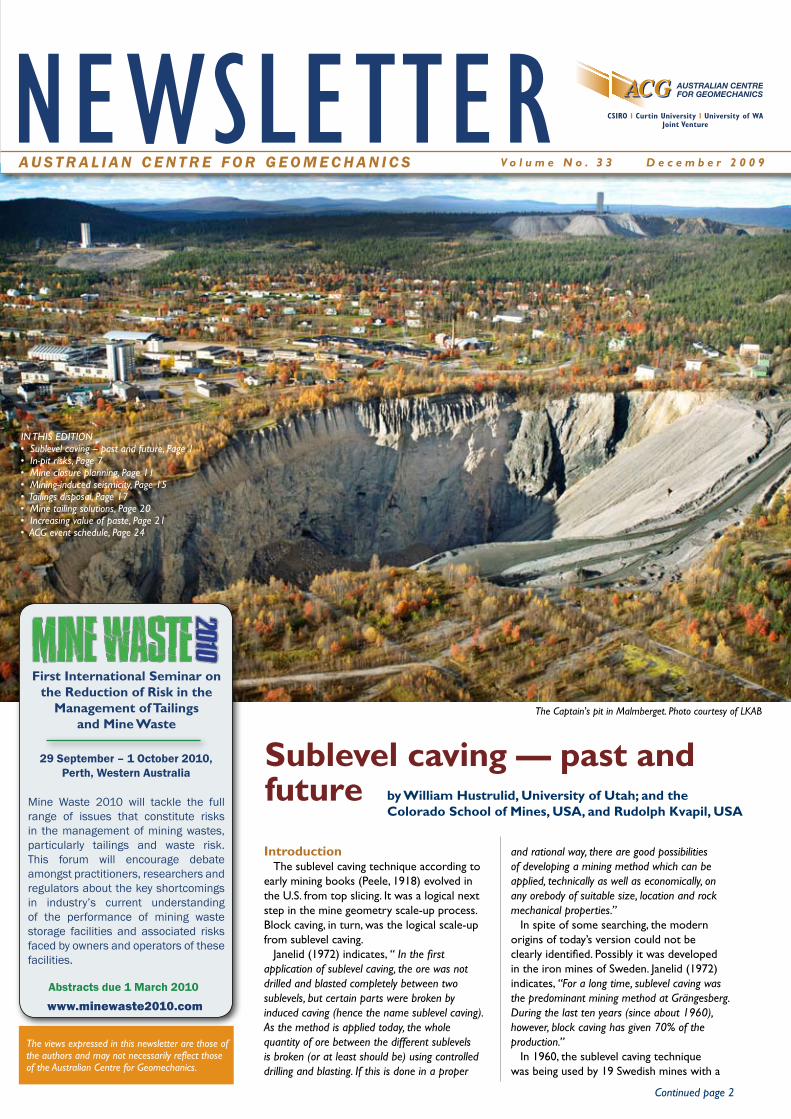
The Captain's pit in Malmberget. Photo courtesy of LKAB
A U S T R A L I A N C E N T R E F O R G E O M E C H A N I C S V o l u m e N o . 3 3 D e c e m b e r 2 0 0 9
NEWSLETTER
The views expressed in this newsletter are those of the authors and may not necessarily reflect those of the Australian Centre for Geomechanics.
Continued page 2
Sublevel caving — past and future
IN THIS EDITION • Sublevel caving – past and future, Page 1• In-pit risks, Page 7• Mine closure planning, Page 11• Mining-induced seismicity, Page 15• Tailings disposal, Page 17• Mine tailing solutions, Page 20• Increasing value of paste, Page 21• ACG event schedule, Page 24
by William Hustrulid, University of Utah; and the Colorado School of Mines, USA, and Rudolph Kvapil, USA
www.minewaste2010.com
29 September – 1 October 2010, Perth, Western Australia
Abstracts due 1 March 2010
IntroductionThe sublevel caving technique according to
early mining books (Peele, 1918) evolved in the U.S. from top slicing. It was a logical next step in the mine geometry scale-up process. Block caving, in turn, was the logical scale-up from sublevel caving.
Janelid (1972) indicates, “ In the first application of sublevel caving, the ore was not drilled and blasted completely between two sublevels, but certain parts were broken by induced caving (hence the name sublevel caving). As the method is applied today, the whole quantity of ore between the different sublevels is broken (or at least should be) using controlled drilling and blasting. If this is done in a proper
and rational way, there are good possibilities of developing a mining method which can be applied, technically as well as economically, on any orebody of suitable size, location and rock mechanical properties.”
In spite of some searching, the modern origins of today’s version could not be clearly identified. Possibly it was developed in the iron mines of Sweden. Janelid (1972) indicates, “For a long time, sublevel caving was the predominant mining method at Grängesberg. During the last ten years (since about 1960), however, block caving has given 70% of the production.”
In 1960, the sublevel caving technique was being used by 19 Swedish mines with a
Mine Waste 2010 will tackle the full range of issues that constitute risks in the management of mining wastes, particularly tailings and waste risk. This forum will encourage debate amongst practitioners, researchers and regulators about the key shortcomings in industry’s current understanding of the performance of mining waste storage facilities and associated risks faced by owners and operators of these facilities.
First International Seminar on the Reduction of Risk in the
Management of Tailings and Mine Waste

2 Australian Centre for Geomechanics • December 2009 Newsletter
Continued from page 1
© Copyright 2009. Australian Centre for Geomechanics (ACG), The University of Western Australia (UWA). All rights reserved. No part of this newsletter may be reproduced, stored or transmitted in any form without the prior written permission of the Australian Centre for Geomechanics, The University of Western Australia.
The information contained in this newsletter is for general educational and informative purposes only. Except to the extent required by law, UWA and the ACG make no representations or warranties express or implied as to the accuracy, reliability or completeness of the information contained therein. To the extent permitted by law, UWA and the ACG exclude all liability for loss or damage of any kind at all (including indirect or consequential loss or damage) arising from the information in this newsletter or use of such information. You acknowledge that the information provided in this newsletter is to assist you with undertaking your own enquiries and analyses and that you should seek independent professional advice before acting in reliance on the information contained therein.
the economic benefits which can be achieved through the development of the correct method are extraordinarily large.”
In Czechoslovakia in 1950, Rudolf Kvapil was given the task of determining the causes of problems in bins and silos and, based on this new understanding, to develop ways of improving their performance. It was evident to him that it would first be necessary to determine the basic gravity flow principles for granular and coarse materials since they must be completely different from principles describing the flow of liquids which were then available for use. He decided that the only realistic way to proceed was to construct and test a large number of models and to make in situ observations. Many of these models and the knowledge gained are described in his recent book (Kvapil, 2004). In 1965, Kvapil joined Janelid at KTH and began applying the gravity flow principles gained in the study of bins and silos to sublevel caving.
Figure 2 shows the application of this type of model to a sublevel cave design. In this particular case, the sublevel spacing is 12.5 m, the drift dimension is 5 x 3.5 m, the sublevel drift spacing is 12 m and the burden is 2 m. These closely resemble the sublevel dimensions used by the Kiruna Mine in the early 1980s. It is interesting to note that the design is based on a drawbody width (WT) to drawpoint width (WD) ratio of 1.7.
Figure 2 Application of gravity flow principles to sublevel caving design (Kvapil,1982, 1992)
Over the past few years, the scale of sublevel caving has increased markedly with
LKAB being a leader in this regard. Figure 3 provides a comparison of the sublevel caving mining geometries appropriate for the years 1963, 1983 and 2003 at the Kiruna Mine. Some of the important parameters are tabulated in Table 1.
Figure 3 The sublevel caving geometry at the Kiruna Mine at three different points in time (Marklund and Hustrulid, 1995)
At the Kiruna Mine today the sublevel spacing is 28.5 m. In certain sectors of LKAB’s Malmberget Mine, the sublevel spacing is as high as 30 m.
Table 1 Summary of some important design parameters (Marklund and Hustrulid, 1995)
Today, with the continuing push to increase mining scale, a fundamental question is whether the gravity flow principles which served as the design basis for the small-scale sublevel caving mine designs of the past can be applied at much larger scales or whether some other approach is required. This article will provide some thinking in that regard.
total yearly production of about 9.5 Mton (Ohlsson, 1961). Figure 1 is a sketch of the method as practiced at LKAB’s Kiruna Mine at about that point in time.
Figure 1 Composite section view of the sublevel caving mine at Kiruna in 1957
The scale was small, certainly by today’s standards, with a sublevel spacing of 9 m, a drift size of 5 x 3.5 m, and a sublevel drift spacing of 10 m centre-to-centre.
As Janelid (1961, 1972) pointed out, “Sublevel caving is in many respects simple. It can be used in orebodies with very different properties and it is easy to mechanize. However, from other points of view such as recovery, dilution and similar, the method is unfavorable. The designs which are used and the measures which can be taken to eliminate the disadvantages are poorly understood. In the end of the 1950’s, model tests regarding gravity flow in material resembling broken rock were started at the Division of Mining, the Royal Institute of Technology (KTH) in Stockholm. The purpose was to study how the geometrical design of various parameters in sublevel caving are influenced by the motion which is induced in the material when ore is loaded in a sublevel drift. Some of these model tests were performed as a part of senior theses and others by assistants and research engineers. Model tests and extensive literature studies on sublevel caving have also been carried out in Kiruna together with conducting practical tests underground. The results achieved have been so encouraging that continued research work is well justified since
Figure 3 The sublevel caving geometry at the Kiruna Mine at three different points in time (Marklund and Hustrulid, 1995) At the Kiruna Mine today the sublevel spacing is 28.5 m. In certain sectors of LKAB’s Malmberget Mine, the sublevel spacing is as high as 30 m. Table 1 Summary of some important design parameters (Marklund and Hustrulid, 1995)
Year Parameter 1963 1983 2003
Drift width (m) 5 5 7 Drift height (m) 3.5 4 5
Sublevel height (m) 9 12 27 Sublevel drift spacing
(m) 10 11 25 Blasthole diameter
(mm) 45 57-76 115 Burden (m) 1.6 1.8 3 Holes/ring 9 9 10
Tons/ring (t) 660 1080 9300 Tons/metre of drift
(t/m) 400 600 3100 Today, with the continuing push to increase mining scale, a fundamental question is whether the gravity flow principles which served as the design basis for the small-scale sublevel caving mine designs of the past can be applied at much larger scales or whether some other approach is required. This article will provide some thinking in that regard. Mine marker studies
3Australian Centre for Geomechanics • December 2009 Newsletter
CavingMine marker studies
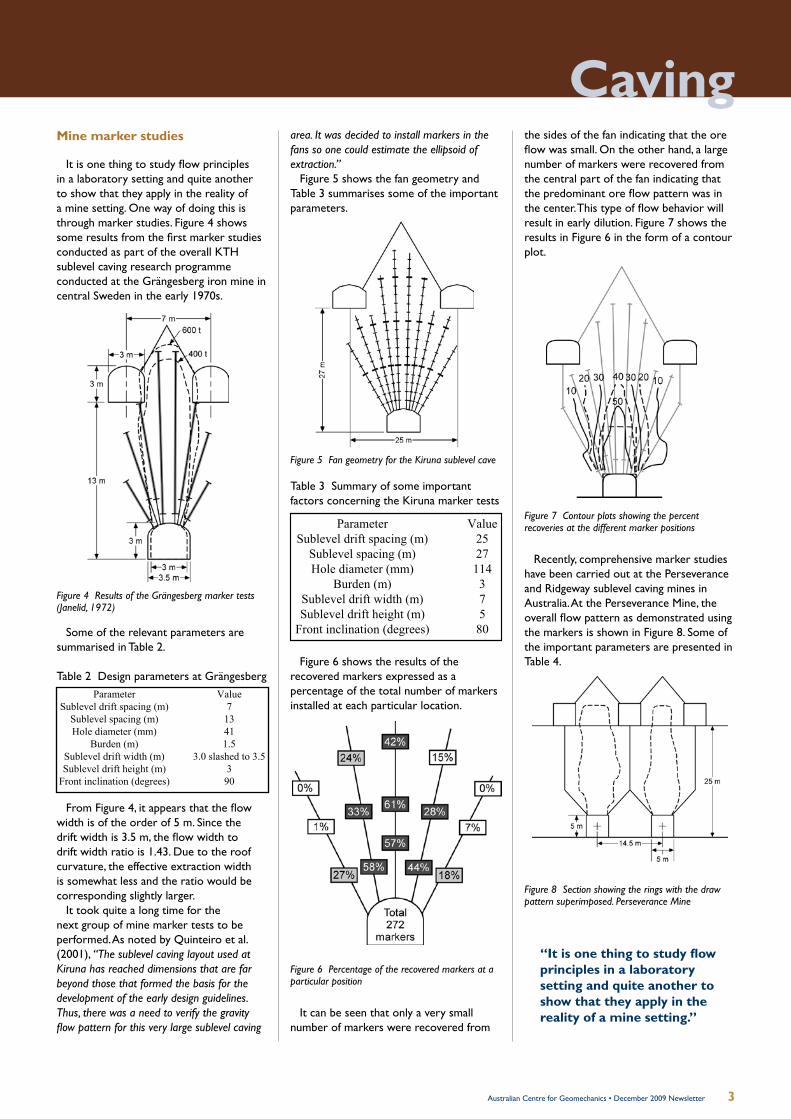
It is one thing to study flow principles in a laboratory setting and quite another to show that they apply in the reality of a mine setting. One way of doing this is through marker studies. Figure 4 shows some results from the first marker studies conducted as part of the overall KTH sublevel caving research programme conducted at the Grängesberg iron mine in central Sweden in the early 1970s.
Figure 4 Results of the Grängesberg marker tests (Janelid, 1972)
Some of the relevant parameters are summarised in Table 2.
Table 2 Design parameters at Grängesberg
From Figure 4, it appears that the flow width is of the order of 5 m. Since the drift width is 3.5 m, the flow width to drift width ratio is 1.43. Due to the roof curvature, the effective extraction width is somewhat less and the ratio would be corresponding slightly larger.
It took quite a long time for the next group of mine marker tests to be performed. As noted by Quinteiro et al. (2001), “The sublevel caving layout used at Kiruna has reached dimensions that are far beyond those that formed the basis for the development of the early design guidelines. Thus, there was a need to verify the gravity flow pattern for this very large sublevel caving
area. It was decided to install markers in the fans so one could estimate the ellipsoid of extraction.”
Figure 5 shows the fan geometry and Table 3 summarises some of the important parameters.
Figure 5 Fan geometry for the Kiruna sublevel cave
Table 3 Summary of some important factors concerning the Kiruna marker tests
Figure 6 shows the results of the recovered markers expressed as a percentage of the total number of markers installed at each particular location.
Figure 6 Percentage of the recovered markers at a particular position
It can be seen that only a very small number of markers were recovered from
the sides of the fan indicating that the ore flow was small. On the other hand, a large number of markers were recovered from the central part of the fan indicating that the predominant ore flow pattern was in the center. This type of flow behavior will result in early dilution. Figure 7 shows the results in Figure 6 in the form of a contour plot.
Figure 7 Contour plots showing the percent recoveries at the different marker positions
Recently, comprehensive marker studies have been carried out at the Perseverance and Ridgeway sublevel caving mines in Australia. At the Perseverance Mine, the overall flow pattern as demonstrated using the markers is shown in Figure 8. Some of the important parameters are presented in Table 4.
Figure 8 Section showing the rings with the draw pattern superimposed. Perseverance Mine
It is one thing to study flow principles in a laboratory setting and quite another to show that they apply in the reality of a mine setting. One way of doing this is through marker studies. Figure 4 shows some results from the first marker studies conducted as part of the overall KTH sublevel caving research programme conducted at the Grängesberg iron mine in central Sweden in the early 1970s.
Figure 4 Results of the Grängesberg marker tests (Janelid, 1972) Some of the relevant parameters are summarised in Table 2. Table 2 Design parameters at Grängesberg
Parameter Value Sublevel drift spacing (m) 7
Sublevel spacing (m) 13 Hole diameter (mm) 41
Burden (m) 1.5 Sublevel drift width (m) 3.0 slashed to 3.5 Sublevel drift height (m) 3
Front inclination (degrees) 90 From Figure 4, it appears that the flow width is of the order of 5 m. Since the drift width is 3.5 m, the flow width to drift width ratio is 1.43. Due to the roof curvature, the effective extraction width is somewhat less and the ratio would be corresponding slightly larger. It took quite a long time for the next group of mine marker tests to be performed. As noted by Quinteiro et al (2001) “The sublevel caving layout used at Kiruna has reached dimensions that are far beyond those that formed the basis for the development of the early design guidelines. Thus, there was a need to verify the gravity flow pattern for this very large sublevel caving area. It was decided to install markers in the fans so one could estimate the ellipsoid of extraction.” Figure 5 shows the fan geometry and Table 3 summarises some of the important parameters.
Figure 5 Fan geometry for the Kiruna sublevel cave Table 3 Summary of some important factors concerning the Kiruna marker tests .
Parameter Value Sublevel drift spacing (m) 25
Sublevel spacing (m) 27 Hole diameter (mm) 114
Burden (m) 3 Sublevel drift width (m) 7 Sublevel drift height (m) 5
Front inclination (degrees) 80 Figure 6 shows the results of the recovered markers expressed as a percentage of the total number of markers installed at each particular location.
Figure 6 Percentage of the recovered markers at a particular position It can be seen that only a very small number of markers were recovered from the sides of the fan indicating that the ore flow was small. On the other hand, a large number of markers were recovered from the central part of the fan indicating that the predominant ore flow pattern was
“It is one thing to study flow principles in a laboratory setting and quite another to show that they apply in the reality of a mine setting.”

4 Australian Centre for Geomechanics • December 2009 Newsletter
Table 4 Summary of some important factors concerning the Perseverance marker tests
Table 5 summarises some of the important parameters concerning the Ridgeway marker tests.
Table 5 Summary of design parameters from the Ridgeway Mine
In reviewing the results of the marker tests from the Grängesberg, Kiruna, Perseverance and Ridgeway mines, it is interesting to note that they all basically reveal a type of “silo” flow such as shown in Figure 9 even if the drilling pattern extends far outside of the “silo.”
Figure 9 “Silo” type of flow pattern. Kvapil (1955), Janelid and Kapil (1965)
The “average” primary flow width/drift width ratios (Wf /Wd) for the four cases are summarised in Table 6.
Table 6 A comparison of the marker flow
The Wf /Wd ratio of 1.4 – 1.7 seems to apply for small scale sublevel caving geometries as well as very large scale. These results are in agreement with the early sublevel caving geometry recommended by Kvapil (see Figure 2) which used 1.7.
In retrospect, there are three reasons why this is a very logical result:1. The middle holes of the ring are fired
first and can make first use of the swell volume offered by the underlying sublevel drift.
2. The central holes are drilled subvertical, fairly parallel, and relatively close to one another. The result is a relatively high and uniform specific charge compared to the other holes in the round. Thus, one would expect the best, most uniform fragmentation.
3. The ore material in the central part of the round can make the best use of the effect of gravity in directing it to the drawpoint.As indicated earlier, small-scale physical
model test results have historically played a very important role in the dimensioning of sublevel caves. In the construction of these models, the sand or other material is simply poured into the forms. As such, the properties are uniform and the mobilities are the same independent of position within the model. In a sublevel cave, this is not the case. All of the material in the fan is drilled and blasted. Because of the fan geometry, the amount of explosive/unit volume and hence the fragmentation varies throughout the fan. The ore material in the centre part of the fan and the lower part of the fan has a much higher specific charge than that at the boundaries of the ring. Furthermore, the “cave” which lies in front of the blasted slice is an eclectic mixture of waste rock and ore remnants. Its mobility varies with location and with time (it changes with the extraction geometry).
Finally, most rock materials upon being blasted would like to bulk (swell) of the order of 50%. In sublevel caving, it is the sublevel drift located at the bottom end
of the fan which is the primary provider of swell space for the ore in the ring. As shown in Table 7, the available free swell is highly mining scale dependent.
Table 7 Available “free” swell for the different LKAB designs
As the scale has increased over the years in the quest to reduce the specific development, the available free swell has correspondingly decreased. With the current LKAB design it is only about 5%. Since it is located at the bottom of the fan, the ore in the near vicinity of the drift has a much greater access to this volume and the chance to bulk. The ore at the extremities of the fan, on the other hand, has little chance to bulk and its mobility is very low. Based on material mobility alone, one would expect significant differences in the mechanics of flow between the sand models and reality, particularly as the sublevel scale is increased. Hence, the marker test results have very high significance.
Sublevel cave layout rules based upon marker test input
Based upon the results of the four marker tests, it appears that the Wf can be expressed as a constant times the width of the Wd. As a first approximation,
Wf = (1.4 – 1.7) Wd (1)
Some preliminary design rules for initial planning are summarised below:• Sublevel drift size (width (Wd) and
height (Hd): determined based on equipment.
• Sublevel interval (HS): the theoretical maximum value is based on the ability
in the center. This type of flow behavior will result in early dilution. Figure 7 shows the results in Figure 6 in the form of a contour plot.
Figure 7 Contour plots showing the percent recoveries at the different marker positions
Recently, comprehensive marker studies have been carried out at the Perseverance and Ridgeway sublevel caving mines in Australia. At the Perseverance Mine, the overall flow pattern as demonstrated using the markers is shown in Figure 8. Some of the important parameters are presented in Table 4.
Figure 8 Section showing the rings with the draw pattern superimposed (Perseverance Mine) Table 4 Summary of some important factors concerning the Perseverance marker tests
Parameter Value Sublevel drift spacing (m) 14.5
Sublevel spacing (m) 25 Hole diameter (mm) 102
Burden (m) 3 Sublevel drift width (m) 5.1 Sublevel drift height (m) 4.8
Front inclination (degrees) 75
A typical result from the Ridgeway Mine marker studies is shown in Figure 9. Table 5 summarises some of the important parameters.
Sublevel drift height (m) 4.8 Front inclination
(degrees) 75 A typical result from the Ridgeway Mine marker studies is shown in Figure 9. Table 5 summarises some of the important parameters.
Figure 9 An example showing marker recovery at the Ridgeway mine. (After Brunton, 2009) Table 5. Summary of design parameters from the Ridgeway Mine
Parameter Value Sublevel drift spacing (m) 14
Sublevel spacing (m) 30 Hole diameter (mm) 102
Burden (m) 2.6 Sublevel drift width (m) 6 Sublevel drift height (m) 4.7
Front inclination (degrees) 80
In reviewing the results of the marker tests from the Grängesberg, Kiruna, Perseverance and Ridgeway mines, it is interesting to note that they all basically reveal a type of “silo” flow such as shown in Figure 10, even if the drilling pattern extends far outside of the “silo.”
Figure 10 “Silo” type of flow pattern. Kvapil (1955), Janelid and Kapil (1965) The “average” primary flow width/drift width ratios (Wf/Wd) for the four cases are summarised in Table 6. Table 6 A comparison of the marker flow patterns
Mine Drift width
(Wd) Level
interval Flow width
(Wf) Wf/Wd (m) (m) (m)
Grängesberg 3.5 13 4.9 1.4 Kiruna 7 27 10.3* 1.5
Perseverance 5 25 7.1 1.4 Ridgeway 5.9 25 - 30 10.0 1.7
* Arbitrarily taken as the 30% contour The Wf/Wd ratio of 1.4 – 1.7 seems to apply for small scale sublevel caving geometries as well as very large scale. These results are in agreement with the early sublevel caving geometry recommended by Kvapil (see Figure 2) which used 1.7. In retrospect, there are three reasons why this is a very logical result:
1. The middle holes of the ring are fired first and can make first use of the swell volume offered by the underlying sublevel drift.
2. The central holes are drilled subvertical, fairly parallel, and relatively close to one another. The result is a relatively high and uniform specific charge compared to the other holes in the round. Thus, one would expect the best, most uniform fragmentation.
3. The ore material in the central part of the round can make the best use of the effect of gravity in directing it to the drawpoint.
As indicated earlier, small-scale physical model test results have historically played a very important role in the dimensioning of sublevel caves. In the construction of these models, the sand or other material is simply poured into the forms. As such, the properties are uniform and the mobilities are the same independent of position within the model. In a sublevel cave, this is not the case. All of the material in the fan is drilled and blasted. Because of the fan geometry, the amount of explosive/unit volume and hence the fragmentation varies throughout the fan. The ore material in the centre part of the fan and the lower part of the fan has a much higher specific charge than that at the boundaries of the ring. Furthermore, the “cave” which lies in front of the blasted slice is an eclectic mixture of waste rock and ore
remnants. Its mobility varies with location and with time (it changes with the extraction geometry). Finally, most rock materials upon being blasted would like to bulk (swell) of the order of 50%. In sublevel caving, it is the sublevel drift located at the bottom end of the fan which is the primary provider of swell space for the ore in the ring. As shown in Table 7, the available free swell is highly mining scale dependent. Table 7 Available “free” swell for the different LKAB designs
Design "Free" Swell 1963 24.0 1983 17.9 2003 5.5
As the scale has increased over the years in the quest to reduce the specific development, the available free swell has correspondingly decreased. With the current LKAB design it is only about 5%. Since it is located at the bottom of the fan, the ore in the near vicinity of the drift has a much greater access to this volume and the chance to bulk. The ore at the extremities of the fan, on the other hand, has little chance to bulk and its mobility is very low. Based on material mobility alone, one would expect significant differences in the mechanics of flow between the sand models and reality particularly as the sublevel scale is increased. Hence, the marker test results have very high significance. Sublevel cave layout rules based upon marker test input Based upon the results of the four marker tests, it appears that the Wf can be expressed as a constant times the width of the Wd. As a first approximation, Wf = (1.4 – 1.7) Wd (1) Some preliminary design rules for initial planning are summarised below:
• Sublevel drift size (width (Wd) and height (Hd): determined based on equipment. • Sublevel interval (HS): the theoretical maximum value is based on the ability to drill
long, straight holes. This, in turn, is based on the hole diameter (D). The actual limit is based on recovery and dilution considerations which are due to managing ore/waste pulsation.
• Hole diameter (D): based on the available drilling equipment and the ability to charge long holes.
• Spacing of the sublevel drifts (Sd): Sd = (2.4 – 2.7) Wd (2) • Ring spacing (burden (B)): based upon the damage radius (Rd) concept discussed by
Hustrulid and Johnson (2008): B = 2 Rd (3) Where
rockANFOe
Expehd P
PrR
ρ65.220/ = (4)
Rd = damage radius (m) rh = hole radius (m) Pe Exp = explosion pressure for the explosive Pe ANFO = explosion pressure for ANFO = 1600 MPa ρrock = rock density (g/cm3)
patterns
5Australian Centre for Geomechanics • December 2009 Newsletter
Cavingto drill long, straight holes. This, in turn, is based on the hole diameter (D). The actual limit is based on recovery and dilution considerations which are due to managing ore/waste pulsation.
• Hole diameter (D): based on the available drilling equipment and the ability to charge long holes.
• Spacing of the sublevel drifts (Sd):
Sd = (2.4 – 2.7) Wd (2)
• Ring spacing (burden (B)): based upon the damage radius (Rd) concept discussed by Hustrulid and Johnson (2008)
B = 2 Rd (3)
Where:
(4)
Rd = damage radius (m)rh = hole radius (m) Pe Exp = explosion pressure for the explosivePe ANFO = explosion pressure for ANFO = 1600 MPaρrock = rock density (g/cm3)2.65 = density of typical rock (g/cm3)
• Hole toe spacing (ST): based upon the burden
ST = 1.3 B• Spacing for parallel holes (SP): based
upon the burden
SP = B (5)
• Front inclination: 70–80 degrees (forward)
If it is assumed that:D = 115 mmDrift dimensions: 7 m wide by 5 m highExplosive: emulsion (Pe Exp = 3900 MPa)Rock density = 4.6 g/cm3
Sublevel interval: 25 m based on drilling ability and control of pulsation
One finds that the remaining dimensions are:
Sublevel drift spacing: 17–19 mBurden: 2.7 mToe spacing (fanned): 3.5 mToe spacing (parallel): 3 mFront inclination: 80o selected
It is noted that the new sublevel drift spacing rule has very limited basis and must be carefully complemented with further testing.
Implications for future sublevel caving designs
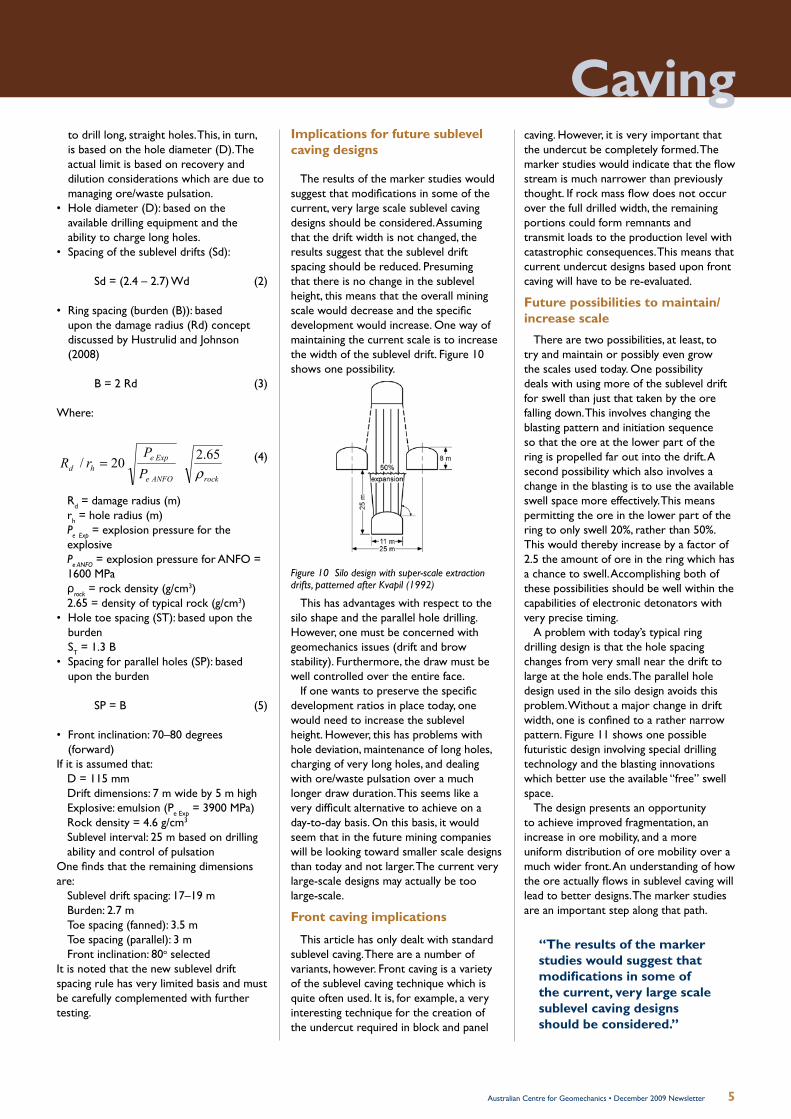
The results of the marker studies would suggest that modifications in some of the current, very large scale sublevel caving designs should be considered. Assuming that the drift width is not changed, the results suggest that the sublevel drift spacing should be reduced. Presuming that there is no change in the sublevel height, this means that the overall mining scale would decrease and the specific development would increase. One way of maintaining the current scale is to increase the width of the sublevel drift. Figure 10 shows one possibility.
Figure 10 Silo design with super-scale extraction drifts, patterned after Kvapil (1992)
This has advantages with respect to the silo shape and the parallel hole drilling. However, one must be concerned with geomechanics issues (drift and brow stability). Furthermore, the draw must be well controlled over the entire face.
If one wants to preserve the specific development ratios in place today, one would need to increase the sublevel height. However, this has problems with hole deviation, maintenance of long holes, charging of very long holes, and dealing with ore/waste pulsation over a much longer draw duration. This seems like a very difficult alternative to achieve on a day-to-day basis. On this basis, it would seem that in the future mining companies will be looking toward smaller scale designs than today and not larger. The current very large-scale designs may actually be too large-scale.
Front caving implications
This article has only dealt with standard sublevel caving. There are a number of variants, however. Front caving is a variety of the sublevel caving technique which is quite often used. It is, for example, a very interesting technique for the creation of the undercut required in block and panel
caving. However, it is very important that the undercut be completely formed. The marker studies would indicate that the flow stream is much narrower than previously thought. If rock mass flow does not occur over the full drilled width, the remaining portions could form remnants and transmit loads to the production level with catastrophic consequences. This means that current undercut designs based upon front caving will have to be re-evaluated.
Future possibilities to maintain/increase scale
There are two possibilities, at least, to try and maintain or possibly even grow the scales used today. One possibility deals with using more of the sublevel drift for swell than just that taken by the ore falling down. This involves changing the blasting pattern and initiation sequence so that the ore at the lower part of the ring is propelled far out into the drift. A second possibility which also involves a change in the blasting is to use the available swell space more effectively. This means permitting the ore in the lower part of the ring to only swell 20%, rather than 50%. This would thereby increase by a factor of 2.5 the amount of ore in the ring which has a chance to swell. Accomplishing both of these possibilities should be well within the capabilities of electronic detonators with very precise timing.
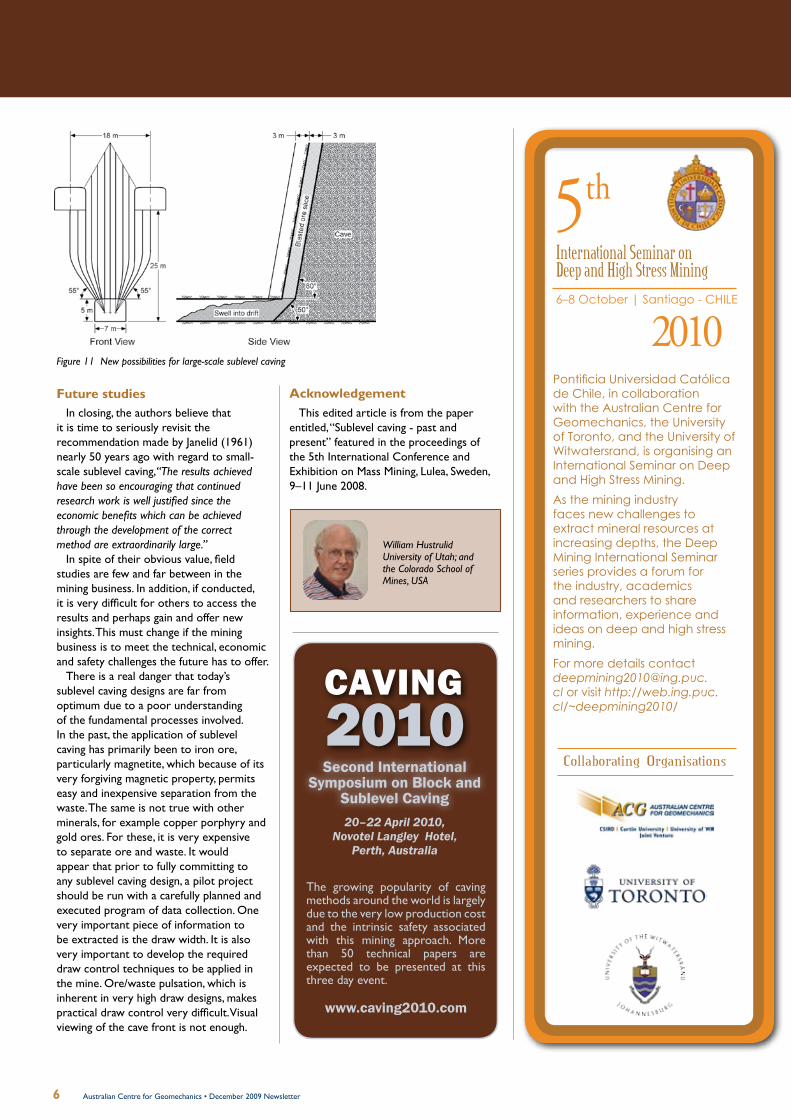
A problem with today’s typical ring drilling design is that the hole spacing changes from very small near the drift to large at the hole ends. The parallel hole design used in the silo design avoids this problem. Without a major change in drift width, one is confined to a rather narrow pattern. Figure 11 shows one possible futuristic design involving special drilling technology and the blasting innovations which better use the available “free” swell space.
The design presents an opportunity to achieve improved fragmentation, an increase in ore mobility, and a more uniform distribution of ore mobility over a much wider front. An understanding of how the ore actually flows in sublevel caving will lead to better designs. The marker studies are an important step along that path.
remnants. Its mobility varies with location and with time (it changes with the extraction geometry). Finally, most rock materials upon being blasted would like to bulk (swell) of the order of 50%. In sublevel caving, it is the sublevel drift located at the bottom end of the fan which is the primary provider of swell space for the ore in the ring. As shown in Table 7, the available free swell is highly mining scale dependent. Table 7 Available “free” swell for the different LKAB designs
Design "Free" Swell 1963 24.0 1983 17.9 2003 5.5
As the scale has increased over the years in the quest to reduce the specific development, the available free swell has correspondingly decreased. With the current LKAB design it is only about 5%. Since it is located at the bottom of the fan, the ore in the near vicinity of the drift has a much greater access to this volume and the chance to bulk. The ore at the extremities of the fan, on the other hand, has little chance to bulk and its mobility is very low. Based on material mobility alone, one would expect significant differences in the mechanics of flow between the sand models and reality particularly as the sublevel scale is increased. Hence, the marker test results have very high significance. Sublevel cave layout rules based upon marker test input Based upon the results of the four marker tests, it appears that the Wf can be expressed as a constant times the width of the Wd. As a first approximation, Wf = (1.4 – 1.7) Wd (1) Some preliminary design rules for initial planning are summarised below:
• Sublevel drift size (width (Wd) and height (Hd): determined based on equipment. • Sublevel interval (HS): the theoretical maximum value is based on the ability to drill
long, straight holes. This, in turn, is based on the hole diameter (D). The actual limit is based on recovery and dilution considerations which are due to managing ore/waste pulsation.
• Hole diameter (D): based on the available drilling equipment and the ability to charge long holes.
• Spacing of the sublevel drifts (Sd): Sd = (2.4 – 2.7) Wd (2) • Ring spacing (burden (B)): based upon the damage radius (Rd) concept discussed by
Hustrulid and Johnson (2008): B = 2 Rd (3) Where
rockANFOe
Expehd P
PrR
ρ65.220/ = (4)
Rd = damage radius (m) rh = hole radius (m) Pe Exp = explosion pressure for the explosive Pe ANFO = explosion pressure for ANFO = 1600 MPa ρrock = rock density (g/cm3)
“The results of the marker studies would suggest that modifications in some of the current, very large scale sublevel caving designs should be considered.”
6 Australian Centre for Geomechanics • December 2009 Newsletter
Second International Symposium on Block and
Sublevel Caving20–22 April 2010,
Novotel Langley Hotel, Perth, Australia
The growing popularity of caving methods around the world is largely due to the very low production cost and the intrinsic safety associated with this mining approach. More than 50 technical papers are expected to be presented at this three day event.
www.caving2010.com
2010CAVING
5th
International Seminar on Deep and High Stress Mining
20106–8 October | Santiago - CHILE
Pontificia Universidad Católica de Chile, in collaboration with the Australian Centre for Geomechanics, the University of Toronto, and the University of Witwatersrand, is organising an International Seminar on Deep and High Stress Mining.As the mining industry faces new challenges to extract mineral resources at increasing depths, the Deep Mining International Seminar series provides a forum for the industry, academics and researchers to share information, experience and ideas on deep and high stress mining.For more details contact [email protected] or visit http://web.ing.puc.cl/~deepmining2010/
Collaborating Organisations
William Hustrulid University of Utah; and the Colorado School of Mines, USA
Future studiesIn closing, the authors believe that
it is time to seriously revisit the recommendation made by Janelid (1961) nearly 50 years ago with regard to small-scale sublevel caving,“The results achieved have been so encouraging that continued research work is well justified since the economic benefits which can be achieved through the development of the correct method are extraordinarily large.”
In spite of their obvious value, field studies are few and far between in the mining business. In addition, if conducted, it is very difficult for others to access the results and perhaps gain and offer new insights. This must change if the mining business is to meet the technical, economic and safety challenges the future has to offer.
There is a real danger that today’s sublevel caving designs are far from optimum due to a poor understanding of the fundamental processes involved. In the past, the application of sublevel caving has primarily been to iron ore, particularly magnetite, which because of its very forgiving magnetic property, permits easy and inexpensive separation from the waste. The same is not true with other minerals, for example copper porphyry and gold ores. For these, it is very expensive to separate ore and waste. It would appear that prior to fully committing to any sublevel caving design, a pilot project should be run with a carefully planned and executed program of data collection. One very important piece of information to be extracted is the draw width. It is also very important to develop the required draw control techniques to be applied in the mine. Ore/waste pulsation, which is inherent in very high draw designs, makes practical draw control very difficult. Visual viewing of the cave front is not enough.
AcknowledgementThis edited article is from the paper
entitled, “Sublevel caving - past and present” featured in the proceedings of the 5th International Conference and Exhibition on Mass Mining, Lulea, Sweden, 9–11 June 2008.
Figure 11 New possibilities for large-scale sublevel caving
7Australian Centre for Geomechanics • December 2009 Newsletter
Introduction
Risk, risk assessment and risk analysis have a number of meanings across a range of disciplines. At the most fundamental, risk is simply a combination of uncertainty in an outcome and consequences for that outcome. Risk analysis or risk assessment is the process of identifying, quantifying, and communicating those uncertainties and outcomes. In geological engineering, risk has traditionally been tied to the calculation of a factor of safety of a slope, or potential failure geometry, and has historically been a qualitative assessment of a calculated value. Advances in the computational power of stability analysis software programs have set the stage for more quantitative assessments. Depending on the scale of the slope under evaluation, and given the variation inherent in earth materials in general, almost every input can be considered to vary over a range of potential values. As such, risk assessment in geological engineering often considers both aleatory uncertainty - the variability inherent to natural materials, and epistemic uncertainty - the variability related to the ability to model a phenomenon. It is uncommon, however, that risk assessment considers a temporal element, i.e. how the inputs, and therefore the associated risk, change with time. To an extent this is to be expected as many inputs do not significantly change over the course of a project life. However, elements such as pore pressure, the surface topography of an excavation, the weight distribution on a potential failure plane, the probability of a seismic event and the properties of low strength materials can all change to a magnitude that materially affects the outcome of a risk analysis. No attempt has been made in this assessment to look at equipment or personnel temporal exposure.
To evaluate the effect of the aleatory, epistemic and temporal variation, research was conducted at the Rio Tinto Minerals – Boron Operations open pit mine near Boron, California. The purpose of this
The changing profile of risk associated with in-pit placement of waste
orebody that was deposited as an evaporate
by Raymond Yost, Rio Tinto Minerals – Boron Operations, USA
article is to discuss the background to that work, the nature of the risk analysis and assessment, and to present preliminary results.
Background and site characterisation
The Boron open pit mine is located near the town of Boron, California in the Mojave Desert Geologic Province. The mining operation extracts borates from a lenticular orebody that was deposited as an evaporite and is encased in layers of low permeability claystone. The clay and borate sequence is bounded on the bottom by a layer of basalt, which is in turn underlain by feldspar-rich sandstone (arkose) with interbeds of clayey sand (the Tropico Formation). Poorly to moderately consolidated and cemented arkose covers the borate and clay sequence. An intrusive body, composed primarily of quartz monzonite, bounds the deposit to the south.
The sequence of Tropico-basalt-evaporites-sediments has been tilted and dips moderately; 5 to 15° to the south. Faulting has offset the orebody into three primary components and a number of sub-blocks.
The open pit operation was initiated in the late 1950s in the northwestern portion of the deposit where the borate layer was generally closest to the surface. Over the past 60 years, the pit has expanded to the south and east and has deepened as the higher elevation ores have been mined out. Slope failures that have occurred during open pit mining operations typically form due to a combination of pore pressure, high-angle faults (which act as a back plane) and low-strength beds of clayey sand or claystone. All of the open pit slopes are designed in recognition of these variables. The design of the north wall, however, is also governed by the orientation of the orebody. As offset on most faults is relatively minimal, the overall slope of the wall generally follows the overall orientation of the orebody.
The overall slope angle of the wall, in conjunction with the strength of the
foundation material (basalt), generally results in factors of safety well in excess of industry required limits. Furthermore, the mineralised zone at the site is confined to a single geologic unit. Extraction of the borate layer represents complete extraction of the resource, so dumping over mined out areas does not present any risk of covering potentially economic mineralised zones. The north slope of the pit was therefore an attractive option for overburden disposal given that it was stable, composed of a higher strength unit, and close to active mining operations. A risk assessment was conducted prior to the large-scale placement of overburden on the slope.
Structure of the risk assessment and input variables
Mining in the most general sense, balances two basic elements – benefits realised against the potential for loss. In this case, they have been incorporated into the risk assessment. Benefits are realised if the ground and overburden dump remain stable throughout the project life and costs are incurred if they do not. Evaluating risk in this case is therefore a matter of determining the potential for slope instability along with the values of the benefits and costs. Stability is a function of the geology, the potential for a seismic event, the pore pressure, the size of the dumped volume and the slope configuration. While some of these variables remain constant over the project life, most of them change to a large enough degree that they affect the probability of a slope failure. A thorough risk assessment therefore requires an evaluation of conditions through the full time line of the project.
The risk assessment was structured to evaluate the potential for slope failure. The risk through time was quantified via a series of steps to establish a probability of failure, determine the magnitude of potential negative outcomes and model the expected values. Specific tasks included:
Open pit

8 Australian Centre for Geomechanics • December 2009 Newsletter
1) Estimating the probability of an outcome (a slope failure) through the use of limit equilibrium analysis and statistical sampling of analysis inputs.
2) Estimating the likely extent of negative results (failure clean-up) through the use of numerical and empirical methods to develop a model of post-failure topography.
3) Estimating the likely extent of positive results (savings associated with dumping near the area of extraction as opposed to ex-pit dumps) through an evaluation of equivalent tonne miles (ETM).
4) Using the probability of an outcome and the estimated costs and benefits to establish expected costs and benefits with time.
5) Adjusting the timing of benefits and costs (benefits are expected to be realised early while costs are expected to be realised later) with a discount rate.
6) Estimating a net expected sum of benefits at distinct points.
Once these values were estimated, the risk was determined as the net sum of expected benefits and costs. A value greater than zero implied that the outcome had a positive expected economic value, while a net sum of less than or equal to one implies that the outcome had a negative expected economic value and a negative risk. The evaluation was repeated at appropriate time increments for a range of in-pit dump volumes to determine if, and how much, waste could be economically placed in the pit.
Results
To illustrate the interplay of the various inputs to the risk assessment, the start and end points of one of the analyses are presented in Figure 1, from the limit equilibrium analysis through empirical modelling, to the final economic assessment for a 30 million t in-pit waste dump.
“Risk in the most general sense, balances two basic elements – benefits realised against the potential for loss.”
Figure 1 Pit topography at year 2010
Probability of failure – 5.0% (with seismic load).• Probability of failure – 0.55% (without seismic load).• Failure volume (in section) 28,350 m• 3 (with seismic load).Failure volume (in section) 28,700 m• 3 (without seismic load).Probability of seismic event – 5.0%.•
At this beginning stage, ore (blue and green units) is close to the toe of potential failure and subject to burial should failure occur. Failure volume is relatively high, but the probability of failure is relatively low. The probability of a seismic event occurring is relatively low.
Figure 2 Pit topography for ultimate pit
Probability of failure – 81.20% (with seismic load).• Probability of failure – 41.60% (without seismic load).• Failure volume (in section) 39,500 m• 3 (with seismic load).Failure volume (in section) 39,250 m• 3 (without seismic load).Probability of seismic event – 70.0%.•
At this final stage, failure volume increased by approximately 40%, but the probability of failure increased, on average, to approximately 60%. The potential for a seismic event has increased as well, but the ore zone is farther away from the toe of slope and is less likely to be covered by a slope failure.
Modelling post-failure runout
A combination of numerical modelling and empirical evaluation was used to develop potential post-failure topography. Post-failure profiles were developed for all sections with a probability of failure greater than 0.01% regardless of the factor of safety. The configuration of the runout was based on an assessment of historical slope failures at the site. At Boron this was the angle of repose of the failed material relative to the dip angle of the underlying failure plane, and adjusted for the geometry of the runout area.
Figure 3 Topography for failure at 2010 for 30 million tonne dump
The ratio of the clean-up area to the post-failure area is 18.5%. The runout was contained to some extent by the concave geometry of runout area resulting in a low overall angle of repose.
9Australian Centre for Geomechanics • December 2009 Newsletter
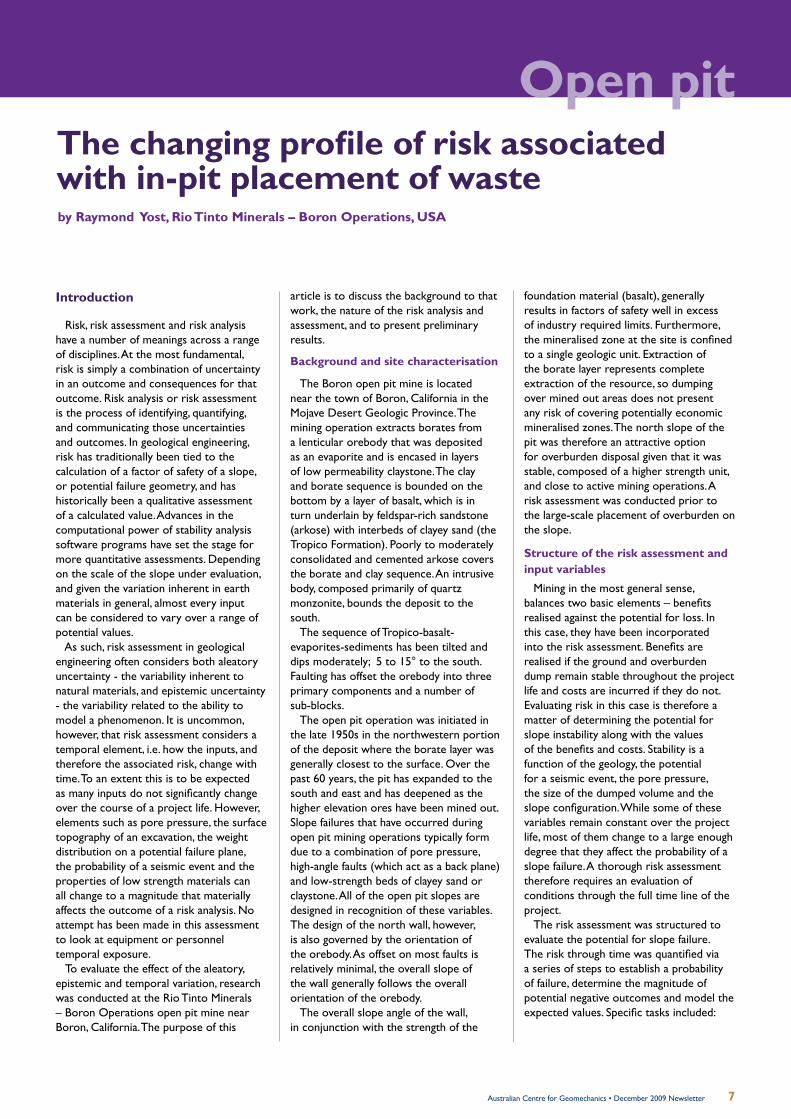
Figure 4 Topography for failure at ultimate pit for 30 million tonne dump
The ratio of the clean-up area to the post-failure area is 22.5%. The removal of material below the toe of failure has allowed considerable runout. The overall angle of repose has increased.
Benefits and costs
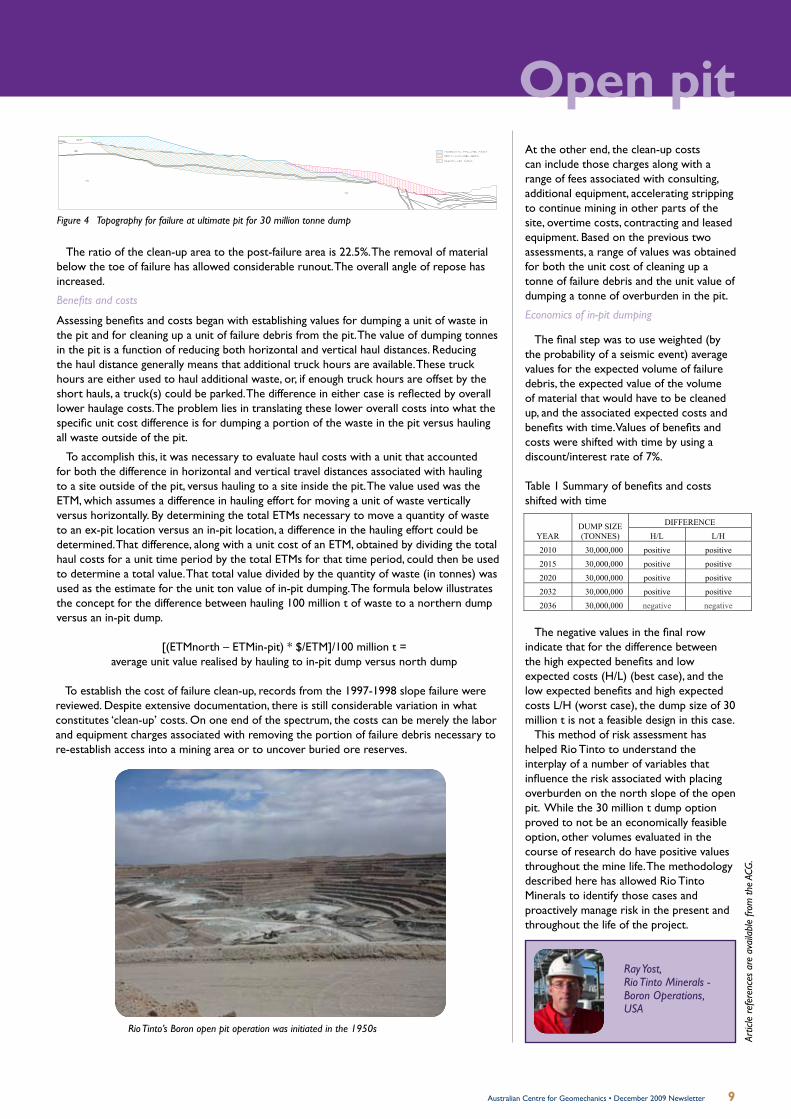
Assessing benefits and costs began with establishing values for dumping a unit of waste in the pit and for cleaning up a unit of failure debris from the pit. The value of dumping tonnes in the pit is a function of reducing both horizontal and vertical haul distances. Reducing the haul distance generally means that additional truck hours are available. These truck hours are either used to haul additional waste, or, if enough truck hours are offset by the short hauls, a truck(s) could be parked. The difference in either case is reflected by overall lower haulage costs. The problem lies in translating these lower overall costs into what the specific unit cost difference is for dumping a portion of the waste in the pit versus hauling all waste outside of the pit.
To accomplish this, it was necessary to evaluate haul costs with a unit that accounted for both the difference in horizontal and vertical travel distances associated with hauling to a site outside of the pit, versus hauling to a site inside the pit. The value used was the ETM, which assumes a difference in hauling effort for moving a unit of waste vertically versus horizontally. By determining the total ETMs necessary to move a quantity of waste to an ex-pit location versus an in-pit location, a difference in the hauling effort could be determined. That difference, along with a unit cost of an ETM, obtained by dividing the total haul costs for a unit time period by the total ETMs for that time period, could then be used to determine a total value. That total value divided by the quantity of waste (in tonnes) was used as the estimate for the unit ton value of in-pit dumping. The formula below illustrates the concept for the difference between hauling 100 million t of waste to a northern dump versus an in-pit dump.
[(ETMnorth – ETMin-pit) * $/ETM]/100 million t =average unit value realised by hauling to in-pit dump versus north dump
To establish the cost of failure clean-up, records from the 1997-1998 slope failure were reviewed. Despite extensive documentation, there is still considerable variation in what constitutes ‘clean-up’ costs. On one end of the spectrum, the costs can be merely the labor and equipment charges associated with removing the portion of failure debris necessary to re-establish access into a mining area or to uncover buried ore reserves.
At the other end, the clean-up costs can include those charges along with a range of fees associated with consulting, additional equipment, accelerating stripping to continue mining in other parts of the site, overtime costs, contracting and leased equipment. Based on the previous two assessments, a range of values was obtained for both the unit cost of cleaning up a tonne of failure debris and the unit value of dumping a tonne of overburden in the pit.
Economics of in-pit dumping
The final step was to use weighted (by the probability of a seismic event) average values for the expected volume of failure debris, the expected value of the volume of material that would have to be cleaned up, and the associated expected costs and benefits with time. Values of benefits and costs were shifted with time by using a discount/interest rate of 7%.
Table 1 Summary of benefits and costs shifted with time
The negative values in the final row indicate that for the difference between the high expected benefits and low expected costs (H/L) (best case), and the low expected benefits and high expected costs L/H (worst case), the dump size of 30 million t is not a feasible design in this case.
This method of risk assessment has helped Rio Tinto to understand the interplay of a number of variables that influence the risk associated with placing overburden on the north slope of the open pit. While the 30 million t dump option proved to not be an economically feasible option, other volumes evaluated in the course of research do have positive values throughout the mine life. The methodology described here has allowed Rio Tinto Minerals to identify those cases and proactively manage risk in the present and throughout the life of the project.
Ray Yost,Rio Tinto Minerals -Boron Operations, USA
Artic
le re
fere
nces
are
ava
ilabl
e fro
m th
e AC
G.
Rio Tinto’s Boron open pit operation was initiated in the 1950s
Open pithorizontally. By determining the total ETMs necessary to move a quantity of waste to an ex-pit location versus an in-pit location, a difference in the hauling effort could be determined. That difference, along with a unit cost of an ETM, obtained by dividing the total haul costs for a unit time period by the total ETMs for that time period, could then be used to determine a total value. That total value divided by the quantity of waste (in tonnes) was used as the estimate for the unit ton value of in-pit dumping. The formula below illustrates the concept for the difference between hauling 100 million t of waste to a northern dump versus an in-pit dump.
[(ETMnorth – ETMin-pit) * $/ETM]/100 million t = average unit value realised by hauling to in-pit dump versus north dump
To establish the cost of failure clean-up, records from the 1997-1998 slope failure were reviewed. Despite extensive documentation, there is still considerable variation in what constitutes ‘clean-up’ costs. On one end of the spectrum, the costs can be merely the labor and equipment charges associated with removing the portion of failure debris necessary to re-establish access into a mining area or to uncover buried ore reserves. At the other end, the clean-up costs can include those charges along with a range of fees associated with consulting, additional equipment, accelerating stripping to continue mining in other parts of the site, overtime costs, contracting and leased equipment. Based on the previous two assessments, a range of values was obtained for both the unit cost of cleaning up a tonne of failure debris and the unit value of dumping a tonne of overburden in the pit. Economics of In-Pit Dumping The final step was to use weighted (by the probability of a seismic event) average values for the expected volume of failure debris, the expected value of the volume of material that would have to be cleaned up, and the associated expected costs and benefits with time. Values of benefits and costs were shifted with time by using a discount/interest rate of 7%. Table 1 Summary of benefits and costs shifted with time
YEAR DUMP SIZE (TONNES)
DIFFERENCE
H/L L/H
2010 30,000,000 positive positive
2015 30,000,000 positive positive
2020 30,000,000 positive positive
2032 30,000,000 positive positive
2036 30,000,000 negative negative
The negative values in the final row indicate that for the difference between the high expected benefits and low expected costs (H/L) (best case), and the low expected benefits and high expected costs L/H (worst case), the dump size of 30 million t is not a feasible design in this case.

10 Australian Centre for Geomechanics • December 2009 Newsletter
Many of the uncertainties surrounding the development of a large open pit mine have now been overcome with the publication of the 496-page “Guidelines For Open Pit Slope Design”.
The publication is the result of four years of effort and support from a group of 12 mining companies representing the majority of the world’s production of diamonds and base metals.
Open pit mining is an efficient way to mine many deposits. But there are complications. Make the slope of the pit too shallow and you have to move millions of additional tonnes of valueless overburden. But if it’s too steep, you risk failure with subsequent risk to people and property.
Up until now, the only handbook of this type available to open pit mine slope design practitioners, including engineering geologists, geotechnical engineers, mining engineers, civil engineers and mine managers has been the “CANMET manual” last published in 1977.
The new Guidelines For Open Pit Slope Design was officially released at the Slope Stability conference in Santiago, Chile, 9 November. It is a direct outcome of the “Large Open Pit” research project and comprises 14 chapters that follow the life of mine sequence from project development to closure.
CSIRO Earth Science and Resource Engineering’s Dr John Read is one of two editors and has also authored a number of chapters in the book.
Dr Read has over 40 years experience as a practitioner and consultant in the mining industry, with special interests and expertise in rock slope stability and open pit mine design and investigation tasks in Australia, Fiji, Papua New Guinea, Brazil, Argentina, Chile, Canada, South Africa and Zambia.
He says that each chapter is written by an industry practitioner with specific experience in the topic being described.
“The purpose of the book is to be a new generation guideline that links
innovative mining geomechanics research with best practice” he said. “The book outlines for today’s practitioners what works best in different situations and why, what doesn’t work and why not, and what is the best approach to satisfy best practice in a range of situations.”
Guidelines For Open Pit Slope Design is available from CSIRO publishing for AU$195. www.publish.csiro.au/
CSIRO helps redefine large open pit design
Seventh Large Open Pit Mining Conference 2010
27–28 July 2010, Perth, Western AustraliaHigh demand for commodities, record fuel prices and a scarcity of skilled personnel have been replaced and surpassed by the recent global financial crisis as the primary issues facing the mining industry. As demand for commodities improves the incentive to continue to drive operational and safety improvements will become paramount. The Seventh Large Open Pit Mining Conference 2010 (LOP 2010) will provide the opportunity to chart that progress in large open pit mines around the world
The conference will provide the forum for operations with major achievements, along with those operators implementing changes, the chance to outline their innovations and to share and explore experiences with others. Consistent with the aims of The AusIMM, the Conference will allow members and the industry to keep abreast of technical developments and provide a forum to share views and opinions within the large open pit sector.
For more information, please contact: Katy Andrews, The AusIMMPhone: +61 3 9658 6125 Fax: +61 3 9662 [email protected]
PUBLISHING
ACG Open Pit Rock Mass Modelling Seminar29–30 July 2010, Burswood
Convention Centre, PerthThis seminar will maximise the
dissemination of geotechnical rock mass modelling and synthetic rock modelling
technologies to industry.
The trend of open pit operations mining to steeper and deeper levels has seen an increase in the stress environment and greater uncertainty about the mechanical behaviour of slopes, elevating mine worker safety and productivity risks. To better identify, understand and manage these potential geotechnical risks (including seismic hazard) associated with slope stability failure, the ACG will host this two day seminar immediately following The AusIMM’s Seventh Large Open Pit Mining Conference 2010.
Please visit, www.acg.uwa.edu.au/events_courses
11Australian Centre for Geomechanics • December 2009 Newsletter
Introduction
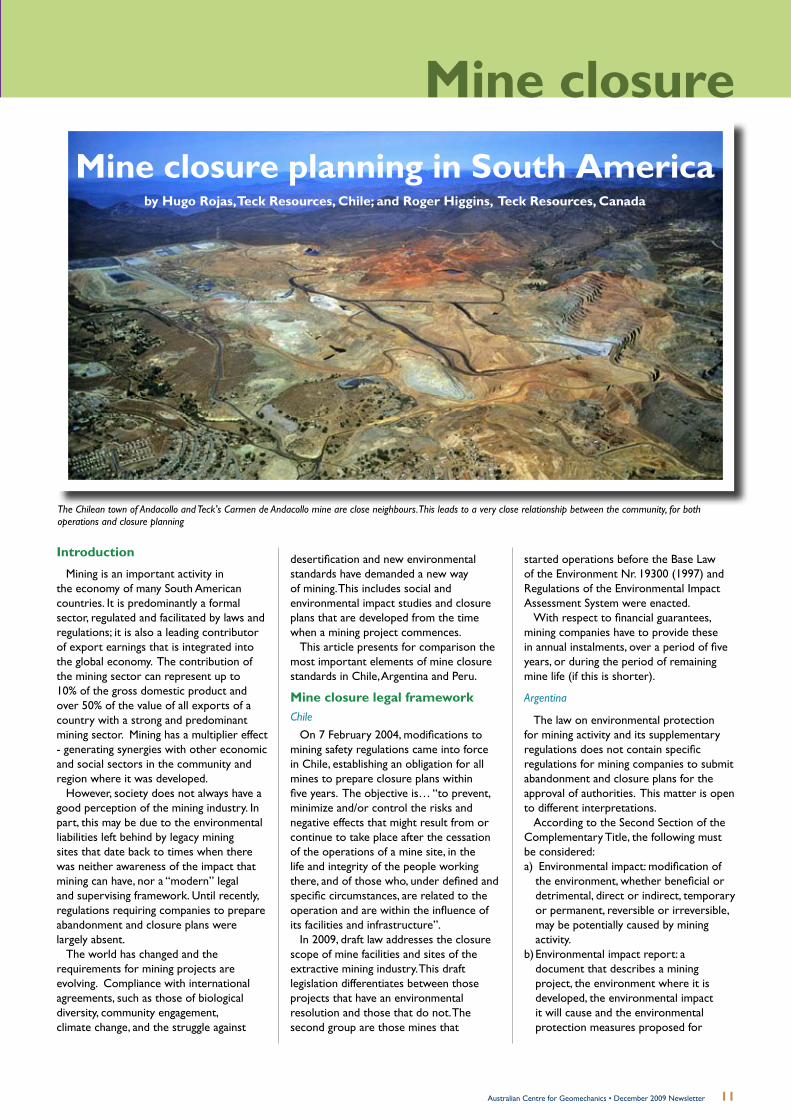
Mining is an important activity in the economy of many South American countries. It is predominantly a formal sector, regulated and facilitated by laws and regulations; it is also a leading contributor of export earnings that is integrated into the global economy. The contribution of the mining sector can represent up to 10% of the gross domestic product and over 50% of the value of all exports of a country with a strong and predominant mining sector. Mining has a multiplier effect - generating synergies with other economic and social sectors in the community and region where it was developed.
However, society does not always have a good perception of the mining industry. In part, this may be due to the environmental liabilities left behind by legacy mining sites that date back to times when there was neither awareness of the impact that mining can have, nor a “modern” legal and supervising framework. Until recently, regulations requiring companies to prepare abandonment and closure plans were largely absent.
The world has changed and the requirements for mining projects are evolving. Compliance with international agreements, such as those of biological diversity, community engagement, climate change, and the struggle against
desertification and new environmental standards have demanded a new way of mining. This includes social and environmental impact studies and closure plans that are developed from the time when a mining project commences.
This article presents for comparison the most important elements of mine closure standards in Chile, Argentina and Peru.
Mine closure legal frameworkChile
On 7 February 2004, modifications to mining safety regulations came into force in Chile, establishing an obligation for all mines to prepare closure plans within five years. The objective is… “to prevent, minimize and/or control the risks and negative effects that might result from or continue to take place after the cessation of the operations of a mine site, in the life and integrity of the people working there, and of those who, under defined and specific circumstances, are related to the operation and are within the influence of its facilities and infrastructure”.
In 2009, draft law addresses the closure scope of mine facilities and sites of the extractive mining industry. This draft legislation differentiates between those projects that have an environmental resolution and those that do not. The second group are those mines that
Mine closure planning in South Americaby Hugo Rojas, Teck Resources, Chile; and Roger Higgins, Teck Resources, Canada
started operations before the Base Law of the Environment Nr. 19300 (1997) and Regulations of the Environmental Impact Assessment System were enacted.
With respect to financial guarantees, mining companies have to provide these in annual instalments, over a period of five years, or during the period of remaining mine life (if this is shorter).
Argentina
The law on environmental protection for mining activity and its supplementary regulations does not contain specific regulations for mining companies to submit abandonment and closure plans for the approval of authorities. This matter is open to different interpretations.
According to the Second Section of the Complementary Title, the following must be considered:a) Environmental impact: modification of
the environment, whether beneficial or detrimental, direct or indirect, temporary or permanent, reversible or irreversible, may be potentially caused by mining activity.
b) Environmental impact report: a document that describes a mining project, the environment where it is developed, the environmental impact it will cause and the environmental protection measures proposed for
The Chilean town of Andacollo and Teck's Carmen de Andacollo mine are close neighbours. This leads to a very close relationship between the community, for both operations and closure planning
Mine closure

12 Australian Centre for Geomechanics • December 2009 Newsletter
These proceedings are a hard-bound, black and white publication featuring 53 papers, comprising 622 pages.
www.acg.uwa.edu.au/shop
adoption. The EIR must address “measures and actions for prevention and mitigation of environmental impact, and rehabilitation, restoration or recomposition of the altered environment”.
c) Environmental impact declaration: an administrative act based on the mining environmental standards in force, approving an EIR, passed by the application authority, and in which are set the specific conditions that the holder company must comply with during all stages of the mining project.
An aspect that is not regulated in Argentina is community involvement in the approval process of an EIR.
Peru
Peru applies regulations for mine closure to every mining activity, with the purpose of preventing, minimising and controlling its potential risks and effects to human health, safety, the environment, the surrounding ecosystem and property. The regulations were passed in 2005, and the articles clearly specify when and what details must be presented to the Director General of Mining Environmental Affairs of the Ministry of Energy and Mines.
The mine closure plan complements the study of environmental impact and the programme of environmental management corresponding to a site’s operations. The filing of the mine closure plan is an obligation for every owner of mining activity that is in operation, beginning mining operations or resuming mining operations — after having been suspended or stopped by the validity of the law, or where there is no an approved mine closure plan.
The approval of a mine closure plan leads to the constitution of guarantees through which assurance is given that the owner of a mining activity can comply with the obligations stated in the mine closure plan. In the event of a breach, the Ministry of Energy and Mines can execute the closure tasks.
An important aspect of the regulations is the provision that allows citizen involvement. Every stakeholder can present their observations and make contributions. Once the closure plan is approved, it is to be executed in a progressive manner during the life of the mining operation. At operation end, the remainder of the areas, works and facilities that, due to operational reasons had not been closed during the production stage must be closed. The regulations also establish mechanisms
and periods for review, updating and accountability.
Observations
• The legal norms of closure plans in South America differ in their scope, depth and citizen involvement. This leads to different requirements for mining operations of similar characteristics.
• The review and update of closure plans is a matter of interest for governments, as well as for organised communities and mining companies.
• Even where there is a deficiency in the law regarding mine site closure, there are companies that progressively design and apply high quality closure plans.
• The design of closure plans in engineering stages prior to the construction of projects and their application from the beginning of the operations, represent an advantage for companies and should be seen as an opportunity to prevent, minimise and control risks and negative effects that might occur after the end of the operations.
• The globalisation of markets, the requirement to comply with international norms and standards, the exchange and development of technical knowledge, together with open communication channels worldwide, will result in the further evolution of mine closure regulations, both legal and self-imposed. This will improve mining processes and practices, environmental stewardship and the efficient use of resources.
• The voices and actions of communities that feel affected by mining will continue to grow, and constructive relationships with communities will be vital.
• A good closure plan will contribute to obtaining and maintaining the social licence to operate.
Hugo Rojas, Teck Resources, Chile
Roger Higgins, Teck Resources, Canada
23-26 November 2010 Casa Piedra Events Centre
Santiago, Chile
RESPONSIBLE CLOSURE: LIVING UP TO COMMUNITIES’ AND
STAKEHOLDERS’ EXPECTATIONS
CONFERENCE THEMES
• Designing and planning for closure• Progressive closure planning• Closure costs and financing• Proactive stakeholder engagement• Long term water management• Mine site reclamation and rehabilitation• Control and monitoring• Soil ecology• Mine cluster, redeployment,
redevelopment and decommissioning• Mine legacies and relinquishment• Legal and regulatory issues• Mining heritage and tourism• Recent closure case studies
Send your abstracts by 25 January 2010 to:
For further information, please visit:
www.mineclosure2010.com
5th International Conference on Mine Closure

13Australian Centre for Geomechanics • December 2009 Newsletter
Summer vacation students in winterby Peter Hills, Tasmania Mine Joint Venture, BCD Resources (Operations) NL
A phone call from Professor Marty Hudyma in February 2009 was my introduction to the idea of offering summer vacation experience to students during the winter. The concept had real merit. We had engaged summer students at Beaconsfield before with somewhat mixed results. This is not usually a measure of the desire of the student to “have a go”, but rather it is the coincidence of the engagement with permanent staff wanting to take annual leave. Inevitably, the students are slotted in to fill the roles of absent staff, while receiving insufficient guidance and mentoring from remaining staff who are left to carry the burden. Furthermore, summer vacation students often simply want a job to earn some money and gain some experience. Marty, however, was keen to see a student undertake a project and complete real work. The project was to be titled Retrospective Analysis of Mining Induced Seismicity at Beaconsfield Gold Mine. It seemed ideal. A summer vacation student with a defined project, arriving in the winter when minimal leave was planned by site personnel would avoid all the usual pitfalls of a summer placement, and so it was agreed that a placement could be made.
The Beaconsfield Gold Mine has experienced seismicity since 2003. Increasing incidents of seismic events saw the installation of a temporary seismic array logging six uniaxial channels in early 2004, and this was replaced by a permanent array logging 12 channels (nine uniaxial and one triaxial) in mid 2005. The system was upgraded in 2007 and again in 2009, and currently logs 24 channels (12 uniaxial and four triaxial).
In late 2005, the Beaconsfield Gold Mine signed on to be a minor sponsor of the ACG’s Mine Seismicity and Rockburst Risk Management project. Sponsorship commenced from January 2006 and has continued since then. At the time of the original sponsorship, the Beaconsfield Gold Mine had been experiencing significant mining-induced seismicity for a period of two years. Much effort had been expended on developing an understanding of the seismicity and procedures to deal with it were being implemented through the development of a Ground Control
Management Plan. The ACG software MS-RAP offered the opportunity to enhance the management of seismicity in the day-to-day operation of the mine.
Following an accident at the mine in early 2006, all aspects of the mining operation were redesigned under the umbrella of a Case to Manage Underground Safety (or Case for Safety). The Case for Safety was developed in four tranches by Coffey Mining, and covered mining of capital and operating access development (Pfitzner, 2006), sill driving (Sidea, Scott and Reeves, 2007), stoping in the generally aseismic east zone of the mine (King, Thomas and Scott, 2007), and stoping in the seismically active west zone where the most significant changes were required (Scott and Reeves, 2007). A key requirement of the Case for Safety was the establishment of protocols to manage seismicity, and MS-RAP was a key tool in that endeavour.
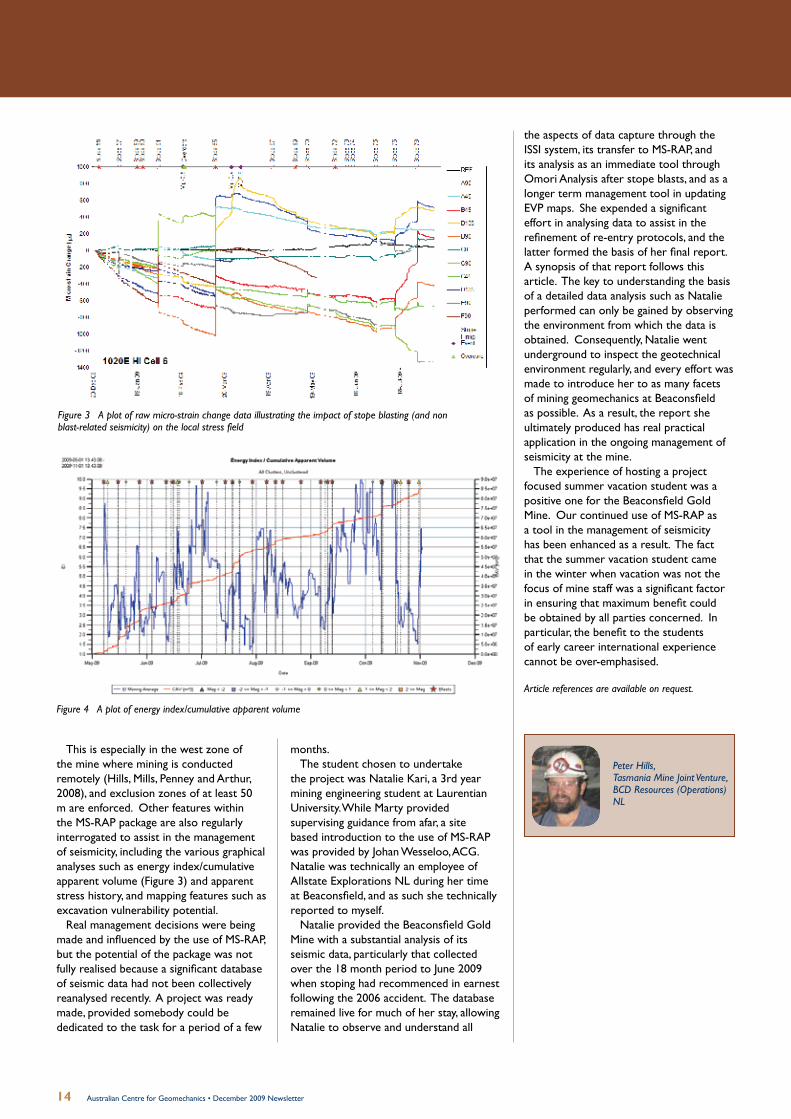
Hills and Penney (2008) describe the management of seismicity at the Beaconsfield Gold Mine in some detail. Of particular utility within MS-RAP is the ability to implement Omori Analysis (Figure 1) to monitor and manage re-entry times into areas excluded after stope blasts. Seismic analysis is coupled with intensive monitoring (Figure 2) (Penny, Hills and Walton, 2008), including stress change using H1 cells, and the impact of that change on the rock mass and the installed support using SMART instruments. Stope blasting is a key trigger for stress change (Figure 3), and as a consequence it is the primary trigger for seismic activity.
The student chosen to undertake the project was Natalie Kari, a 3rd year mining engineering student at Laurentian University. While Marty provided supervising guidance from afar, a site based introduction to the use of MS-RAP was provided by Johan Wesseloo, ACG. Natalie was technically an employee of Allstate Explorations NL during her time at Beaconsfield, and as such she technically reported to myself.
Natalie provided the Beaconsfield Gold Mine with a substantial analysis of its seismic data, particularly that collected over the 18 month period to June 2009 when stoping had recommenced in earnest following the 2006 accident. The database remained live for much of her stay, allowing Natalie to observe and understand all the aspects of data capture through the ISSI system, its transfer to MS-RAP, and its analysis as an immediate tool through Omori Analysis after stope blasts, and as a longer term management tool in updating EVP maps. She expended a significant effort in analysing data to assist in the refinement of re-entry protocols, and the latter formed the basis of her final report. A synopsis of that report follows this article. The key to understanding the basis of a detailed data analysis such as Natalie performed can only be gained by observing the environment from which the data is obtain. Consequently, she went underground to inspect the geotechnical environment regularly, and every effort was made to introduce her to as many facets of mining geomechanics at Beaconsfield as possible. As a result, the report she ultimately produced has real practical application in the ongoing management of seismicity at the mine.
The experience of hosting a project focused summer vacation student was a positive one for the Beaconsfield Gold Mine. Our continued use of MS-RAP as a tool in the management of seismicity has been enhanced as a result. The fact that the summer vacation student came in the winter when vacation was not the focus of mine staff was a significant factor in ensuring that maximum benefit could be obtained by all parties concerned. In particular, the benefit to the students of early career international experience cannot be over-emphasised.
Article references are available on request
Figure 1. Omori Analysis following a stope blast Figure 1 Omori analysis following a stope blast
Underground
Figure 2 Intensive monitoring at Beaconsfield showing the SMART cables (grey) and stress monitoring (HI cells) (yellow)
14 Australian Centre for Geomechanics • December 2009 Newsletter
This is especially in the west zone of the mine where mining is conducted remotely (Hills, Mills, Penney and Arthur, 2008), and exclusion zones of at least 50 m are enforced. Other features within the MS-RAP package are also regularly interrogated to assist in the management of seismicity, including the various graphical analyses such as energy index/cumulative apparent volume (Figure 3) and apparent stress history, and mapping features such as excavation vulnerability potential.
Real management decisions were being made and influenced by the use of MS-RAP, but the potential of the package was not fully realised because a significant database of seismic data had not been collectively reanalysed recently. A project was ready made, provided somebody could be dedicated to the task for a period of a few
months.The student chosen to undertake
the project was Natalie Kari, a 3rd year mining engineering student at Laurentian University. While Marty provided supervising guidance from afar, a site based introduction to the use of MS-RAP was provided by Johan Wesseloo, ACG. Natalie was technically an employee of Allstate Explorations NL during her time at Beaconsfield, and as such she technically reported to myself.
Natalie provided the Beaconsfield Gold Mine with a substantial analysis of its seismic data, particularly that collected over the 18 month period to June 2009 when stoping had recommenced in earnest following the 2006 accident. The database remained live for much of her stay, allowing Natalie to observe and understand all
Figure 2. A plot of raw micro-strain change data illustrating the impact of stope blasting (and non blast-related seismicity) on the local stress field
Figure 3. A plot of energy index/cumulative apparent volume Figure 4 A plot of energy index/cumulative apparent volume
the aspects of data capture through the ISSI system, its transfer to MS-RAP, and its analysis as an immediate tool through Omori Analysis after stope blasts, and as a longer term management tool in updating EVP maps. She expended a significant effort in analysing data to assist in the refinement of re-entry protocols, and the latter formed the basis of her final report. A synopsis of that report follows this article. The key to understanding the basis of a detailed data analysis such as Natalie performed can only be gained by observing the environment from which the data is obtained. Consequently, Natalie went underground to inspect the geotechnical environment regularly, and every effort was made to introduce her to as many facets of mining geomechanics at Beaconsfield as possible. As a result, the report she ultimately produced has real practical application in the ongoing management of seismicity at the mine.
The experience of hosting a project focused summer vacation student was a positive one for the Beaconsfield Gold Mine. Our continued use of MS-RAP as a tool in the management of seismicity has been enhanced as a result. The fact that the summer vacation student came in the winter when vacation was not the focus of mine staff was a significant factor in ensuring that maximum benefit could be obtained by all parties concerned. In particular, the benefit to the students of early career international experience cannot be over-emphasised.
Article references are available on request.
Figure 3 A plot of raw micro-strain change data illustrating the impact of stope blasting (and non blast-related seismicity) on the local stress field
Figure 2. A plot of raw micro-strain change data illustrating the impact of stope blasting (and non blast-related seismicity) on the local stress field
Figure 3. A plot of energy index/cumulative apparent volume
Peter Hills, Tasmania Mine Joint Venture, BCD Resources (Operations) NL
15Australian Centre for Geomechanics • December 2009 Newsletter
Understanding mining-induced seismicity at Beaconsfield Gold Mineby Natalie Kari, Laurentian University, Canada
Post blast re-entry times were estimated for 73 production blasts, using 90% of the total seismic energy as a re-entry criterion. The overall distribution of re-entry times is shown in Figure 1. Using this 90% of total seismic energy re-entry criterion, 59 of the production blasts had a possible re-entry time of less than 12 hours, with 14 blasts requiring a re-entry time of more than 12 hours. Figure 2 shows that re-entry times are somewhat controlled by local seismic sources and vary spatially in the mine. It was concluded that for the Beaconsfield Gold Mine, a 24 hour re-entry period is usually conservative, although at times it may be required. It is suggested that other tools, such as the seismic hazard mapping tool in MS-RAP, be used in conjunction with the re-entry analysis when making a final decision on re-entry following each blast. In addition, it is important that this analysis procedure be continued to monitor future changes in seismological patterns and their potential effect on re-entry times.
Figure 1. Distribution of re-entry times for 73 production blasts at Beaconsfield Gold Mine in 2008 and 2009. Figure 1 Distribution of re-entry times for 73 production blasts at Beasonsfield Gold Mine in 2008 and 2009
A project was undertaken at the Beaconsfield Gold Mine to investigate the current mining-induced seismicity at the operation. The objectives of the project were to identify all of the main seismic sources currently active in the mine and to rate the seismic sources with regards to:• Seismic source mechanism (the rock
mass failure mode causing the seismic events).
• Seismic hazard (the largest expected seismic event that would be expected).
• How mining activities (particularly stope blasting) affects the rate of seismicity from each of the seismic sources.
• The ability for seismic monitoring to be used as a re-entry tool for each of the seismic sources.The seismic analyses in this project were
all conducted using the ACG’s MS-RAP program (Mine Seismicity Risk Analysis Program).
The complex geology and geological structures of the Beaconsfield Gold Mine, including faults, contact zones, shears, bedding and splays, contribute to the challenges of mining within the Tasmanian reef. More than 8500 seismic events were recorded at the Beaconsfield Gold Mine between March 2008 and February 2009, including nine events larger than local magnitude +1.0. A cluster analysis identified 56 groups of seismic events during this period, of which 23 were particularly active and investigated in detail. Each group was analysed to determine the seismic source mechanism, seismic hazard and the rock mass response to production blasting in the mine. This analysis helped to describe the character of each seismic source and highlight the seismic sources most likely to cause operational issues at the mine. When higher hazard seismic sources can be identified, a range of seismic risk mitigation techniques can be used to manage the hazard. Ten of the seismic sources were found to have a qualitative seismic hazard rating of moderate-high to high. The seismic hazard rating is a good indicator of the likelihood of larger magnitude events.
The seismic source mechanism at each seismic source, for the one year time period March 2008 – February 2009, was compared to the seismic source mechanism over the last four years (June 2005 – June 2009). In almost all cases, the analysis showed that the seismic source mechanism remained constant over time. This is an important conclusion, as it means that it is the local rock mass failure mechanism that is controlling the nature of the seismicity, irrespective of the nearby mining influences. When the current seismic response to mining is similar to the past seismic response to mining, it gives greater confidence in using the current seismicity to understand future seismicity. Overall, the majority of seismic source mechanisms at the Beaconsfield Gold Mine are related to the volumetric fracturing associated with mining-induced stresses as a direct response to mine blasting.
An investigation of how mining activities, particularly stope blasting, affects the rate of seismicity from each of the main seismic sources was conducted. The proximity of each of the seismic sources to the stope blasts was considered. As expected, seismic sources in close proximity to mine blasts have a higher rate of induced seismicity than stopes located at further distances. However, two particular seismic sources did not follow this trend; often
having a disproportionately intense seismic response to distant mine blasts. Identifying seismic sources that do not follow expected trends is often an indicator of locations which have a strong geological control. These locations require particular vigilance with respect to monitoring and underground inspections.
Post blast re-entry times were estimated for 73 production blasts, using 90% of the total seismic energy as a re-entry criterion. The overall distribution of re-entry times is shown in Figure 1. Using this 90% of total seismic energy re-entry criterion, 59 of the production blasts had a possible re-entry time of less than 12 hours, with 14 blasts requiring a re-entry time of more than 12 hours. Figure 2 shows that re-entry times are somewhat controlled by local seismic sources and vary spatially in the mine. It was concluded that for the Beaconsfield Gold Mine, a 24 hour re-entry period is usually conservative, although at times it may be required. It is suggested that other tools, such as the seismic hazard mapping tool in MS-RAP, be used in conjunction with the re-entry analysis when making a final decision on re-entry following each blast. In addition, it is important that this analysis procedure be continued to monitor future changes in seismological patterns and their potential effect on re-entry times.
Underground
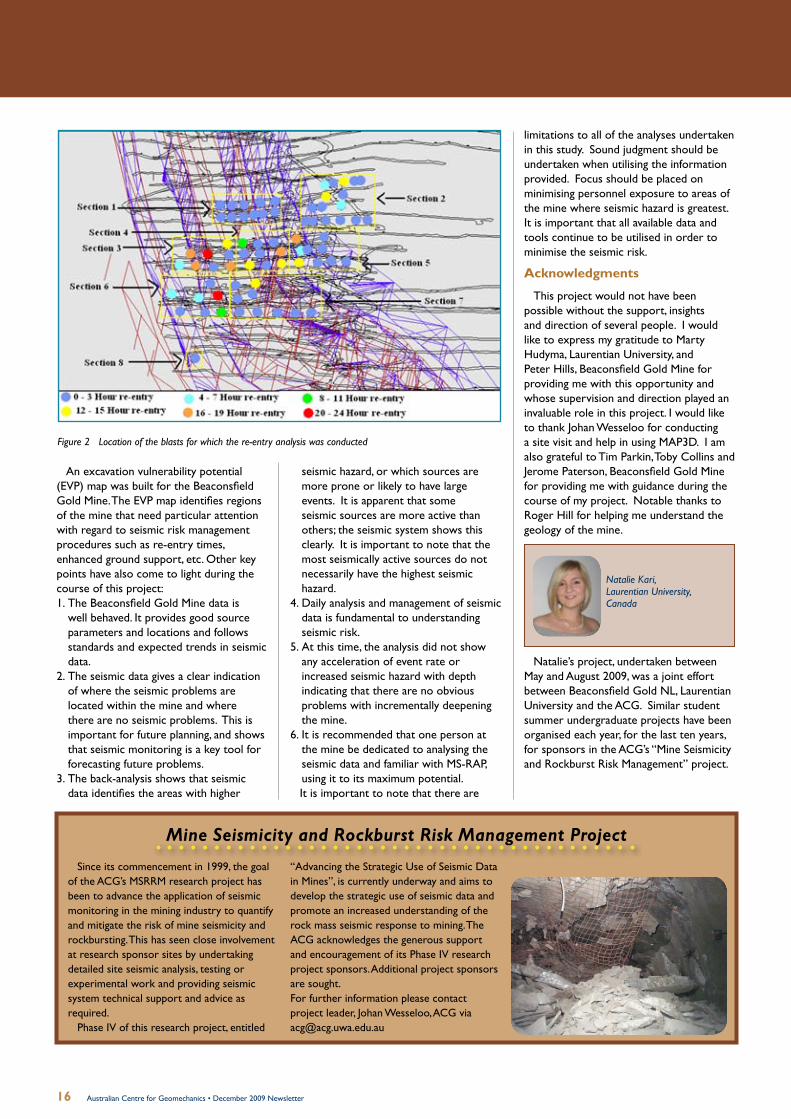
16 Australian Centre for Geomechanics • December 2009 Newsletter
An excavation vulnerability potential (EVP) map was built for the Beaconsfield Gold Mine. The EVP map identifies regions of the mine that need particular attention with regard to seismic risk management procedures such as re-entry times, enhanced ground support, etc. Other key points have also come to light during the course of this project:1. The Beaconsfield Gold Mine data is
well behaved. It provides good source parameters and locations and follows standards and expected trends in seismic data.
2. The seismic data gives a clear indication of where the seismic problems are located within the mine and where there are no seismic problems. This is important for future planning, and shows that seismic monitoring is a key tool for forecasting future problems.
3. The back-analysis shows that seismic data identifies the areas with higher
seismic hazard, or which sources are more prone or likely to have large events. It is apparent that some seismic sources are more active than others; the seismic system shows this clearly. It is important to note that the most seismically active sources do not necessarily have the highest seismic hazard.
4. Daily analysis and management of seismic data is fundamental to understanding seismic risk.
5. At this time, the analysis did not show any acceleration of event rate or increased seismic hazard with depth indicating that there are no obvious problems with incrementally deepening the mine.
6. It is recommended that one person at the mine be dedicated to analysing the seismic data and familiar with MS-RAP, using it to its maximum potential.It is important to note that there are
Figure 2 Location of the blasts for which the re-entry analysis was conducted
limitations to all of the analyses undertaken in this study. Sound judgment should be undertaken when utilising the information provided. Focus should be placed on minimising personnel exposure to areas of the mine where seismic hazard is greatest. It is important that all available data and tools continue to be utilised in order to minimise the seismic risk.
Acknowledgments
This project would not have been possible without the support, insights and direction of several people. I would like to express my gratitude to Marty Hudyma, Laurentian University, and Peter Hills, Beaconsfield Gold Mine for providing me with this opportunity and whose supervision and direction played an invaluable role in this project. I would like to thank Johan Wesseloo for conducting a site visit and help in using MAP3D. I am also grateful to Tim Parkin, Toby Collins and Jerome Paterson, Beaconsfield Gold Mine for providing me with guidance during the course of my project. Notable thanks to Roger Hill for helping me understand the geology of the mine.
Natalie’s project, undertaken between May and August 2009, was a joint effort between Beaconsfield Gold NL, Laurentian University and the ACG. Similar student summer undergraduate projects have been organised each year, for the last ten years, for sponsors in the ACG’s “Mine Seismicity and Rockburst Risk Management” project.
Mine Seismicity and Rockburst Risk Management Project
Natalie Kari,Laurentian University,Canada
Since its commencement in 1999, the goal of the ACG’s MSRRM research project has been to advance the application of seismic monitoring in the mining industry to quantify and mitigate the risk of mine seismicity and rockbursting. This has seen close involvement at research sponsor sites by undertaking detailed site seismic analysis, testing or experimental work and providing seismic system technical support and advice as required.
Phase IV of this research project, entitled
“Advancing the Strategic Use of Seismic Data in Mines”, is currently underway and aims to develop the strategic use of seismic data and promote an increased understanding of the rock mass seismic response to mining. The ACG acknowledges the generous support and encouragement of its Phase IV research project sponsors. Additional project sponsors are sought. For further information please contact project leader, Johan Wesseloo, ACG via [email protected]
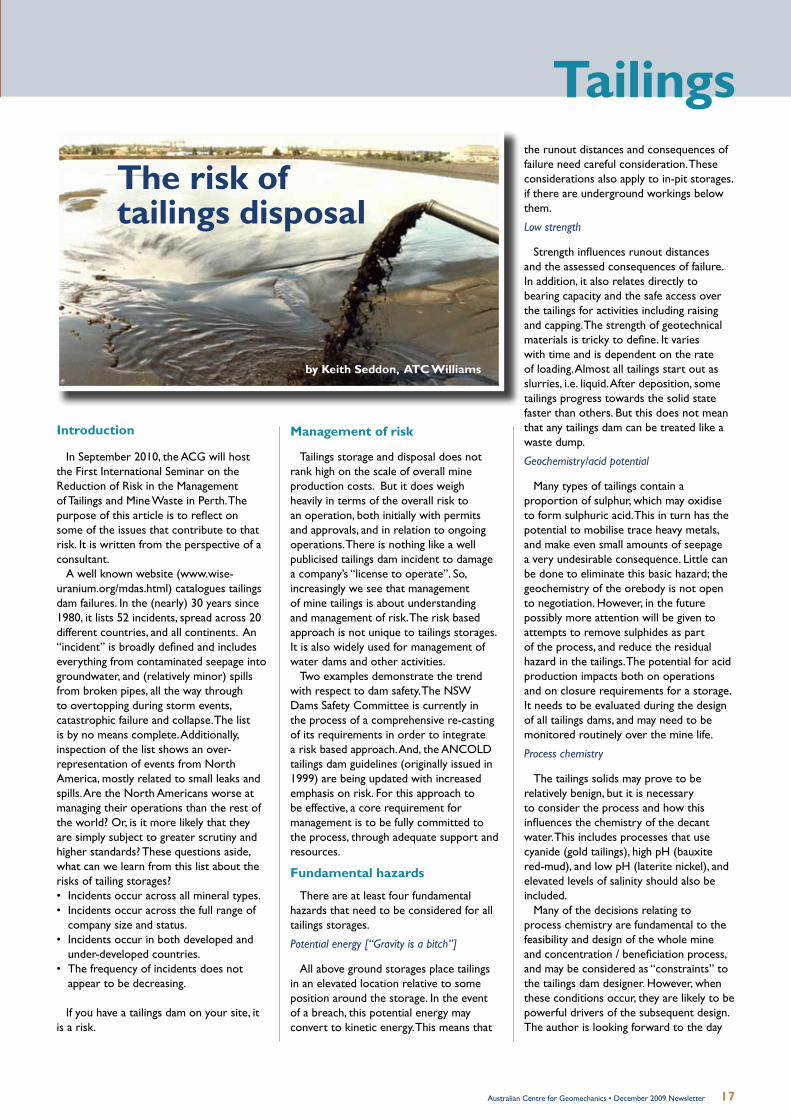
17Australian Centre for Geomechanics • December 2009 Newsletter
The risk of tailings disposal
by Keith Seddon, ATC Williams
Introduction
In September 2010, the ACG will host the First International Seminar on the Reduction of Risk in the Management of Tailings and Mine Waste in Perth. The purpose of this article is to reflect on some of the issues that contribute to that risk. It is written from the perspective of a consultant.
A well known website (www.wise-uranium.org/mdas.html) catalogues tailings dam failures. In the (nearly) 30 years since 1980, it lists 52 incidents, spread across 20 different countries, and all continents. An “incident” is broadly defined and includes everything from contaminated seepage into groundwater, and (relatively minor) spills from broken pipes, all the way through to overtopping during storm events, catastrophic failure and collapse. The list is by no means complete. Additionally, inspection of the list shows an over-representation of events from North America, mostly related to small leaks and spills. Are the North Americans worse at managing their operations than the rest of the world? Or, is it more likely that they are simply subject to greater scrutiny and higher standards? These questions aside, what can we learn from this list about the risks of tailing storages?• Incidents occur across all mineral types.• Incidents occur across the full range of
company size and status.• Incidents occur in both developed and
under-developed countries.• The frequency of incidents does not
appear to be decreasing.
If you have a tailings dam on your site, it is a risk.
Management of risk
Tailings storage and disposal does not rank high on the scale of overall mine production costs. But it does weigh heavily in terms of the overall risk to an operation, both initially with permits and approvals, and in relation to ongoing operations. There is nothing like a well publicised tailings dam incident to damage a company’s “license to operate”. So, increasingly we see that management of mine tailings is about understanding and management of risk. The risk based approach is not unique to tailings storages. It is also widely used for management of water dams and other activities.
Two examples demonstrate the trend with respect to dam safety. The NSW Dams Safety Committee is currently in the process of a comprehensive re-casting of its requirements in order to integrate a risk based approach. And, the ANCOLD tailings dam guidelines (originally issued in 1999) are being updated with increased emphasis on risk. For this approach to be effective, a core requirement for management is to be fully committed to the process, through adequate support and resources.
Fundamental hazards
There are at least four fundamental hazards that need to be considered for all tailings storages.
Potential energy [“Gravity is a bitch”]
All above ground storages place tailings in an elevated location relative to some position around the storage. In the event of a breach, this potential energy may convert to kinetic energy. This means that
the runout distances and consequences of failure need careful consideration. These considerations also apply to in-pit storages. if there are underground workings below them.
Low strength
Strength influences runout distances and the assessed consequences of failure. In addition, it also relates directly to bearing capacity and the safe access over the tailings for activities including raising and capping. The strength of geotechnical materials is tricky to define. It varies with time and is dependent on the rate of loading. Almost all tailings start out as slurries, i.e. liquid. After deposition, some tailings progress towards the solid state faster than others. But this does not mean that any tailings dam can be treated like a waste dump.
Geochemistry/acid potential
Many types of tailings contain a proportion of sulphur, which may oxidise to form sulphuric acid. This in turn has the potential to mobilise trace heavy metals, and make even small amounts of seepage a very undesirable consequence. Little can be done to eliminate this basic hazard; the geochemistry of the orebody is not open to negotiation. However, in the future possibly more attention will be given to attempts to remove sulphides as part of the process, and reduce the residual hazard in the tailings. The potential for acid production impacts both on operations and on closure requirements for a storage. It needs to be evaluated during the design of all tailings dams, and may need to be monitored routinely over the mine life.
Process chemistry
The tailings solids may prove to be relatively benign, but it is necessary to consider the process and how this influences the chemistry of the decant water. This includes processes that use cyanide (gold tailings), high pH (bauxite red-mud), and low pH (laterite nickel), and elevated levels of salinity should also be included.
Many of the decisions relating to process chemistry are fundamental to the feasibility and design of the whole mine and concentration / beneficiation process, and may be considered as “constraints” to the tailings dam designer. However, when these conditions occur, they are likely to be powerful drivers of the subsequent design. The author is looking forward to the day
Tailings
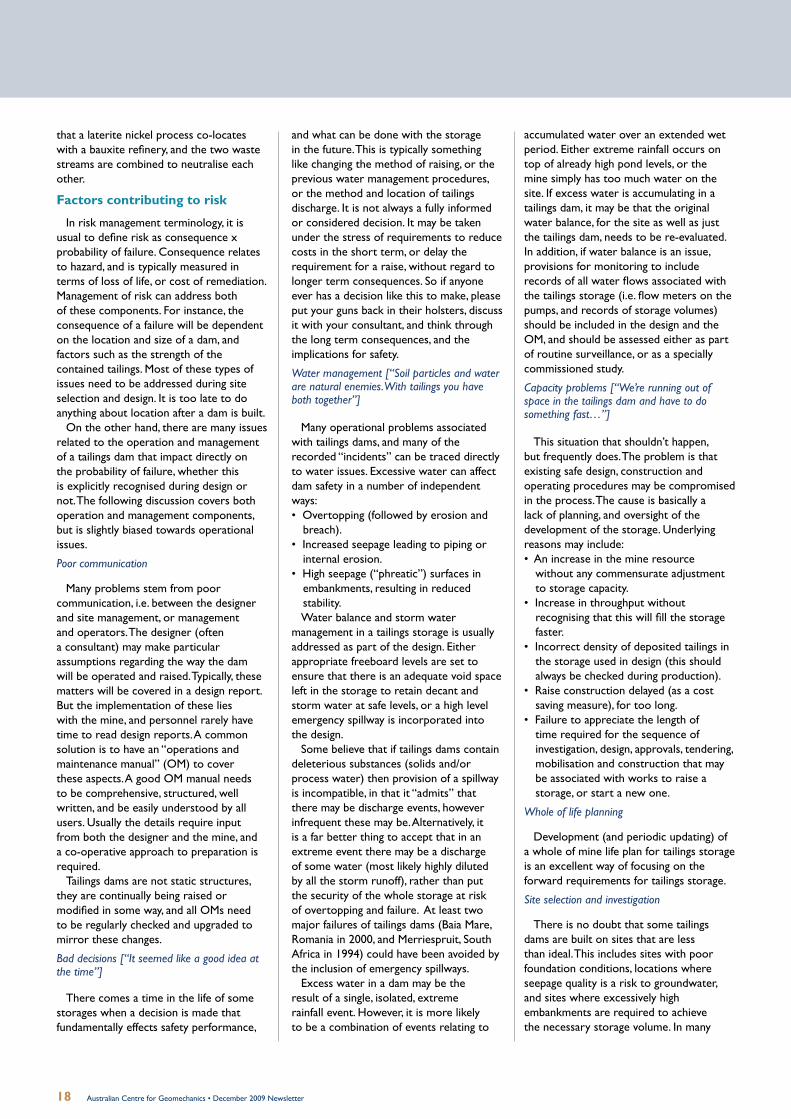
18 Australian Centre for Geomechanics • December 2009 Newsletter
that a laterite nickel process co-locates with a bauxite refinery, and the two waste streams are combined to neutralise each other.
Factors contributing to risk
In risk management terminology, it is usual to define risk as consequence x probability of failure. Consequence relates to hazard, and is typically measured in terms of loss of life, or cost of remediation. Management of risk can address both of these components. For instance, the consequence of a failure will be dependent on the location and size of a dam, and factors such as the strength of the contained tailings. Most of these types of issues need to be addressed during site selection and design. It is too late to do anything about location after a dam is built.
On the other hand, there are many issues related to the operation and management of a tailings dam that impact directly on the probability of failure, whether this is explicitly recognised during design or not. The following discussion covers both operation and management components, but is slightly biased towards operational issues.
Poor communication
Many problems stem from poor communication, i.e. between the designer and site management, or management and operators. The designer (often a consultant) may make particular assumptions regarding the way the dam will be operated and raised. Typically, these matters will be covered in a design report. But the implementation of these lies with the mine, and personnel rarely have time to read design reports. A common solution is to have an “operations and maintenance manual” (OM) to cover these aspects. A good OM manual needs to be comprehensive, structured, well written, and be easily understood by all users. Usually the details require input from both the designer and the mine, and a co-operative approach to preparation is required.
Tailings dams are not static structures, they are continually being raised or modified in some way, and all OMs need to be regularly checked and upgraded to mirror these changes.
Bad decisions [“It seemed like a good idea at the time”]
There comes a time in the life of some storages when a decision is made that fundamentally effects safety performance,
and what can be done with the storage in the future. This is typically something like changing the method of raising, or the previous water management procedures, or the method and location of tailings discharge. It is not always a fully informed or considered decision. It may be taken under the stress of requirements to reduce costs in the short term, or delay the requirement for a raise, without regard to longer term consequences. So if anyone ever has a decision like this to make, please put your guns back in their holsters, discuss it with your consultant, and think through the long term consequences, and the implications for safety.
Water management [“Soil particles and water are natural enemies. With tailings you have both together”]
Many operational problems associated with tailings dams, and many of the recorded “incidents” can be traced directly to water issues. Excessive water can affect dam safety in a number of independent ways:• Overtopping (followed by erosion and
breach).• Increased seepage leading to piping or
internal erosion.• High seepage (“phreatic”) surfaces in
embankments, resulting in reduced stability.Water balance and storm water
management in a tailings storage is usually addressed as part of the design. Either appropriate freeboard levels are set to ensure that there is an adequate void space left in the storage to retain decant and storm water at safe levels, or a high level emergency spillway is incorporated into the design.
Some believe that if tailings dams contain deleterious substances (solids and/or process water) then provision of a spillway is incompatible, in that it “admits” that there may be discharge events, however infrequent these may be. Alternatively, it is a far better thing to accept that in an extreme event there may be a discharge of some water (most likely highly diluted by all the storm runoff), rather than put the security of the whole storage at risk of overtopping and failure. At least two major failures of tailings dams (Baia Mare, Romania in 2000, and Merriespruit, South Africa in 1994) could have been avoided by the inclusion of emergency spillways.
Excess water in a dam may be the result of a single, isolated, extreme rainfall event. However, it is more likely to be a combination of events relating to
accumulated water over an extended wet period. Either extreme rainfall occurs on top of already high pond levels, or the mine simply has too much water on the site. If excess water is accumulating in a tailings dam, it may be that the original water balance, for the site as well as just the tailings dam, needs to be re-evaluated. In addition, if water balance is an issue, provisions for monitoring to include records of all water flows associated with the tailings storage (i.e. flow meters on the pumps, and records of storage volumes) should be included in the design and the OM, and should be assessed either as part of routine surveillance, or as a specially commissioned study.
Capacity problems [“We’re running out of space in the tailings dam and have to do something fast…”]
This situation that shouldn’t happen, but frequently does. The problem is that existing safe design, construction and operating procedures may be compromised in the process. The cause is basically a lack of planning, and oversight of the development of the storage. Underlying reasons may include: • An increase in the mine resource
without any commensurate adjustment to storage capacity.
• Increase in throughput without recognising that this will fill the storage faster.
• Incorrect density of deposited tailings in the storage used in design (this should always be checked during production).
• Raise construction delayed (as a cost saving measure), for too long.
• Failure to appreciate the length of time required for the sequence of investigation, design, approvals, tendering, mobilisation and construction that may be associated with works to raise a storage, or start a new one.
Whole of life planning
Development (and periodic updating) of a whole of mine life plan for tailings storage is an excellent way of focusing on the forward requirements for tailings storage.
Site selection and investigation
There is no doubt that some tailings dams are built on sites that are less than ideal. This includes sites with poor foundation conditions, locations where seepage quality is a risk to groundwater, and sites where excessively high embankments are required to achieve the necessary storage volume. In many

19Australian Centre for Geomechanics • December 2009 Newsletter
cases these sites are dictated by existing topography and/or lease boundaries, and are often the result of choosing the “least bad option”. It is important to appreciate that even if the starter dam is relatively modest, the final storage may grow to be a major structure. A full and comprehensive geotechnical and hydrogeological investigation should be carried out as part of the initial feasibility studies to enable the viability of the final structure to be established.
Construction issues
Construction control, or the lack of it, can have a major impact on the adequacy of tailings dams. This applies particularly to raises, where both the construction and supervision may be largely undertaken by the mine. The design will have been prepared on the expectation of certain standards of foundation preparation, material selection and placement etc. It is important that these standards should be achieved, and close and continued involvement by the designer throughout construction is essential. Many regulatory authorities recognise this and include a requirement for an acceptable “sign off” of construction, and also of design changes during construction.
Other operational issues
Other items that impact on safety and risk are:• Tailings deposition management: this is
often integrally linked to pond locations and beach development, and has major implications for the ongoing safe operation of the storage.
• Monitoring and surveillance: monitoring is the collection of data that relates to the performance of a dam, e.g. seepage flows, water levels, filling rate and storage levels, settlement and movement etc. There needs to be provision for these data to be reviewed at appropriate intervals, and the significance of the readings evaluated. Surveillance is the ongoing process of evaluation and assessment of the safety of a dam based on data obtained from inspections and monitoring, and is seen as a very valuable contribution to risk identification and reduction. Many regulatory authorities now require regular surveillance reports to be prepared on tailings dams with significant or high failure consequences. Some mining companies have similar internal requirements.
• Dust: dust from a tailings storage is sometimes a major environmental headache. One of the perceived “fixes” for this is to pond water on the tailings. This should not be attempted without consideration of the consequences.
Closure planning
Eventually, all tailings storages have to be closed, and the costs of closure can be significant, especially when the time is “now”, not “still 10 years down the track”.
Why is there a risk associated with this? Primarily because of a failure to plan. Many of the things that are needed for closure should have already been done well before. • What are the revegetation requirements?
What cover is required to get things to grow (schedule cover trials)?
• What is the final landform and capping design?
• Where is the material for this going to come from?Planning for closure should be
incorporated in initial design, and should continue throughout operations.
Corporate memory
Site personnel often take valuable knowledge with them when they do go. In some cases the consultant has better records of a site history than the mine, but no mine should rely on them. All sites should maintain a library/archive that contains copies of all reports, records etc., relating to each of its tailings storages. If a site is ever sold, these documents should be required by the new owner as an integral part of due diligence.
Article references are available on request.
Keith Seddon,ATC Williams
Tailings
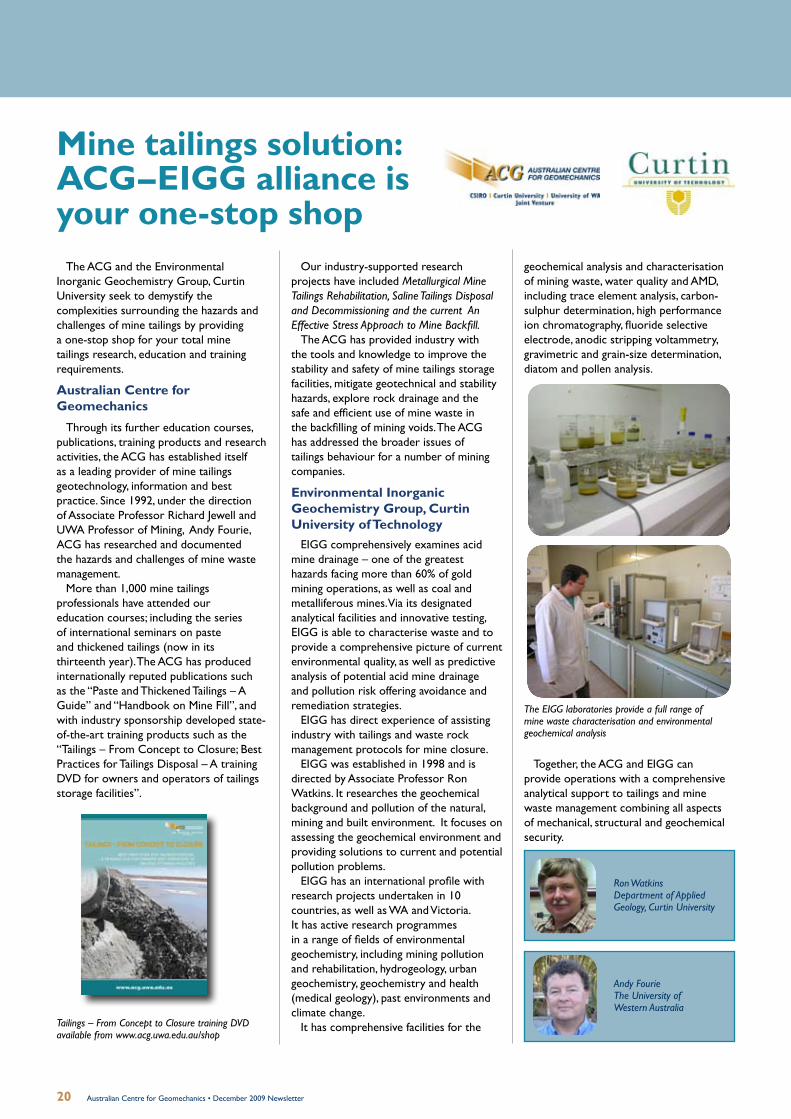
20 Australian Centre for Geomechanics • December 2009 Newsletter
Mine tailings solution: ACG–EIGG alliance is your one-stop shop
The ACG and the Environmental Inorganic Geochemistry Group, Curtin University seek to demystify the complexities surrounding the hazards and challenges of mine tailings by providing a one-stop shop for your total mine tailings research, education and training requirements.
Australian Centre for Geomechanics
Through its further education courses, publications, training products and research activities, the ACG has established itself as a leading provider of mine tailings geotechnology, information and best practice. Since 1992, under the direction of Associate Professor Richard Jewell and UWA Professor of Mining, Andy Fourie, ACG has researched and documented the hazards and challenges of mine waste management.
More than 1,000 mine tailings professionals have attended our education courses; including the series of international seminars on paste and thickened tailings (now in its thirteenth year). The ACG has produced internationally reputed publications such as the “Paste and Thickened Tailings – A Guide” and “Handbook on Mine Fill”, and with industry sponsorship developed state-of-the-art training products such as the “Tailings – From Concept to Closure; Best Practices for Tailings Disposal – A training DVD for owners and operators of tailings storage facilities”.
Our industry-supported research projects have included Metallurgical Mine Tailings Rehabilitation, Saline Tailings Disposal and Decommissioning and the current An Effective Stress Approach to Mine Backfill.
The ACG has provided industry with the tools and knowledge to improve the stability and safety of mine tailings storage facilities, mitigate geotechnical and stability hazards, explore rock drainage and the safe and efficient use of mine waste in the backfilling of mining voids. The ACG has addressed the broader issues of tailings behaviour for a number of mining companies.
Environmental Inorganic Geochemistry Group, Curtin University of Technology
EIGG comprehensively examines acid mine drainage – one of the greatest hazards facing more than 60% of gold mining operations, as well as coal and metalliferous mines. Via its designated analytical facilities and innovative testing, EIGG is able to characterise waste and to provide a comprehensive picture of current environmental quality, as well as predictive analysis of potential acid mine drainage and pollution risk offering avoidance and remediation strategies.
EIGG has direct experience of assisting industry with tailings and waste rock management protocols for mine closure.
EIGG was established in 1998 and is directed by Associate Professor Ron Watkins. It researches the geochemical background and pollution of the natural, mining and built environment. It focuses on assessing the geochemical environment and providing solutions to current and potential pollution problems.
EIGG has an international profile with research projects undertaken in 10 countries, as well as WA and Victoria. It has active research programmes in a range of fields of environmental geochemistry, including mining pollution and rehabilitation, hydrogeology, urban geochemistry, geochemistry and health (medical geology), past environments and climate change.
It has comprehensive facilities for the
geochemical analysis and characterisation of mining waste, water quality and AMD, including trace element analysis, carbon-sulphur determination, high performance ion chromatography, fluoride selective electrode, anodic stripping voltammetry, gravimetric and grain-size determination, diatom and pollen analysis.
Tailings – From Concept to Closure training DVD available from www.acg.uwa.edu.au/shop
Andy FourieThe University of Western Australia
Ron WatkinsDepartment of Applied Geology, Curtin University
The EIGG laboratories provide a full range of mine waste characterisation and environmental geochemical analysis
Together, the ACG and EIGG can provide operations with a comprehensive analytical support to tailings and mine waste management combining all aspects of mechanical, structural and geochemical security.
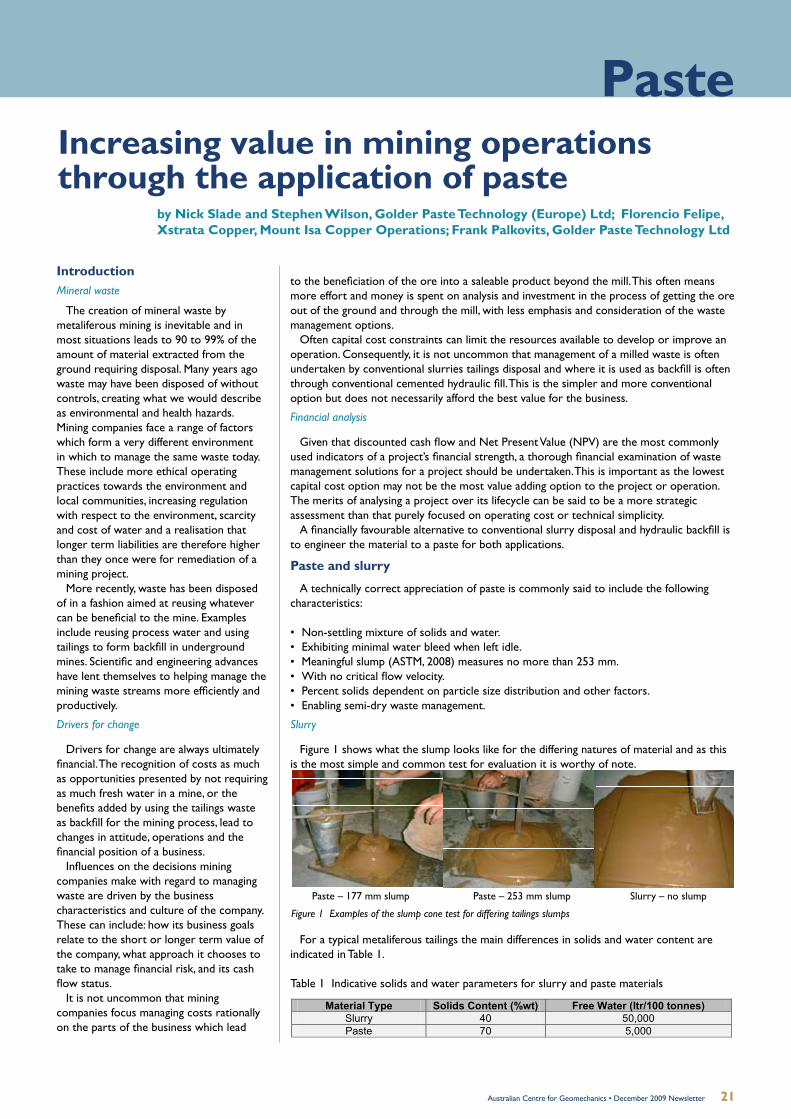
21Australian Centre for Geomechanics • December 2009 Newsletter
Increasing value in mining operations through the application of paste
by Nick Slade and Stephen Wilson, Golder Paste Technology (Europe) Ltd; Florencio Felipe, Xstrata Copper, Mount Isa Copper Operations; Frank Palkovits, Golder Paste Technology Ltd
IntroductionMineral waste
The creation of mineral waste by metaliferous mining is inevitable and in most situations leads to 90 to 99% of the amount of material extracted from the ground requiring disposal. Many years ago waste may have been disposed of without controls, creating what we would describe as environmental and health hazards. Mining companies face a range of factors which form a very different environment in which to manage the same waste today. These include more ethical operating practices towards the environment and local communities, increasing regulation with respect to the environment, scarcity and cost of water and a realisation that longer term liabilities are therefore higher than they once were for remediation of a mining project.
More recently, waste has been disposed of in a fashion aimed at reusing whatever can be beneficial to the mine. Examples include reusing process water and using tailings to form backfill in underground mines. Scientific and engineering advances have lent themselves to helping manage the mining waste streams more efficiently and productively.
Drivers for change
Drivers for change are always ultimately financial. The recognition of costs as much as opportunities presented by not requiring as much fresh water in a mine, or the benefits added by using the tailings waste as backfill for the mining process, lead to changes in attitude, operations and the financial position of a business.
Influences on the decisions mining companies make with regard to managing waste are driven by the business characteristics and culture of the company. These can include: how its business goals relate to the short or longer term value of the company, what approach it chooses to take to manage financial risk, and its cash flow status.
It is not uncommon that mining companies focus managing costs rationally on the parts of the business which lead
to the beneficiation of the ore into a saleable product beyond the mill. This often means more effort and money is spent on analysis and investment in the process of getting the ore out of the ground and through the mill, with less emphasis and consideration of the waste management options.
Often capital cost constraints can limit the resources available to develop or improve an operation. Consequently, it is not uncommon that management of a milled waste is often undertaken by conventional slurries tailings disposal and where it is used as backfill is often through conventional cemented hydraulic fill. This is the simpler and more conventional option but does not necessarily afford the best value for the business.
Financial analysis
Given that discounted cash flow and Net Present Value (NPV) are the most commonly used indicators of a project’s financial strength, a thorough financial examination of waste management solutions for a project should be undertaken. This is important as the lowest capital cost option may not be the most value adding option to the project or operation. The merits of analysing a project over its lifecycle can be said to be a more strategic assessment than that purely focused on operating cost or technical simplicity.
A financially favourable alternative to conventional slurry disposal and hydraulic backfill is to engineer the material to a paste for both applications.
Paste and slurry
A technically correct appreciation of paste is commonly said to include the following characteristics:
• Non-settling mixture of solids and water.• Exhibiting minimal water bleed when left idle.• Meaningful slump (ASTM, 2008) measures no more than 253 mm.• With no critical flow velocity.• Percent solids dependent on particle size distribution and other factors.• Enabling semi-dry waste management.
Slurry
Figure 1 shows what the slump looks like for the differing natures of material and as this is the most simple and common test for evaluation it is worthy of note.
For a typical metaliferous tailings the main differences in solids and water content are indicated in Table 1.
Table 1 Indicative solids and water parameters for slurry and paste materials
Paste – 177 mm slump Paste – 253 mm slump Slurry – no slump
3
For a typical metaliferous tailings the main differences in solids and water content are indicated in Table 1.
Table 1 –Indicative solids and water parameters for slurry and paste materials
Material Type Solids Content (%wt) Free Water (ltr/100 tonnes) Slurry 40 50,000 Paste 70 5,000
Paste application benefits Surface disposal benefits
Recent technology development has supported the application for tailings disposal as a paste. Some responsible
mining companies and regulators today are looking at more holistic waste management approaches.
Approaches which take that move towards minimising waste generation are fundamentally important to manage
efficient operations with respect to development and closure capital costs and operational costs. The knock-on
effects of resource consumption and waste disposal that were previously considered as free are now of major
financial significance to worldwide mining activities and operations.
The immediate and long-term liability of waste materials and the associated water run-off can amount to a major
portion of the cost to a business and can present significant obstacles in the permitting of disposal sites.
Minimising this cost and liability (risk) through reduced surface disposal volumes, hazards and innovative surface
storage brings benefits to any project. This is particularly so in relatively dry (hot or cold) climates or highly
populated areas as these place higher value / cost on consumption of water and the value of socio-economic and
environmental impact.
As the majority of mines and mining projects fall into this situation they are increasingly important financial drivers,
especially for larger scale projects.
In summary, the key risk-reducing and value-adding benefits to depositing tailings as a paste, rather than a slurry,
include:
• Smaller tailings disposal footprint (up to 40%); with a steeper beach angle (up to 5o).
• Smaller dam engineering.
• Lower water consumption.
• Negligible bleed water release.
• No critical velocity required to avoid settling.
• Reduced closure cost (10 to 75% depending on the characteristics of the waste).
• Reduced operating risk liability.
Figure 1 Examples of the slump cone test for differing tailings slumps
Paste
22 Australian Centre for Geomechanics • December 2009 Newsletter
Principal Sponsor
Paste application benefitsSurface disposal benefits
Recent technology development has supported the application for tailings disposal as a paste. Some responsible mining companies and regulators today are looking at more holistic waste management approaches.
Approaches which take that move towards minimising waste generation are fundamentally important to manage efficient operations with respect to development and closure capital costs and operational costs. The knock-on effects of resource consumption and waste disposal that were previously considered as free are now of major financial significance to worldwide mining activities and operations.
The immediate and long-term liability of waste materials and the associated water run-off can amount to a major portion of the cost to a business and can present significant obstacles in the permitting of disposal sites. Minimising this cost and liability (risk) through reduced surface disposal volumes and hazards, and innovative surface storage brings benefits to any project. This is particularly so in relatively dry (hot or cold) climates or highly populated areas as these place higher value / cost on consumption of water and the value of socio-economic and environmental impact.
As the majority of mines and mining projects fall into this situation they are increasingly important financial drivers, especially for larger scale projects.
In summary, the key risk reducing and value adding benefits to depositing tailings as a paste, rather than a slurry, include:• Smaller tailings disposal footprint (up to
40%); with a steeper beach angle (up to 5 degrees).
• Smaller dam engineering.• Lower water consumption. • Negligible bleed water release.• No critical velocity required to avoid
settling.• Reduced closure cost (10 to 75%
depending on the characteristics of the waste).
• Reduced operating risk liability.• Reduction in contamination/leachate
potential.• Potential to not require impervious liner
and monitoring systems (saving A$17-22/m2).
Backfill benefits
The disposal of tailings as backfill to an underground mine brings three clear gains
to almost all methods utilising backfill:• Reduction in the volume of material
placed as waste on surface in a deposition facility.
• Permits the generation of a larger size ore reserve in the underground mine.
• An increase in productivity as a result of reduced production cycle time.These elements can lead to significant
operational cost savings and revenue enhancements.
Paste application as backfill yields opportunities to reduce risk and add value by:• Increased mining productivity.• Reduced cycle time and cement
consumption.• Full range of plant tailings can be utilised. • Simplified stope preparation.• Improved underground mining
conditions (less water, slimes, pumping).• Reduced surface disposal volume.
Value and costShareholder value
If the business driver or goal is shareholder value and the used representation is NPV (Runge, 1998), then it is appropriate to consider this during evaluations of all key potential expenditures to ensure that value based decisions are made.
Net present value
Intuitively, where the NPV is increased for a project, even with increased capital expenditure, basic theory suggests the project will make a financial return and the project should go ahead. In practice there are limitations to this theoretical outcome, such as available capital within the business or indeed the capital finance market place, as has been witnessed in 2009, or the risk associated with the mining project. In such cases, the financial imperative for a project may not just be a positive NPV, but it may also be the return on the investment, the payback period or the inherent risk involved in the project as compared to other projects the business is assessing.
Net present cost
Net Present Cost (NPC) is also used. This reflects the discounted cash flow and time cost of the expenditure and is used in isolation from the NPV because the revenue data was either not relevant to the analysis or did not change. In relevant examples, NPV has been stated where the revenue did change as part of the analysis.
Financial case exampleSurface disposal in South America
A large mine in South America has an opportunity to increase the value of its asset with the application of paste tailings disposal rather than a conventional slurry tailings facility. The mine is a large operation producing approximately 150,000 tpd of tailings with a tailings solids concentration around 55% wt. By thickening the tailings towards 70% wt solids, significant gains are identified. The project outcome highlighted the following key benefits from the application of paste for tailings deposition:• Virtually eliminating water re-handling
associated with the tailings deposition. • Reduction in water consumption.• Reduction in water abstraction.• Prolonging the life of the existing facility.• Opportunity to increase production (by
increasing tailings capacity). • Reduce deposited tailings liquefaction
potential.These aspects provide a range of savings,
notably in water abstraction and re-handling, to the operation. The key financial gains in this example are:• Operating costs reduced by A$30M to
40M per annum.• NPC cost reduction of 40% for the life
of the tailings deposition system.Recognising this opportunity for the
business, the operation is advancing its project work towards the use of paste for the deposition of its tailings.
Conclusions
As indirect and direct costs to mining operations become greater and the focus on delivery of sustainable projects is linked to business success, the case for paste applications is clear in a variety of situations. Consideration of a range of key internal and external factors clearly suggests whether the application of paste is warranted for analysis and study on a new project or existing operation. Strategic perspectives of the project and business must also be examined to ensure value is maximised.
Nick Slade, Golder Paste Technology (Europe) Ltd, UK
Artic
le re
fere
nces
are
ava
ilabl
e on
requ
est.
23Australian Centre for Geomechanics • December 2009 Newsletter
Ground Control Groups Update
Eastern Australia Ground Control Group
A meeting was held in October 2009 in Tasmania on “Ground vibrations — blasting and seismicity, and its effect on ground support”. The meeting was well attended by more than 65 members and Dr Phil Dight, ACG Winthrop Professor Geotechnical Engineering presented a talk on microseismicity and the influence of rock fracturing on deep open pits. For details regarding the next meeting, please visit www.eagcg.org
Ground Control Group (WA)
The group met last month at the WA School of Mines, Kalgoorlie to discuss paste fill. A survey on the future of the group is being undertaken and can be obtained from the GCGWA secretary via [email protected]
This question was posed as part of a break-out session during the ACG and Centre for Land Rehabilitation’s (CLR) Fourth International Mine Closure Conference held in Perth in September 2009. This session provided delegates with a forum to explore corporate responsibility in relation to mine closure, using a hypothetical mining project as a case study. The hypothetical project comprised a remote greenfields gold mine owned by a mid-sized mining company. It was proposed that the mine would have a fly in – fly out workforce of about 300 employees and an operational life of 50 years.
A technical panel provided perspectives from different groups of stakeholders. The panel comprised Darren Murphy (SKM), Graham Cobby (WA Department of Minerals and Petroleum), Mark Batty (Western Australian Local Government Association), Kado Muir (Aboriginal Heritage Consultants and Traditional Owner), and Cathy Gupanis (Paladin Energy). The session was facilitated by Sonia Finucane with assistance from Don Burnside (URS Australia) and Talitha Santini (CLR).
The first part of the break-out session examined corporate responsibility during the permitting phase of the hypothetical project. Initial discussion examined the type of closure commitments that would be reasonable for the proponent to make at this early stage of the project life. Key topics included what should take priority in making closure commitments and how the company should balance the need of regulators and other stakeholders for certainty in closure outcomes with the need for continual improvement for a project with a long mine life. It was concluded that there was a need for proponents to agree with their stakeholders on mine closure targets for both environmental and social factors, but that gaining alignment on priorities could be difficult.
There was also discussion about the role of government and other stakeholders in
guiding proponents on what information on closure planning should be provided during the environmental impact assessment phase, including closure cost estimates. It was noted that developing closure cost estimates during the permitting phase was important but could be difficult, particularly for those projects expected to have a mine life of many decades as there was a decreasing level of accuracy in the closure cost estimate with increasing length of mine life. It was also noted that the focus of closure cost estimates developed at this stage of a project was usually on decommissioning and rehabilitation, with little or no allowance made for the socio-economic aspects of mine closure.
This second scenario examined corporate responsibility when a company was faced with unexpected or unplanned closure. Under this scenario, the mine had obtained environmental and other permits and had been operating successfully for five years when an unexpected and significant drop in commodity prices occurred. This forced the mine into temporary shutdown and, despite the company’s earlier good intention, it appeared that the only solution was to close the mine permanently. The company had prepared a closure plan as a condition of its environmental approval and had established a closure provision, but this was considered to be insufficient to pay for full project closure so early in mine life.
In discussing this scenario, a number of topics including what the company should do to demonstrate corporate responsibility when faced with unexpected closure were considered. Is corporate responsibility something to be spoken about only in good times? What is it really worth when times are tough? Unexpected closure usually triggers a review of company priorities and responsibilities, the extent of closure risks and liabilities, and the adequacy of closure provisions and bonds. During discussion on this point, the importance of stakeholder engagement during these reviews was recognised and it was commented that if it was difficult to get stakeholder alignment
Corporate (ir) responsibility: what is it really worth when times are tough?by Sonia Finucane, Bioscope Environmental Consulting Pty Ltd
on closure objectives and procedures during the environmental permitting stage, it could be even more difficult to obtain alignment when unexpected or unplanned closure occurs. Consequently, companies needed to manage this process carefully.
A consistent theme throughout the break-out session was how to address the socio-economic aspects of mine closure. It was felt that the “social conversation is still an externality”, with little or no consideration of the socio-economic aspects in closure planning and cost estimates. This was even more evident when unexpected closure occurred, as many of the social and community benefits of a mining project often took a number of years to be realised and these opportunities were reduced or lost altogether when a mine ceased operations prematurely. Where community assets (such as health or recreational facilities) were in development, when unexpected closure occurred there was concern about who would be responsible for completing and maintaining these assets. Often, this responsibility falls to local government authorities acting on behalf of the community. Therefore, it was suggested that life-cycle costing be undertaken when a mining company first proposed development of community assets so that local government and the community understood the cost of completing and maintaining these assets in the event of unexpected or unplanned mine closure.
Mine closure
24 Australian Centre for Geomechanics • December 2009 Newsletter
ACG Event Schedule*Practical Rock Mechanics in Mining Short Course Perth, 24–25 March 2010
Preconditioning Workshop Perth, 19 April 2010
Second International Symposium on Block and Sublevel Caving Perth, 20–22 April 2010
Advanced Mine Seismicity Seminar Perth, 8–11 June 2010
Rheology Workshop Perth, 22–23 June 2010
Open Pit Rock Mass Modelling Seminar Perth, 29–30 July 2010
Ground Support for Underground and Open Pit Mines (Basic Level) Short Course Perth, 25–26 August 2010
Tailings Workshop Perth, 28 September 2010
First International Seminar on the Reduction of Risk in the Management of Tailings and Mine Waste
Perth, 29 September – 1 October 2010
Blasting for Stable Slopes (Open Pit) Perth, 17–19 November 2010
In-Pit Waste Storage and Management Seminar Perth, 8–9 December 2010
14th International Seminar on Paste and Thickened Tailings Perth, 4–8 April 2011
* The ACG event schedule is subject to change. For event updates, please visit www.acg.uwa.edu.au/events_and_courses
Australian Centre for Geomechanics PO Box 3296 – Broadway, Nedlands, Western Australia, AUSTRALIA 6009Ph + 61 8 6488 3300 Fax +61 8 6488 1130 [email protected] www.acg.uwa.edu.au
The ACG team wishes you and your family a very merry Christmas and a
happy New Year. We thank you for your support and encouragement during 2009 and look forward to an exciting 2010.
Our office will be closed from Wednesday 23rd December 2009, reopening on
Wednesday 6th January 2010.
Festive Greetings
ACG Underground Drilling and Blasting – A safety training DVD for underground metalliferous mine workers
All underground mine workers will be exposed to drilling and blasting processes. The aim of this new DVD is to provide workers with the critical knowledge on drilling and blasting to aid appreciation of the importance of these mining processes and their related hazards. The DVD will feature an introduction to the rock breaking process in mining and a description of explosives and how they work. The second part of the DVD will cover development drilling and blasting practices; while the third part will cover production drilling and blasting. The ACG acknowledges the project sponsors’ generous support.
The ACG invites your organisation to sponsor this new training DVD. Contact the ACG for more information.
For many mining companies, ACG training products have become an integral and essential component of their training programmes. For the full list of the ACG’s successful suite of geotechnical mine worker training DVDs, please visit www.acg.uwa.edu.au/training_products.

ACG December 2009 Newsletter Article References
Sublevel caving — past and future by William Hustrulid, University of Utah; and the Colorado School of Mines, USA, and Rudolph Kvapil, USA
Bullock, R.L., and Hustrulid, W.A. (2001), Planning the underground mine on the basis of mining method, Underground Mining Methods: Engineering Fundamentals and International Case Studies (Ed. W.A. Hustrulid and R.L. Bullock), SME, Littleton, Colorado, pp 29-48.
Coates, D.F. (1981), Rock Mechanics Principles, Monograph 874 (revised), CANMET Energy, Mines and Resources. Hollins, B., and Tucker, J. (2004), Drawpoint analysis using a marker trial at the Perseverance nickel mine, Leinster, Western
Australia, Proceedings, MassMin 2004, Santiago, Chile, pp Hustrulid, W., and Johnson, J. (2008), A gas pressure-based drift round blast design methodology, Proceedings, MassMin 2008,
Luleå, Sweden Janelid, I. (1961), Introductory speech, Sublevel Caving Discussion Meeting, Series B, Number 32, March 29, 1962, pp 3-7. Janelid, I. (1972), Study of the gravity flow process in sublevel caving. International Sublevel Caving Symposium, Stockholm,
September. Janelid, I., and Kvapil, R. (1965), Sublevel caving, Int. Jour. Rock Mech. and Min. Sci. vol. 3, pp 129-153. Johansson, C.H. and Persson, P-A (1970), Detonics of High Explosives, Academic Press, London, 330pp. Kvapil, R. (1955), Theory of the Flow of Granular and Coarse Materials in Hoppers (In Czech), State Technical Literature
Publishing Company (SNTL), Prague. Kvapil, R. (1982), The mechanics and design of sublevel caving systems, Underground Mining Methods Handbook (Ed W.A.
Hustrulid), SME, AIME, New York, pp 880- 897. Kvapil, R. (1992), Sublevel caving. SME Mining Engineering Handbook, 2nd Edition (Ed H.L. Hartman), SME, Littleton, Colorado,
pp 1789-1814. Kvapil, R. (2004), Gravity Flow in Sublevel and Panel Caving - A Common Sense Approach. Book/CD published with very limited
circulation. Larsson, L. (1996), Personal communication. Larsson, L. (2007), Personal communication. Marklund, I., and Hustrulid, W. (1995), Large-scale underground mining, new equipment and a better underground environment
– result of research and development at LKAB, Sweden, Institution of Mining and Metallurgy, V104, pp A164-A168. September- December.
McCormick, R.J. (1968), How wide does a drawpoint draw? Engineering and Mining Journal, 169(6):106-116. Minelco (2007), From the Minelco selection, www.minelco.com Newman, T. (1997), “Blasting of intact ore against caved waste rock at Kiruna, Senior Thesis, University of South Australia. Newman, T., Hustrulid, W., and Quinteiro, C (2008), Sublevel caving trial - blasting of an ore slice against caved rock at the Kiruna
mine, Proceedings, MassMin 2008, Luleå, Sweden Nordqvist, a (2007), Personal communication. Ohlsson, K. (1961), Summary of contributions regarding sublevel caving in Sweden in 1960, Sublevel Caving Discussion Meeting,
Series B, Number 32, March 29, 1962, pp 8-15 Peele, R. (1918), Mining Engineers’ Handbook. John Wiley & Sons, New York. Quinteiro, C., Hustrulid, W., and Larsson, L. (2001), Theory and practice of very large scale sublevel caving, Underground Mining
methods – Engineering Fundamentals and International Case Studies (Ed: Hustrulid and Bullock: pp381-384), SME, Littleton,Colorado.
Redaelli, L.L. (1963), Sublevel caving at Koskullskulle, Mine and Quarry Engineering, June, pp 261-264. Sandström, P.O. (1972), Application and optimization of sublevel caving techniques, Engineering and Mining Journal, 173(6):112
- 125. Simetric (2007), Density of materials, www.simetric.co.uk/si_materials.htm Szwedzicki, T., and Cooper, R. (2007), Ore flow and fragmentation at Perseverance mine, Proceedings, 1st International
Symposium on Block and Sub-Level Caving, Southern African Institute of Mining and Metallurgy, pp 133 – 146.
The changing profile of risk associated with in-pit placement of waste by Raymond Yost, Rio Tinto Minerals – Boron Operations, USA
A-Grivas, D. and Harr, M. E., 1979, A Reliability Approach to the Design of Soil Slopes, Design Parameters in Geotechnical Engineering, Proceedings of the 7th European Conference, Soil Mechanics and Foundation Engineering, pp. 95-100.
Brox, D. R., and Newcomen, H. W., 2004, Utilizing Strain Criteria to Predict Highwall Stability Performance, Society of Mining and Metallurgical Engineering Annual Meeting, Denver, CO.
Call, R. D., Savely, J. P., and Nicholas, D. E., 1977, Estimation of Joint Set Characteristics from Surface Mapping Data: Monograph 1 on Rock Mechanics Applications in Mining. Papers presented at the 17th U.S. Symposium on Rock Mechanics (Snowbird, Utah, August, 1976), pp. 65-73, New York; Society of Mining Engineers.
Chowdhury, R. N. and A-Grivas, D., 1982, Probabilistic Model of Progressive Failure of Slopes, Journal of Geotechnical Engineering, Division American Society of Civil Engineers, vol. 108, pp. 803-819.
Chowdhury, R. N., 1984, State of the Art Report on Probabilistic Methods in Landslide Studies, IV International Symposium on Landslides, vol. 1, pp. 209-228.
Chowdhury, R. N. and Derooy, E. R., 1985, Progressive Reliability of a Strain-Softening Slope, Transactions of the Institution of Engineers, Australia, vol. CE27, pp. 79-94.
Cooper, D. M. 1962, Slope Stability (June 13th Slide), internal memorandum Cooper D. M. 1963, Comparison of Major Slides (June, 1962 and April, 1963), internal memorandum. Cooper, D. M. 1964, Slope Stability, South Wall (Continuation of the June 1962 Slide) EP-0543, internal memorandum Cooper, D. M. and Paulsen, J. C. 1963, Handling of the April, 1963 Slide, Report Number BE-75, internal memorandum. Cooper, D. M. and Paulsen, J. C. 1965, South Wall Remedial Action (Meeting, March 10,1965), internal memorandum Eisebraun, G. F., 1970, Unloading of the Northeast Pit Wall (Extension 17), internal memorandum. Fell, R., 1994, Landslide Risk Assessment and Acceptable Risk, Canadian Geotechnical Journal, vol. 31, pp. 261-272. GAB Robins, 2000, re: Open it Wall Failure - Fourteenth Report, fax to Royal & Sun Alliance, April 12, 2000. Glass, C. E., Savely, J. P., and Call, R. D., 1978, Determining Seismic Risk for Economic Optimum Slope Design, 19th U.S.
Symposium on Rock Mechanics, Nevada, pp. 1-6. Hachich, W. and VanMarcke, E. H., 1983, Probabilistic Updating of Pore Pressure Fields, Journal of Geotechnical Engineering,
Division American Society of Civil Engineers, vol. 109 (3), pp. 373-387. Heslop, T.G. and Milne, P. R. G., 2003, A Practical Example of a Risk-Based Approach to the Design of an Open Pit, Fifth Large
Open Pit Mining Conference, Kalgoorlie, Australia, p. 215 – 224. Krahn, J., 2004, Stability Modeling with SLOPE/W: An Engineering Methodology, GEO-SLOPE International Ltd. Calgary, Alberta,,
Canada. Li, K. S., 1991a Fallacies of Current Probabilistic Approaches to Progressive Slope Failure, Sixth International Conference
on Applications of Statistics and Probability in Civil Engineering, vol. 2, pp 784-791. Li, K. S., 1991b Some Common Mistakes in Probabilistic Analysis of Slopes, Landslides: Proceedings of the Sixth International
Symposium, Christchurch, vol. 1, pp. 475-480. Maddocks, C. A., 1981, Extensions 22S and K-1 Design, internal memorandum. Maddocks, C. A., 19872, July 1984 East Wall Slide, internal memorandum. Marek, J. M. and Savely, J. P., 1978, Probabilistic Analysis of the Plane Shear Failure Mode: 19th US Symposium on Rock
Mechanics, Nevada. McMahon, B. K., 1971, Statistical Method for the Design of Rock Slopes, Proceedings of the First Australian – New Zealand
Conference for Geomechanics, Melbourne, Australia. Miller, S.M., Whyatt, J. K., McHugh, E. L., 2004, Applications of the Point Estimation Method for Stochastic Rock Slope
Engineering, in Gulf Rocks 2004: Rock Mechanics Across Borders and Disciplines, Proceedings of the 6th North American Rock Mechanics Conference, Huston, TX.
Morriss, P. and Stoter, H. J., 1983, Open-cut Slope Design Using Probabilistic Methods, Proceedings of the Fifth Congress, International Society of Rock Mechanics, Section C, pp. 107 – 112.
National Research Council (NRC), 1995, Probabilistic Methods in Geotechnical Engineering, The National Academy of Sciences, Washington D.C.
Norrman, J. 2004, On Bayesian Decision Analysis for Evaluating Alternative Actions at Contaminated Sites, Rapport 67, Swedish Geotechnical Institute, Goteberg, Sweden, 266 pgs.
Siefke, J. W., 1970, Geological Aspects of Slope Failure in Extension 17, internal memorandum. Siefke, J. W., 1982, Slope Stability, internal memorandum. Stacey, T. R., Terbrugge, P. J., Keyter, G. J., and Xianban, Y., 2003, Extension Strain – A New Concept in Open Pit Slope Stability
and its Use in the Explanation of Two Slope Failures, Fifth Large Open Pit Mining Conference, Kalgoorlie, Austraila, p. 259 – 266.
U.S. Army Corps of Engineers (USACE), 1995, Introduction to Probability and Reliability Methods for Use in Geotechnical Engineering, Department of the Army, Washington D.C., Technical Letter No. 1110-2-547
U.S. Army Corps of Engineers (USACE), 1999, Risk-Based Analysis in Geotechnical Engineering for Support of Planning Studies, Department of the Army, Washington, D.C., Technical Letter No.1110-2-556
Vanmarcke, E. H. 1980, Probabilistic Stability Analysis of Earth Slopes, Engineering Geology, vol. 16, pp. 29-50. Zavodni, Z. M., 2001, Time-Dependent Movement of Open Pit Slopes, Slope Stability in Surface Mining, Society for Mining,
Metallurgy and Exploration, pp. 81-87.
Summer vacation students in winter by Peter Hills, Tasmania Mine Joint Venture, BCD Resources (Operations) NL
Hills, P.B. & Penney, A.R., 2008. Management of seismicity at the Beaconsfield Gold Mine, Tasmania. In, Proceedings of the Tenth AusIMM Underground Operators’ Conference 2008. The Australasian Institute of Mining & Metallurgy: Melbourne. Pp. 157-170.
Hills, P.B., Mills, J., Penney, A.R., & Arthur, S., (2008). The development and implementation of a fully remote stoping method at Beaconsfield Gold Mine, Tasmania. In, Proceedings of the Narrow Vein Mining Conference 2008. The Australasian Institute of Mining & Metallurgy: Melbourne. Pp. 199-206.
King, R., Thomas, S. & Scott, C., 2007. Geotechnical assessment – resumption of ore production (East Zone). Coffey Mining P/L Report No. HZ00054.01.BH.
Penney, A.R., Hills, P.B. & Walton, R.J., (2008). The use of geotechnical instrumentation to optimise an engineered mine design at Beaconsfield Gold Mine, Tasmania. In, Proceedings of the Narrow Vein Mining Conference 2008. The Australasian Institute of Mining & Metallurgy: Melbourne. Pp. 165-172.
Pfitzner, M., 2006 Geotechnical assessment – resumption of decline developments. Coffey Mining P/L Report No. HZ00054.01.A1.
Scott, C. & Reeves, I., 2007. Geotechnical assessment – resumption of ore production (West Zone). Coffey Mining P/L Report No. HZ00054.01.BY.
Sidea, D., Scott, C. & Reeves, I. 2007. Geotechnical assessment – resumption of ore driving development. Coffey Mining P/L Report No. HZ00054.01.AT.
The risk of tailings disposal by Keith Seddon, ATC Williams
Australian National Committee on Large Dams “Guidelines on Tailings Dam Design Construction and Operation” October 1999. “Safety of Tailings Dams” http://www.wise-uranium.org/mdas.html Standards Australia AS/NZS 4360:2004 Risk Management.
Increasing value in mining operations through the application of paste by Nick Slade and Stephen Wilson, Golder Paste Technology (Europe) Ltd; Florencio Felipe, Xstrata Copper, Mount Isa Copper Operations; Frank Palkovits, Golder Paste Technology Ltd
Runge I,C,1998. Mining Economics and Strategy. (Society for Mining, Metallurgy and Exploration, Inc) United States. ASTM C143 / C143M – 08, 2008. Standard Test Method for Slump of Hydraulic-Cement Concrete. (ASTM International) United
States. MacNamara, L. 2009. (FLSmidth Dorr Oliver Eimco Ltd) Personal Communication on large scale applications and paste thickener
evolution.