Embed Size (px)
Citation preview
MNRAS 448, 3325–3338 (2015) doi:10.1093/mnras/stv214
Submillimetre observations of WISE/radio-selected AGN and theirenvironments
Suzy F. Jones,1‹ Andrew W. Blain,1 Carol Lonsdale,2 James Condon,2 Duncan Farrah,3
Daniel Stern,4 Chao-Wei Tsai,4 Roberto J. Assef,5 Carrie Bridge,6 Amy Kimball,7
Mark Lacy,2 Peter Eisenhardt,4 Jingwen Wu8 and Tom Jarrett91XROA, Department of Physics and Astronomy, University of Leicester, University Road, Leicester LE1 7RH, UK2National Radio Astronomy Observatory, 520 Edgemont Road, Charlottesville, VA 22903-2475, USA3Department of Physics MC 0435, Virginia Polytechnic Institute and State University, 850 West Campus Drive, Blacksburg, VA 24061, USA4Jet Propulsion Laboratory, California Institute of Technology, 4800 Oak Grove Dr., Pasadena, CA 91109, USA5Nucleo de Astronomıa de la Facultad de Ingenierıa, Universidad Diego Portales, Av. Ejercito Libertador 441, Santiago, Chile6California Institute of Technology MS249-17, Pasadena, CA 91125, USA7CSIRO Astronomy & Space Science, PO Box 76, Epping, NSW 1710, Australia8Division of Physics & Astronomy, University of California Los Angeles, Physics and Astronomy Building, 430 Portola Plaza,Los Angeles, CA 90095-1547, USA9Astronomy Department, University of Cape Town, Rondebosch 7701, Republic of South Africa
Accepted 2015 January 28. Received 2015 January 15; in original form 2014 November 27
ABSTRACTWe present JCMT SCUBA-2 850 µm submillimetre (submm) observations of 30 mid-infrared(mid-IR) luminous active galactic nuclei (AGNs), detected jointly by the Wide-field InfraredSurvey Explorer (WISE) all-sky IR survey and the NVSS/FIRST radio survey. These raresources are selected by their extremely red mid-IR spectral energy distributions (SEDs) andcompact radio counterparts. Further investigations show that they are highly obscured, haveabundant warm AGN-heated dust and are thought to be experiencing intense AGN feedback.These galaxies appear to be consistent with a later AGN-dominated phase of merging galaxies,while hot, dust-obscured galaxies are an earlier starburst-dominated phase. When comparingthe number of submm galaxies detected serendipitously in the surrounding 1.5 arcmin to thosein blank-field submm surveys, there is a very significant overdensity, of order 5, but no signof radial clustering centred at our primary objects. The WISE/radio-selected AGN thus residein 10-Mpc-scale overdense environments that could be forming in pre-viralized clusters ofgalaxies. WISE/radio-selected AGNs appear to be the strongest signposts of high-densityregions of active, luminous and dusty galaxies. SCUBA-2 850 µm observations indicatethat their submm fluxes are low compared to many popular AGN SED templates, hencethe WISE/radio-selected AGNs have either less cold and/or more warm dust emission thannormally assumed for typical AGN. Most of the targets are not detected, only four targets aredetected at SCUBA-2 850 µm, and have total IR luminosities ≥1013 L�, if their redshiftsare consistent with the subset of the 10 SCUBA-2 undetected targets with known redshifts,z ∼ 0.44–2.86.
Key words: galaxies: active – galaxies: clusters: general – galaxies: high-redshift – quasars:general – infrared: galaxies – submillimetre: galaxies.
1 IN T RO D U C T I O N
A popular galaxy evolution theory is for major mergers between gas-rich galaxies to cause tidal interactions between the two galaxiesand gas is driven into the central regions of the galaxies (Sanders
� E-mail: [email protected]
et al. 1988; Barnes & Hernquist 1992; Schweizer 1998; Farrah et al.2001; Veilleux, Kim & Sanders 2002; Hopkins et al. 2006, 2008;Volonteri, Natarajan & Gultekin 2011). Gas is converted quicklyinto stars in a period of intense starburst activity (<109 yr), whichdominates the luminosity. The active galactic nuclei (AGNs) arefuelled and merge, and with the increased gas supply can accrete atclose to or above the Eddington rate (Assef et al. 2014), dominatingthe luminosity for a time as a powerful obscured AGN, and then
C© 2015 The AuthorsPublished by Oxford University Press on behalf of the Royal Astronomical Society
at University of L
eicester on January 27, 2016http://m
nras.oxfordjournals.org/D
ownloaded from
3326 S. F. Jones et al.
perhaps an optically bright quasar. Feedback from the supermassiveblack hole (SMBH) and supernovae can expel all the gas from thegalaxy, and quench further star formation and BH accretion, leavingbehind a passive elliptical galaxy. Hence, AGN feedback likelyplays a crucial role in galaxy evolution. There are two modes forAGN feedback: radiative or wind mode, it is intense and short-lived(�108 yr), when the accreting BH is close to the Eddington limitand affects the distribution of cold gas (Farrah et al. 2012), and thesecond is kinetic or maintenance mode, which lasts longer and is lessintense than radiative mode, it is jet-driven, and is when the galaxyhas a hot halo (Fabian 2012). From previous observations, radiativemode feedback is important for highly luminous, obscured galaxies,comparable to the galaxies observed in this paper, and kinetic modefeedback is important in nearby massive elliptical galaxies (Fabian2012). However, a combination of both radiative and jet-drivenfeedback modes could be important for the targets of this paper,because the galaxies are extremely luminous and obscured, andalso contain radio jets. Observations of AGN feedback, especiallyat the peak epoch of cosmic star formation, z ∼ 2–3, are requiredto fully understand how AGN feedback affects the host galaxy.
To observe AGN feedback in action, mid-infrared (mid-IR) se-lections are very successful (de Grijp, Lub & Miley 1987; Lowet al. 1988; Sanders et al. 1988; Spinoglio & Malkan 1989; Keelet al. 1994; Lacy et al. 2004; Stern et al. 2005, 2012; Yan et al.2005; Polletta et al. 2006, 2008; Gruppioni et al. 2008; Sacchi et al.2009; Tommasin et al. 2010; Donley et al. 2012; Assef et al. 2013;Mateos et al. 2013). NASA’s Wide-field Infrared Survey Explorer(WISE; Wright et al. 2010) is able to find luminous, dusty, high-redshift, active galaxies because the hot dust heated by AGN and/orstarburst activity can be traced using the WISE 12 µm (W3) and22 µm (W4) bands. Eisenhardt et al. (2012), Bridge et al. (2012,2013) and Lonsdale et al. (submitted) have shown that WISE canfind different classes of interesting, luminous, high-redshift, dust-obscured AGN. There has been previous work on heavily-obscured,hyperluminous, WISE-selected AGNs from Eisenhardt et al. (2012),Wu et al. (2012), Jones et al. (2014) and Tsai et al. (2014) whoobserved galaxies with faint or undetectable flux densities in the3.4 µm (W1) and 4.6 µm (W2) bands, and well-detected fluxes inthe W3 and/or W4 bands, but a radio blind selection. These galax-ies, which also host obscured AGNs, are called ‘W1W2-dropouts’or hot, dust-obscured galaxies (Hot DOGs; Wu et al. 2012; Joneset al. 2014). Hot DOGs are thought to be consistent with a later,transient phase of a major merger compared to submillimetre galax-ies (SMGs; Jones et al. 2014), and a comparison of submillimetre(submm) observations of the WISE/radio-selected AGNs and theirsurrounding environments are presented in this paper, to see if theyare different.
The observations of luminous, dusty, high-redshift, active galax-ies also revealed significant evidence that the galaxy density in theenvironments of high-redshift far-IR and mid-IR luminous galax-ies appears to be above average (Blain et al. 2004; Borys et al.2004; Farrah et al. 2006; Scott, Dunlop & Serjeant 2006; Gilli,Comastri & Hasinger 2007; Chapman et al. 2009; Hickox et al.2009, 2012; Cooray et al. 2010). Clustering of these mid-IR andSMGs could be evidence for massive dark matter haloes and high-light bias of this distribution as compared with the underlying darkmatter distribution. There is also evidence that SMGs are found indense environments from Umehata et al. (2014), who observed theprotocluster SSA22 field with the Astronomical Thermal EmissionCamera (AzTEC) on the Atacama Submillimeter Telescope Exper-iment (ASTE), at 1.1 mm to a depth of 0.7–1.3 mJy beam−1, andfound 10 SMGs correlated with z = 3.1 Lyman-alpha emitters in the
protocluster. There is also evidence for high-redshift radio galaxies(HzRGs) to reside in overdense regions as traced by dusty galax-ies (Stevens et al. 2003, 2010; Falder et al. 2010; Galametz et al.2010, 2012; Mayo et al. 2012; Wylezalek et al. 2013, 2014; Hatchet al. 2014). This suggests that HzRGs are progenitors of massivegalaxies in the centre of rich galaxy clusters in the present-day Uni-verse (Stevens et al. 2003, 2010; Venemans et al. 2007; Falder et al.2010; Galametz et al. 2010, 2012; Mayo et al. 2012; Wylezaleket al. 2013; Hatch et al. 2014): in particular, the Herschel GalaxyEvolution Project (HeRGE) found that the HzRG MRC 1138−26at z = 2.156, the Spiderweb galaxy, is a protocluster environment(Seymour et al. 2012). Further evidence is from the Clusters AroundRadio-Loud AGN (CARLA) Spitzer programme that looked at theenvironments of radio-loud AGN (RLAGN) at 1.2 < z < 3.2, andconcluded that RLAGN are in overdense environments in mid-IRwavelengths, and could be signposts of high-redshift galaxy clus-ters (Wylezalek et al. 2013; Hatch et al. 2014). Donoso et al. (2014)looked at ∼170 000 WISE-selected Hot DOGs and found that ob-scured AGN are found in denser environments than unobscuredAGN. Stevens et al. (2003) observed seven HzRGs with Submil-limetre Common-User Bolometer Array (SCUBA), and comparedthe number of serendipitous sources in the fields of seven HzRGsand their lambda cold dark matter (�CDM) simulation predicteddistribution (fig. 4), and showed the data and simulations show thateither no companions or two companions are found in the HzRGfields. Stevens et al. (2003) concluded that the radio galaxies hadintense, extended star-formation activity and detected on averageone serendipitous source per HzRG field.
In this paper, we present James Clerk Maxwell Telescope(JCMT) SCUBA-2 (Holland et al. 2013) observations of a sub-set of WISE/radio-selected AGNs from Lonsdale et al. (submitted).The 30 luminous, dusty, high-redshift, active galaxies are selectedfrom WISE, but also contain compact radio sources, in order to ob-serve AGN feedback and potential overdense environments. Theywere selected on their red WISE mid-IR colours, with strong com-pact radio emission in the National Radio Astronomy Observatory(NRAO) Very Large Array (VLA) Sky Survey (NVSS; Condon et al.1998) and/or Faint Images of the Radio Sky at Twenty cm (FIRST;Becker, White & Helfand 1995). These WISE/radio-selected AGNsare likely to have spectral energy distributions (SEDs) dominatedby AGN that could be quenching star formation by the feedback atthe highest rate of AGN fuelling, where feedback is most effectiveand important. The long wavelength SCUBA-2 measurements areneeded to understand the cold dust properties of the target and tocalculate the total IR luminosity (LIR) all the way from 8 to 1000 µm(LIR = L8−1000 µm; the total IR luminosity).
Section 2 summaries the details of the sample selection fromWISE and NVSS/FIRST data (Lonsdale et al., submitted). Sec-tion 3 describes the SCUBA-2 observations. Section 4 reports theSCUBA-2 results for SEDs and total IR luminosities (LIR), and ap-propriate templates in fitting the data are discussed. The maximumpermitted luminosities of underlying host galaxy components arealso calculated. The overdensity of serendipitous SMG sources inthe SCUBA-2 fields is determined by comparison with blank-fieldsubmm surveys. The overdensity results from Hot DOGs (Joneset al. 2014) are compared, and we compared the distribution ofserendipitous SMG sources within each SCUBA-2 field to HzRGfields (Stevens et al. 2003).
Throughout this paper we assume a �CDM cosmology withH0 = 71 km s−1 Mpc−1, �m = 0.27 and �� = 0.73. WISE cataloguemagnitudes are converted to flux densities using zero-point valueson the Vega system of 306.7, 170.7, 29.04 and 8.284 Jy for WISE
MNRAS 448, 3325–3338 (2015)
at University of L
eicester on January 27, 2016http://m
nras.oxfordjournals.org/D
ownloaded from
WISE/radio-selected AGN submm observations 3327
3.4, 4.6, 12 and 22 µm wavelengths, respectively (Wright et al.2010).
2 SA M P L E SE L E C T I O N
The 30 galaxies observed here with JCMT SCUBA-2 are a sub-set from the WISE/radio-selected AGNs described in more de-tail by Lonsdale et al. (submitted), of which 49 southern galaxieswere observed with Atacama Large Millimeter/submillimeter Array(ALMA) in cycle 0. JCMT SCUBA-2 was used to observe galaxiesfrom an independent sample in the Northern hemisphere. JCMTSCUBA-2 observations were also used to compare to the SCUBA-2 observations of Hot DOGs reported by Jones et al. (2014), andto observe the potential overdense environments surrounding theWISE/radio-selected AGNs.
2.1 WISE
WISE surveyed the entire sky at wavelengths of 3.4, 4.6, 12 and22 µm (W1–W4) from 2010 January to 2011 January (Wright et al.2010). One of the primary science goals was to identify the mostluminous galaxies in the observable Universe, which can be ac-complished due to WISE obtaining much greater sensitivity thanprevious all-sky IR survey missions. For example, IRAS yieldedcatalogued source sensitivities of 0.5 Jy at 12, 25 and 60 µm and1 Jy at 100 µm and angular resolutions that varied from 0.5 arcminat 12 µm to about 2 arcmin at 100 µm (Neugebauer et al. 1984),compared to WISE that achieved 5σ source sensitivities better than0.054, 0.071, 0.73 and 5.0 mJy and angular resolutions of 6.1, 6.4,6.5 and 12.0 arcsec in the W1–W4 bands, respectively (Wright et al.2010; Jarrett et al. 2011). The objects observed here are selectedfrom the WISE AllWISE Source Catalog,1 with IR magnitudes de-rived using point source profile-fitting (Cutri et al. 2003).
2.2 NVSS/FIRST
NVSS is a 1.4-GHz continuum survey of the entire sky north of−40◦ declination, and covers 82 per cent of the sky, with an angu-lar resolution of 45 arcsec (Condon et al. 1998). NVSS ran from1993 to 1997 and catalogued ∼1.8 × 10⁶ discrete sources with acompleteness limit ≥2.5 mJy.
FIRST is a 1.4 GHz survey over 10 000 deg2 of the North andSouth Galactic Caps at 20 cm (Becker et al. 1995). It produced 5-arcsec-resolution maps, with a typical root mean square (rms) noiselevel of 0.15 mJy. FIRST has a higher resolution than NVSS and sowhen both were available, FIRST positional data were used.
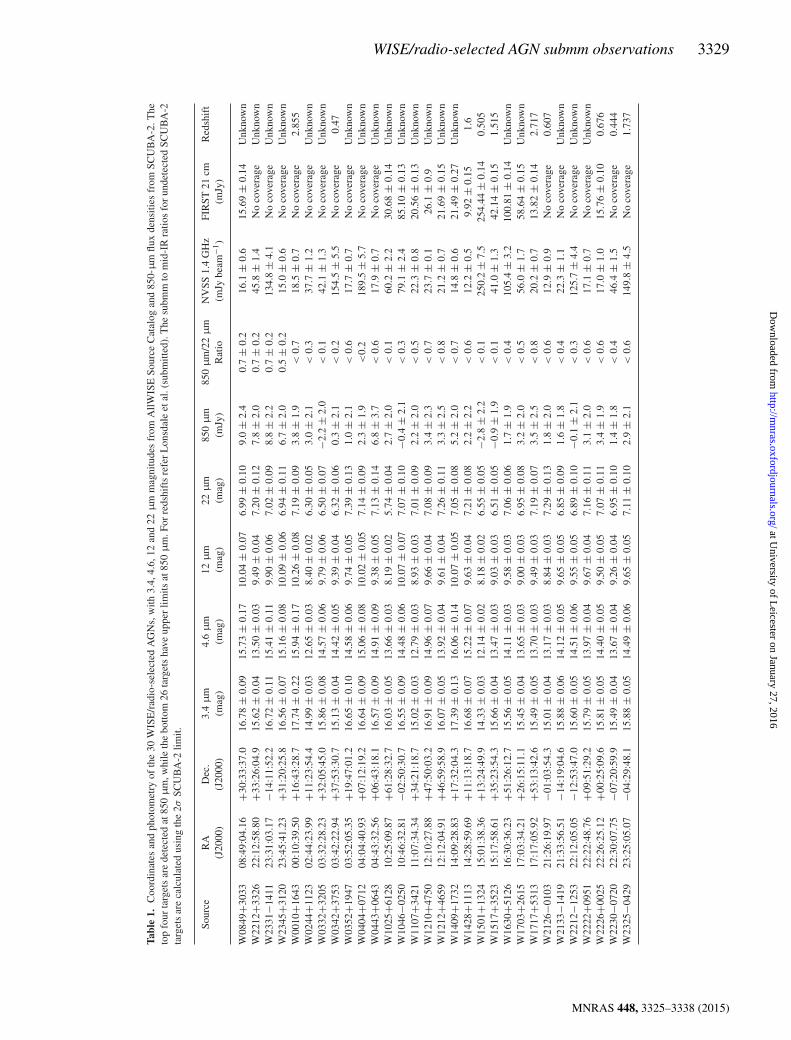
The selection criteria 0.1 < S22 µm/S1.4 GHz < 1, ensures thatthe sample are radio-intermediate, not as radio-bright as standardradio-galaxies, 1040–1045 erg s−1 (Kellermann 1974). The radio datamap the synchrotron emission, and so by using this selection cutensure that their 850 µm fluxes are not contaminated by syn-chrotron emission. The brightest radio source in this sample hasan S1.4 GHz = 250.2 mJy, and most have a radio flux density between10–100 mJy at 1.4 GHz. The weighted average S1.4 GHz = 104.8 mJy,and adopting a power-law spectral index of α = −1.0, which ap-pears to be appropriate for radio-intermediate targets (Fanti et al.2000; Giacintucci et al. 2007; Varenius et al. 2014), the contri-bution to the 850 µm flux would be 0.4 mJy. When looking atthe radio-loudest (S1.4 GHz = 250.2 mJy) and the radio-quietest(S1.4 GHz = 12.2 mJy) targets, the contribution to the 850 µm flux
1 http://wise2.ipac.caltech.edu/docs/release/allwise/
would be 1.0 and 0.04 mJy, respectively. Therefore, the sample’s850 µm fluxes, probed to a depth of 2.1 mJy beam−1, should not becontaminated strongly by synchrotron emission.
The radio fluxes of the sample are similar to the luminous-infraredgalaxies (LIRGs),2 observed with the Very Long Baseline Array(VLBA) that had strong radio cores and were found to be AGNdominated (Lonsdale et al. 2003). This could imply that the strongradio emission of the WISE/radio-selected AGNs is evidence ofsignificant non-thermal contributions and could be from the AGNjets. For more details see Lonsdale et al. (submitted).
The NVSS/FIRST catalogue was cross-matched with the WISEcatalogue on <7 arcsec scales, which was best for reliability andcompleteness, and excluding the region within 10 deg of the Galac-tic plane to avoid asymptotic giant branch (AGB) stars and satu-ration artefacts. Matched targets with very red WISE colours wereselected, the selection cut (W2 − W3) + 1.25(W1 − W2) > 7,W4 > 10 mJy and W3 ≥ 7 mJy were used because coverage levelsand sensitivity varies over the sky in the WISE survey (Lonsdaleet al., submitted). The NVSS and WISE selection cuts were madeto ensure that the targets had steep mid-IR WISE SEDs from W1–W4, which are consistent with AGN SEDs, with compact radio-intermediate structures. The final selection cut was for the targets tohave faint or no optical counterparts to the Sloan Digital Sky Survey(SDSS) depth r − [24] > 12.3, to avoid confusion with bright orextended low-redshift galaxies.
These cuts led to 156 selected galaxies. The surface density ofWISE/radio-selected high-redshift galaxies over the whole sky, tothis magnitude limit, is 0.003 deg−2 and points to this populationbeing exceptionally rare and perhaps an interesting transition popu-lation. They have no bright optical counterpart and are ultraluminousif at redshift z > 0.5. 10 targets have known redshifts, with a range0.444 < z < 2.855, and most of the other targets are expected tobe in the same range, because they have similar WISE colour cuts.These redshifts ensure that the targets will benefit from the negativeK-correction when observed at submm wavelengths.
3 O BSERVATI ONS
3.1 JCMT SCUBA-2
SCUBA-2 is a submm 450/850 µm bolometer camera with eight32 × 40 pixel detector arrays, each with a field of view of2.4 arcmin2. The diffraction-limited beams have full width at halfmaximum (FWHM) of approximately 7.5 and 14.5 arcsec, respec-tively (Holland et al. 2013).
From the 130 WISE/radio-selected AGNs, 30 that could be ob-served in the Northern hemisphere, were observed using SCUBA-2on the 15-m JCMT atop Mauna Kea in Hawaii, primarily in 2013August but also on other nights through the 12B semester, from2012 August to 2013 January, and in the 13B semester, from 2013August to 2014 January, and the 14A semester, from 2014 Febru-ary to 2014 September. The optical depth at 225 GHz, τ 225, duringthe observations was in the range of JCMT Band 2 conditions:0.05 < τ 225 < 0.08. The corresponding opacities for each atmo-spheric window, 450 and 850 µm, were 0.61 < τ 450 < 1.18 and
2 Luminous-infrared galaxies (LIRGs), ultraluminous infrared galaxies(ULIRGs) and hyperluminous infrared galaxies (HyLIRGs) have character-izing total infrared luminosities (8–1000 µm) of L8−1000 µm > 1011 L�,L8−1000 µm > 1012 L� and L8−1000 µm > 1013 L�, respectively (Sanders& Mirabel 1996; Lonsdale, Farrah & Smith 2006).
MNRAS 448, 3325–3338 (2015)
at University of L
eicester on January 27, 2016http://m
nras.oxfordjournals.org/D
ownloaded from
3328 S. F. Jones et al.
0.24 < τ 850 < 0.40 (Dempsey et al. 2013). Therefore, we couldnot use any 450 µm data because the atmospheric opacity was toogreat, and noise levels were too high.
All observations were taken in the ‘CV Daisy observing modethat produces a 12-arcmin diameter map, with the deepest coveragein a central 3-arcmin diameter region (Holland et al. 2013). Thetarget stays near the centre of the arrays and the telescope performsa pseudo-circular pattern with a radius of 250 arcsec at a speed of155 arcsec s−1. This mode is best for point-like sources or sourceswith structure smaller than 3 arcmin scales. Each scan was 25 minlong and there were three scans per target, totalling an exposuretime per target of 75 min.
Pointing checks were taken throughout the nights. The calibrationsources observed were Uranus, CRL 2688, CRL 618 and Mars.Calibrations were taken at the start and end of every night in thestandard manner (Dempsey et al. 2013).
4 R ESULTS
4.1 Photometry
The maps were reduced with the Starlink SubMillimeter User Re-duction Facility (SMURF) data reduction package with the ‘BlankField configuration suitable for low signal-to-noise ratio pointsources (Chapin et al. 2013). SMURF performs pre-processingsteps to clean the data by modelling each of the contributions tothe signal from each bolometer, flat-fields the data and removes at-mospheric emission and finally regrids to produce a science-qualityimage. Using the Starlink PIpeline for Combining and AnalysingReduced Data (PICARD) package the maps were mosaickedwith all three observations per target, beam-match filtered with a15-arcsec FWHM Gaussian and calibrated with the flux conversionfactor of 2.34 Jy pW−1 arcsec−2 (appropriate for aperture pho-tometry) or 537 Jy pW−1 beam−1 (in order to measure absolutepeak fluxes of discrete sources) that is pertinent for 850 µm data(Dempsey et al. 2013).
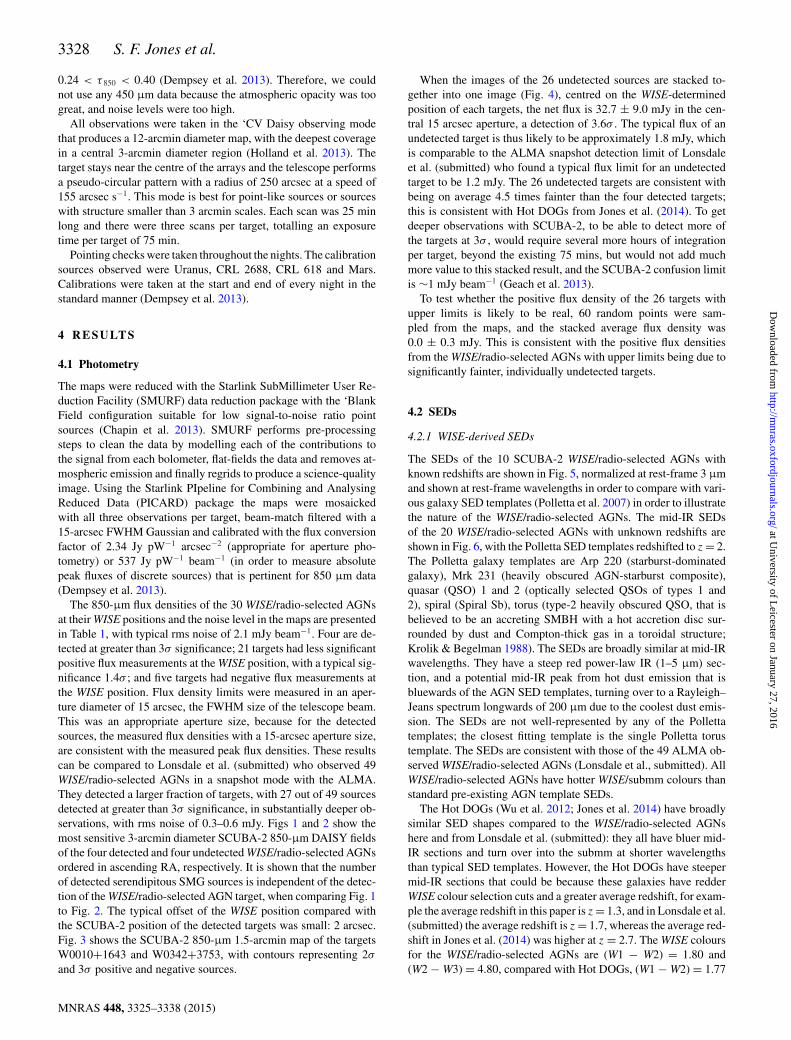
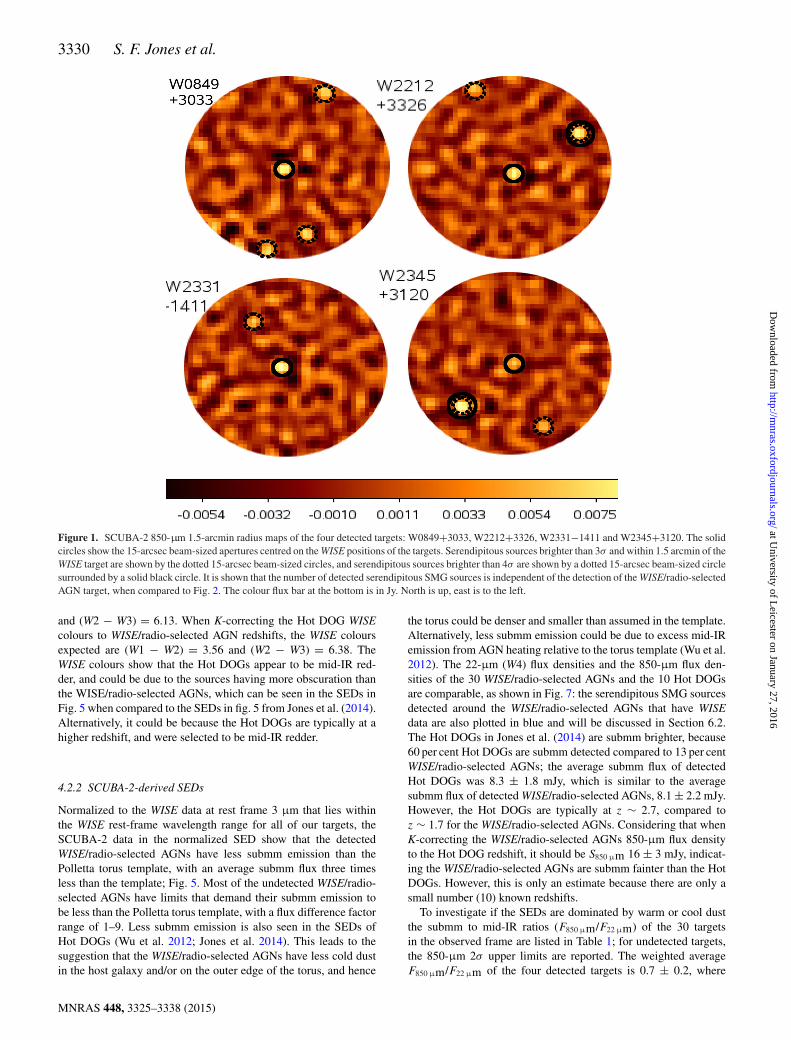
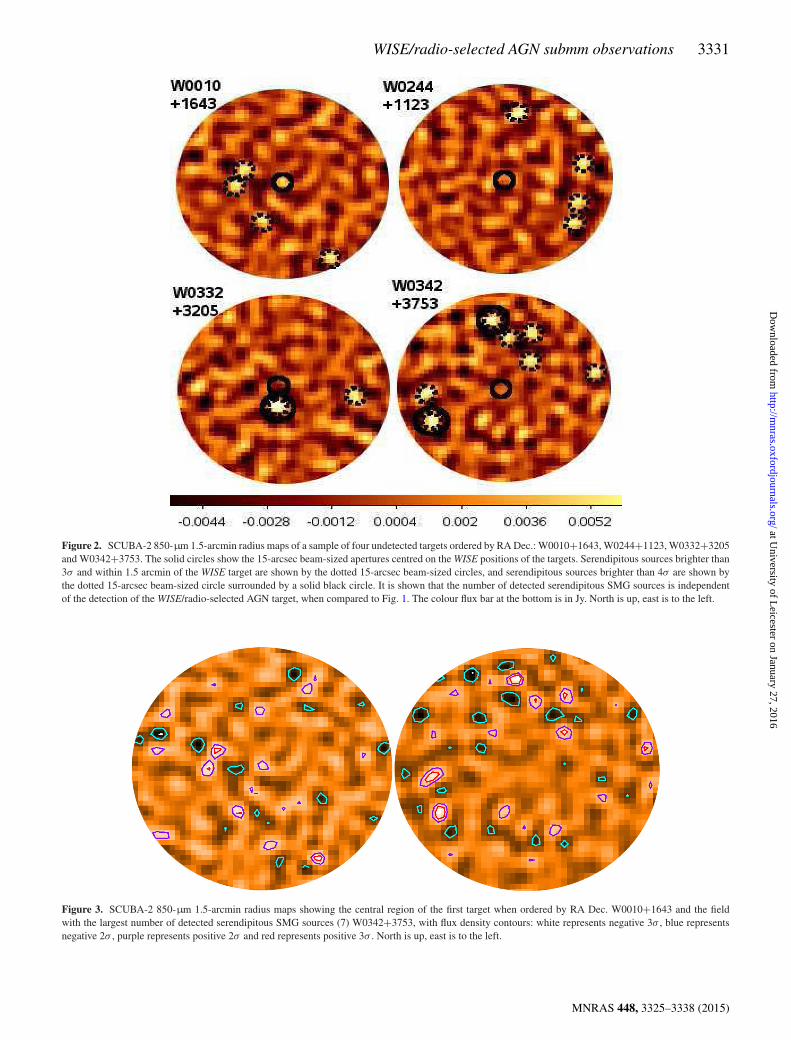
The 850-µm flux densities of the 30 WISE/radio-selected AGNsat their WISE positions and the noise level in the maps are presentedin Table 1, with typical rms noise of 2.1 mJy beam−1. Four are de-tected at greater than 3σ significance; 21 targets had less significantpositive flux measurements at the WISE position, with a typical sig-nificance 1.4σ ; and five targets had negative flux measurements atthe WISE position. Flux density limits were measured in an aper-ture diameter of 15 arcsec, the FWHM size of the telescope beam.This was an appropriate aperture size, because for the detectedsources, the measured flux densities with a 15-arcsec aperture size,are consistent with the measured peak flux densities. These resultscan be compared to Lonsdale et al. (submitted) who observed 49WISE/radio-selected AGNs in a snapshot mode with the ALMA.They detected a larger fraction of targets, with 27 out of 49 sourcesdetected at greater than 3σ significance, in substantially deeper ob-servations, with rms noise of 0.3–0.6 mJy. Figs 1 and 2 show themost sensitive 3-arcmin diameter SCUBA-2 850-µm DAISY fieldsof the four detected and four undetected WISE/radio-selected AGNsordered in ascending RA, respectively. It is shown that the numberof detected serendipitous SMG sources is independent of the detec-tion of the WISE/radio-selected AGN target, when comparing Fig. 1to Fig. 2. The typical offset of the WISE position compared withthe SCUBA-2 position of the detected targets was small: 2 arcsec.Fig. 3 shows the SCUBA-2 850-µm 1.5-arcmin map of the targetsW0010+1643 and W0342+3753, with contours representing 2σ
and 3σ positive and negative sources.
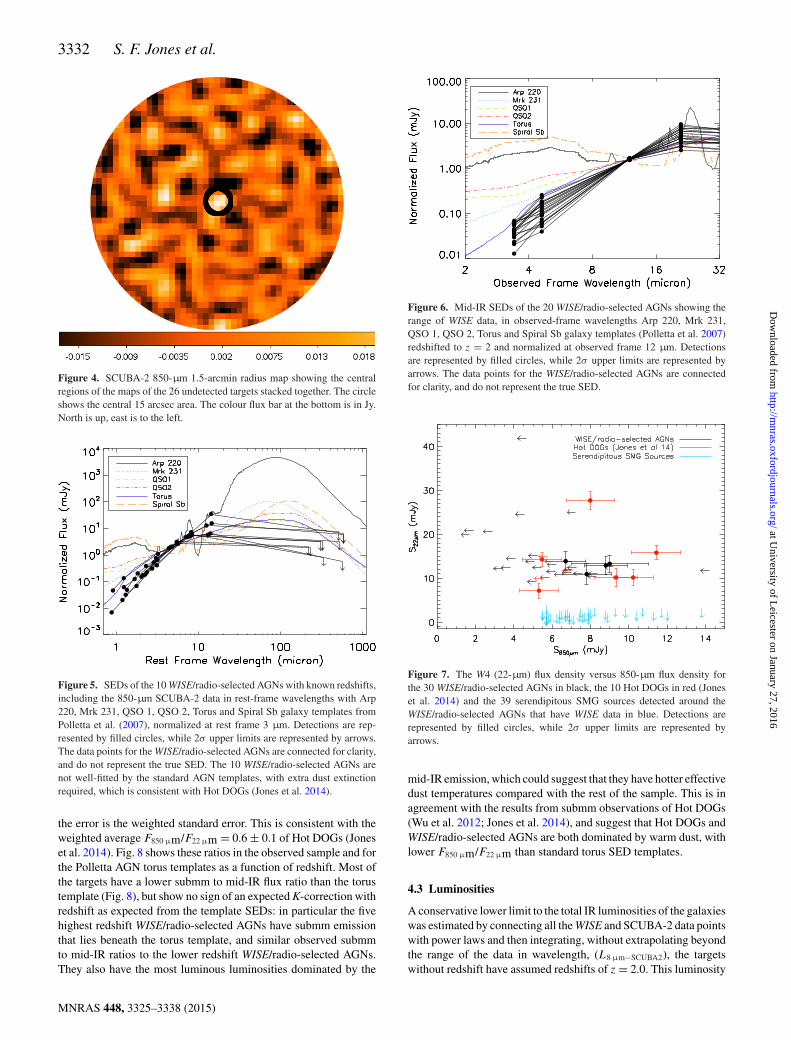
When the images of the 26 undetected sources are stacked to-gether into one image (Fig. 4), centred on the WISE-determinedposition of each targets, the net flux is 32.7 ± 9.0 mJy in the cen-tral 15 arcsec aperture, a detection of 3.6σ . The typical flux of anundetected target is thus likely to be approximately 1.8 mJy, whichis comparable to the ALMA snapshot detection limit of Lonsdaleet al. (submitted) who found a typical flux limit for an undetectedtarget to be 1.2 mJy. The 26 undetected targets are consistent withbeing on average 4.5 times fainter than the four detected targets;this is consistent with Hot DOGs from Jones et al. (2014). To getdeeper observations with SCUBA-2, to be able to detect more ofthe targets at 3σ , would require several more hours of integrationper target, beyond the existing 75 mins, but would not add muchmore value to this stacked result, and the SCUBA-2 confusion limitis ∼1 mJy beam−1 (Geach et al. 2013).
To test whether the positive flux density of the 26 targets withupper limits is likely to be real, 60 random points were sam-pled from the maps, and the stacked average flux density was0.0 ± 0.3 mJy. This is consistent with the positive flux densitiesfrom the WISE/radio-selected AGNs with upper limits being due tosignificantly fainter, individually undetected targets.
4.2 SEDs
4.2.1 WISE-derived SEDs
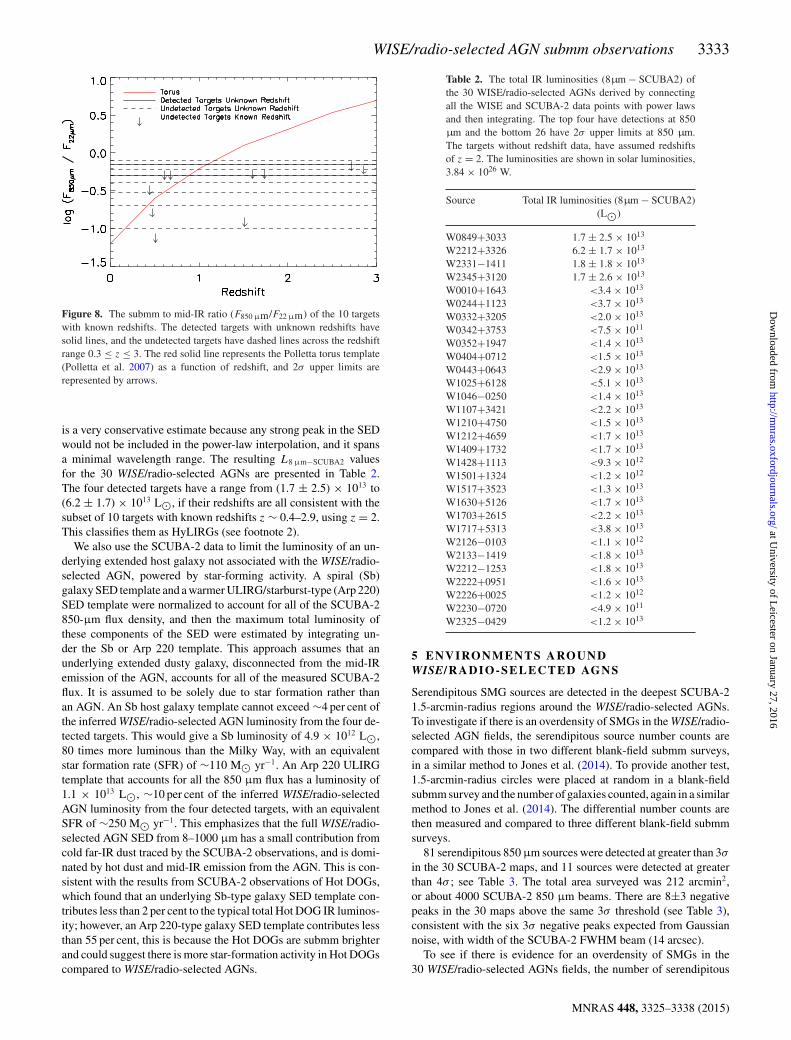
The SEDs of the 10 SCUBA-2 WISE/radio-selected AGNs withknown redshifts are shown in Fig. 5, normalized at rest-frame 3 µmand shown at rest-frame wavelengths in order to compare with vari-ous galaxy SED templates (Polletta et al. 2007) in order to illustratethe nature of the WISE/radio-selected AGNs. The mid-IR SEDsof the 20 WISE/radio-selected AGNs with unknown redshifts areshown in Fig. 6, with the Polletta SED templates redshifted to z = 2.The Polletta galaxy templates are Arp 220 (starburst-dominatedgalaxy), Mrk 231 (heavily obscured AGN-starburst composite),quasar (QSO) 1 and 2 (optically selected QSOs of types 1 and2), spiral (Spiral Sb), torus (type-2 heavily obscured QSO, that isbelieved to be an accreting SMBH with a hot accretion disc sur-rounded by dust and Compton-thick gas in a toroidal structure;Krolik & Begelman 1988). The SEDs are broadly similar at mid-IRwavelengths. They have a steep red power-law IR (1–5 µm) sec-tion, and a potential mid-IR peak from hot dust emission that isbluewards of the AGN SED templates, turning over to a Rayleigh–Jeans spectrum longwards of 200 µm due to the coolest dust emis-sion. The SEDs are not well-represented by any of the Pollettatemplates; the closest fitting template is the single Polletta torustemplate. The SEDs are consistent with those of the 49 ALMA ob-served WISE/radio-selected AGNs (Lonsdale et al., submitted). AllWISE/radio-selected AGNs have hotter WISE/submm colours thanstandard pre-existing AGN template SEDs.
The Hot DOGs (Wu et al. 2012; Jones et al. 2014) have broadlysimilar SED shapes compared to the WISE/radio-selected AGNshere and from Lonsdale et al. (submitted): they all have bluer mid-IR sections and turn over into the submm at shorter wavelengthsthan typical SED templates. However, the Hot DOGs have steepermid-IR sections that could be because these galaxies have redderWISE colour selection cuts and a greater average redshift, for exam-ple the average redshift in this paper is z = 1.3, and in Lonsdale et al.(submitted) the average redshift is z = 1.7, whereas the average red-shift in Jones et al. (2014) was higher at z = 2.7. The WISE coloursfor the WISE/radio-selected AGNs are (W1 − W2) = 1.80 and(W2 − W3) = 4.80, compared with Hot DOGs, (W1 − W2) = 1.77
MNRAS 448, 3325–3338 (2015)
at University of L
eicester on January 27, 2016http://m
nras.oxfordjournals.org/D
ownloaded from
WISE/radio-selected AGN submm observations 3329
Tabl
e1.
Coo
rdin
ates
and
phot
omet
ryof
the
30W
ISE
/rad
io-s
elec
ted
AG
Ns,
with
3.4,
4.6,
12an
d22
µm
mag
nitu
des
from
AllW
ISE
Sour
ceC
atal
ogan
d85
0-µ
mflu
xde
nsiti
esfr
omSC
UB
A-2
.The
top
four
targ
ets
are
dete
cted
at85
0µ
m,w
hile
the
botto
m26
targ
ets
have
uppe
rlim
itsat
850
µm
.For
reds
hift
sre
fer
Lon
sdal
eet
al.(
subm
itted
).T
hesu
bmm
tom
id-I
Rra
tios
for
unde
tect
edSC
UB
A-2
targ
ets
are
calc
ulat
edus
ing
the
2σSC
UB
A-2
limit.
Sour
ceR
AD
ec.
3.4
µm
4.6
µm
12µ
m22
µm
850
µm
850
µm
/22
µm
NV
SS1.
4G
Hz
FIR
ST21
cmR
edsh
ift
(J20
00)
(J20
00)
(mag
)(m
ag)
(mag
)(m
ag)
(mJy
)R
atio
(mJy
beam
−1)
(mJy
)
W08
49+3
033
08:4
9:04
.16
+30:
33:3
7.0
16.7
8±
0.09
15.7
3±
0.17
10.0
4±
0.07
6.99
±0.
109.
0±
2.4
0.7
±0.
216
.1±
0.6
15.6
9±
0.14
Unk
now
nW
2212
+332
622
:12:
58.8
0+3
3:26
:04.
915
.62
±0.
0413
.50
±0.
039.
49±
0.04
7.20
±0.
127.
8±
2.0
0.7
±0.
245
.8±
1.4
No
cove
rage
Unk
now
nW
2331
−141
123
:31:
03.1
7−1
4:11
:52.
216
.72
±0.
1115
.41
±0.
119.
90±
0.06
7.02
±0.
098.
8±
2.2
0.7
±0.
213
4.8
±4.
1N
oco
vera
geU
nkno
wn
W23
45+3
120
23:4
5:41
.23
+31:
20:2
5.8
16.5
6±
0.07
15.1
6±
0.08
10.0
9±
0.06
6.94
±0.
116.
7±
2.0
0.5
±0.
215
.0±
0.6
No
cove
rage
Unk
now
nW
0010
+164
300
:10:
39.5
0+1
6:43
:28.
717
.74
±0.
2215
.94
±0.
1710
.26
±0.
087.
19±
0.09
3.8
±1.
9<
0.7
18.5
±0.
7N
oco
vera
ge2.
855
W02
44+1
123
02:4
4:23
.99
+ 11:
23:5
4.4
14.9
9±
0.03
12.6
5±
0.03
8.40
±0.
026.
30±
0.05
3.0
±2.
1<
0.3
37.7
±1.
2N
oco
vera
geU
nkno
wn
W03
32+3
205
03:3
2:28
.23
+32:
05:4
5.0
15.8
6±
0.08
14.5
7±
0.06
9.79
±0.
066.
50±
0.07
−2.2
±2.
0<
0.1
42.1
±1.
3N
oco
vera
geU
nkno
wn
W03
42+3
753
03:4
2:22
.94
+37:
53:3
0.7
15.1
3±
0.04
14.4
2±
0.05
9.39
±0.
046.
32±
0.06
0.3
±2.
1<
0.2
154.
5±
5.5
No
cove
rage
0.47
W03
52+1
947
03:5
2:05
.35
+19:
47:0
1.2
16.6
5±
0.10
14.5
8±
0.06
9.74
±0.
057.
39±
0.13
1.0
±2.
1<
0.6
17.7
±0.
7N
oco
vera
geU
nkno
wn
W04
04+0
712
04:0
4:40
.93
+07:
12:1
9.2
16.6
4±
0.09
15.0
6±
0.08
10.0
2±
0.05
7.14
±0.
092.
3±
1.9
<0.
218
9.5
±5.
7N
oco
vera
geU
nkno
wn
W04
43+0
643
04:4
3:32
.56
+06:
43:1
8.1
16.5
7±
0.09
14.9
1±
0.09
9.38
±0.
057.
13±
0.14
6.8
±3.
7<
0.6
17.9
±0.
7N
oco
vera
geU
nkno
wn
W10
25+6
128
10:2
5:09
.87
+61:
28:3
2.7
16.0
3±
0.05
13.6
6±
0.03
8.19
±0.
025.
74±
0.04
2.7
±2.
0<
0.1
60.2
±2.
230
.68
±0.
14U
nkno
wn
W10
46−0
250
10:4
6:32
.81
−02:
50:3
0.7
16.5
5±
0.09
14.4
8±
0.06
10.0
7±
0.07
7.07
±0.
10−0
.4±
2.1
<0.
379
.1±
2.4
85.1
0±
0.13
Unk
now
nW
1107
+342
111
:07:
34.3
4+3
4:21
:18.
715
.02
±0.
0312
.79
±0.
038.
93±
0.03
7.01
±0.
092.
2±
2.0
<0.
522
.3±
0.8
20.5
6±
0.13
Unk
now
nW
1210
+475
012
:10:
27.8
8+4
7:50
:03.
216
.91
±0.
0914
.96
±0.
079.
66±
0.04
7.08
±0.
093.
4±
2.3
<0.
723
.7±
0.1
26.1
±0.
9U
nkno
wn
W12
12+4
659
12:1
2:04
.91
+ 46:
59:5
8.9
16.0
7±
0.05
13.9
2±
0.04
9.61
±0.
047.
26±
0.11
3.3
±2.
5<
0.8
21.2
±0.
721
.69
±0.
15U
nkno
wn
W14
09+1
732
14:0
9:28
.83
+17:
32:0
4.3
17.3
9±
0.13
16.0
6±
0.14
10.0
7±
0.05
7.05
±0.
085.
2±
2.0
<0.
714
.8±
0.6
21.4
9±
0.27
Unk
now
nW
1428
+111
314
:28:
59.6
9+1
1:13
:18.
716
.68
±0.
0715
.22
±0.
079.
63±
0.04
7.21
±0.
082.
2±
2.2
<0.
612
.2±
0.5
9.92
±0.
151.
6W
1501
+132
415
:01:
38.3
6+1
3:24
:49.
914
.33
±0.
0312
.14
±0.
028.
18±
0.02
6.55
±0.
05−2
.8±
2.2
<0.
125
0.2
±7.
525
4.44
±0.
140.
505
W15
17+3
523
15:1
7:58
.61
+35:
23:5
4.3
15.6
6±
0.04
13.4
7±
0.03
9.03
±0.
036.
51±
0.05
−0.9
±1.
9<
0.1
41.0
±1.
342
.14
±0.
151.
515
W16
30+5
126
16:3
0:36
.23
+51:
26:1
2.7
15.5
6±
0.05
14.1
1±
0.03
9.58
±0.
037.
06±
0.06
1.7
±1.
9<
0.4
105.
4±
3.2
100.
81±
0.14
Unk
now
nW
1703
+261
517
:03:
34.2
1+2
6:15
:11.
115
.45
±0.
0413
.65
±0.
039.
00±
0.03
6.95
±0.
083.
2±
2.0
<0.
556
.0±
1.7
58.6
4±
0.15
Unk
now
nW
1717
+531
317
:17:
05.9
2+5
3:13
:42.
615
.49
±0.
0513
.70
±0.
039.
49±
0.03
7.19
±0.
073.
5±
2.5
<0.
820
.2±
0.7
13.8
2±
0.14
2.71
7W
2126
−010
321
:26:
19.9
7−0
1:03
:54.
315
.01
±0.
0413
.17
±0.
038.
84±
0.03
7.29
±0.
131.
8±
2.0
<0.
612
.9±
0.9
No
cove
rage
0.60
7W
2133
−141
921
:33:
56.5
1−1
4:19
:04.
615
.88
±0.
0614
.12
±0.
059.
65±
0.05
6.85
±0.
091.
6±
1.8
<0.
422
.3±
1.1
No
cove
rage
Unk
now
nW
2212
−125
322
:12:
05.0
5−1
2:53
:47.
015
.60
±0.
0514
.51
±0.
069.
55±
0.05
6.89
±0.
10−0
.1±
2.1
<0.
312
5.7
±4.
4N
oco
vera
geU
nkno
wn
W22
22+0
951
22:2
2:48
.76
+09:
51:2
9.2
15.7
9±
0.05
13.9
7±
0.04
9.67
±0.
047.
16±
0.11
3.1
±2.
0<
0.6
17.1
±0.
7N
oco
vera
geU
nkno
wn
W22
26+0
025
22:2
6:25
.12
+00:
25:0
9.6
15.8
1±
0.05
14.4
0±
0.05
9.50
±0.
057.
07±
0.11
3.4
±1.
9<
0.6
17.0
±1.
015
.76
±0.
100.
676
W22
30−0
720
22:3
0:07
.75
−07:
20:5
9.9
15.4
9±
0.04
13.6
7±
0.04
9.26
±0.
046.
95±
0.10
1.4
±1.
8<
0.4
46.4
±1.
5N
oco
vera
ge0.
444
W23
25−0
429
23:2
5:05
.07
−04:
29:4
8.1
15.8
8±
0.05
14.4
9±
0.06
9.65
±0.
057.
11±
0.10
2.9
±2.
1<
0.6
149.
8±
4.5
No
cove
rage
1.73
7
MNRAS 448, 3325–3338 (2015)
at University of L
eicester on January 27, 2016http://m
nras.oxfordjournals.org/D
ownloaded from
3330 S. F. Jones et al.
Figure 1. SCUBA-2 850-µm 1.5-arcmin radius maps of the four detected targets: W0849+3033, W2212+3326, W2331−1411 and W2345+3120. The solidcircles show the 15-arcsec beam-sized apertures centred on the WISE positions of the targets. Serendipitous sources brighter than 3σ and within 1.5 arcmin of theWISE target are shown by the dotted 15-arcsec beam-sized circles, and serendipitous sources brighter than 4σ are shown by a dotted 15-arcsec beam-sized circlesurrounded by a solid black circle. It is shown that the number of detected serendipitous SMG sources is independent of the detection of the WISE/radio-selectedAGN target, when compared to Fig. 2. The colour flux bar at the bottom is in Jy. North is up, east is to the left.
and (W2 − W3) = 6.13. When K-correcting the Hot DOG WISEcolours to WISE/radio-selected AGN redshifts, the WISE coloursexpected are (W1 − W2) = 3.56 and (W2 − W3) = 6.38. TheWISE colours show that the Hot DOGs appear to be mid-IR red-der, and could be due to the sources having more obscuration thanthe WISE/radio-selected AGNs, which can be seen in the SEDs inFig. 5 when compared to the SEDs in fig. 5 from Jones et al. (2014).Alternatively, it could be because the Hot DOGs are typically at ahigher redshift, and were selected to be mid-IR redder.
4.2.2 SCUBA-2-derived SEDs
Normalized to the WISE data at rest frame 3 µm that lies withinthe WISE rest-frame wavelength range for all of our targets, theSCUBA-2 data in the normalized SED show that the detectedWISE/radio-selected AGNs have less submm emission than thePolletta torus template, with an average submm flux three timesless than the template; Fig. 5. Most of the undetected WISE/radio-selected AGNs have limits that demand their submm emission tobe less than the Polletta torus template, with a flux difference factorrange of 1–9. Less submm emission is also seen in the SEDs ofHot DOGs (Wu et al. 2012; Jones et al. 2014). This leads to thesuggestion that the WISE/radio-selected AGNs have less cold dustin the host galaxy and/or on the outer edge of the torus, and hence
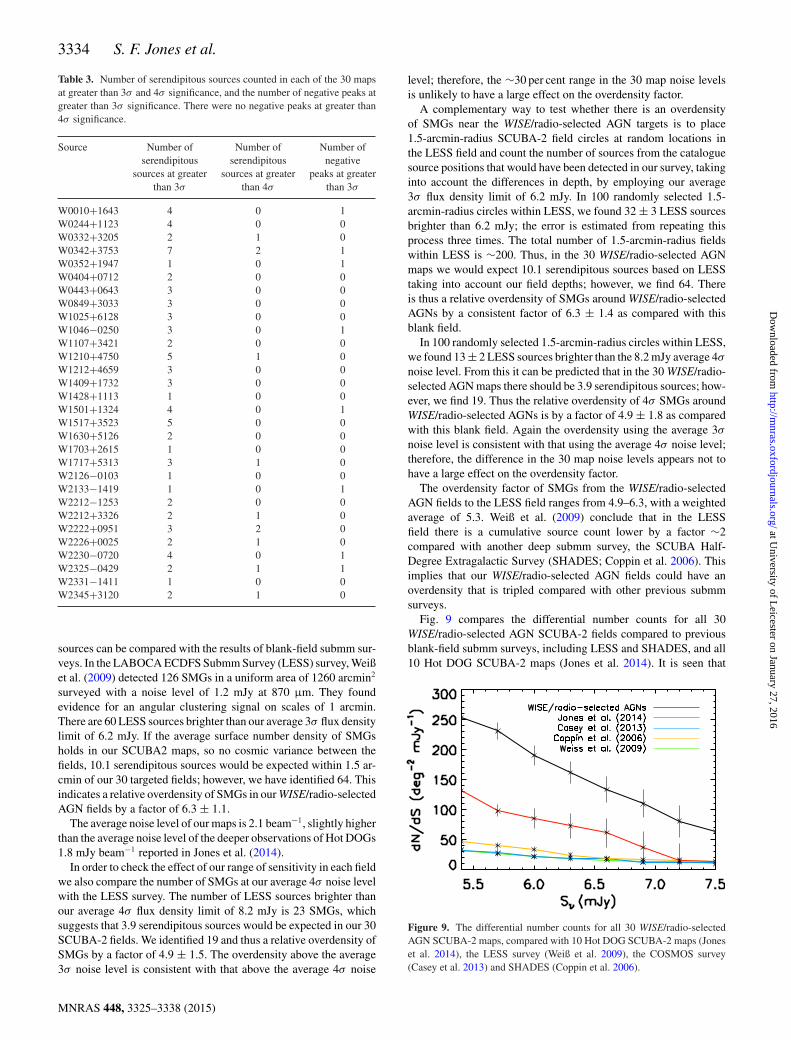
the torus could be denser and smaller than assumed in the template.Alternatively, less submm emission could be due to excess mid-IRemission from AGN heating relative to the torus template (Wu et al.2012). The 22-µm (W4) flux densities and the 850-µm flux den-sities of the 30 WISE/radio-selected AGNs and the 10 Hot DOGsare comparable, as shown in Fig. 7: the serendipitous SMG sourcesdetected around the WISE/radio-selected AGNs that have WISEdata are also plotted in blue and will be discussed in Section 6.2.The Hot DOGs in Jones et al. (2014) are submm brighter, because60 per cent Hot DOGs are submm detected compared to 13 per centWISE/radio-selected AGNs; the average submm flux of detectedHot DOGs was 8.3 ± 1.8 mJy, which is similar to the averagesubmm flux of detected WISE/radio-selected AGNs, 8.1 ± 2.2 mJy.However, the Hot DOGs are typically at z ∼ 2.7, compared toz ∼ 1.7 for the WISE/radio-selected AGNs. Considering that whenK-correcting the WISE/radio-selected AGNs 850-µm flux densityto the Hot DOG redshift, it should be S850 µm 16 ± 3 mJy, indicat-ing the WISE/radio-selected AGNs are submm fainter than the HotDOGs. However, this is only an estimate because there are only asmall number (10) known redshifts.
To investigate if the SEDs are dominated by warm or cool dustthe submm to mid-IR ratios (F850 µm/F22 µm) of the 30 targetsin the observed frame are listed in Table 1; for undetected targets,the 850-µm 2σ upper limits are reported. The weighted averageF850 µm/F22 µm of the four detected targets is 0.7 ± 0.2, where
MNRAS 448, 3325–3338 (2015)
at University of L
eicester on January 27, 2016http://m
nras.oxfordjournals.org/D
ownloaded from
WISE/radio-selected AGN submm observations 3331
Figure 2. SCUBA-2 850-µm 1.5-arcmin radius maps of a sample of four undetected targets ordered by RA Dec.: W0010+1643, W0244+1123, W0332+3205and W0342+3753. The solid circles show the 15-arcsec beam-sized apertures centred on the WISE positions of the targets. Serendipitous sources brighter than3σ and within 1.5 arcmin of the WISE target are shown by the dotted 15-arcsec beam-sized circles, and serendipitous sources brighter than 4σ are shown bythe dotted 15-arcsec beam-sized circle surrounded by a solid black circle. It is shown that the number of detected serendipitous SMG sources is independentof the detection of the WISE/radio-selected AGN target, when compared to Fig. 1. The colour flux bar at the bottom is in Jy. North is up, east is to the left.
Figure 3. SCUBA-2 850-µm 1.5-arcmin radius maps showing the central region of the first target when ordered by RA Dec. W0010+1643 and the fieldwith the largest number of detected serendipitous SMG sources (7) W0342+3753, with flux density contours: white represents negative 3σ , blue representsnegative 2σ , purple represents positive 2σ and red represents positive 3σ . North is up, east is to the left.
MNRAS 448, 3325–3338 (2015)
at University of L
eicester on January 27, 2016http://m
nras.oxfordjournals.org/D
ownloaded from
3332 S. F. Jones et al.
Figure 4. SCUBA-2 850-µm 1.5-arcmin radius map showing the centralregions of the maps of the 26 undetected targets stacked together. The circleshows the central 15 arcsec area. The colour flux bar at the bottom is in Jy.North is up, east is to the left.
Figure 5. SEDs of the 10 WISE/radio-selected AGNs with known redshifts,including the 850-µm SCUBA-2 data in rest-frame wavelengths with Arp220, Mrk 231, QSO 1, QSO 2, Torus and Spiral Sb galaxy templates fromPolletta et al. (2007), normalized at rest frame 3 µm. Detections are rep-resented by filled circles, while 2σ upper limits are represented by arrows.The data points for the WISE/radio-selected AGNs are connected for clarity,and do not represent the true SED. The 10 WISE/radio-selected AGNs arenot well-fitted by the standard AGN templates, with extra dust extinctionrequired, which is consistent with Hot DOGs (Jones et al. 2014).
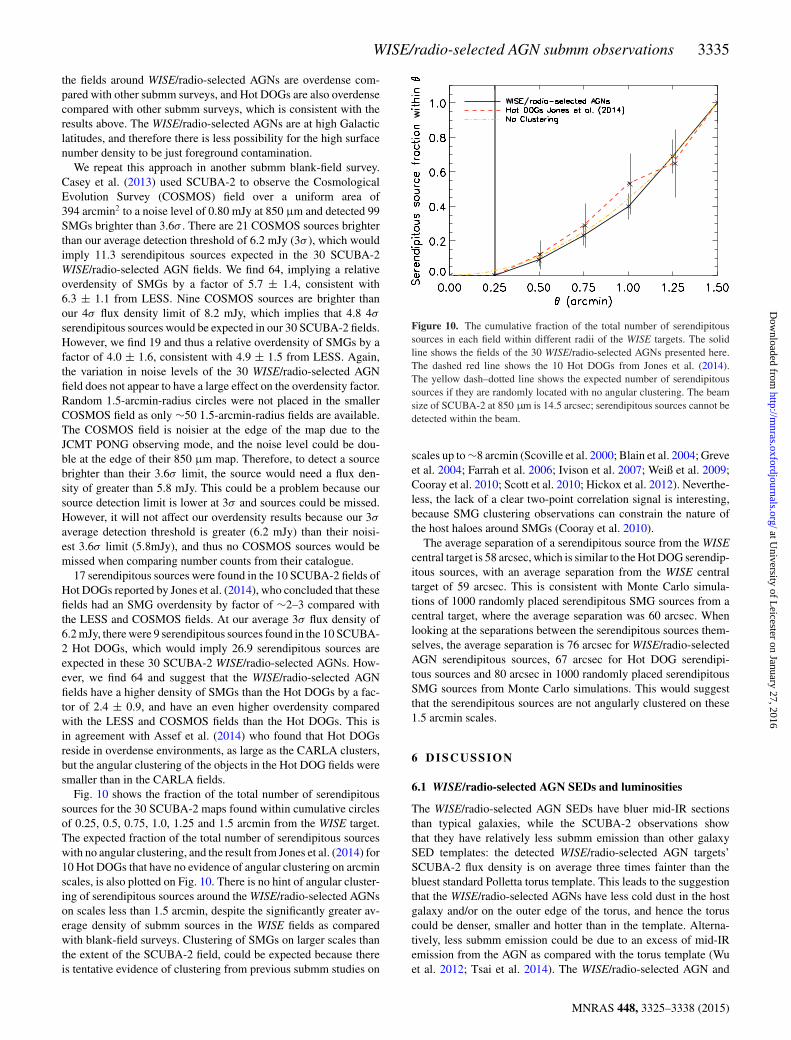
the error is the weighted standard error. This is consistent with theweighted average F850 µm/F22 µm = 0.6 ± 0.1 of Hot DOGs (Joneset al. 2014). Fig. 8 shows these ratios in the observed sample and forthe Polletta AGN torus templates as a function of redshift. Most ofthe targets have a lower submm to mid-IR flux ratio than the torustemplate (Fig. 8), but show no sign of an expected K-correction withredshift as expected from the template SEDs: in particular the fivehighest redshift WISE/radio-selected AGNs have submm emissionthat lies beneath the torus template, and similar observed submmto mid-IR ratios to the lower redshift WISE/radio-selected AGNs.They also have the most luminous luminosities dominated by the
Figure 6. Mid-IR SEDs of the 20 WISE/radio-selected AGNs showing therange of WISE data, in observed-frame wavelengths Arp 220, Mrk 231,QSO 1, QSO 2, Torus and Spiral Sb galaxy templates (Polletta et al. 2007)redshifted to z = 2 and normalized at observed frame 12 µm. Detectionsare represented by filled circles, while 2σ upper limits are represented byarrows. The data points for the WISE/radio-selected AGNs are connectedfor clarity, and do not represent the true SED.
Figure 7. The W4 (22-µm) flux density versus 850-µm flux density forthe 30 WISE/radio-selected AGNs in black, the 10 Hot DOGs in red (Joneset al. 2014) and the 39 serendipitous SMG sources detected around theWISE/radio-selected AGNs that have WISE data in blue. Detections arerepresented by filled circles, while 2σ upper limits are represented byarrows.
mid-IR emission, which could suggest that they have hotter effectivedust temperatures compared with the rest of the sample. This is inagreement with the results from submm observations of Hot DOGs(Wu et al. 2012; Jones et al. 2014), and suggest that Hot DOGs andWISE/radio-selected AGNs are both dominated by warm dust, withlower F850 µm/F22 µm than standard torus SED templates.
4.3 Luminosities
A conservative lower limit to the total IR luminosities of the galaxieswas estimated by connecting all the WISE and SCUBA-2 data pointswith power laws and then integrating, without extrapolating beyondthe range of the data in wavelength, (L8 µm−SCUBA2), the targetswithout redshift have assumed redshifts of z = 2.0. This luminosity
MNRAS 448, 3325–3338 (2015)
at University of L
eicester on January 27, 2016http://m
nras.oxfordjournals.org/D
ownloaded from
WISE/radio-selected AGN submm observations 3333
Figure 8. The submm to mid-IR ratio (F850 µm/F22 µm) of the 10 targetswith known redshifts. The detected targets with unknown redshifts havesolid lines, and the undetected targets have dashed lines across the redshiftrange 0.3 ≤ z ≤ 3. The red solid line represents the Polletta torus template(Polletta et al. 2007) as a function of redshift, and 2σ upper limits arerepresented by arrows.
is a very conservative estimate because any strong peak in the SEDwould not be included in the power-law interpolation, and it spansa minimal wavelength range. The resulting L8 µm−SCUBA2 valuesfor the 30 WISE/radio-selected AGNs are presented in Table 2.The four detected targets have a range from (1.7 ± 2.5) × 1013 to(6.2 ± 1.7) × 1013 L�, if their redshifts are all consistent with thesubset of 10 targets with known redshifts z ∼ 0.4–2.9, using z = 2.This classifies them as HyLIRGs (see footnote 2).
We also use the SCUBA-2 data to limit the luminosity of an un-derlying extended host galaxy not associated with the WISE/radio-selected AGN, powered by star-forming activity. A spiral (Sb)galaxy SED template and a warmer ULIRG/starburst-type (Arp 220)SED template were normalized to account for all of the SCUBA-2850-µm flux density, and then the maximum total luminosity ofthese components of the SED were estimated by integrating un-der the Sb or Arp 220 template. This approach assumes that anunderlying extended dusty galaxy, disconnected from the mid-IRemission of the AGN, accounts for all of the measured SCUBA-2flux. It is assumed to be solely due to star formation rather thanan AGN. An Sb host galaxy template cannot exceed ∼4 per cent ofthe inferred WISE/radio-selected AGN luminosity from the four de-tected targets. This would give a Sb luminosity of 4.9 × 10¹² L�,80 times more luminous than the Milky Way, with an equivalentstar formation rate (SFR) of ∼110 M� yr−1. An Arp 220 ULIRGtemplate that accounts for all the 850 µm flux has a luminosity of1.1 × 1013 L�, ∼10 per cent of the inferred WISE/radio-selectedAGN luminosity from the four detected targets, with an equivalentSFR of ∼250 M� yr−1. This emphasizes that the full WISE/radio-selected AGN SED from 8–1000 µm has a small contribution fromcold far-IR dust traced by the SCUBA-2 observations, and is domi-nated by hot dust and mid-IR emission from the AGN. This is con-sistent with the results from SCUBA-2 observations of Hot DOGs,which found that an underlying Sb-type galaxy SED template con-tributes less than 2 per cent to the typical total Hot DOG IR luminos-ity; however, an Arp 220-type galaxy SED template contributes lessthan 55 per cent, this is because the Hot DOGs are submm brighterand could suggest there is more star-formation activity in Hot DOGscompared to WISE/radio-selected AGNs.
Table 2. The total IR luminosities (8µm − SCUBA2) ofthe 30 WISE/radio-selected AGNs derived by connectingall the WISE and SCUBA-2 data points with power lawsand then integrating. The top four have detections at 850µm and the bottom 26 have 2σ upper limits at 850 µm.The targets without redshift data, have assumed redshiftsof z = 2. The luminosities are shown in solar luminosities,3.84 × 1026 W.
Source Total IR luminosities (8µm − SCUBA2)(L�)
W0849+3033 1.7 ± 2.5 × 10¹³
W2212+3326 6.2 ± 1.7 × 10¹³
W2331−1411 1.8 ± 1.8 × 10¹³
W2345+3120 1.7 ± 2.6 × 10¹³
W0010+1643 <3.4 × 10¹³
W0244+1123 <3.7 × 10¹³
W0332+3205 <2.0 × 10¹³
W0342+3753 <7.5 × 10¹¹
W0352+1947 <1.4 × 10¹³
W0404+0712 <1.5 × 10¹³
W0443+0643 <2.9 × 10¹³
W1025+6128 <5.1 × 10¹³
W1046−0250 <1.4 × 10¹³
W1107+3421 <2.2 × 10¹³
W1210+4750 <1.5 × 10¹³
W1212+4659 <1.7 × 10¹³
W1409+1732 <1.7 × 10¹³
W1428+1113 <9.3 × 10¹²
W1501+1324 <1.2 × 10¹²
W1517+3523 <1.3 × 10¹³
W1630+5126 <1.7 × 10¹³
W1703+2615 <2.2 × 10¹³
W1717+5313 <3.8 × 10¹³
W2126−0103 <1.1 × 10¹²
W2133−1419 <1.8 × 10¹³
W2212−1253 <1.8 × 10¹³
W2222+0951 <1.6 × 10¹³
W2226+0025 <1.2 × 10¹²
W2230−0720 <4.9 × 10¹¹
W2325−0429 <1.2 × 10¹³
5 E N V I RO N M E N T S A RO U N DWISE/ RADI O-SELECTED AG NS
Serendipitous SMG sources are detected in the deepest SCUBA-21.5-arcmin-radius regions around the WISE/radio-selected AGNs.To investigate if there is an overdensity of SMGs in the WISE/radio-selected AGN fields, the serendipitous source number counts arecompared with those in two different blank-field submm surveys,in a similar method to Jones et al. (2014). To provide another test,1.5-arcmin-radius circles were placed at random in a blank-fieldsubmm survey and the number of galaxies counted, again in a similarmethod to Jones et al. (2014). The differential number counts arethen measured and compared to three different blank-field submmsurveys.
81 serendipitous 850 µm sources were detected at greater than 3σ
in the 30 SCUBA-2 maps, and 11 sources were detected at greaterthan 4σ ; see Table 3. The total area surveyed was 212 arcmin2,or about 4000 SCUBA-2 850 µm beams. There are 8±3 negativepeaks in the 30 maps above the same 3σ threshold (see Table 3),consistent with the six 3σ negative peaks expected from Gaussiannoise, with width of the SCUBA-2 FWHM beam (14 arcsec).
To see if there is evidence for an overdensity of SMGs in the30 WISE/radio-selected AGNs fields, the number of serendipitous
MNRAS 448, 3325–3338 (2015)
at University of L
eicester on January 27, 2016http://m
nras.oxfordjournals.org/D
ownloaded from
3334 S. F. Jones et al.
Table 3. Number of serendipitous sources counted in each of the 30 mapsat greater than 3σ and 4σ significance, and the number of negative peaks atgreater than 3σ significance. There were no negative peaks at greater than4σ significance.
Source Number of Number of Number ofserendipitous serendipitous negative
sources at greater sources at greater peaks at greaterthan 3σ than 4σ than 3σ
W0010+1643 4 0 1W0244+1123 4 0 0W0332+3205 2 1 0W0342+3753 7 2 1W0352+1947 1 0 1W0404+0712 2 0 0W0443+0643 3 0 0W0849+3033 3 0 0W1025+6128 3 0 0W1046−0250 3 0 1W1107+3421 2 0 0W1210+4750 5 1 0W1212+4659 3 0 0W1409+1732 3 0 0W1428+1113 1 0 0W1501+1324 4 0 1W1517+3523 5 0 0W1630+5126 2 0 0W1703+2615 1 0 0W1717+5313 3 1 0W2126−0103 1 0 0W2133−1419 1 0 1W2212−1253 2 0 0W2212+3326 2 1 0W2222+0951 3 2 0W2226+0025 2 1 0W2230−0720 4 0 1W2325−0429 2 1 1W2331−1411 1 0 0W2345+3120 2 1 0
sources can be compared with the results of blank-field submm sur-veys. In the LABOCA ECDFS Submm Survey (LESS) survey, Weißet al. (2009) detected 126 SMGs in a uniform area of 1260 arcmin2
surveyed with a noise level of 1.2 mJy at 870 µm. They foundevidence for an angular clustering signal on scales of 1 arcmin.There are 60 LESS sources brighter than our average 3σ flux densitylimit of 6.2 mJy. If the average surface number density of SMGsholds in our SCUBA2 maps, so no cosmic variance between thefields, 10.1 serendipitous sources would be expected within 1.5 ar-cmin of our 30 targeted fields; however, we have identified 64. Thisindicates a relative overdensity of SMGs in our WISE/radio-selectedAGN fields by a factor of 6.3 ± 1.1.
The average noise level of our maps is 2.1 beam−1, slightly higherthan the average noise level of the deeper observations of Hot DOGs1.8 mJy beam−1 reported in Jones et al. (2014).
In order to check the effect of our range of sensitivity in each fieldwe also compare the number of SMGs at our average 4σ noise levelwith the LESS survey. The number of LESS sources brighter thanour average 4σ flux density limit of 8.2 mJy is 23 SMGs, whichsuggests that 3.9 serendipitous sources would be expected in our 30SCUBA-2 fields. We identified 19 and thus a relative overdensity ofSMGs by a factor of 4.9 ± 1.5. The overdensity above the average3σ noise level is consistent with that above the average 4σ noise
level; therefore, the ∼30 per cent range in the 30 map noise levelsis unlikely to have a large effect on the overdensity factor.
A complementary way to test whether there is an overdensityof SMGs near the WISE/radio-selected AGN targets is to place1.5-arcmin-radius SCUBA-2 field circles at random locations inthe LESS field and count the number of sources from the cataloguesource positions that would have been detected in our survey, takinginto account the differences in depth, by employing our average3σ flux density limit of 6.2 mJy. In 100 randomly selected 1.5-arcmin-radius circles within LESS, we found 32 ± 3 LESS sourcesbrighter than 6.2 mJy; the error is estimated from repeating thisprocess three times. The total number of 1.5-arcmin-radius fieldswithin LESS is ∼200. Thus, in the 30 WISE/radio-selected AGNmaps we would expect 10.1 serendipitous sources based on LESStaking into account our field depths; however, we find 64. Thereis thus a relative overdensity of SMGs around WISE/radio-selectedAGNs by a consistent factor of 6.3 ± 1.4 as compared with thisblank field.
In 100 randomly selected 1.5-arcmin-radius circles within LESS,we found 13 ± 2 LESS sources brighter than the 8.2 mJy average 4σ
noise level. From this it can be predicted that in the 30 WISE/radio-selected AGN maps there should be 3.9 serendipitous sources; how-ever, we find 19. Thus the relative overdensity of 4σ SMGs aroundWISE/radio-selected AGNs is by a factor of 4.9 ± 1.8 as comparedwith this blank field. Again the overdensity using the average 3σ
noise level is consistent with that using the average 4σ noise level;therefore, the difference in the 30 map noise levels appears not tohave a large effect on the overdensity factor.
The overdensity factor of SMGs from the WISE/radio-selectedAGN fields to the LESS field ranges from 4.9–6.3, with a weightedaverage of 5.3. Weiß et al. (2009) conclude that in the LESSfield there is a cumulative source count lower by a factor ∼2compared with another deep submm survey, the SCUBA Half-Degree Extragalactic Survey (SHADES; Coppin et al. 2006). Thisimplies that our WISE/radio-selected AGN fields could have anoverdensity that is tripled compared with other previous submmsurveys.
Fig. 9 compares the differential number counts for all 30WISE/radio-selected AGN SCUBA-2 fields compared to previousblank-field submm surveys, including LESS and SHADES, and all10 Hot DOG SCUBA-2 maps (Jones et al. 2014). It is seen that
Figure 9. The differential number counts for all 30 WISE/radio-selectedAGN SCUBA-2 maps, compared with 10 Hot DOG SCUBA-2 maps (Joneset al. 2014), the LESS survey (Weiß et al. 2009), the COSMOS survey(Casey et al. 2013) and SHADES (Coppin et al. 2006).
MNRAS 448, 3325–3338 (2015)
at University of L
eicester on January 27, 2016http://m
nras.oxfordjournals.org/D
ownloaded from
WISE/radio-selected AGN submm observations 3335
the fields around WISE/radio-selected AGNs are overdense com-pared with other submm surveys, and Hot DOGs are also overdensecompared with other submm surveys, which is consistent with theresults above. The WISE/radio-selected AGNs are at high Galacticlatitudes, and therefore there is less possibility for the high surfacenumber density to be just foreground contamination.
We repeat this approach in another submm blank-field survey.Casey et al. (2013) used SCUBA-2 to observe the CosmologicalEvolution Survey (COSMOS) field over a uniform area of394 arcmin2 to a noise level of 0.80 mJy at 850 µm and detected 99SMGs brighter than 3.6σ . There are 21 COSMOS sources brighterthan our average detection threshold of 6.2 mJy (3σ ), which wouldimply 11.3 serendipitous sources expected in the 30 SCUBA-2WISE/radio-selected AGN fields. We find 64, implying a relativeoverdensity of SMGs by a factor of 5.7 ± 1.4, consistent with6.3 ± 1.1 from LESS. Nine COSMOS sources are brighter thanour 4σ flux density limit of 8.2 mJy, which implies that 4.8 4σ
serendipitous sources would be expected in our 30 SCUBA-2 fields.However, we find 19 and thus a relative overdensity of SMGs by afactor of 4.0 ± 1.6, consistent with 4.9 ± 1.5 from LESS. Again,the variation in noise levels of the 30 WISE/radio-selected AGNfield does not appear to have a large effect on the overdensity factor.Random 1.5-arcmin-radius circles were not placed in the smallerCOSMOS field as only ∼50 1.5-arcmin-radius fields are available.The COSMOS field is noisier at the edge of the map due to theJCMT PONG observing mode, and the noise level could be dou-ble at the edge of their 850 µm map. Therefore, to detect a sourcebrighter than their 3.6σ limit, the source would need a flux den-sity of greater than 5.8 mJy. This could be a problem because oursource detection limit is lower at 3σ and sources could be missed.However, it will not affect our overdensity results because our 3σ
average detection threshold is greater (6.2 mJy) than their noisi-est 3.6σ limit (5.8mJy), and thus no COSMOS sources would bemissed when comparing number counts from their catalogue.
17 serendipitous sources were found in the 10 SCUBA-2 fields ofHot DOGs reported by Jones et al. (2014), who concluded that thesefields had an SMG overdensity by factor of ∼2–3 compared withthe LESS and COSMOS fields. At our average 3σ flux density of6.2 mJy, there were 9 serendipitous sources found in the 10 SCUBA-2 Hot DOGs, which would imply 26.9 serendipitous sources areexpected in these 30 SCUBA-2 WISE/radio-selected AGNs. How-ever, we find 64 and suggest that the WISE/radio-selected AGNfields have a higher density of SMGs than the Hot DOGs by a fac-tor of 2.4 ± 0.9, and have an even higher overdensity comparedwith the LESS and COSMOS fields than the Hot DOGs. This isin agreement with Assef et al. (2014) who found that Hot DOGsreside in overdense environments, as large as the CARLA clusters,but the angular clustering of the objects in the Hot DOG fields weresmaller than in the CARLA fields.
Fig. 10 shows the fraction of the total number of serendipitoussources for the 30 SCUBA-2 maps found within cumulative circlesof 0.25, 0.5, 0.75, 1.0, 1.25 and 1.5 arcmin from the WISE target.The expected fraction of the total number of serendipitous sourceswith no angular clustering, and the result from Jones et al. (2014) for10 Hot DOGs that have no evidence of angular clustering on arcminscales, is also plotted on Fig. 10. There is no hint of angular cluster-ing of serendipitous sources around the WISE/radio-selected AGNson scales less than 1.5 arcmin, despite the significantly greater av-erage density of submm sources in the WISE fields as comparedwith blank-field surveys. Clustering of SMGs on larger scales thanthe extent of the SCUBA-2 field, could be expected because thereis tentative evidence of clustering from previous submm studies on
Figure 10. The cumulative fraction of the total number of serendipitoussources in each field within different radii of the WISE targets. The solidline shows the fields of the 30 WISE/radio-selected AGNs presented here.The dashed red line shows the 10 Hot DOGs from Jones et al. (2014).The yellow dash–dotted line shows the expected number of serendipitoussources if they are randomly located with no angular clustering. The beamsize of SCUBA-2 at 850 µm is 14.5 arcsec; serendipitous sources cannot bedetected within the beam.
scales up to ∼8 arcmin (Scoville et al. 2000; Blain et al. 2004; Greveet al. 2004; Farrah et al. 2006; Ivison et al. 2007; Weiß et al. 2009;Cooray et al. 2010; Scott et al. 2010; Hickox et al. 2012). Neverthe-less, the lack of a clear two-point correlation signal is interesting,because SMG clustering observations can constrain the nature ofthe host haloes around SMGs (Cooray et al. 2010).
The average separation of a serendipitous source from the WISEcentral target is 58 arcsec, which is similar to the Hot DOG serendip-itous sources, with an average separation from the WISE centraltarget of 59 arcsec. This is consistent with Monte Carlo simula-tions of 1000 randomly placed serendipitous SMG sources from acentral target, where the average separation was 60 arcsec. Whenlooking at the separations between the serendipitous sources them-selves, the average separation is 76 arcsec for WISE/radio-selectedAGN serendipitous sources, 67 arcsec for Hot DOG serendipi-tous sources and 80 arcsec in 1000 randomly placed serendipitousSMG sources from Monte Carlo simulations. This would suggestthat the serendipitous sources are not angularly clustered on these1.5 arcmin scales.
6 D I SCUSSI ON
6.1 WISE/radio-selected AGN SEDs and luminosities
The WISE/radio-selected AGN SEDs have bluer mid-IR sectionsthan typical galaxies, while the SCUBA-2 observations showthat they have relatively less submm emission than other galaxySED templates: the detected WISE/radio-selected AGN targets’SCUBA-2 flux density is on average three times fainter than thebluest standard Polletta torus template. This leads to the suggestionthat the WISE/radio-selected AGNs have less cold dust in the hostgalaxy and/or on the outer edge of the torus, and hence the toruscould be denser, smaller and hotter than in the template. Alterna-tively, less submm emission could be due to an excess of mid-IRemission from the AGN as compared with the torus template (Wuet al. 2012; Tsai et al. 2014). The WISE/radio-selected AGN and
MNRAS 448, 3325–3338 (2015)
at University of L
eicester on January 27, 2016http://m
nras.oxfordjournals.org/D
ownloaded from
3336 S. F. Jones et al.
Hot DOG SEDs are both dominated by mid-IR emission; however,the WISE/radio-selected AGNs are submm fainter and mid-IR bluer.
The luminosities of the four detected targets (with a mean lumi-nosity of L8 µm−SCUBA2 = 2.9 × 10¹³ L�) are higher than thoseof typical SMGs, which have LIR = 8.5 × 10¹² L� (Chapman et al.2005; Kovacs et al. 2006), and DOGs, which have a mean luminosityLIR = 9 × 10¹² L� (Melbourne et al. 2012). High total IR lumi-nosities were also found for the WISE/radio-selected AGNs fromLonsdale et al. (submitted) with a range of LIR = 1012–1013.55 L�.Hot DOGs had higher luminosities, with a mean luminosity ofL8 µm−SCUBA2 = 5.3 × 10¹³ L� from Jones et al. (2014) and amean luminosity of LIR = 6.1 × 10¹³ L� from Wu et al. (2012).However, WISE-selected AGNs could be biased towards being themid-IR brightest and rarest galaxies, because they were selectedon the grounds of their bright mid-IR flux. Eight WISE-selectedLyman-alpha blobs (Bridge et al. 2013) were also found to be ul-traluminous galaxies from Herschel data (LIR = 2.3 × 10¹³ L�),and included a wider range of mid-IR fluxes with no WISE colourselection cut. This indicates that galaxies with extremely red WISEcolours have very luminous mid-IR properties.
WISE/radio-selected AGN SEDs are dominated by mid-IR emis-sion and are very luminous compared to other galaxy populations,suggesting the galaxies are very active from either star formationor AGN activity, and have large amounts of obscuring hot dust, thatcould be due to merging galaxies.
6.2 WISE/radio-selected AGN environments
Comparing number counts of the serendipitous sources in the 30WISE/radio-selected AGN fields with other submm surveys, im-plies there is an overdensity of SMGs in the 30 SCUBA-2 fields byfactor of ∼4–6. This is consistent with finding WISE/radio-selectedAGN in potentially overdense environments. This is an agreementwith ALMA results of another subset of WISE/radio-selected AGNsfrom the same main sample (Lonsdale et al., submitted), who de-tected 23 serendipitous SMG sources in 17 out of 49 fields, whichimplies an overdensity factor of ∼10 compared to expected mod-els and unbiased population number counts (Silva & Sajina 2014).There is double the overdensity of SMG serendipitous sources in theALMA fields than our SCUBA-2 fields when compared to previoussubmm surveys, which is due to lower flux density limits (Silva& Sajina 2014, had deeper observations with rms noise level of∼0.3–0.6 mJy beam−1, which is lower than our rms noise level of∼1.8–3.7 mJy beam−1) and smaller spatial scales (Silva & Sajina2014, observed ALMA fields with radius of 9 arcsec, which issmaller than our SCUBA-2 fields with radius of 90 arcsec). Silva &Sajina (2014) concluded that WISE/radio-selected AGNs reside inhighly clustered environments, but further redshift data are neededto determine if they are in protocluster regions.
Our SMG overdensity results are also consistent with previ-ous submm observations of HzRGs. The number of serendipitoussources around seven HzRGs in SCUBA maps were twice theexpected number from other blank-field surveys (Stevens et al.2003): our SMG overdensity is higher compared with other blank-field surveys, by a greater factor of ∼4–6. There appears to be nocorrelation between the redshift of the WISE/radio-selected AGNand the number of serendipitous sources found in the fields aroundit; however, the numbers here are only modest and more redshiftdata are needed to confirm this.
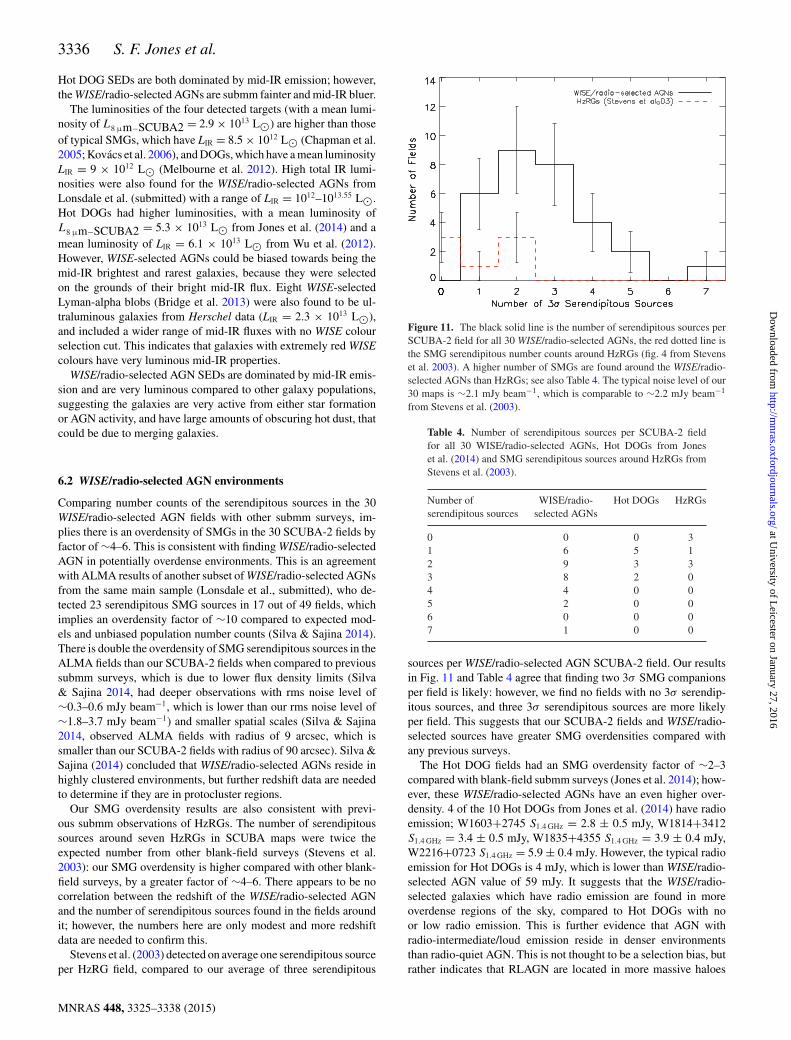
Stevens et al. (2003) detected on average one serendipitous sourceper HzRG field, compared to our average of three serendipitous
Figure 11. The black solid line is the number of serendipitous sources perSCUBA-2 field for all 30 WISE/radio-selected AGNs, the red dotted line isthe SMG serendipitous number counts around HzRGs (fig. 4 from Stevenset al. 2003). A higher number of SMGs are found around the WISE/radio-selected AGNs than HzRGs; see also Table 4. The typical noise level of our30 maps is ∼2.1 mJy beam−1, which is comparable to ∼2.2 mJy beam−1
from Stevens et al. (2003).
Table 4. Number of serendipitous sources per SCUBA-2 fieldfor all 30 WISE/radio-selected AGNs, Hot DOGs from Joneset al. (2014) and SMG serendipitous sources around HzRGs fromStevens et al. (2003).
Number of WISE/radio- Hot DOGs HzRGsserendipitous sources selected AGNs
0 0 0 31 6 5 12 9 3 33 8 2 04 4 0 05 2 0 06 0 0 07 1 0 0
sources per WISE/radio-selected AGN SCUBA-2 field. Our resultsin Fig. 11 and Table 4 agree that finding two 3σ SMG companionsper field is likely: however, we find no fields with no 3σ serendip-itous sources, and three 3σ serendipitous sources are more likelyper field. This suggests that our SCUBA-2 fields and WISE/radio-selected sources have greater SMG overdensities compared withany previous surveys.
The Hot DOG fields had an SMG overdensity factor of ∼2–3compared with blank-field submm surveys (Jones et al. 2014); how-ever, these WISE/radio-selected AGNs have an even higher over-density. 4 of the 10 Hot DOGs from Jones et al. (2014) have radioemission; W1603+2745 S1.4 GHz = 2.8 ± 0.5 mJy, W1814+3412S1.4 GHz = 3.4 ± 0.5 mJy, W1835+4355 S1.4 GHz = 3.9 ± 0.4 mJy,W2216+0723 S1.4 GHz = 5.9 ± 0.4 mJy. However, the typical radioemission for Hot DOGs is 4 mJy, which is lower than WISE/radio-selected AGN value of 59 mJy. It suggests that the WISE/radio-selected galaxies which have radio emission are found in moreoverdense regions of the sky, compared to Hot DOGs with noor low radio emission. This is further evidence that AGN withradio-intermediate/loud emission reside in denser environmentsthan radio-quiet AGN. This is not thought to be a selection bias, butrather indicates that RLAGN are located in more massive haloes
MNRAS 448, 3325–3338 (2015)
at University of L
eicester on January 27, 2016http://m
nras.oxfordjournals.org/D
ownloaded from
WISE/radio-selected AGN submm observations 3337
(Yates, Miller & Peacock 1989; Hill & Lilly 1991; Best, Longair& Roettgering 1998; Roche, Eales & Hippelein 1998; Best 2000;Donoso et al. 2010; Hatch et al. 2014). Our SMG overdensity couldindicate that WISE/radio-selected AGNs are signposts of protoclus-ter regions.
None of the serendipitous SMG sources in the WISE/radio-selected AGN and Hot DOG fields were detected in the NVSSor FIRST catalogues. However, 48 and 59 per cent of serendipitousSMG sources in the WISE/radio-selected AGN and Hot DOG fields,respectively, had counterparts in the AllWISE Source Catalog. Allserendipitous sources detected around WISE/radio-selected AGNswere detected in the W1 band, 74 per cent in the W2 band, 10 per centin the W3 band, and 0 per cent in the W4 band. All serendipitoussources detected around Hot DOGs were detected in the W1 band,90 per cent in the W2 band, 20 per cent in the W3 band, and 0 per centin the W4 band. Fig. 7 shows the W4 flux density versus SCUBA-2 850-µm flux density of the 39 serendipitous sources detectedaround the WISE/radio-selected AGNs that have WISE data, com-pared with WISE/radio-selected AGNs and Hot DOGs. From Fig. 7it can be seen that the serendipitous sources are less bright in W4and therefore, not as red in the mid-IR than WISE/radio-selectedAGNs and Hot DOGs. This implies they are normal SMGs, thathave S850 µm > 2 mJy, and are high-redshift galaxies with high IRluminosities believed to be from starburst activity, but are faint inoptical and near-IR wavelengths (Ivison et al. 1998; Eales et al.1999; Barger, Cowie & Richards 2000; Smail et al. 2000; Chapmanet al. 2001; Blain et al. 2002; Ivison et al. 2002, 2004; Pope et al.2006). Most of the serendipitous SMG sources will be at a similarredshift (1 ≤ z ≤ 3) to the WISE/radio-selected AGNs (Karim et al.2013), but some will be inevitably unassociated in redshift.
These WISE/radio-selected AGNs appear to be very powerfulAGN that have more mid-IR emission, and mid-IR opacity thanAGN in standard galaxy templates. Therefore, the WISE/radio-selected AGNs might be experiencing the most powerful AGNfeedback possible and could be an obscured AGN-dominated shortevolutionary phase of merging galaxies, for example the Hot DOGtarget W1814+3412 has three components of the same redshiftand within 50 kpc of each other (Eisenhardt et al. 2012). TheWISE/radio-selected AGNs also appear to reside in intriguing many-arcmin-scale overdensities of very luminous, dusty sources.
WISE/radio-selected AGNs have lower submm flux densities,higher radio emission, lower redshifts and denser environments thanHot DOGs. These could be due to Hot DOGs having a higher typicalredshift, and were selected to be mid-IR redder. WISE/radio-selectedAGNs and Hot DOGs appear to be consistent with a transientAGN-dominated phase of the major merger theory, but starburstactivity cannot be ruled out. The WISE/radio-selected AGNs appearto be signposts of overdense regions of active, luminous and dustygalaxies.
7 SU M M A RY
The results from SCUBA-2 850 µm observations of 30 WISE/radio-selected, high-redshift, luminous, dusty AGNs are as follows.
(i) The 30 WISE/radio-selected AGNs have SEDs that are notwell fitted by the current AGN templates (see Fig. 5); the bestfitting is the Polletta torus (Polletta et al. 2007) template.
(ii) The detected WISE/radio-selected AGNs have less cold dustthan the Polletta torus template, which could be because there is lesscold dust in the host galaxy, and/or the outer scale of the AGN torusin the WISE/radio-selected AGNs are smaller. Alternatively there
could be more intense mid-IR emission from hotter inner regions(Wu et al. 2012).
(iii) Despite being observed over a wide redshift range, the 10WISE/radio-selected AGNs with known redshift data show uniformsubmm to mid-IR ratios. The highest redshift, most luminous tar-gets, could thus have hotter dust temperatures than assumed in thetemplates. However, the number of targets with known redshiftsis currently only modest (10) and the selection of the targets issensitive to redshift, owing to very red WISE colours.
(iv) The detected WISE/radio-selected AGNs have high IR lu-minosities, L8 µm−SCUBA2 ≥ 1013 L�, confirming they areHyLIRGs. These are conservative values as any pronounced peak ofthe SED would increase these further. The undetected WISE/radio-selected AGNs have upper limit luminosities that are consistent withLIRGs.
(v) The luminosity of an underlying extended star-forminggalaxy cannot exceed a luminosity ∼4 per cent (for a cool spi-ral galaxy template) or ∼10 per cent (for a warmer ULIRG-likegalaxy template) as compared with the submm-detected typicalWISE/radio-selected AGNs luminosity. Our SCUBA-2 observationsconfirm that WISE/radio-selected AGNs are a mid-IR dominatedpopulation.
(vi) When comparing the submm galaxy counts of the 30 1.5-arcmin-radius SCUBA-2 maps observed here to blank-field surveys,there is an overdensity of SMGs on this scale by a factor 4–6, butno evidence for any angular clustering within these fields.
(vii) There is an SMG overdensity of order ∼2 when compar-ing WISE/radio-selected AGNs to Hot DOGs, and suggests thatWISE/radio-selected AGNs are signposts of overdense regions ofactive, luminous and dusty galaxies in the sky.
(viii) WISE/radio-selected AGNs and Hot DOGs appear to beconsistent with a transient AGN-dominated phase of the majormerger theory, but starburst activity cannot be ruled out.
AC K N OW L E D G E M E N T S
The authors would like to thank the anonymous referee for his/hercomments and suggestions, which have greatly improved this paper.
SFJ gratefully acknowledges support from the University of Le-icester Physics & Astronomy Department. This publication makesuse of data products from the WISE, which is a joint project of theUniversity of California, Los Angeles, and the Jet Propulsion Lab-oratory/California Institute of Technology, funded by the NationalAeronautics and Space Administration.
The James Clerk Maxwell Telescope has historically been op-erated by the Joint Astronomy Centre on behalf of the Scienceand Technology Facilities Council of the United Kingdom, the Na-tional Research Council of Canada and the Netherlands Organiza-tion for Scientific Research. Additional funds for the constructionof SCUBA-2 were provided by the Canada Foundation for Innova-tion. The programme IDs under which the data were obtained wereM12BU07 and M13BU02.
RJA was supported by Gemini-CONICYT grant number32120009.
R E F E R E N C E S
Assef R. J. et al., 2013, ApJ, 772, 26Assef R. J. et al., 2014, preprint (arXiv:1408.1092)Barger A. J., Cowie L. L., Richards E. A., 2000, AJ, 119, 2092Barnes J. E., Hernquist L., 1992, ARA&A, 30, 705Becker R. H., White R. L., Helfand D. J., 1995, ApJ, 450, 559
MNRAS 448, 3325–3338 (2015)
at University of L
eicester on January 27, 2016http://m
nras.oxfordjournals.org/D
ownloaded from
3338 S. F. Jones et al.
Best P. N., 2000, MNRAS, 317, 720Best P. N., Longair M. S., Roettgering H. J. A., 1998, MNRAS, 295, 549Blain A. W., Smail I., Ivison R. J., Kneib J.-P., Frayer D. T., 2002, Phys.
Rep., 369, 111Blain A. W., Chapman S. C., Smail I., Ivison R., 2004, ApJ, 611, 725Borys C., Scott D., Chapman S., Halpern M., Nandra K., Pope A., 2004,
MNRAS, 355, 485Bridge C. R. et al., 2012, preprint (arXiv:1205.4030)Bridge C. R. et al., 2013, ApJ, 769, 91Casey C. M. et al., 2013, MNRAS, 436, 1919Chapin E. L., Berry D. S., Gibb A. G., Jenness T., Scott D., Tilanus R. P. J.,
Economou F., Holland W. S., 2013, MNRAS, 430, 2545Chapman S. C., Richards E. A., Lewis G. F., Wilson G., Barger A. J., 2001,
ApJ, 548, L147Chapman S. C., Blain A. W., Smail I., Ivison R. J., 2005, ApJ, 622, 772Chapman S. C., Blain A., Ibata R., Ivison R. J., Smail I., Morrison G., 2009,
ApJ, 691, 560Condon J. J., Cotton W. D., Greisen E. W., Yin Q. F., Perley R. A., Taylor
G. B., Broderick J. J., 1998, AJ, 115, 1693Cooray A. et al., 2010, A&A, 518, L22Coppin K. et al., 2006, MNRAS, 372, 1621Cutri R. M. et al., 2003, VizieR Online Data Catalog, 2246, 0de Grijp M. H. K., Lub J., Miley G. K., 1987, A&AS, 70, 95Dempsey J. T. et al., 2013, MNRAS, 430, 2534Donley J. L. et al., 2012, ApJ, 748, 142Donoso E., Li C., Kauffmann G., Best P. N., Heckman T. M., 2010, MNRAS,
407, 1078Donoso E., Yan L., Stern D., Assef R. J., 2014, ApJ, 789, 44Eales S., Lilly S., Gear W., Dunne L., Bond J. R., Hammer F., Le Fevre O.,
Crampton D., 1999, ApJ, 515, 518Eisenhardt P. R. M. et al., 2012, ApJ, 755, 173Fabian A. C., 2012, ARA&A, 50, 455Falder J. T. et al., 2010, MNRAS, 405, 347Fanti C. et al., 2000, A&A, 358, 499Farrah D. et al., 2001, MNRAS, 326, 1333Farrah D. et al., 2006, ApJ, 641, L17Farrah D. et al., 2012, ApJ, 745, 178Galametz A. et al., 2010, A&A, 522, A58Galametz A. et al., 2012, ApJ, 749, 169Geach J. E. et al., 2013, MNRAS, 432, 53Giacintucci S., Venturi T., Murgia M., Dallacasa D., Athreya R., Bardelli
S., Mazzotta P., Saikia D. J., 2007, A&A, 476, 99Gilli R., Comastri A., Hasinger G., 2007, A&A, 463, 79Greve T. R., Ivison R. J., Bertoldi F., Stevens J. A., Dunlop J. S., Lutz D.,
Carilli C. L., 2004, MNRAS, 354, 779Gruppioni C. et al., 2008, ApJ, 684, 136Hatch N. A. et al., 2014, MNRAS, 445, 280Hickox R. C. et al., 2009, ApJ, 696, 891Hickox R. C. et al., 2012, MNRAS, 421, 284Hill G. J., Lilly S. J., 1991, ApJ, 367, 1Holland W. S. et al., 2013, MNRAS, 430, 2513Hopkins P. F., Hernquist L., Cox T. J., Di Matteo T., Robertson B., Springel
V., 2006, ApJS, 163, 1Hopkins P. F., Hernquist L., Cox T. J., Keres D., 2008, ApJS, 175, 356Ivison R. J., Smail I., Le Borgne J.-F., Blain A. W., Kneib J.-P., Bezecourt
J., Kerr T. H., Davies J. K., 1998, MNRAS, 298, 583Ivison R. J. et al., 2002, MNRAS, 337, 1Ivison R. J. et al., 2004, ApJS, 154, 124Ivison R. J. et al., 2007, MNRAS, 380, 199Jarrett T. H. et al., 2011, ApJ, 735, 112Jones S. F. et al., 2014, MNRAS, 443, 146Karim A. et al., 2013, MNRAS, 432, 2Keel W. C., de Grijp M. H. K., Miley G. K., Zheng W., 1994, A&A, 283,
791
Kellermann K. I., 1974, in Verschuur G. L., Kellermann K. I., van Brunt V.,eds, Radio Galaxies and Quasars. Springer-Verlag, Berlin, p. 320
Kovacs A., Chapman S. C., Dowell C. D., Blain A. W., Ivison R. J., SmailI., Phillips T. G., 2006, ApJ, 650, 592
Krolik J. H., Begelman M. C., 1988, ApJ, 329, 702Lacy M. et al., 2004, ApJS, 154, 166Lonsdale C. J., Lonsdale C. J., Smith H. E., Diamond P. J., 2003, ApJ, 592,
804Lonsdale C. J., Farrah D., Smith H. E., 2006, Astrophysics Update 2.
Springer-Verlag, Berlin, p. 285Low F. J., Cutri R. M., Huchra J. P., Kleinmann S. G., 1988, ApJ, 327, L41Mateos S., Alonso-Herrero A., Carrera F. J., Blain A., Severgnini P., Cac-
cianiga A., Ruiz A., 2013, MNRAS, 434, 941Mayo J. H., Vernet J., De Breuck C., Galametz A., Seymour N., Stern D.,
2012, A&A, 539, A33Melbourne J. et al., 2012, AJ, 143, 125Neugebauer G. et al., 1984, ApJ, 278, L1Polletta M. d. C. et al., 2006, ApJ, 642, 673Polletta M. et al., 2007, ApJ, 663, 81Polletta M., Weedman D., Honig S., Lonsdale C. J., Smith H. E., Houck J.,
2008, ApJ, 675, 960Pope A. et al., 2006, MNRAS, 370, 1185Roche N., Eales S., Hippelein H., 1998, MNRAS, 295, 946Sacchi N. et al., 2009, ApJ, 703, 1778Sanders D. B., Mirabel I. F., 1996, ARA&A, 34, 749Sanders D. B., Soifer B. T., Elias J. H., Madore B. F., Matthews K., Neuge-
bauer G., Scoville N. Z., 1988, ApJ, 325, 74Schweizer F., 1998, in Kennicutt R. C., Jr, Schweizer F., Barnes J. E., Friedli
D., Martinet L., Pfenniger D., eds, Galaxies: Interactions and InducedStar Formation: Saas-Fee Advanced Course 26. Springer, Berlin, p. 105
Scott S. E., Dunlop J. S., Serjeant S., 2006, MNRAS, 370, 1057Scott K. S. et al., 2010, MNRAS, 405, 2260Scoville N. Z. et al., 2000, AJ, 119, 991Seymour N. et al., 2012, ApJ, 755, 146Silva A. L., Sajina A., 2014, Am. Astron. Soc. Meeting Abstr., 224, #222.13Smail I., Ivison R. J., Owen F. N., Blain A. W., Kneib J.-P., 2000, ApJ, 528,
612Spinoglio L., Malkan M. A., 1989, ApJ, 342, 83Stern D. et al., 2005, ApJ, 631, 163Stern D. et al., 2012, ApJ, 753, 30Stevens J. A. et al., 2003, Nature, 425, 264Stevens J. A., Jarvis M. J., Coppin K. E. K., Page M. J., Greve T. R., Carrera
F. J., Ivison R. J., 2010, MNRAS, 405, 2623Tommasin S., Spinoglio L., Malkan M. A., Fazio G., 2010, ApJ, 709, 1257Tsai C.-W. et al., 2014, preprint (arXiv:1410.1751)Umehata H. et al., 2014, MNRAS, 440, 3462Varenius E., Conway J. E., Martı-Vidal I., Aalto S., Beswick R., Costagliola
F., Klockner H.-R., 2014, A&A, 566, A15Veilleux S., Kim D.-C., Sanders D. B., 2002, ApJS, 143, 315Venemans B. P. et al., 2007, A&A, 461, 823Volonteri M., Natarajan P., Gultekin K., 2011, ApJ, 737, 50Weiß A. et al., 2009, ApJ, 707, 1201Wright E. L. et al., 2010, AJ, 140, 1868Wu J. et al., 2012, ApJ, 756, 96Wylezalek D. et al., 2013, ApJ, 769, 79Wylezalek D. et al., 2014, ApJ, 786, 17Yan L. et al., 2005, ApJ, 628, 604Yates M. G., Miller L., Peacock J. A., 1989, MNRAS, 240, 129
This paper has been typeset from a TEX/LATEX file prepared by the author.
MNRAS 448, 3325–3338 (2015)
at University of L
eicester on January 27, 2016http://m
nras.oxfordjournals.org/D
ownloaded from