Embed Size (px)
Citation preview

Submission to AOAC as a candidate method for the Call: “Selected Adulterants in Dietary Ingredients and Dietary Supplements Containing Chondroitin Sulfate” By United States Pharmacopeia
Intended Use: Routine Surveillance of Dietary
Ingredients and Products by a Trained Technician
Applicability
Screening method for selected adulterants in dietary ingredients claiming to contain chondroitin sulfate:
Sodium hexametaphosphate
Sodium alginate
Propylene glycol alginate sulfate sodium
Over-sulfated polysaccharides
Carrageenan is in the SMPR as a potential adulterant; however we have not included any experiment related to carrageenan in this submission because it does not produce a titration end point with cetylpyridinium chloride. In addition, viscosities of carrageenan solutions are much higher than those of chondroitin solutions at similar concentration; therefore the two substances immediately differentiate from each other during preparation of solutions for testing. Because of these reasons, we believe that adulteration of chondroitin sulfate sodium with carrageenan is unlikely to happen.
Analytical Technique and its Principles
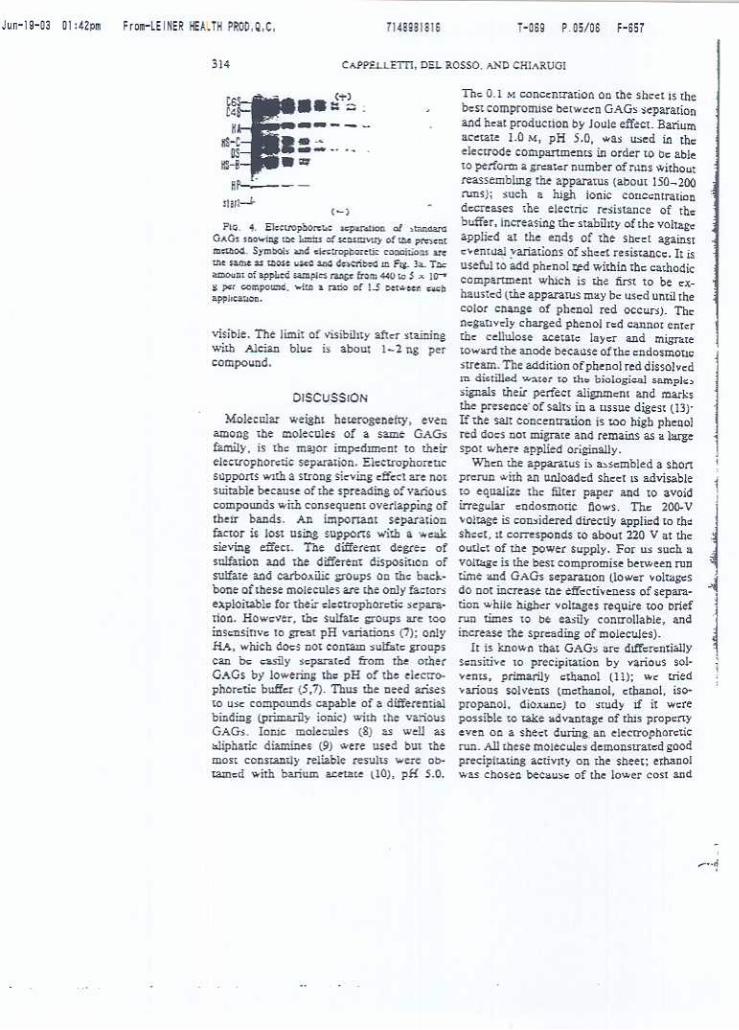
The analytical technique selected for this submission is electrophoresis on cellulose acetate membranes with Toluidine Blue staining. The method’s principle is based on the characteristic migration pattern of chondroitin sulfate on cellulose acetate membranes when subject to a voltaic current, producing visible very well defined bands after staining the developed membranes with a cationic dye (Toluidine Blue). The system separates CS from potential adulterants that produce positive interferences in CS assays based on ionic pair formation. The cationic nature of Toluidine Blue dye enables staining potential anion assay inferences by forming similar ionic pairs with the dye. Early work from Cappelletti et al (See annex 2) demonstrated the separation capabilities of the electrophoretic procedure. Further publications
confirmed the ability of the method to separate chondroitin from substances of similar related chemical structure (other sulfated and non-sulfated polysaccharides). (See annex 3)
Analytical Procedure
Electrophoretic analysis was performed according to the USP monograph (See Annex 1). The test system is described in detail below:
Instrumental Equipment
(a) Sample applicator.—DiaSys (Holzheim, Germany), Model No. Spectra 4, or Apacor (Berkshire, England) Sepratek 4 Applicator, Product No: 51119
(b) Cellulose acetate membrane sheets.—Sigma-Aldrich, 145 × 192 mm, Cat. No., 41776 A-F.
(c) Electrophoresis submarine chamber—Beijing Liuyi Instruments (Beijing, China), Model No. DDY-6C
or DiaSys Apacor (Berkshire, England) Semi-Micro II Chamber, Product No: 51214
Reagents
(1) Acetic acid, glacial.—LabChem, Inc. (Pittsburg, PA), 5000 mL/bottle, Lot No. B299-01.
(2) Barium acetate.—Sigma-Aldrich, 250 g/bottle, Lot No. SZBC0290V.
(3) Toluidine blue.—Sinopharm Chemical Reagents Co., Ltd. (Shanghi, China), 25 g/bottle, Lot No. WC20080626.
Reference Materials
(4) CS reference standard.—CS sodium (U.S. Pharmacopeial Convention, Rockville, MD) reference standard, 300 mg/bottle, Lot No. H1K241.
(5) CS sodium reference standard (CSRS).—Meitek Technology (Jiaonan City, Qingdao, China), 101.3% CPC, Lot No. ZP11081904, calibrated against the USP reference standard and used throughout this study as the CSRS.
Materials for Testing
(6) CS samples for testing.—CS sodium 90% (CS90).—Meitek Technology, 90.1% CPC, Lot No. ZP12083105.
Reagent Solutions
(7) Barium acetate buffer—25.24 g barium acetate was dissolved in 900 mL water, adjusted with acetic acid to pH 5.0, and diluted with water to 1000 mL.
(8) Staining reagent.—1 g toluidine blue in 1000 mL 0.1 M acetic acid.
Standard solutions
(9) Standard solution A.—30 mg/mL USP CSRS in water.
(10) Standard solution B.—1 mL standard solution A diluted with water to 50 mL.
(11) Standard solution C.—1 mL standard solution A diluted with water to 100 mL.
Testing solutions
(12) CS Sample solutions.—30 mg/mL in water.
(13) ASD Sample solution.—30 mg/mL in water.
(14) Z1 Sample solution.—30 mg/mL in water.
(15) Analysis.—Fill the chamber of the electrophoresis apparatus with barium acetate buffer. Soak a cellulose acetate membrane, about 6 × 14 cm in barium acetate buffer for 10 min, or until evenly wetted, then blot dry between two sheets of absorbent paper. Using an applicator suitable for electrophoresis, apply equal volumes (0.5 μL) standard solutions A, B, and C—or sample solutions as appropriate—to the smooth side of the membrane held in position on an appropriate application stand or on a separating bridge in the chamber. (Note: Cut absorbent paper to size and soak in buffer solution before placing on supporting beams on both sides of the separation bridge.) Place the membranes across supporting beams covered with wetted absorbent paper and over the separation bridge, without coming into contact with the bridge surface. Apply the samples applied to the membrane closer to the negative electrode. Immerse the terminal edges of the membrane at least 0.5–1.0 cm deep in the buffer in the chambers. Apply a constant current of 60 V (6 mA at the start) for 2 h. Because air drying of the blotted membranes reduces sensitivity, apply the voltage within 5 min of sample application. Following electrophoresis separation, remove the membranes from the chamber and place them in a plastic staining tray, application side down, and gently immersed in the staining reagent for 5 min, followed by gentle stirring for 1 min. Remove the membranes from the staining try and destain in 5% acetic acid until the background cleared. Compare the bands of samples formed with those of the standards. Document the results by digital photography within 5 min.
Method Performance
SPECIFICITY
The proposed procedure is able to separate chondroitin sulfate from Sodium Alginate, (see Annex 4) Sodium Hexametaphosphate, Propylenglycol Alginate Sulfate Sodium (see Annex 5), oversulfated chondroitin sulfate (see annex 6), fast moving heparin, slow moving heparin, dermatan sulfate, and hyaluronic acid (see annex 2).
LIMIT OF DETECTION
Sodium Alginate: 0.3 % (Annex 4)
Hexametaphosphate: ~1 % (Annex 5)
Propylene glycol Alginate Sulfate Sodium: 0.6 % (Annex 5)
Oversulfated Chondroitin: Between 1 and 2 % (Annex 6)
5970 Choline / Dietary Supplements USP 38
170 mL of water and 30.0 mL of sodium hydroxide TS, volume of this solution with Mobile phase to obtain aand stir until dissolved. concentration of 2.0 µg/mL of USP Choline Chloride RS.
System suitability stock solution: 10 µg/mL of trimeth- Sample solution: Transfer 110 mg of Choline Chlorideylamine hydrochloride in water to a 24-mL screw-capped vial. Dry at 120° for 2 h. Add
System suitability solution: Transfer 10.0 mL of System 400 mg of 3,5-dinitrobenzoyl chloride and 10 mL of ac-suitability stock solution to a beaker containing a plastic- etonitrile. Cap the vial, heat to 55°, and continue heat-coated stirring bar, add 160 mL of water and 30.0 mL ing for 2 h. Cool to room temperature, and add 5 mLof sodium hydroxide TS, and stir until dissolved. of water. Allow to stand for 5 min. Quantitatively trans-
Electrode system: Use a gas-sensing, ammonia-specific fer the solution to a 50-mL volumetric flask, and diluteindicating electrode with internal reference connected with Mobile phase to volume. Pipet 2.0 mL of the solu-to a pH meter capable of measuring potentials with a tion to a 25-mL volumetric flask, and dilute with Mobileminimum reproducibility of ±0.1 mV (see pH ⟨791⟩). phase to volume.
Standard response line: Mix 30.0 mL of sodium hy- Chromatographic systemdroxide TS, and 170 mL of water. Add a plastic-coated (See Chromatography ⟨621⟩, System Suitability.)stirring bar, insert the electrode into the solution, and Mode: LCrecord the potential, in mV. Continue stirring, and at Detector: UV 208 nm5-min intervals add 0.200, 0.600, 1.00, and 2.00 mL of Column: 4.6-mm × 25-cm; packing L7Standard solution, and record the potential after each Column temperature: 30°addition. Plot the logarithms of the cumulative trimeth- Flow rate: 1.0 mL/minylamine hydrochloride concentrations (0.50, 1.50, 2.50, Injection size: 20 µLand 5.00 µg/mL) versus potential, in mV, and deter- System suitabilitymine the slope (S) of the Standard response line for the Sample: Standard solutionelectrode. Suitability requirements
System suitability Capacity factor (k′): NLT 2Sample: System suitability solution Relative standard deviation: NMT 5%, determinedProceed as directed in Analysis, except to replace the from the choline derivative peakSample solution with the System suitability solution and Analysisin the formula below to replace W with V, which Samples: Standard solution and Sample solutionequals 10 mL. Calculate the percentage of each impurity in the por-
Suitability requirements: The total change is NLT 10 tion of Choline Chloride taken:mV for a 0.4-mL cumulative addition of the Standard
Result = (rU/rS) × (CS/CU) × 100solution; the amount of trimethylamine hydrochloridefound is 8.5–11.5 µg/L.
rU = peak response for each impurity, excludingAnalysisthat for the choline derivative and 3,5-Samples: Standard solution and Sample solutiondinitrobenzoic acid from the Sample solutionRinse the electrode, insert it into the Sample solution,
rS = peak response for the choline derivative fromstir, and record the potential, in mV. Add 0.100 mL ofthe Standard solutionthe Standard solution, and record the potential. Add
CS = concentration of USP Choline Chloride RS inanother 0.100 mL of the Standard solution, and recordthe Standard solution (mg/mL)the potential. [NOTE—If the total change after the sec-
CU = concentration of Choline Chloride in theond addition of the Standard solution is less than 10Sample solution (mg/mL)mV, add a third aliquot of 0.200 mL.]
Acceptance criteriaCalculate the content, in µg/g, of total amines as tri-Individual impurities: NMT 0.3%methylamine hydrochloride in the portion of sampleTotal impurities: NMT 2.0%taken:
SPECIFIC TESTSResult = (CS × VA)/[(F − 1) × W]• PH ⟨791⟩: 4.0–7.0, in a solution (1 in 10)• WATER DETERMINATION, Method I ⟨921⟩: NMT 0.5%CS = concentration of Standard solution (µg/mL)
VA = total volume of the Standard solution added to ADDITIONAL REQUIREMENTSthe Sample solution (mL) • PACKAGING AND STORAGE: Preserve in well-closedW = weight of Choline Chloride taken to prepare containers.the Sample solution (g) • USP REFERENCE STANDARDS ⟨11⟩F = correction factor, calculated by the formula: USP Choline Chloride RSF = antilog [(mVF − mV0)/S]
mVF = final reading after the additions of the.Standard solution (mV)
mV0 = initial reading of the Sample solution (mV) Chondroitin Sulfate SodiumS = slope of the Standard response line for the
Chondroitin, hydrogen sulfate, sodium salt [9082-07-9].electrodeAcceptance criteria: NMT 10 µg/g DEFINITION• CHROMATOGRAPHIC PURITY Chondroitin Sulfate Sodium is the sodium salt of theBuffer solution: 7.1 g/L of anhydrous dibasic sodium sulfated linear glycosaminoglycan obtained from bovine,phosphate. Adjust with phosphoric acid to a pH of 2.5. porcine, or avian cartilages of healthy and domestic ani-Mobile phase: Buffer solution and acetonitrile (7:3) mals used for food by humans. Chondroitin Sulfate So-Standard solution: Transfer an amount, NMT 100 mg, dium consists mostly of the sodium salt of the sulfate es-of USP Choline Chloride RS to a 24-mL screw-capped ter of N-acetylchondrosamine (2-acetamido-2-deoxy-β-D-vial, and add 400 mg of 3,5-dinitrobenzoyl chloride and galactopyranose) and D-glucuronic acid copolymer. These10 mL of acetonitrile. Cap the vial, heat to 55°, and hexoses are alternately linked β-1,4 and β-1,3 in the poly-continue heating for 2 h. Cool to room temperature, mer. Chondrosamine moieties in the prevalent glycosami-and add 5 mL of water. Allow to stand for 5 min. noglycan are monosulfated primarily on position 4 andQuantitatively transfer the solution to a 25-mL volumet- less so on position 6. It contains NLT 90.0% and NMTric flask, and dilute with acetonitrile to volume. Dilute a
DS
Mo
no
gra
ph
s
Official from May 1, 2015Copyright (c) 2014 The United States Pharmacopeial Convention. All rights reserved.
Accessed from 10.6.1.10 by uspstaff on Thu Dec 11 16:44:51 EST 2014
USP 38 Dietary Supplements / Chondroitin 5971
105.0% of chondroitin sulfate sodium, calculated on the • CHLORIDE AND SULFATE, Sulfate ⟨221⟩dried basis. Sample solution: Dissolve 200 mg in 40 mL of water.
[NOTE—Chondroitin Sulfate Sodium is extremely hygro- Add 10 mL of a 30-mg/mL solution of cetylpyridiniumscopic once dried. Avoid exposure to the atmosphere, chloride, pass through a filter, and use a 25-mL portionand weigh promptly.] of the filtrate.
Acceptance criteria: NMT 0.24%; the Sample solutionIDENTIFICATION shows no more sulfate than corresponds to 0.25 mL of• A. INFRARED ABSORPTION ⟨197K⟩ 0.020 N sulfuric acid.• B. IDENTIFICATION TESTS—GENERAL, Sodium ⟨191⟩: Meets • ELECTROPHORETIC PURITY
the requirements [CAUTION—Voltages used in electrophoresis can readily de-Sample solution: 0.5 g in 10 mL of water liver a lethal shock. The hazard is increased by the use of
• C. DISACCHARIDE COMPOSITION aqueous buffer solutions and the possibility of working inThe chromatogram of the enzymatically digested Sample damp environments. The equipment, with the possiblesolution as obtained in the test for Limit of Nonspecific exception of the power supply, should be enclosed in ei-Disaccharides shows three main peaks corresponding to ther a grounded metal case or a case made of insulatingdehydrated glucuronic acid-[1→3]-chondrosamine- material. The case should have an interlock that deener-4-sulfated (∆Di-4S), dehydrated glucuronic acid-[1→3]- gizes the power supply when the case is opened, afterchondrosamine-6-sulfated (∆Di-6S), and nonsulfated de- which reactivation should be prevented until activation ofhydrated glucuronic acid-[1→3]-chondrosamine (∆Di- a reset switch is carried out. High-voltage cables from the0S) in the enzymatically digested Standard solution. By power supply to the apparatus should preferably be apeak-area response, ∆Di-4S is the most abundant, fol- type in which a braided metal shield completely encloseslowed by ∆Di-6S, with ∆Di-0S being the least abundant the insulated central conductor, and the shield should beof the three. The ratio of the peak response of the ∆Di- grounded. The base of the apparatus should be grounded4S to the ∆Di-6S is NLT 1.0. metal or contain a grounded metal rim which is con-
• D. SPECIFIC ROTATION: Meets the requirements for Optical structed in such a way that any leakage of electrolyte willRotation, Specific Rotation ⟨781S⟩ in Specific Tests produce a short which will deenergize the power supply
before the electrolyte can flow beyond the protective en-COMPOSITION closure. If the power supply contains capacitors as part of• CONTENT OF CHONDROITIN SULFATE SODIUM a filter circuit, it should also contain a bleeder resistor toStandard solutions: 1.5, 1.0, and 0.5 mg/mL of USP ensure discharge of the capacitors before the protectiveChondroitin Sulfate Sodium RS in water case is opened. A shorting bar that is activated by open-Sample solution: Transfer 100 mg of dried Chondroitin ing the case may be considered as an added precaution.Sulfate Sodium into a 100-mL volumetric flask, dissolve Because of the potential hazard associated with electro-in 30 mL of water, and dilute with water to volume. phoresis, laboratory personnel should be completely famil-Diluent: Weigh about 297 mg of monobasic potassium iar with electrophoresis equipment before using it.]phosphate, 492 mg of dibasic potassium phosphate, Barium acetate buffer: Dissolve 25.24 g of barium ace-and 250 mg of polysorbate 80, and transfer into a 1-L tate in 900 mL of water. Adjust with acetic acid to a pHbeaker. Dissolve in 900 mL of water, and adjust with of 5.0, and dilute with water to 1000 mL.potassium hydroxide or phosphoric acid to a pH of 7.0 Staining reagent: Dissolve 1 g of toluidine blue in± 0.2. Dilute with water to 1 L, and mix thoroughly. 1000 mL of 0.1 M acetic acid.Titrimetric system Standard solution A: 30 mg/mL of USP Chondroitin(See Titrimetry ⟨541⟩.) Sulfate Sodium RS in waterMode: Photometric titration Standard solution B: Dilute 1 mL of Standard solution ATitrant: 1 mg/mL of cetylpyridinium chloride in water. with water to 50 mL.Degas before use. Sample solution: 30 mg/mL of Chondroitin Sulfate So-Endpoint detection: Turbidimetric with a photo- dium in waterelectric probe Analysis: Fill the chambers of an electrophoresis appa-Analysis: Transfer 5.0 mL each of the Standard solution ratus suitable for separations on cellulose acetate mem-and the Sample solution to separate titration vessels, and branes1. (a small submarine gel chamber or one dedi-add 25 mL of Diluent to each. Stir until a steady reading cated to membrane media) with Barium acetate buffer.is obtained with a phototrode either at 420, 550, or Soak a cellulose acetate membrane, 5–6 cm ×660 nm. Set the instrument to zero in absorbance 12–14 cm, in Barium acetate buffer for 10 min, or untilmode. Titrate with Titrant using the phototrode to de- evenly wetted, then blot dry between two sheets of ab-termine the endpoint turbidimetrically. From a linear re- sorbent paper. Using an applicator2
. suitable for electro-gression equation, calculated using the volumes of Ti- phoresis, apply equal volumes (0.5 µL) of the Sampletrant consumed versus concentrations of the Standard solution, Standard solution A, and Standard solution B tosolutions, determine the concentration of chondroitin the brighter side of the membrane held in position insulfate sodium in the Sample solution. an appropriate applicator stand or on a separatingCalculate the percentage of chondroitin sulfate sodium bridge in the chamber. Ensure that both ends of thein the portion of Chondroitin Sulfate Sodium taken: membrane are dipped at least 0.5–1.0 cm deep into thebuffer chambers. Apply a constant 60 volts (6 mA atResult = (C/CU) × 100 the start) for 2 h. [NOTE—Perform the application ofsolutions and voltage within 5 min because further dry-C = concentration of chondroitin sulfate sodium ining of the blotted paper reduces sensitivity.]the aliquot of the Sample solution, obtainedPlace the membrane in a plastic staining tray, and withfrom the regression equation (mg/mL)the application side down, float or gently immerse inCU = concentration of Chondroitin Sulfate SodiumStaining reagent for 5 min. Then stir the solution gen-in the Sample solution (mg/mL)tly for 1 min. Remove the membrane, and destain inAcceptance criteria: 90.0%–105.0% on the dried basis5% acetic acid until the background clears. Compare
IMPURITIES 1. Suitable cellulose acetate membranes for electrophoresis are available from
• RESIDUE ON IGNITION ⟨281⟩: 20.0%–30.0% on the dried Malta Chemetron SRL, Milano, Italy; Fluka Chemical Corp., Milwaukee, WI;and DiaSys Corp., Waterbury, CT (www.diasys.com).basis2
. Suitable applicators are available from DiaSys Corp., Waterbury, CT (www.• CHLORIDE AND SULFATE, Chloride ⟨221⟩: NMT 0.50%; a diasys.com) and Helena Laboratories, Beaumont, TX (www.helena.com).0.10-g portion shows no more chloride than correspondsto 0.7 mL of 0.020 N hydrochloric acid.
DS M
on
og
raph
s
Official from May 1, 2015Copyright (c) 2014 The United States Pharmacopeial Convention. All rights reserved.
Accessed from 10.6.1.10 by uspstaff on Thu Dec 11 16:44:51 EST 2014
5972 Chondroitin / Dietary Supplements USP 38
the bands. [NOTE—Document the results by taking a Table 1picture within 15 min of completion of destaining.] Time Solution A Solution BAcceptance criteria: The electropherogram from the (min) (%) (%)Sample solution exhibits a major band that is identical in
0.0 100 0position to the band from Standard solution A. The4.5 100 0band from Standard solution B is clearly visible at a mo-21.0 61 39bility similar to the band from Standard solution A. Any
secondary band in the electropherogram of the Sample 21.1 100 0solution is not more intense than the band from Stan-
Buffer solution: 50 mM tris(hydroxymethyl)amino-dard solution B. NMT 2% of any individual impurity ismethane and 60 mM sodium acetate (1:1), adjustedfound. [NOTE—Document the results by taking a picturewith diluted hydrochloric acid to a pH of 8.0within 15 min of completion of destaining.]
Chondroitinase AC solution: Combine 2 units of chon-• LIMIT OF PROTEINdroitinase AC3
. and 0.5 mL of Buffer solution. Dilute withSolution A: 20 mg/mL of sodium tartrate dihydratewater to 10.0 mL, and mix thoroughly.Solution B: 10 mg/mL of cupric sulfateEnzyme suitability: Dilute the digested Standard solu-Solution C: 20 mg/mL of anhydrous sodium carbonatetion (see Analysis section below) (1 in 10), and meas-in 0.1 M sodium hydroxideure the absorbance at 230 nm in 1-cm path cells.Dilute Folin-Ciocalteu reagent: Dilute Folin-CiocalteuCalculate the absorptivity of the USP Chondroitin Sul-phenol TS with water (1:5). Prepare immediately beforefate Sodium RS:use.
Alkaline cupric tartaric reagent: Mix 1 mL each of So-Result = A/(C × D × d)lution A and Solution B, and to the mixture slowly add
100 mL of Solution C with stirring. Use within 24 h, andA = absorbance of the diluted and digesteddiscard afterward.
Standard solutionStandard solution: 36 µg/mL of bovine serum albuminC = concentration of USP Chondroitin Sulfatecertified standard in water
Sodium RS in the Standard solution (mg/mL)Sample solution: Transfer a portion of Chondroitin Sul-D = dilution factor of digested Standard solutionfate Sodium, equivalent to 60 mg of the dried sub-
(1/5)stance, to a 100-mL volumetric flask, and dissolve ind = dilution factor for the UV measurement (1/10)and dilute with water to volume.
Enzyme suitability requirements: The absorptivity ofInstrumental conditionsthe digested USP Chondroitin Sulfate Sodium RS is(See Spectrophotometry and Light-Scattering ⟨851⟩.)NLT 8 AU · mL · mg–1
. · cm–1..Analytical wavelength: 750 nm
Standard solution: 2.4 mg/mL of dried USP Chondroi-Blank: Watertin Sulfate Sodium RS in waterAnalysis
Sample solution: Transfer about 250 mg of dried (105°Samples: Standard solution, Sample solution, and Blankfor 4 h) Chondroitin Sulfate Sodium to a 100-mL volu-Add 2.0 mL of freshly prepared Alkaline cupric tartaricmetric flask, and dissolve in and dilute with water toreagent to test tubes containing 2.0 mL of the Stan-volume.dard solution, 2.0 mL of the Sample solution, or 2.0 mL
System suitability solution: Add 1 volume of Standardof the Blank. After 10 min, add 1.0 mL of Dilute Folin-solution to 1 volume of Sample solution.Ciocalteu reagent to each test tube, and mix immedi-
Blank: Waterately and vigorously. After 30 min, measure the ab-Chromatographic systemsorbance of the Standard solution and Sample solution(See Chromatography ⟨621⟩, System Suitability.)against the Blank.Mode: LCAcceptance criteria: NMT 6.0% on the dried basis; theDetector: UV 230 nmabsorbance of the Sample solution is NMT the absorb-Column: 4.6-mm × 25-cm; 5-µm packing L14ance of the Standard solution.Flow rate: 1 mL/minInjection volume: 25 µLCONTAMINANTS[NOTE—The Injection volume may be decreased to im-• MICROBIAL ENUMERATION TESTS ⟨2021⟩: The total bacterialprove the peak shape of the analytes.]count does not exceed 103
. cfu/g, and the total com-System suitabilitybined molds and yeasts count does not exceed 102
. cfu/Samples: Standard solution and System suitability solu-g.tion (prepared as directed for Samples in the Analysis• ABSENCE OF SPECIFIED MICROORGANISMS ⟨2022⟩: It meetsbelow)the requirements of the tests for absence of Salmonella
[NOTE—The relative retention times for the ∆Di-0S, ∆Di-species, and Escherichia coli.6S, and ∆Di-4S peaks are 0.80, 0.97, and 1.0,respectively.]
Delete the following: Suitability requirementsChromatogram similarity: The chromatogram of the•
.• HEAVY METALS, Method II ⟨231⟩: NMT 20 ppm• (Official 1- Standard solution is similar to that of the ReferenceDec-2015) Chromatogram provided with USP Chondroitin Sul-
fate Sodium RS.SPECIFIC TESTS Resolution: NLT 2.0, between the ∆Di-4S and ∆Di-6S• LIMIT OF NONSPECIFIC DISSACCHARIDES peaksSolution A: Water adjusted with 0.1 N hydrochloric Recovery factor: NLT 95% of the USP Chondroitinacid to a pH of 3.5 Sulfate Sodium RS added to the Sample solutionSolution B: 1 M sodium chloride adjusted with 0.1 N [NOTE—This test is intended to demonstrate the ab-hydrochloric acid to a pH of 3.5 sence of enzyme inhibition by impurities in the sam-Mobile phase: See Table 1. ples. Performance of this test is required only for sam-ples not meeting the Acceptance criteria below. Therecovery factor can be calculated as follows.
Result = [(2 × ΣrSY) − ΣrU]/ΣrS × 1003
. Chondroitinase AC from Chromadex, part number ASB-00003613-10.
DS
Mo
no
gra
ph
s
Official from May 1, 2015Copyright (c) 2014 The United States Pharmacopeial Convention. All rights reserved.
Accessed from 10.6.1.10 by uspstaff on Thu Dec 11 16:44:51 EST 2014
USP 38 Dietary Supplements / Chondroitin 5973
ΣrSY = sum of the peak areas of ∆Di-0S, ∆Di-4S, and • USP REFERENCE STANDARDS ⟨11⟩∆Di-6S from the System suitability solution USP Chondroitin Sulfate Sodium RS
ΣrU = sum of the peak areas of ∆Di-0S, ∆Di-4S, and∆Di-6S from the Sample solution
ΣrS = sum of the peak areas of ∆Di-0S, ∆Di-4S, and.∆Di-6S from the Standard solution]
Relative standard deviation: NMT 5.0% for the ∆Di- Chondroitin Sulfate Sodium Tablets0S, ∆Di-4S, and ∆Di-6S peaks
Analysis DEFINITIONSamples: Standard solution, Sample solution, Sytem suit- Chondroitin Sulfate Sodium Tablets contain NLT 90.0% andability solution, and Blank NMT 120.0% of the labeled amount of chondroitin sul-
In four separate vials, combine 4 volumes of Chondroi- fate sodium.tinase AC solution with 1 volume each of Standard solu- [NOTE—Chondroitin Sulfate Sodium is extremely hygro-tion, Sample solution, System suitability solution, and scopic once dried. Avoid exposure to the atmosphere,Blank. Mix thoroughly. Incubate at 37°C for 3 h. Allow and weigh promptly.]to cool before injection.
Calculate the percentage of specific disaccharides in the IDENTIFICATIONsample taken: • A. ELECTROPHORESIS ⟨726⟩
Barium acetate buffer: Dissolve 25.24 g of barium ace-Result = (ΣrU/ΣrS) × (CS/CU) × 100 tate in 900 mL of water. Adjust with acetic acid to a pH
of 5.0, and dilute with water to 1000 mL.ΣrU = sum of the peak areas of ∆Di-0S, ∆Di-4S, and Staining reagent: 0.1% (w/v) toluidine blue in 0.1 M
∆Di-6S from the Sample solution acetic acidΣrS = sum of the peak areas of ∆Di-0S, ∆Di-4S, and Standard solution: Use the Standard solution of middle
∆Di-6S from the Standard solution concentration from the Content of Chondroitin SulfateCS = concentration of chondroitin sulfate sodium in Sodium.
the Standard solution (mg/mL) Sample solution: Prepare as directed in the Content ofCU = concentration of Chondroitin Sulfate Sodium Chondroitin Sulfate Sodium.
in the Sample solution (mg/mL) Analysis: Fill the chambers of an electrophoresis appa-Calculate the content of nonspecific disaccharides in the ratus suitable for separations on cellulose acetate mem-sample taken: branes1
. (a small submarine gel chamber or one dedi-cated to membrane media) with Barium acetate buffer.Result = CSC − SDC Soak a cellulose acetate membrane 5–6 cm × 12–14 cmin Barium acetate buffer for 10 min, or until evenly wet-CSC = Chondroitin sulfate sodium content from the ted, then blot dry between two sheets of absorbent pa-test for Content of Chondroitin Sulfate Sodium per. Using an applicator2
. suitable for electrophoresis,(%) apply equal volumes (0.5 µL) of the Sample solution andSDC = specific disaccharides content (%) Standard solution to the brighter side of the membraneAcceptance criteria: NMT 10.0% held in position in an appropriate applicator stand or• CLARITY AND COLOR OF SOLUTION on a separating bridge in the chamber. Ensure thatSample solution: Transfer 2.5 g of Chondroitin Sulfate both ends of the membrane are dipped at leastSodium to a 50-mL volumetric flask. Dissolve in and 0.5–1.0-cm deep into the buffer chambers. Apply adilute with carbon dioxide-free water to volume, and constant 60 volts (6 mA at the start) for 2 h. [NOTE—examine immediately. Perform the application of solutions and voltage withinInstrumental conditions 5 min because further drying of the blotted paper(See Spectrophotometry and Light-Scattering ⟨851⟩.) reduces sensitivity.]Analytical wavelength: 420 nm Place the membrane in a plastic staining tray, and withCell: 1 cm the application side down, float or gently immerse inBlank: Carbon dioxide-free water Staining reagent for 5 min. Then stir the solution gen-Analysis: Measure the absorbance of the Sample tly for 1 min. Remove the membrane, and destain insolution. 5% acetic acid until the background clears.Acceptance criteria: Its absorbance is NMT 0.35. Acceptance criteria: The principal spot from the Sam-• OPTICAL ROTATION, Specific Rotation ⟨781S⟩: –20.0° to ple solution has the same migration as the principal spot–30.0° from the Standard solution. [NOTE—Document the re-Sample solution: 30 mg/mL sults by taking a picture within 15 min of completion of• PH ⟨791⟩: 5.5–7.5, in a solution (1 in 100) destaining.]• LOSS ON DRYING ⟨731⟩: Dry a sample at 105° for 4 h: itloses NMT 12.0% of its weight. [NOTE—Chondroitin Sul- STRENGTHfate Sodium is extremely hygroscopic once dried. Avoid • CONTENT OF CHONDROITIN SULFATE SODIUMexposure to the atmosphere, and weigh promptly.] Standard solutions: 1.5, 1.0, and 0.5 mg/mL of USP
Chondroitin Sulfate Sodium RS in waterADDITIONAL REQUIREMENTS Sample solution: Transfer an equivalent to 100 mg of• PACKAGING AND STORAGE: Preserve in tight containers. chondroitin sulfate sodium from NLT 20 Tablets, finely• LABELING: Label it to state the source(s) from which the powdered, to 60 mL of water, and shake to suspendarticle was derived, whether bovine, porcine, avian, or a the powder in solution. Sonicate in a 65° water bath formixture of any of them. 20 min. Remove from the bath, stir or shake for 5 min,dilute with water to 100 mL, and centrifuge or passthrough a suitable filter.
1. Suitable cellulose acetate membranes for electrophoresis are available from
Malta Chemetron SRL, Milano, Italy (www.maltachemetron.com); FlukaChemical Corp., Milwaukee, WI; and DiaSys Corp., Waterbury, CT (www.diasys.com).2
. Suitable applicators are available from DiaSys Corp., Waterbury, CT (www.diasys.com) and Helena Laboratories, Beaumont, TX (www.helena.com).
DS M
on
og
raph
s
Official from May 1, 2015Copyright (c) 2014 The United States Pharmacopeial Convention. All rights reserved.
Accessed from 10.6.1.10 by uspstaff on Thu Dec 11 16:44:51 EST 2014
S
Ofp
RI
a
ARAA
KHDCGC
1
aorGA
ttciqa
asla[[
0d
Journal of Pharmaceutical and Biomedical Analysis 49 (2009) 151–155
Contents lists available at ScienceDirect
Journal of Pharmaceutical and Biomedical Analysis
journa l homepage: www.e lsev ier .com/ locate / jpba
hort communication
ne-dimensional cellulose acetate plate electrophoresis—A feasible methodor analysis of dermatan sulfate and other glycosaminoglycan impurities inharmaceutical heparin
ainer Domanig, Wolfgang Jöbstl, Silvia Gruber, Thomas Freudemann ∗
PC Analytical & Technical Process Support Labs, Sandoz GmbH, Biotechnical Production Plant Schaftenau, Biochemiestraße 10, 6336 Langkampfen, Austria
r t i c l e i n f o
rticle history:eceived 23 June 2008ccepted 8 October 2008
a b s t r a c t
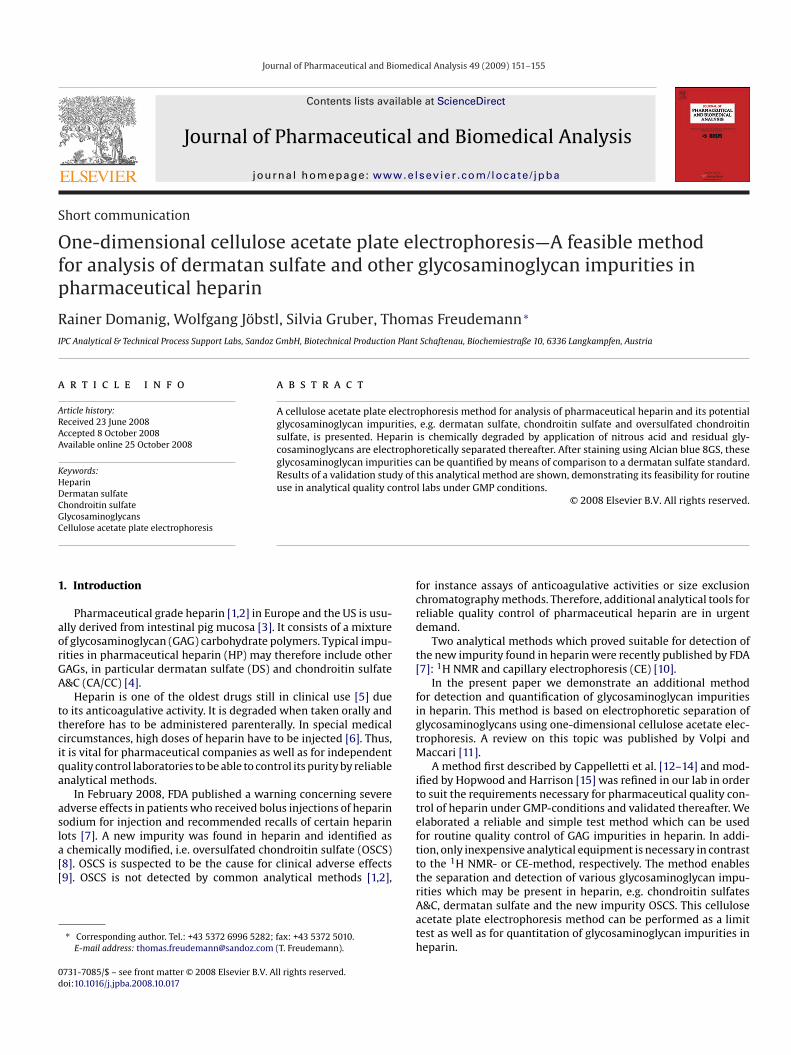
A cellulose acetate plate electrophoresis method for analysis of pharmaceutical heparin and its potentialglycosaminoglycan impurities, e.g. dermatan sulfate, chondroitin sulfate and oversulfated chondroitinsulfate, is presented. Heparin is chemically degraded by application of nitrous acid and residual gly-
vailable online 25 October 2008
eywords:eparinermatan sulfatehondroitin sulfate
cosaminoglycans are electrophoretically separated thereafter. After staining using Alcian blue 8GS, theseglycosaminoglycan impurities can be quantified by means of comparison to a dermatan sulfate standard.Results of a validation study of this analytical method are shown, demonstrating its feasibility for routineuse in analytical quality control labs under GMP conditions.
© 2008 Elsevier B.V. All rights reserved.
fcrd
t[
figtM
itte
lycosaminoglycansellulose acetate plate electrophoresis
. Introduction
Pharmaceutical grade heparin [1,2] in Europe and the US is usu-lly derived from intestinal pig mucosa [3]. It consists of a mixturef glycosaminoglycan (GAG) carbohydrate polymers. Typical impu-ities in pharmaceutical heparin (HP) may therefore include otherAGs, in particular dermatan sulfate (DS) and chondroitin sulfate&C (CA/CC) [4].
Heparin is one of the oldest drugs still in clinical use [5] dueo its anticoagulative activity. It is degraded when taken orally andherefore has to be administered parenterally. In special medicalircumstances, high doses of heparin have to be injected [6]. Thus,t is vital for pharmaceutical companies as well as for independentuality control laboratories to be able to control its purity by reliablenalytical methods.
In February 2008, FDA published a warning concerning severedverse effects in patients who received bolus injections of heparinodium for injection and recommended recalls of certain heparin
ots [7]. A new impurity was found in heparin and identified aschemically modified, i.e. oversulfated chondroitin sulfate (OSCS)8]. OSCS is suspected to be the cause for clinical adverse effects9]. OSCS is not detected by common analytical methods [1,2],
∗ Corresponding author. Tel.: +43 5372 6996 5282; fax: +43 5372 5010.E-mail address: [email protected] (T. Freudemann).
ftttrAath
731-7085/$ – see front matter © 2008 Elsevier B.V. All rights reserved.oi:10.1016/j.jpba.2008.10.017
or instance assays of anticoagulative activities or size exclusionhromatography methods. Therefore, additional analytical tools foreliable quality control of pharmaceutical heparin are in urgentemand.
Two analytical methods which proved suitable for detection ofhe new impurity found in heparin were recently published by FDA7]: 1H NMR and capillary electrophoresis (CE) [10].
In the present paper we demonstrate an additional methodor detection and quantification of glycosaminoglycan impuritiesn heparin. This method is based on electrophoretic separation oflycosaminoglycans using one-dimensional cellulose acetate elec-rophoresis. A review on this topic was published by Volpi and
accari [11].A method first described by Cappelletti et al. [12–14] and mod-
fied by Hopwood and Harrison [15] was refined in our lab in ordero suit the requirements necessary for pharmaceutical quality con-rol of heparin under GMP-conditions and validated thereafter. Welaborated a reliable and simple test method which can be usedor routine quality control of GAG impurities in heparin. In addi-ion, only inexpensive analytical equipment is necessary in contrasto the 1H NMR- or CE-method, respectively. The method enableshe separation and detection of various glycosaminoglycan impu-
ities which may be present in heparin, e.g. chondroitin sulfates&C, dermatan sulfate and the new impurity OSCS. This cellulosecetate plate electrophoresis method can be performed as a limitest as well as for quantitation of glycosaminoglycan impurities ineparin.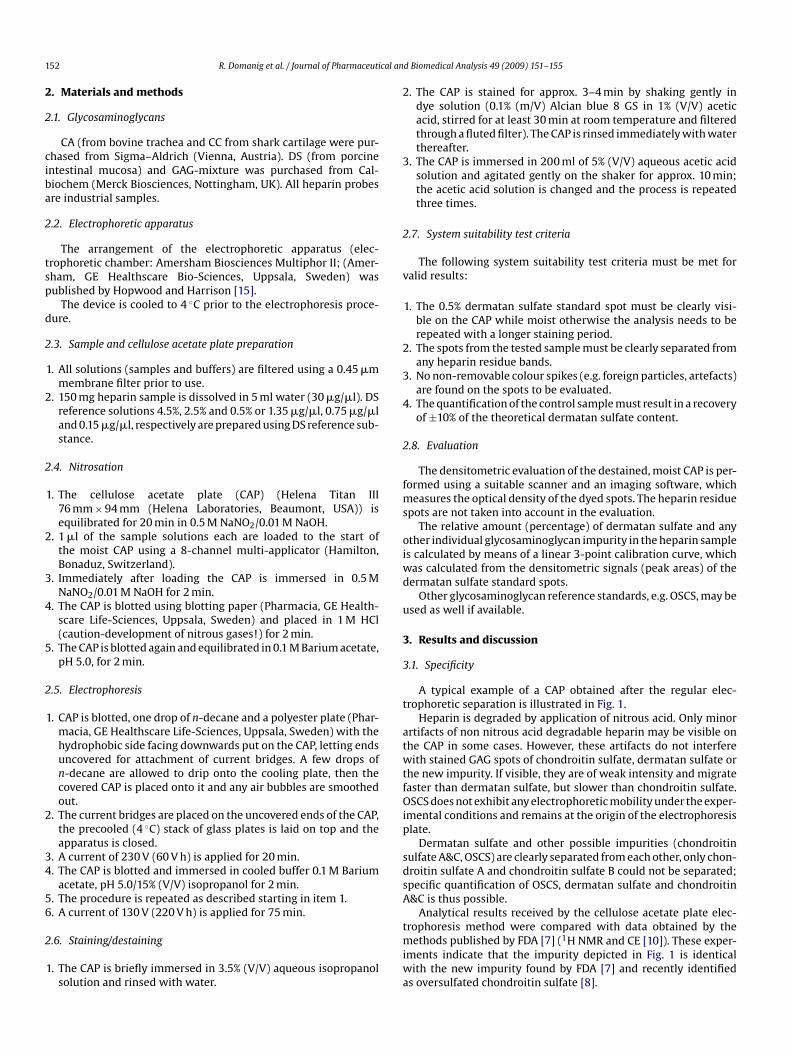
1 cal an
2
2
ciba
2
tsp
d
2
2
2
2
3
4
5
2
2
34
56
2
2
3
2
v
2
3
4
2
fms
oiwd
u
3
3
t
atwtfOip
sdsA
52 R. Domanig et al. / Journal of Pharmaceuti
. Materials and methods
.1. Glycosaminoglycans
CA (from bovine trachea and CC from shark cartilage were pur-hased from Sigma–Aldrich (Vienna, Austria). DS (from porcinentestinal mucosa) and GAG-mixture was purchased from Cal-iochem (Merck Biosciences, Nottingham, UK). All heparin probesre industrial samples.
.2. Electrophoretic apparatus
The arrangement of the electrophoretic apparatus (elec-rophoretic chamber: Amersham Biosciences Multiphor II; (Amer-ham, GE Healthscare Bio-Sciences, Uppsala, Sweden) wasublished by Hopwood and Harrison [15].
The device is cooled to 4 ◦C prior to the electrophoresis proce-ure.
.3. Sample and cellulose acetate plate preparation
1. All solutions (samples and buffers) are filtered using a 0.45 �mmembrane filter prior to use.
. 150 mg heparin sample is dissolved in 5 ml water (30 �g/�l). DSreference solutions 4.5%, 2.5% and 0.5% or 1.35 �g/�l, 0.75 �g/�land 0.15 �g/�l, respectively are prepared using DS reference sub-stance.
.4. Nitrosation
1. The cellulose acetate plate (CAP) (Helena Titan III76 mm × 94 mm (Helena Laboratories, Beaumont, USA)) isequilibrated for 20 min in 0.5 M NaNO2/0.01 M NaOH.
. 1 �l of the sample solutions each are loaded to the start ofthe moist CAP using a 8-channel multi-applicator (Hamilton,Bonaduz, Switzerland).
. Immediately after loading the CAP is immersed in 0.5 MNaNO2/0.01 M NaOH for 2 min.
. The CAP is blotted using blotting paper (Pharmacia, GE Health-scare Life-Sciences, Uppsala, Sweden) and placed in 1 M HCl(caution-development of nitrous gases!) for 2 min.
. The CAP is blotted again and equilibrated in 0.1 M Barium acetate,pH 5.0, for 2 min.
.5. Electrophoresis
1. CAP is blotted, one drop of n-decane and a polyester plate (Phar-macia, GE Healthscare Life-Sciences, Uppsala, Sweden) with thehydrophobic side facing downwards put on the CAP, letting endsuncovered for attachment of current bridges. A few drops ofn-decane are allowed to drip onto the cooling plate, then thecovered CAP is placed onto it and any air bubbles are smoothedout.
. The current bridges are placed on the uncovered ends of the CAP,the precooled (4 ◦C) stack of glass plates is laid on top and theapparatus is closed.
. A current of 230 V (60 V h) is applied for 20 min.
. The CAP is blotted and immersed in cooled buffer 0.1 M Bariumacetate, pH 5.0/15% (V/V) isopropanol for 2 min.
. The procedure is repeated as described starting in item 1.
. A current of 130 V (220 V h) is applied for 75 min.
.6. Staining/destaining
1. The CAP is briefly immersed in 3.5% (V/V) aqueous isopropanolsolution and rinsed with water.
tmiwa
d Biomedical Analysis 49 (2009) 151–155
. The CAP is stained for approx. 3–4 min by shaking gently indye solution (0.1% (m/V) Alcian blue 8 GS in 1% (V/V) aceticacid, stirred for at least 30 min at room temperature and filteredthrough a fluted filter). The CAP is rinsed immediately with waterthereafter.
. The CAP is immersed in 200 ml of 5% (V/V) aqueous acetic acidsolution and agitated gently on the shaker for approx. 10 min;the acetic acid solution is changed and the process is repeatedthree times.
.7. System suitability test criteria
The following system suitability test criteria must be met foralid results:
1. The 0.5% dermatan sulfate standard spot must be clearly visi-ble on the CAP while moist otherwise the analysis needs to berepeated with a longer staining period.
. The spots from the tested sample must be clearly separated fromany heparin residue bands.
. No non-removable colour spikes (e.g. foreign particles, artefacts)are found on the spots to be evaluated.
. The quantification of the control sample must result in a recoveryof ±10% of the theoretical dermatan sulfate content.
.8. Evaluation
The densitometric evaluation of the destained, moist CAP is per-ormed using a suitable scanner and an imaging software, which
easures the optical density of the dyed spots. The heparin residuepots are not taken into account in the evaluation.
The relative amount (percentage) of dermatan sulfate and anyther individual glycosaminoglycan impurity in the heparin samples calculated by means of a linear 3-point calibration curve, whichas calculated from the densitometric signals (peak areas) of theermatan sulfate standard spots.
Other glycosaminoglycan reference standards, e.g. OSCS, may besed as well if available.
. Results and discussion
.1. Specificity
A typical example of a CAP obtained after the regular elec-rophoretic separation is illustrated in Fig. 1.
Heparin is degraded by application of nitrous acid. Only minorrtifacts of non nitrous acid degradable heparin may be visible onhe CAP in some cases. However, these artifacts do not interfereith stained GAG spots of chondroitin sulfate, dermatan sulfate or
he new impurity. If visible, they are of weak intensity and migrateaster than dermatan sulfate, but slower than chondroitin sulfate.SCS does not exhibit any electrophoretic mobility under the exper-
mental conditions and remains at the origin of the electrophoresislate.
Dermatan sulfate and other possible impurities (chondroitinulfate A&C, OSCS) are clearly separated from each other, only chon-roitin sulfate A and chondroitin sulfate B could not be separated;pecific quantification of OSCS, dermatan sulfate and chondroitin&C is thus possible.
Analytical results received by the cellulose acetate plate elec-
rophoresis method were compared with data obtained by theethods published by FDA [7] (1H NMR and CE [10]). These exper-ments indicate that the impurity depicted in Fig. 1 is identical
ith the new impurity found by FDA [7] and recently identifieds oversulfated chondroitin sulfate [8].
R. Domanig et al. / Journal of Pharmaceutical an
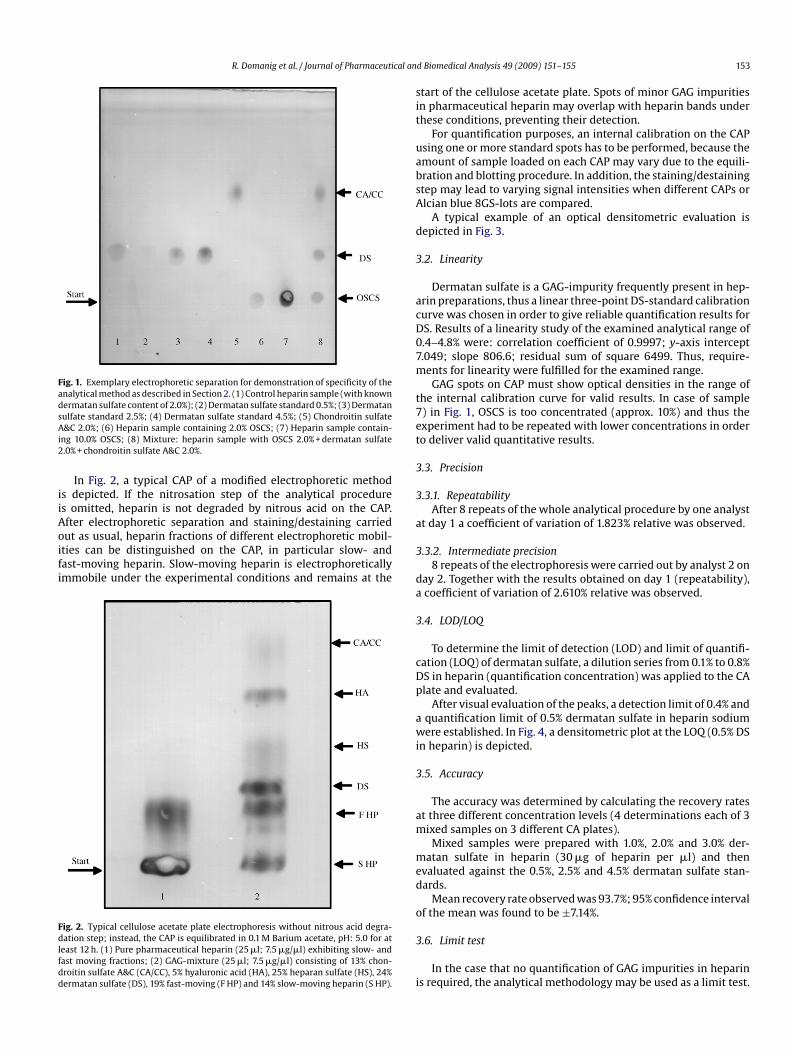
Fig. 1. Exemplary electrophoretic separation for demonstration of specificity of theanalytical method as described in Section 2. (1) Control heparin sample (with knowndermatan sulfate content of 2.0%); (2) Dermatan sulfate standard 0.5%; (3) DermatansAi2
iiAoifi
Fdlfdd
sit
uabsA
d
3
acD07m
t7et
3
3
ulfate standard 2.5%; (4) Dermatan sulfate standard 4.5%; (5) Chondroitin sulfate&C 2.0%; (6) Heparin sample containing 2.0% OSCS; (7) Heparin sample contain-
ng 10.0% OSCS; (8) Mixture: heparin sample with OSCS 2.0% + dermatan sulfate.0% + chondroitin sulfate A&C 2.0%.
In Fig. 2, a typical CAP of a modified electrophoretic methods depicted. If the nitrosation step of the analytical procedures omitted, heparin is not degraded by nitrous acid on the CAP.fter electrophoretic separation and staining/destaining carried
ut as usual, heparin fractions of different electrophoretic mobil-ties can be distinguished on the CAP, in particular slow- andast-moving heparin. Slow-moving heparin is electrophoreticallymmobile under the experimental conditions and remains at theig. 2. Typical cellulose acetate plate electrophoresis without nitrous acid degra-ation step; instead, the CAP is equilibrated in 0.1 M Barium acetate, pH: 5.0 for at
east 12 h. (1) Pure pharmaceutical heparin (25 �l; 7.5 �g/�l) exhibiting slow- andast moving fractions; (2) GAG-mixture (25 �l; 7.5 �g/�l) consisting of 13% chon-roitin sulfate A&C (CA/CC), 5% hyaluronic acid (HA), 25% heparan sulfate (HS), 24%ermatan sulfate (DS), 19% fast-moving (F HP) and 14% slow-moving heparin (S HP).
a
3
da
3
cDp
awi
3
am
med
o
3
i
d Biomedical Analysis 49 (2009) 151–155 153
tart of the cellulose acetate plate. Spots of minor GAG impuritiesn pharmaceutical heparin may overlap with heparin bands underhese conditions, preventing their detection.
For quantification purposes, an internal calibration on the CAPsing one or more standard spots has to be performed, because themount of sample loaded on each CAP may vary due to the equili-ration and blotting procedure. In addition, the staining/destainingtep may lead to varying signal intensities when different CAPs orlcian blue 8GS-lots are compared.
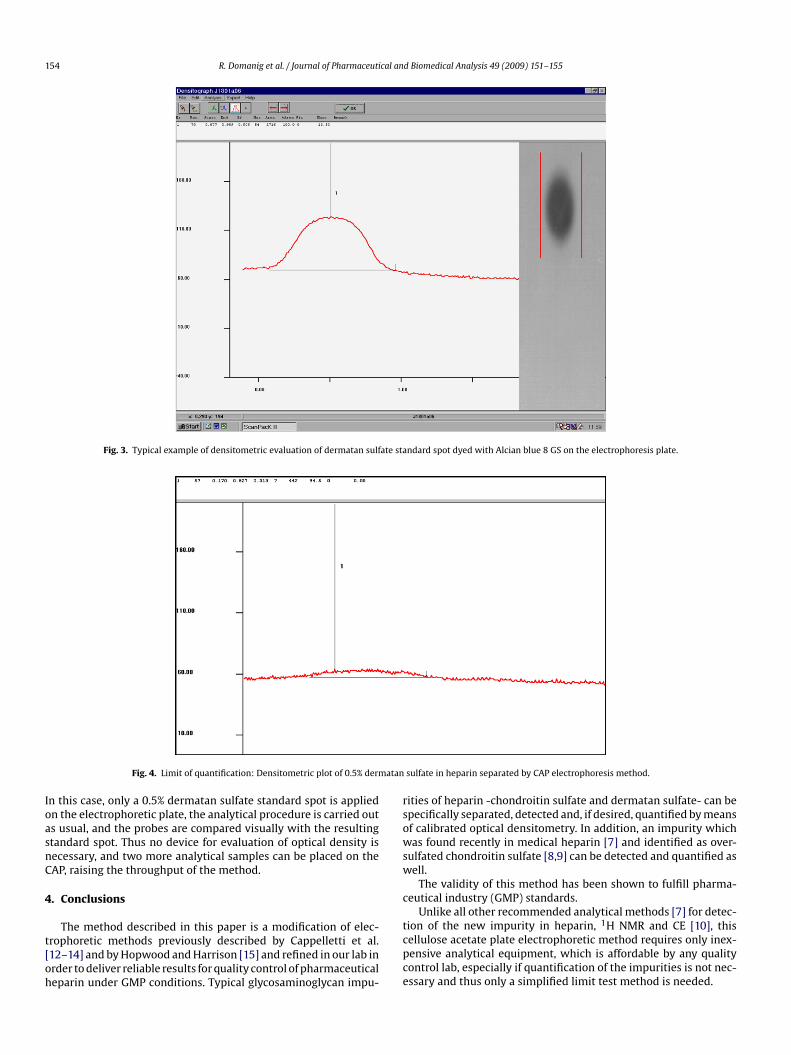
A typical example of an optical densitometric evaluation isepicted in Fig. 3.
.2. Linearity
Dermatan sulfate is a GAG-impurity frequently present in hep-rin preparations, thus a linear three-point DS-standard calibrationurve was chosen in order to give reliable quantification results forS. Results of a linearity study of the examined analytical range of.4–4.8% were: correlation coefficient of 0.9997; y-axis intercept.049; slope 806.6; residual sum of square 6499. Thus, require-ents for linearity were fulfilled for the examined range.GAG spots on CAP must show optical densities in the range of
he internal calibration curve for valid results. In case of sample) in Fig. 1, OSCS is too concentrated (approx. 10%) and thus thexperiment had to be repeated with lower concentrations in ordero deliver valid quantitative results.
.3. Precision
.3.1. RepeatabilityAfter 8 repeats of the whole analytical procedure by one analyst
t day 1 a coefficient of variation of 1.823% relative was observed.
.3.2. Intermediate precision8 repeats of the electrophoresis were carried out by analyst 2 on
ay 2. Together with the results obtained on day 1 (repeatability),coefficient of variation of 2.610% relative was observed.
.4. LOD/LOQ
To determine the limit of detection (LOD) and limit of quantifi-ation (LOQ) of dermatan sulfate, a dilution series from 0.1% to 0.8%S in heparin (quantification concentration) was applied to the CAlate and evaluated.
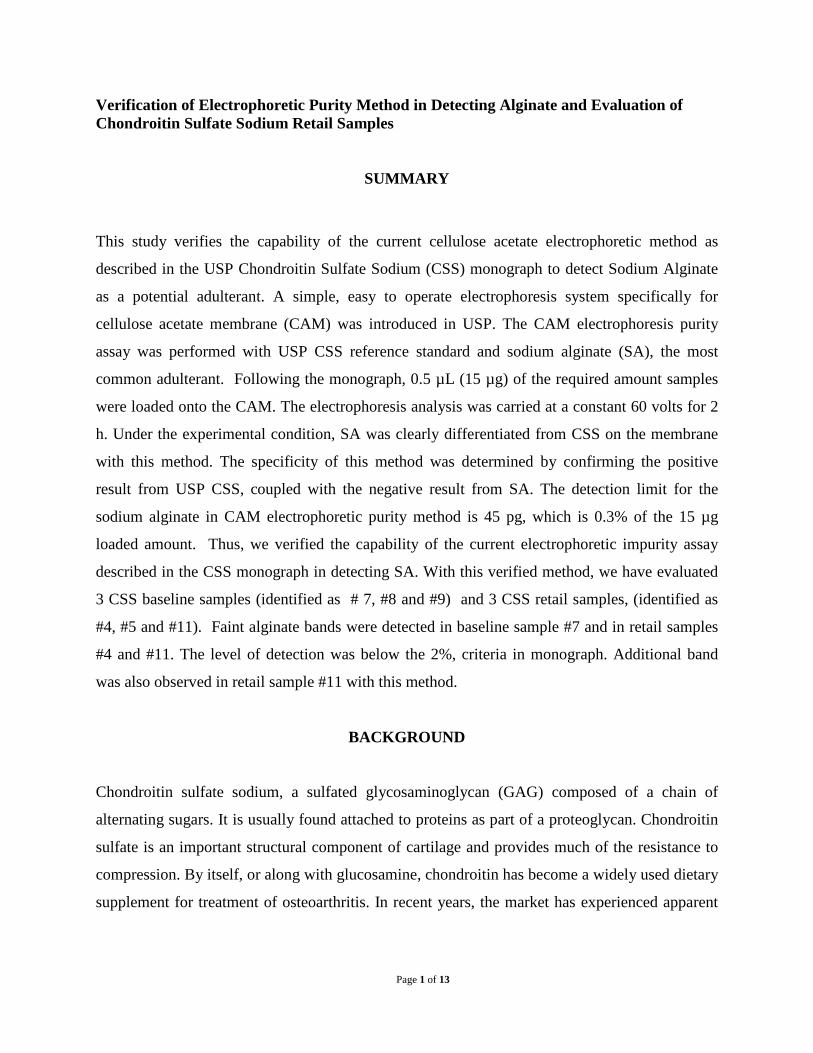
After visual evaluation of the peaks, a detection limit of 0.4% andquantification limit of 0.5% dermatan sulfate in heparin sodiumere established. In Fig. 4, a densitometric plot at the LOQ (0.5% DS
n heparin) is depicted.
.5. Accuracy
The accuracy was determined by calculating the recovery ratest three different concentration levels (4 determinations each of 3ixed samples on 3 different CA plates).Mixed samples were prepared with 1.0%, 2.0% and 3.0% der-
atan sulfate in heparin (30 �g of heparin per �l) and thenvaluated against the 0.5%, 2.5% and 4.5% dermatan sulfate stan-ards.
Mean recovery rate observed was 93.7%; 95% confidence intervalf the mean was found to be ±7.14%.
.6. Limit test
In the case that no quantification of GAG impurities in heparins required, the analytical methodology may be used as a limit test.
154 R. Domanig et al. / Journal of Pharmaceutical and Biomedical Analysis 49 (2009) 151–155
Fig. 3. Typical example of densitometric evaluation of dermatan sulfate standard spot dyed with Alcian blue 8 GS on the electrophoresis plate.
atan
IoasnC
4
t[oh
rsowsw
c
Fig. 4. Limit of quantification: Densitometric plot of 0.5% derm
n this case, only a 0.5% dermatan sulfate standard spot is appliedn the electrophoretic plate, the analytical procedure is carried outs usual, and the probes are compared visually with the resultingtandard spot. Thus no device for evaluation of optical density isecessary, and two more analytical samples can be placed on theAP, raising the throughput of the method.
. Conclusions
The method described in this paper is a modification of elec-rophoretic methods previously described by Cappelletti et al.12–14] and by Hopwood and Harrison [15] and refined in our lab inrder to deliver reliable results for quality control of pharmaceuticaleparin under GMP conditions. Typical glycosaminoglycan impu-
tcpce
sulfate in heparin separated by CAP electrophoresis method.
ities of heparin -chondroitin sulfate and dermatan sulfate- can bepecifically separated, detected and, if desired, quantified by meansf calibrated optical densitometry. In addition, an impurity whichas found recently in medical heparin [7] and identified as over-
ulfated chondroitin sulfate [8,9] can be detected and quantified asell.
The validity of this method has been shown to fulfill pharma-eutical industry (GMP) standards.
Unlike all other recommended analytical methods [7] for detec-
ion of the new impurity in heparin, 1H NMR and CE [10], thisellulose acetate plate electrophoretic method requires only inex-ensive analytical equipment, which is affordable by any qualityontrol lab, especially if quantification of the impurities is not nec-ssary and thus only a simplified limit test method is needed.
cal an
au
R
[
[
R. Domanig et al. / Journal of Pharmaceuti
Therefore we recommend this simple and reliable method as andditional tool for quality control of pharmaceutical heparin to besed by health authorities and in the pharmaceutical industry.
eferences
[1] The European Council, European Directorate for the Quality of Medicines& HealthCare, The European Pharmacopoeia, 6th ed., Strasbourg, France,2008.
[2] The Unites States Pharmacopeial Convention, The Unites States Pharmacopeia,USP, 30–NF, 25, Rockville, MD, 2008.
[3] R.J. Linhardt, N.S. Gunay, Semin. Thromb. Hemost 25 (1999) 5–16.[4] K.R. Holme, A.S. Perlin, Carbohydr. Res. 186 (1989) 301–312.[5] R.J. Linhardt, Chem. Indust. 2 (1991) 45–50.[6] J. Hirsh, R. Raschke, Chest 126 (Suppl. 3) (2004) 188–203.
[[
[
[
d Biomedical Analysis 49 (2009) 151–155 155
[7] US Food and Drug Administration, Communication. Information on HeparinSodium Injection, <http://www.fda.gov/cder/drug/infopage/heparin/default.htm>.
[8] M. Guerrini, D. Beccati, Z. Shriver, et al., Nat. Biotechnol. 26 (2008) 669–675.
[9] T.K. Kishimoto, K. Viswanathan, T. Ganguly, et al., N. Engl. J. Med. 358 (2008)2457–2467.
10] R.P. Patel, C. Narkowica, J.P. Hutchinson, E.F. Hilder, G.A. Jacobson, J. Pharm.Biomed. Anal. 46 (2008) 30–35.
11] N. Volpi, F. Maccari, J. Chromatogr. B 834 (2006) 1–13.
12] R. Cappelletti, M.D. Rosso, V.P. Chiarugi, Anal. Biochem. 93 (1979) 37–40.13] R. Cappelletti, M.D. Rosso, V.P. Chiarugi, Anal. Biochem. 99 (1979) 311–315.14] R. Cappelletti, M.D. Rosso, V.P. Chiarugi, Anal. Biochem. 105 (1980) 430–
435.15] J.J. Hopwood, J.R. Harrison, Anal. Biochem. 119 (1981) 120–127.
Page 1 of 13
Verification of Electrophoretic Purity Method in Detecting Alginate and Evaluation of Chondroitin Sulfate Sodium Retail Samples
SUMMARY
This study verifies the capability of the current cellulose acetate electrophoretic method as
described in the USP Chondroitin Sulfate Sodium (CSS) monograph to detect Sodium Alginate
as a potential adulterant. A simple, easy to operate electrophoresis system specifically for
cellulose acetate membrane (CAM) was introduced in USP. The CAM electrophoresis purity
assay was performed with USP CSS reference standard and sodium alginate (SA), the most
common adulterant. Following the monograph, 0.5 µL (15 µg) of the required amount samples
were loaded onto the CAM. The electrophoresis analysis was carried at a constant 60 volts for 2
h. Under the experimental condition, SA was clearly differentiated from CSS on the membrane
with this method. The specificity of this method was determined by confirming the positive
result from USP CSS, coupled with the negative result from SA. The detection limit for the
sodium alginate in CAM electrophoretic purity method is 45 pg, which is 0.3% of the 15 µg
loaded amount. Thus, we verified the capability of the current electrophoretic impurity assay
described in the CSS monograph in detecting SA. With this verified method, we have evaluated
3 CSS baseline samples (identified as # 7, #8 and #9) and 3 CSS retail samples, (identified as
#4, #5 and #11). Faint alginate bands were detected in baseline sample #7 and in retail samples
#4 and #11. The level of detection was below the 2%, criteria in monograph. Additional band
was also observed in retail sample #11 with this method.
BACKGROUND
Chondroitin sulfate sodium, a sulfated glycosaminoglycan (GAG) composed of a chain of
alternating sugars. It is usually found attached to proteins as part of a proteoglycan. Chondroitin
sulfate is an important structural component of cartilage and provides much of the resistance to
compression. By itself, or along with glucosamine, chondroitin has become a widely used dietary
supplement for treatment of osteoarthritis. In recent years, the market has experienced apparent
Page 2 of 13
adulteration in the supply chain of chondroitin sulfate as demand rises and scarcity of raw
materials intensifies.
Certain substances are known have been incorporated in various types of chondroitin sulfate
sodium products in economically motivated adulteration to achieve cost advantages. Commonly
known adulterants include variations of alginate (alginic acid), which has similar physical and
chemical properties to that of chondroitin sulfate: soluble in water but insoluble in ethanol, and
can form ionic pairs with cetylpyridinium ions, thus interfering with the assay procedure in the
monograph (CPC titration) making it a candidate for adulteration of chondroitin sulfate sodium
samples. Detection and determination of presence of adulterations even at significant levels with
presently accepted analytical tools, such as spectrometry, chromatography, and electrochemistry
fall short in various ways due to certain limitations.
To assure the quality of the material, the current USP Chondroitin Sulfate Sodium monograph
requires a purity test in conjunction with the assay to measure the content of chondroitin sulfate
sodium. The purity test described in the USP Chondroitin Sulfate Sodium monograph is a thin
layer electrophoresis using cellulose acetate membranes. The acceptance criteria in the
Chondroitin Monograph is the visibility of 2% of the 15 µg loaded amount and NMT 2% of any
individual impurity.
We have received reports on the use of the current USP electrophoretic impurity method in
detecting the level of alginate in CSS product. This study set out to verify the method in
detecting alginate and to evaluate the applicability of the method in detecting the presence of
alginate in CSS baseline samples and retail samples.
Verification of the method has been performed by following the guideline described in the USP
General Chapter <1225> Validation of Compendial Procedures with the limit of test as listed in
category II through the visualization of sample on electrophoregram. Data elements required for
such verification include specificity and detection limit.
Page 3 of 13
EXPERIMENTAL PROCEDURE
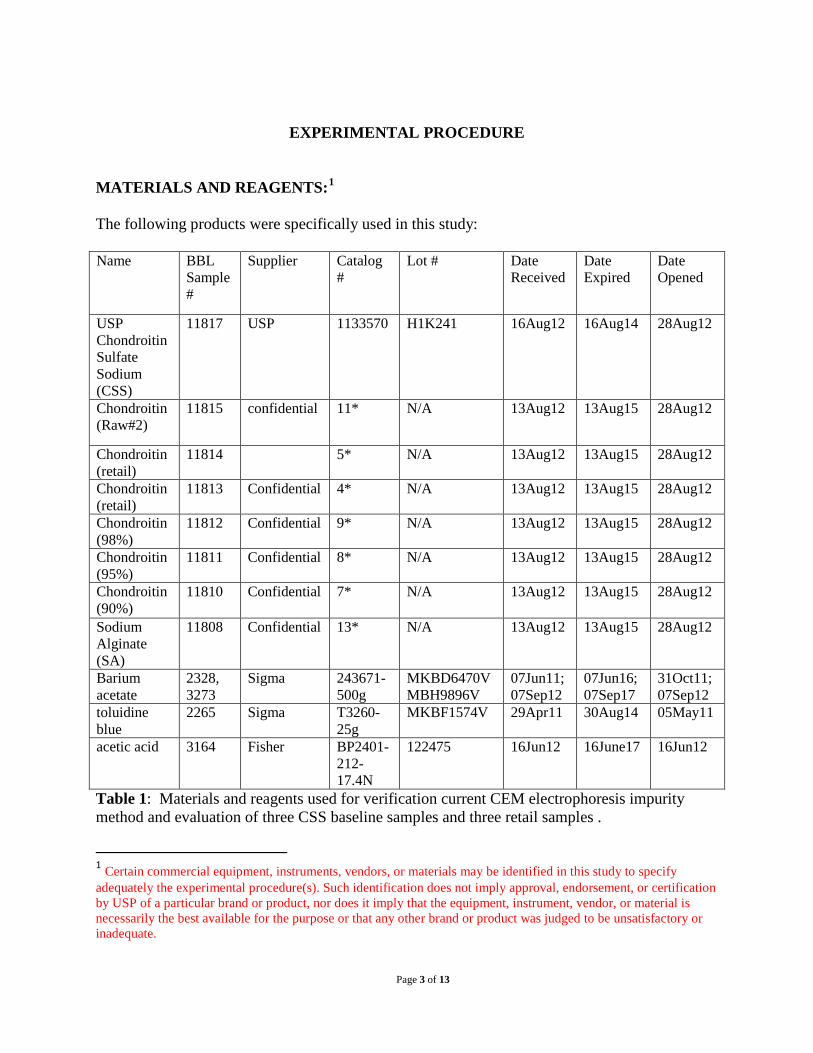
MATERIALS AND REAGENTS:1 The following products were specifically used in this study: Name BBL
Sample #
Supplier Catalog #
Lot # Date Received
Date Expired
Date Opened
USP Chondroitin Sulfate Sodium (CSS)
11817 USP 1133570 H1K241 16Aug12 16Aug14 28Aug12
Chondroitin (Raw#2)
11815 confidential 11* N/A 13Aug12 13Aug15 28Aug12
Chondroitin (retail)
11814 5* N/A 13Aug12 13Aug15 28Aug12
Chondroitin (retail)
11813 Confidential 4* N/A 13Aug12 13Aug15 28Aug12
Chondroitin (98%)
11812 Confidential 9* N/A 13Aug12 13Aug15 28Aug12
Chondroitin (95%)
11811 Confidential 8* N/A 13Aug12 13Aug15 28Aug12
Chondroitin (90%)
11810 Confidential 7* N/A 13Aug12 13Aug15 28Aug12
Sodium Alginate (SA)
11808 Confidential 13* N/A 13Aug12 13Aug15 28Aug12
Barium acetate
2328, 3273
Sigma 243671-500g
MKBD6470V MBH9896V
07Jun11; 07Sep12
07Jun16; 07Sep17
31Oct11; 07Sep12
toluidine blue
2265 Sigma T3260-25g
MKBF1574V 29Apr11 30Aug14 05May11
acetic acid
3164 Fisher BP2401-212-17.4N
122475 16Jun12 16June17 16Jun12
Table 1: Materials and reagents used for verification current CEM electrophoresis impurity method and evaluation of three CSS baseline samples and three retail samples .
1 Certain commercial equipment, instruments, vendors, or materials may be identified in this study to specify adequately the experimental procedure(s). Such identification does not imply approval, endorsement, or certification by USP of a particular brand or product, nor does it imply that the equipment, instrument, vendor, or material is necessarily the best available for the purpose or that any other brand or product was judged to be unsatisfactory or inadequate.

Page 4 of 13
*Numbers are given for purposes of material labeling during the study in order to blind confidential information about manufacturers and distributors
All materials and reagents were purchased from qualified vendors, or provided by the sponsor of
this study, and stored as recommended. When specified, lyophilized buffers were reconstituted
and prepared using in-house Mille-Q water and stored as directed according to the particular
protocol.
EQUIPMENT:
pH meter: PHMT-0023
Balance: BALA-0077; BALA-0078
Stirrer: STIR-0066
Sample dry oven: OVEN-0051
Electrophoresis system: Semi-Micro II chamber (Product No: 51214), Sepratek-4 applicator
(Product No: 51214) DiaSys or Apacor, Berkshire, UK (Distributed in USA by VWR
International LLC Radnor, PA Tel: 800 932 5000 Website: www.vwr.com)
Power supply: POWR-0004
Shaker: SHAK-0011
Timer: TIMR-0101
Pipette: PPXX-0132, PPXX-0169, PPXX-0140, PPXX-0149
Imaging system: VersaDoc imaging system, IMAG-0001
Milli-Q water supply: WPUR-0023
PROCEDURE: Prepare reagents
1. Barium acetate buffer
Dissolve 25.24g Barium acetate in 900 mL of water. Adjust with acetic acid to a pH of
5.0, and dilute with water to 1000ml.
2. Staining solution:
a. Dilute 5.75mL of 17.4N acetic acid into 994.25 mL water to make 0.1N acetic
acid ;
b. Dissolve 1g of toludine blue O in 100mL of 0.1N acetic acid

Page 5 of 13
3. Destaining solution (5% acetic acid): 50ml acetic acid into 950 mL Milli-Q water
4. Standard solution and sample solution
a. Dry all the samples at 104°C for 4hrs before using
b. Make the standard solution and sample solution at 30mg/ml, aliquot at 40 µL and
store at -20°C freezer
Electrophoresis
1. Sample application
a. Fully soak the membrane in barium acetate buffer for 10-15mins
b. Dry with an absorbent pad and transfer to three bridges
c. Load 10 µL samples into Sepratek applicator 4, hold teeth into samples for 15
seconds
d. Transfer across to the soaked membrane and place the teeth on top of the
membrane and hold down for 15 seconds
2. Electrophoresis
a. Fill the Semi-Micro II chamber up with 100 mL of barium acetate buffer solution
either side of the chamber, so the membrane will be in contact with it; make sure
the sample should be close to the negative electrode.
b. Close the chamber, the circuit is complete
c. Equalize for 5 mins. Apply a constant 60 volt (about 6 mA current) for 2 hours.
3. Staining
a. Transfer the membranes to a vessel containing staining solution for 5 minutes
b. Place the stained membrane to the destaining solution. De-stain until the
background of the membrane is clear.
c. Dry the membrane with absorbent pad.
d. Scan or take photo of the results with VersaDoc imaging system.
RESULTS AND DISCUSSION
Cellulose Acetate Membrane Electrophoresis System Since the commonly known adulterant alginate has similar physical and chemical properties to
CSS, a number of analytical methods have been used to detect potential alginate adulteration.
Each of these methods has certain inherent limitations and thus fall short in various ways.
Page 6 of 13
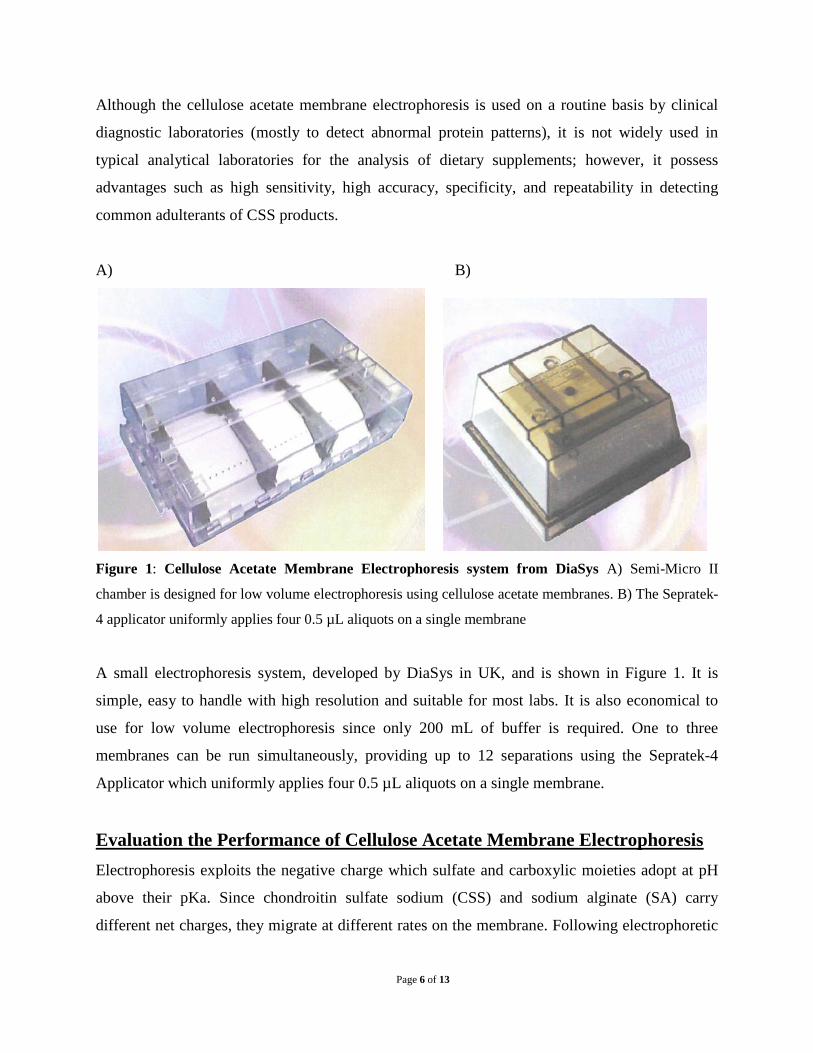
Although the cellulose acetate membrane electrophoresis is used on a routine basis by clinical
diagnostic laboratories (mostly to detect abnormal protein patterns), it is not widely used in
typical analytical laboratories for the analysis of dietary supplements; however, it possess
advantages such as high sensitivity, high accuracy, specificity, and repeatability in detecting
common adulterants of CSS products.
A) B)
Figure 1: Cellulose Acetate Membrane Electrophoresis system from DiaSys A) Semi-Micro II
chamber is designed for low volume electrophoresis using cellulose acetate membranes. B) The Sepratek-
4 applicator uniformly applies four 0.5 µL aliquots on a single membrane
A small electrophoresis system, developed by DiaSys in UK, and is shown in Figure 1. It is
simple, easy to handle with high resolution and suitable for most labs. It is also economical to
use for low volume electrophoresis since only 200 mL of buffer is required. One to three
membranes can be run simultaneously, providing up to 12 separations using the Sepratek-4
Applicator which uniformly applies four 0.5 µL aliquots on a single membrane.
Evaluation the Performance of Cellulose Acetate Membrane Electrophoresis Electrophoresis exploits the negative charge which sulfate and carboxylic moieties adopt at pH
above their pKa. Since chondroitin sulfate sodium (CSS) and sodium alginate (SA) carry
different net charges, they migrate at different rates on the membrane. Following electrophoretic
Page 7 of 13
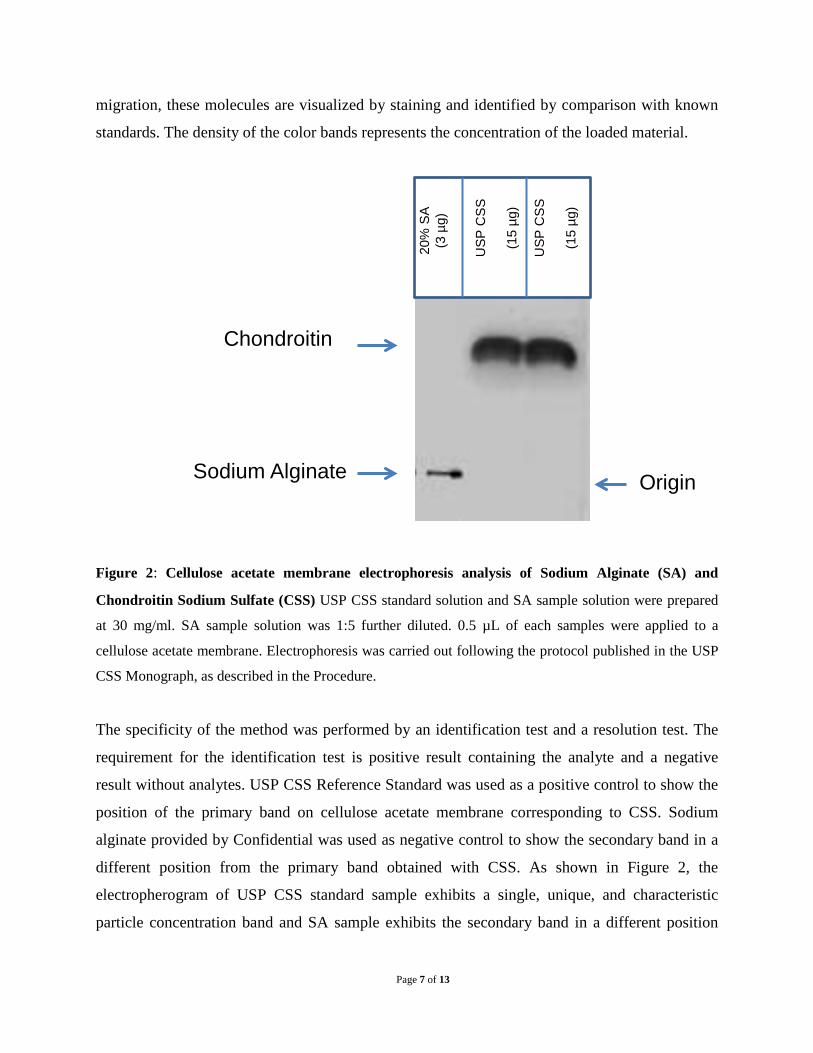
migration, these molecules are visualized by staining and identified by comparison with known
standards. The density of the color bands represents the concentration of the loaded material.
Figure 2: Cellulose acetate membrane electrophoresis analysis of Sodium Alginate (SA) and
Chondroitin Sodium Sulfate (CSS) USP CSS standard solution and SA sample solution were prepared
at 30 mg/ml. SA sample solution was 1:5 further diluted. 0.5 µL of each samples were applied to a
cellulose acetate membrane. Electrophoresis was carried out following the protocol published in the USP
CSS Monograph, as described in the Procedure.
The specificity of the method was performed by an identification test and a resolution test. The
requirement for the identification test is positive result containing the analyte and a negative
result without analytes. USP CSS Reference Standard was used as a positive control to show the
position of the primary band on cellulose acetate membrane corresponding to CSS. Sodium
alginate provided by Confidential was used as negative control to show the secondary band in a
different position from the primary band obtained with CSS. As shown in Figure 2, the
electropherogram of USP CSS standard sample exhibits a single, unique, and characteristic
particle concentration band and SA sample exhibits the secondary band in a different position
20%
SA
(3
µg)
USP
CS
S
(15
µg)
USP
CS
S
(15
µg)
Chondroitin
Sodium Alginate Origin
Page 8 of 13
from CSS. Because of the different net charge, SA migrated much slower than CSS, which
allows us to distinguish the two products with this methodology.
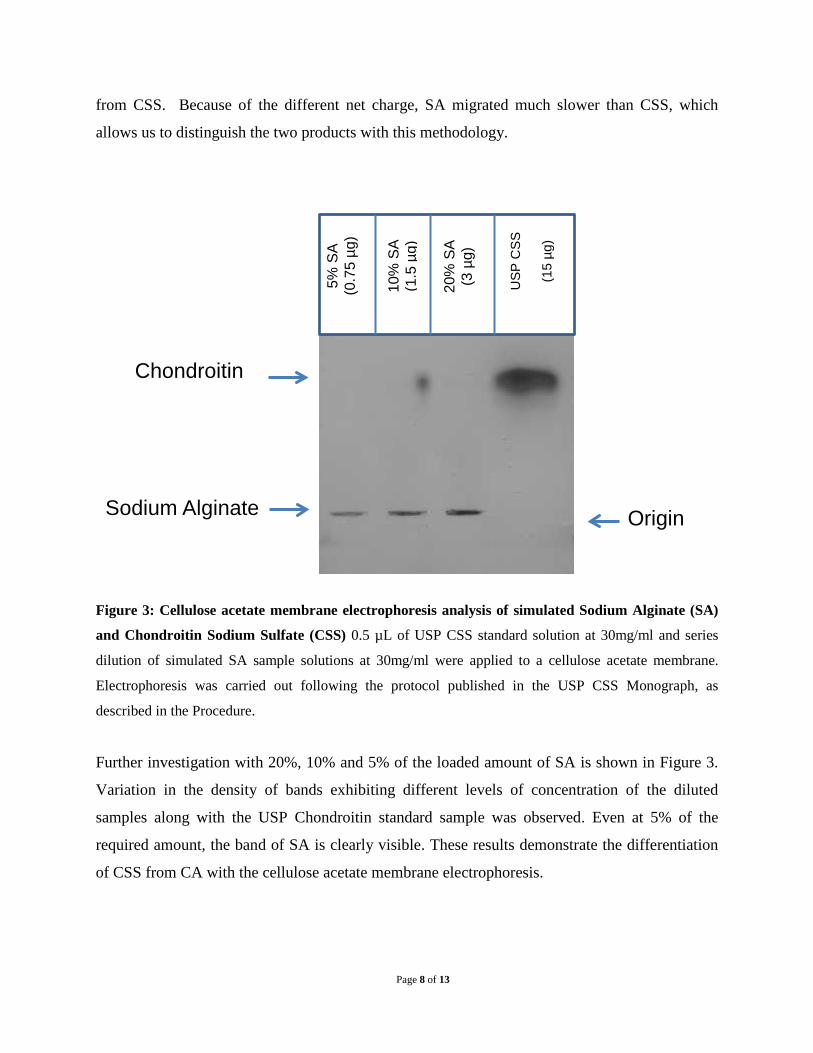
Figure 3: Cellulose acetate membrane electrophoresis analysis of simulated Sodium Alginate (SA)
and Chondroitin Sodium Sulfate (CSS) 0.5 µL of USP CSS standard solution at 30mg/ml and series
dilution of simulated SA sample solutions at 30mg/ml were applied to a cellulose acetate membrane.
Electrophoresis was carried out following the protocol published in the USP CSS Monograph, as
described in the Procedure.
Further investigation with 20%, 10% and 5% of the loaded amount of SA is shown in Figure 3.
Variation in the density of bands exhibiting different levels of concentration of the diluted
samples along with the USP Chondroitin standard sample was observed. Even at 5% of the
required amount, the band of SA is clearly visible. These results demonstrate the differentiation
of CSS from CA with the cellulose acetate membrane electrophoresis.
5% S
A (0
.75
µg)
10%
SA
(1.5
µg)
20%
SA
(3 µ
g)
USP
CS
S
(15
µg)
Chondroitin
Sodium Alginate Origin
Page 9 of 13
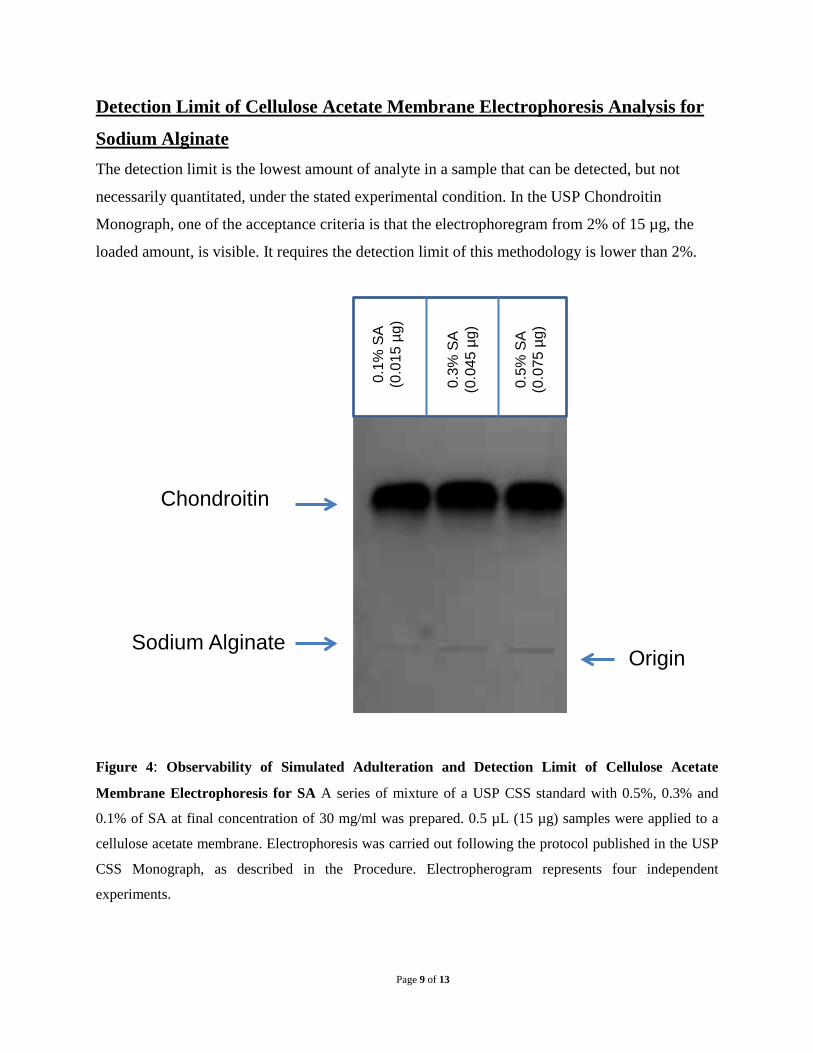
Detection Limit of Cellulose Acetate Membrane Electrophoresis Analysis for
Sodium Alginate The detection limit is the lowest amount of analyte in a sample that can be detected, but not
necessarily quantitated, under the stated experimental condition. In the USP Chondroitin
Monograph, one of the acceptance criteria is that the electrophoregram from 2% of 15 µg, the
loaded amount, is visible. It requires the detection limit of this methodology is lower than 2%.
Figure 4: Observability of Simulated Adulteration and Detection Limit of Cellulose Acetate
Membrane Electrophoresis for SA A series of mixture of a USP CSS standard with 0.5%, 0.3% and
0.1% of SA at final concentration of 30 mg/ml was prepared. 0.5 µL (15 µg) samples were applied to a
cellulose acetate membrane. Electrophoresis was carried out following the protocol published in the USP
CSS Monograph, as described in the Procedure. Electropherogram represents four independent
experiments.
Chondroitin
Sodium Alginate
0.
1% S
A (0
.015
µg)
0.3%
SA
(0.0
45 µ
g)
0.5%
SA
(0.0
75 µ
g)
Origin
Page 10 of 13
To determine the detection limit, a series of mixture of USP CSS standard with 20%, 10%, 5%,
4%, 2%, 1%, 0.5%, 0.3% and 0.1% of SA were prepared to a final concentration of 30 mg/mL.
0.5 µL, the 15 µg loaded amount of samples were analyzed. When alginate sodium reaches
0.3%, electropherogram shows a visible identical band corresponding to SA, whereas at 0.1%,
observation of the band becomes uncertain (Figure 4). Four independent experiments were
carried with similar results. Therefore, this method can detect as little as 45 pg of SA which is
0.3% of the loaded amount by monograph. The study demonstrates that this method is reliable to
detect the impurity of the chondroitin product.
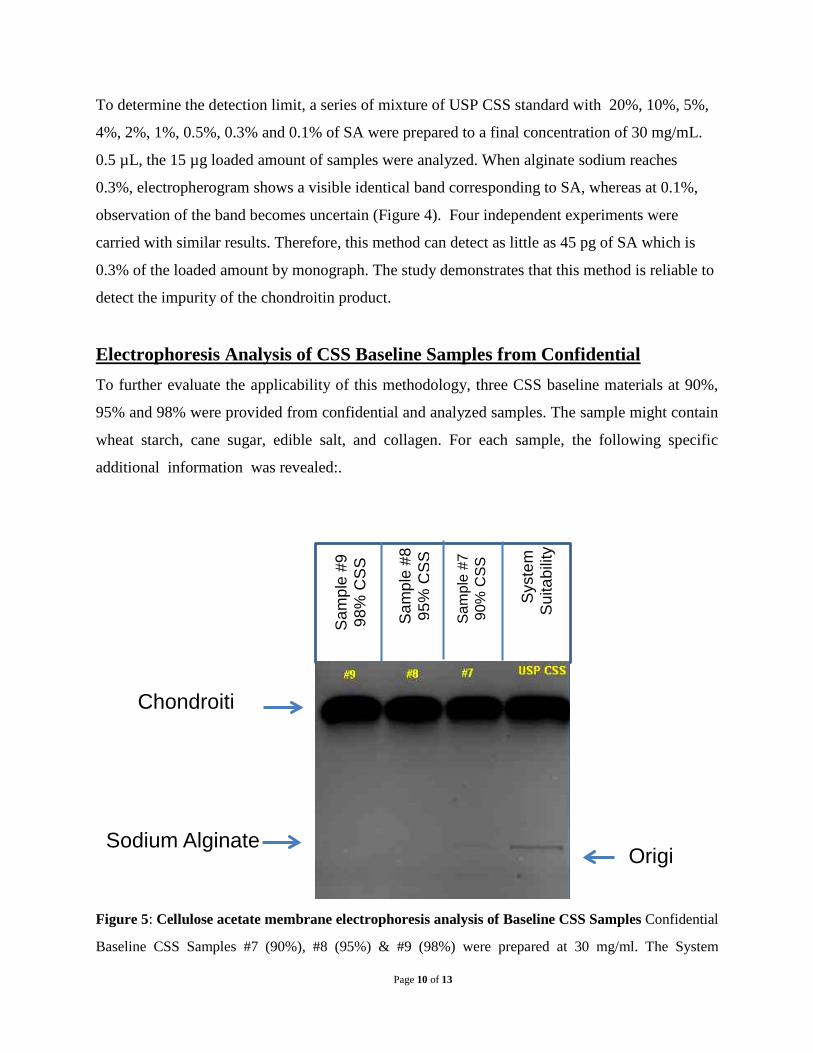
Electrophoresis Analysis of CSS Baseline Samples from Confidential To further evaluate the applicability of this methodology, three CSS baseline materials at 90%,
95% and 98% were provided from confidential and analyzed samples. The sample might contain
wheat starch, cane sugar, edible salt, and collagen. For each sample, the following specific
additional information was revealed:.
Figure 5: Cellulose acetate membrane electrophoresis analysis of Baseline CSS Samples Confidential
Baseline CSS Samples #7 (90%), #8 (95%) & #9 (98%) were prepared at 30 mg/ml. The System
Sam
ple
#7
90%
CSS
Sam
ple
#8
95%
CS
S
Sys
tem
S
uita
bilit
y
Sam
ple
#9
98%
CS
S
Chondroiti
Sodium Alginate Origi
Page 11 of 13
Suitability sample was made from 98% of USP CSS mixed with 2% of SA at a final concentration of 30
mg/ml. 0.5 µL, 15 µg of each samples were applied to a cellulose acetate membrane. Electrophoresis was
carried out following the protocol published in USP CSS Monograph, as described in the Procedure.
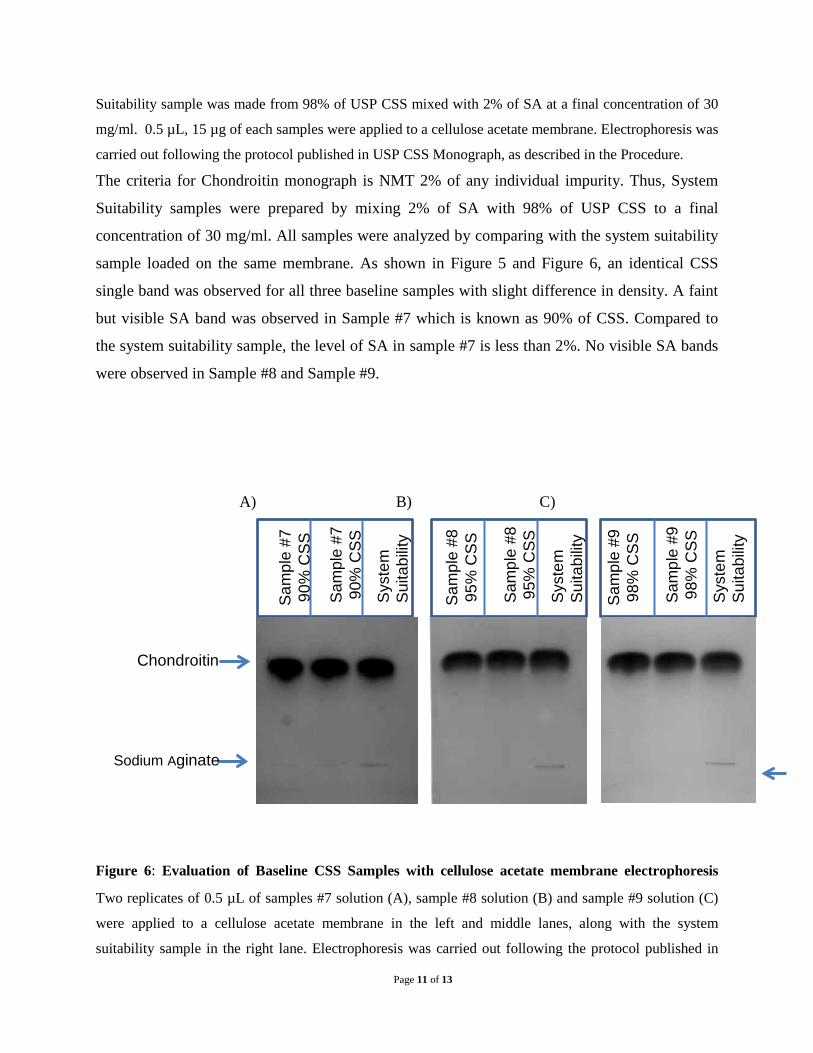
The criteria for Chondroitin monograph is NMT 2% of any individual impurity. Thus, System
Suitability samples were prepared by mixing 2% of SA with 98% of USP CSS to a final
concentration of 30 mg/ml. All samples were analyzed by comparing with the system suitability
sample loaded on the same membrane. As shown in Figure 5 and Figure 6, an identical CSS
single band was observed for all three baseline samples with slight difference in density. A faint
but visible SA band was observed in Sample #7 which is known as 90% of CSS. Compared to
the system suitability sample, the level of SA in sample #7 is less than 2%. No visible SA bands
were observed in Sample #8 and Sample #9.
A) B) C)
Figure 6: Evaluation of Baseline CSS Samples with cellulose acetate membrane electrophoresis
Two replicates of 0.5 µL of samples #7 solution (A), sample #8 solution (B) and sample #9 solution (C)
were applied to a cellulose acetate membrane in the left and middle lanes, along with the system
suitability sample in the right lane. Electrophoresis was carried out following the protocol published in
Sam
ple
#7
90%
CS
S
Sam
ple
#7
90%
CS
S
Sys
tem
S
uita
bilit
y
Sam
ple
#8
95%
CS
S
Sam
ple
#8
95%
CS
S
Sys
tem
S
uita
bilit
y
Sam
ple
#9
98%
CS
S
Sam
ple
#9
98%
CS
S
Sys
tem
S
uita
bilit
y
Chondroitin
Sodium Aginate
Page 12 of 13
USP CSS Monograph, as described in the Procedure. Electropherogram represents four independent
experiments.
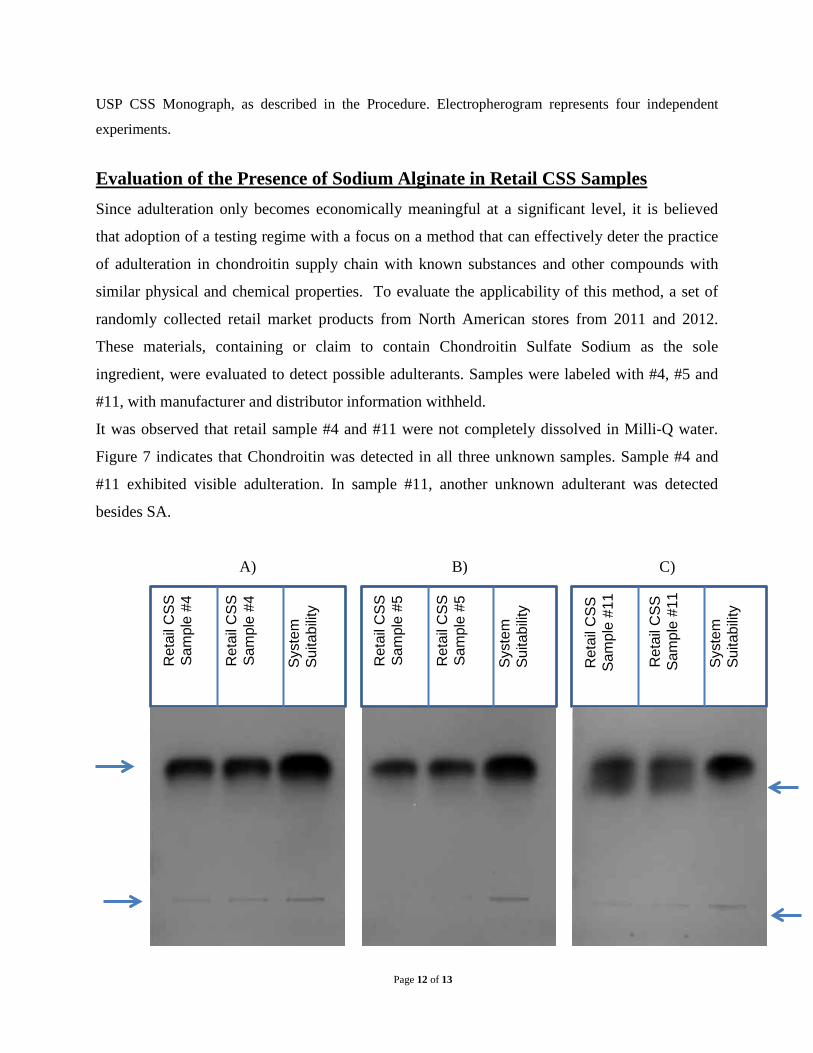
Evaluation of the Presence of Sodium Alginate in Retail CSS Samples Since adulteration only becomes economically meaningful at a significant level, it is believed
that adoption of a testing regime with a focus on a method that can effectively deter the practice
of adulteration in chondroitin supply chain with known substances and other compounds with
similar physical and chemical properties. To evaluate the applicability of this method, a set of
randomly collected retail market products from North American stores from 2011 and 2012.
These materials, containing or claim to contain Chondroitin Sulfate Sodium as the sole
ingredient, were evaluated to detect possible adulterants. Samples were labeled with #4, #5 and
#11, with manufacturer and distributor information withheld.
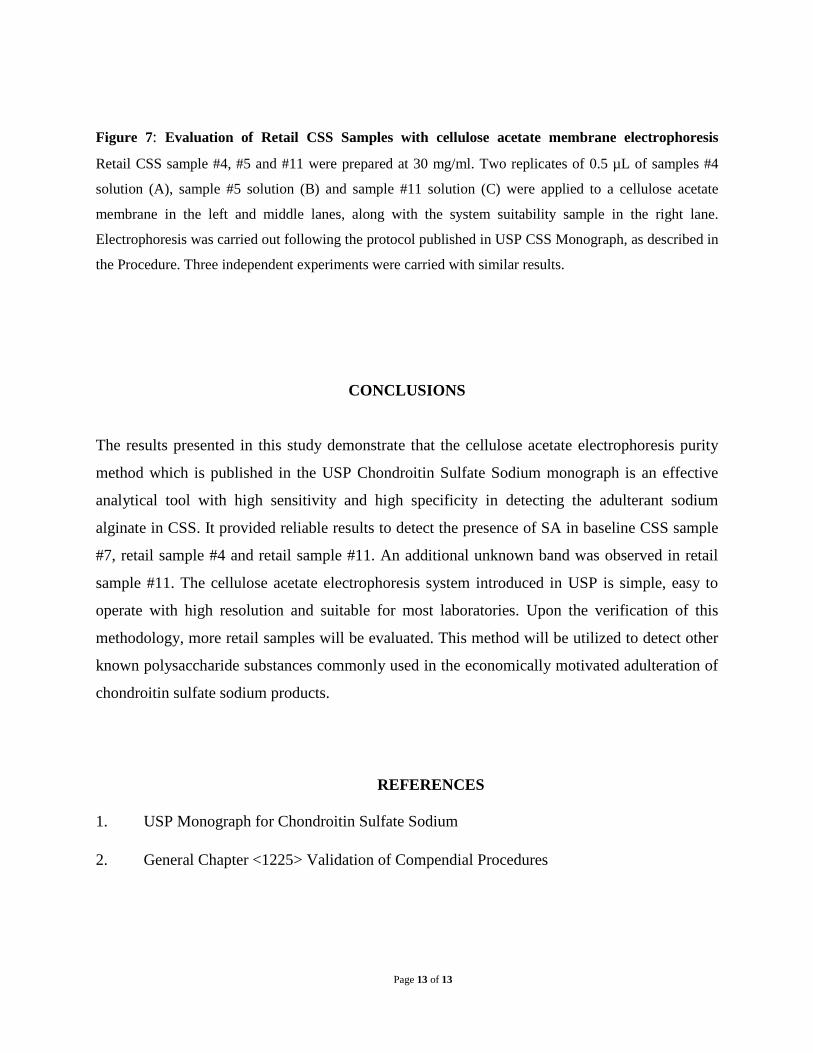
It was observed that retail sample #4 and #11 were not completely dissolved in Milli-Q water.
Figure 7 indicates that Chondroitin was detected in all three unknown samples. Sample #4 and
#11 exhibited visible adulteration. In sample #11, another unknown adulterant was detected
besides SA.
A) B) C)
Ret
ail C
SS
Sam
ple
#4
Syst
em
Suita
bilit
y
Syst
em
Suita
bilit
y
Syst
em
Suita
bilit
y
Ret
ail C
SS
Sam
ple
#4
Ret
ail C
SS
Sam
ple
#5
Ret
ail C
SS
Sam
ple
#5
Ret
ail C
SS
Sam
ple
#11
Ret
ail C
SS
Sam
ple
#11
Page 13 of 13
Figure 7: Evaluation of Retail CSS Samples with cellulose acetate membrane electrophoresis
Retail CSS sample #4, #5 and #11 were prepared at 30 mg/ml. Two replicates of 0.5 µL of samples #4
solution (A), sample #5 solution (B) and sample #11 solution (C) were applied to a cellulose acetate
membrane in the left and middle lanes, along with the system suitability sample in the right lane.
Electrophoresis was carried out following the protocol published in USP CSS Monograph, as described in
the Procedure. Three independent experiments were carried with similar results.
CONCLUSIONS
The results presented in this study demonstrate that the cellulose acetate electrophoresis purity
method which is published in the USP Chondroitin Sulfate Sodium monograph is an effective
analytical tool with high sensitivity and high specificity in detecting the adulterant sodium
alginate in CSS. It provided reliable results to detect the presence of SA in baseline CSS sample
#7, retail sample #4 and retail sample #11. An additional unknown band was observed in retail
sample #11. The cellulose acetate electrophoresis system introduced in USP is simple, easy to
operate with high resolution and suitable for most laboratories. Upon the verification of this
methodology, more retail samples will be evaluated. This method will be utilized to detect other
known polysaccharide substances commonly used in the economically motivated adulteration of
chondroitin sulfate sodium products.
REFERENCES
1. USP Monograph for Chondroitin Sulfate Sodium
2. General Chapter <1225> Validation of Compendial Procedures
Zhang et al.: Journal of aoaC InternatIonal Vol. 97, no. 6, 2014 1
Electrophoretic Separation of Alginic Sodium Diester and Sodium Hexametaphosphate in Chondroitin Sulfate that Interfere with the Cetylpyridinium Chloride Titration Assay Weiguo ZhangSynutra Research Laboratory, 2275 Research Blvd, Rockville, MD 20850gabriel giancaspro and Kristie M. adaMsUnited States Pharmacopeial Convention, 12601 Twinbrook Pkwy, Rockville, MD 20852JaMes neal-KababicKFlora Research Laboratories, 1000 SE M St, Unit B, Grants Pass, OR 97526Jana hildrethSynutra Research Laboratory, 2275 Research Blvd, Rockville, MDaishan liMeitek Technology (Qingdao) Co., Ltd, Jiaonan City, Qingdao, People’s Republic of ChinaMarK c. roMan1
Tampa Bay Analytical Research, 13130 56th Court, Suite 606, Clearwater, FL 33760 Joseph M. betZNational Institutes of Health, Office of Dietary Supplements, 6100 Executive Blvd, Bethesda, MD 20892
Received August 8, 2014. Accepted by AP September 18, 2014.Corresponding author’s e-mail: [email protected] Author to whom this manuscript is dedicated.Supplemental information is available on the J. AOAC Int. website,
http://aoac.publisher.ingentaconnect.com/content/aoac/jaoacDOI: 10.5740/jaoacint.14-167
DIETARY SUPPLEMENTS
The most commonly used chondroitin sulfate (CS) assay method is cetylpyridinium chloride (CPC) titration. Cellulose acetate membrane electrophoresis (CAME) is the technique used for detection of impurities in the U.S. Pharmacopeia’s CS monograph. Because CPC titration is a relatively nonspecific quantitative technique, the apparent amount of CS as determined by CPC titration alone may not reflect the true amount of CS due to possible interference with the CPC assay by impurities that contain CPC titratable functional groups. When CAME is used in conjunction with CPC titration, certain non-CS and adulterants can be visualized and estimated, and a true value for CS can be assigned once the presence of these non-CS impurities has been ruled out. This study examines conjunct application of CPC and CAME in ascertaining CS assay and purity in the presence of certain adulterants. These include propylene glycol alginate sulfate sodium, known in commerce as alginic sodium diester (ASD), and Zero One (Z1), a water-soluble agent newly reported in the CS marketplace and subsequently identified as sodium hexametaphosphate. ASD, Z1, and CS are similar in physical appearance and solubility in water and ethanol. They are also titratable anions and form ionic pairs with CPC, therefore interfering with the CPC titration assay for CS. CAME separates these adulterants from each other and from CS by differences in their electrophoretic mobility. CAME is able to detect these impurities in
CS at levels as low as 0.66% by weight. Although it is recommended that a method for detecting impurities (e.g., CAME) be used in combination with relatively nonspecific assay methods such as CPC titration, this is seldom done in practice. Assay results for CS derived from CPC titration may, therefore, be misleading, leaving the CS supply chain vulnerable to adulteration. In this study, the authors investigated ASD and Z1 adulteration of CS and developed an electrophoretic separation of these adulterants in CS and procedures to isolate ASD from CS matrixes containing these adulterants. The authors describe in this paper utilization of an orthogonal approach to establish the identity of Z1 as sodium hexametaphosphate and to confirm the identity of ASD, including ethanol fractionation, FTIR spectroscopy, differential scanning calorimetry, and NMR spectroscopy. The authors suggest that CAME is a cost-effective and easy to use method for detecting certain impurities in CS raw ingredients and recommend that CPC and CAME be used in combination by QC laboratories as a means of effectively deterring the practice of adulterating CS raw materials with the known adulterants ASD and Z1 and/or other non-chondroitin substances that can be separated from CS by CAME and that exhibit CPC titration behavior similar to CS.
Chondroitin sulfate (CS) is a negatively charged polymeric glycosaminoglycan (GAG) consisting of alternating glycuronic acid and N-acetylhexosamine residues
connected by β1-3 hexuronidic and β1-4-N-acetylhexosaminidic bonds (1). It is closely related to other GAGs such as dermatan sulfate, hyaluronic acid, heparin, heparin sulfate, and keratan sulfate. CS contains N-acetylgalactosamine as the hexosamine
2 Zhang et al.: Journal of aoaC InternatIonal Vol. 97, no. 6, 2014
and glucuronic acid as the glycuronic acid moiety (2), while other GAGs contain other hexosamine and/or glycuronic acid residues. Either of the residues can be sulfated at different positions.
CS is a major component of connective tissue and is partially responsible for providing the flexibility of these tissues. Orally administered CS is promoted to help treat symptoms of osteoarthritis, and dietary supplements that contain CS are readily available. Predominant sources of CS raw materials in commerce are bovine trachea, porcine skin and rib cartilage, and shark cartilage (3).
Quantitative analysis of CS in CS raw materials and dietary supplement products formulated with CS raw materials has been extremely challenging due to the large MW variation of CS polymers, their poor UV absorbance, and strongly anionic nature. Other related GAGs may be present as impurities or adulterants in CS materials, and, thus, any analytical methodology designed to quantify CS must be selective for CS in the presence of other related GAGs (3). Various approaches to CS characterization exist, including carbazole reaction (4), cetylpyridinium chloride (CPC) titration (5, 6), and size exclusion chromatography (7); however, these methods cannot distinguish between CS and related GAGs, and they are also subject to interferences by non-GAGs in dietary supplement finished products. CPC titration has become a popular method for determining the amount of CS in raw materials and finished products, but it cannot distinguish between CS and other GAGs and will give positive results for any material having high anionic charge, e.g., carrageenans, proteins, and surfactants.
In recent years, CS sold as a dietary ingredient has been subjected to economically motivated adulteration (EMA). Certain compounds have been identified as agents used in EMA of CS, including alginic sodium diester (ASD) and a previously undetected compound we named Zero One (Z1). Substances used to adulterate CS need to be relatively inexpensive, easily available, and similar to CS in appearance. They are usually also soluble in water but precipitate out in ethanol at certain level of solvent concentration. More importantly, adulterants must also react with CPC in the titration assay for CS commonly used in the dietary supplement industry. While a large number of materials are titratable with CPC, the combination of this property with availability, low cost, appropriate sensory characteristics, and physical properties limits the number of suitable adulterants. The adulterants in this study, ASD and Z1, meet all of the above criteria. ASD is similar to CS in physical appearance and solubility, and it reacts with CPC in a ratio that yields values equivalent to 140% of those from the same mass of a pure CS standard. Z1, which dissolves easily in water but not in ethanol, yields CPC assay results as much as 235% of the U.S. Pharmacopeia (USP) CS standard. These known adulterants are available at prices that are about one-third (ASD) and about equal (Z1) to that of CS. At these prices, use of ASD or Z1 in CS materials would allow unscrupulous marketers a cost advantage either by substituting a certain percentage of CS material with lower cost adulterants while retaining equal or greater CPC titration values (ASD) or boosting CPC titration values significantly with a small amount of Z1 that costs about the same as CS. In these scenarios, batches of low-quality materials that would otherwise be rejected or need further purification because they failed to meet assay values as determined with CPC titration would achieve a passing score.
In addition, batches of CS with CPC titration values within the acceptable range could be diluted with small amounts of the adulterants to lower the raw material costs without making a large detectable change in the assay values.
Cellulose acetate membrane electrophoresis (CAME) has been demonstrated by Cappelletti et al. to separate animal-derived glycosaminoglycans (8). CAME is one of the USP methods (9) employed to detect impurities in CS as a dietary ingredient (10) and as an identity test in dietary supplement formulations such as CS tablets (11) containing a combination of CS and glucosamine (12) and/or CS and methylsulfonylmethane (13). The electrophoretic purity test in the USP monograph for CS is meant to detect any non-chondroitin substance that may interfere with the CPC titration.
Ionic pair forming capacity between GAGs and CPC correlates with the staining capacity of toluidine blue with GAGs and other large anions on electrophoretic media. Staining with toluidine blue after electrophoresis thus reveals any impurity/adulterant that reacts with CPC in the titration assay but has an electrophoretic mobility different from that of CS. The USP monograph does not specify a particular target adulterant in CS, but it provides a limit of not more than 2.0% for unspecified electrophoretic impurities.
CAME is an inexpensive procedure with a low initial setup cost. The apparatus has a small footprint, requiring about 1 M of bench space. The operating cost is also low, and each membrane can accommodate between four and 10 samples. The electrophoretic separation requires about 2 h following about 45 min of sample preparation. With this economic profile, CAME is an attractive technique that can serve the entire CS supply chain, including small ingredient suppliers and manufacturers who are not equipped with sophisticated laboratories.
ASD is a chemically modified polysaccharide sulfate derived from sodium alginate, a polymer extracted from a variety of brown algae (14). Several forms of sulfated alginates are approved for use in several countries as active pharmaceutical ingredients in prescription drugs, including ASD (15; see Exhibit 1 in the Supplemental Information on J. AOAC Int. website, http://aoac.publisher.ingentaconnect.com/content/aoac/jaoac). In 2009, China’s State Food and Drug Administration issued a warning of adverse events caused by ASD injections. These included serious cardiovascular, gastrointestinal, and other reactions (16; see Exhibit 2 in the Supplemental Information section). In the United States, there is no approved or permitted use for ASD as a dietary ingredient [U.S. Food and Drug Administration (FDA), Federal Register Notice, the Generally Recognized as Safe (GRAS) Proposal, 1997; www.fda.gov/Food/FoodIngredientsPackaging/GenerallyRecognizedasSafeGRAS]; a search of FDA sources returned no GRAS notification record of ASD. In addition, no notification record to FDA of ASD is found as a New Dietary Ingredient, per FDA Guidance for Industry: Dietary Supplements: NDI Notifications and Related Issues, 2011. (www.fda.gov/Food/DietarySupplements/NewDietary IngredientsNotificationProcess). As this material was not in the market before 1994, ASD cannot be considered a “grandfathered” dietary ingredient. The presence of ASD in CS may pose a significant risk to consumer safety and public health (17).
The adulterant Z1 is identified in this study as a form of sodium hexametaphosphate (SHMP), also known as amorphous sodium polyphosphate with some other minor substances. SHMP is a polymeric metaphosphate, and it is an industrial chemical
Zhang et al.: Journal of aoaC InternatIonal Vol. 97, no. 6, 2014 3
commonly used in detergents and water treatment agents (including in one form under the commercial name of Calgon®) and belongs to the family of polymeric metaphosphates. SHMP is a hexamer of composition (NaPO3)6 (18); industrial sources of this chemical are often mixtures of polymeric metaphosphates containing various polymeric chain lengths. This substance is not an approved dietary ingredient, but it is an approved food additive for use as a sequestering (or chelating) agent in some foods at low levels. The substance is also approved for food use in the European Union under No. E452i, which is in the category of thickeners, stabilizers, and emulsifiers (19). Chronic human consumption of SHMP in supplements at elevated levels could pose potential health risks to consumers (20). Legitimate use of both ASD and Z1 is tightly regulated worldwide (19, 21–23), and presence of these compounds in CS or other dietary supplements occurs only in black market operations.
To establish the functionality of ASD and Z1 as effective adulterants in CS materials, we performed CPC titrimetry (24) tests on pure samples and mixtures of ASD and Z1 added to CS. These experiments were designed to demonstrate that both of the adulterants interfere with the CPC titration assay for CS, with ASD and Z1 assaying as high as 140 and 235%, respectively, calculated relative to a pure CS reference standard.
We also compared the electrophoretic mobility of ASD, Z1, and CS by performing CAME studies of simulated adulterated authentic CS and of CS materials and supplement products purchased from the marketplace.
To ascertain the identities of the impurities detected by CAME in the CS materials, including the known adulterants ASD and Z1, we conducted forensic analyses on impurities isolated from CS mixtures to look for identifying spectroscopic signatures of ASD and Z1 for impurities isolated from CS mixtures. Ethanol fractionation was used to isolate ASD from a CS market sample suspected of adulteration. NMR spectroscopic studies of the isolates from the CS mixture were performed to establish the spectral fingerprint pattern of the sample ASD adulterant. FTIR (mid-IR or MIR) data were also collected to establish signature bands of ASD and Z1. The FTIR spectrum of Z1 exhibited wavelength bands that were similar to those of documentary FTIR data of SHMP (25). Once the adulterants were tentatively identified, we obtained authentic ASD and SHMP from commercial sources and compared their spectra to those obtained from adulterants isolated from CS samples. Further FTIR analyses were conducted to evaluate the similarity of FTIR signatures of Z1 and technical grade SHMP.
Experimental
Materials
(a) CS reference standard.—CS sodium (U.S. Pharmacopeial Convention, Rockville, MD) reference standard, 300 mg/bottle, Lot No. H1K241.
(b) CS sodium reference standard (CSRS).—Meitek Technology (Jiaonan City, Qingdao, China), 101.3% CPC, Lot No. ZP11081904, calibrated against the USP reference standard and used throughout this study as the CSRS.
(c) CS samples for testing.—(1) CS sodium 90% (CS90).—Meitek Technology, 90.1%
CPC, Lot No. ZP12083105.
(2) CS sodium 90% for repeat test (CS90r).—Meitek Technology, 89.4% CPC, Lot No. ZP1305301.
(3) ASD.—Chu Yuan Pharmaceutical Chemicals Co. (Qingdao, China), 20 kg/drum, Lot No. 33342-05-1.
(4) Z1.—Undocumented material offered in market and purported to enhance CS content (Z1), market source and description on record at Meitek Technology.
(5) Commercial CS material sample 1 (K1).—Vendor record on file at Meitek, 91.5% CPC content, last four digits of Lot No. -09A1.
(6) Commercial CS material sample 2 (K2).—Vendor record on file at Meitek Technology, 87.4% CPC content, last four digits of Lot No. -20S1.
(7) Supplement sample 1 (S1).—Purchase record on file at Synutra (Rockville, MD), tablet, CS and glucosamine hydrochloride preparation, Sample Reference No. 34.
(8) Supplement sample 2 (S2).—Purchase record on file at Synutra, coated tablet, CS and glucosamine hydrochloride preparation, Sample Reference No. 47.
(9) Raw material screening sample 1 (R1).—CS 90% of bovine source, vendor information on record at Synutra, Lot No. YB130327.
(10) Raw material screening sample 2 (R2).—CS 90% of porcine source, vendor information on record at Synutra, Lot No. YB130315.
(11) Raw material screening sample 3 (R3).—CS 90% of avian source, vendor information on record at Synutra, Lot No. YB130222.
(12) Raw material screening sample 4 (R4).—CS 90% of mixed sources, vendor information on record at Synutra, Lot No. YB130402.
(13) SHMP.—65–70%, Sigma-Aldrich (St. Louis, MO), Lot No. 71600.
(d) CPC titrimetry.—(1) Monobasic potassium phosphate (diluent).—Shantou
Xilong Chemicals (Shantou, China), Lot No. 0808071.(2) Dibasic potassium phosphate (diluent).—Shantou
Xilong Chemicals, Lot No. 0902231.(3) CPC (titrant).—Sigma, Lot No. 039K0055 (Sigma-
Aldrich). (4) Photoelectric probe.—Mettler Toledo (Columbus, OH),
T50.(e) Cellulose acetate membrane electrophoresis.— (1) Acetic acid, glacial.—LabChem, Inc. (Pittsburg, PA),
5000 mL/bottle, Lot No. B299-01.(2) Barium acetate.—Sigma-Aldrich, 250 g/bottle, Lot No.
SZBC0290V.(3) Toluidine blue.—Sinopharm Chemical Reagents Co.,
Ltd. (Shanghi, China), 25 g/bottle, Lot No. WC20080626.(4) Sample applicator.—DiaSys (Holzheim, Germany),
Model No. Spectra 4,(5) Cellulose acetate membrane sheets.—Sigma-Aldrich,
145 × 192 mm, Cat. No., 41776 A-F.(6) Electrophoresis submarine chamber—Beijing Liuyi
Instruments (Beijing, China), Model No. DDY-6C.(f) Ethanol fractionation of CS.—(1) Acetone.—Honeywell Burdick & Jackson (Morristown,
NJ), Lot No. DG913.(2) 95% Ethanol (190 proof).—Warner-Graham Co.
(Cockeysville, MD), Lot No. 061215.
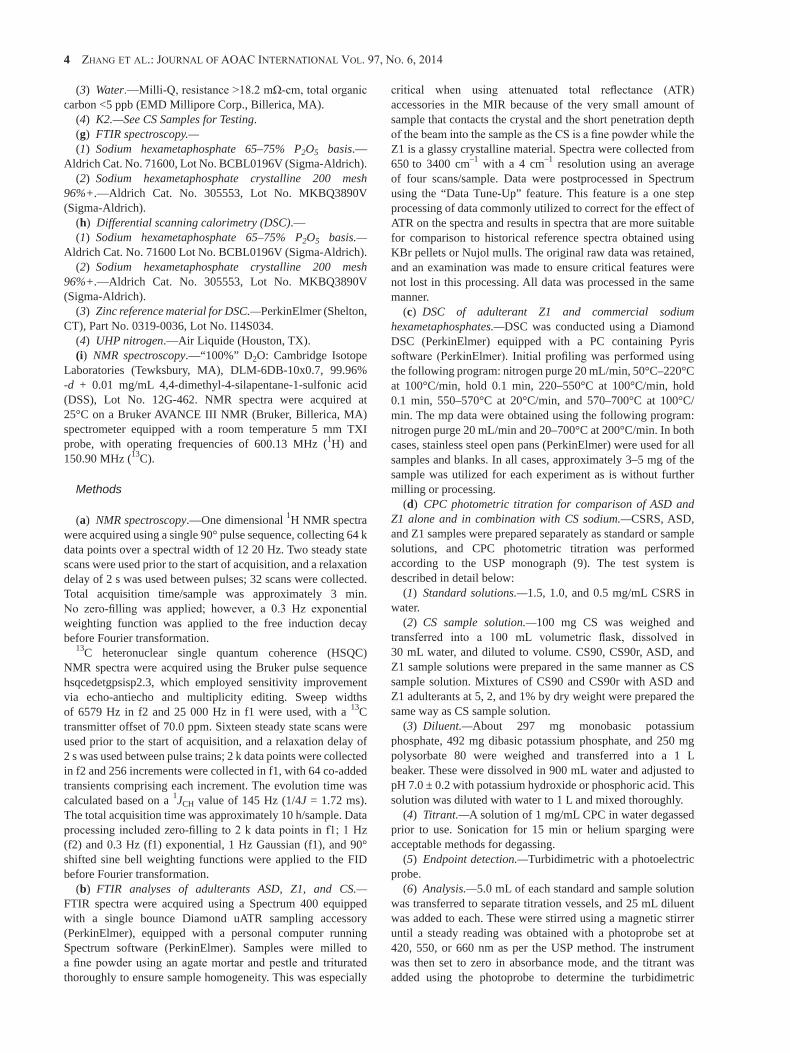
4 Zhang et al.: Journal of aoaC InternatIonal Vol. 97, no. 6, 2014
(3) Water.—Milli-Q, resistance >18.2 mΩ-cm, total organic carbon <5 ppb (EMD Millipore Corp., Billerica, MA).
(4) K2.—See CS Samples for Testing. (g) FTIR spectroscopy.—(1) Sodium hexametaphosphate 65–75% P2O5 basis.—
Aldrich Cat. No. 71600, Lot No. BCBL0196V (Sigma-Aldrich).(2) Sodium hexametaphosphate crystalline 200 mesh
96%+.—Aldrich Cat. No. 305553, Lot No. MKBQ3890V (Sigma-Aldrich).
(h) Differential scanning calorimetry (DSC).—(1) Sodium hexametaphosphate 65–75% P2O5 basis.—
Aldrich Cat. No. 71600 Lot No. BCBL0196V (Sigma-Aldrich).(2) Sodium hexametaphosphate crystalline 200 mesh
96%+.—Aldrich Cat. No. 305553, Lot No. MKBQ3890V (Sigma-Aldrich).
(3) Zinc reference material for DSC.—PerkinElmer (Shelton, CT), Part No. 0319-0036, Lot No. I14S034.
(4) UHP nitrogen.—Air Liquide (Houston, TX).(i) NMR spectroscopy.—“100%” D2O: Cambridge Isotope
Laboratories (Tewksbury, MA), DLM-6DB-10x0.7, 99.96% -d + 0.01 mg/mL 4,4-dimethyl-4-silapentane-1-sulfonic acid (DSS), Lot No. 12G-462. NMR spectra were acquired at 25°C on a Bruker AVANCE III NMR (Bruker, Billerica, MA) spectrometer equipped with a room temperature 5 mm TXI probe, with operating frequencies of 600.13 MHz (1H) and 150.90 MHz (13C).
Methods
(a) NMR spectroscopy.—One dimensional 1H NMR spectra were acquired using a single 90° pulse sequence, collecting 64 k data points over a spectral width of 12 20 Hz. Two steady state scans were used prior to the start of acquisition, and a relaxation delay of 2 s was used between pulses; 32 scans were collected. Total acquisition time/sample was approximately 3 min. No zero-filling was applied; however, a 0.3 Hz exponential weighting function was applied to the free induction decay before Fourier transformation.
13C heteronuclear single quantum coherence (HSQC) NMR spectra were acquired using the Bruker pulse sequence hsqcedetgpsisp2.3, which employed sensitivity improvement via echo-antiecho and multiplicity editing. Sweep widths of 6579 Hz in f2 and 25 000 Hz in f1 were used, with a 13C transmitter offset of 70.0 ppm. Sixteen steady state scans were used prior to the start of acquisition, and a relaxation delay of 2 s was used between pulse trains; 2 k data points were collected in f2 and 256 increments were collected in f1, with 64 co-added transients comprising each increment. The evolution time was calculated based on a 1JCH value of 145 Hz (1/4J = 1.72 ms). The total acquisition time was approximately 10 h/sample. Data processing included zero-filling to 2 k data points in f1; 1 Hz (f2) and 0.3 Hz (f1) exponential, 1 Hz Gaussian (f1), and 90° shifted sine bell weighting functions were applied to the FID before Fourier transformation.
(b) FTIR analyses of adulterants ASD, Z1, and CS.— FTIR spectra were acquired using a Spectrum 400 equipped with a single bounce Diamond uATR sampling accessory (PerkinElmer), equipped with a personal computer running Spectrum software (PerkinElmer). Samples were milled to a fine powder using an agate mortar and pestle and triturated thoroughly to ensure sample homogeneity. This was especially
critical when using attenuated total reflectance (ATR) accessories in the MIR because of the very small amount of sample that contacts the crystal and the short penetration depth of the beam into the sample as the CS is a fine powder while the Z1 is a glassy crystalline material. Spectra were collected from 650 to 3400 cm–1 with a 4 cm–1 resolution using an average of four scans/sample. Data were postprocessed in Spectrum using the “Data Tune-Up” feature. This feature is a one step processing of data commonly utilized to correct for the effect of ATR on the spectra and results in spectra that are more suitable for comparison to historical reference spectra obtained using KBr pellets or Nujol mulls. The original raw data was retained, and an examination was made to ensure critical features were not lost in this processing. All data was processed in the same manner.
(c) DSC of adulterant Z1 and commercial sodium hexametaphosphates.—DSC was conducted using a Diamond DSC (PerkinElmer) equipped with a PC containing Pyris software (PerkinElmer). Initial profiling was performed using the following program: nitrogen purge 20 mL/min, 50°C–220°C at 100°C/min, hold 0.1 min, 220–550°C at 100°C/min, hold 0.1 min, 550–570°C at 20°C/min, and 570–700°C at 100°C/min. The mp data were obtained using the following program: nitrogen purge 20 mL/min and 20–700°C at 200°C/min. In both cases, stainless steel open pans (PerkinElmer) were used for all samples and blanks. In all cases, approximately 3–5 mg of the sample was utilized for each experiment as is without further milling or processing.
(d) CPC photometric titration for comparison of ASD and Z1 alone and in combination with CS sodium.—CSRS, ASD, and Z1 samples were prepared separately as standard or sample solutions, and CPC photometric titration was performed according to the USP monograph (9). The test system is described in detail below:
(1) Standard solutions.—1.5, 1.0, and 0.5 mg/mL CSRS in water.
(2) CS sample solution.—100 mg CS was weighed and transferred into a 100 mL volumetric flask, dissolved in 30 mL water, and diluted to volume. CS90, CS90r, ASD, and Z1 sample solutions were prepared in the same manner as CS sample solution. Mixtures of CS90 and CS90r with ASD and Z1 adulterants at 5, 2, and 1% by dry weight were prepared the same way as CS sample solution.
(3) Diluent.—About 297 mg monobasic potassium phosphate, 492 mg dibasic potassium phosphate, and 250 mg polysorbate 80 were weighed and transferred into a 1 L beaker. These were dissolved in 900 mL water and adjusted to pH 7.0 ± 0.2 with potassium hydroxide or phosphoric acid. This solution was diluted with water to 1 L and mixed thoroughly.
(4) Titrant.—A solution of 1 mg/mL CPC in water degassed prior to use. Sonication for 15 min or helium sparging were acceptable methods for degassing.
(5) Endpoint detection.—Turbidimetric with a photoelectric probe.
(6) Analysis.—5.0 mL of each standard and sample solution was transferred to separate titration vessels, and 25 mL diluent was added to each. These were stirred using a magnetic stirrer until a steady reading was obtained with a photoprobe set at 420, 550, or 660 nm as per the USP method. The instrument was then set to zero in absorbance mode, and the titrant was added using the photoprobe to determine the turbidimetric
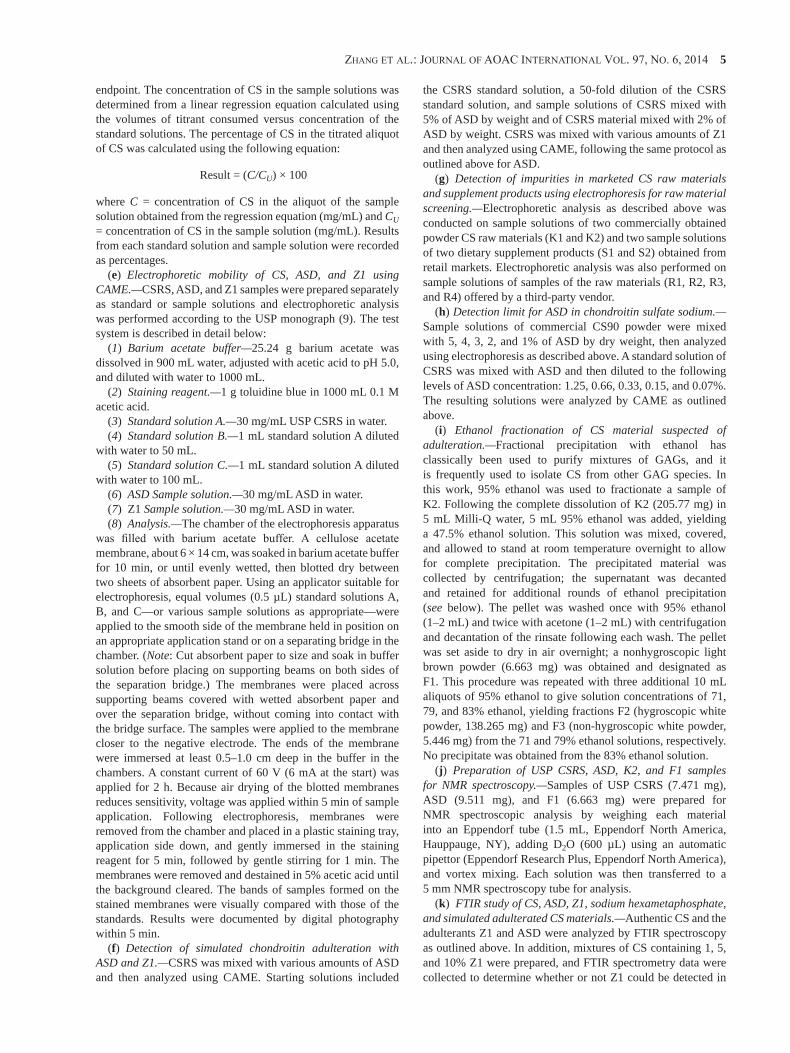
Zhang et al.: Journal of aoaC InternatIonal Vol. 97, no. 6, 2014 5
endpoint. The concentration of CS in the sample solutions was determined from a linear regression equation calculated using the volumes of titrant consumed versus concentration of the standard solutions. The percentage of CS in the titrated aliquot of CS was calculated using the following equation:
Result = (C/CU) × 100
where C = concentration of CS in the aliquot of the sample solution obtained from the regression equation (mg/mL) and CU = concentration of CS in the sample solution (mg/mL). Results from each standard solution and sample solution were recorded as percentages.
(e) Electrophoretic mobility of CS, ASD, and Z1 using CAME.—CSRS, ASD, and Z1 samples were prepared separately as standard or sample solutions and electrophoretic analysis was performed according to the USP monograph (9). The test system is described in detail below:
(1) Barium acetate buffer—25.24 g barium acetate was dissolved in 900 mL water, adjusted with acetic acid to pH 5.0, and diluted with water to 1000 mL.
(2) Staining reagent.—1 g toluidine blue in 1000 mL 0.1 M acetic acid.
(3) Standard solution A.—30 mg/mL USP CSRS in water.(4) Standard solution B.—1 mL standard solution A diluted
with water to 50 mL.(5) Standard solution C.—1 mL standard solution A diluted
with water to 100 mL.(6) ASD Sample solution.—30 mg/mL ASD in water.(7) Z1 Sample solution.—30 mg/mL ASD in water.(8) Analysis.—The chamber of the electrophoresis apparatus
was filled with barium acetate buffer. A cellulose acetate membrane, about 6 × 14 cm, was soaked in barium acetate buffer for 10 min, or until evenly wetted, then blotted dry between two sheets of absorbent paper. Using an applicator suitable for electrophoresis, equal volumes (0.5 µL) standard solutions A, B, and C—or various sample solutions as appropriate—were applied to the smooth side of the membrane held in position on an appropriate application stand or on a separating bridge in the chamber. (Note: Cut absorbent paper to size and soak in buffer solution before placing on supporting beams on both sides of the separation bridge.) The membranes were placed across supporting beams covered with wetted absorbent paper and over the separation bridge, without coming into contact with the bridge surface. The samples were applied to the membrane closer to the negative electrode. The ends of the membrane were immersed at least 0.5–1.0 cm deep in the buffer in the chambers. A constant current of 60 V (6 mA at the start) was applied for 2 h. Because air drying of the blotted membranes reduces sensitivity, voltage was applied within 5 min of sample application. Following electrophoresis, membranes were removed from the chamber and placed in a plastic staining tray, application side down, and gently immersed in the staining reagent for 5 min, followed by gentle stirring for 1 min. The membranes were removed and destained in 5% acetic acid until the background cleared. The bands of samples formed on the stained membranes were visually compared with those of the standards. Results were documented by digital photography within 5 min.
(f) Detection of simulated chondroitin adulteration with ASD and Z1.—CSRS was mixed with various amounts of ASD and then analyzed using CAME. Starting solutions included
the CSRS standard solution, a 50-fold dilution of the CSRS standard solution, and sample solutions of CSRS mixed with 5% of ASD by weight and of CSRS material mixed with 2% of ASD by weight. CSRS was mixed with various amounts of Z1 and then analyzed using CAME, following the same protocol as outlined above for ASD.
(g) Detection of impurities in marketed CS raw materials and supplement products using electrophoresis for raw material screening.—Electrophoretic analysis as described above was conducted on sample solutions of two commercially obtained powder CS raw materials (K1 and K2) and two sample solutions of two dietary supplement products (S1 and S2) obtained from retail markets. Electrophoretic analysis was also performed on sample solutions of samples of the raw materials (R1, R2, R3, and R4) offered by a third-party vendor.
(h) Detection limit for ASD in chondroitin sulfate sodium.—Sample solutions of commercial CS90 powder were mixed with 5, 4, 3, 2, and 1% of ASD by dry weight, then analyzed using electrophoresis as described above. A standard solution of CSRS was mixed with ASD and then diluted to the following levels of ASD concentration: 1.25, 0.66, 0.33, 0.15, and 0.07%. The resulting solutions were analyzed by CAME as outlined above.
(i) Ethanol fractionation of CS material suspected of adulteration.—Fractional precipitation with ethanol has classically been used to purify mixtures of GAGs, and it is frequently used to isolate CS from other GAG species. In this work, 95% ethanol was used to fractionate a sample of K2. Following the complete dissolution of K2 (205.77 mg) in 5 mL Milli-Q water, 5 mL 95% ethanol was added, yielding a 47.5% ethanol solution. This solution was mixed, covered, and allowed to stand at room temperature overnight to allow for complete precipitation. The precipitated material was collected by centrifugation; the supernatant was decanted and retained for additional rounds of ethanol precipitation (see below). The pellet was washed once with 95% ethanol (1–2 mL) and twice with acetone (1–2 mL) with centrifugation and decantation of the rinsate following each wash. The pellet was set aside to dry in air overnight; a nonhygroscopic light brown powder (6.663 mg) was obtained and designated as F1. This procedure was repeated with three additional 10 mL aliquots of 95% ethanol to give solution concentrations of 71, 79, and 83% ethanol, yielding fractions F2 (hygroscopic white powder, 138.265 mg) and F3 (non-hygroscopic white powder, 5.446 mg) from the 71 and 79% ethanol solutions, respectively. No precipitate was obtained from the 83% ethanol solution.
(j) Preparation of USP CSRS, ASD, K2, and F1 samples for NMR spectroscopy.—Samples of USP CSRS (7.471 mg), ASD (9.511 mg), and F1 (6.663 mg) were prepared for NMR spectroscopic analysis by weighing each material into an Eppendorf tube (1.5 mL, Eppendorf North America, Hauppauge, NY), adding D2O (600 µL) using an automatic pipettor (Eppendorf Research Plus, Eppendorf North America), and vortex mixing. Each solution was then transferred to a 5 mm NMR spectroscopy tube for analysis.
(k) FTIR study of CS, ASD, Z1, sodium hexametaphosphate, and simulated adulterated CS materials.—Authentic CS and the adulterants Z1 and ASD were analyzed by FTIR spectroscopy as outlined above. In addition, mixtures of CS containing 1, 5, and 10% Z1 were prepared, and FTIR spectrometry data were collected to determine whether or not Z1 could be detected in
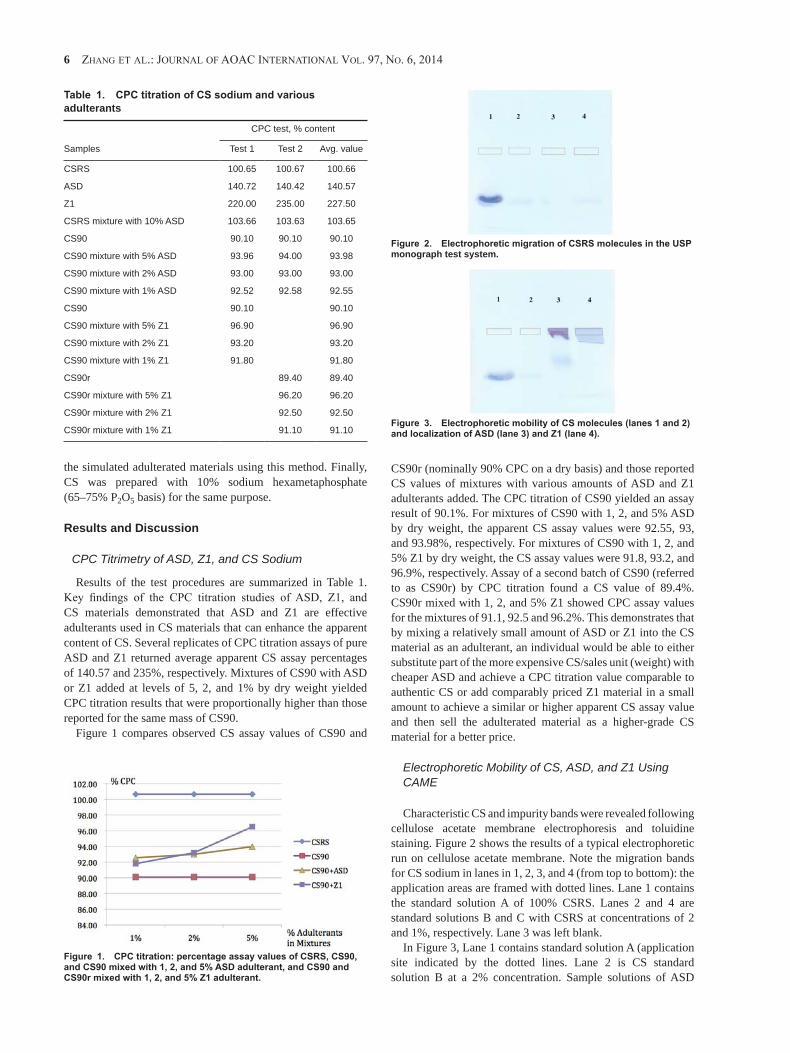
6 Zhang et al.: Journal of aoaC InternatIonal Vol. 97, no. 6, 2014
the simulated adulterated materials using this method. Finally, CS was prepared with 10% sodium hexametaphosphate (65–75% P2O5 basis) for the same purpose.
Results and Discussion
CPC Titrimetry of ASD, Z1, and CS Sodium
Results of the test procedures are summarized in Table 1. Key findings of the CPC titration studies of ASD, Z1, and CS materials demonstrated that ASD and Z1 are effective adulterants used in CS materials that can enhance the apparent content of CS. Several replicates of CPC titration assays of pure ASD and Z1 returned average apparent CS assay percentages of 140.57 and 235%, respectively. Mixtures of CS90 with ASD or Z1 added at levels of 5, 2, and 1% by dry weight yielded CPC titration results that were proportionally higher than those reported for the same mass of CS90.
Figure 1 compares observed CS assay values of CS90 and
CS90r (nominally 90% CPC on a dry basis) and those reported CS values of mixtures with various amounts of ASD and Z1 adulterants added. The CPC titration of CS90 yielded an assay result of 90.1%. For mixtures of CS90 with 1, 2, and 5% ASD by dry weight, the apparent CS assay values were 92.55, 93, and 93.98%, respectively. For mixtures of CS90 with 1, 2, and 5% Z1 by dry weight, the CS assay values were 91.8, 93.2, and 96.9%, respectively. Assay of a second batch of CS90 (referred to as CS90r) by CPC titration found a CS value of 89.4%. CS90r mixed with 1, 2, and 5% Z1 showed CPC assay values for the mixtures of 91.1, 92.5 and 96.2%. This demonstrates that by mixing a relatively small amount of ASD or Z1 into the CS material as an adulterant, an individual would be able to either substitute part of the more expensive CS/sales unit (weight) with cheaper ASD and achieve a CPC titration value comparable to authentic CS or add comparably priced Z1 material in a small amount to achieve a similar or higher apparent CS assay value and then sell the adulterated material as a higher-grade CS material for a better price.
Electrophoretic Mobility of CS, ASD, and Z1 Using CAME
Characteristic CS and impurity bands were revealed following cellulose acetate membrane electrophoresis and toluidine staining. Figure 2 shows the results of a typical electrophoretic run on cellulose acetate membrane. Note the migration bands for CS sodium in lanes in 1, 2, 3, and 4 (from top to bottom): the application areas are framed with dotted lines. Lane 1 contains the standard solution A of 100% CSRS. Lanes 2 and 4 are standard solutions B and C with CSRS at concentrations of 2 and 1%, respectively. Lane 3 was left blank.
In Figure 3, Lane 1 contains standard solution A (application site indicated by the dotted lines. Lane 2 is CS standard solution B at a 2% concentration. Sample solutions of ASD
Table 1. CPC titration of CS sodium and various adulterants
CPC test, % content
Samples Test 1 Test 2 Avg. value
CSRS 100.65 100.67 100.66
ASD 140.72 140.42 140.57
Z1 220.00 235.00 227.50
CSRS mixture with 10% ASD 103.66 103.63 103.65
CS90 90.10 90.10 90.10
CS90 mixture with 5% ASD 93.96 94.00 93.98
CS90 mixture with 2% ASD 93.00 93.00 93.00
CS90 mixture with 1% ASD 92.52 92.58 92.55
CS90 90.10 90.10
CS90 mixture with 5% Z1 96.90 96.90
CS90 mixture with 2% Z1 93.20 93.20
CS90 mixture with 1% Z1 91.80 91.80
CS90r 89.40 89.40
CS90r mixture with 5% Z1 96.20 96.20
CS90r mixture with 2% Z1 92.50 92.50
CS90r mixture with 1% Z1 91.10 91.10
Figure 1. CPC titration: percentage assay values of CSRS, CS90, and CS90 mixed with 1, 2, and 5% ASD adulterant, and CS90 and CS90r mixed with 1, 2, and 5% Z1 adulterant.
Figure 2. Electrophoretic migration of CSRS molecules in the USP monograph test system.
Figure 3. Electrophoretic mobility of CS molecules (lanes 1 and 2) and localization of ASD (lane 3) and Z1 (lane 4).

Zhang et al.: Journal of aoaC InternatIonal Vol. 97, no. 6, 2014 7
and Z1 were applied to Lanes 3 and 4, respectively. ASD and Z1 samples exhibited distinct mobility from CS in the test system, remaining mostly in the sample application areas. The CS, ASD, and Z1 bands were observed in Lanes 1, 3, and 4, respectively. The weak band in Lane 2 with a characteristic CS mobility represents a 2% CS concentration.
Study of Simulated CS Adulteration with ASD and Z1
Figure 4 illustrates simulated adulteration of CS with ASD. Lane 1 contains a standard solution of CSRS. Lane 2 contains CSRS with 5% added ASD. Lane 3 is CSRS solution diluted 50 times to yield 2% a CS concentration. Lane 4 is 2% by weight of added ASD. Figure 5 illustrates simulated adulteration of CS with Z1. In Lane 1, a standard solution of CSRS was applied. Lane 2 is CSRS that contains 5% Z1. Lane 3 is a 50-fold dilution of CSRS (2% CS). Lane 4 contains CSRS with 2% by weight of added Z1.
Electrophoretic Impurities in Market Samples Including CS Material Samples and Supplement Samples and in Raw Material Screening
In Figure 6, Lanes 1 and 2 represent sample solutions of commercially obtained CS powder materials (K1 and K2). The electropherogram shows clear separation of the primary CS bands and the localized secondary impurity bands. Lanes 3 and 4 contain sample solutions of two dietary supplement products (S1 and S2) obtained from the North America market (capsule and tablet, respectively). The product label of both supplement products stated that CS was the main dietary ingredient, along with glucosamine hydrochloride. At the end of the electrophoresis procedure, clear CS primary bands and secondary impurity bands were observed in Lanes 3 and 4, indicating apparent product adulteration.
In Figure 7, Lanes 1, 2, 3, and 4 each represent a CS 90% raw material obtained from a third-party vendor and represented as being sourced from various types of cartilage (R1, R2, R3, and R4). At the end of the electrophoresis procedure, clear mobility separation of an impurity from CS was observed in Lane 1, a CS90 bovine material. By comparing the density of the secondary impurity band with those of the standard solutions B and C, the level of adulteration of this CS90 bovine material (R1) is believed to be between 1 and 2%. The CS90 porcine and avian materials (R2 and R3) in Lanes 2 and 3, respectively, exhibit little observable secondary impurity bands. In Lane 4, a CS90 material of mixed cartilage sources (R4), exhibits a faintly observable secondary band, indicating the presence of a low level impurity.
Detection Limit for Impurities in CS Sodium by CAME
Lanes 1 through 5 in Figure 8 each represent sample solutions of CS90 mixed with ASD at dry weights of 5, 4, 3, 2, and 1%, respectively. A clear linear relationship can be established between the amount of ASD and the density of the localized secondary ASD bands, with the 5% ASD adulteration band being very intense and the 1% ASD adulteration band considerably less intense. In Figure 9, Lanes 1 through 4 each represent a standard solution of CSRS mixed with ASD by dry weight at 0.1, 0.3, 0.5, and 0.8%, respectively. This electropherogram further demonstrates the relationship between levels and intensity of the secondary bands formed by ASD adulterants. It is notable that while ASD adulteration at 0.8% by dry weight is highly visible, the ASD band is very faint at 0.3% and not visible at 0.1%. In Figure 10, Lanes 1 through 5 represent a sample solution of CSRS mixed with ASD and then diluted to achieve various levels of ASD concentration, starting at 1.25%, and decreasing to 0.66, 0.33, 0.15, and 0.07%. Again, the ASD adulterant at 1.25 and 0.66% produced discernible secondary bands on the membrane, while ASD adulteration at
Figure 4. Mobility separation revealing simulated adulteration of CS using ASD.
Figure 5. Mobility separation revealing simulated adulteration of CS using Z1
Figure 6. Detection of apparent adulteration in market samples.
Figure 7. CS raw material screening using electrophoresis.
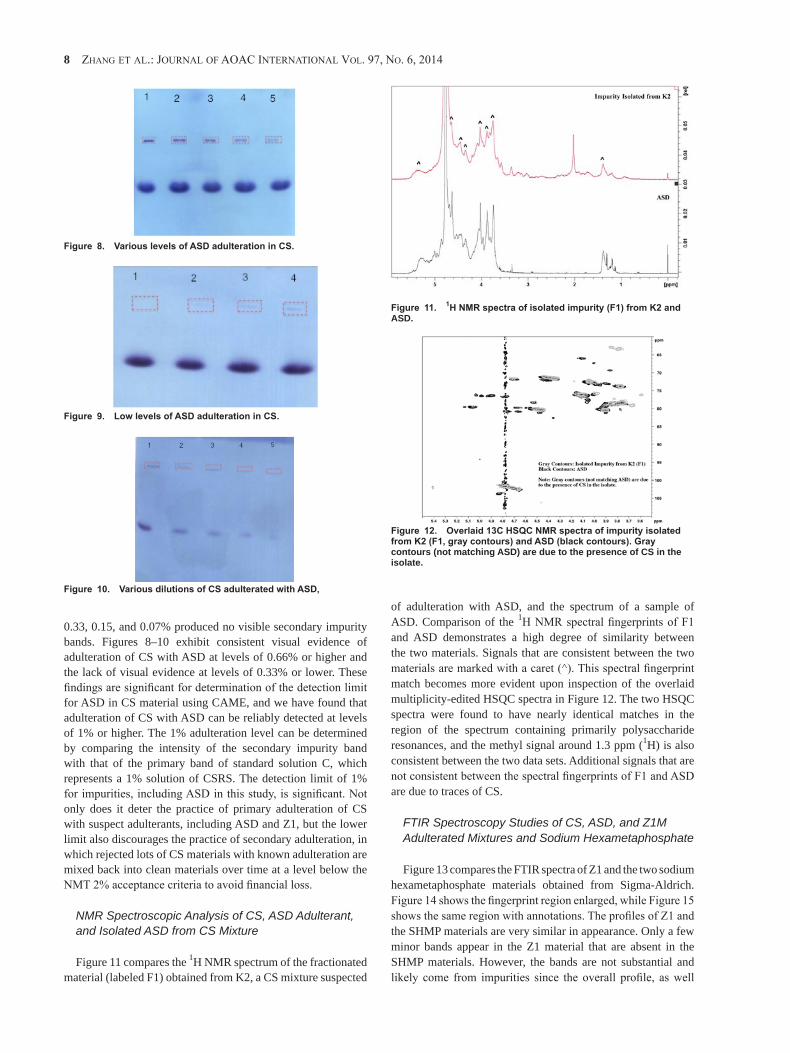
8 Zhang et al.: Journal of aoaC InternatIonal Vol. 97, no. 6, 2014
0.33, 0.15, and 0.07% produced no visible secondary impurity bands. Figures 8–10 exhibit consistent visual evidence of adulteration of CS with ASD at levels of 0.66% or higher and the lack of visual evidence at levels of 0.33% or lower. These findings are significant for determination of the detection limit for ASD in CS material using CAME, and we have found that adulteration of CS with ASD can be reliably detected at levels of 1% or higher. The 1% adulteration level can be determined by comparing the intensity of the secondary impurity band with that of the primary band of standard solution C, which represents a 1% solution of CSRS. The detection limit of 1% for impurities, including ASD in this study, is significant. Not only does it deter the practice of primary adulteration of CS with suspect adulterants, including ASD and Z1, but the lower limit also discourages the practice of secondary adulteration, in which rejected lots of CS materials with known adulteration are mixed back into clean materials over time at a level below the NMT 2% acceptance criteria to avoid financial loss.
NMR Spectroscopic Analysis of CS, ASD Adulterant, and Isolated ASD from CS Mixture
Figure 11 compares the 1H NMR spectrum of the fractionated material (labeled F1) obtained from K2, a CS mixture suspected
of adulteration with ASD, and the spectrum of a sample of ASD. Comparison of the 1H NMR spectral fingerprints of F1 and ASD demonstrates a high degree of similarity between the two materials. Signals that are consistent between the two materials are marked with a caret (^). This spectral fingerprint match becomes more evident upon inspection of the overlaid multiplicity-edited HSQC spectra in Figure 12. The two HSQC spectra were found to have nearly identical matches in the region of the spectrum containing primarily polysaccharide resonances, and the methyl signal around 1.3 ppm (1H) is also consistent between the two data sets. Additional signals that are not consistent between the spectral fingerprints of F1 and ASD are due to traces of CS.
FTIR Spectroscopy Studies of CS, ASD, and Z1M Adulterated Mixtures and Sodium Hexametaphosphate
Figure 13 compares the FTIR spectra of Z1 and the two sodium hexametaphosphate materials obtained from Sigma-Aldrich. Figure 14 shows the fingerprint region enlarged, while Figure 15 shows the same region with annotations. The profiles of Z1 and the SHMP materials are very similar in appearance. Only a few minor bands appear in the Z1 material that are absent in the SHMP materials. However, the bands are not substantial and likely come from impurities since the overall profile, as well
Figure 11. 1H NMR spectra of isolated impurity (F1) from K2 and ASD.
Figure 12. Overlaid 13C HSQC NMR spectra of impurity isolated from K2 (F1, gray contours) and ASD (black contours). Gray contours (not matching ASD) are due to the presence of CS in the isolate.
Figure 8. Various levels of ASD adulteration in CS.
Figure 9. Low levels of ASD adulteration in CS.
Figure 10. Various dilutions of CS adulterated with ASD,
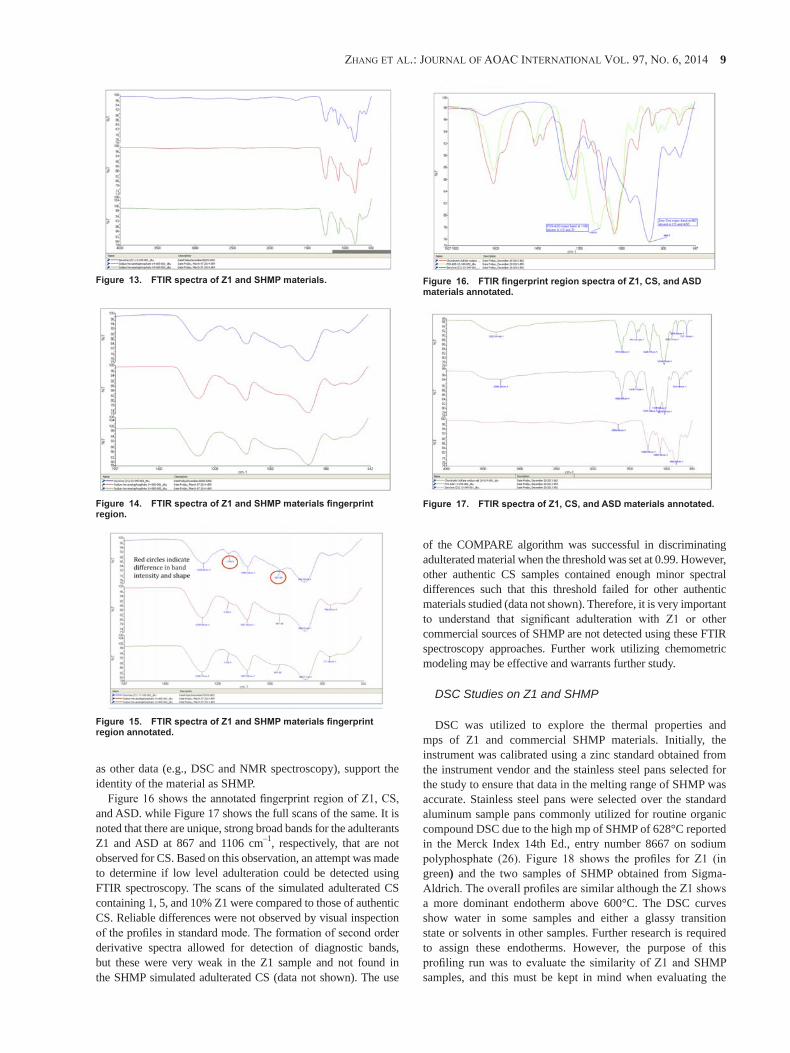
Zhang et al.: Journal of aoaC InternatIonal Vol. 97, no. 6, 2014 9
as other data (e.g., DSC and NMR spectroscopy), support the identity of the material as SHMP.
Figure 16 shows the annotated fingerprint region of Z1, CS, and ASD. while Figure 17 shows the full scans of the same. It is noted that there are unique, strong broad bands for the adulterants Z1 and ASD at 867 and 1106 cm–1, respectively, that are not observed for CS. Based on this observation, an attempt was made to determine if low level adulteration could be detected using FTIR spectroscopy. The scans of the simulated adulterated CS containing 1, 5, and 10% Z1 were compared to those of authentic CS. Reliable differences were not observed by visual inspection of the profiles in standard mode. The formation of second order derivative spectra allowed for detection of diagnostic bands, but these were very weak in the Z1 sample and not found in the SHMP simulated adulterated CS (data not shown). The use
of the COMPARE algorithm was successful in discriminating adulterated material when the threshold was set at 0.99. However, other authentic CS samples contained enough minor spectral differences such that this threshold failed for other authentic materials studied (data not shown). Therefore, it is very important to understand that significant adulteration with Z1 or other commercial sources of SHMP are not detected using these FTIR spectroscopy approaches. Further work utilizing chemometric modeling may be effective and warrants further study.
DSC Studies on Z1 and SHMP
DSC was utilized to explore the thermal properties and mps of Z1 and commercial SHMP materials. Initially, the instrument was calibrated using a zinc standard obtained from the instrument vendor and the stainless steel pans selected for the study to ensure that data in the melting range of SHMP was accurate. Stainless steel pans were selected over the standard aluminum sample pans commonly utilized for routine organic compound DSC due to the high mp of SHMP of 628°C reported in the Merck Index 14th Ed., entry number 8667 on sodium polyphosphate (26). Figure 18 shows the profiles for Z1 (in green) and the two samples of SHMP obtained from Sigma-Aldrich. The overall profiles are similar although the Z1 shows a more dominant endotherm above 600°C. The DSC curves show water in some samples and either a glassy transition state or solvents in other samples. Further research is required to assign these endotherms. However, the purpose of this profiling run was to evaluate the similarity of Z1 and SHMP samples, and this must be kept in mind when evaluating the
Figure 13. FTIR spectra of Z1 and SHMP materials.
Figure 14. FTIR spectra of Z1 and SHMP materials fingerprint region.
Figure 15. FTIR spectra of Z1 and SHMP materials fingerprint region annotated.
Figure 16. FTIR fingerprint region spectra of Z1, CS, and ASD materials annotated.
Figure 17. FTIR spectra of Z1, CS, and ASD materials annotated.
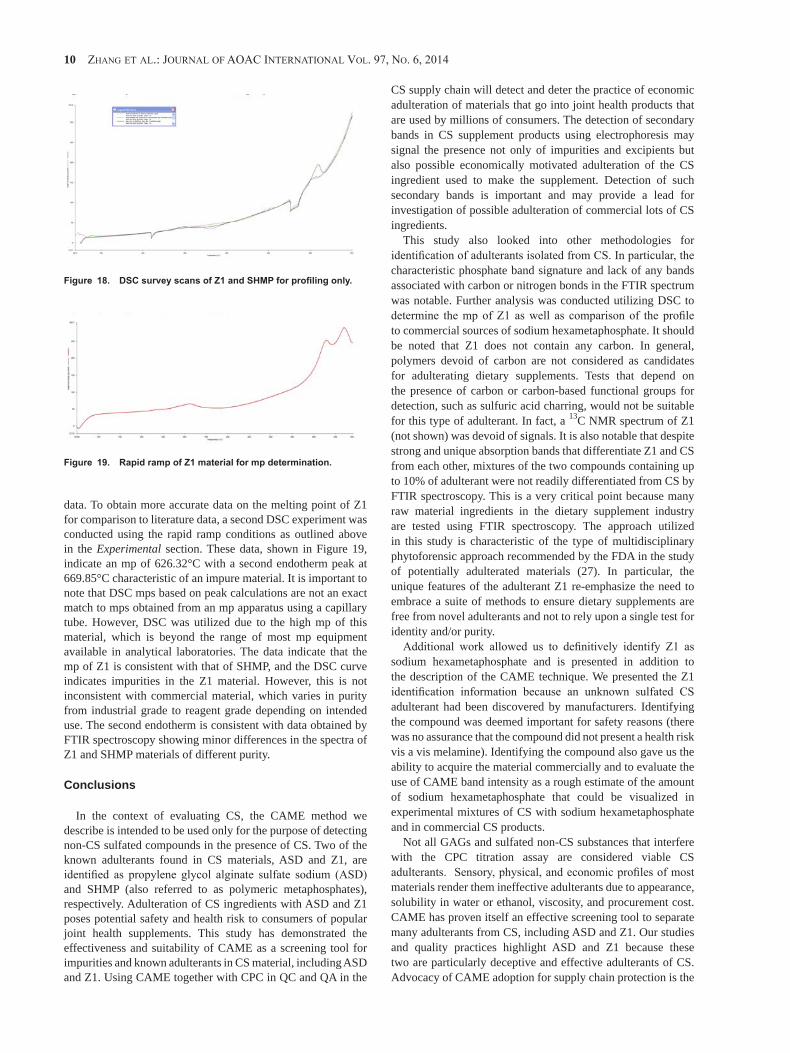
10 Zhang et al.: Journal of aoaC InternatIonal Vol. 97, no. 6, 2014
data. To obtain more accurate data on the melting point of Z1 for comparison to literature data, a second DSC experiment was conducted using the rapid ramp conditions as outlined above in the Experimental section. These data, shown in Figure 19, indicate an mp of 626.32°C with a second endotherm peak at 669.85°C characteristic of an impure material. It is important to note that DSC mps based on peak calculations are not an exact match to mps obtained from an mp apparatus using a capillary tube. However, DSC was utilized due to the high mp of this material, which is beyond the range of most mp equipment available in analytical laboratories. The data indicate that the mp of Z1 is consistent with that of SHMP, and the DSC curve indicates impurities in the Z1 material. However, this is not inconsistent with commercial material, which varies in purity from industrial grade to reagent grade depending on intended use. The second endotherm is consistent with data obtained by FTIR spectroscopy showing minor differences in the spectra of Z1 and SHMP materials of different purity.
Conclusions
In the context of evaluating CS, the CAME method we describe is intended to be used only for the purpose of detecting non-CS sulfated compounds in the presence of CS. Two of the known adulterants found in CS materials, ASD and Z1, are identified as propylene glycol alginate sulfate sodium (ASD) and SHMP (also referred to as polymeric metaphosphates), respectively. Adulteration of CS ingredients with ASD and Z1 poses potential safety and health risk to consumers of popular joint health supplements. This study has demonstrated the effectiveness and suitability of CAME as a screening tool for impurities and known adulterants in CS material, including ASD and Z1. Using CAME together with CPC in QC and QA in the
CS supply chain will detect and deter the practice of economic adulteration of materials that go into joint health products that are used by millions of consumers. The detection of secondary bands in CS supplement products using electrophoresis may signal the presence not only of impurities and excipients but also possible economically motivated adulteration of the CS ingredient used to make the supplement. Detection of such secondary bands is important and may provide a lead for investigation of possible adulteration of commercial lots of CS ingredients.
This study also looked into other methodologies for identification of adulterants isolated from CS. In particular, the characteristic phosphate band signature and lack of any bands associated with carbon or nitrogen bonds in the FTIR spectrum was notable. Further analysis was conducted utilizing DSC to determine the mp of Z1 as well as comparison of the profile to commercial sources of sodium hexametaphosphate. It should be noted that Z1 does not contain any carbon. In general, polymers devoid of carbon are not considered as candidates for adulterating dietary supplements. Tests that depend on the presence of carbon or carbon-based functional groups for detection, such as sulfuric acid charring, would not be suitable for this type of adulterant. In fact, a 13C NMR spectrum of Z1 (not shown) was devoid of signals. It is also notable that despite strong and unique absorption bands that differentiate Z1 and CS from each other, mixtures of the two compounds containing up to 10% of adulterant were not readily differentiated from CS by FTIR spectroscopy. This is a very critical point because many raw material ingredients in the dietary supplement industry are tested using FTIR spectroscopy. The approach utilized in this study is characteristic of the type of multidisciplinary phytoforensic approach recommended by the FDA in the study of potentially adulterated materials (27). In particular, the unique features of the adulterant Z1 re-emphasize the need to embrace a suite of methods to ensure dietary supplements are free from novel adulterants and not to rely upon a single test for identity and/or purity.
Additional work allowed us to definitively identify Z1 as sodium hexametaphosphate and is presented in addition to the description of the CAME technique. We presented the Z1 identification information because an unknown sulfated CS adulterant had been discovered by manufacturers. Identifying the compound was deemed important for safety reasons (there was no assurance that the compound did not present a health risk vis a vis melamine). Identifying the compound also gave us the ability to acquire the material commercially and to evaluate the use of CAME band intensity as a rough estimate of the amount of sodium hexametaphosphate that could be visualized in experimental mixtures of CS with sodium hexametaphosphate and in commercial CS products.
Not all GAGs and sulfated non-CS substances that interfere with the CPC titration assay are considered viable CS adulterants. Sensory, physical, and economic profiles of most materials render them ineffective adulterants due to appearance, solubility in water or ethanol, viscosity, and procurement cost. CAME has proven itself an effective screening tool to separate many adulterants from CS, including ASD and Z1. Our studies and quality practices highlight ASD and Z1 because these two are particularly deceptive and effective adulterants of CS. Advocacy of CAME adoption for supply chain protection is the
Figure 18. DSC survey scans of Z1 and SHMP for profiling only.
Figure 19. Rapid ramp of Z1 material for mp determination.
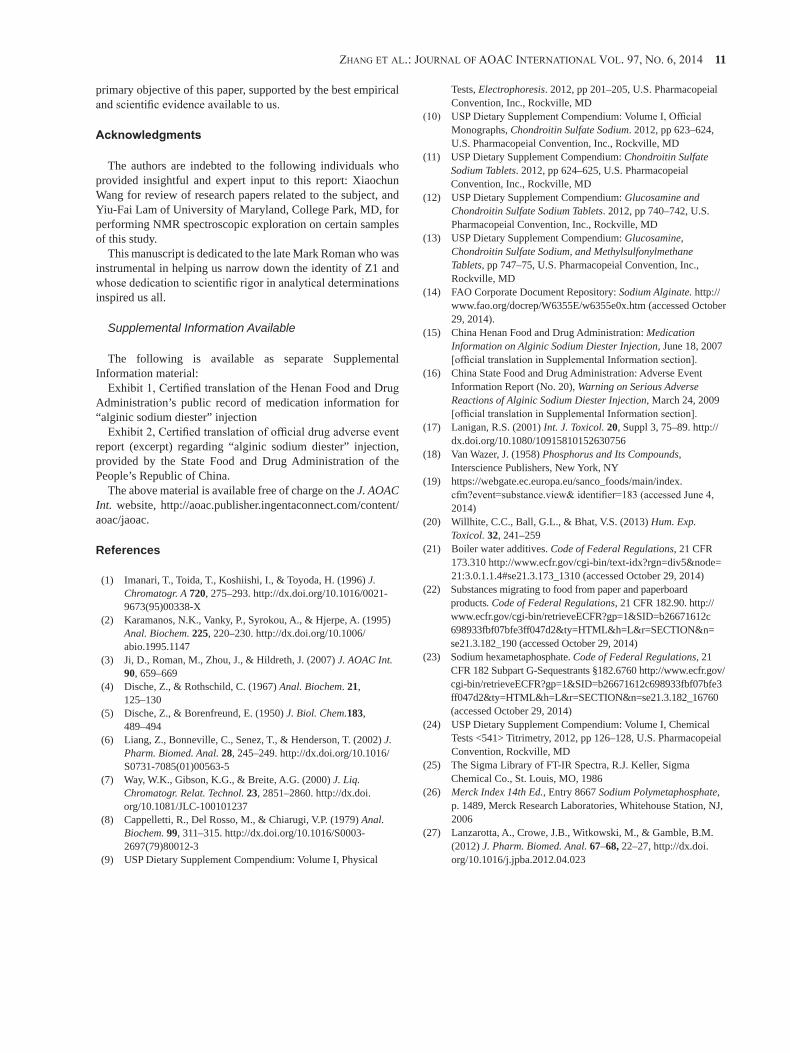
Zhang et al.: Journal of aoaC InternatIonal Vol. 97, no. 6, 2014 11
primary objective of this paper, supported by the best empirical and scientific evidence available to us.
Acknowledgments
The authors are indebted to the following individuals who provided insightful and expert input to this report: Xiaochun Wang for review of research papers related to the subject, and Yiu-Fai Lam of University of Maryland, College Park, MD, for performing NMR spectroscopic exploration on certain samples of this study.
This manuscript is dedicated to the late Mark Roman who was instrumental in helping us narrow down the identity of Z1 and whose dedication to scientific rigor in analytical determinations inspired us all.
Supplemental Information Available
The following is available as separate Supplemental Information material:
Exhibit 1, Certified translation of the Henan Food and Drug Administration’s public record of medication information for “alginic sodium diester” injection
Exhibit 2, Certified translation of official drug adverse event report (excerpt) regarding “alginic sodium diester” injection, provided by the State Food and Drug Administration of the People’s Republic of China.
The above material is available free of charge on the J. AOAC Int. website, http://aoac.publisher.ingentaconnect.com/content/aoac/jaoac.
References
(1) Imanari, T., Toida, T., Koshiishi, I., & Toyoda, H. (1996) J. Chromatogr. A 720, 275–293. http://dx.doi.org/10.1016/0021-9673(95)00338-X
(2) Karamanos, N.K., Vanky, P., Syrokou, A., & Hjerpe, A. (1995) Anal. Biochem. 225, 220–230. http://dx.doi.org/10.1006/abio.1995.1147
(3) Ji, D., Roman, M., Zhou, J., & Hildreth, J. (2007) J. AOAC Int. 90, 659–669
(4) Dische, Z., & Rothschild, C. (1967) Anal. Biochem. 21, 125–130
(5) Dische, Z., & Borenfreund, E. (1950) J. Biol. Chem.183, 489–494
(6) Liang, Z., Bonneville, C., Senez, T., & Henderson, T. (2002) J. Pharm. Biomed. Anal. 28, 245–249. http://dx.doi.org/10.1016/S0731-7085(01)00563-5
(7) Way, W.K., Gibson, K.G., & Breite, A.G. (2000) J. Liq. Chromatogr. Relat. Technol. 23, 2851–2860. http://dx.doi.org/10.1081/JLC-100101237
(8) Cappelletti, R., Del Rosso, M., & Chiarugi, V.P. (1979) Anal. Biochem. 99, 311–315. http://dx.doi.org/10.1016/S0003-2697(79)80012-3
(9) USP Dietary Supplement Compendium: Volume I, Physical
Tests, Electrophoresis. 2012, pp 201–205, U.S. Pharmacopeial Convention, Inc., Rockville, MD
(10) USP Dietary Supplement Compendium: Volume I, Official Monographs, Chondroitin Sulfate Sodium. 2012, pp 623–624, U.S. Pharmacopeial Convention, Inc., Rockville, MD
(11) USP Dietary Supplement Compendium: Chondroitin Sulfate Sodium Tablets. 2012, pp 624–625, U.S. Pharmacopeial Convention, Inc., Rockville, MD
(12) USP Dietary Supplement Compendium: Glucosamine and Chondroitin Sulfate Sodium Tablets. 2012, pp 740–742, U.S. Pharmacopeial Convention, Inc., Rockville, MD
(13) USP Dietary Supplement Compendium: Glucosamine, Chondroitin Sulfate Sodium, and Methylsulfonylmethane Tablets, pp 747–75, U.S. Pharmacopeial Convention, Inc., Rockville, MD
(14) FAO Corporate Document Repository: Sodium Alginate. http://www.fao.org/docrep/W6355E/w6355e0x.htm (accessed October 29, 2014).
(15) China Henan Food and Drug Administration: Medication Information on Alginic Sodium Diester Injection, June 18, 2007 [official translation in Supplemental Information section].
(16) China State Food and Drug Administration: Adverse Event Information Report (No. 20), Warning on Serious Adverse Reactions of Alginic Sodium Diester Injection, March 24, 2009 [official translation in Supplemental Information section].
(17) Lanigan, R.S. (2001) Int. J. Toxicol. 20, Suppl 3, 75–89. http://dx.doi.org/10.1080/10915810152630756
(18) Van Wazer, J. (1958) Phosphorus and Its Compounds, Interscience Publishers, New York, NY
(19) https://webgate.ec.europa.eu/sanco_foods/main/index.cfm?event=substance.view& identifier=183 (accessed June 4, 2014)
(20) Willhite, C.C., Ball, G.L., & Bhat, V.S. (2013) Hum. Exp. Toxicol. 32, 241–259
(21) Boiler water additives. Code of Federal Regulations, 21 CFR 173.310 http://www.ecfr.gov/cgi-bin/text-idx?rgn=div5&node=21:3.0.1.1.4#se21.3.173_1310 (accessed October 29, 2014)
(22) Substances migrating to food from paper and paperboard products. Code of Federal Regulations, 21 CFR 182.90. http://www.ecfr.gov/cgi-bin/retrieveECFR?gp=1&SID=b26671612c698933fbf07bfe3ff047d2&ty=HTML&h=L&r=SECTION&n=se21.3.182_190 (accessed October 29, 2014)
(23) Sodium hexametaphosphate. Code of Federal Regulations, 21 CFR 182 Subpart G-Sequestrants §182.6760 http://www.ecfr.gov/cgi-bin/retrieveECFR?gp=1&SID=b26671612c698933fbf07bfe3ff047d2&ty=HTML&h=L&r=SECTION&n=se21.3.182_16760 (accessed October 29, 2014)
(24) USP Dietary Supplement Compendium: Volume I, Chemical Tests <541> Titrimetry, 2012, pp 126–128, U.S. Pharmacopeial Convention, Rockville, MD
(25) The Sigma Library of FT-IR Spectra, R.J. Keller, Sigma Chemical Co., St. Louis, MO, 1986
(26) Merck Index 14th Ed., Entry 8667 Sodium Polymetaphosphate, p. 1489, Merck Research Laboratories, Whitehouse Station, NJ, 2006
(27) Lanzarotta, A., Crowe, J.B., Witkowski, M., & Gamble, B.M. (2012) J. Pharm. Biomed. Anal. 67–68, 22–27, http://dx.doi.org/10.1016/j.jpba.2012.04.023
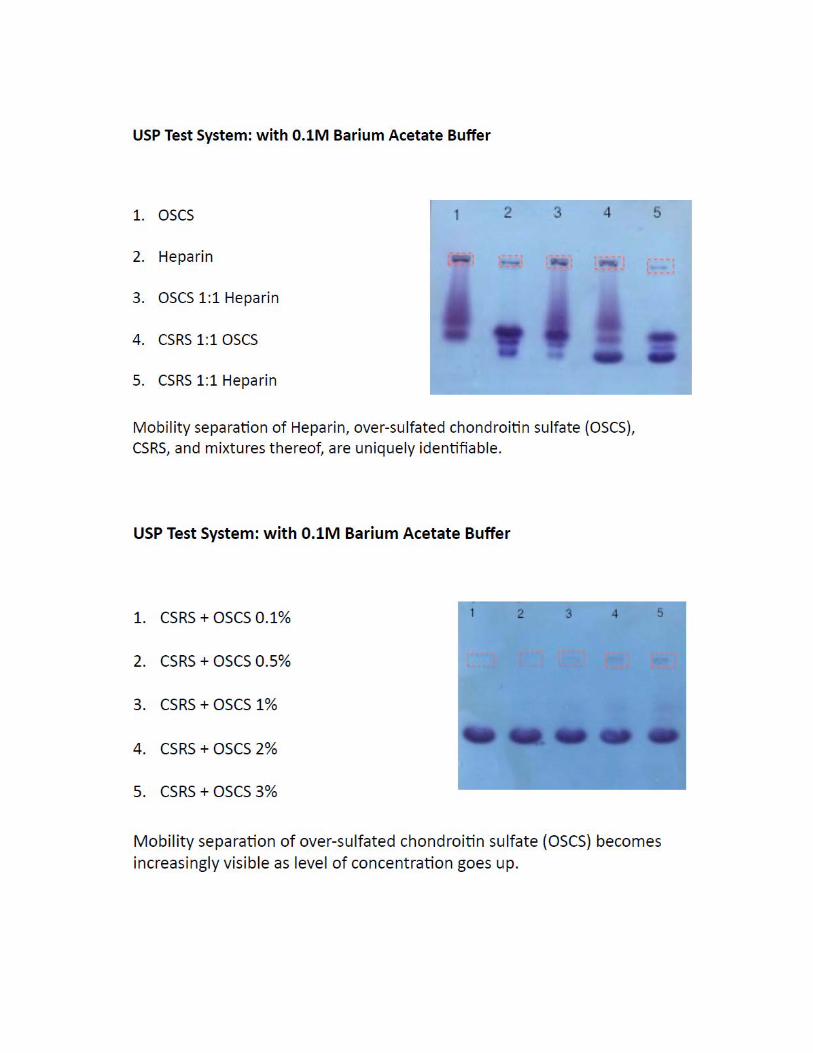


![SMPR 1. Mobilidade [30%] 5.034.878,00 SMPR 2. Melhorias de Bairro 20.000.000… · 2017-04-03 · SMPR 1. Mobilidade [30%] 5.034.878,00 SMPR 2. Melhorias de Bairro 20.000.000,00 Total](https://img.pdfslide.net/doc/110x75/5e713c6158348f731d5c6626/smpr-1-mobilidade-30-503487800-smpr-2-melhorias-de-bairro-20000-2017-04-03.jpg)