Embed Size (px)
Citation preview
1
Subsea 7 S.A. Announces Fourth Quarter and Full Year 2019 Results
Luxembourg – 26 February 2020 – Subsea 7 S.A. (the Group) (Oslo Børs: SUBC, ADR: SUBCY, ISIN: LU0075646355) announced today results for the fourth quarter and full year which ended 31 December 2019. Unless otherwise stated the comparative period is the full year which ended 31 December 2018.
Fourth Quarter and Full Year 2019 highlights
• Adjusted EBITDA of $631 million and margin of 17% for the full year 2019, reflected good progress on certain projects but lower activity in Renewables and Heavy Lifting
• Goodwill impairment charge of $100 million related to weakness in the wind turbine foundation market • Order intake totalled $3.9 billion in the year, equivalent to a book-to-bill ratio of 1.1, with eight awards announced in
the fourth quarter. Order backlog increased to $5.2 billion at the year end, with $3.3 billion expected to be executed in 2020
• Solid financial and liquidity position at 31 December 2019, with cash and cash equivalents of $398 million, net debt of $181 million including $345 million related to IFRS 16 lease liabilities and $656 million in unutilised credit facilities
• $304 million returned to shareholders in 2019 comprising $250 million in share repurchases and $54 million special dividend
(a) For explanations and reconciliations of Adjusted EBITDA and Adjusted EBITDA margin refer to Note 8 ‘Adjusted EBITDA and Adjusted EBITDA margin’ to the Condensed Consolidated Financial Statements. IFRS 16 ‘Leases’ was implemented on 1 January 2019 and comparative figures for 2018 have not been restated, as a result Adjusted EBITDA for the fourth quarter and year ended 31 Dec 2019 benefitted by $24 million and $105 million respectively.
(b) For the explanation and a reconciliation of diluted earnings per share and Adjusted diluted earnings per share, which excludes the impact of the goodwill impairment charge, refer to Note 7 ‘Earnings per share’ to the Condensed Consolidated Financial Statements.
(c) Backlog at 31 December 2019 and 31 December 2018 is unaudited and is a non-IFRS measure.
(d) Audited unless otherwise stated.
(e) IFRS 16 ‘Leases’ was implemented on 1 January 2019, comparative figures for 2018 have not been restated, as a result net debt (including IFRS 16 ‘Leases’ liabilities) at 31 December 2018 has not been shown.
John Evans, Chief Executive Officer, said: ‘Subsea 7 delivered solid operational results in 2019 as we continued to progress orders awarded at lower prices during the downturn, and commenced work on projects with more favourable terms. The outlook for SURF and Conventional continues to improve, with the level of tendering increasing year-on-year and pricing recovering gradually. Subsea Integration Alliance, our SPS-SURF partnership with OneSubsea, a Schlumberger company, has made a significant contribution to recent order intake. With the award of the full EPIC scope for the Julimar project following earlier FEED activity and, in recent weeks, the announcement of contracts that further extend our momentum in large greenfield subsea projects, we have reaffirmed our strategy of early engagement and an integrated approach. In Renewables and Heavy Lifting, our cable-lay vessels continue to deliver good utilisation, but the foundations market remains competitive. We have therefore had to record a goodwill impairment charge associated with this business. In the long-term, we remain confident that our client-focused approach and experience managing complex projects leave us well-positioned to create sustainable value in addressing our clients’ transition to lower carbon solutions.
We are committed to reducing our own environmental impact and this year will mark the publication of our first Sustainability Report, which will discuss our sustainability strategy in more detail. The upgrade of our Life of Field vessel, Seven Viking, to hybrid power, was successful, resulting in a 19% reduction in CO2 emissions.
Fourth Quarter
Full year
For the period (in $ millions, except Adjusted EBITDA margin and per share data) Q4 2019
Unaudited Q4 2018
Unaudited
2019 Audited
2018 (d)
Revenue 889 1,023 3,657 4,074 Adjusted EBITDA(a) (unaudited) 168 163 631 669 Adjusted EBITDA margin(a) (unaudited) 19% 16% 17% 16% Net operating (loss)/income excluding goodwill impairment charge (16) 23 77 200 Goodwill impairment charge (100) – (100) – Net operating (loss)/income (116) 23 (23) 200 Net (loss)/income excluding goodwill impairment charge (29) 32 18 165 Net (loss)/income (129) 32 (82) 165
Earnings per share – in $ per share Basic (0.45) 0.12 (0.27) 0.56 Diluted(b) (0.45) 0.12 (0.27) 0.56 Adjusted diluted(b) (0.12) 0.12 0.05 0.56
At (in $ millions)
2019 31 Dec
2018 31 Dec
Backlog - unaudited(c) 5,187 4,907 Cash and cash equivalents 398 765 Borrowings (234) (258) Net cash (excluding IFRS 16 ‘Leases’ liabilities) 164 507 Net debt (including IFRS 16 ‘Leases’ liabilities) (181) –(e)
2 Subsea 7 S.A. Fourth Quarter and Full Year 2019 Results
In 2020, Subsea 7 has strengthened its management team with the appointment of three new Executive Vice Presidents. I am confident we have the leadership in place to deliver strong operational and financial performance while continuing to drive the growth of the business.’
Full year 2019 Full year revenue of $3.7 billion was 10% lower than the prior year. Good progress on projects within SURF and Conventional was offset by significantly lower activity levels within Renewables and Heavy Lifting, which reflected the timing of large project awards. Adjusted EBITDA of $631 million was down 6% year-on-year. The margin of 17% benefitted from solid execution offset by low activity levels in Renewables and Heavy Lifting. A goodwill impairment charge of $100 million was recognised in the Renewables and Heavy Lifting business, which reflected weakness in the wind turbine foundations market. Excluding the goodwill impairment charge, net operating income was $77 million and net income was $18 million. Adjusted diluted earnings per share was $0.05 versus $0.56 in 2018. The reduction from the prior year was driven in part by impairment charges totalling $70 million mainly relating to two older vessels that are candidates for disposal.
In 2019, order intake was $3.9 billion including escalations of approximately $0.8 billion, resulting in a book-to-bill ratio of 1.1. Notable successes in the year included contract awards in Saudi Arabia, and new orders for Subsea Integration Alliance that support the strategy of early engagement and an integrated approach.
In line with our commitment to capital discipline, in 2019, Subsea 7 invested $258 million in capital expenditure and returned $304 million to shareholders consisting of $250 million of share repurchases and a special dividend of $54 million. Following the successful conclusion of the Group’s $200 million share repurchase programme on 24 July 2019, the Board of Directors authorised a new share repurchase programme of up to $200 million.
While we are confident of the improving conditions in our markets, in view of current global economic uncertainty and market volatility, combined with a change in law impacting the continuing validity of our advance tax agreement with the Luxembourg authorities, which we are still evaluating, the Board of Directors does not recommend the payment of a special dividend to the shareholders at the Annual General Meeting on the 7 April 2020. Rather, the Group will manage its returns to shareholders through the current $200 million share repurchase programme.
Fourth quarter 2019 Fourth quarter revenue of $889 million was 13% lower than the prior year period reflecting lower activity levels in Africa and Renewables and Heavy Lifting. Adjusted EBITDA of $168 million, a year-on-year increase of 3%, at a margin of 19% was driven by good execution within SURF and Conventional, as well as certain commercial settlements. A goodwill impairment charge of $100 million was recognised in the Renewables and Heavy Lifting business, reflecting near-term weakness in the wind turbine foundations market. Net loss, excluding the goodwill impairment charge, was $29 million. Excluding the goodwill impairment charge, Adjusted diluted earnings per share was a loss of $0.12 compared to earnings per share of $0.12 in the same period last year. The reduction from the prior year was driven by impairment charges totalling $70 million mainly relating to two older vessels that are candidates for disposal.
During the quarter, net cash generated from operations was $162 million with a favourable movement in net operating assets and liabilities of $23 million. Capital expenditure was $81 million in the quarter, mainly relating to the construction of Seven Vega. In addition, the Group acquired 4Subsea. The Group has a solid financial and liquidity position supported by cash and cash equivalents of $398 million at 31 December 2019 and a $656 million Revolving Credit Facility that remains unutilised. Net debt of $181 million at the year end included IFRS 16 lease liabilities of $345 million.
Despite the slippage of some awards into 2020, the backlog was more than replenished in the fourth quarter by orders totalling $1.1 billion, including $184 million of escalations. In SURF and Conventional, key awards included the Julimar Phase 2 and Ærfugl Phase 2 projects, while in Renewables and Heavy Lifting awards included the Formosa 2 and Lingshui projects. Backlog at the year end was $5.2 billion, of which $3.3 billion is expected to be executed in 2020.
The SURF and Conventional business unit made good progress on projects in the fourth quarter and benefitted from some commercial settlements. In Norway, the Yme project was completed, while fabrication work continued on the Snorre Expansion project. In Egypt, the Burullus 9B project has progressed well with the 2019 offshore campaign successfully completed. On the Mad Dog Phase 2 project, the offshore phase has started with light construction works in preparation for the pipelay campaign in 2020. The PRP6 project, offshore Brunei, completed topsides installation works.
Total vessel utilisation was 66% in the fourth quarter 2019, compared to 70% in the prior year period, reflecting greater seasonality in the North Sea and low levels of wind turbine foundation activity in the Renewables and Heavy Lifting business. Utilisation of the cable-lay vessels within Renewables and Heavy Lifting has remained robust since their acquisition by the Group in 2018. The Pipelay Support Vessels (PSLVs) on long-term contracts in Brazil achieved high levels of utilisation in the quarter. At 31 December 2019, the fleet comprised 35 vessels, including Seven Vega, which is under construction, and two stacked vessels.
Outlook The continued improvement in the deepwater oil and gas markets this year has supported increased tendering activity and a gradual improvement in pricing compared to 2018. Since the year end, the Group has announced a number of greenfield FEED and SURF awards. In addition, the Group is currently working on SURF and Conventional tenders with an estimated value of approximately $11 billion, up from approximately $9 billion at the same time last year.
While demand for offshore wind turbine services is growing in support of the transition to low carbon energy production, continued competition in the foundations market continues to negatively impact pricing. This is expected to improve in the longer-term as the market rebalances.
Guidance for full year 2020 is unchanged with both revenue and Adjusted EBITDA expected to be higher than in 2019, driven by an increase in activity in key markets. The Adjusted EBITDA margin is expected to remain relatively subdued, as projects awarded with competitive pricing progress to offshore execution.
3
Conference Call Information Lines will open 15 minutes prior to conference call.
Date: 26 February 2020
Time: 12:00 UK Time
Conference ID: 50666916#
Conference Dial In Numbers
United Kingdom 0333 300 0804 United States 631 913 1422 Norway 23 50 02 43 International Dial In +44 333 300 0804 Replay Facility Details A replay facility (with conference ID 301307642#) will be available from:
Date: 26 February 2020 Time: 17:00 UK Time
Conference Replay Dial In
Numbers
International Dial In +44 333 300 0819
For further information, please contact:
Katherine Tonks
Head of Investor Relations
email: [email protected]
Telephone: +44 20 8210 5568
Special Note Regarding Forward-Looking Statements Certain statements made in this announcement may include ‘forward-looking statements’. These statements may be identified by the use of words like ‘anticipate’, ‘believe’, ‘could’, ‘estimate’, ‘expect’, ‘forecast’, ‘intend’, ‘may’, ‘might’, ‘plan’, ‘predict’, ‘project’, ‘scheduled’, ‘seek’, ‘should’, ‘will’, and similar expressions. The forward-looking statements reflect our current views and are subject to risks, uncertainties and assumptions. The principal risks and uncertainties which could impact the Group and the factors which could affect the actual results are described but not limited to those in the ‘Risk Management’ section in the Group’s Annual Report and Consolidated Financial Statements 2018. These factors, and others which are discussed in our public announcements, are among those that may cause actual and future results and trends to differ materially from our forward-looking statements: actions by regulatory authorities or other third parties; our ability to recover costs on significant projects; general economic conditions and competition in the markets and businesses in which we operate; our relationship with significant clients; the outcome of legal and administrative proceedings or governmental enquiries; uncertainties inherent in operating internationally; the timely delivery of vessels on order; the impact of laws and regulations; and operating hazards, including spills and environmental damage. Many of these factors are beyond our ability to control or predict. Other unknown or unpredictable factors could also have material adverse effects on our future results. Given these factors, you should not place undue reliance on the forward-looking statements.
4 Subsea 7 S.A. Fourth Quarter and Full Year 2019 Results
Fourth Quarter 2019
Revenue Revenue for the fourth quarter was $889 million, a decrease of $134 million or 13% compared to Q4 2018. This reduction was driven by lower activity levels in the SURF and Conventional business unit, mainly related to projects in Africa and in the Renewables and Heavy Lifting business unit. Revenue in the Life of Field business unit was $70 million, an increase of $3 million compared with Q4 2018.
Adjusted EBITDA Adjusted EBITDA and Adjusted EBITDA margin for the quarter were $168 million and 19% respectively, compared to $163 million and 16% in Q4 2018. Adjusted EBITDA margin in Q4 2019 reflected good execution within the SURF and Conventional and Life of Field business units, partly offset by lower activity levels within the Renewables and Heavy Lifting business unit.
Net operating income/(loss) Net operating loss for the quarter was $116 million, compared to net operating income of $23 million in Q4 2018. The main items contributing to the net operating loss were:
• a goodwill impairment charge of $100 million related to the Renewables and Heavy Lifting business unit;
• impairment charges of $70 million, related to property, plant and equipment, compared to $13 million in Q4 2018
partially offset by:
• impairment charges of $25 million, related to intangible assets, recognised in Q4 2018 compared with no equivalent charge in Q4 2019.
Net operating loss excluding the goodwill impairment charge was $16 million for the quarter.
Net income/(loss) Net loss was $129 million in the quarter, compared to net income of $32 million in Q4 2018. The movement was primarily due to:
• net operating loss in Q4 2019, which included a goodwill impairment charge of $100 million;
• net foreign currency losses of $12 million in Q4 2019, compared to net foreign currency gains of $4 million in Q4 2018; and
• a tax credit of $2 million compared to a charge of $3 million in Q4 2018. The effective tax rate for Q4 2019 was 1%, compared with 8% in the prior year period, which reflected the limited tax relief available on the impairment charges recognised in Q4 2019.
Excluding the goodwill impairment charge, net loss was $29 million for Q4 2019 compared to net income of $32 million in Q4 2018.
Earnings per share Diluted loss per share was $0.45 in Q4 2019 compared to diluted earnings per share of $0.12 in Q4 2018, calculated using a weighted average number of shares of 299 million and 325 million respectively. Adjusted diluted loss per share, which excludes the impact of the goodwill impairment charge, was $0.12 in Q4 2019 compared to earnings per share of $0.12 in Q4 2018.
Cash and cash equivalents Cash and cash equivalents were $398 million at 31 December 2019, an increase of $31 million in the quarter. The movement in cash and cash equivalents during the quarter was mainly attributable to:
• net cash generated from operating activities of $162 million
partially offset by:
• purchases of property, plant and equipment of $70 million;
• payments related to lease liabilities of $24 million; and
• acquisition of the 4Subsea business (net of cash) for $17 million.
Borrowings and lease liabilities Borrowings decreased to $234 million at 31 December 2019 from $240 million at 30 September 2019 due to scheduled repayments. At 31 December 2019, lease liabilities were $345 million, a decrease of $23 million compared with 30 September 2019, this was mainly driven by scheduled lease payments.
Year ended 31 December 2019
Revenue Revenue for the year ended 31 December 2019 was $3.7 billion, a decrease of $0.4 billion or 10% compared to the equivalent period in 2018. The year-on-year decrease was primarily due to significantly lower activity levels in the Renewables and Heavy Lifting business unit following the completion of the Beatrice wind farm project.
Adjusted EBITDA Adjusted EBITDA and Adjusted EBITDA margin for the year ended 31 December 2019 were $631 million and 17% respectively, compared to $669 million and 16% in 2018. The year ended 31 December 2019 benefitted by $105 million compared to the prior year period due to the implementation of IFRS 16 ‘Leases’ on 1 January 2019. Adjusted EBITDA margin in 2019 reflected lower pricing on projects awarded during the downturn within the SURF and Conventional business unit and significantly lower activity levels within the Renewables and Heavy Lifting business unit.
5
Net operating income/(loss) Net operating loss for the year ended 31 December 2019 was $23 million, compared to net operating income of $200 million in 2018. The decrease was mainly due to:
• significantly lower activity levels in the Renewables and Heavy Lifting business unit, which reported an operating loss of $56 million before the goodwill impairment charges in 2019 compared to operating income of $4 million in 2018;
• a goodwill impairment charge of $100 million related to the Renewables and Heavy Lifting business unit;
• impairment charges related to property, plant and equipment of $70 million, compared to $13 million of charges in 2018
partially offset by:
• impairment charges of $25 million, related to intangible assets, recognised in 2018 with no equivalent charge in 2019.
Net operating income excluding the impact of the goodwill impairment charge was $77 million, a decrease of $123 million compared to 2018.
Net income/(loss) Net loss was $82 million for the year ended 31 December 2019, compared to net income of $165 million for the prior year. The net loss for 2019 was primarily due to:
• net operating loss of $23 million in 2019, compared with net operating income of $200 million in 2018;
• net foreign currency losses of $30 million for the year ended 31 December 2019, compared to net foreign currency gains of $7 million in 2018;
• an increase of $11 million in finance costs mainly due to the implementation of IFRS 16 ‘Leases’ from 1 January 2019
partially offset by:
• a decrease in the taxation charge of $22 million compared with the prior year.
Net income excluding the goodwill impairment charge was $18 million for 2019 compared to net income of $165 million in 2018.
Excluding the impact of the goodwill impairment charge of $100 million and the impairment charges of $70 million related to property, plant and equipment, which attracted limited tax relief, the effective tax rate for the year ended 31 December 2019 was 27% compared with 24% in the prior year.
Earnings per share Diluted loss per share was $0.27 for the year ended 31 December 2019 compared to diluted earnings per share of $0.56 in 2018, calculated using a weighted average number of shares of 305 million and 327 million respectively. Adjusted diluted earnings per share, which excludes the impact of the goodwill impairment charge, was $0.05 compared to $0.56 in 2018.
Cash and cash equivalents Cash and cash equivalents were $398 million at 31 December 2019 compared to $765 million at 31 December 2018. The decrease of $367 million during the year was mainly attributable to:
• net cash generated from operating activities of $357 million
offset by:
• repurchases of shares at a cost of $250 million;
• purchases of property, plant and equipment of $240 million;
• payments related to lease liabilities of $105 million;
• dividends paid to shareholders of $54 million;
• payment of contingent consideration in respect of acquisitions of $30 million; and
• acquisition of businesses (net of cash acquired) of $26 million.
Borrowings and lease liabilities Borrowings decreased to $234 million at 31 December 2019 from $258 million at 31 December 2018 due to scheduled repayments. Lease liabilities were $345 million at 31 December 2019, following their initial recognition on the balance sheet as of 1 January 2019, on implementation of IFRS 16 ‘Leases’.
Business Unit Highlights
Fourth Quarter 2019
SURF and Conventional Revenue for the fourth quarter was $760 million, a decrease of $113 million or 13% compared to Q4 2018.
During the quarter work progressed on the Burullus 9B project, offshore Egypt, the Zinia project, offshore Angola, the Berri-Zuluf project, offshore Saudi Arabia, the Julimar Phase 2, offshore Australia, the Mad Dog 2, Katmai and Manuel projects in the US Gulf of Mexico, the Snorre, Nova and Ærfugl projects, offshore Norway and the Arran and Penguins projects, offshore UK. In Brazil, there were high levels of PLSV utilisation under long-term contracts with Petrobras and work progressed on the Lapa NE project.
Net operating income was $33 million in the quarter, a decrease of $30 million or 48% compared to Q4 2018. The decrease in net operating income was primarily driven by impairment charges, related to property, plant and equipment, of $66 million. This was partially offset by an impairment charge, related to intangible assets, of $25 million which was recognised in Q4 2018 with no equivalent charge in Q4 2019.
6 Subsea 7 S.A. Fourth Quarter and Full Year 2019 Results
Life of Field Revenue for Q4 2019 was $70 million, an increase of $3 million or 4% compared to Q4 2018. Net operating loss was $3 million in Q4 2019 compared to net operating loss of $17 million in Q4 2018. The reduction in net operating loss was mainly driven by impairment charges, related to property, plant and equipment, of $12 million recognised in Q4 2018 with no equivalent charge in Q4 2019.
Renewables and Heavy Lifting Revenue was $59 million in Q4 2019 compared to $82 million in Q4 2018. The reduction in revenue was partly due to reduced activity on the Beatrice wind farm project, offshore UK, which is operationally complete. Net operating loss was $129 million in Q4 2019 compared to net operating loss of $13 million in Q4 2018. During Q4 2019, a goodwill impairment charge of $100 million was recognised reflecting the impact of the competitive wind turbine foundations market in the near-term. Net operating loss excluding the goodwill impairment charge was $29 million compared to $13 million in Q4 2018, the increase in net operating loss reflected lower activity levels compared with the prior year period and a competitive market environment.
Year ended 31 December 2019
SURF and Conventional Revenue was $3.2 billion for the year ended 31 December 2019, in line with 2018.
During the year ended 31 December 2019, the West Nile Delta GFR field development project, offshore Egypt, the PUPP and Asabo Flare Restoration projects, offshore Nigeria, the Hasbah project, offshore Saudi Arabia, the Storr and Alligin projects, offshore UK, the Yme and Aaskalad projects, offshore Norway and the Sole project, offshore Australia completed or neared completion. Work progressed on the Burullus 9B project, offshore Egypt, the 3PDMs and Berri-Zuluf projects, offshore Saudi Arabia, the Mad Dog 2, Katmai and Manuel projects in the US Gulf of Mexico, the Snorre, Nova and Ærfugl projects, offshore Norway and the Arran and Penguins projects, offshore UK. In Brazil, there were high levels of PLSV utilisation under long-term contracts with Petrobras and work commenced on the Lapa NE project.
Net operating income was $160 million for the year ended 31 December 2019, a decrease of $71 million or 31% compared to 2018. The decrease in net operating income was primarily driven by impairment charges, related to property, plant and equipment, of $66 million recognised in 2019 with no equivalent charge in 2018.
Life of Field Revenue for the year ended 31 December 2019 was $266 million, an increase of $20 million or 8% compared to 2018. The increase in revenue was primarily driven by increased inspection, repair and maintenance activities, offshore Azerbaijan, in the North Sea and in the Gulf of Mexico. Net operating loss was $3 million for the year ended 31 December 2019 compared to net operating loss of $12 million in 2018. The decrease in net operating loss reflected $12 million of impairment charges, related to property, plant and equipment, recognised in 2018 with no equivalent charge in 2019.
Renewables and Heavy Lifting Revenue was $217 million for the year ended 31 December 2019 compared to $664 million in 2018. The reduction in revenue was primarily due to lower activity on the Beatrice wind farm project, offshore UK, which is operationally complete. Net operating loss was $156 million in 2019, compared to net operating income of $4 million in 2018. In 2019, a goodwill impairment charge of $100 million was recognised reflecting the impact of the competitive wind turbine foundations market in the short to medium-term. Net operating loss excluding the goodwill impairment charge was $56 million compared to net operating income of $4 million in 2018, the decrease reflected lower activity levels compared with the prior year, due to the completion of the Beatrice wind farm project, and a competitive market environment.
Asset Development and Activities
Vessel Utilisation Total Vessel Utilisation for the quarter was 66% compared to 70% in Q4 2018. For the full year, Total Vessel Utilisation was 72% compared to 70% in 2018.
At 31 December 2019 there were 35 vessels in the fleet, comprising 32 active vessels, two stacked vessels and one vessel under construction.
Asset Development During the quarter, construction work continued on the Group’s new reel-lay vessel, Seven Vega, which was launched in May 2019. The vessel is expected to commence operations in 2020, after installation of pipelaying equipment, commissioning and sea trials.
Backlog
At 31 December 2019 backlog was $5.2 billion, an increase of $0.3 billion compared with 30 September 2019. Order intake totalling $1.1 billion, including escalations, was recorded in the quarter. Favourable foreign exchange movements of approximately $60 million were recognised during the quarter. New awards included the Julimar Phase 2 project, offshore Australia, the Ærfugl phase 2 project, offshore Norway, and the Formosa 2 project, offshore Taiwan.
$4.1 billion of the backlog at 31 December 2019 related to the SURF and Conventional business unit (which included $0.6 billion related to long-term day-rate contracts for PLSVs in Brazil), $0.6 billion related to the Life of Field business unit and $0.5 billion related to the Renewables and Heavy Lifting business unit. $3.3 billion of this backlog is expected to be executed in 2020, $1.4 billion in 2021 and $0.5 billion in 2022 and thereafter. Backlog related to associates and joint ventures is excluded from these figures.
Risks and uncertainties
The principal risks and uncertainties which could materially adversely impact the Group’s reputation, operations and/or financial performance and position are noted on pages 18 to 24 of Subsea 7 S.A.’s Annual Report and Consolidated Financial Statements 2018. The Executive Management Team has considered these principal risks and uncertainties and concluded that these have not changed significantly in the year ended 31 December 2019.

7
Responsibility statement
We confirm that, to the best of our knowledge, the financial statements for the year ended 31 December 2019 have been prepared in accordance with current applicable accounting standards and give a true and fair view of the assets, liabilities, financial position and results of the Company and the Group taken as a whole. We also confirm that, to the best of our knowledge, this report together with the Subsea 7 S.A. Annual Report and Consolidated Financial Statements 2018 include a fair review of the development and performance of the business and the position of the Group, together with a description of the principal risks and uncertainties facing the Group.
8 Subsea 7 S.A. Fourth Quarter and Full Year 2019 Results
Subsea 7 S.A. Condensed Consolidated Income Statement
Three Months Ended
Year Ended
(in $ millions) 31 Dec 2019
Unaudited 31 Dec 2018
Unaudited 31 Dec 2019
Audited 31 Dec 2018
Audited
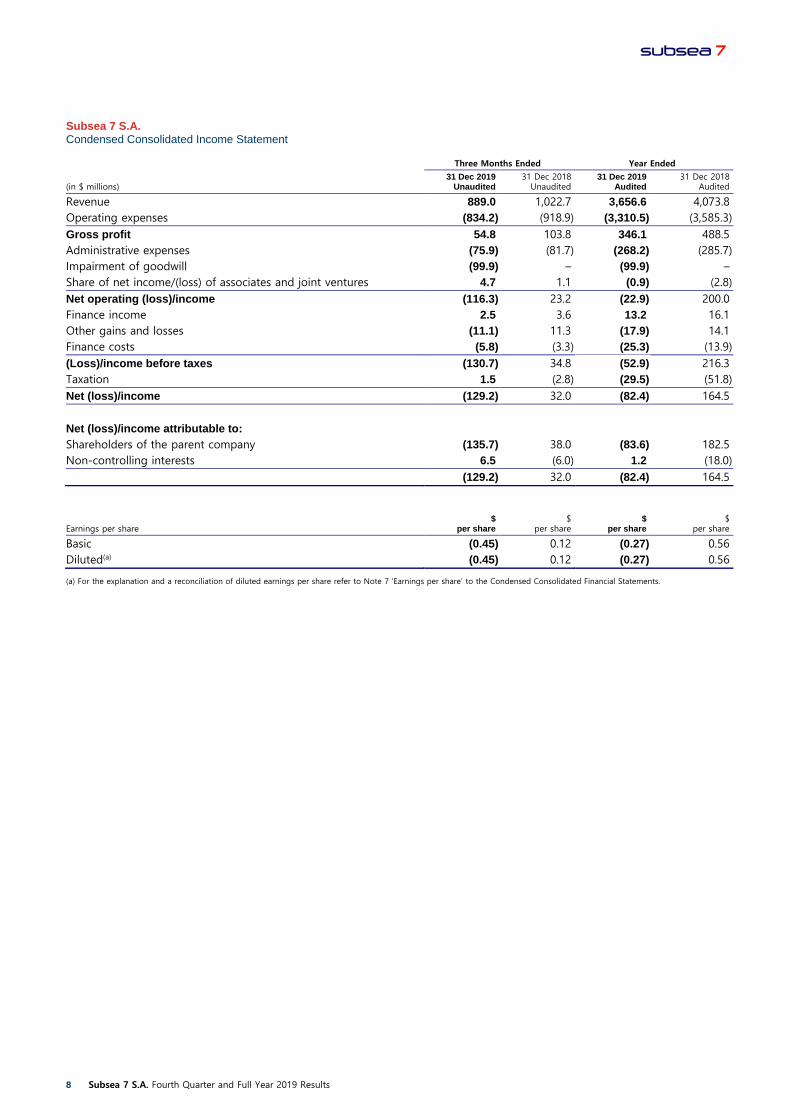
Revenue 889.0 1,022.7 3,656.6 4,073.8 Operating expenses (834.2) (918.9) (3,310.5) (3,585.3) Gross profit 54.8 103.8 346.1 488.5 Administrative expenses (75.9) (81.7) (268.2) (285.7) Impairment of goodwill (99.9) – (99.9) – Share of net income/(loss) of associates and joint ventures 4.7 1.1 (0.9) (2.8) Net operating (loss)/income (116.3) 23.2 (22.9) 200.0 Finance income 2.5 3.6 13.2 16.1 Other gains and losses (11.1) 11.3 (17.9) 14.1 Finance costs (5.8) (3.3) (25.3) (13.9) (Loss)/income before taxes (130.7) 34.8 (52.9) 216.3 Taxation 1.5 (2.8) (29.5) (51.8) Net (loss)/income (129.2) 32.0 (82.4) 164.5
Net (loss)/income attributable to: Shareholders of the parent company (135.7) 38.0 (83.6) 182.5 Non-controlling interests 6.5 (6.0) 1.2 (18.0) (129.2) 32.0 (82.4) 164.5
Earnings per share $
per share $
per share $
per share $
per share
Basic (0.45) 0.12 (0.27) 0.56 Diluted(a) (0.45) 0.12 (0.27) 0.56
(a) For the explanation and a reconciliation of diluted earnings per share refer to Note 7 ‘Earnings per share’ to the Condensed Consolidated Financial Statements.
9
Subsea 7 S.A. Condensed Consolidated Statement of Comprehensive Income
Three Months Ended
Year Ended
(in $ millions) 31 Dec 2019
Unaudited 31Dec 2018 Unaudited
31 Dec 2019 Audited
31 Dec 2018 Audited
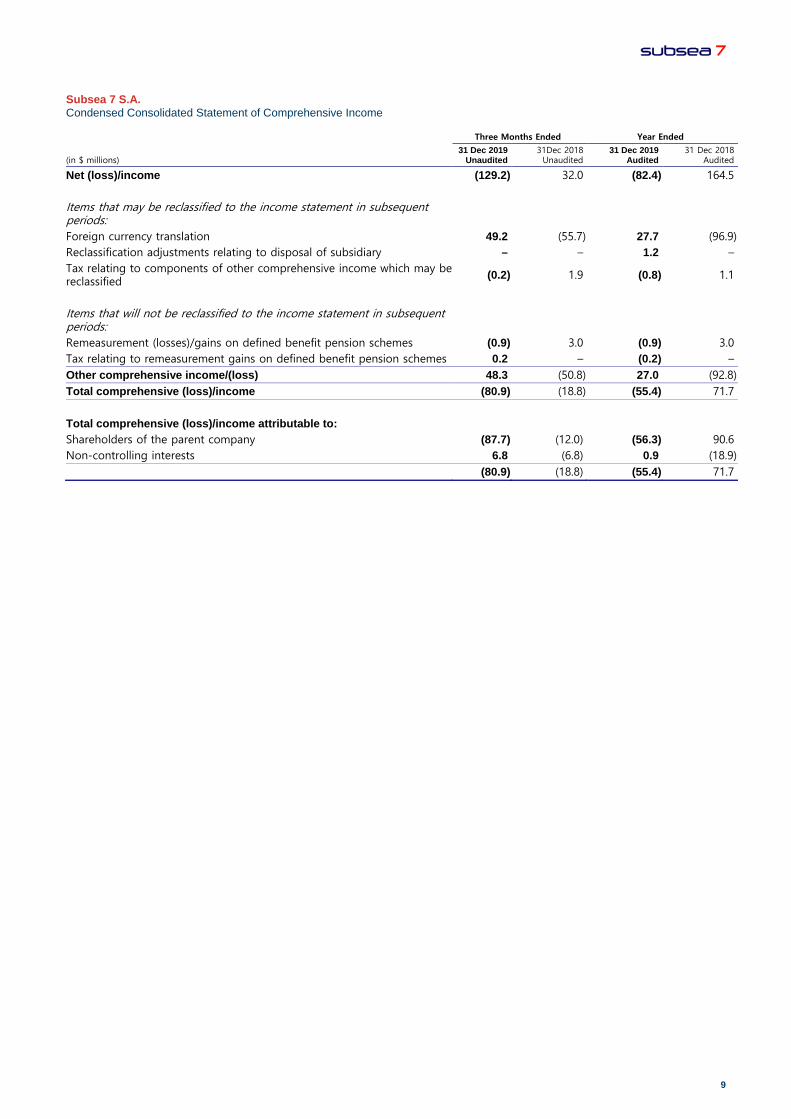
Net (loss)/income (129.2) 32.0 (82.4) 164.5 Items that may be reclassified to the income statement in subsequent periods:
Foreign currency translation 49.2 (55.7) 27.7 (96.9) Reclassification adjustments relating to disposal of subsidiary – – 1.2 – Tax relating to components of other comprehensive income which may be reclassified (0.2) 1.9 (0.8) 1.1
Items that will not be reclassified to the income statement in subsequent periods:
Remeasurement (losses)/gains on defined benefit pension schemes (0.9) 3.0 (0.9) 3.0 Tax relating to remeasurement gains on defined benefit pension schemes 0.2 – (0.2) – Other comprehensive income/(loss) 48.3 (50.8) 27.0 (92.8) Total comprehensive (loss)/income (80.9) (18.8) (55.4) 71.7 Total comprehensive (loss)/income attributable to: Shareholders of the parent company (87.7) (12.0) (56.3) 90.6 Non-controlling interests 6.8 (6.8) 0.9 (18.9) (80.9) (18.8) (55.4) 71.7
10 Subsea 7 S.A. Fourth Quarter and Full Year 2019 Results
Subsea 7 S.A. Condensed Consolidated Balance Sheet
31 Dec 2019
Audited 31 Dec 2018
Audited
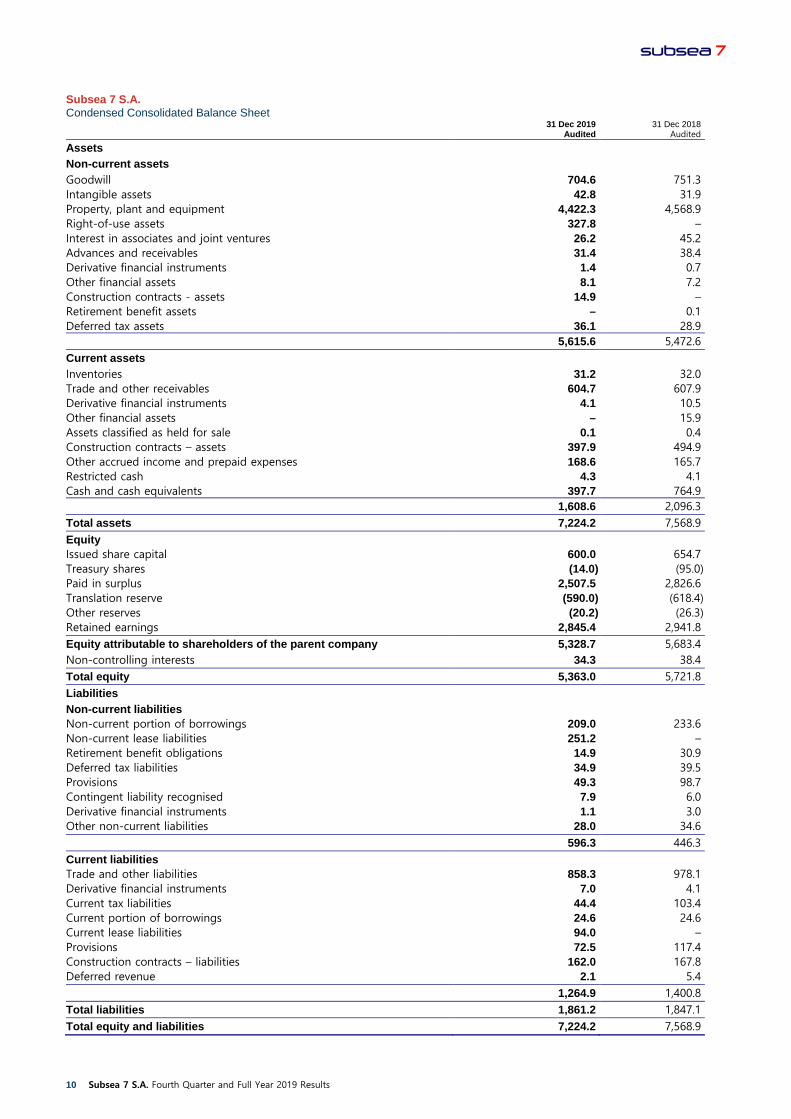
Assets Non-current assets Goodwill 704.6 751.3 Intangible assets 42.8 31.9 Property, plant and equipment 4,422.3 4,568.9 Right-of-use assets 327.8 – Interest in associates and joint ventures 26.2 45.2 Advances and receivables 31.4 38.4 Derivative financial instruments 1.4 0.7 Other financial assets 8.1 7.2 Construction contracts - assets 14.9 – Retirement benefit assets – 0.1 Deferred tax assets 36.1 28.9 5,615.6 5,472.6 Current assets Inventories 31.2 32.0 Trade and other receivables 604.7 607.9 Derivative financial instruments 4.1 10.5 Other financial assets – 15.9 Assets classified as held for sale 0.1 0.4 Construction contracts – assets 397.9 494.9 Other accrued income and prepaid expenses 168.6 165.7 Restricted cash 4.3 4.1 Cash and cash equivalents 397.7 764.9 1,608.6 2,096.3 Total assets 7,224.2 7,568.9 Equity Issued share capital 600.0 654.7 Treasury shares (14.0) (95.0) Paid in surplus 2,507.5 2,826.6 Translation reserve (590.0) (618.4) Other reserves (20.2) (26.3) Retained earnings 2,845.4 2,941.8 Equity attributable to shareholders of the parent company 5,328.7 5,683.4 Non-controlling interests 34.3 38.4 Total equity 5,363.0 5,721.8 Liabilities Non-current liabilities Non-current portion of borrowings 209.0 233.6 Non-current lease liabilities 251.2 – Retirement benefit obligations 14.9 30.9 Deferred tax liabilities 34.9 39.5 Provisions 49.3 98.7 Contingent liability recognised 7.9 6.0 Derivative financial instruments 1.1 3.0 Other non-current liabilities 28.0 34.6 596.3 446.3 Current liabilities Trade and other liabilities 858.3 978.1 Derivative financial instruments 7.0 4.1 Current tax liabilities 44.4 103.4 Current portion of borrowings 24.6 24.6 Current lease liabilities 94.0 – Provisions 72.5 117.4 Construction contracts – liabilities 162.0 167.8 Deferred revenue 2.1 5.4 1,264.9 1,400.8 Total liabilities 1,861.2 1,847.1 Total equity and liabilities 7,224.2 7,568.9
11
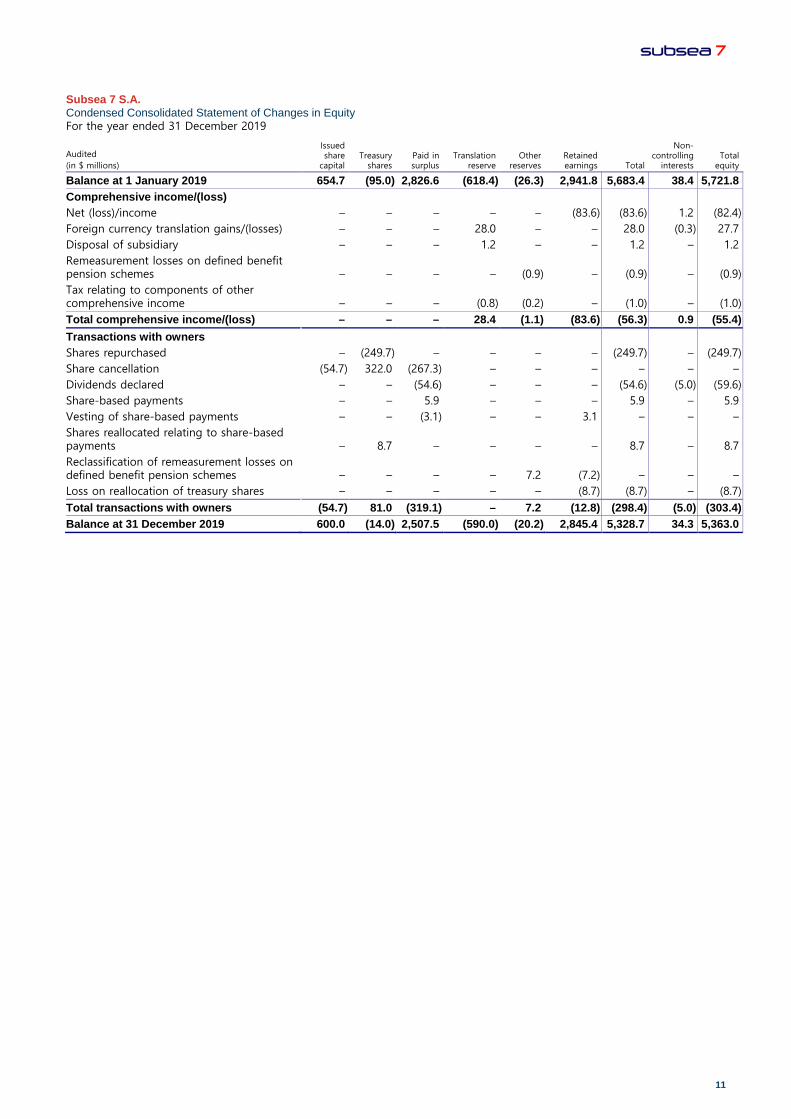
Subsea 7 S.A. Condensed Consolidated Statement of Changes in Equity For the year ended 31 December 2019
Audited (in $ millions)
Issued share
capital Treasury
shares Paid in surplus
Translation reserve
Other reserves
Retained earnings Total
Non-controlling
interests Total
equity
Balance at 1 January 2019 654.7 (95.0) 2,826.6 (618.4) (26.3) 2,941.8 5,683.4 38.4 5,721.8 Comprehensive income/(loss) Net (loss)/income – – – – – (83.6) (83.6) 1.2 (82.4) Foreign currency translation gains/(losses) – – – 28.0 – – 28.0 (0.3) 27.7 Disposal of subsidiary – – – 1.2 – – 1.2 – 1.2 Remeasurement losses on defined benefit pension schemes – – – – (0.9) – (0.9) – (0.9) Tax relating to components of other comprehensive income – – – (0.8) (0.2) – (1.0) – (1.0) Total comprehensive income/(loss) – – – 28.4 (1.1) (83.6) (56.3) 0.9 (55.4) Transactions with owners Shares repurchased – (249.7) – – – – (249.7) – (249.7) Share cancellation (54.7) 322.0 (267.3) – – – – – – Dividends declared – – (54.6) – – – (54.6) (5.0) (59.6) Share-based payments – – 5.9 – – – 5.9 – 5.9 Vesting of share-based payments – – (3.1) – – 3.1 – – – Shares reallocated relating to share-based payments – 8.7 – – – – 8.7 – 8.7 Reclassification of remeasurement losses on defined benefit pension schemes – – – – 7.2 (7.2) – – – Loss on reallocation of treasury shares – – – – – (8.7) (8.7) – (8.7) Total transactions with owners (54.7) 81.0 (319.1) – 7.2 (12.8) (298.4) (5.0) (303.4) Balance at 31 December 2019 600.0 (14.0) 2,507.5 (590.0) (20.2) 2,845.4 5,328.7 34.3 5,363.0
12 Subsea 7 S.A. Fourth Quarter and Full Year 2019 Results
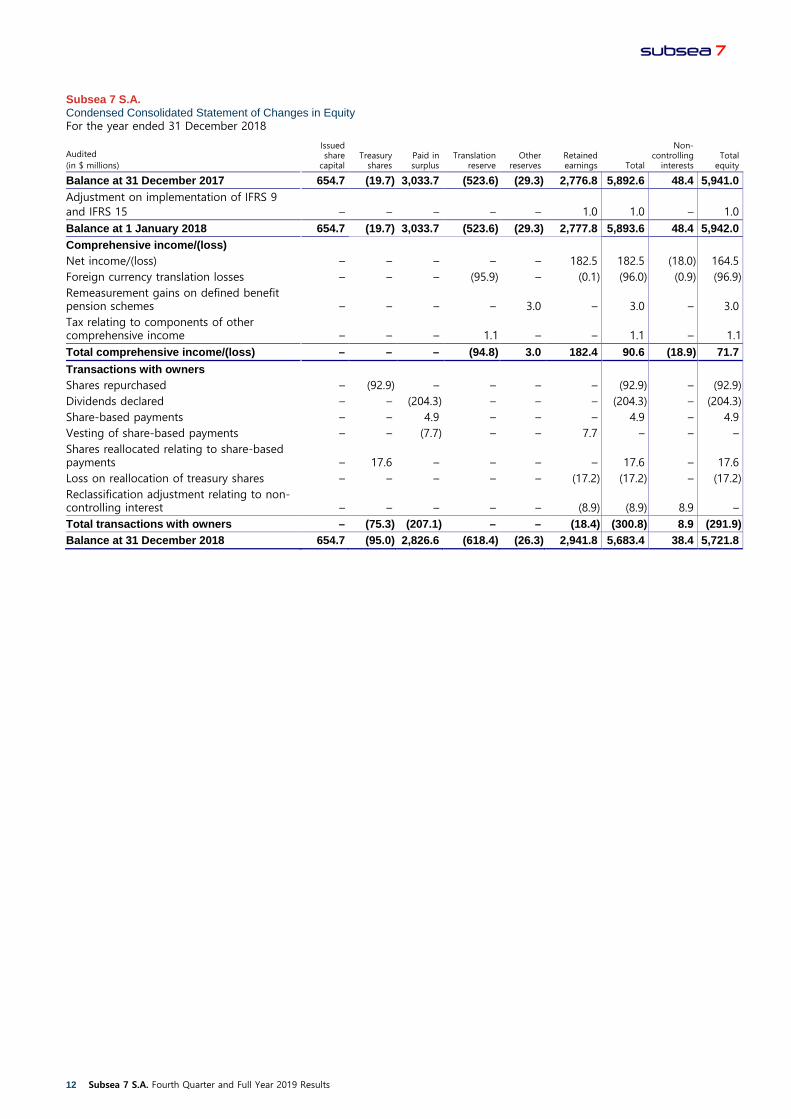
Subsea 7 S.A. Condensed Consolidated Statement of Changes in Equity For the year ended 31 December 2018
Audited (in $ millions)
Issued share
capital Treasury
shares Paid in surplus
Translation reserve
Other reserves
Retained earnings Total
Non-controlling
interests Total
equity
Balance at 31 December 2017 654.7 (19.7) 3,033.7 (523.6) (29.3) 2,776.8 5,892.6 48.4 5,941.0 Adjustment on implementation of IFRS 9 and IFRS 15 – – – – – 1.0 1.0 – 1.0 Balance at 1 January 2018 654.7 (19.7) 3,033.7 (523.6) (29.3) 2,777.8 5,893.6 48.4 5,942.0 Comprehensive income/(loss) Net income/(loss) – – – – – 182.5 182.5 (18.0) 164.5 Foreign currency translation losses – – – (95.9) – (0.1) (96.0) (0.9) (96.9) Remeasurement gains on defined benefit pension schemes – – – – 3.0 – 3.0 – 3.0 Tax relating to components of other comprehensive income – – – 1.1 – – 1.1 – 1.1 Total comprehensive income/(loss) – – – (94.8) 3.0 182.4 90.6 (18.9) 71.7 Transactions with owners Shares repurchased – (92.9) – – – – (92.9) – (92.9) Dividends declared – – (204.3) – – – (204.3) – (204.3) Share-based payments – – 4.9 – – – 4.9 – 4.9 Vesting of share-based payments – – (7.7) – – 7.7 – – – Shares reallocated relating to share-based payments – 17.6 – – – – 17.6 – 17.6 Loss on reallocation of treasury shares – – – – – (17.2) (17.2) – (17.2) Reclassification adjustment relating to non-controlling interest – – – – – (8.9) (8.9) 8.9 – Total transactions with owners – (75.3) (207.1) – – (18.4) (300.8) 8.9 (291.9) Balance at 31 December 2018 654.7 (95.0) 2,826.6 (618.4) (26.3) 2,941.8 5,683.4 38.4 5,721.8
13
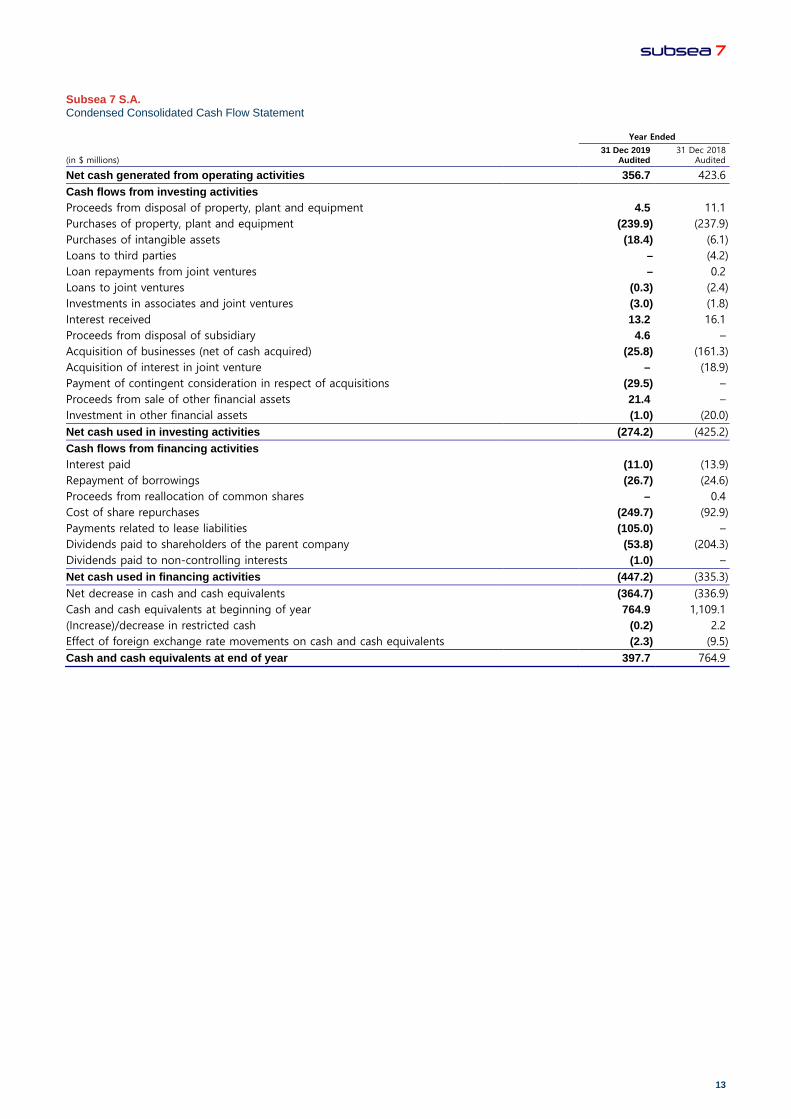
Subsea 7 S.A. Condensed Consolidated Cash Flow Statement
Year Ended
(in $ millions) 31 Dec 2019
Audited 31 Dec 2018
Audited
Net cash generated from operating activities 356.7 423.6 Cash flows from investing activities Proceeds from disposal of property, plant and equipment 4.5 11.1 Purchases of property, plant and equipment (239.9) (237.9) Purchases of intangible assets (18.4) (6.1) Loans to third parties – (4.2) Loan repayments from joint ventures – 0.2 Loans to joint ventures (0.3) (2.4) Investments in associates and joint ventures (3.0) (1.8) Interest received 13.2 16.1 Proceeds from disposal of subsidiary 4.6 – Acquisition of businesses (net of cash acquired) (25.8) (161.3) Acquisition of interest in joint venture – (18.9) Payment of contingent consideration in respect of acquisitions (29.5) – Proceeds from sale of other financial assets 21.4 – Investment in other financial assets (1.0) (20.0) Net cash used in investing activities (274.2) (425.2) Cash flows from financing activities Interest paid (11.0) (13.9) Repayment of borrowings (26.7) (24.6) Proceeds from reallocation of common shares – 0.4 Cost of share repurchases (249.7) (92.9) Payments related to lease liabilities (105.0) – Dividends paid to shareholders of the parent company (53.8) (204.3) Dividends paid to non-controlling interests (1.0) – Net cash used in financing activities (447.2) (335.3) Net decrease in cash and cash equivalents (364.7) (336.9) Cash and cash equivalents at beginning of year 764.9 1,109.1 (Increase)/decrease in restricted cash (0.2) 2.2 Effect of foreign exchange rate movements on cash and cash equivalents (2.3) (9.5) Cash and cash equivalents at end of year 397.7 764.9
Notes to the Condensed Consolidated Financial Statements continued
14 Subsea 7 S.A. Fourth Quarter and Full Year 2019 Results
1. General information Subsea 7 S.A. is a company registered in Luxembourg whose common shares trade on the Oslo Børs and over-the-counter as American Depositary Receipts (ADRs) in the US. The address of the registered office is 412F, route d’Esch, L-2086 Luxembourg. The Condensed Consolidated Financial Statements were authorised for issue by the Board of Directors on 25 February 2020.
2. Basis of preparation The Condensed Consolidated Financial Statements for the period from 1 January 2019 to 31 December 2019 for Subsea 7 S.A. have been prepared on a going concern basis and in accordance with International Accounting Standard (IAS) 34 ‘Interim Financial Reporting’ as issued by the International Accounting Standards Board (IASB) and as adopted by the European Union (EU).
The Condensed Consolidated Financial Statements should be read in conjunction with the audited Consolidated Financial Statements for the year ended 31 December 2018 which have been prepared in accordance with International Financial Reporting Standards (IFRS) as adopted by the EU.
The Condensed Consolidated Financial Statements are unaudited.
3. Accounting policies Basis of accounting The accounting policies adopted in the preparation of the Condensed Consolidated Financial Statements are consistent with the Consolidated Financial Statements for the year ended 31 December 2018 except as detailed below.
The following International Financial Reporting Standards (IFRS) have been adopted by the Group for the financial year beginning 1 January 2019.
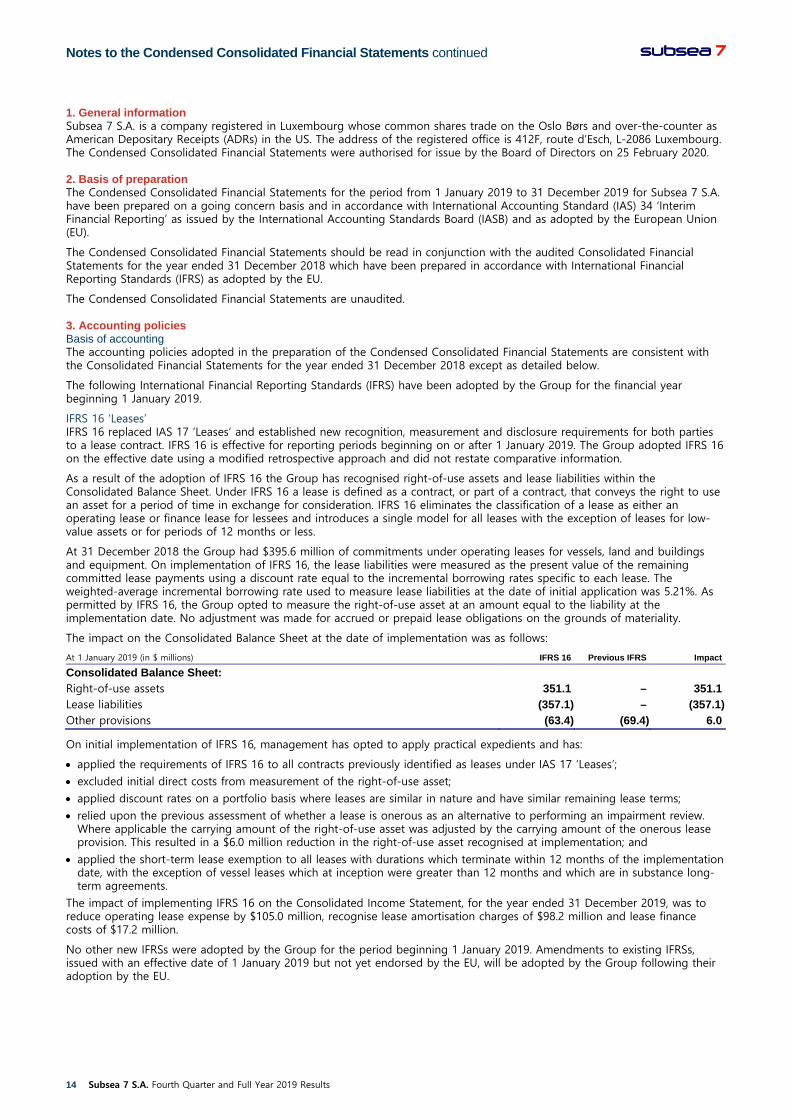
IFRS 16 ‘Leases’ IFRS 16 replaced IAS 17 ‘Leases’ and established new recognition, measurement and disclosure requirements for both parties to a lease contract. IFRS 16 is effective for reporting periods beginning on or after 1 January 2019. The Group adopted IFRS 16 on the effective date using a modified retrospective approach and did not restate comparative information.
As a result of the adoption of IFRS 16 the Group has recognised right-of-use assets and lease liabilities within the Consolidated Balance Sheet. Under IFRS 16 a lease is defined as a contract, or part of a contract, that conveys the right to use an asset for a period of time in exchange for consideration. IFRS 16 eliminates the classification of a lease as either an operating lease or finance lease for lessees and introduces a single model for all leases with the exception of leases for low-value assets or for periods of 12 months or less.
At 31 December 2018 the Group had $395.6 million of commitments under operating leases for vessels, land and buildings and equipment. On implementation of IFRS 16, the lease liabilities were measured as the present value of the remaining committed lease payments using a discount rate equal to the incremental borrowing rates specific to each lease. The weighted-average incremental borrowing rate used to measure lease liabilities at the date of initial application was 5.21%. As permitted by IFRS 16, the Group opted to measure the right-of-use asset at an amount equal to the liability at the implementation date. No adjustment was made for accrued or prepaid lease obligations on the grounds of materiality.
The impact on the Consolidated Balance Sheet at the date of implementation was as follows:
At 1 January 2019 (in $ millions) IFRS 16 Previous IFRS Impact
Consolidated Balance Sheet: Right-of-use assets 351.1 – 351.1 Lease liabilities (357.1) – (357.1) Other provisions (63.4) (69.4) 6.0
On initial implementation of IFRS 16, management has opted to apply practical expedients and has:
• applied the requirements of IFRS 16 to all contracts previously identified as leases under IAS 17 ‘Leases’;
• excluded initial direct costs from measurement of the right-of-use asset;
• applied discount rates on a portfolio basis where leases are similar in nature and have similar remaining lease terms;
• relied upon the previous assessment of whether a lease is onerous as an alternative to performing an impairment review. Where applicable the carrying amount of the right-of-use asset was adjusted by the carrying amount of the onerous lease provision. This resulted in a $6.0 million reduction in the right-of-use asset recognised at implementation; and
• applied the short-term lease exemption to all leases with durations which terminate within 12 months of the implementation date, with the exception of vessel leases which at inception were greater than 12 months and which are in substance long-term agreements.
The impact of implementing IFRS 16 on the Consolidated Income Statement, for the year ended 31 December 2019, was to reduce operating lease expense by $105.0 million, recognise lease amortisation charges of $98.2 million and lease finance costs of $17.2 million.
No other new IFRSs were adopted by the Group for the period beginning 1 January 2019. Amendments to existing IFRSs, issued with an effective date of 1 January 2019 but not yet endorsed by the EU, will be adopted by the Group following their adoption by the EU.
Notes to the Condensed Consolidated Financial Statements
15
4. Critical accounting judgements and key sources of estimation uncertainty In the application of the Group’s accounting policies which are described in the Consolidated Financial Statements for the year ended 31 December 2018, management is required to make judgements, estimates and assumptions about the carrying amounts of assets and liabilities that are not readily apparent from other sources. The estimates and associated assumptions are based on historical experience and other assumptions that management believe to be reasonable under the circumstances. Actual results may differ from these estimates under different assumptions or conditions.
The estimates and underlying assumptions are reviewed on an ongoing basis. Revisions to accounting estimates are recognised in the period in which the estimate is revised if the revision affects only that period or in the period of revision and future periods if the revision affects both current and future periods.
Management makes accounting judgements on the following aspects of the business as described in full in the audited Consolidated Financial Statements for the year ended 31 December 2018:
• Revenue recognition on long-term construction contracts and renewables contracts
• Revenue recognition on variation orders and claims
• Allocation of goodwill to cash-generating units (CGUs)
• Goodwill carrying amount
• Property, plant and equipment
• Recognition of provisions and disclosure of contingent liabilities
• Taxation
• Measurement of other intangibles acquired on business combinations
• Measurement of contingent consideration on business combinations
5. Seasonality A significant portion of the Group’s revenue is generated from work performed offshore. During certain periods of the year, the Group may be affected by adverse weather conditions such as hurricanes, tropical storms and rough seas, which may cause delays. In the Northern Hemisphere seasonally adverse weather, typically during the period from October to March, can affect the Group’s offshore operations. Periods of adverse weather conditions usually result in low levels of activity.
6. Segment information For management and reporting purposes, the Group is organised into four business units: SURF and Conventional, Life of Field, Renewables and Heavy Lifting and Corporate. These operating segments are defined as follows:
SURF and Conventional The SURF and Conventional business unit includes:
• Subsea Umbilicals, Risers and Flowlines (SURF) activities related to the engineering, procurement, installation and commissioning of highly complex systems offshore, including the long-term PLSV contracts in Brazil; and
• Conventional services including the fabrication, installation, extension and refurbishment of fixed and floating platforms and associated pipelines in shallow water environments.
This segment includes costs, including depreciation, amortisation and impairment charges, related to owned and long-term leased vessels, equipment and offshore personnel deployed on SURF and Conventional activities.
Life of Field The Life of Field business unit includes activities associated with the provision of inspection, repair and maintenance (IRM) services, integrity management of subsea infrastructure and remote intervention support. This segment includes costs, including depreciation, amortisation and impairment charges, related to owned and long-term leased vessels, equipment and offshore personnel deployed on Life of Field activities.
Renewables and Heavy Lifting The Renewables and Heavy Lifting business unit includes activities related to three specialist segments of the offshore energy market: the installation of offshore wind turbine foundations and inner-array cables, heavy lifting operations for oil and gas structures, and the decommissioning of redundant offshore structures. This segment includes costs, including depreciation, amortisation and impairment charges, related to owned and long-term leased vessels, equipment and offshore personnel deployed on Renewables and Heavy Lifting activities.
Corporate The Corporate business unit includes group-wide activities, and associated costs, including captive insurance activities, operational support, corporate services and costs associated with discrete events such as restructuring. A significant portion of the Corporate business unit’s costs are allocated to the other operating segments based on a percentage of their external revenue.
Notes to the Condensed Consolidated Financial Statements continued
16 Subsea 7 S.A. Fourth Quarter and Full Year 2019 Results
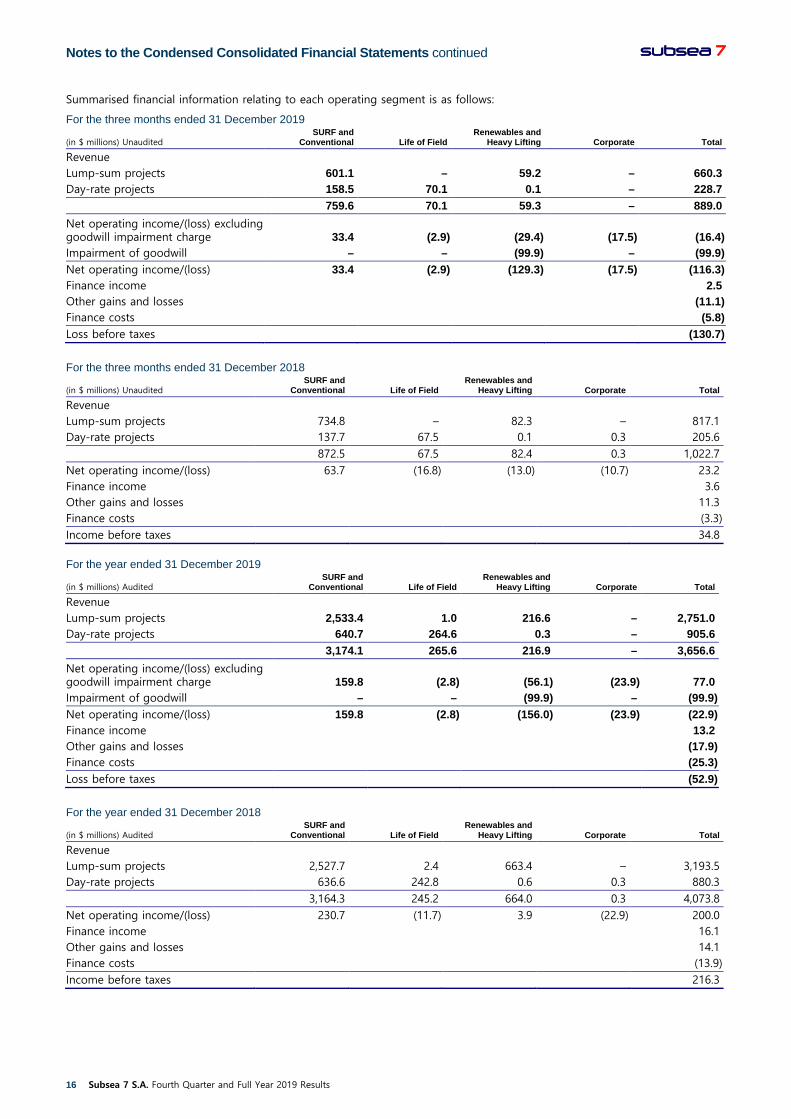
Summarised financial information relating to each operating segment is as follows:
For the three months ended 31 December 2019
(in $ millions) Unaudited SURF and
Conventional Life of Field Renewables and
Heavy Lifting Corporate Total
Revenue Lump-sum projects 601.1 – 59.2 – 660.3 Day-rate projects 158.5 70.1 0.1 – 228.7 759.6 70.1 59.3 – 889.0 Net operating income/(loss) excluding goodwill impairment charge
33.4
(2.9)
(29.4)
(17.5)
(16.4)
Impairment of goodwill – – (99.9) – (99.9) Net operating income/(loss) 33.4 (2.9) (129.3) (17.5) (116.3) Finance income 2.5 Other gains and losses (11.1) Finance costs (5.8) Loss before taxes (130.7)
For the three months ended 31 December 2018
(in $ millions) Unaudited SURF and
Conventional Life of Field Renewables and
Heavy Lifting Corporate Total
Revenue Lump-sum projects 734.8 – 82.3 – 817.1 Day-rate projects 137.7 67.5 0.1 0.3 205.6 872.5 67.5 82.4 0.3 1,022.7 Net operating income/(loss) 63.7 (16.8) (13.0) (10.7) 23.2 Finance income 3.6 Other gains and losses 11.3 Finance costs (3.3) Income before taxes 34.8 For the year ended 31 December 2019
(in $ millions) Audited SURF and
Conventional Life of Field Renewables and
Heavy Lifting Corporate Total
Revenue Lump-sum projects 2,533.4 1.0 216.6 – 2,751.0 Day-rate projects 640.7 264.6 0.3 – 905.6 3,174.1 265.6 216.9 – 3,656.6 Net operating income/(loss) excluding goodwill impairment charge
159.8
(2.8)
(56.1)
(23.9)
77.0
Impairment of goodwill – – (99.9) – (99.9) Net operating income/(loss) 159.8 (2.8) (156.0) (23.9) (22.9) Finance income 13.2 Other gains and losses (17.9) Finance costs (25.3) Loss before taxes (52.9)
For the year ended 31 December 2018
(in $ millions) Audited SURF and
Conventional Life of Field Renewables and
Heavy Lifting Corporate Total
Revenue Lump-sum projects 2,527.7 2.4 663.4 – 3,193.5 Day-rate projects 636.6 242.8 0.6 0.3 880.3 3,164.3 245.2 664.0 0.3 4,073.8 Net operating income/(loss) 230.7 (11.7) 3.9 (22.9) 200.0 Finance income 16.1 Other gains and losses 14.1 Finance costs (13.9) Income before taxes 216.3
Notes to the Condensed Consolidated Financial Statements
17
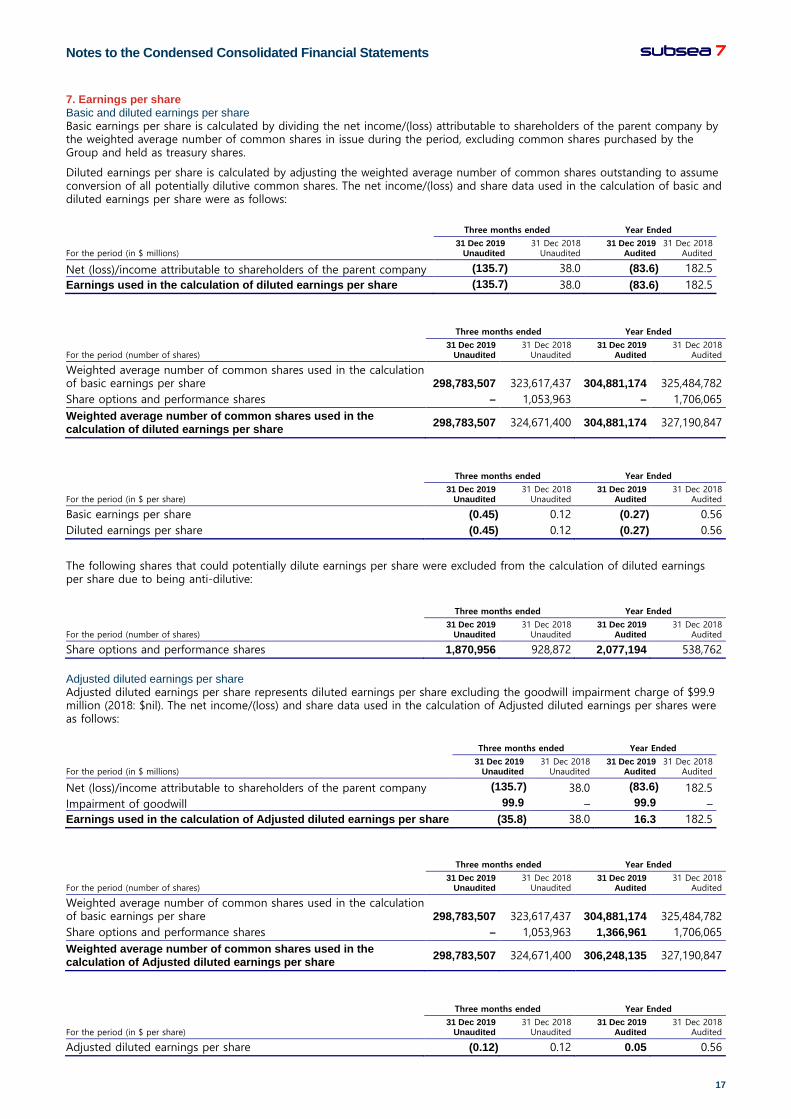
7. Earnings per share Basic and diluted earnings per share Basic earnings per share is calculated by dividing the net income/(loss) attributable to shareholders of the parent company by the weighted average number of common shares in issue during the period, excluding common shares purchased by the Group and held as treasury shares.
Diluted earnings per share is calculated by adjusting the weighted average number of common shares outstanding to assume conversion of all potentially dilutive common shares. The net income/(loss) and share data used in the calculation of basic and diluted earnings per share were as follows:
Three months ended
Year Ended
For the period (in $ millions) 31 Dec 2019
Unaudited 31 Dec 2018
Unaudited 31 Dec 2019
Audited 31 Dec 2018
Audited
Net (loss)/income attributable to shareholders of the parent company (135.7) 38.0 (83.6) 182.5 Earnings used in the calculation of diluted earnings per share (135.7) 38.0 (83.6) 182.5
Three months ended
Year Ended
For the period (number of shares) 31 Dec 2019
Unaudited 31 Dec 2018
Unaudited 31 Dec 2019
Audited 31 Dec 2018
Audited
Weighted average number of common shares used in the calculation of basic earnings per share 298,783,507 323,617,437 304,881,174 325,484,782 Share options and performance shares – 1,053,963 – 1,706,065 Weighted average number of common shares used in the calculation of diluted earnings per share 298,783,507 324,671,400 304,881,174 327,190,847
Three months ended
Year Ended
For the period (in $ per share) 31 Dec 2019
Unaudited 31 Dec 2018
Unaudited 31 Dec 2019
Audited 31 Dec 2018
Audited
Basic earnings per share (0.45) 0.12 (0.27) 0.56 Diluted earnings per share (0.45) 0.12 (0.27) 0.56
The following shares that could potentially dilute earnings per share were excluded from the calculation of diluted earnings per share due to being anti-dilutive:
Three months ended
Year Ended
For the period (number of shares) 31 Dec 2019
Unaudited 31 Dec 2018
Unaudited 31 Dec 2019
Audited 31 Dec 2018
Audited
Share options and performance shares 1,870,956 928,872 2,077,194 538,762 Adjusted diluted earnings per share Adjusted diluted earnings per share represents diluted earnings per share excluding the goodwill impairment charge of $99.9 million (2018: $nil). The net income/(loss) and share data used in the calculation of Adjusted diluted earnings per shares were as follows:
Three months ended
Year Ended
For the period (in $ millions) 31 Dec 2019
Unaudited 31 Dec 2018
Unaudited 31 Dec 2019
Audited 31 Dec 2018
Audited
Net (loss)/income attributable to shareholders of the parent company (135.7) 38.0 (83.6) 182.5 Impairment of goodwill 99.9 – 99.9 – Earnings used in the calculation of Adjusted diluted earnings per share (35.8) 38.0 16.3 182.5
Three months ended
Year Ended
For the period (number of shares) 31 Dec 2019
Unaudited 31 Dec 2018
Unaudited 31 Dec 2019
Audited 31 Dec 2018
Audited
Weighted average number of common shares used in the calculation of basic earnings per share 298,783,507 323,617,437 304,881,174 325,484,782 Share options and performance shares – 1,053,963 1,366,961 1,706,065 Weighted average number of common shares used in the calculation of Adjusted diluted earnings per share 298,783,507 324,671,400 306,248,135 327,190,847
Three months ended
Year Ended
For the period (in $ per share) 31 Dec 2019
Unaudited 31 Dec 2018
Unaudited 31 Dec 2019
Audited 31 Dec 2018
Audited
Adjusted diluted earnings per share (0.12) 0.12 0.05 0.56
Notes to the Condensed Consolidated Financial Statements continued
18 Subsea 7 S.A. Fourth Quarter and Full Year 2019 Results
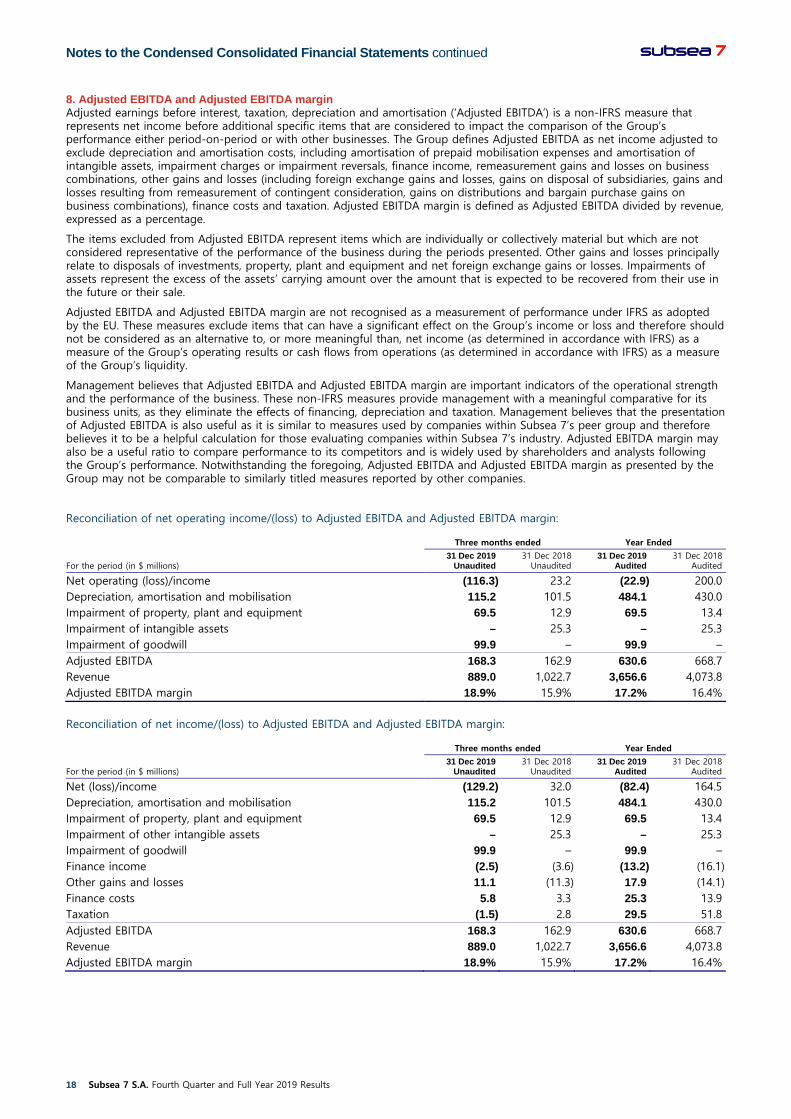
8. Adjusted EBITDA and Adjusted EBITDA margin Adjusted earnings before interest, taxation, depreciation and amortisation (‘Adjusted EBITDA’) is a non-IFRS measure that represents net income before additional specific items that are considered to impact the comparison of the Group’s performance either period-on-period or with other businesses. The Group defines Adjusted EBITDA as net income adjusted to exclude depreciation and amortisation costs, including amortisation of prepaid mobilisation expenses and amortisation of intangible assets, impairment charges or impairment reversals, finance income, remeasurement gains and losses on business combinations, other gains and losses (including foreign exchange gains and losses, gains on disposal of subsidiaries, gains and losses resulting from remeasurement of contingent consideration, gains on distributions and bargain purchase gains on business combinations), finance costs and taxation. Adjusted EBITDA margin is defined as Adjusted EBITDA divided by revenue, expressed as a percentage.
The items excluded from Adjusted EBITDA represent items which are individually or collectively material but which are not considered representative of the performance of the business during the periods presented. Other gains and losses principally relate to disposals of investments, property, plant and equipment and net foreign exchange gains or losses. Impairments of assets represent the excess of the assets’ carrying amount over the amount that is expected to be recovered from their use in the future or their sale.
Adjusted EBITDA and Adjusted EBITDA margin are not recognised as a measurement of performance under IFRS as adopted by the EU. These measures exclude items that can have a significant effect on the Group’s income or loss and therefore should not be considered as an alternative to, or more meaningful than, net income (as determined in accordance with IFRS) as a measure of the Group’s operating results or cash flows from operations (as determined in accordance with IFRS) as a measure of the Group’s liquidity.
Management believes that Adjusted EBITDA and Adjusted EBITDA margin are important indicators of the operational strength and the performance of the business. These non-IFRS measures provide management with a meaningful comparative for its business units, as they eliminate the effects of financing, depreciation and taxation. Management believes that the presentation of Adjusted EBITDA is also useful as it is similar to measures used by companies within Subsea 7’s peer group and therefore believes it to be a helpful calculation for those evaluating companies within Subsea 7’s industry. Adjusted EBITDA margin may also be a useful ratio to compare performance to its competitors and is widely used by shareholders and analysts following the Group’s performance. Notwithstanding the foregoing, Adjusted EBITDA and Adjusted EBITDA margin as presented by the Group may not be comparable to similarly titled measures reported by other companies.
Reconciliation of net operating income/(loss) to Adjusted EBITDA and Adjusted EBITDA margin: Three months ended
Year Ended
For the period (in $ millions) 31 Dec 2019
Unaudited 31 Dec 2018
Unaudited 31 Dec 2019
Audited 31 Dec 2018
Audited
Net operating (loss)/income (116.3) 23.2 (22.9) 200.0 Depreciation, amortisation and mobilisation 115.2 101.5 484.1 430.0 Impairment of property, plant and equipment 69.5 12.9 69.5 13.4 Impairment of intangible assets – 25.3 – 25.3 Impairment of goodwill 99.9 – 99.9 – Adjusted EBITDA 168.3 162.9 630.6 668.7 Revenue 889.0 1,022.7 3,656.6 4,073.8 Adjusted EBITDA margin 18.9% 15.9% 17.2% 16.4%
Reconciliation of net income/(loss) to Adjusted EBITDA and Adjusted EBITDA margin:
Three months ended
Year Ended
For the period (in $ millions) 31 Dec 2019
Unaudited 31 Dec 2018
Unaudited 31 Dec 2019
Audited 31 Dec 2018
Audited
Net (loss)/income (129.2) 32.0 (82.4) 164.5 Depreciation, amortisation and mobilisation 115.2 101.5 484.1 430.0 Impairment of property, plant and equipment 69.5 12.9 69.5 13.4 Impairment of other intangible assets – 25.3 – 25.3 Impairment of goodwill 99.9 – 99.9 – Finance income (2.5) (3.6) (13.2) (16.1) Other gains and losses 11.1 (11.3) 17.9 (14.1) Finance costs 5.8 3.3 25.3 13.9 Taxation (1.5) 2.8 29.5 51.8 Adjusted EBITDA 168.3 162.9 630.6 668.7 Revenue 889.0 1,022.7 3,656.6 4,073.8 Adjusted EBITDA margin 18.9% 15.9% 17.2% 16.4%
Notes to the Condensed Consolidated Financial Statements
19
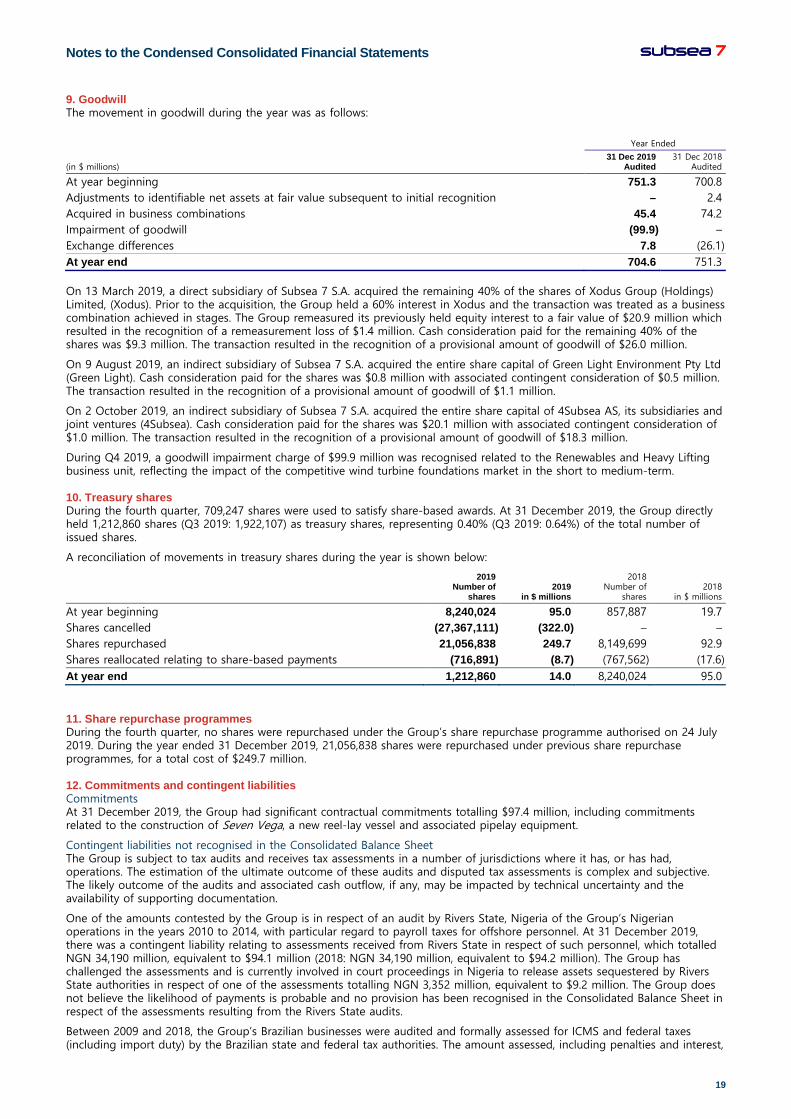
9. Goodwill The movement in goodwill during the year was as follows:
Year Ended
(in $ millions) 31 Dec 2019
Audited 31 Dec 2018
Audited
At year beginning 751.3 700.8 Adjustments to identifiable net assets at fair value subsequent to initial recognition – 2.4 Acquired in business combinations 45.4 74.2 Impairment of goodwill (99.9) – Exchange differences 7.8 (26.1) At year end 704.6 751.3 On 13 March 2019, a direct subsidiary of Subsea 7 S.A. acquired the remaining 40% of the shares of Xodus Group (Holdings) Limited, (Xodus). Prior to the acquisition, the Group held a 60% interest in Xodus and the transaction was treated as a business combination achieved in stages. The Group remeasured its previously held equity interest to a fair value of $20.9 million which resulted in the recognition of a remeasurement loss of $1.4 million. Cash consideration paid for the remaining 40% of the shares was $9.3 million. The transaction resulted in the recognition of a provisional amount of goodwill of $26.0 million.
On 9 August 2019, an indirect subsidiary of Subsea 7 S.A. acquired the entire share capital of Green Light Environment Pty Ltd (Green Light). Cash consideration paid for the shares was $0.8 million with associated contingent consideration of $0.5 million. The transaction resulted in the recognition of a provisional amount of goodwill of $1.1 million.
On 2 October 2019, an indirect subsidiary of Subsea 7 S.A. acquired the entire share capital of 4Subsea AS, its subsidiaries and joint ventures (4Subsea). Cash consideration paid for the shares was $20.1 million with associated contingent consideration of $1.0 million. The transaction resulted in the recognition of a provisional amount of goodwill of $18.3 million.
During Q4 2019, a goodwill impairment charge of $99.9 million was recognised related to the Renewables and Heavy Lifting business unit, reflecting the impact of the competitive wind turbine foundations market in the short to medium-term.
10. Treasury shares During the fourth quarter, 709,247 shares were used to satisfy share-based awards. At 31 December 2019, the Group directly held 1,212,860 shares (Q3 2019: 1,922,107) as treasury shares, representing 0.40% (Q3 2019: 0.64%) of the total number of issued shares.
A reconciliation of movements in treasury shares during the year is shown below:
2019 Number of
shares 2019
in $ millions
2018 Number of
shares 2018
in $ millions
At year beginning 8,240,024 95.0 857,887 19.7 Shares cancelled (27,367,111) (322.0) – – Shares repurchased 21,056,838 249.7 8,149,699 92.9 Shares reallocated relating to share-based payments (716,891) (8.7) (767,562) (17.6) At year end 1,212,860 14.0 8,240,024 95.0
11. Share repurchase programmes During the fourth quarter, no shares were repurchased under the Group’s share repurchase programme authorised on 24 July 2019. During the year ended 31 December 2019, 21,056,838 shares were repurchased under previous share repurchase programmes, for a total cost of $249.7 million.
12. Commitments and contingent liabilities Commitments At 31 December 2019, the Group had significant contractual commitments totalling $97.4 million, including commitments related to the construction of Seven Vega, a new reel-lay vessel and associated pipelay equipment.
Contingent liabilities not recognised in the Consolidated Balance Sheet The Group is subject to tax audits and receives tax assessments in a number of jurisdictions where it has, or has had, operations. The estimation of the ultimate outcome of these audits and disputed tax assessments is complex and subjective. The likely outcome of the audits and associated cash outflow, if any, may be impacted by technical uncertainty and the availability of supporting documentation.
One of the amounts contested by the Group is in respect of an audit by Rivers State, Nigeria of the Group’s Nigerian operations in the years 2010 to 2014, with particular regard to payroll taxes for offshore personnel. At 31 December 2019, there was a contingent liability relating to assessments received from Rivers State in respect of such personnel, which totalled NGN 34,190 million, equivalent to $94.1 million (2018: NGN 34,190 million, equivalent to $94.2 million). The Group has challenged the assessments and is currently involved in court proceedings in Nigeria to release assets sequestered by Rivers State authorities in respect of one of the assessments totalling NGN 3,352 million, equivalent to $9.2 million. The Group does not believe the likelihood of payments is probable and no provision has been recognised in the Consolidated Balance Sheet in respect of the assessments resulting from the Rivers State audits.
Between 2009 and 2018, the Group’s Brazilian businesses were audited and formally assessed for ICMS and federal taxes (including import duty) by the Brazilian state and federal tax authorities. The amount assessed, including penalties and interest,

Notes to the Condensed Consolidated Financial Statements continued
20 Subsea 7 S.A. Fourth Quarter and Full Year 2019 Results
at 31 December 2019 amounted to BRL 847.7 million, equivalent to $207.6 million (2018: BRL 750.7 million, equivalent to $192.6 million). The Group has challenged these assessments. A contingent liability has been disclosed for the total amounts assessed as the disclosure criteria have been met however the Group does not believe that the likelihood of payment is probable.
During 2018 and 2019, the Group’s Brazilian business received a number of labour and civil tax claims. The amount assessed at 31 December 2019 amounted to BRL 237.8 million, equivalent to $58.2 million (2018: BRL 136.4 million, equivalent to $35.0 million). The Group has challenged these claims. A contingent liability has been disclosed for BRL 193.3 million, equivalent to $47.3 million as the disclosure criteria have been met however, the Group does not believe that the likelihood of payment is probable. At 31 December 2019, a provision of BRL 44.5 million, equivalent to $10.9 million was recognised within the Consolidated Balance Sheet (2018: BRL 27.4 million, equivalent to $7.0 million), as the IAS 37 ‘Provisions, contingent liabilities and contingent assets’ recognition criteria were met.
Contingent liabilities recognised in the Consolidated Balance Sheet As part of accounting for the business combination with Subsea 7 Inc., IFRS 3 ‘Business combinations’ (IFRS 3) required the Group to recognise as a provision, as of the acquisition date, the fair value of contingent liabilities assumed if there was a present obligation that arose from past events, even where payment was not probable. The value of the provision recognised within the Consolidated Balance Sheet at 31 December 2019 was $6.9 million (2018: $4.1 million). While complying with the requirements of IFRS 3, the Group continues to believe that payment relating to the remaining recognised contingent liabilities is not probable.
As part of the accounting for the business combination of Pioneer Lining Technology Limited, IFRS 3 required the Group to
recognise a provision in respect of contingent consideration payable to a third party following the acquisition of intangible
assets in 2009. The value of the provision recognised within the Consolidated Balance Sheet at 31 December 2019 was $1.0
million (2018: $1.9 million). While complying with the requirements of IFRS 3, the Group continues to believe that payment
relating to the remaining recognised contingent liabilities is not probable.
13. Cash flow from operating activities
Year Ended
For the period ended (in $ millions) 31 Dec 2019
Audited 31 Dec 2018
Audited
Cash flow from operating activities: (Loss)/income before taxes (52.9) 216.3 Adjustments for non-cash items:
Depreciation of property, plant and equipment 365.9 389.6 Impairment of property, plant and equipment 69.5 13.4 Impairment of intangible assets – 25.3 Amortisation of right-of-use assets 98.2 – Amortisation of intangible assets 11.0 30.8 Amortisation of mobilisation costs 9.0 9.6 Impairment of goodwill 99.9 – (Gain)/loss on other financial assets measured at fair value through profit or loss (5.5) 4.0
Adjustments for investing and financing items: Remeasurement loss on business combination 1.4 – Gain on disposal of subsidiary (4.3) – Gain on settlement of contingent consideration (1.5) –
Share of net income of associates and joint ventures 0.9 2.8 Net gain on disposal of property, plant and equipment (1.3) (5.8) Finance income (13.2) (16.1) Finance costs 25.3 13.9
Adjustments for equity items: Reclassification of exchange differences relating to the disposal of a subsidiary 1.1 –
Share-based payments 5.9 4.9 609.4 688.7
Changes in operating assets and liabilities: Decrease in inventories 0.8 4.7 Decrease/(increase) in operating receivables 78.1 (309.1) (Decrease)/increase in operating liabilities (223.9) 137.6 (145.0) (166.8) Income taxes paid (107.7) (98.3) Net cash generated from operating activities 356.7 423.6
Notes to the Condensed Consolidated Financial Statements
21
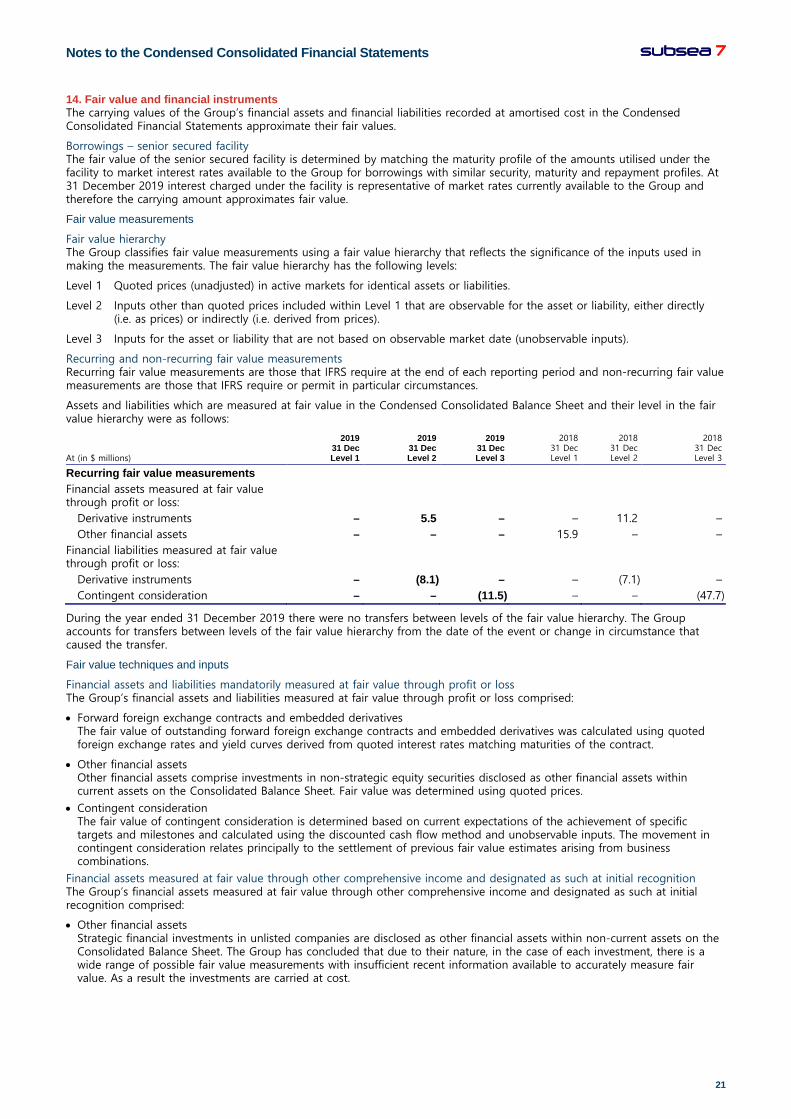
14. Fair value and financial instruments The carrying values of the Group’s financial assets and financial liabilities recorded at amortised cost in the Condensed Consolidated Financial Statements approximate their fair values.
Borrowings – senior secured facility The fair value of the senior secured facility is determined by matching the maturity profile of the amounts utilised under the facility to market interest rates available to the Group for borrowings with similar security, maturity and repayment profiles. At 31 December 2019 interest charged under the facility is representative of market rates currently available to the Group and therefore the carrying amount approximates fair value.
Fair value measurements
Fair value hierarchy The Group classifies fair value measurements using a fair value hierarchy that reflects the significance of the inputs used in making the measurements. The fair value hierarchy has the following levels:
Level 1 Quoted prices (unadjusted) in active markets for identical assets or liabilities.
Level 2 Inputs other than quoted prices included within Level 1 that are observable for the asset or liability, either directly (i.e. as prices) or indirectly (i.e. derived from prices).
Level 3 Inputs for the asset or liability that are not based on observable market date (unobservable inputs).
Recurring and non-recurring fair value measurements Recurring fair value measurements are those that IFRS require at the end of each reporting period and non-recurring fair value measurements are those that IFRS require or permit in particular circumstances.
Assets and liabilities which are measured at fair value in the Condensed Consolidated Balance Sheet and their level in the fair value hierarchy were as follows:
At (in $ millions)
2019 31 Dec Level 1
2019 31 Dec Level 2
2019 31 Dec Level 3
2018 31 Dec Level 1
2018 31 Dec Level 2
2018 31 Dec Level 3
Recurring fair value measurements Financial assets measured at fair value through profit or loss:
Derivative instruments – 5.5 – – 11.2 – Other financial assets – – – 15.9 – –
Financial liabilities measured at fair value through profit or loss:
Derivative instruments – (8.1) – – (7.1) – Contingent consideration – – (11.5) – – (47.7)
During the year ended 31 December 2019 there were no transfers between levels of the fair value hierarchy. The Group accounts for transfers between levels of the fair value hierarchy from the date of the event or change in circumstance that caused the transfer.
Fair value techniques and inputs
Financial assets and liabilities mandatorily measured at fair value through profit or loss The Group’s financial assets and liabilities measured at fair value through profit or loss comprised:
• Forward foreign exchange contracts and embedded derivatives The fair value of outstanding forward foreign exchange contracts and embedded derivatives was calculated using quoted foreign exchange rates and yield curves derived from quoted interest rates matching maturities of the contract.
• Other financial assets Other financial assets comprise investments in non-strategic equity securities disclosed as other financial assets within current assets on the Consolidated Balance Sheet. Fair value was determined using quoted prices.
• Contingent consideration The fair value of contingent consideration is determined based on current expectations of the achievement of specific targets and milestones and calculated using the discounted cash flow method and unobservable inputs. The movement in contingent consideration relates principally to the settlement of previous fair value estimates arising from business combinations.
Financial assets measured at fair value through other comprehensive income and designated as such at initial recognition The Group’s financial assets measured at fair value through other comprehensive income and designated as such at initial recognition comprised:
• Other financial assets Strategic financial investments in unlisted companies are disclosed as other financial assets within non-current assets on the Consolidated Balance Sheet. The Group has concluded that due to their nature, in the case of each investment, there is a wide range of possible fair value measurements with insufficient recent information available to accurately measure fair value. As a result the investments are carried at cost.

Notes to the Condensed Consolidated Financial Statements continued
22 Subsea 7 S.A. Fourth Quarter and Full Year 2019 Results
15. Post balance sheet events Assets classified as held for sale During January 2020, a vessel was classified as an asset held for sale with the criteria specified within IFRS 5 ‘Non-current Assets Held for Sale and Discontinued Operations’ being met. In addition a second vessel was removed from the active fleet in preparation for recycling.