Embed Size (px)
Citation preview

Subthreshold resonance properties contribute to theefficient coding of auditory spatial cuesMichiel W. H. Remmea,b,1, Roberta Donatoc,1, Jason Mikiel-Huntera,c, Jimena A. Ballesteroc, Simon Fosterc,John Rinzela,d, and David McAlpinec,2
aCenter for Neural Science, New York University, New York, NY 10003; bInstitute for Theoretical Biology, Humboldt-Universität zu Berlin, 10115 Berlin,Germany; cUniversity College London Ear Institute, University College London, London WC1X 8EE, United Kingdom; and dCourant Institute of MathematicalSciences, New York University, New York, NY 10012
Edited by Eric I. Knudsen, Stanford University School of Medicine, Stanford, CA, and approved April 25, 2014 (received for review September 7, 2013)
Neurons in the medial superior olive (MSO) and lateral superiorolive (LSO) of the auditory brainstem code for sound-source locationin the horizontal plane, extracting interaural time differences (ITDs)from the stimulus fine structure and interaural level differences (ILDs)from the stimulus envelope. Here, we demonstrate a postsynapticgradient in temporal processing properties across the presumedtonotopic axis; neurons in the MSO and the low-frequency limb ofthe LSO exhibit fast intrinsic electrical resonances and low inputimpedances, consistent with their processing of ITDs in the temporalfine structure. Neurons in the high-frequency limb of the LSO showlow-pass electrical properties, indicating they are better suited toextracting information from the slower, modulated envelopes ofsounds. Using a modeling approach, we assess ITD and ILD sensitivityof the neural filters to natural sounds, demonstrating that thetransformation in temporal processing along the tonotopic axiscontributes to efficient extraction of auditory spatial cues.
auditory system | superior olivary nucleus | spatial listening
The auditory system analyzes sounds over different time scalesto extract ecologically relevant information, including the
identity and location of a sound source (Fig. 1A; also see ref. 1).In particular, sensitivity to rapidly fluctuating signals in thetemporal fine structure (TFS; the sound-pressure waveform) ofsounds enables the extraction of spatial information in the form ofinteraural time differences (ITDs), i.e., the time difference in thearrival of the stimulus to both ears. For frequencies below about1,500 Hz, human listeners can discriminate ITDs of just a few tensof microseconds (2–4), corresponding to a spatial resolution ofabout two degrees for sources located to the front. Such exquisitesensitivity relies on the ability of cochlear hair cells to generateaction potentials in auditory nerve fibers that are phase-locked tothe instantaneous sound-pressure waveform at each eardrum(Fig. 1A, bottom right). Phase-locking to the TFS in nerve fibersextends to at least 4 kHz in many mammalian species but startsto degrade from about 1 kHz as the result of low-pass filteringby the sensory hair cells (5). Postsynaptic specializations in sub-sequent stages of the ascending pathway—such as the cochlearnucleus—may improve temporal locking of action potentials to theTFS, at least for frequencies below 1 kHz (6). Phase-locked ex-citatory (and potentially inhibitory) inputs from each ear (“EE”input) ultimately converge on neurons in the medial superior olive(MSO) of the brainstem, where ITDs are explicitly computed(Fig. 1B).For sounds above a few kilohertz in frequency, differences
in the intensity of the sound at each ear (interaural level differ-ences, ILDs)—generated by the head “shadowing” the ear furtherfrom the source—become increasingly important as localizationcues. Although phase-locking of action potentials to the TFStypically is absent in this frequency range, the spiking activity doesvary with the more-slowly varying sound amplitude (the sound“envelope”). Besides conveying the structure of speech (<10 Hz)and the pitch of complex sounds (e.g., 100–300 Hz for humanvoice), sensitivity to the sound envelope creates an additional
localization cue in the form of the “envelope ITD.” EnvelopeITDs generally are considered less important than ILDs as alocalization cue at these frequencies (7); however, depending onthe stimulus parameters and listening conditions, sensitivity toenvelope ITDs may approach that observed for ITDs conveyedin the TFS of low-frequency sounds behaviorally (3) and phys-iologically (8). High-frequency inputs from both ears convergein the lateral superior olive (LSO), where both ILDs and en-velope ITDs are computed (Fig. 1B). LSO neurons receive adirect excitatory input from the ipsilateral cochlear nucleus,whereas input from the other ear is inhibitory and reaches theLSO via an intermediate synapse from the medial nucleus of thetrapezoid body (MNTB; “EI” input).Although the loss of temporal coding with increasing sound
frequency usually is considered a consequence of the degrada-tion of phase-locking, the notion that reduced temporal perfor-mance at higher frequencies represents an intrinsic limitation inneural sensitivity to high stimulation rates reckons without theconcept of efficiency. Efficiency represents a fundamental prin-ciple of sensory coding whereby neural filters are matched to thestatistics of ecologically relevant stimuli. In accordance with thisprinciple, it has been shown in the early auditory system thatcochlear and auditory nerve filter characteristics are well-suitedto extract the spectrotemporal features present in natural sounds(9, 10). Furthermore, behaviorally relevant stimuli combinedwith background noise typically display a decreasing signal-to-noise ratio (SNR) with increasing frequency (11). Because theauditory pathways are organized according to sound frequency(tonotopy), this decrease in SNR might be expected to affect the
Significance
Locating the source of a sound is critical to the survival of manyspecies and an important factor in human communication. Au-ditory spatial cues—differences in the timing and intensity ofsounds arriving at the two ears—are processed by specializedneurons in the brainstem. The importance of these cues varieswith sound frequency. Through in vitro recordings we show thatthe biophysical properties of brainstem neurons vary with theirpresumed sound frequency tuning. Using neural modeling wedemonstrate that the cell properties are well suited to extractspatial cues from natural sounds, including in background noise.Our findings also provide an explanation for human listeningperformance limits under noisy conditions and have implicationsfor further development of cochlear implants.
Author contributions: M.W.H.R., R.D., J.R., and D.M. designed research; M.W.H.R., R.D.,J.M.-H., J.A.B., and S.F. performed research; M.W.H.R., R.D., and J.M.-H. analyzed data;and M.W.H.R., R.D., J.R., and D.M. wrote the paper.
The authors declare no conflict of interest.
This article is a PNAS Direct Submission.
Freely available online through the PNAS open access option.1M.W.H.R. and R.D. contributed equally to this work.2To whom correspondence should be addressed. E-mail: [email protected].
www.pnas.org/cgi/doi/10.1073/pnas.1316216111 PNAS | Published online May 19, 2014 | E2339–E2348
NEU
ROSC
IENCE
PNASPL
US
Dow
nloa
ded
by g
uest
on
Dec
embe
r 29
, 202
1

form of the neural code along the frequency axis. To this end,constraints of efficiency are likely to affect the neural repre-sentation of spatial cues by MSO and LSO neurons.Specifically, under the efficiency paradigm, it might be expected
that the coding strategies of MSO and LSO neurons are special-ized to extract information conveyed by low- and high-frequencycomponents of natural sound. To test this hypothesis, we used invitro electrophysiological recordings (in guinea pig and rat) tocharacterize the intrinsic filtering properties of MSO and LSOneurons. We first determined their subthreshold membrane im-pedance profiles (12, 13) and found strong subthreshold reso-nance in MSO neurons as well as some neurons in the lateral limbof the LSO (where neurons sensitive to low-frequency sounds aresituated) but largely low-pass impedance profiles in the mediallimb of the LSO (the location of neurons sensitive to high-fre-quency sounds). Based on these observed filter properties, wedeveloped a biophysically inspired binaural model and examinedits ability to extract spatial information from natural sounds(conspecific vocalizations). We demonstrated that high-frequencyresonances contribute to the efficient extraction of ITD cues from
the TFS of low-frequency sounds, whereas neurons with low-passimpedance characteristics coded ILD cues from high-frequencysounds more efficiently. Furthermore, we showed that thechange in coding strategy enhances the extraction of spatialinformation in background noise as the SNR decreases withincreasing sound frequency.Here, we demonstrate a transformation in intrinsic electrical
properties of neurons along the main tonotopic axis of the bin-aural brainstem nuclei that is tuned to exploit the transition incoding information from one emphasizing the TFS of sounds toone emphasizing the temporal envelope.
ResultsIn Vitro Whole-Cell Recordings from Principal Neurons of MSO andLSO. To determine whether the intrinsic properties of brainstemauditory neurons accord with the efficiency hypothesis, we firstcharacterized the subthreshold input filtering properties of MSOand LSO neurons by performing in vitro whole-cell patch-clamprecordings from these cells in guinea pig brainstem slices at near-physiological temperatures (Materials and Methods). The guineapig was selected as an animal model because, unlike most rodents,its hearing range (14) spans the range of frequencies over whichprocessing shifts from one associated with the TFS (5, 15) to oneassociated with the temporal envelope (8).To characterize the neural filters, we determined the sub-
threshold membrane impedance profile (i.e., the frequency-dependent voltage response) by recording the voltage response toa ZAP current (12, 13), i.e., a sinusoidal current with constantamplitude and linearly increasing frequency (1–1,000 Hz for0.96 s). When necessary, current was injected to maintain thebaseline membrane voltage close to −55 mV (−53 ± 5 mV, n =17). The amplitude of the ZAP current was adjusted to keepperturbations of the membrane potential close to 5 mV peak topeak, thus avoiding the triggering of action potentials. Fig. 2Aashows the input current (Upper) and voltage output (Lower)recorded from a guinea pig MSO neuron. The impedance pro-file (Fig. 2Ac) was obtained by dividing the Fourier transform ofthe voltage response by that of the input current (Fig. 2Ab;panels show power spectra). According to their impedanceprofiles, neurons were classified as “resonant” if they showeda peak in their impedance that was higher than their inputresistance (i.e., the impedance to a dc input). Neurons wereclassified as “low-pass” if such a peak was absent. Resonancepeaks were characterized by both the frequency at which theyoccurred and the quality or “Q factor” (maximum impedancedivided by the input resistance; Materials and Methods). Thepresence of a resonance peak implies that a neuron respondspreferentially (i.e., the subthreshold voltage response is largest) toinputs whose frequency content matches that of the resonantpeak, whereas a low-pass neuron responds better to slowly vary-ing input signals allowing integration of inputs in time (13).MSO neurons had significantly lower input resistance than
LSO neurons (19 ± 3 MΩ with n = 10 vs. 73 ± 17 MΩ with n = 7;unpaired t test; P < 0.05). This difference is the result, at leastin part, of the greater activation in MSO neurons of voltage-dependent, low-threshold conductances around the restingmembrane potential (16). Most importantly, principal neuronsdisplayed a gradient in their resonant properties along the tono-topic dimension of the MSO and LSO (i.e., MSO to lateral LSO tomedial LSO; Fig. 2B). All MSO neurons recorded showed a reso-nance with peak frequencies ranging from 80 to 400 Hz (Fig.2C). Two of three recorded neurons in the LSO’s lateral (low-frequency) limb were resonant (Fig. 2B, Center, triangles inwhite region of LSO), whereas the four recorded neurons in themedial LSO had low-pass impedance profiles (Fig. 2B, trianglesin gray region). To demonstrate the generality of this phenome-non further, we evaluated the filtering properties of LSO neuronsin the rat, a species with less-well developed low-frequency
CF 800 Hz
Filtered sound wave
CF 4 kHz
CF 8 kHz Auditory nerve output
Cochlear filters
Time (s)
Fre
quen
cy (
kHz)
0 0.2 0.4 0.6 0.8 1 1.20
2
4
6
8
10
Sound wave
10 ms
A
AVCN
LSO MNTB
EI
EE
+
+ + +
-
B
MSO
2 m
m
Fig. 1. Peripheral processing of auditory stimuli. (A) Guinea pig vocalizationsound wave and its spectrogram (Left) and the frequency ranges of thespectrogram that are passed by cochlear filters with center frequencies (CFs)of 800 Hz (Bottom), 4 kHz (Middle), and 8 kHz (Top). (Right) Examples ofauditory nerve responses to 50-ms fragments of the sound wave; 10 real-izations of the spike output were produced by using the model from Zilanyet al. (66) for auditory nerves with CFs of 800 Hz (Bottom), 4 kHz (Middle),and 8 kHz (Top). (B) Horizontal section of the guinea pig brainstem witha schematic of the projections to the MSO and LSO (shown for one side of thebrainstem). The MSO receives bilateral excitatory input (i.e., EE input) fromthe anterior ventral cochlear nuclei (AVCN). The LSO nucleus receives ipsi-lateral excitatory input from the AVCN and contralateral inhibitory inputfrom the MNTB, which receives excitatory input from the contralateral AVCN(hence, LSO cells receive EI input). Note that the right-hand side of the slice isa reflected copy of the left-hand, recorded, side.
E2340 | www.pnas.org/cgi/doi/10.1073/pnas.1316216111 Remme et al.
Dow
nloa
ded
by g
uest
on
Dec
embe
r 29
, 202
1

hearing and a less well-defined MSO (17). Input resistances ofneurons in the lateral and medial/mediolateral limbs of the ratLSO were not significantly different (112 ± 17 MΩ with n = 7 vs.99 ± 15 MΩ with n = 10, respectively). Nevertheless, similar tothe guinea pig, most of the neurons (5 of 7) in the lateral LSOlimb were resonant, with peak frequencies ranging from 150 to360 Hz, whereas most of the neurons (8 of 10) in the medial andmediolateral limbs of the rat LSO were low pass. The close cor-respondence between the impedance profiles of MSO and LSOprincipal neurons and their presumed sound-frequency tuningsuggests that these filtering properties might play an important rolein the efficient coding of sound signals across the tonotopic axis.We also characterized MSO and LSO principal neurons
according to their firing properties by injecting suprathresholdcurrent steps through the recording electrode. Consistent withprevious reports (18, 19), MSO neurons responded with a singleaction potential at stimulus onset, i.e., a phasic firing pattern(Fig. 2B, Right), whereas the responses of LSO neurons weremore varied: in the lateral LSO limb, action potentials generallywere confined to stimulus onset (Fig. 2B, Lower Left), whereasthose in the medial LSO limb were characterized by a tonicfiring pattern (Fig. 2B, Upper Left).
Modeling Binaural Neurons.We used the filter properties recordedexperimentally to develop functional models of binaural neuronsto assess their ITD and ILD sensitivity to real-world acousticinputs. ZAP current responses of the 10 MSO cells and 7 LSOcells from the guinea pig were fitted with linear models de-scribing the subthreshold voltage dynamics. The three examplesin Fig. 3A illustrate the range of impedance profiles of models fitto data: a low-pass model from the medial LSO, a model with lowresonant frequency from the lateral LSO, and a model with a highresonant frequency from the MSO. None of the 17 cells could befit properly by a simple RC circuit (i.e., a resistance and a ca-pacitance in parallel); the model fits required one or two linearly
voltage-dependent ion currents: a resonant current and/or anamplifying current (Materials and Methods; ref. 13). The modelfits of the resonant neurons and of one low-pass neuron includeda resonant current (gw; Fig. 3B). The parameters of the fittedmodels suggest that with increasing resonance frequency, a reso-nant current increases in amplitude, whereas its activation timeconstant decreases down to ∼0.3 ms (τw; Fig. 3B). This restorativecurrent contributes strongly to the subthreshold membrane dy-namics and has a fast activation time constant, features shared bythe low-threshold potassium current (carried by Kv1.1 channels)that is prominent in principal MSO neurons (16, 18) and in asubpopulation of principal LSO neurons (19). The model fits ofall low-pass neurons and two of the resonant neurons included anamplifying current (gn; Fig. 3C) with an activation time constantbetween 0.6 and 1.8 ms (τn; Fig. 3C). Such a subthresholdamplifying current might reflect a (persistent) sodium current,a low-threshold calcium current, or an inward-rectifying potas-sium current (see refs. 20, 21).
Modeling ITD and ILD Sensitivity for Resonant and NonresonantBinaural Neurons. We characterized the influence of model neu-rons’ filtering properties on the sensitivity to ITD and ILD cuesconveyed in guinea pig vocalizations. By using a 5-s exemplar ofa guinea pig vocalization (Fig. 4A), auditory nerve model firingpatterns were generated for different frequency components foripsilateral and contralateral signals to produce synaptic inputsthat were then applied to modeled binaural neurons.We first assessed the responses of model neurons when only
the ITD cues were presented. Fig. 4B illustrates the activity ofauditory nerves, which provide the binaural excitatory (EE) syn-aptic input to the model neurons. Shown are responses of auditorynerves with center frequencies (CFs; sound frequency for whicha neuron has the lowest threshold for evoking action potentials) of800 Hz (Left) when there is phase-locking to the TFS, and withCFs of 8 kHz (Right) when auditory nerve activity is not synchronized
10 100 10000
40
80
Frequency (Hz)
Impe
danc
e (M
)
50 ms
30 mV
10 100 10000
40
80
Frequency (Hz)
Impe
danc
e (M
)
10 100 10000
20
40
Frequency (Hz)
Impe
danc
e (M
)
−500
50
I (pA
)−55
−53
−51
V (
mV
)200 ms 10 100 1000
0
20
40
Frequency (Hz)
Impe
danc
e (M
)
fres
10 100 1000Frequency (Hz)
Pow
er
0.1
1
0.1
1
Zres
RN
0 100 200 300 4001
1.5
2
2.5
3
Resonant frequency (Hz)
Q fa
ctor
guinea pig MSOguinea pig LSOrat LSO
Resonant frequency (Hz)0 100 200 300 400
high CF
LSOMSO
dorsal
low CF
high CF
low CF
low-pass
low-pass
fres = 83 Hz
fres = 230 Hz
A
B
CA A
Pow
erMSO
medial LSO
lateral LSO
cba
Fig. 2. Assessing intrinsic electrical properties of MSO/LSO neurons. (Aa–Ac) Illustration of the ZAP protocol applied to a guinea pig MSO cell: (Aa) inputcurrent and voltage response, (Ab) their respective power spectra, and (Ac) the impedance profile. Dashed lines in Ac indicate the peak resonant frequency(fres) at which impedance is maximal (Zres). The input resistance (RN) of this cell is indicated on the vertical axis. (B) Schematic of LSO and MSO nuclei with theapproximate locations of all the recorded cells in the guinea pig MSO and LSO nuclei (▲, △) and rat LSO nucleus (●), color-coded for peak resonant fre-quency. Black symbols denote nonresonant cells. The △s in the MSO nucleus denote cells for which the precise location within the MSO could not beestablished. The gray area in the LSO schematic distinguishes the medial and mediolateral limbs from the lateral limb. Shown are three examples of im-pedance profiles and related spike responses. (C) Q factor vs. peak resonant frequency of all resonant MSO and LSO cells. The Q factor is defined as the peakimpedance (Zres) divided by the input resistance (RN; see A).
Remme et al. PNAS | Published online May 19, 2014 | E2341
NEU
ROSC
IENCE
PNASPL
US
Dow
nloa
ded
by g
uest
on
Dec
embe
r 29
, 202
1

to the TFS. To model neuronal firing, two mechanisms forgenerating action potentials (“spikes”) were assessed. Spikeswere evoked either by crossings of a voltage threshold (v) or bya sufficiently fast rise in the membrane voltage over time (a slopethreshold, dv/dt). Note that this slope threshold was an idealizationof a mechanism underlying the phasic firing we observed in MSOneurons (and some of the LSO neurons) and also has been reportedin other neurons of the auditory brainstem (22, 23). The voltage (orslope) threshold for spike generation was set such that the variationof the output rate of the model neuron was maximized (Fig. 4C).Model neurons were assumed to be maximally responsive whenthe ITD was equivalent to the maximum ITD reported for theguinea pig, i.e., leading by 330 μs relative to the opposite ear(24). The ITD-dependent firing rate was assessed over a 1-msrange, encompassing the maximum range of ITDs over whicha neuron’s response might vary (i.e., from 330 μs leading at theipsilateral ear to 330 μs leading at the contralateral ear). Fig.4D compares response variations produced by either slope orvoltage threshold. Consistent with previous reports (25), spikegeneration initiated by a fast rise in voltage elicits greatervariations in the response to ITD than does the magnitude ofthe voltage per se.ITD sensitivity was assessed for three models (Fig. 3A)—“fast”
resonant (MSO), “slow” resonant (lateral LSO), and “low-pass”
(medial LSO)—across the frequency range encompassed by theexemplar vocalization (Fig. 4A). The fast resonant model alwaysperforms better than the slow resonant or low-pass model withrespect to variation of the spike rate with ITD (Fig. 4 E and F).Note that the variation of these sensitivities with CF reflects thewavelength of sound components passing through the filter band,as well as head size (obviously, where signal energy is low orabsent there also is little variation in the response). ITD sensi-tivity shows two clear maxima over different frequency ranges(Fig. 4E). The first maximum is explained by considering thatITD sensitivity is cyclic on the period of a pure tone stimulus (orquasiperiodic for broadband sounds; Fig. 4D). Therefore, vari-ation of spike rates over a fixed range of ITDs (here, 0 vs. 660 μs)is necessarily frequency dependent and thus is lower for lowersound frequencies (here, <300 Hz). In fact, signal power at 100 Hzand 500 Hz is roughly equal in the exemplar stimulus (Fig. 4A,Lower), but ITD sensitivity is much greater at the higher frequency.With increasing CF of the auditory nerves, and particularly wherephase-locking of monaural inputs to the TFS remains high (500–1,000 Hz), ITD sensitivity is high. At still-higher sound frequencies,however, at which phase-locking to the TFS begins to decline, ITDsensitivity also declines whereupon, above ∼2 kHz, it again startsincreasing (particularly over the frequency range 5–8 kHz), but thistime associated with ITDs conveyed in the sound envelope. Becausethe cochlear filters broaden with increasing CF (Fig. 1A), the rangeof possible amplitude modulation frequencies also increases withCF, allowing for increased (envelope) ITD sensitivity. This isanalogous to the increase in ITD sensitivity to the TFS in the CFrange up to 800 Hz. Note, however, because of the low-pass char-acteristics of the envelope spectrum within high-frequency auditorychannels (a product of the filter bandwidths and 1/f characteristicsof the envelope power spectrum; Fig. 5 B and C), envelope ITDsensitivity never approaches that observed for the TFS, even for thefastest resonance model, and declines steadily above 8 kHz.Model responses also were assessed for the ILD cue alone
(Fig. 4 G–I). In this case, synaptic stimuli were applied to theneural models by means of ipsilateral excitatory input and con-tralateral inhibitory input (EI) that mimics LSO connectivity (Fig.1B), yielding model output that is maximal for stimuli from theipsilateral side (negative ILD, Fig. 4G). Fig. 4H illustrates thatthere is little ILD-dependent change in spike rate at low CF;there is little head shadow generated at these frequencies in theguinea pig and, therefore, little ILD (see the idealized relation-ship between ILD and sound frequency in Fig. 4G, Inset). Withincreasing CF, however, the magnitude of the ILD increases asdoes, concomitantly, the ILD-dependent variation in spike rate.Note, however, that in contrast to ITD, ILD sensitivity is greatestfor model neurons incorporating low-pass electrical character-istics (medial LSO model, Fig. 4H and I) combined with a spikingmechanism using a voltage threshold. Note, too, that the fre-quency range over which the maximum ILD-dependent variationin spike rate occurs does not correspond to any particular peak inthe vocalization spectrum (compare Fig. 4H with Fig. 4A).
Contribution of Resonance Properties to Listening in Noise.A criticalfeature of spatial listening is the ability to hear out sounds againstbackground noise (e.g., competing sources, environmental sounds,or reflections from hard surfaces). Typically, the power of be-haviorally relevant signals decreases with increasing frequency(Insets in Fig. 5 E and H), whereas interfering noise often showsa broader power spectrum (11), resulting in unfavorable SNRswith increasing frequency. To this end, we assessed the ability ofmodel neurons to extract spatial cues at different SNRs when bothITD and ILD cues potentially are available (Fig. 5 A, D, and G),considering the 800-Hz and 8-kHz centered energy band as above,as well as an additional, intermediate band centered on 4 kHz.This intermediate band is of special interest because neurons inthe LSO encode ITDs both in the TFS and in the envelope by
0 100 200 300 4000
2
4
6
8
w (
ms)
0 100 200 300 4000
10
20
30
g n (
nS)
0 100 200 300 4000
0.5
1
1.5
2
n (m
s)
Resonant frequency (Hz)
AIm
peda
nce
(M)
10 100 10000
50
100
150medial LSO
low-pass
B
0 100 200 300 4000
15
30
45
g w (
nS)
10 100 10000
20
40
60
lateral LSO
fres = 83 Hz10 100 10000
10
20
30
40
Frequency (Hz)
MSO
fres = 260 Hz
Resonant frequency (Hz)
C
Frequency (Hz) Frequency (Hz)
MSOlateral LSOmedial LSO
A Aa b c
Fig. 3. Linear models predict membrane properties that underlie sub-threshold response of MSO and LSO cells. (Aa–Ac) Examples of model fits toprincipal cells from the guinea pig MSO and LSO: (Aa) a low-pass filter fromthe medial LSO, (Ab) a model with low resonant frequency from the lateralLSO, and (Ac) a model with high resonant frequency from the MSO. The ●sgive the experimentally determined impedance profiles, and solid curvesgive the model fits. (B) Magnitude (gw in nanosiemens; Upper) and activa-tion time constant (τw in milliseconds; Lower) of the resonant current(Materials and Methods) of the cell models, plotted as a function of resonantfrequency (low-pass models are plotted at fres = 0 Hz). All 12 resonantmodels and one of the five low-pass models included a resonant current.Arrows indicate models from A. (C) Magnitude (gn; Upper) and activationtime constant (τn; Lower) of the amplifying current plotted as a function ofresonant frequency. All five low-pass models and two of the 12 resonantmodels contained an amplifying current. Arrows indicate models from A.
E2342 | www.pnas.org/cgi/doi/10.1073/pnas.1316216111 Remme et al.
Dow
nloa
ded
by g
uest
on
Dec
embe
r 29
, 202
1

virtue of their EI inputs (26, 27), suggesting the capacity of theseneurons to compute ILD or ITD (or both) for frequencies abovea few kilohertz, at which both binaural cues potentially are avail-able. Once more, we assessed the extent to which the two maincategories of binaural integration (EE and EI) and spike gener-ation mechanisms (slope and voltage threshold) operate withrespect to the three models: fast resonance, slow resonance, andlow-pass. Note that we did not include in our model the addi-tional, fast-acting glycinergic inhibitory input posited as con-tributing to the ITD sensitivity of low-frequency neurons classedas EE in their response type (28, 29), as its biophysical prop-erties remain to be determined.In general, model neurons with exclusively EE inputs (Fig. 5 B,
E, and H) perform best (i.e., the variation in response rate ishighest) when they incorporate fast resonance (red curves) andwhen spike generation is initiated by a slope threshold (triangles
indicate performance with the voltage threshold at +30 dB SNR).Note that the form of the spike generator clearly contributes tothe modulation of the neural response. Overall, its contribution(Fig. 5 B, E, and H; differences between triangles and corre-sponding circles at +30 dB SNR) is of a magnitude similar to thecontribution of the subthreshold membrane properties (the dif-ference between triangles or between circles at +30 dB SNR).The extent to which models with fast resonances outperform theother models—evident at high SNRs—is frequency dependent,being most obvious at 800 Hz (Fig. 5B), less so at 4 kHz (Fig. 5E),and largely absent at 8 kHz (Fig. 5H). Note that at 800 Hz,performance is dominated by sensitivity to ITDs conveyed in theTFS and that ITD sensitivity extends down to negative SNRs forall models. This result is consistent with previous studies showingthat low-frequency neurons in the guinea pig midbrain encodeITD information at negative SNRs (30). At 4 kHz, model
Time (s)F
requ
ency
(kH
z)0 1 2 3 4 5
0
5
10
15
20
Sound wave
Frequency (Hz)
ACF 800 Hz
Sou
nd w
ave
(filt
ered
)A
N o
utpu
tip
sico
ntra
Time (s)
Syn
aptic
inpu
t cur
rent
Time (s)
CF 8 kHzB
100 1000 10000
Pow
er (
dB)
−30
−20
−10
0
slope threshold
CF (Hz)
ITD
sen
sitiv
ity (
sp/s
)
E
ILD
sen
sitiv
ity (
sp/s
)
H
100 1000 10000
voltage threshold
CF (Hz)100 1000 10000
0
200
400
Mea
n fir
ing
rate
(sp
/s)
0 10 20 300
50
100
V threshold above rest (mV)
ITD
-mod
ulat
edfir
ing
rate
(sp
/s)
ITD = 0 ms
ITD = 0.66 ms
C
100 1000 1000005
1015
Frequency (Hz)
ILD
(dB
)
CF 8 kHz; EI input
phys.range
CF 800 Hz; EE input
voltage threshold
slope threshold
2 x phys. range
ITD (ms)
Mea
n fir
ing
rate
(sp
/s)
ILD (dB)
Mea
n fir
ing
rate
(sp
/s)
D
G
0
50
100
150
200
−20 −10 0 10 20
0 0.2 0.4 0.6 0.8 10
50
100
150
200
1.29 1.31 1.331.05 1.07 1.09
voltage thresholdCF = 8 kHz
slope threshold
MSO
CF = 800 Hz
lateral LSO
0 100 200 300 400Resonant frequency (Hz)
ILD
sen
sitiv
ity (
sp/s
)
Resonant frequency (Hz)
ITD
sen
sitiv
ity (
sp/s
)
medial LSO
F
I
0 100 200 300 400
100
110
120
130
140
150
100
110
120
130
140
150
0
25
50
75
100
125
150
0
25
50
75
100
125
150
MSOlateral LSOmedial LSO
Fig. 4. Sensitivity of model neurons to binaural spatial cues. (A) Five-second exemplar of guinea pig vocalization—sound wave (Top), spectrogram (Middle),and power spectra (Bottom) of the exemplar (black) and average of 1,000 conspecific vocalizations (red). (B) Synaptic inputs to model neurons were derivedfrom the exemplar vocalization. (Top) Fifty-millisecond sound wave fragments band-pass filtered at 800 Hz and 8 kHz. (Middle) Modeled auditory nerve (AN)fiber responses (see ref. 66) activate six ipsi- and six contralateral inputs to MSO/LSO models. (Bottom) Summed synaptic currents when all 12 inputs areexcitatory (EE input). (C) Spike output of model cells results from voltage (or voltage slope) threshold crossings. Threshold was chosen such that the outputrate modulation was maximized (Materials and Methods). (Upper) Output rate of the MSO model from Fig. 3A as a function of voltage threshold for ITD = 0or 0.66 ms (i.e., ± physiological range of 0.33 ms). (Lower) Difference between the ITD curves shows voltage threshold (○) generating maximum ITD-modulatedfiring rate. (D) Modulation of firing rate with ITD over the range 0–1 ms for a fast resonant model (MSOmodel in Fig. 3A) using a slope threshold (○) or voltagethreshold (●). AN input as in C. (E) Modulation of firing rate (ITD sensitivity) over ± physiological range (see D) as a function of CF of AN fibers using the 5-sexemplar vocalization from A. The fast resonant MSO model (red), slow resonant lateral LSO model (cyan), and low-pass medial LSO model (dark blue) are as inFig. 3A. AN fibers provide EE input, and cell models use a slope threshold. Data points plot an average of 60 trials, with error bars indicating SE (largely hiddenby symbols). (F) ITD sensitivity as a function of peak resonant frequency of all 17 cell models. AN fibers have CF = 800 Hz and provide EE input. Models usea slope threshold. Arrows indicate the three models used in E. Error bars show SE for the 60 trials. (G) Modulation of firing rate with ILD (without ITD cues) fora low-pass model (medial LSO model from Fig. 3A) for slope threshold (○) or voltage threshold (●) spike mechanisms. AN fibers have a CF of 8 kHz and provideexcitatory ipsilateral input and inhibitory contralateral (EI) input. (Inset) Maximum ILD as a function of sound frequency for the guinea pig (idealization of datain ref. 24). (H) Modulation of firing rate (ILD sensitivity) as a function of the CF of the AN fibers using the 5-s exemplar vocalization from A for the same threemodels as in E. AN fibers provide EI input, and cell models use a voltage threshold. Data points show the average of 60 trials, with error bars indicating SE(largely hidden by symbols). (I) ILD sensitivity as a function of peak resonant frequency of all 17 cell models. AN fibers have CF = 8 kHz and provide EI input.Models use a voltage threshold. Arrows indicate the three models used in H. Error bars show SE for the 60 trials.
Remme et al. PNAS | Published online May 19, 2014 | E2343
NEU
ROSC
IENCE
PNASPL
US
Dow
nloa
ded
by g
uest
on
Dec
embe
r 29
, 202
1

performance is dominated by the (envelope) ITD cue, and al-though the fast resonance model once again performs best, nomodel demonstrates variation of the response rate at negativeSNRs. At 8 kHz, response rate variation is virtually indistin-guishable among the three models for exclusively excitatoryinputs and is evident only at relatively high, positive SNRs.Conversely, model neurons with EI properties (Fig. 5 C, F, and I)
perform best when comprising low-pass electrical properties (darkblue curves) and spikes are initiated by crossing a voltage threshold(triangles indicate performance with the slope threshold at +30 dBSNR). The relatively poor sensitivity at 800 Hz (Fig. 5C) reflects thelack of ILD cues at this frequency (at least for far-field sources;Discussion), but EI models at both 4 kHz (Fig. 5F) and 8 kHz (Fig.5I) demonstrate a preference for low-pass electrical characteristics;response rate variation always is greatest for the low-pass model.Nevertheless, performance never achieves that observed at 800 Hzfor the EE model at any frequency in that response variation isrestricted to positive SNRs. This lack of performance at negativeSNRs is consistent with behavioral observations of the relativelylimited access to temporal information conveyed in the envelopesof high-frequency sounds and the difficulties associated with lis-tening in noisy or reverberant environments when access to low-frequency TFS is limited (31). Importantly, for the 4-kHz band,there appears to be some benefit from implementing both forms
of model neuron—EE with fast resonance and EI with low-passelectrical characteristics—with regard to rate modulation.
DiscussionWe have demonstrated a postsynaptic specialization in electricalresonant properties of auditory brainstem neurons that variesacross the tonotopic axis (Fig. 2). Using biophysically inspiredbinaural neuron models (Fig. 3), we show that these electricalproperties contribute to a transition in the coding of temporalinformation from one emphasizing information conveyed in thefast TFS to one emphasizing information conveyed in the more-slowly changing temporal envelope (Fig. 4). The effect of thischange in coding strategy is maintained in the presence of back-ground noise (Fig. 5). Together, the data highlight the efficientcoding capacity of brainstem binaural neurons, which appear to beoptimized for encoding the statistics of low- and high-frequencycomponents of natural sounds.
Biophysics of Resonance and Effect on Discharge Patterns. Mem-brane potential resonance has been reported for many neuronalsystems (13). In the auditory system, for example, electrical res-onance (up to several hundred hertz) underlies hair cell tuning inthe turtle cochlea (32). In the mammalian brain, resonancescommonly are reported in the range 2–12 Hz and appear to be
CF = 4 kHz
CF = 800 Hz
CF = 8 kHz
ipsilateral
contralateral
ipsilateral
contralateral
ipsilateral
contralateral
200 ms
Signal
NoiseA
D
G
Filtered sound wave
Rat
e m
odul
atio
n (s
pike
s/s)
Rat
e m
odul
atio
n (s
pike
s/s)
Rat
e m
odul
atio
n (s
pike
s/s)
1 10 100
0
20
AM freq. (Hz)
Pow
er (
dB)
EE inputslope threshold
SNR (dB)
1 10 100
0
20
AM freq. (Hz)
Pow
er (
dB)
MSO
lateral LSO
medial LSO
SNR (dB)
SNR (dB)0
0
100
00
10
20
40
00
100
EI inputvoltage threshold
SNR (dB)
SNR (dB)
SNR (dB)0
0
100
00
100
00
10
20
40
B
E
H
C
F
I
Fig. 5. Sensitivity to combined ITD and ILD cues at low, middle, and high frequencies in a noisy environment. (A–I) Gaussian white noise is added to the 5-sexemplar guinea pig vocalization (see Fig. 4A) such that the SNR varies from −30 to 45 dB within the frequency bands around 800 Hz (A–C; 700–900 Hz), 4 kHz(D–F; 3.5–4.5 kHz), and 8 kHz (G–I; 7–9 kHz). Firing rate modulation of a fast resonant (MSO, red), a slow resonant (lateral LSO, cyan), and a low-pass model(medial LSO, dark blue) was determined for the vocalization stimulus coming from the ipsilateral side and compared with that coming from the contralateralside. ITD differs by twice the physiological range (±0.33 ms) with the peak of the ITD response function at the ipsilateral side. ILD varies with frequencyaccording to Fig. 4G, Inset. The noise is uncorrelated for the two ears and does not provide ILD (or ITD) cues. (A, D, and G) For all three frequencies, theipsilateral and contralateral cochlear filter output is shown for a 500-ms fragment of the vocalization signal (black) and the noise (red) for SNR = 0 dB, wherethe vocalization signal is presented at the ipsilateral side. (B, C, E, F, H, and I) Firing rate modulation is plotted as a function of the SNR when the three modelsreceive EE input (B, E, and H) or EI input (C, F, and I). Firing rate output is determined by a slope threshold (B, E, and H) or by a voltage threshold (C, F, and I).For comparison, the modulation of the firing rate with the alternate threshold mechanism is indicated at +30 dB SNR by ▲s. (E and H, Insets) Amplitudemodulation spectrum of the vocalization in the 4-kHz band (E) and 8-kHz band (H). Error bars denote SE for 60 trials.
E2344 | www.pnas.org/cgi/doi/10.1073/pnas.1316216111 Remme et al.
Dow
nloa
ded
by g
uest
on
Dec
embe
r 29
, 202
1

related to the generation or maintenance of oscillatory brainwaves (e.g., in the hippocampus; ref. 33). Intrinsic low-pass andresonance properties (up to 40 Hz resonances) are evident in thesubthreshold responses of vestibular neurons (34), and analogousto our findings, these covary with spiking patterns (phasic ortonic). Therefore, it is unusual, but perhaps not surprising in thecontext of brain nuclei dedicated to fast, submillisecond tem-poral coding, to observe resonance frequencies up to severalhundred hertz.Although a range of membrane conductances in principal cells
of the MSO and LSO potentially contribute to the appearance ofresonances, the most likely contender for the high resonantfrequencies reported in the present study is the low-voltage ac-tivated potassium channel, particularly Kv1.1. This channel ishighly expressed in adult principal cells in the MSO (35, 36), anda tonotopic gradient in the expression of this channel existsacross the LSO, decreasing from the lateral to the medial limb(19). The Kv1.1 channel has the characteristics required to pro-duce resonances at high frequencies (>80 Hz) with a large volt-age-dependent contribution to the membrane conductance nearresting potential and an activation time constant of ∼1 ms (35).Note that the hyperpolarization-activated current (Ih), which isresponsible for resonances in many neurons in the central ner-vous system, also is highly expressed in principal MSO and LSOcells (37, 38). However, its slow activation kinetics (∼100 ms),which would support resonances only at relatively low frequencies(∼10 Hz), means that it cannot account for the high resonantfrequencies we report in this study, although Ih may help maintainan operating voltage range so that resonance is preserved (39).Concomitant with the gradient in Kv1.1 expression reported in
LSO in vitro (19), neural firing patterns in the lateral limb tendto respond to injected current steps only at stimulus onset,whereas those in the medial limb respond with a more sustainedfiring pattern. As onset-firing patterns may be transformed intosustained patterns by blocking the Kv1.1 channel (19), theyclearly play an important role in modulating the neural codingstrategy in the binaural brainstem nuclei. It is not yet clear,however, exactly how these subthreshold and spiking responsesin vitro relate to discharge patterns recorded in vivo. Responsesin extracellularly recorded neurons in the LSO typically are char-acterized as showing a “chopper” response, with regularly spacedpeaks of activity following stimulus onset (40, 41). A recent mod-eling study speculated that Kv1.1 channels might play a role inshaping the dynamics of this chopper activity through its effect onthe spike afterhyperpolarization (42). Further modeling work (43)demonstrated that the band-pass filtering by cells with Kv1.1channels might account for the reduction in firing rate seen in manyLSO cell responses to amplitude-modulated tones (presented to theipsilateral ear) as the modulation rate is increased above a fewhundred hertz (44). Note that other factors also might play a role inreducing firing rates (e.g., inhibitory input from MNTB). Mostimportantly, a recent in vivo study in unanesthetized cats demon-strated that about a third of LSO neurons did not exhibit chopperresponses (45) and suggested that these neurons might be locatedprimarily in the lateral LSO—the region where Kv1.1 is expressedmost strongly (19). By means of a mathematical model, theseauthors demonstrated that all types of LSO responses could bereproduced from a modeled chopper cell, depending on thelevel and latency of ipsilateral inhibition it received. This expla-nation does not consider, however, whether the different mem-brane properties of LSO neurons (band-pass vs. low-pass; phasicvs. sustained firing) contribute to the type of discharge patternobserved. Further in vivo experiments might clarify the relation-ship between Kv1.1 and responses in LSO—for example, throughthe application of a Kv1.1 blocker such as dendrotoxin.
Resonance and Auditory Spatial Coding. Fast, electrically resonantneurons operating over the low-frequency range would enable
the assessment of rapid fluctuations in the TFS at each eargenerated by source (or head) movements, as well as changes inthe interaural coherence of the sound at each ear resulting fromacoustic reflections, reverberation, and the interference patternsgenerated by multiple, simultaneous sound sources. Sensitivity toall these interaural acoustic features is critical to spatial listeningin terms of the identification and localization of sources and indetermining features of the source. Conversely, the extent towhich ILD cues might be exploited for purposes of sound lo-calization is limited by the size and shape of the head (includingthe pinnae), at least for sources distant from the listener; ILDsincrease as the wavelength of sound decreases (frequency increas-es) and sufficient head shadow is cast (note, however, that near-field sources also can generate significant ILDs at lower soundfrequencies, particularly through interaction with the pinnae, al-though their role in localization per se remains to be determined;refs. 46–49). Because signal energy falls with increasing sound ormodulation frequency (in accordance with the “1/f rule”), soundlevel and temporal information likely becomes increasingly spuri-ous with increasing sound frequency. Low-pass electrical propertiesprovide for longer temporal integration, improving the accuracywith which level information is assessed. It is worth noting in thisregard that thresholds for sound level fall as a function of soundduration and are similar in magnitude to those for ILD. Thus, thepredominance of low-pass response characteristics in the high-fre-quency limb of the LSO favors energy integration over time, pre-sumably to better characterize natural sounds or stimulus features,including at unfavorable SNRs. The data also provide an explana-tion as to why sensitivity to temporal information in the envelopedomain is not robust to interference by background noise (31). Theincreasingly integrative nature of neurons along the tonotopic axisin response to real-world sounds (here, vocalizations) demonstratesthat the concept of efficiency is at play—as the SNR declines withincreasing sound frequency, neural performance is enhanced byintegrating input over time (neurons showing lower resonance orlow-pass electrical behavior) to maximize information. Further,there is some indication that envelope ITDs might be more poorlyencoded with increasing CF (ref. 3; although see ref. 50, which callsthis into question). Irrespective of the precise limits to performance,however, ITD sensitivity in the high-frequency, envelope domainis relatively restricted compared with that in the low-frequency(<1,500 Hz) domain, and even where it is comparable in conditionsof quiet, it is considerably degraded in the presence of interferingsignals (51).It is noteworthy that both resonant and nonresonant neural
filters were recorded in the LSO, a structure traditionally consid-ered important for coding ILD and therefore presumably favoringlow-pass filtering. Nevertheless, physiological evidence also indi-cates that LSO neurons encode ITDs in both low- and high-fre-quency sounds through EI interactions (26, 27, 52), and the twoclasses of impedance profiles—resonant and nonresonant—mightpotentially correspond to the neurons encoding ITDs and ILDs,respectively. Regardless of their correspondence, however, theexistence of two forms of binaural integration, potentially overthe same sound-frequency range, makes sense from a codingperspective. ILDs increase with increasing sound frequency andtherefore likely represent the more salient spatial cue at in-creasingly higher frequencies. However, for many small mam-mals, the ability to exploit ILDs will be severely limited by thesize of their head. Even for species such as the guinea pig, withgood low-frequency hearing (14) and the ability to encode fine-structure ITDs (15), peripheral sensitivity to the TFS will havedeclined (with increasing sound frequency; ref. 5) well beforeany appreciable ILD cue is present, at least for far-field sources.For the rat, with relatively poor low-frequency hearing (53) com-pared with the guinea pig, appreciable ILDs may be available onlyat relatively high frequencies (maximum ILDs are less than 10 dBbelow 8 kHz; see ref. 49). However, by combining both cues
Remme et al. PNAS | Published online May 19, 2014 | E2345
NEU
ROSC
IENCE
PNASPL
US
Dow
nloa
ded
by g
uest
on
Dec
embe
r 29
, 202
1
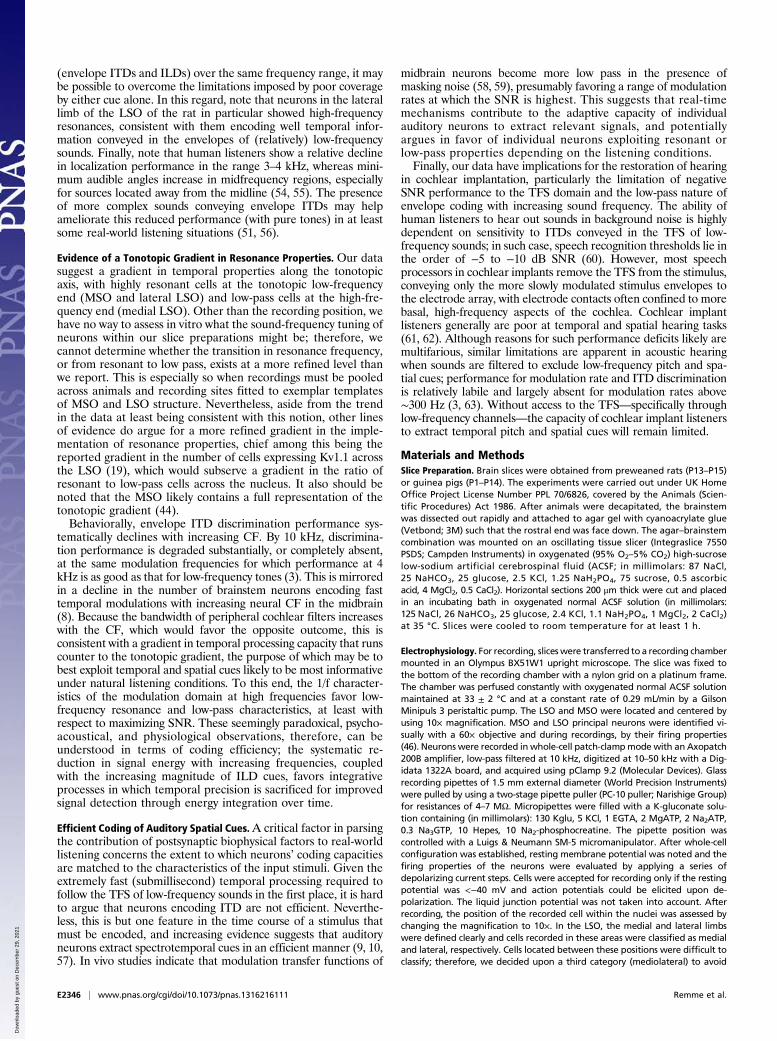
(envelope ITDs and ILDs) over the same frequency range, it maybe possible to overcome the limitations imposed by poor coverageby either cue alone. In this regard, note that neurons in the laterallimb of the LSO of the rat in particular showed high-frequencyresonances, consistent with them encoding well temporal infor-mation conveyed in the envelopes of (relatively) low-frequencysounds. Finally, note that human listeners show a relative declinein localization performance in the range 3–4 kHz, whereas mini-mum audible angles increase in midfrequency regions, especiallyfor sources located away from the midline (54, 55). The presenceof more complex sounds conveying envelope ITDs may helpameliorate this reduced performance (with pure tones) in at leastsome real-world listening situations (51, 56).
Evidence of a Tonotopic Gradient in Resonance Properties. Our datasuggest a gradient in temporal properties along the tonotopicaxis, with highly resonant cells at the tonotopic low-frequencyend (MSO and lateral LSO) and low-pass cells at the high-fre-quency end (medial LSO). Other than the recording position, wehave no way to assess in vitro what the sound-frequency tuning ofneurons within our slice preparations might be; therefore, wecannot determine whether the transition in resonance frequency,or from resonant to low pass, exists at a more refined level thanwe report. This is especially so when recordings must be pooledacross animals and recording sites fitted to exemplar templatesof MSO and LSO structure. Nevertheless, aside from the trendin the data at least being consistent with this notion, other linesof evidence do argue for a more refined gradient in the imple-mentation of resonance properties, chief among this being thereported gradient in the number of cells expressing Kv1.1 acrossthe LSO (19), which would subserve a gradient in the ratio ofresonant to low-pass cells across the nucleus. It also should benoted that the MSO likely contains a full representation of thetonotopic gradient (44).Behaviorally, envelope ITD discrimination performance sys-
tematically declines with increasing CF. By 10 kHz, discrimina-tion performance is degraded substantially, or completely absent,at the same modulation frequencies for which performance at 4kHz is as good as that for low-frequency tones (3). This is mirroredin a decline in the number of brainstem neurons encoding fasttemporal modulations with increasing neural CF in the midbrain(8). Because the bandwidth of peripheral cochlear filters increaseswith the CF, which would favor the opposite outcome, this isconsistent with a gradient in temporal processing capacity that runscounter to the tonotopic gradient, the purpose of which may be tobest exploit temporal and spatial cues likely to be most informativeunder natural listening conditions. To this end, the 1/f character-istics of the modulation domain at high frequencies favor low-frequency resonance and low-pass characteristics, at least withrespect to maximizing SNR. These seemingly paradoxical, psycho-acoustical, and physiological observations, therefore, can beunderstood in terms of coding efficiency; the systematic re-duction in signal energy with increasing frequencies, coupledwith the increasing magnitude of ILD cues, favors integrativeprocesses in which temporal precision is sacrificed for improvedsignal detection through energy integration over time.
Efficient Coding of Auditory Spatial Cues.A critical factor in parsingthe contribution of postsynaptic biophysical factors to real-worldlistening concerns the extent to which neurons’ coding capacitiesare matched to the characteristics of the input stimuli. Given theextremely fast (submillisecond) temporal processing required tofollow the TFS of low-frequency sounds in the first place, it is hardto argue that neurons encoding ITD are not efficient. Neverthe-less, this is but one feature in the time course of a stimulus thatmust be encoded, and increasing evidence suggests that auditoryneurons extract spectrotemporal cues in an efficient manner (9, 10,57). In vivo studies indicate that modulation transfer functions of
midbrain neurons become more low pass in the presence ofmasking noise (58, 59), presumably favoring a range of modulationrates at which the SNR is highest. This suggests that real-timemechanisms contribute to the adaptive capacity of individualauditory neurons to extract relevant signals, and potentiallyargues in favor of individual neurons exploiting resonant orlow-pass properties depending on the listening conditions.Finally, our data have implications for the restoration of hearing
in cochlear implantation, particularly the limitation of negativeSNR performance to the TFS domain and the low-pass nature ofenvelope coding with increasing sound frequency. The ability ofhuman listeners to hear out sounds in background noise is highlydependent on sensitivity to ITDs conveyed in the TFS of low-frequency sounds; in such case, speech recognition thresholds lie inthe order of −5 to −10 dB SNR (60). However, most speechprocessors in cochlear implants remove the TFS from the stimulus,conveying only the more slowly modulated stimulus envelopes tothe electrode array, with electrode contacts often confined to morebasal, high-frequency aspects of the cochlea. Cochlear implantlisteners generally are poor at temporal and spatial hearing tasks(61, 62). Although reasons for such performance deficits likely aremultifarious, similar limitations are apparent in acoustic hearingwhen sounds are filtered to exclude low-frequency pitch and spa-tial cues; performance for modulation rate and ITD discriminationis relatively labile and largely absent for modulation rates above∼300 Hz (3, 63). Without access to the TFS—specifically throughlow-frequency channels—the capacity of cochlear implant listenersto extract temporal pitch and spatial cues will remain limited.
Materials and MethodsSlice Preparation. Brain slices were obtained from preweaned rats (P13–P15)or guinea pigs (P1–P14). The experiments were carried out under UK HomeOffice Project License Number PPL 70/6826, covered by the Animals (Scien-tific Procedures) Act 1986. After animals were decapitated, the brainstemwas dissected out rapidly and attached to agar gel with cyanoacrylate glue(Vetbond; 3M) such that the rostral end was face down. The agar–brainstemcombination was mounted on an oscillating tissue slicer (Integraslice 7550PSDS; Campden Instruments) in oxygenated (95% O2–5% CO2) high-sucroselow-sodium artificial cerebrospinal fluid (ACSF; in millimolars: 87 NaCl,25 NaHCO3, 25 glucose, 2.5 KCl, 1.25 NaH2PO4, 75 sucrose, 0.5 ascorbicacid, 4 MgCl2, 0.5 CaCl2). Horizontal sections 200 μm thick were cut and placedin an incubating bath in oxygenated normal ACSF solution (in millimolars:125 NaCl, 26 NaHCO3, 25 glucose, 2.4 KCl, 1.1 NaH2PO4, 1 MgCl2, 2 CaCl2)at 35 °C. Slices were cooled to room temperature for at least 1 h.
Electrophysiology. For recording, sliceswere transferred to a recording chambermounted in an Olympus BX51W1 upright microscope. The slice was fixed tothe bottom of the recording chamber with a nylon grid on a platinum frame.The chamber was perfused constantly with oxygenated normal ACSF solutionmaintained at 33 ± 2 °C and at a constant rate of 0.29 mL/min by a GilsonMinipuls 3 peristaltic pump. The LSO and MSO were located and centered byusing 10× magnification. MSO and LSO principal neurons were identified vi-sually with a 60× objective and during recordings, by their firing properties(46). Neurons were recorded in whole-cell patch-clampmode with an Axopatch200B amplifier, low-pass filtered at 10 kHz, digitized at 10–50 kHz with a Dig-idata 1322A board, and acquired using pClamp 9.2 (Molecular Devices). Glassrecording pipettes of 1.5 mm external diameter (World Precision Instruments)were pulled by using a two-stage pipette puller (PC-10 puller; Narishige Group)for resistances of 4–7 MΩ. Micropipettes were filled with a K-gluconate solu-tion containing (in millimolars): 130 Kglu, 5 KCl, 1 EGTA, 2 MgATP, 2 Na2ATP,0.3 Na3GTP, 10 Hepes, 10 Na2-phosphocreatine. The pipette position wascontrolled with a Luigs & Neumann SM-5 micromanipulator. After whole-cellconfiguration was established, resting membrane potential was noted and thefiring properties of the neurons were evaluated by applying a series ofdepolarizing current steps. Cells were accepted for recording only if the restingpotential was <−40 mV and action potentials could be elicited upon de-polarization. The liquid junction potential was not taken into account. Afterrecording, the position of the recorded cell within the nuclei was assessed bychanging the magnification to 10×. In the LSO, the medial and lateral limbswere defined clearly and cells recorded in these areas were classified as medialand lateral, respectively. Cells located between these positions were difficult toclassify; therefore, we decided upon a third category (mediolateral) to avoid
E2346 | www.pnas.org/cgi/doi/10.1073/pnas.1316216111 Remme et al.
Dow
nloa
ded
by g
uest
on
Dec
embe
r 29
, 202
1

introducing extra variability in the other two categories when studying ana-tomical variations of physiological properties.
ZAP Current Generation and Results Analysis. ZAP current protocols werecreated with MATLAB. The principal ZAP current protocol used was a sweepfrom 1 to 1,000 Hz over 0.96 s at a linear rate of increase. Each protocolcomprised 10 sweeps at 0.04-s intervals. MATLAB files were exported topClamp 9 via Excel 2007. ZAP amplitudes were adjusted in pClamp by usingthe “scale factor” setting to achieve peak membrane potential responseamplitudes of ∼5 mV from holding in each cell. The ZAP stimulus and themembrane potential response to the ZAP were subject to a fast Fouriertransform (FFT) performed by Clampfit 9 to reveal their respective powerspectra with respect to frequency, averaged for the 10 sweeps. Impedanceprofiles were calculated by dividing the voltage FFT by the current FFT, andthe resulting impedance values were plotted as a function of their corre-sponding frequencies by using GraphPad Prism 5. Q factor was calculated bydividing the value of the impedance at the resonant frequency by the valueof a neuron’s input resistance (see ref. 64).
Model Fitting and Simulations. Neural models were constructed using theguinea pig experimental data. ZAP current responses of the 10 MSO cells and7 LSO cells were fitted with a linear membrane-voltagemodel (see ref. 12). Tocapture the filtering properties of recorded cells, model fits required notonly a capacitive current and a leak current, but also one or two dynamic ioncurrents: a resonant current and/or an amplifying current (13). Resonantcurrents function as a negative feedback, counteracting changes in mem-brane potential, whereas amplifying currents act as a positive feedback,boosting any deviation from the holding potential. The linear modeldescribes the membrane voltage v (in millivolts; note that for convenience,we define the holding potential as 0 mV) and the two types of dynamicmembrane currents, and is given by the following system of linear ordinarydifferential equations:
cdvdt
=−gM v −gw ww +gn wn + IappðtÞ
τwdww
dt= v −ww
τndwn
dt= v −wn
with capacitance c (in picofarads) and total membrane conductance gM (innanosiemens). The dynamics of the resonant and amplifying currents withconductance gw and gn, respectively (in nanosiemens), are affected by thevariables ww and wn (in millivolts) with associated time constants τw and τn,respectively (in milliseconds). The filtering of the applied current Iapp (inpicoamperes) that this system implements can be described by thecomplex impedance Z(ω) with radial frequency ω. An expression for Z(ω)can be obtained from the above system of equations by taking its Fouriertransform:
~ZðωÞ=�iωc+gM +
gw
1+ iωτw−
gn
1+ iωτn
�−1
,
where i is the imaginary unit. Note that input resistance is given by RN = Z(ω =0) = 1/(gM + gw − gn). Parameters of the model were fit to each of the 17 cellsby minimizing the summed squared difference of the resistance and re-actance (i.e., the real and the imaginary part of the complex impedance,respectively) of the Fourier-transformed experimental data (including in-put resistance) and of the model (using the functions fmincon and pattern-search from MATLAB). Experimental data were fit using the above modelwith either a resonant or an amplifying current (total of four parameters).We fit a model with both types of currents (total of six parameters) only
when the fit using one type of current was poor and was greatly improvedby including the other current type (the case for one MSO and twoLSO cells).
We first used the model fits (from the ZAP data) to predict intrinsicproperties of cells, particularly of the voltage-dependent currents shapingsubthreshold input filtering. The models subsequently were used to simulatenumerically responses to natural sounds and to assess the influence of bio-physical properties on coding of interaural cues. A 5-s guinea pig vocalizationwas used as the exemplar natural stimulus, making sure that its statistics wererepresentative of guinea pig vocalizations (Fig. 4A; recordings provided byM. N. Wallace and J. M. Grimsley, Medical Research Council Institute ofHearing Research, Nottingham, United Kingdom, ref. 65). The peripheralprocessing of acoustic signals, including the generation of auditory-nervespike times, was carried out using the model by Zilany et al. (66). This modelprovides phenomenological descriptions of the major functional compo-nents of the auditory periphery, from the middle ear to the auditory nerve.The input of the model is the instantaneous pressure waveform of thestimulus, and the output is the resulting spike times for an auditory nervefiber with a particular CF. The input first is filtered by the middle ear, thenfollows three parallel filter paths: two signal paths that describe the basilarmembrane filtering and a feed-forward control path that models the effectsof outer hair cell function and regulates the gain and bandwidth of thebasilar membrane filtering. Both signal filter outputs are passed throughinner hair cell transduction functions, the outputs of which are summed andlow-pass filtered to produce the inner hair cell receptor potential. This po-tential drives an inner hair cell–to–auditory nerve synapse model, which sub-sequently leads to the generation of spikes according to an inhomogeneousPoisson process with refractoriness. MSO and LSO cell models received synapticinput relaying activity from six contralateral and six ipsilateral auditory nervefibers. By generating the synaptic input directly from the auditory nerve fibers,we are idealizing the cochlear nucleus as a simple relay (see, e.g., ref. 43).Activities of all fibers were independent realizations of the auditory peripherymodel using identical CF. Ipsilateral input was always excitatory; the shape ofthe excitatory postsynaptic currents was described by an alpha function withtime constant 0.2 ms (67). Contralateral input was either excitatory (leading toEE input) or inhibitory (leading to EI input), with the shape of the inhibitorypostsynaptic currents described by the difference of two exponential functionswith time constants of 0.2 ms and 2 ms (68). The peak amplitude of an ex-citatory postsynaptic current was −4.75 times the peak amplitude of an in-hibitory postsynaptic current, such that both currents provided an equalamount of charge. Note that the absolute amplitude of the synaptic input wasarbitrary because the membrane voltage models are linear. Action potentialoutput of the cell models was computed from voltage traces by setting eithera fixed voltage threshold or a slope (dv/dt) threshold and adding a 1-ms re-fractory period. The slope threshold was an idealization of the mechanismunderlying phasic firing (see refs. 22 and 23). The threshold value was set foreach model such that modulation of output firing rate was maximal fora particular CF (and dependent on the use of either EE or EI input), ensuringthat performance of the models was not limited by an arbitrary choice ofa fixed threshold. A minimal voltage or slope threshold was imposed for eachmodel, such that spontaneous activity of the auditory nerve input to themodels (i.e., when no acoustic stimulus is presented) produced output firingrates of maximally 10 Hz (this minimal threshold was determined separatelyfor EE and EI input).
ACKNOWLEDGMENTS. We are grateful to Mark Wallace and Jasmine Grimsleyfor the use of the guinea pig vocalizations. This work was supported by USNational Institutes of Health Grant DC008543 (to M.W.H.R. and J.R.),Einstein Foundation Berlin (M.W.H.R.), German Federal Ministry of Educa-tion and Research Grant 01GQ0972 (to M.W.H.R.), Deafness Research UK (R.D.and J.M.-H.), and Programme Grant G1002267 from the United KingdomMedical Research Council (to D.M.).
1. Rosen S (1992) Temporal information in speech: Acoustic, auditory and linguistic as-
pects. Philos Trans R Soc Lond B Biol Sci 336(1278):367–373.2. McFadden D, Jeffress LA, Ermey HL (1971) Differences of interaural phase and level in
detection and lateralization: 250 Hz. J Acoust Soc Am 50(6):1484–1493.3. Bernstein LR, Trahiotis C (2002) Enhancing sensitivity to interaural delays at
high frequencies by using “transposed stimuli.” J Acoust Soc Am 112(3 Pt 1):
1026–1036.4. Brughera A, Dunai L, Hartmann WM (2013) Human interaural time difference thresholds
for sine tones: The high-frequency limit. J Acoust Soc Am 133(5):2839–2855.5. Palmer AR, Russell IJ (1986) Phase-locking in the cochlear nerve of the guinea-pig and
its relation to the receptor potential of inner hair-cells. Hear Res 24(1):1–15.
6. Joris PX, Carney LH, Smith PH, Yin TC (1994) Enhancement of neural synchronization
in the anteroventral cochlear nucleus. I. Responses to tones at the characteristic
frequency. J Neurophysiol 71(3):1022–1036.7. Henning GB (1974) Detectability of interaural delay in high-frequency complex
waveforms. J Acoust Soc Am 55(1):84–90.8. Griffin SJ, Bernstein LR, Ingham NJ, McAlpine D (2005) Neural sensitivity to interaural
envelope delays in the inferior colliculus of the guinea pig. J Neurophysiol 93(6):
3463–3478.9. Lewicki MS (2002) Efficient coding of natural sounds. Nat Neurosci 5(4):356–363.10. Smith E, Lewicki MS (2005) Efficient coding of time-relative structure using spikes.
Neural Comput 17(1):19–45.
Remme et al. PNAS | Published online May 19, 2014 | E2347
NEU
ROSC
IENCE
PNASPL
US
Dow
nloa
ded
by g
uest
on
Dec
embe
r 29
, 202
1

11. Singh NC, Theunissen FE (2003) Modulation spectra of natural sounds and ethologicaltheories of auditory processing. J Acoust Soc Am 114(6 Pt 1):3394–3411.
12. Puil E, Gimbarzevsky B, Miura RM (1986) Quantification of membrane properties oftrigeminal root ganglion neurons in guinea pigs. J Neurophysiol 55(5):995–1016.
13. Hutcheon B, Yarom Y (2000) Resonance, oscillation and the intrinsic frequencypreferences of neurons. Trends Neurosci 23(5):216–222.
14. Heffner R, Heffner H, Masterton B (1971) Behavioral measurements of absolute andfrequency-difference thresholds in guinea pig. J Acoust Soc Am 49(6):1888–1895.
15. McAlpine D, Jiang D, Palmer AR (2001) A neural code for low-frequency sound lo-calization in mammals. Nat Neurosci 4(4):396–401.
16. Svirskis G, Dodla R, Rinzel J (2003) Subthreshold outward currents enhance temporalintegration in auditory neurons. Biol Cybern 89(5):333–340.
17. Smith AJ, Owens S, Forsythe ID (2000) Characterisation of inhibitory and excitatorypostsynaptic currents of the rat medial superior olive. J Physiol 529(Pt 3):681–698.
18. Svirskis G, Kotak V, Sanes DH, Rinzel J (2002) Enhancement of signal-to-noise ratioand phase locking for small inputs by a low-threshold outward current in auditoryneurons. J Neurosci 22(24):11019–11025.
19. Barnes-Davies M, Barker MC, Osmani F, Forsythe ID (2004) Kv1 currents mediatea gradient of principal neuron excitability across the tonotopic axis in the rat lateralsuperior olive. Eur J Neurosci 19(2):325–333.
20. Tennigkeit F, Schwarz DW, Puil E (1999) Modulation of frequency selectivity by Na+-and K+-conductances in neurons of auditory thalamus. Hear Res 127(1-2):77–85.
21. Leao RM, Li S, Doiron B, Tzounopoulos T (2012) Diverse levels of an inwardly rectifyingpotassium conductance generate heterogeneous neuronal behavior in a population ofdorsal cochlear nucleus pyramidal neurons. J Neurophysiol 107(11):3008–3019.
22. McGinley MJ, Oertel D (2006) Rate thresholds determine the precision of temporalintegration in principal cells of the ventral cochlear nucleus. Hear Res 216-217:52–63.
23. Meng X, Huguet G, Rinzel J (2012) Type III excitability, slope sensitivity and co-incidence detection. Discrete Contin Dyn Syst Ser A 32(8):2729–2757.
24. Sterbing SJ, Hartung K, Hoffmann K-P (2003) Spatial tuning to virtual sounds in theinferior colliculus of the guinea pig. J Neurophysiol 90(4):2648–2659.
25. Gai Y, Doiron B, Kotak V, Rinzel J (2009) Noise-gated encoding of slow inputs byauditory brain stem neurons with a low-threshold K+ current. J Neurophysiol 102(6):3447–3460.
26. Joris PX (1996) Envelope coding in the lateral superior olive. II. Characteristic delaysand comparison with responses in the medial superior olive. J Neurophysiol 76(4):2137–2156.
27. Tollin DJ, Yin TCT (2005) Interaural phase and level difference sensitivity in low-fre-quency neurons in the lateral superior olive. J Neurosci 25(46):10648–10657.
28. Brand A, Behrend O, Marquardt T, McAlpine D, Grothe B (2002) Precise inhibition isessential for microsecond interaural time difference coding. Nature 417(6888):543–547.
29. Pecka M, Brand A, Behrend O, Grothe B (2008) Interaural time difference processingin the mammalian medial superior olive: The role of glycinergic inhibition. J Neurosci28(27):6914–6925.
30. Jiang D, McAlpine D, Palmer AR (1997) Detectability index measures of binauralmasking level difference across populations of inferior colliculus neurons. J Neurosci17(23):9331–9339.
31. Rakerd B, Hartmann WM (2010) Localization of sound in rooms. V. Binaural co-herence and human sensitivity to interaural time differences in noise. J Acoust Soc Am128(5):3052–3063.
32. Crawford AC, Fettiplace R (1981) An electrical tuning mechanism in turtle cochlearhair cells. J Physiol 312:377–412.
33. Buzsáki G (2002) Theta oscillations in the hippocampus. Neuron 33(3):325–340.34. Beraneck M, et al. (2007) Differential intrinsic response dynamics determine synaptic
signal processing in frog vestibular neurons. J Neurosci 27(16):4283–4296.35. Scott LL, Mathews PJ, Golding NL (2005) Posthearing developmental refinement of
temporal processing in principal neurons of the medial superior olive. J Neurosci25(35):7887–7895.
36. Svirskis G, Kotak V, Sanes DH, Rinzel J (2004) Sodium along with low-threshold po-tassium currents enhance coincidence detection of subthreshold noisy signals in MSOneurons. J Neurophysiol 91(6):2465–2473.
37. Adam TJ, Finlayson PG, Schwarz DW (2001) Membrane properties of principal neu-rons of the lateral superior olive. J Neurophysiol 86(2):922–934.
38. Khurana S, et al. (2012) An essential role for modulation of hyperpolarization-acti-vated current in the development of binaural temporal precision. J Neurosci 32(8):2814–2823.
39. Khurana S, Remme MWH, Rinzel J, Golding NL (2011) Dynamic interaction of Ih andIK-LVA during trains of synaptic potentials in principal neurons of the medial superiorolive. J Neurosci 31(24):8936–8947.
40. Tsuchitani C (1982) Discharge patterns of cat lateral superior olivary units to ipsilat-eral tone-burst stimuli. J Neurophysiol 47(3):479–500.
41. Tsuchitani C, Johnson DH (1985) The effects of ipsilateral tone burst stimulus level onthe discharge patterns of cat lateral superior olivary units. J Acoust Soc Am 77(4):1484–1496.
42. Zhou Y, Colburn HS (2010) A modeling study of the effects of membrane after-hyperpolarization on spike interval statistics and on ILD encoding in the lateral su-perior olive. J Neurophysiol 103(5):2355–2371.
43. Wang L, Colburn HS (2012) A modeling study of the responses of the lateral superiorolive to ipsilateral sinusoidally amplitude-modulated tones. J Assoc Res Otolaryngol13(2):249–267.
44. Joris PX, Smith PH, Yin TC (1998) Coincidence detection in the auditory system: 50years after Jeffress. Neuron 21(6):1235–1238.
45. Greene NT, Davis KA (2012) Discharge patterns in the lateral superior olive of de-cerebrate cats. J Neurophysiol 108(7):1942–1953.
46. Brungart DS, Rabinowitz WM (1999) Auditory localization of nearby sources. Head-related transfer functions. J Acoust Soc Am 106(3 Pt 1):1465–1479.
47. Jones HG, Koka K, Thornton JL, Tollin DJ (2011) Concurrent development of the headand pinnae and the acoustical cues to sound location in a precocious species, thechinchilla (Chinchilla lanigera). J Assoc Res Otolaryngol 12(2):127–140.
48. Koka K, Jones HG, Thornton JL, Lupo JE, Tollin DJ (2011) Sound pressure trans-formations by the head and pinnae of the adult Chinchilla (Chinchilla lanigera). HearRes 272(1-2):135–147.
49. Koka K, Read HL, Tollin DJ (2008) The acoustical cues to sound location in the rat:Measurements of directional transfer functions. J Acoust Soc Am 123(6):4297–4309.
50. Majdak P, Laback B (2009) Effects of center frequency and rate on the sensitivity tointeraural delay in high-frequency click trains. J Acoust Soc Am 125(6):3903–3913.
51. Monaghan JJM, Krumbholz K, Seeber BU (2013) Factors affecting the use of envelopeinteraural time differences in reverberation. J Acoust Soc Am 133(4):2288–2300.
52. Finlayson PG, Caspary DM (1991) Low-frequency neurons in the lateral superior oliveexhibit phase-sensitive binaural inhibition. J Neurophysiol 65(3):598–605.
53. Heffner HE, Heffner RS, Contos C, Ott T (1994) Audiogram of the hooded Norway rat.Hear Res 73(2):244–247.
54. Stevens SS, Newman EB (1936) The localization of actual sources of sound. Am JPsychol 48(2):297–306.
55. Mills AW (1958) On the minimum audible angle. J Acoust Soc Am 30:237–246.56. Ruggles D, Bharadwaj H, Shinn-Cunningham BG (2012) Why middle-aged listeners
have trouble hearing in everyday settings. Curr Biol 22(15):1417–1422.57. Smith EC, Lewicki MS (2006) Efficient auditory coding. Nature 439(7079):978–982.58. Rees A, Palmer AR (1988) Rate-intensity functions and their modification by broad-
band noise for neurons in the guinea pig inferior colliculus. J Acoust Soc Am 83(4):1488–1498.
59. Lesica NA, Grothe B (2008) Efficient temporal processing of naturalistic sounds. PLoSOne 3(2):e1655.
60. Plomp R, Mimpen AM (1979) Improving the reliability of testing the speech receptionthreshold for sentences. Audiology 18(1):43–52.
61. Zeng FG (2002) Temporal pitch in electric hearing. Hear Res 174(1-2):101–106.62. Seeber BU, Fastl H (2008) Localization cues with bilateral cochlear implants. J Acoust
Soc Am 123(2):1030–1042.63. Akeroyd MA, Patterson RD (1997) A comparison of detection and discrimination of
temporal asymmetry in amplitude modulation. J Acoust Soc Am 101(1):430–439.64. Hutcheon B, Miura RM, Puil E (1996) Subthreshold membrane resonance in neo-
cortical neurons. J Neurophysiol 76(2):683–697.65. Grimsley JMS, Palmer AR, Wallace MN (2011) Age differences in the purr call distin-
guished by units in the adult guinea pig primary auditory cortex. Hear Res 277(1-2):134–142.
66. Zilany MSA, Bruce IC, Nelson PC, Carney LH (2009) A phenomenological model of thesynapse between the inner hair cell and auditory nerve: Long-term adaptation withpower-law dynamics. J Acoust Soc Am 126(5):2390–2412.
67. Couchman K, Grothe B, Felmy F (2010) Medial superior olivary neurons receive sur-prisingly few excitatory and inhibitory inputs with balanced strength and short-termdynamics. J Neurosci 30(50):17111–17121.
68. Magnusson AK, Kapfer C, Grothe B, Koch U (2005) Maturation of glycinergic in-hibition in the gerbil medial superior olive after hearing onset. J Physiol 568(Pt 2):497–512.
E2348 | www.pnas.org/cgi/doi/10.1073/pnas.1316216111 Remme et al.
Dow
nloa
ded
by g
uest
on
Dec
embe
r 29
, 202
1