Embed Size (px)
Citation preview

September 2015
THOUGHT LEADERSHIP SERIES
SUBURBAN OFFICE OBSOLESCENCE QUANTIFYING CHALLENGES AND OPPORTUNITIES
3Newmark Grubb Knight Frank2
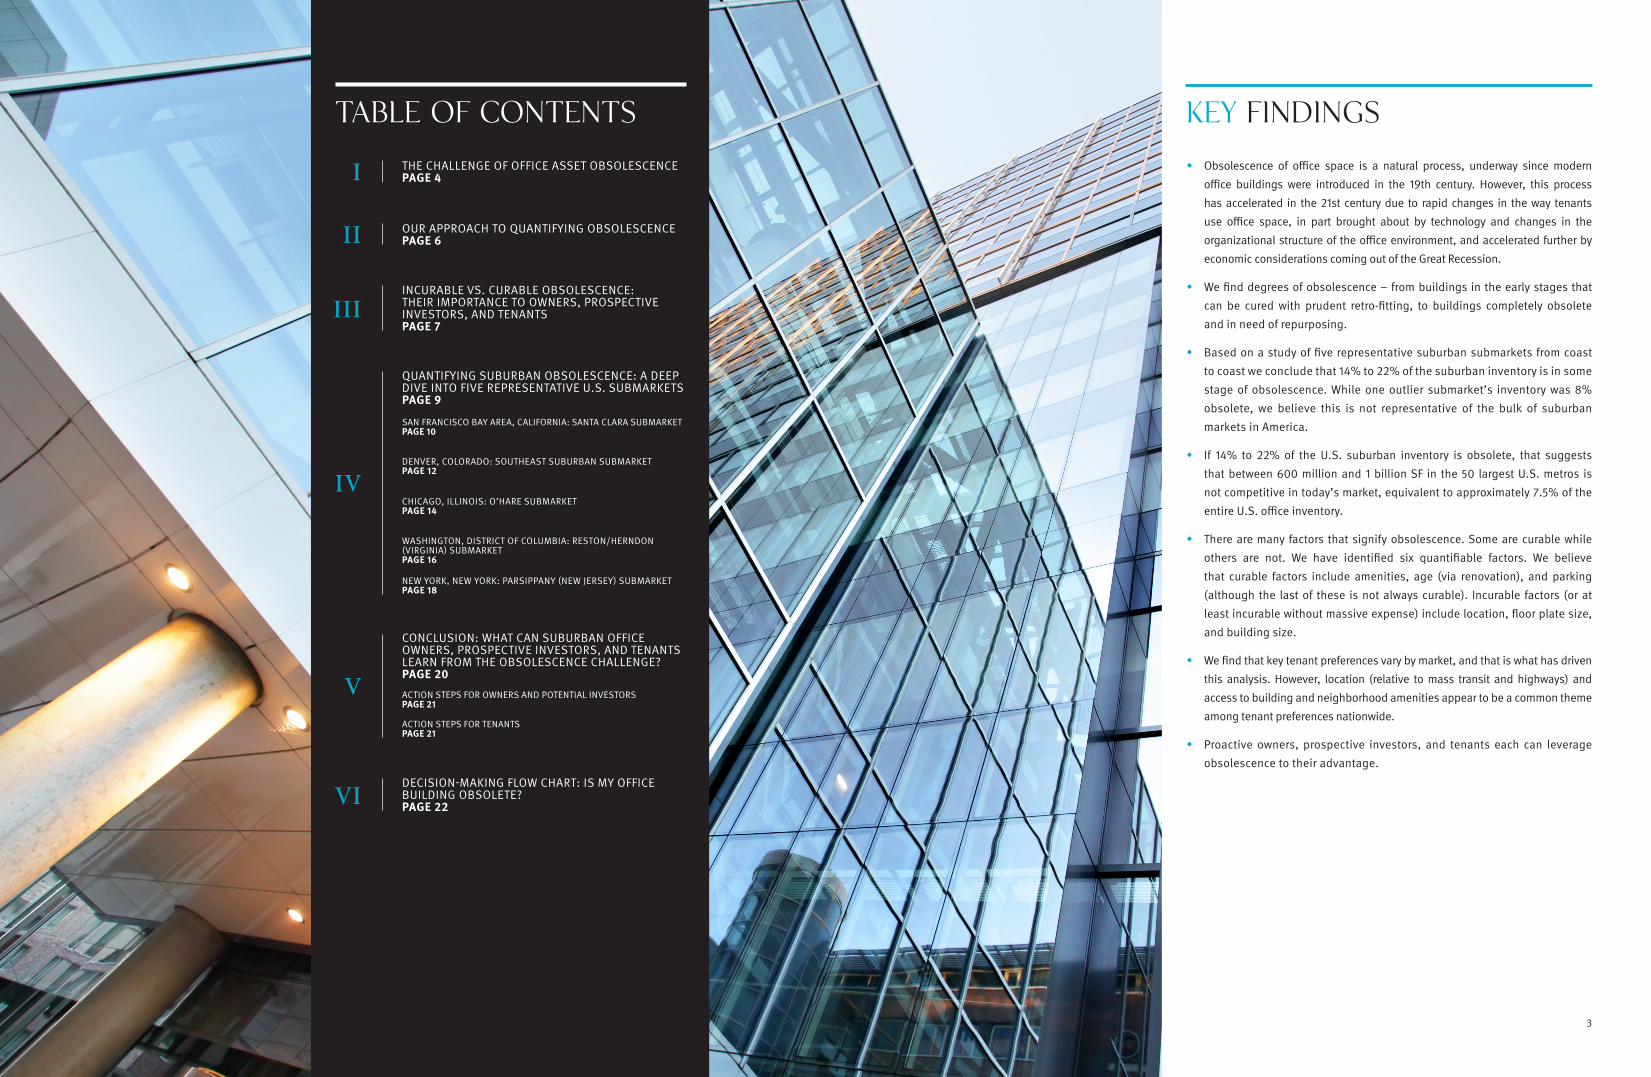
TABLE OF CONTENTS
THE CHALLENGE OF OFFICE ASSET OBSOLESCENCE PAGE 4
KEY FINDINGS
� Obsolescence of office space is a natural process, underway since modern
office buildings were introduced in the 19th century. However, this process
has accelerated in the 21st century due to rapid changes in the way tenants
use office space, in part brought about by technology and changes in the
organizational structure of the office environment, and accelerated further by
economic considerations coming out of the Great Recession.
� We find degrees of obsolescence – from buildings in the early stages that
can be cured with prudent retro-fitting, to buildings completely obsolete
and in need of repurposing.
� Based on a study of five representative suburban submarkets from coast
to coast we conclude that 14% to 22% of the suburban inventory is in some
stage of obsolescence. While one outlier submarket’s inventory was 8%
obsolete, we believe this is not representative of the bulk of suburban
markets in America.
� If 14% to 22% of the U.S. suburban inventory is obsolete, that suggests
that between 600 million and 1 billion SF in the 50 largest U.S. metros is
not competitive in today’s market, equivalent to approximately 7.5% of the
entire U.S. office inventory.
� There are many factors that signify obsolescence. Some are curable while
others are not. We have identified six quantifiable factors. We believe
that curable factors include amenities, age (via renovation), and parking
(although the last of these is not always curable). Incurable factors (or at
least incurable without massive expense) include location, floor plate size,
and building size.
� We find that key tenant preferences vary by market, and that is what has driven
this analysis. However, location (relative to mass transit and highways) and
access to building and neighborhood amenities appear to be a common theme
among tenant preferences nationwide.
� Proactive owners, prospective investors, and tenants each can leverage
obsolescence to their advantage.
I
OUR APPROACH TO QUANTIFYING OBSOLESCENCE PAGE 6
INCURABLE VS. CURABLE OBSOLESCENCE: THEIR IMPORTANCE TO OWNERS, PROSPECTIVE INVESTORS, AND TENANTSPAGE 7
QUANTIFYING SUBURBAN OBSOLESCENCE: A DEEP DIVE INTO FIVE REPRESENTATIVE U.S. SUBMARKETS PAGE 9
CONCLUSION: WHAT CAN SUBURBAN OFFICE OWNERS, PROSPECTIVE INVESTORS, AND TENANTS LEARN FROM THE OBSOLESCENCE CHALLENGE? PAGE 20
DECISION-MAKING FLOW CHART: IS MY OFFICE BUILDING OBSOLETE? PAGE 22
SAN FRANCISCO BAY AREA, CALIFORNIA: SANTA CLARA SUBMARKET PAGE 10
DENVER, COLORADO: SOUTHEAST SUBURBAN SUBMARKET PAGE 12
CHICAGO, ILLINOIS: O’HARE SUBMARKET PAGE 14
WASHINGTON, DISTRICT OF COLUMBIA: RESTON/HERNDON (VIRGINIA) SUBMARKET PAGE 16
NEW YORK, NEW YORK: PARSIPPANY (NEW JERSEY) SUBMARKET PAGE 18
ACTION STEPS FOR OWNERS AND POTENTIAL INVESTORS PAGE 21
ACTION STEPS FOR TENANTS PAGE 21
II
III
IV
V
VI
Newmark Grubb Knight Frank4 5
THE CHALLENGE OF Office Asset Obsolescence
In the recovery period that has followed the Great Recession of 2007-2009, most discussion of the U.S. office market has focused on demand – or the lack of it. With concern over slow employment growth in office-using sectors of the economy and densification (the reduction in square feet leased per worker), modest levels of demand have resulted in a slow comeback for office space. That is not the case everywhere – some metro areas, such as San Francisco and Boston, boast tight office market conditions in 2015, with low vacancy rates and rapidly rising rents. Overall, however, the return to owner-favored market conditions has been a gradual one, with demand unlikely to match the peak levels of prior expansion cycles.
Lost in this concern over demand is what the condition of the existing office supply means for the future of the market. As the needs of the modern tenant have become increasingly clear – often defined as Trophy or Class A office space that is proximate to mass transit and with robust in-building amenities – older properties are challenged to compete. In particular, as tenants prioritize walkable, “urban” office space, owners of suburban properties – especially those in
1980s-era campus settings – are increasingly finding their assets to be obsolete. Some of those assets are incurably obsolete – due to factors such as location or floor plate size. Increasingly they simply do not offer the experience most of today’s tenants are seeking, and no feasible investment in the asset is likely to change that status. Others are curably obsolete – with the right investment in amenities and building systems, the asset may be brought up to modern standards, allowing it once again to compete for tenants. There is a spectrum of obsolescence as shown in the flow chart at the back of this report, and some outdated properties may still appeal to tenants who are very value-conscious or who are seeking a very specific type of space. Overall, however, buildings near the incurably obsolete end of the spectrum are candidates for repurposing – conversion to other uses.
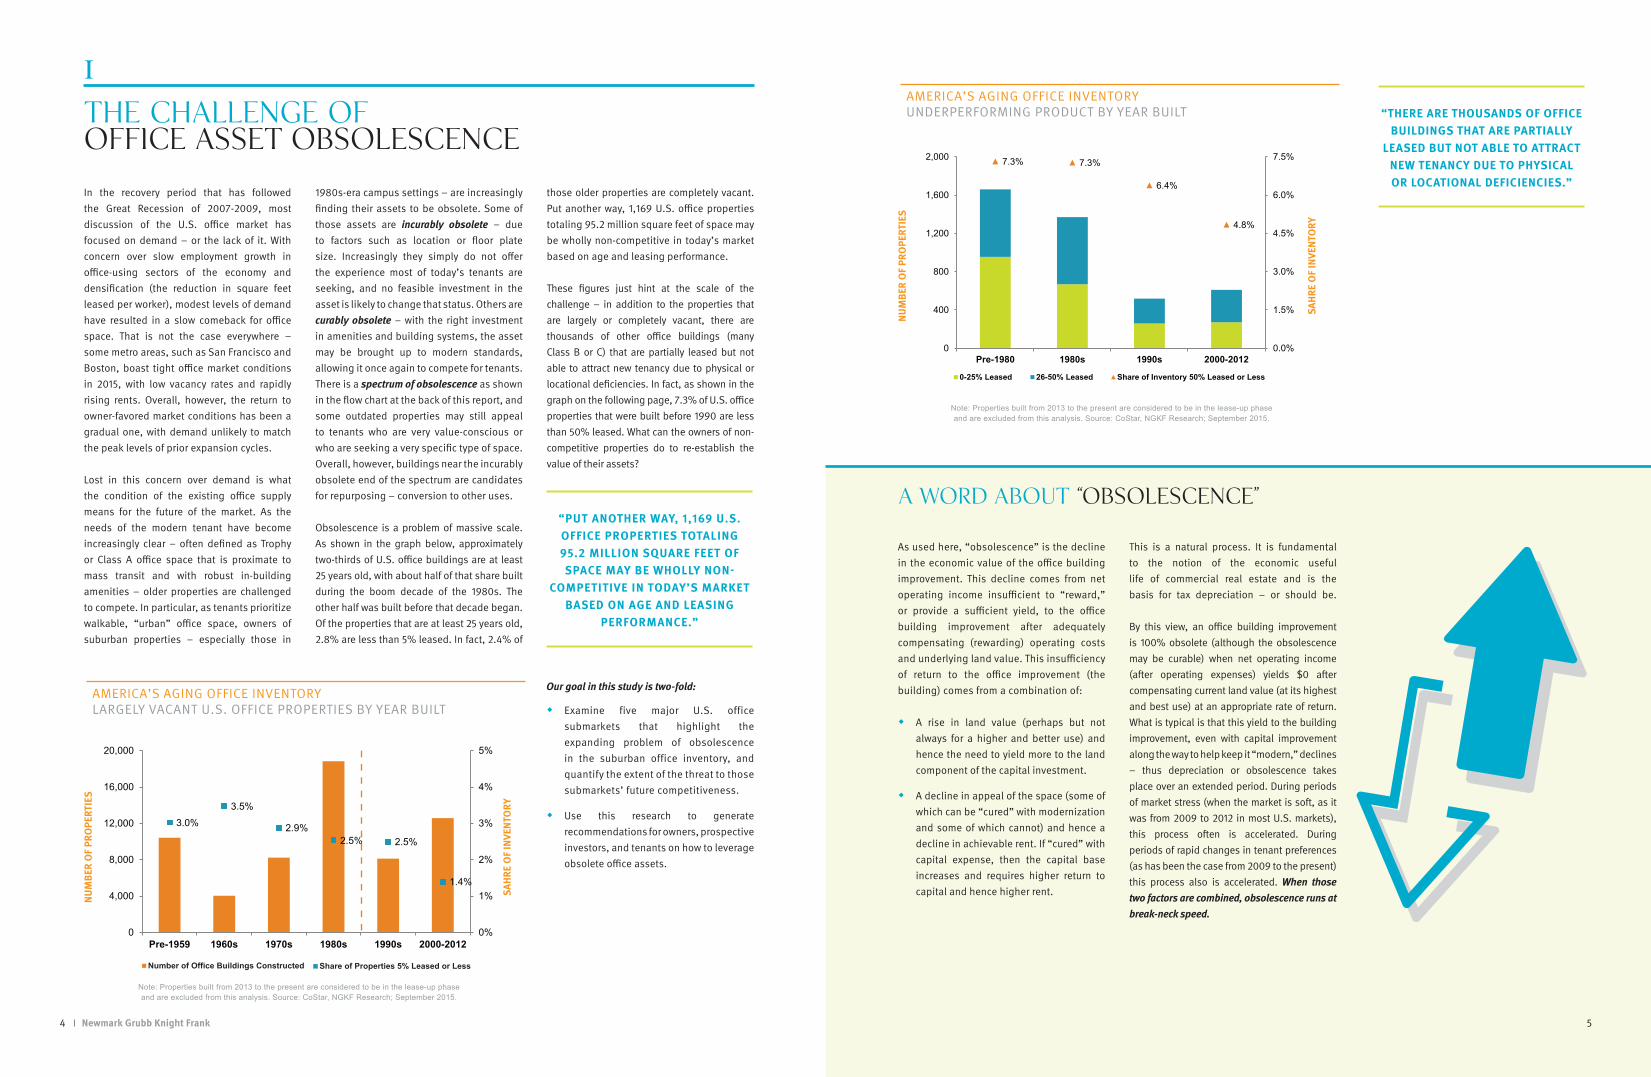
Obsolescence is a problem of massive scale. As shown in the graph below, approximately two-thirds of U.S. office buildings are at least 25 years old, with about half of that share built during the boom decade of the 1980s. The other half was built before that decade began. Of the properties that are at least 25 years old, 2.8% are less than 5% leased. In fact, 2.4% of
those older properties are completely vacant. Put another way, 1,169 U.S. office properties totaling 95.2 million square feet of space may be wholly non-competitive in today’s market based on age and leasing performance.
These figures just hint at the scale of the challenge – in addition to the properties that are largely or completely vacant, there are thousands of other office buildings (many Class B or C) that are partially leased but not able to attract new tenancy due to physical or locational deficiencies. In fact, as shown in the graph on the following page, 7.3% of U.S. office properties that were built before 1990 are less than 50% leased. What can the owners of non-competitive properties do to re-establish the value of their assets?
AMERICA’S AGING OFFICE INVENTORYLARGELY VACANT U.S. OFFICE PROPERTIES BY YEAR BUILT
“PUT ANOTHER WAY, 1,169 U.S. OFFICE PROPERTIES TOTALING 95.2 MILLION SQUARE FEET OF SPACE MAY BE WHOLLY NON-
COMPETITIVE IN TODAY’S MARKET BASED ON AGE AND LEASING
PERFORMANCE.”
As used here, “obsolescence” is the decline in the economic value of the office building improvement. This decline comes from net operating income insufficient to “reward,” or provide a sufficient yield, to the office building improvement after adequately compensating (rewarding) operating costs and underlying land value. This insufficiency of return to the office improvement (the building) comes from a combination of:
� A rise in land value (perhaps but not always for a higher and better use) and hence the need to yield more to the land component of the capital investment.
� A decline in appeal of the space (some of which can be “cured” with modernization and some of which cannot) and hence a decline in achievable rent. If “cured” with capital expense, then the capital base increases and requires higher return to capital and hence higher rent.
This is a natural process. It is fundamental to the notion of the economic useful life of commercial real estate and is the basis for tax depreciation – or should be.
By this view, an office building improvement is 100% obsolete (although the obsolescence may be curable) when net operating income (after operating expenses) yields $0 after compensating current land value (at its highest and best use) at an appropriate rate of return. What is typical is that this yield to the building improvement, even with capital improvement along the way to help keep it “modern,” declines – thus depreciation or obsolescence takes place over an extended period. During periods of market stress (when the market is soft, as it was from 2009 to 2012 in most U.S. markets), this process often is accelerated. During periods of rapid changes in tenant preferences (as has been the case from 2009 to the present) this process also is accelerated. When those two factors are combined, obsolescence runs at break-neck speed.
A WORD ABOUT “OBSOLESCENCE”
Our goal in this study is two-fold:
� Examine five major U.S. office submarkets that highlight the expanding problem of obsolescence in the suburban office inventory, and quantify the extent of the threat to those submarkets’ future competitiveness.
� Use this research to generate recommendations for owners, prospective investors, and tenants on how to leverage obsolete office assets.
AMERICA’S AGING OFFICE INVENTORYUNDERPERFORMING PRODUCT BY YEAR BUILT
Note: Properties built from 2013 to the present are considered to be in the lease-up phase and are excluded from this analysis. Source: CoStar, NGKF Research; September 2015.
NUM
BER
OF
PRO
PERT
IES
SAHR
E O
F IN
VENT
ORY
Note: Properties built from 2013 to the present are considered to be in the lease-up phase and are excluded from this analysis. Source: CoStar, NGKF Research; September 2015.
NUM
BER
OF
PRO
PERT
IES
SAHR
E O
F IN
VENT
ORY
I
“THERE ARE THOUSANDS OF OFFICE BUILDINGS THAT ARE PARTIALLY
LEASED BUT NOT ABLE TO ATTRACT NEW TENANCY DUE TO PHYSICAL OR LOCATIONAL DEFICIENCIES.”
3.0%3.5%
2.9%2.5% 2.5%
1.4%
0%
1%
2%
3%
4%
5%
0
4,000
8,000
12,000
16,000
20,000
Pre-1959 1960s 1970s 1980s 1990s 2000-2012
7.3% 7.3%
6.4%
4.8%
0.0%
1.5%
3.0%
4.5%
6.0%
7.5%
0
400
800
1,200
1,600
2,000
Pre-1980 1980s 1990s 2000-2012
0-25% Leased 26-50% Leased Share of Inventory 50% Leased or Less
Share of Properties 5% Leased or LessNumber of Office Buildings Constructed
7Newmark Grubb Knight Frank6
OUR APPROACH TO Quantifying Obsolescence
In looking at the obsolescence problem in suburban office space, the key question is how do we quantify what makes a building obsolete? While there are a number of factors and attributes that make each building unique, we identified six quantifiable factors that are important to office tenants across most suburban markets. They are:
� Location, as determined by proximity to public transit and/or highway access
� In-building amenities, particularly on-premises food service, fitness centers, and conference centers
� Parking ratio
� Age of the property, based on year built or renovated
� Size of the building
� Size of the floor plate
In order to keep the scope of this study manageable – but also applicable to major markets across the United States – we identified
one key submarket in each of five major metro areas that is suffering from a partially obsolete inventory. Our goal was to draw conclusions from the performance of illustrative submarkets that met these four criteria:
� The submarket has a significant share of obsolete inventory (there is a problem that needs to be addressed)
� The submarket has valuable, unique, or notable characteristics, such as a popular town center, proximity to a major airport, or serving as a hub to a growing industry (there is something to recommend it)
� The submarket has some functional, well-performing office assets (there is a basis for comparison)
� There are enough amenities, transit access, or job creation to allow for some curing of the obsolescence challenge (investors are looking for and willing to fund solutions)
In addition to analyzing the six metrics listed for each property being studied, we sought the opinion of tenant representatives in the five subject submarkets. We asked them to identify the key considerations their clients have when seeking new space, and we ranked
the six key metrics accordingly, with some variation across the submarkets. For more details on these rankings, see the submarket-specific analyses in Section IV of this report.
“IN LOOKING AT THE OBSOLESCENCE PROBLEM IN
SUBURBAN OFFICE SPACE, THE KEY QUESTION IS HOW DO
WE QUANTIFY WHAT MAKES A BUILDING OBSOLETE?”
In a business that values location above all else, when tenants’ locational preferences change, asset values can be affected dramatically. For example, the expansiveness, serenity, and security of the 1980s suburban office campus once made that environment appealing for many professional and business services firms. Now, however, walkability and activated environments are at the top of many tenants’ lists of must-haves. Suburban office buildings that have become obsolete due to car-centric and removed locations – and which do not have some factor that will remedy these traits in the future (such as a planned transit station or new highway exits) – are unlikely to achieve market-average rents as leases roll. In extreme cases, properties that are incurably obsolete – primarily those at undesirable locations or with building sizes or floor plates that tenants now find either too large or too small – may never lease again. Or, they may lease at rates that no longer yield a return to the improvement, with the lease rate just covering operating costs and return to land value.
Incurable obsolescence is a function of the unchangeable features of an office property. The major, quantifiable characteristics of incurable obsolescence are:
� Building location
� Building size
� Building floor plate
� Ceiling height
In the analysis that follows, we have analyzed the first three of these in the five illustrative submarkets noted earlier. Unfortunately, the data sample for ceiling heights was insufficient and too unreliable to include in our analysis. For those buildings in an acceptable suburban location – which we and many tenant brokers define as being within a half-mile of mass transit or with premier highway access – there are some steps owners can take to modernize their assets and increase their appeal to today’s tenants. These buildings are curably obsolete – they are
challenged by today’s standards, but they can be upgraded to meet the needs of many tenants in the market. That does not mean that it makes financial sense to make these upgrades. That must be established on a building-by-building basis. But, at least money has the potential to solve these obsolescence challenges – therefore the moniker “curable obsolescence.”
Curable obsolescence revolves around the changeable features of an office property. The major, quantifiable characteristics of curable obsolescence are:
� Amenities (in-building or neighborhood)
� Building age (accounting for major renovations)
� Parking ratio at the property
In the analysis that follows, we have analyzed these for the five illustrative submarkets noted earlier.
INCURABLE VS. CURABLE OBSOLESCENCE: Their Importance to Owners, Prospective Investors, and Tenants
II III
9Newmark Grubb Knight Frank8
Based on broker input provided for this analysis, among buildings in suburban locations where neighborhood amenities are not walkable, in-building amenities determine whether or not a building even gets an initial tour. Typically, the top three must-have in-building amenities for suburban properties are a conference center, a fitness center, and food service. Buildings lacking one or more of these amenities are unlikely to make an initial tour list. Conversely, those buildings located in denser, more urbanized suburban areas do not need to depend as much on in-building amenities if neighborhood amenities are walkable and readily available. So the basic formula goes: If tenants are not able to walk to nearby retail or a neighboring office property to get lunch, they had better be able to get it at their own building. With substantial blocks of available space in many suburban submarkets, tenants have numerous options to consider. Also, tenants recently have shown an affinity for more modern and urban space – hence the plethora of stories about office moves from suburban campus locations into major urbanized town centers and downtown areas, and the success of newer transit-accessible
trophy assets compared to the broader market. As a result of these two trends, the market has prescribed a “renovate or die” approach for owners of obsolete properties. Properties with outdated elevators, lobbies, and building systems generally do not succeed in today’s market. If an outdated asset has other redeeming qualities such as good transit or highway access or a strong amenity base, building upgrades are the next major requirement for achieving market-competitive rents. Investing capital into a property to improve the window line, upgrade the HVAC and other building systems, modernize lobbies, and overhaul elevators can be a lifeline in today’s competitive suburban markets. Modernization may not set a building apart, but it can help ensure that tenants will at least consider touring the property if it has a location to recommend it.
Why should investors take seriously this challenge of building obsolescence, and consider major investments to keep their assets modern? Further, why should tenants care? According to the Bureau of Labor Statistics, the median tenure for U.S. workers is 4.6 years. A company’s ability to attract and retain talent depends on providing an environment where young people want to spend their time. For the Millennial generation, that is typically in a modern, collaborative office environment, or completely untethered to an office at all. Tenants committed to space in isolated, suburban assets are facing a losing battle to retain their best workers as the employment market continues to tighten. Owners of such
space are facing an even greater challenge – how to keep their investments attractive to tenants as leases roll and space reaches the market. The distinctive qualities that owners should consider vary by submarket, and our analysis that follows accounts for different tenant preferences in different places.
In summary, there will always be extremely value-conscious tenants who set cost as their most important requirement. As a result, there will always be some market share for value-priced properties, even if those properties do not conform to the current trends of transit-adjacent, amenity-laden space. There is a market for obsolete office space. But there is little to no return to the office improvement after consideration of operating expenses and yield to land value.
For owners seeking to generate market-competitive rents and increase the long-term value of their assets, tackling the challenge of curable obsolescence where it exists in their portfolios is a critical next step.
As described earlier, in order to assess America’s suburban office obsolescence problem, we identified one suburban submarket in each of five major U.S. metro areas that is illustrative of the obsolescence problem. We then examined the office inventory for each of these submarkets based on an ideal range for the following quantifiable metrics: location, building
size, floor plate size, amenities, year built or renovated, and parking ratio. The ideal ranges were developed after consultation with local brokers and other market experts. The ranges are submarket-specific and therefore vary. Please see the table on page 23 for details. For the purposes of this study, we defined obsolete product as those properties meeting the acceptable range for
less than two of the six metrics. The financial challenge to investors may be too great to remedy properties that do not already meet at least two of the six criteria noted.
Following is our analysis of five submarkets that illustrate the growing challenge of suburban office property obsolescence, presented from west to east.
QUANTIFYING SUBURBAN OBSOLESCENCE: A Deep Dive into Five Representative U.S. Submarkets
“IF AN OUTDATED ASSET HAS GOOD TRANSIT OR HIGHWAY
ACCESS OR A STRONG AMENITY BASE, BUILDING UPGRADES ARE THE NEXT MAJOR REQUIREMENT
FOR ACHIEVING MARKET-COMPETITIVE RENTS.”
“THE BASIC FORMULA GOES: IF TENANTS ARE NOT ABLE TO WALK TO NEARBY RETAIL OR A NEIGHBORING
OFFICE PROPERTY TO GET LUNCH, THEY HAD BETTER BE ABLE TO GET
IT AT THEIR OWN BUILDING.”
IV
11Newmark Grubb Knight Frank10
SANTA CLARA
SAN FRANCISCO
BAY
SAN FRANCISCO BAY AREA, CALIFORNIA: SANTA CLARA SUBMARKET
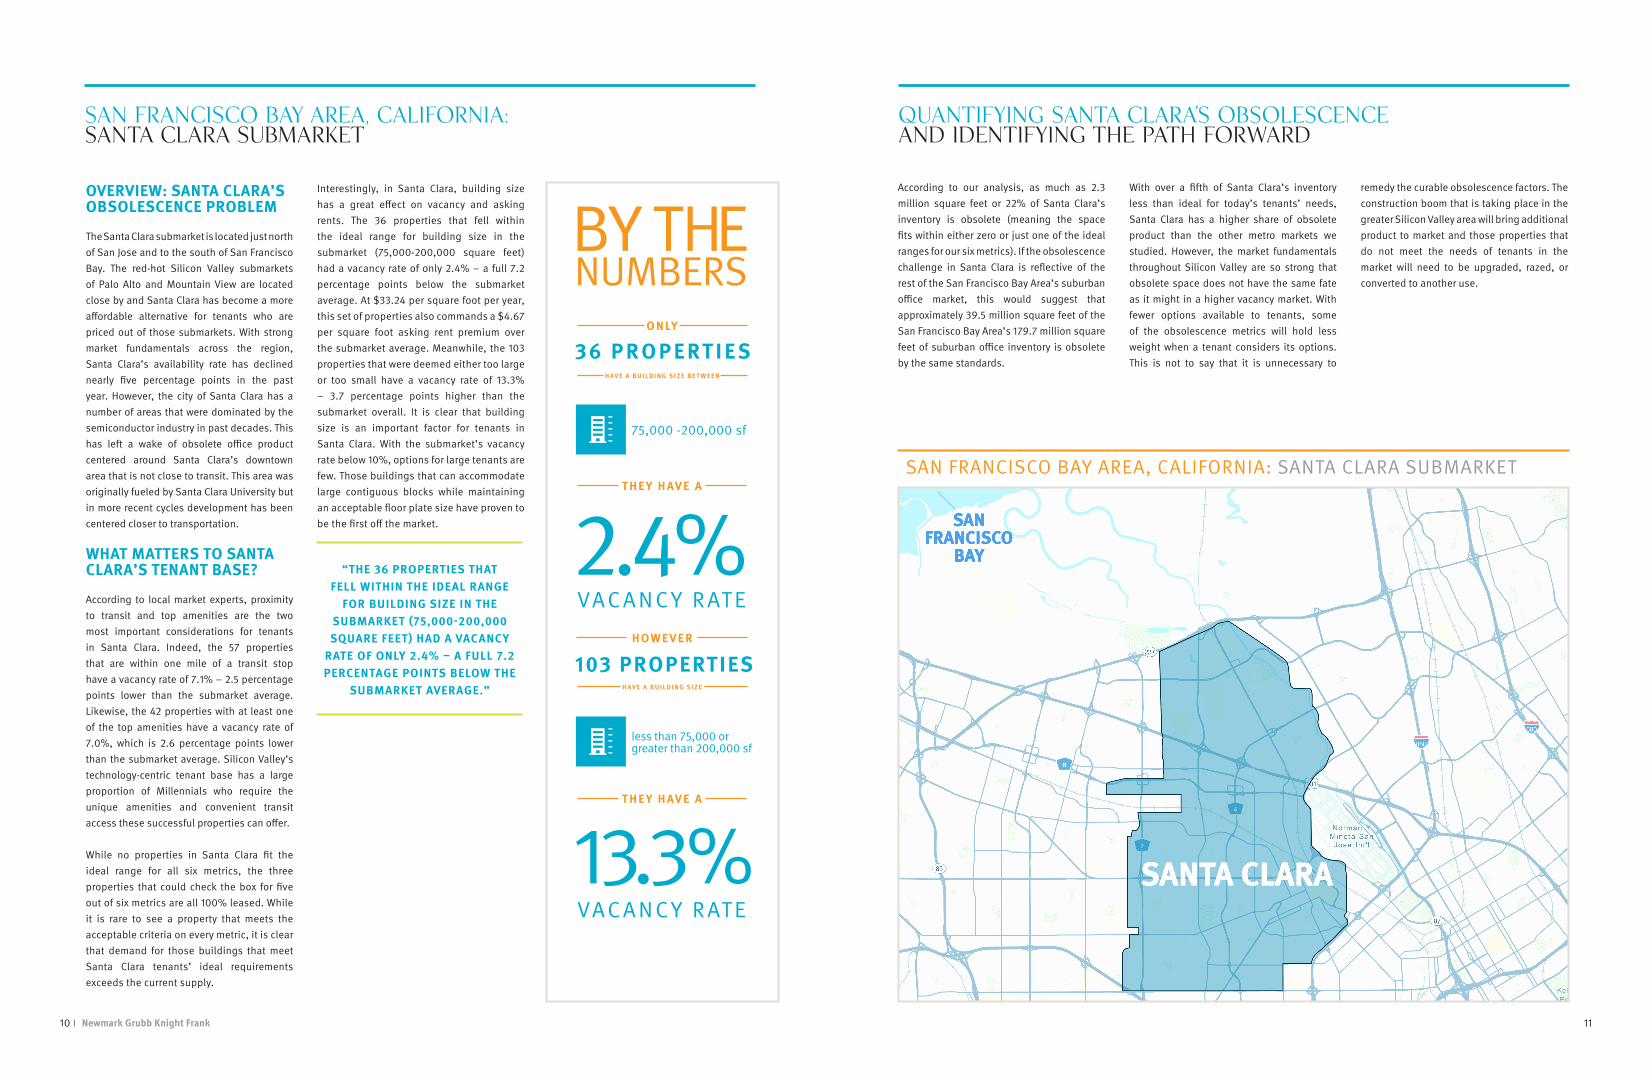
According to our analysis, as much as 2.3 million square feet or 22% of Santa Clara’s inventory is obsolete (meaning the space fits within either zero or just one of the ideal ranges for our six metrics). If the obsolescence challenge in Santa Clara is reflective of the rest of the San Francisco Bay Area’s suburban office market, this would suggest that approximately 39.5 million square feet of the San Francisco Bay Area’s 179.7 million square feet of suburban office inventory is obsolete by the same standards.
With over a fifth of Santa Clara’s inventory less than ideal for today’s tenants’ needs, Santa Clara has a higher share of obsolete product than the other metro markets we studied. However, the market fundamentals throughout Silicon Valley are so strong that obsolete space does not have the same fate as it might in a higher vacancy market. With fewer options available to tenants, some of the obsolescence metrics will hold less weight when a tenant considers its options. This is not to say that it is unnecessary to
remedy the curable obsolescence factors. The construction boom that is taking place in the greater Silicon Valley area will bring additional product to market and those properties that do not meet the needs of tenants in the market will need to be upgraded, razed, or converted to another use.
QUANTIFYING SANTA CLARA’S OBSOLESCENCE and Identifying the Path Forward
OVERVIEW: SANTA CLARA’S OBSOLESCENCE PROBLEM
The Santa Clara submarket is located just north of San Jose and to the south of San Francisco Bay. The red-hot Silicon Valley submarkets of Palo Alto and Mountain View are located close by and Santa Clara has become a more affordable alternative for tenants who are priced out of those submarkets. With strong market fundamentals across the region, Santa Clara’s availability rate has declined nearly five percentage points in the past year. However, the city of Santa Clara has a number of areas that were dominated by the semiconductor industry in past decades. This has left a wake of obsolete office product centered around Santa Clara’s downtown area that is not close to transit. This area was originally fueled by Santa Clara University but in more recent cycles development has been centered closer to transportation. WHAT MATTERS TO SANTA CLARA’S TENANT BASE?
According to local market experts, proximity to transit and top amenities are the two most important considerations for tenants in Santa Clara. Indeed, the 57 properties that are within one mile of a transit stop have a vacancy rate of 7.1% – 2.5 percentage points lower than the submarket average. Likewise, the 42 properties with at least one of the top amenities have a vacancy rate of 7.0%, which is 2.6 percentage points lower than the submarket average. Silicon Valley’s technology-centric tenant base has a large proportion of Millennials who require the unique amenities and convenient transit access these successful properties can offer. While no properties in Santa Clara fit the ideal range for all six metrics, the three properties that could check the box for five out of six metrics are all 100% leased. While it is rare to see a property that meets the acceptable criteria on every metric, it is clear that demand for those buildings that meet Santa Clara tenants’ ideal requirements exceeds the current supply.
Interestingly, in Santa Clara, building size has a great effect on vacancy and asking rents. The 36 properties that fell within the ideal range for building size in the submarket (75,000-200,000 square feet) had a vacancy rate of only 2.4% – a full 7.2 percentage points below the submarket average. At $33.24 per square foot per year, this set of properties also commands a $4.67 per square foot asking rent premium over the submarket average. Meanwhile, the 103 properties that were deemed either too large or too small have a vacancy rate of 13.3% – 3.7 percentage points higher than the submarket overall. It is clear that building size is an important factor for tenants in Santa Clara. With the submarket’s vacancy rate below 10%, options for large tenants are few. Those buildings that can accommodate large contiguous blocks while maintaining an acceptable floor plate size have proven to be the first off the market.
“THE 36 PROPERTIES THAT FELL WITHIN THE IDEAL RANGE
FOR BUILDING SIZE IN THE SUBMARKET (75,000-200,000 SQUARE FEET) HAD A VACANCY
RATE OF ONLY 2.4% – A FULL 7.2 PERCENTAGE POINTS BELOW THE
SUBMARKET AVERAGE.”
SAN FRANCISCO BAY AREA, CALIFORNIA: Santa Clara Submarket
36 P R O P E RT I ES
VAC A N C Y R AT E2.4%
BY THE NUMBERS
75,000 -200,000 sf
O N LY
T H E Y H AV E A
H AV E A B U I L D I N G S I Z E B E T W E E N
103 PROPERTIES
VAC A N C Y R AT E13.3%
less than 75,000 or greater than 200,000 sf
H OW E V E R
T H E Y H AV E A
H AV E A B U I L D I N G S I Z E

13Newmark Grubb Knight Frank12
OVERVIEW: SOUTHEAST SUBURBAN’S OBSOLESCENCE PROBLEM
The Southeast Suburban (SES) submarket is one of Denver’s premier suburban submarkets and is in fact larger in geography and inventory than Denver’s Central Business District. The submarket is home to the well-known Denver Tech Center and many financial and professional/business services tenants. These industries took a hit during the Great Recession but are now growing during the recovery, which has been a boon for the submarket. Another driver of growth in SES is the relatively new light rail system which runs directly through the submarket. In general, the transit-oriented developments on either side of I-25 are well leased and commanding above-market rental rates. Meanwhile, some properties that do not offer transit access and have not upgraded to keep up with the changing needs of Denver’s tenant base have taken years to lease up. WHAT MATTERS TO SOUTHEAST SUBURBAN’S TENANT BASE?
According to local market experts, access to transit and parking are the two most important metrics for tenants in SES. Accordingly, the seven properties that are within a quarter-mile of a transit stop and have a parking ratio of 4.5/1,000 square feet or higher have an average vacancy rate of only 1.7% – a full nine percentage points lower than the submarket average. This set of properties also commands an average asking rent of $25.09 per square foot – a $4.77 per square foot premium over the submarket as a whole. While it may seem counterintuitive, both parking and transit access are important requirements for SES tenants. Many of the executives and decision-makers who work in SES live to the south and drive to work, thus requiring generous parking ratios. Meanwhile, the same companies want to attract and retain the Millennial talent that favors transit access.
In SES, there were eight properties that met the ideal range for six out of six metrics and 27 that qualified for at least five out of the
six. The properties that meet at least five out of six metrics have a vacancy rate of 8.9% – 1.8 percentage points lower than the submarket average. Asking rents for this set of properties average $22.24 per square foot – $1.92 per square foot higher than the submarket as a whole. Meanwhile, the 23 properties that meet zero out of the six metrics have an average asking rent of only $15.56 per square foot – $4.76 per square foot lower than the overall submarket. As in Santa Clara, properties that check the box on all or most of tenants’ ideals are rewarded with lower vacancy. Tenants are willing to pay more for properties that meet their needs and clearly the SES market supports rent premiums for properties that can provide that value.
Buildings that have checked the box on parking and location and that go a step further to provide top amenities (such as a fitness center and food service in the building) can generally outpace the competition. According to the data, the 14 properties that meet the requirements on location, parking and amenities have a vacancy rate of 8.4% – 2.3 percentage points lower than the submarket average. These properties also command average asking rents of $24.08 per square foot – a $3.76 per square foot premium over the submarket as a whole. Since properties within the ideal range for parking and transit access have already proven to be top of the line for SES tenants, those that can adequately meet these requirements and also provide top amenities are rewarded with even lower vacancy and higher rents.
“THE 23 PROPERTIES THAT MEET ZERO OUT OF THE SIX METRICS
HAVE AN AVERAGE ASKING RENT OF ONLY $15.56 PER SQUARE FOOT – $4.76 PER SQUARE FOOT LOWER THAN THE OVERALL SUBMARKET.”
DENVER, COLORADO: Southeast Suburban Submarket
SOUTHEASTSUBURBAN
DENVER
DENVER, COLORADO: SOUTHEAST SUBURBAN SUBMARKET
According to our analysis, as much as 4.5 million square feet or 14% of the SES inventory is obsolete to one degree or another (meaning the space fits within either zero or just one of the ideal ranges for our six metrics). If the obsolescence challenge in SES is reflective of the rest of Denver’s suburban office market, this would suggest that approximately 9.3 million square feet of Denver’s 66.6 million square feet of suburban office inventory is obsolete.
Many of SES’s obsolete properties are well-leased as of today, and the collective vacancy
rate for these properties is slightly lower than the submarket average. However, a look at the average asking rents reveals these properties have asking rents a full $3.32 per square foot lower than the submarket average. This suggests that owners are aware that these properties do not meet tenants’ current requirements and are targeting tenants who are focused solely on occupancy cost.
Overall vacancy in SES has declined more than eight percentage points over the past six years. While SES still has a fair amount
of obsolete product as defined by this study, it becomes clear that when a submarket is successful overall, it is far more forgiving of obsolescence factors. With such outstanding market fundamentals and many properties that are ripe for redevelopment, the SES submarket is primed for a number of mixed-use and adaptive re-use developments in the near future.
QUANTIFYING SOUTHEAST SUBURBAN’S OBSOLESCENCE and Identifying the Path Forward
VACANCY RATE THAT IS
2.3PERCENTAGE POINTS LOWER
A S K I N G R E N T S
$3.76THAN THE OVERALL SUBMARKET
/SF HIGHER
LOCATION
PARKING
AMENITIES
BY THE NUMBERS
14 P R O P E RT I ES O N LY
T H E Y H AV E A
A N D
C H EC K T H E B O X O N
15Newmark Grubb Knight Frank14
OVERVIEW: O’HARE’S OBSOLESCENCE PROBLEM
The O’Hare submarket is located northwest of Chicago and has been one of Chicago’s most successful submarkets in this recovery cycle. It has direct access to mass transit, is near the region’s largest airport, and is closer to the city than some of Chicago’s other suburban submarkets. Its many successful properties are generally located closer to transit and have undergone renovations to modernize building features and systems. Those assets that are struggling with higher vacancy are dated buildings with a lack of highway and transit access. WHAT MATTERS TO O’HARE’S TENANT BASE?
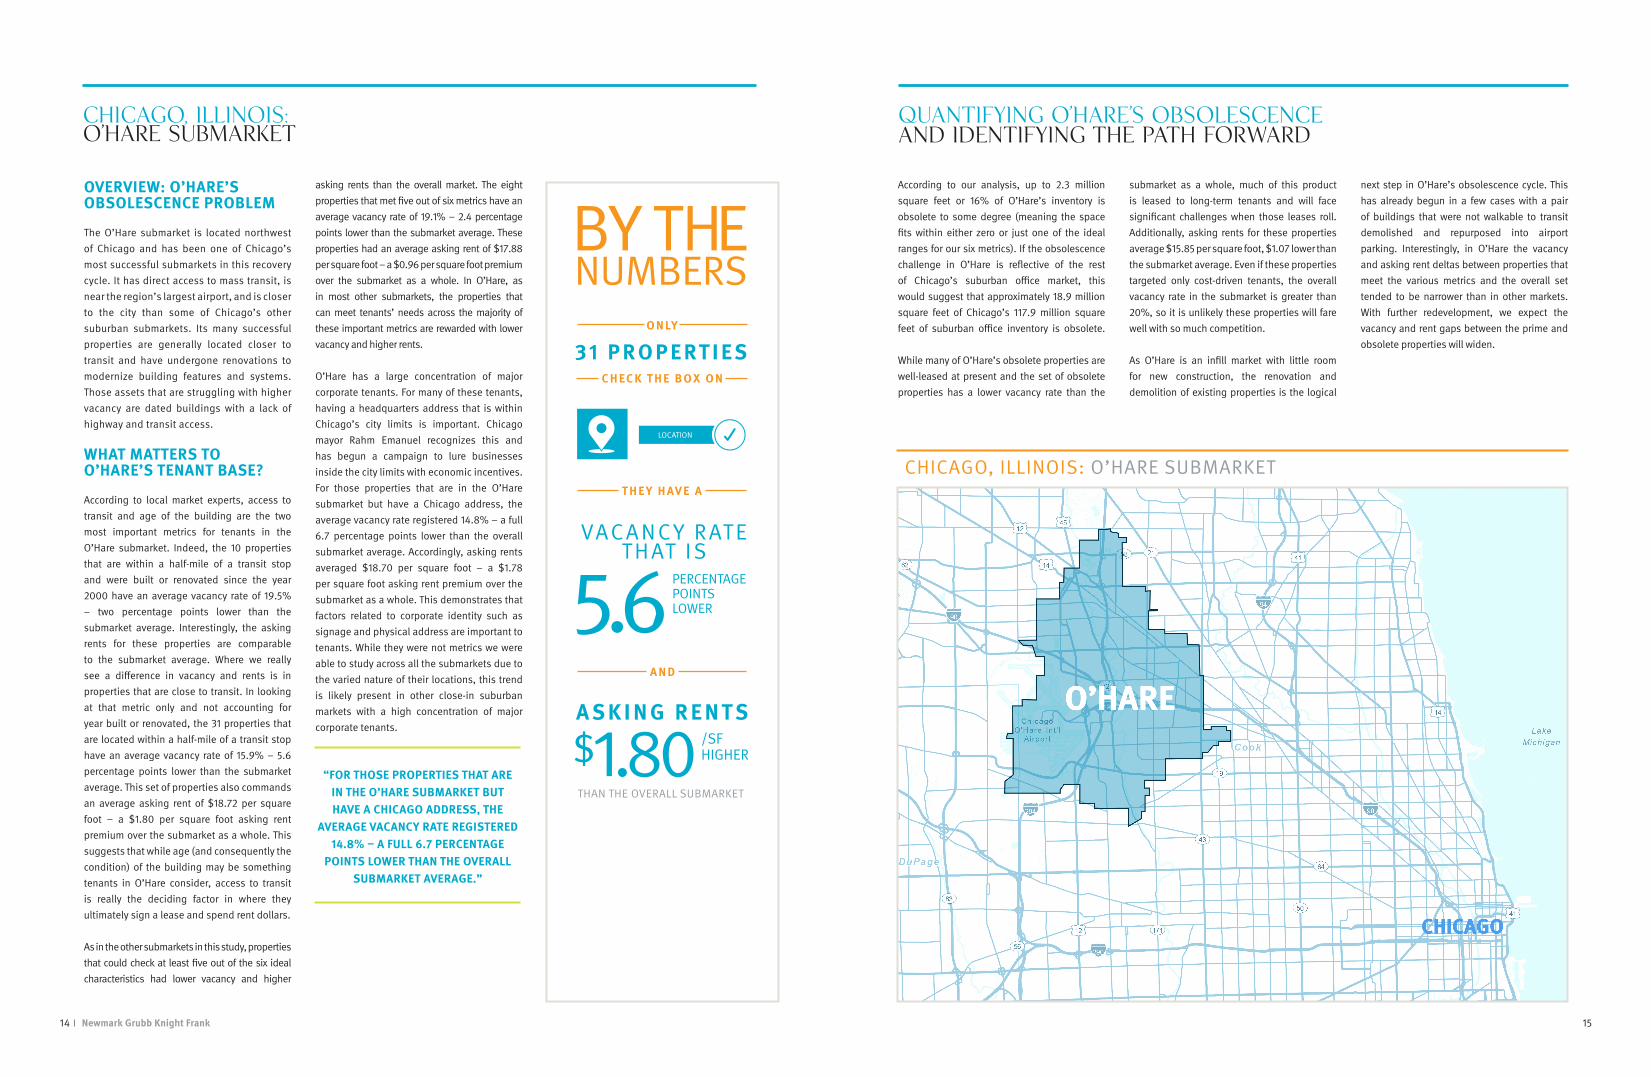
According to local market experts, access to transit and age of the building are the two most important metrics for tenants in the O’Hare submarket. Indeed, the 10 properties that are within a half-mile of a transit stop and were built or renovated since the year 2000 have an average vacancy rate of 19.5% – two percentage points lower than the submarket average. Interestingly, the asking rents for these properties are comparable to the submarket average. Where we really see a difference in vacancy and rents is in properties that are close to transit. In looking at that metric only and not accounting for year built or renovated, the 31 properties that are located within a half-mile of a transit stop have an average vacancy rate of 15.9% – 5.6 percentage points lower than the submarket average. This set of properties also commands an average asking rent of $18.72 per square foot – a $1.80 per square foot asking rent premium over the submarket as a whole. This suggests that while age (and consequently the condition) of the building may be something tenants in O’Hare consider, access to transit is really the deciding factor in where they ultimately sign a lease and spend rent dollars.
As in the other submarkets in this study, properties that could check at least five out of the six ideal characteristics had lower vacancy and higher
asking rents than the overall market. The eight properties that met five out of six metrics have an average vacancy rate of 19.1% – 2.4 percentage points lower than the submarket average. These properties had an average asking rent of $17.88 per square foot – a $0.96 per square foot premium over the submarket as a whole. In O’Hare, as in most other submarkets, the properties that can meet tenants’ needs across the majority of these important metrics are rewarded with lower vacancy and higher rents.
O’Hare has a large concentration of major corporate tenants. For many of these tenants, having a headquarters address that is within Chicago’s city limits is important. Chicago mayor Rahm Emanuel recognizes this and has begun a campaign to lure businesses inside the city limits with economic incentives. For those properties that are in the O’Hare submarket but have a Chicago address, the average vacancy rate registered 14.8% – a full 6.7 percentage points lower than the overall submarket average. Accordingly, asking rents averaged $18.70 per square foot – a $1.78 per square foot asking rent premium over the submarket as a whole. This demonstrates that factors related to corporate identity such as signage and physical address are important to tenants. While they were not metrics we were able to study across all the submarkets due to the varied nature of their locations, this trend is likely present in other close-in suburban markets with a high concentration of major corporate tenants.
“FOR THOSE PROPERTIES THAT ARE IN THE O’HARE SUBMARKET BUT HAVE A CHICAGO ADDRESS, THE
AVERAGE VACANCY RATE REGISTERED 14.8% – A FULL 6.7 PERCENTAGE
POINTS LOWER THAN THE OVERALL SUBMARKET AVERAGE.”
CHICAGO, ILLINOIS: O’Hare Submarket
CHICAGO
O’HARE
CHICAGO, ILLINOIS: O’HARE SUBMARKET
According to our analysis, up to 2.3 million square feet or 16% of O’Hare’s inventory is obsolete to some degree (meaning the space fits within either zero or just one of the ideal ranges for our six metrics). If the obsolescence challenge in O’Hare is reflective of the rest of Chicago’s suburban office market, this would suggest that approximately 18.9 million square feet of Chicago’s 117.9 million square feet of suburban office inventory is obsolete.
While many of O’Hare’s obsolete properties are well-leased at present and the set of obsolete properties has a lower vacancy rate than the
submarket as a whole, much of this product is leased to long-term tenants and will face significant challenges when those leases roll. Additionally, asking rents for these properties average $15.85 per square foot, $1.07 lower than the submarket average. Even if these properties targeted only cost-driven tenants, the overall vacancy rate in the submarket is greater than 20%, so it is unlikely these properties will fare well with so much competition.
As O’Hare is an infill market with little room for new construction, the renovation and demolition of existing properties is the logical
next step in O’Hare’s obsolescence cycle. This has already begun in a few cases with a pair of buildings that were not walkable to transit demolished and repurposed into airport parking. Interestingly, in O’Hare the vacancy and asking rent deltas between properties that meet the various metrics and the overall set tended to be narrower than in other markets. With further redevelopment, we expect the vacancy and rent gaps between the prime and obsolete properties will widen.
QUANTIFYING O’HARE’S OBSOLESCENCE and Identifying the Path Forward
VACANCY RATE THAT IS
5.6PERCENTAGE POINTS LOWER
A S K I N G R E N T S
$1.80THAN THE OVERALL SUBMARKET
/SF HIGHER
LOCATION
BY THE NUMBERS
31 P R O P E RT I ES O N LY
T H E Y H AV E A
A N D
C H EC K T H E B O X O N
17Newmark Grubb Knight Frank16
OVERVIEW: RESTON/HERNDON’S OBSOLESCENCE PROBLEM
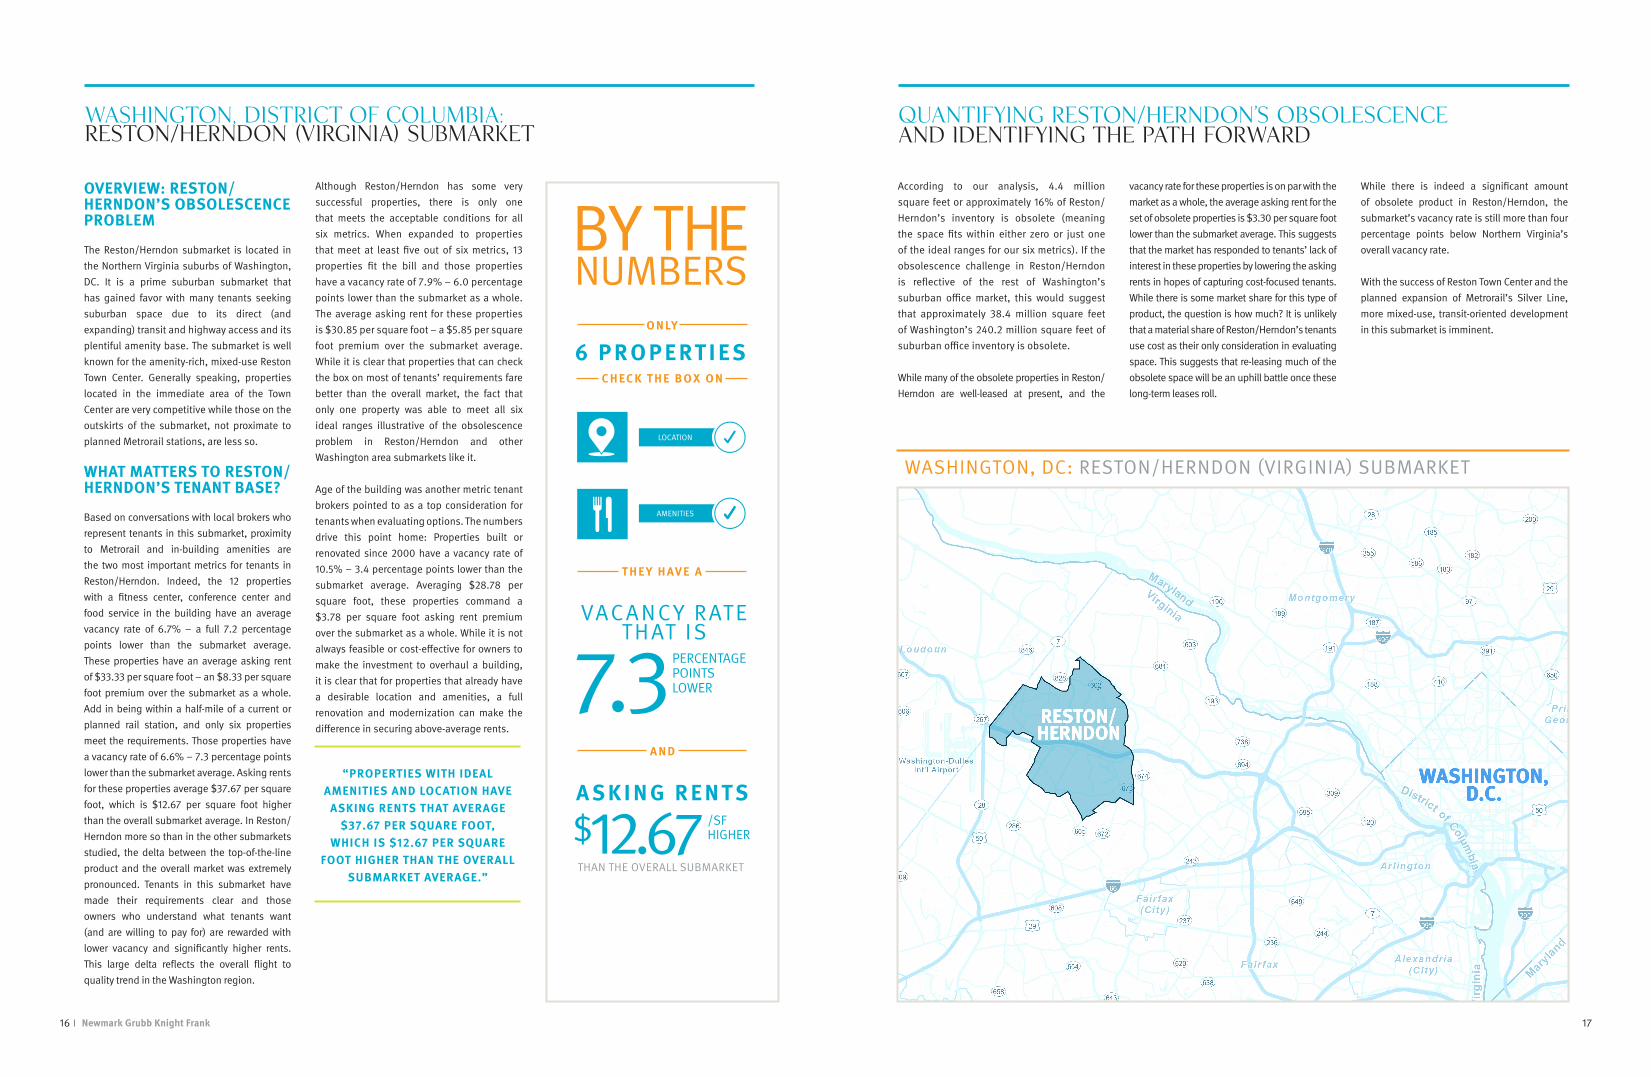
The Reston/Herndon submarket is located in the Northern Virginia suburbs of Washington, DC. It is a prime suburban submarket that has gained favor with many tenants seeking suburban space due to its direct (and expanding) transit and highway access and its plentiful amenity base. The submarket is well known for the amenity-rich, mixed-use Reston Town Center. Generally speaking, properties located in the immediate area of the Town Center are very competitive while those on the outskirts of the submarket, not proximate to planned Metrorail stations, are less so. WHAT MATTERS TO RESTON/HERNDON’S TENANT BASE?
Based on conversations with local brokers who represent tenants in this submarket, proximity to Metrorail and in-building amenities are the two most important metrics for tenants in Reston/Herndon. Indeed, the 12 properties with a fitness center, conference center and food service in the building have an average vacancy rate of 6.7% – a full 7.2 percentage points lower than the submarket average. These properties have an average asking rent of $33.33 per square foot – an $8.33 per square foot premium over the submarket as a whole. Add in being within a half-mile of a current or planned rail station, and only six properties meet the requirements. Those properties have a vacancy rate of 6.6% – 7.3 percentage points lower than the submarket average. Asking rents for these properties average $37.67 per square foot, which is $12.67 per square foot higher than the overall submarket average. In Reston/Herndon more so than in the other submarkets studied, the delta between the top-of-the-line product and the overall market was extremely pronounced. Tenants in this submarket have made their requirements clear and those owners who understand what tenants want (and are willing to pay for) are rewarded with lower vacancy and significantly higher rents. This large delta reflects the overall flight to quality trend in the Washington region.
Although Reston/Herndon has some very successful properties, there is only one that meets the acceptable conditions for all six metrics. When expanded to properties that meet at least five out of six metrics, 13 properties fit the bill and those properties have a vacancy rate of 7.9% – 6.0 percentage points lower than the submarket as a whole. The average asking rent for these properties is $30.85 per square foot – a $5.85 per square foot premium over the submarket average. While it is clear that properties that can check the box on most of tenants’ requirements fare better than the overall market, the fact that only one property was able to meet all six ideal ranges illustrative of the obsolescence problem in Reston/Herndon and other Washington area submarkets like it.
Age of the building was another metric tenant brokers pointed to as a top consideration for tenants when evaluating options. The numbers drive this point home: Properties built or renovated since 2000 have a vacancy rate of 10.5% – 3.4 percentage points lower than the submarket average. Averaging $28.78 per square foot, these properties command a $3.78 per square foot asking rent premium over the submarket as a whole. While it is not always feasible or cost-effective for owners to make the investment to overhaul a building, it is clear that for properties that already have a desirable location and amenities, a full renovation and modernization can make the difference in securing above-average rents.
“PROPERTIES WITH IDEAL AMENITIES AND LOCATION HAVE
ASKING RENTS THAT AVERAGE $37.67 PER SQUARE FOOT,
WHICH IS $12.67 PER SQUARE FOOT HIGHER THAN THE OVERALL
SUBMARKET AVERAGE.”
WASHINGTON, DISTRICT OF COLUMBIA: Reston/Herndon (Virginia) Submarket
RESTON/HERNDON
WASHINGTON, D.C.
WASHINGTON, DC: RESTON/HERNDON (VIRGINIA) SUBMARKET
According to our analysis, 4.4 million square feet or approximately 16% of Reston/Herndon’s inventory is obsolete (meaning the space fits within either zero or just one of the ideal ranges for our six metrics). If the obsolescence challenge in Reston/Herndon is reflective of the rest of Washington’s suburban office market, this would suggest that approximately 38.4 million square feet of Washington’s 240.2 million square feet of suburban office inventory is obsolete.
While many of the obsolete properties in Reston/Herndon are well-leased at present, and the
vacancy rate for these properties is on par with the market as a whole, the average asking rent for the set of obsolete properties is $3.30 per square foot lower than the submarket average. This suggests that the market has responded to tenants’ lack of interest in these properties by lowering the asking rents in hopes of capturing cost-focused tenants. While there is some market share for this type of product, the question is how much? It is unlikely that a material share of Reston/Herndon’s tenants use cost as their only consideration in evaluating space. This suggests that re-leasing much of the obsolete space will be an uphill battle once these long-term leases roll.
While there is indeed a significant amount of obsolete product in Reston/Herndon, the submarket’s vacancy rate is still more than four percentage points below Northern Virginia’s overall vacancy rate. With the success of Reston Town Center and the planned expansion of Metrorail’s Silver Line, more mixed-use, transit-oriented development in this submarket is imminent.
QUANTIFYING RESTON/HERNDON’S OBSOLESCENCE and Identifying the Path Forward
VACANCY RATE THAT IS
7.3PERCENTAGE POINTS LOWER
A S K I N G R E N T S
$12.67THAN THE OVERALL SUBMARKET
/SF HIGHER
LOCATION
BY THE NUMBERS
6 P R O P E RT I ES O N LY
T H E Y H AV E A
A N D
AMENITIES
C H EC K T H E B O X O N
19Newmark Grubb Knight Frank18
OVERVIEW: PARSIPPANY’S OBSOLESCENCE PROBLEM
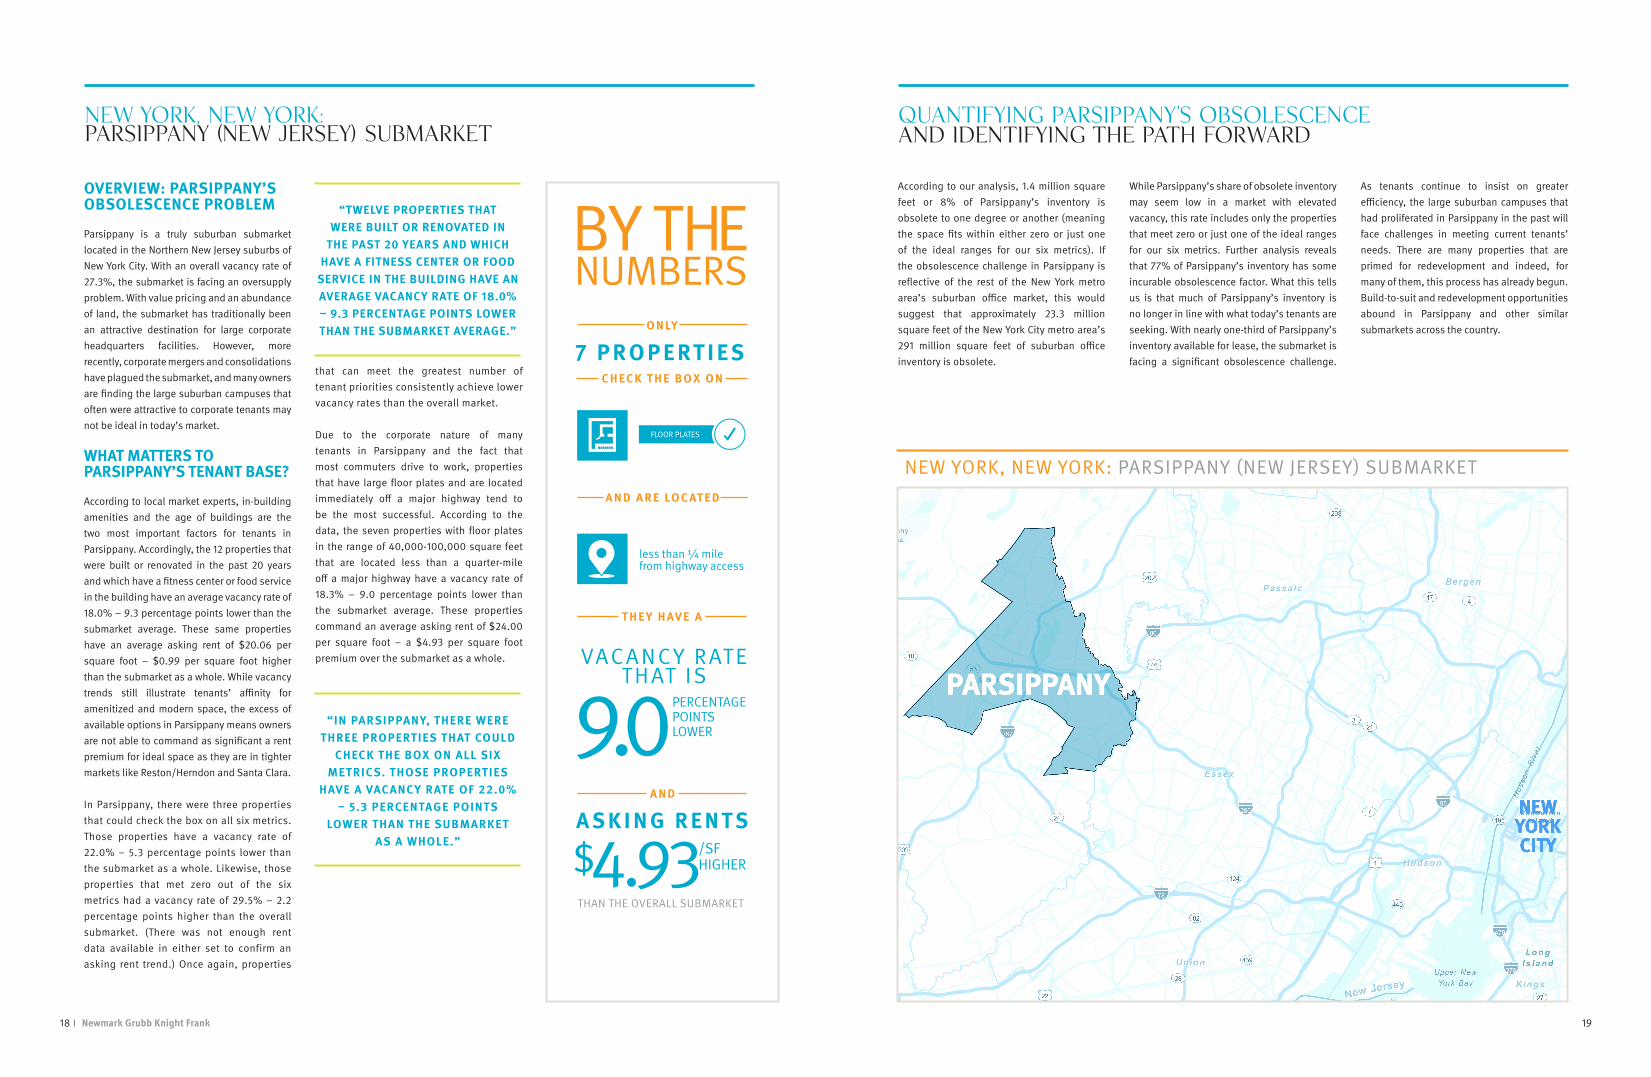
Parsippany is a truly suburban submarket located in the Northern New Jersey suburbs of New York City. With an overall vacancy rate of 27.3%, the submarket is facing an oversupply problem. With value pricing and an abundance of land, the submarket has traditionally been an attractive destination for large corporate headquarters facilities. However, more recently, corporate mergers and consolidations have plagued the submarket, and many owners are finding the large suburban campuses that often were attractive to corporate tenants may not be ideal in today’s market. WHAT MATTERS TO PARSIPPANY’S TENANT BASE?
According to local market experts, in-building amenities and the age of buildings are the two most important factors for tenants in Parsippany. Accordingly, the 12 properties that were built or renovated in the past 20 years and which have a fitness center or food service in the building have an average vacancy rate of 18.0% – 9.3 percentage points lower than the submarket average. These same properties have an average asking rent of $20.06 per square foot – $0.99 per square foot higher than the submarket as a whole. While vacancy trends still illustrate tenants’ affinity for amenitized and modern space, the excess of available options in Parsippany means owners are not able to command as significant a rent premium for ideal space as they are in tighter markets like Reston/Herndon and Santa Clara.
In Parsippany, there were three properties that could check the box on all six metrics. Those properties have a vacancy rate of 22.0% – 5.3 percentage points lower than the submarket as a whole. Likewise, those properties that met zero out of the six metrics had a vacancy rate of 29.5% – 2.2 percentage points higher than the overall submarket. (There was not enough rent data available in either set to confirm an asking rent trend.) Once again, properties
that can meet the greatest number of tenant priorities consistently achieve lower vacancy rates than the overall market.
Due to the corporate nature of many tenants in Parsippany and the fact that most commuters drive to work, properties that have large floor plates and are located immediately off a major highway tend to be the most successful. According to the data, the seven properties with floor plates in the range of 40,000-100,000 square feet that are located less than a quarter-mile off a major highway have a vacancy rate of 18.3% – 9.0 percentage points lower than the submarket average. These properties command an average asking rent of $24.00 per square foot – a $4.93 per square foot premium over the submarket as a whole.
“TWELVE PROPERTIES THAT WERE BUILT OR RENOVATED IN
THE PAST 20 YEARS AND WHICH HAVE A FITNESS CENTER OR FOOD
SERVICE IN THE BUILDING HAVE AN AVERAGE VACANCY RATE OF 18.0% – 9.3 PERCENTAGE POINTS LOWER THAN THE SUBMARKET AVERAGE.”
“IN PARSIPPANY, THERE WERE THREE PROPERTIES THAT COULD
CHECK THE BOX ON ALL SIX METRICS. THOSE PROPERTIES
HAVE A VACANCY RATE OF 22.0% – 5.3 PERCENTAGE POINTS
LOWER THAN THE SUBMARKET AS A WHOLE.”
NEW YORK, NEW YORK: Parsippany (New Jersey) Submarket
PARSIPPANY
NEW YORKCITY
NEW YORK, NEW YORK: PARSIPPANY (NEW JERSEY) SUBMARKET
According to our analysis, 1.4 million square feet or 8% of Parsippany’s inventory is obsolete to one degree or another (meaning the space fits within either zero or just one of the ideal ranges for our six metrics). If the obsolescence challenge in Parsippany is reflective of the rest of the New York metro area’s suburban office market, this would suggest that approximately 23.3 million square feet of the New York City metro area’s 291 million square feet of suburban office inventory is obsolete.
While Parsippany’s share of obsolete inventory may seem low in a market with elevated vacancy, this rate includes only the properties that meet zero or just one of the ideal ranges for our six metrics. Further analysis reveals that 77% of Parsippany’s inventory has some incurable obsolescence factor. What this tells us is that much of Parsippany’s inventory is no longer in line with what today’s tenants are seeking. With nearly one-third of Parsippany’s inventory available for lease, the submarket is facing a significant obsolescence challenge.
As tenants continue to insist on greater efficiency, the large suburban campuses that had proliferated in Parsippany in the past will face challenges in meeting current tenants’ needs. There are many properties that are primed for redevelopment and indeed, for many of them, this process has already begun. Build-to-suit and redevelopment opportunities abound in Parsippany and other similar submarkets across the country.
QUANTIFYING PARSIPPANY’S OBSOLESCENCE and Identifying the Path Forward
VACANCY RATE THAT IS
9.0PERCENTAGE POINTS LOWER
A S K I N G R E N T S
$4.93THAN THE OVERALL SUBMARKET
/SF HIGHER
BY THE NUMBERS
T H E Y H AV E A
A N D
7 P R O P E RT I ES O N LY
A N D A R E LO C AT E D
FLOOR PLATES
less than ¼ mile from highway access
C H EC K T H E B O X O N
21Newmark Grubb Knight Frank20
CONCLUSION: What Can Suburban Office Owners, Prospective Investors, and Tenants Learn from the Obsolescence Challenge?
Suburban office building obsolescence has increasingly become a topic of discussion among those who have a stake in suburban office space. Largely absent from these discussions has been an assessment of the scale of obsolescence and what the potential solutions are. In quantifying obsolescence it is our hope to evaluate the root causes of obsolescence, determine what can be done to remedy it, and understand its impact on market statistics.
One notable finding of this study is that so few properties meet the ideal on every metric studied. Of over 1,000 properties analyzed across the five submarkets, only ten properties meet the acceptable range for all six of the metrics studied. This would suggest that 99% of properties in the suburban inventory have some feature that is not in line with what today’s tenants desire. But this is not surprising; obsolescence begins as soon as a building is put into service since tenant preferences and requirements are always evolving and not every metric is changeable. Across the five data sets, 297 properties or 29% of the buildings studied failed to meet the ideal range for all of the incurable obsolescence metrics (location, floor plate size, and building size). If these data sets are representative of other major U.S. suburban markets – and more research is needed but based on anecdotal evidence we believe they are – it becomes clear that obsolescence is a critical problem facing America’s suburban office markets. Having found that a significant share of the inventory in these representative markets is indeed obsolete by today’s standards, the question becomes: What should office asset owners do to address this problem? While this study is primarily aimed to quantify the amount of obsolete space present in these markets, an equally important element is to determine which characteristics make a property most successful. It is valuable to quantify how much space is obsolete, but it is more constructive to look at what
can be done to improve competitiveness in those properties that are lacking key traits. Across all five of the submarkets examined, those properties that could check the box on at least five out of six metrics consistently outperformed the overall market; those that were lacking on a majority of the metrics consistently were consigned to have below-market rents. Though it will not pencil financially for every property in every market, remedying the curable obsolescence factors is a way to increase occupancy and rents in an overwhelming majority of properties.
In looking at these representative markets, it is important to note that every submarket and every tenant base is unique. The properties that record significantly lower vacancy rates and higher asking rents than the submarket averages consistently meet the ideal ranges for key metrics that are identified by local market experts as being most important to that submarket’s tenant base. Indeed, the most important metrics are not the same in each market. In Denver SES, properties located close to transit consistently came in below the market’s average vacancy rate. In Parsippany, the deciding factor for outperforming the market is being within a quarter-mile of a highway (not mass transit). In Reston/Herndon, modern properties with ample parking and amenities consistently
come out on top. Owners of the most successful properties are in tune with the tenant base they are targeting and the specific and unique needs of those tenants.
Though it is not possible to simply prescribe a set of building upgrades that will cure the obsolescence problem once and for all, owners who are struggling to gain or maintain market share in today’s competitive suburban market have opportunities available that are proven to increase competitiveness.
Meanwhile, suburban tenants are an important part of this equation. While most discussions about suburban office obsolescence focus on the owners and managers of these properties, it is important for suburban tenants to be aware of the disconnect between what they and their peers are seeking and what is available in the market. Tenants who are considering a move, a lease renewal, or a lease renegotiation can use the obsolescence problem to their advantage.
And of course, there are opportunities for potential investors in office assets – and also potholes to avoid. The investor with capital to deploy and an appetite for leasing risk can find many leasing-challenged, obsolete properties to buy. The art of these deals is to select those opportunities with curable obsolescence in a strong market where the price and eventual value leave plenty of room for the upgrade cost. On the other hand, some deals for stale stock are best left alone – those with incurable obsolescence or where the cost to cure obsolescence cannot be rewarded with sufficient yield upon lease-up.
With this in mind, opportunities exist for owners of suburban office buildings, investors searching for deals, and the tenants who occupy obsolete properties. As mentioned earlier, tenant preferences vary by location and the specific tenant makeup of that submarket. However, the following action steps apply to many tenant types and circumstances.
“SUBURBAN OFFICE BUILDING OBSOLESCENCE HAS INCREASINGLY
BECOME A TOPIC OF DISCUSSION AMONG THOSE WHO HAVE A STAKE IN SUBURBAN OFFICE
SPACE. LARGELY ABSENT FROM THESE DISCUSSIONS HAS BEEN
AN ASSESSMENT OF THE SCALE OF OBSOLESCENCE AND WHAT THE POTENTIAL SOLUTIONS ARE.”
V
ACTION STEPS for Owners and PROSPECTIVE Investors
� Use our decision-making flow chart on the following page to determine where your property falls on the obsolescence spectrum. Is there a business case for making improvements to increase competitiveness? Of course, whether or not these improvements will be a worthwhile investment will depend on local market conditions and the extent of the changes needed.
� Be knowledgeable about your tenant base. If there is some feature of your property that is less than ideal for the broader market, is there a unique tenant type that might better fit the product you are offering?
� Assess how your property fares on the curable obsolescence metrics. Is there some amenity or improvement most tenants are seeking? Since it is generally less expensive to renew current tenants than to market space, negotiate new leases, and fund concessions, proactively determining what will retain current tenants and then following through on those improvements will often pay off in the long run.
� If your property is incurably obsolete, consider the highest and best use of the property. Do market fundamentals in your area support repurposing to residential
or retail, or to some form of a mixed-use development? In some cases and in some markets, the land may be more valuable than the existing improved asset.
� Once you have determined there is a business case for completing a renovation, examine economic trends to determine ideal timing for delivery of the renovated building. Based on the office-using job cycle, NGKF forecasts an overall office tightening in coming years with a peak U.S. landlord market in 2017-2018. Individual markets will vary based on local conditions.
ACTION STEPS for Tenants
� When assessing real estate needs, determine which of the six metrics (or others) are most important to your employees. If your lease is expiring in the near term, determine if your current building fits your employees’ needs across all six metrics. If your current location is lacking, now may be an ideal time to take advantage of softer market conditions to either renegotiate your lease at more favorable terms or find a property that better meets your criteria within your price range.
� Assess the type of talent you are trying to attract and retain. Ensure your space not only meets the needs of current employees but also those you would like to recruit.
� Re-evaluate your needs. Being outside the mainstream on one or more of these metrics can be a huge advantage. If sales employees are expected to lunch with clients or prospects most days of the week, you may not need a restaurant in the building. If your business functions best when all employees are on one floor, maybe a larger than average floor plate is ideal for you. If there is some type of product that is suitable for your needs but not for the broader market, leverage your firm’s unique qualities.
� If you like your location but your building is lacking in some curable factor, initiate negotiations with your landlord for upgrades. In many cases,
landlords may already be considering substantial renovations but need to be mindful not to disrupt the operations of existing tenants. Since it is in the best interest of the landlord to retain current tenants, you may be able to move to better space within the building and/or renegotiate terms of an existing lease to accommodate renovations.
23
CONSIDER.
ASSESS COST OF BUILDING
RENOVATIONS. DO UPGRADES TO
SYSTEMS, FAÇADE, AND LOBBY MAKE
FINANCIAL SENSE?
CONSIDER.
ASSESS COST OF ADDING AMENITIES
BASED ON NEEDS OF TARGETED TENANT BASE. IS BUSINESS CASE FOR
ADDING AMENITIES SENSIBLE?
CONSIDER.
ASSESS COST OF EXPANDING STRUCTURED
OR SURFACE PARKING. ARE EITHER OF THESE
OPTIONS COST-EFFECTIVE?
IF NOT BUILT IN THE LAST 10-15
YEARS, HAS THE BUILDING BEEN
RENOVATED RECENTLY?
YesNo
No
IS THE PARKING RATIO
ACCEPTABLE FOR YOUR
SUBMARKET?
ARE THE FLOOR PLATES AN
ACCEPTABLE SIZE FOR YOUR SUBMARKET?
IS IT WALKABLE TO NEIGHBORHOOD
AMENITIES?
IS THE PROPERTY WALKABLE TO
PUBLIC TRANSIT OR DOES IT HAVE GOOD HIGHWAY
ACCESS?
START
IS THE BUILDING AN ACCEPTABLE SIZE FOR YOUR SUBMARKET?
Yes Yes
Yes
Yes
Yes
Yes
Yes
No
No
No
No
No
DOES IT HAVE IN-BUILDING
AMENITIES SUCH AS CONFERENCE CENTER, FITNESS
CENTER AND FOOD SERVICE?
MO
RE
OB
SO
LE
TE
MO
RE
CO
MP
ET
ITIV
E
YesNo
No
No
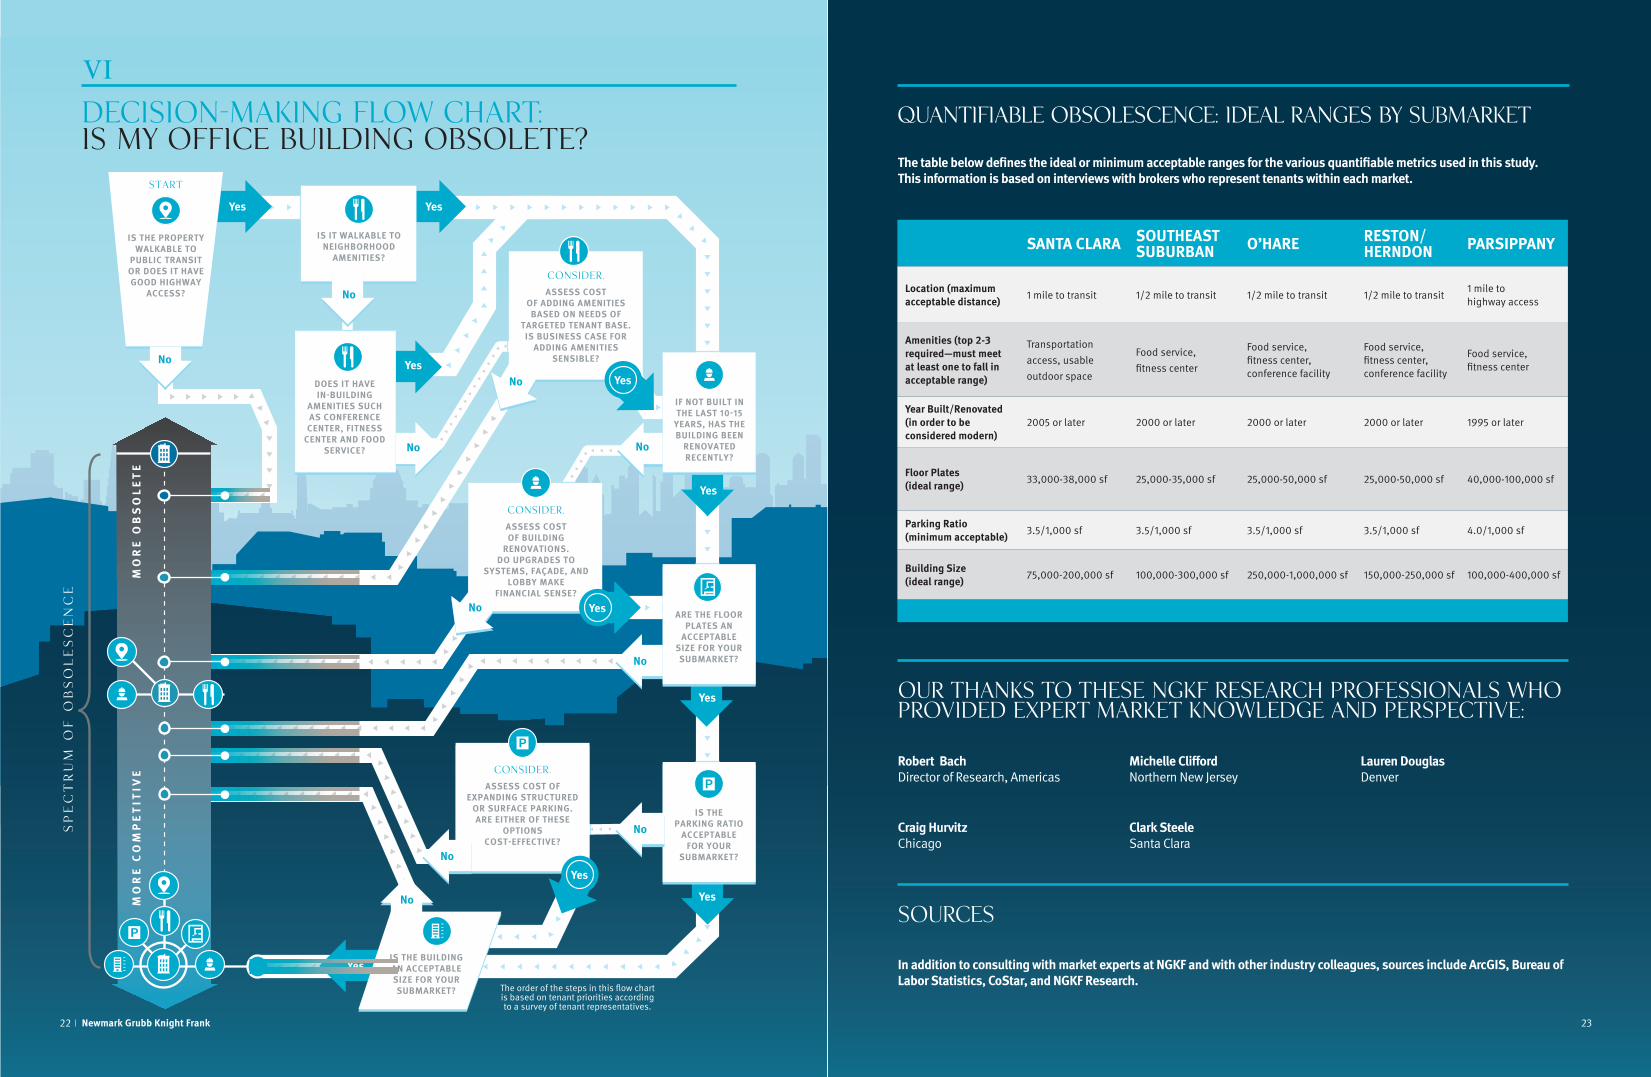
The order of the steps in this flow chart is based on tenant priorities according to a survey of tenant representatives.
Yes
SP
EC
TR
UM
OF
OB
SO
LE
SC
EN
CE
No
22 Newmark Grubb Knight Frank
DECISION-MAKING FLOW CHART: Is My Office Building Obsolete?
VI
OUR THANKS to these NGKF research Professionals who provided expert market knowledge and perspective:
Robert Bach Director of Research, Americas
Michelle Clifford Northern New Jersey
Lauren Douglas Denver
SOURCES
SANTA CLARA SOUTHEAST SUBURBAN O’HARE RESTON/
HERNDON PARSIPPANY
Location (maximum acceptable distance) 1 mile to transit 1/2 mile to transit 1/2 mile to transit 1/2 mile to transit
1 mile to highway access
Amenities (top 2-3 required—must meet at least one to fall in acceptable range)
Transportation access, usable outdoor space
Food service, fitness center
Food service, fitness center, conference facility
Food service, fitness center, conference facility
Food service, fitness center
Year Built/Renovated (in order to be considered modern)
2005 or later 2000 or later 2000 or later 2000 or later 1995 or later
Floor Plates (ideal range) 33,000-38,000 sf 25,000-35,000 sf 25,000-50,000 sf 25,000-50,000 sf 40,000-100,000 sf
Parking Ratio (minimum acceptable) 3.5/1,000 sf 3.5/1,000 sf 3.5/1,000 sf 3.5/1,000 sf 4.0/1,000 sf
Building Size (ideal range) 75,000-200,000 sf 100,000-300,000 sf 250,000-1,000,000 sf 150,000-250,000 sf 100,000-400,000 sf
QUANTIFIABLE OBSOLESCENCE: IDEAL RANGES BY SUBMARKET
In addition to consulting with market experts at NGKF and with other industry colleagues, sources include ArcGIS, Bureau of Labor Statistics, CoStar, and NGKF Research.
The table below defines the ideal or minimum acceptable ranges for the various quantifiable metrics used in this study. This information is based on interviews with brokers who represent tenants within each market.
Craig Hurvitz Chicago
Clark Steele Santa Clara
All information contained in this publication is derived from sources that are deemed to be reliable. However, Newmark Grubb Knight Frank (NGKF) has not verified any such information, and the
same constitutes the statements and representations only of the source thereof, and not of NGKF. Any recipient of this publication should independently verify such information and all other
information that may be material to any decision that recipient may make in response to this publication, and should consult with professionals of the recipient’s choice with regard to all aspects
of that decision, including its legal, financial, and tax aspects and implications. Any recipient of this publication may not, without the prior written approval of NGKF, distribute, disseminate,
publish, transmit, copy, broadcast, upload, download, or in any other way reproduce this publication or any of the information it contains.
NEWMARK GRUBB KNIGHT FRANK RESEARCH REPORTS ARE ALSO AVAILABLE AT WWW.NGKF.COM/RESEARCH.
www.ngkf.com/research
Delaware Wilmington
District of Columbia Washington, DC
Florida Boca Raton Jacksonville Miami Orlando Sarasota Tampa
Georgia Atlanta St. Simons Island
Hawaii Honolulu
Illinois Chicago
Indiana Indianapolis Mishawaka
Maryland Baltimore
Massachusetts Boston
Michigan Detroit Grand Rapids
Missouri Kansas City St. Louis
Nevada Las Vegas
New Jersey Central, East Brunswick Northern, Rutherford Southern, Marlton
New York New York Long Island Westchester
North Carolina Charlotte Raleigh
North Dakota Fargo
Ohio Cleveland Columbus
Oklahoma Oklahoma City Tulsa
Oregon Portland
Pennsylvania Philadelphia Pittsburgh Wayne
South Carolina Charleston Columbia Greenville Myrtle Beach
Tennessee Memphis
Texas Austin Dallas Houston McAllen
Utah American Fork Clearfield Salt Lake City
Virginia Tysons Corner
Washington Seattle
Wisconsin Appleton Green Bay Madison Wausau
CANADA Calgary Edmonton Halifax Moncton Montreal Ottawa Québec City Toronto Vancouver
MEXICO Ciudad Juarez Guanajuato Mexico City Monterrey Queretaro Saltillo San Luis Potosi
USA Alabama Mobile
Arizona Phoenix
Arkansas Bentonville Little Rock
California Bakersfield Emeryville Fresno Hayward Los Angeles Newport Beach Ontario Palo Alto Pleasanton Roseville Sacramento San Diego San Francisco San Mateo San Rafael Santa Ana Santa Clara Santa Rosa Visalia Walnut Creek
Colorado Colorado Springs Denver
Connecticut Hartford Stamford
Gregory H. Leisch, CRESenior Managing DirectorMarket [email protected]
Alexander (Sandy) Paul, CREManaging DirectorNational Market [email protected]
Marianne (Swearingen) SkorupskiResearch [email protected]
Bethany SchneiderSenior Research [email protected]
Richard SmithResearch [email protected]
Washington, DC 1899 Pennsylvania Avenue, NW Suite 300 Washington, DC 20006 202.331.7000
Tysons 1410 Spring Hill Road Suite 600 McLean, VA 22102 703.448.2000
Baltimore 400 East Pratt Street Suite 710 Baltimore, MD 21202 410.625.4200