Embed Size (px)
Citation preview

Toward an imminent extinction of Colombian glaciers?
Antoine Rabatel1, Jorge Luis Ceballos2, Natan Micheletti3, Ekkehard Jordan4, Michael
Braitmeier4, Javier Gonzales4, Nico Mölg5, Michael Zemp5, Christian Huggel5
(1) Univ. Grenoble Alpes, CNRS, IRD, Institut des Géosciences de l’Environnement (IGE), Grenoble, France
(2) IDEAM, Bogota, Colombia
(3) Institute of Earth Surface Dynamics, University of Lausanne, Switzerland
(4) Heinrich-Heine-Universität, Düsseldorf, Germany
(5) Institute Department of Geography, University of Zurich, Switzerland
Suggested journal: Geografiska Annaler: Series A, Physical Geography
Corresponding author:
Dr. Antoine Rabatel
Institut des Géosciences de l’Environnement
54 rue Molière,
38400 Saint Martin d’Hères, France
E-mail: [email protected]
1
2
3
4
5
6
7
8
9
10
11
12
13
14
15
1617181920
21

ABSTRACT. (< 250 words)
This study documents the current state of the glacier coverage in the Colombian Andes, the
glacier shrinkage over the 20th century and discuss indications of their disappearance in the
coming decades. Satellite images have been used to update the glacier inventory of Colombia
reflecting an overall glacier extent of about 41 km2 in 2016 distributed in four glacierized
mountain ranges. Combining these data with older inventories, we show that the current
extent is 40% less than in the mid-1990s, and 65% less than in the mid-20th century, and
almost 90% less during LIA maximum extents.
Focusing on the Nevado Santa Isabel in the Parque Nacional de los Nevados, aerial
photographs from 1987 and 2005 combined with a terrestrial Lidar survey show that the mass
loss of the former ice cap, which is nowadays parceled into several small glaciers, was about -
2.5 m w.e. yr-1 during the last three decades. Radar measurements performed on one of the
remnant glaciers, La Conejeras glacier, show that the ice thickness is limited (about 20 m in
average) and that with such a mass loss rate, the glacier should disappear in the coming years.
At the scale of the Colombian Andes, due to their imbalance with current climate conditions,
their limited altitudinal extent and their relatively low uppermost altitude (i.e. < 5400 m a.s.l.),
most of the Colombian glaciers will most likely disappear in the coming decades and only the
largest ones located on the highest summits will probably persist until the mid-21 st century
although very reduced.
KEY WORDS. Glaciers, surface area changes, tropical Andes, Colombia
22
23
24
25
26
27
28
29
30
31
32
33
34
35
36
37
38
39
40
41
42
43

1. INTRODUCTION
Glaciers in Colombia are more than ice on mountains: they indeed are key components of the
landscapes lived by the Colombian society (Ceballos et al., 2012). For peasants, indigenous,
mountain climbers, artists, scientists and city dwellers, glaciers in Colombia fulfill different
functions within their territories and are part of their daily practices in different ways: from
sentinels of global climate changes, local water resources, local-to-regional sources of hazards
as glaciers in the Cordillera Central of Colombia are frequently located on active volcanoes
(Thouret, 1990; Huggel et al., 2007). The increasing ice loss of Colombian glaciers since the
late 1970s, (Ceballos et al., 2006; Morris et al., 2006; Poveda and Pineda, 2009), like
everywhere in the tropical Andes (Rabatel et al., 2013a), has strengthened the necessity of a
glacier monitoring combining repeated inventories at the national scale and in-situ
measurements on reference benchmark glaciers located in the two mostly glacierized
mountain ranges of Colombia (e.g., Ceballos et al., 2012; Mölg et al., 2017). Such a
monitoring strategy is in line with the international strategy for glacier monitoring defined by
the Global Terrestrial Network for Glaciers (GTN-G, gtn-g.org). Nowadays, in-situ
measurements are conducted by the Instituto de Hidrología, Meteorología y Estudios
Ambientales (IDEAM). These activities are part of different international programs: the joint
international laboratory GREAT-ICE (Sicart et al., 2015) financed by the French Institut de
Recherche pour le Développement (IRD), the World Glacier Monitoring Service (wgms.ch),
and the CATCOS project (Capacity Building and Twinning for Climate Observing Systems)
financed by the Swiss Agency for Development and Cooperation (SDC).
The aims of this paper are: 1) to present the current state of glaciers in Colombia, with the
results of a new glacier inventory from 2016; 2) to draw a multi-decadal perspective of
changes in glacier surface-area using repeated glacier inventories since the mid-20 th Century
44
45
46
47
48
49
50
51
52
53
54
55
56
57
58
59
60
61
62
63
64
65
66
67

and LIA maximum extents; and 3) to estimate the future evolution of glaciers in Colombia on
the basis of the up-to-date inventory and current surface-area and mass loss rates.
2. STUDY AREA
Glaciers in Colombia are located in four main areas (Fig. 1): from North to South: Sierra
Nevada de Santa Marta (about 10°50’ N; 73°40’ W), Sierra Nevada de El Coquy (about
6°25’ N; 72°20’ W), Cordillera Central: cadena Ruiz-Santa Isabel-Tolima (about 4°45’ N;
75°20’ W), and Cordillera Central: Nevado Huila (about 2°55’ N; 76°00’ W). In the two
northernmost areas, small slope glaciers can be found, whereas in the two southernmost areas,
small ice caps lying on more or less active volcanoes (e.g., Nevado del Ruiz, Nevado del
Huila) are the dominant glacier type.
Figure 1: Glacierized areas in Colombia. The spectral bands combination used
for the Landsat8 images involves the bands #6 (middle infra-red: MIR), #5
(short-wave infra-red: SWIR) and #3 (green).
68
69
70
71
72
73
74
75
76
77
78
79
80
81
82

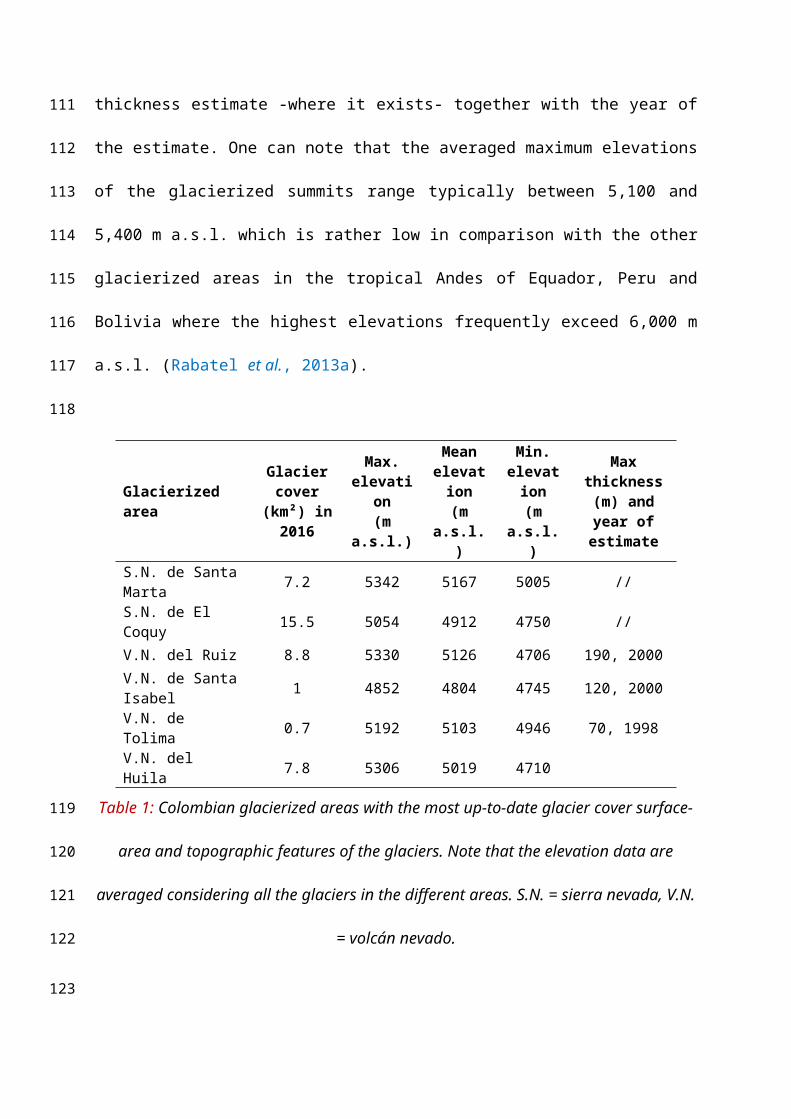
Table 1 lists the main characteristics of the glacierized areas of Colombia, with the glacier
cover in 2016, the maximum ice thickness estimate -where it exists- together with the year of
the estimate. One can note that the averaged maximum elevations of the glacierized summits
range typically between 5,100 and 5,400 m a.s.l. which is rather low in comparison with the
other glacierized areas in the tropical Andes of Equador, Peru and Bolivia where the highest
elevations frequently exceed 6,000 m a.s.l. (Rabatel et al., 2013a).
Glacierized areaGlacier
cover (km²) in 2016
Max. elevation(m a.s.l.)
Mean elevation(m a.s.l.)
Min. elevation(m a.s.l.)
Max thickness (m) and year of estimate
S.N. de Santa Marta 7.2 5342 5167 5005 //
S.N. de El Coquy 15.5 5054 4912 4750 //
V.N. del Ruiz 8.8 5330 5126 4706 190, 2000
V.N. de Santa Isabel 1 4852 4804 4745 120, 2000
V.N. de Tolima 0.7 5192 5103 4946 70, 1998
V.N. del Huila 7.8 5306 5019 4710
Table 1: Colombian glacierized areas with the most up-to-date glacier cover surface-area
and topographic features of the glaciers. Note that the elevation data are averaged
considering all the glaciers in the different areas. S.N. = sierra nevada, V.N. = volcán
nevado.
From a climatological point of view, Colombia belongs to the inner tropics (Troll, 1941) with
almost unchanged humidity, homogeneous temperature and almost constant incident solar
radiation throughout the year. At the seasonal scale, the displacement of the inter-tropical
convergence zone (ITCZ) strongly controls the annual regime of precipitation which results to
be contrasted from one region to the other at the country scale (e.g., Poveda et al., 2005). The
central and western parts of Colombia (glacierized areas C and D on Fig. 1) experience a
bimodal precipitation regime with two periods of high precipitation (April-May and October-
83
84
85
86
87
88
89
90
91
92
93
94
95
96
97
98
99
100
101

November) and two periods of less precipitation (December-February and June-August). On
the other hand, the Caribbean coast (glacierized area A on Fig. 1) and the Pacific coast of the
isthmus with Panama show a unimodal precipitation regime (May-October), resulting from
the northernmost position of the ITCZ. The eastern side the eastern Andes (glacierized area B
on Fig. 1) also experiments a single precipitation peak occurring during June-August which
results from deep convection of the moisture transported from the Amazon basin due to the
orographic barrier of the Andes.
The inter-annual variability of atmospheric conditions is dominated by the El Niño-Southern
Oscillation (ENSO). Although the climate characteristics of La Niña/El Niño events are not
uniform at the scale of a country, El Niño years (warm phase of ENSO) tend to be warmer
and drier, while La Niña years (cold phase of ENSO) are associated with colder and wetter
conditions in the mountains.
3. METHODS AND DATA
3.1. Quantification of glacier surface-area
Former studies have documented the glacier surface-area changes since their maximal extent
during the Little Ice Age (e.g., Florez, 1992; Ceballos et al., 2006; Poveda and Pineda, 2009;
Herrera and Ruiz, 2009). Note that the Little Ice Age maximal extent has not been dated in the
Colombia Andes as it was the case in the other countries of the tropical Andes (e.g., Rabatel
et al., 2005, 2008; Jomelli et al., 2009), but we can assume that it lasted between the mid-17th
and the early 18th centuries. The former studies on the extent of Colombian glaciers in the past
are based on the moraines (reflecting the Little Ice Age maximal extent), aerial photographs
from the late 1940s until the late 1970s early 1980s, and using Landsat TM and ETM Mid
1980’s until early 2000s. In the current study, an update of the glacial coverage in the
Colombian Andes has been realized using images from the following satellites: QuickBird
102
103
104
105
106
107
108
109
110
111
112
113
114
115
116
117
118
119
120
121
122
123
124
125
126
(2007 for all the Colombian glacierized areas), ALOS (2008, 2009 for Sierra Nevada de El
Coquy), RapidEye (2010 for all the Colombian glacierized areas) and Landsat8 OLI (2016 for
all the Colombian glacierized areas, Fig. 1).
On the basis of Landsat8 images from late January-early February 2016, a detailed inventory
was performed and a database was generated according to the design of the GLIMS glacier
relational database. For an extensive description of the database content, the reader will refer
to the GLIMS website (http://www.glims.org/MapsAndDocs/db_design.html). The 2016
Landsat8 images provide the perfect conditions for a glacier inventory: no cloud cover on the
mountains, no snow cover outside the glaciers. These images have a spatial resolution of 30 m
in multispectral mode and 15 m in the panchromatic mode. Due to the small size of the
glaciers and their limited number, the delineation of the glaciers outline has been made
manually. This allows getting a better accuracy than automatic delineation methods which
generally fail at detecting snow and ice covers in the shadowed parts (Gardent et al., 2014).
Note that debris-covered glaciers are negligible in Colombia, either because the glaciers are
small ice caps, or remnants of ice caps, or slope glaciers; and in every cases, rock walls
overhanging the glaciers are limited or absent.
3.2. Quantification of glacier volume
Ice thickness measurements have been acquired on La Conejeras glacier (Nevado Santa
Isabel) using an ice penetrating radar (IPR) during field campaigns in January-February 2014.
Our IPR is a geophysical instrument specially designed by the Canadian company Blue
System Integration Ltd in collaboration with glaciologists to measure the thickness of glacier
ice (Mingo and Flowers, 2010). It comprises a pair of transmitting and receiving 5 MHz
antennas that allow continuous acquisition, and is georeferenced with a GPS receiver.
14 cross profiles and two longitudinal profiles have been acquired on this small glacier (0.19
km² in 2014, Fig. 2), which is a remnant of the Santa Isabel ice cap (Fig. 3). From the in-situ
127
128
129
130
131
132
133
134
135
136
137
138
139
140
141
142
143
144
145
146
147
148
149
150
151

GPR continuous acquisitions, 200 measurements have been picked up (Fig. 2) where the
reflected signal was the clearer. This represents an average density of 1 pt / 100 m². Note that
these data have been integrated to the glacier thickness database (GLATHIDA 2.0, WGMS,
2016).
Figure 2: GPR measurements acquired in
Jan-Feb 2014 on La Conejeras glacier.
3.3. Quantification of surface elevation changes
Changes in glacier-surface elevation can be computed by the difference of digital elevation
models (DEMs) realized by topography (DGPS, LiDAR) or using aerial photographs or
satellite images. However, such accurate DEMs are not available for all the Colombian
glaciers. Nevado Santa Isabel is one of the exceptions as realized a photogrammetric
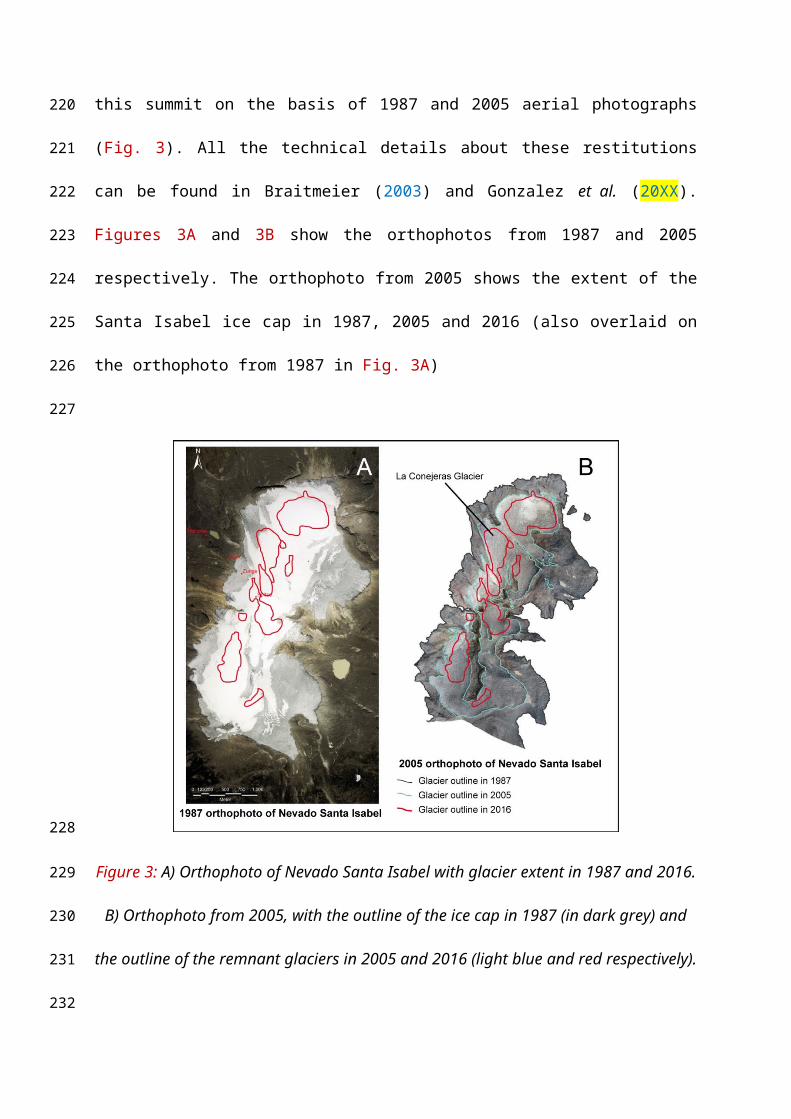
restitution of this summit on the basis of 1987 and 2005 aerial photographs (Fig. 3). All the
technical details about these restitutions can be found in Braitmeier (2003) and Gonzalez et al.
(20XX). Figures 3A and 3B show the orthophotos from 1987 and 2005 respectively. The
152
153
154
155
156
157
158
159
160
161
162
163
164
165

orthophoto from 2005 shows the extent of the Santa Isabel ice cap in 1987, 2005 and 2016
(also overlaid on the orthophoto from 1987 in Fig. 3A)
Figure 3: A) Orthophoto of Nevado Santa Isabel with glacier extent in 1987 and 2016. B)
Orthophoto from 2005, with the outline of the ice cap in 1987 (in dark grey) and the outline of
the remnant glaciers in 2005 and 2016 (light blue and red respectively).
During the January-February 2014 field campaign for glacier thickness measurements on La
Conejeras glacier (as previously mentioned this glacier is a remnant of Santa Isabel ice cap,
see Fig. 3B), a complete topography of the glacier surface was realized using a terrestrial
LiDAR. An ultra-long-range RIEGL VZ-6000 device was used (Fig. 4A). This system emits a
near-infrared laser beam at 1064 nm ideal for glacial studies. Ten reflector targets with 5 cm
diameter were fixed on stakes or rocks around the glacier for georeferencing purposes. Their
position has been measured using differential GPS. Three distinct scan positions were set to
166
167
168
169
170
171
172
173
174
175
176
177
178
179
180

achieve good coverage of the whole glacier and its surroundings. The LiDAR data were
processed using the software RiSCAN PRO. The main processing steps included a filtering of
points (e.g., due to atmospheric reflections caused by dust or moisture), a unification of the
point clouds from the different scan positions, and the georeferencing of the final grid using
the target reference points. Figure 4B provides an illustration of the final point cloud. The
resulting DEM has a homogeneous resolution of 0.5 m and was reprojected to MAGNA
Colombia Bogotá (EPSG 3116), the official georeference system of Colombia.
Figure 4: A) RIEGL VZ-6000 operating at
the front of La Conejeras glacier. B) Scanned
point cloud of La Conejeras glacier.
The changes in glacier surface elevation have been quantified by subtracting the different
DEMs. This was possible at the scale of the entire Santa Isabel ice cap for the period 1987-
2005, and for the La Conejeras glacier only for the periods 1987-2014 and 2005-1987 using
the 2014 LiDAR data.
From these surface elevation changes, the geodetic average annual mass balance has been
quantified considering the average surface area between the two considered dates, the time
181
182
183
184
185
186
187
188
189
190
191
192
193
194
195
between the two DEM and an average ice density of 0.9900 kg m3 . For more details about the
geodetic method the reader may refer dedicated publications (e.g. Rabatel et al., 2006;
Cogley, 2009; Basantes Serrano et al., 2016).
3.4. In situ glacier surface mass balance data
Two glaciers in Colombia are monitored with in-situ measurements to quantify their surface
mass balance: La Conejeras glacier on the Nevado Santa Isabel, Ritacuba glacier in the Sierra
Nevada de El Coquy (Ceballos et al., 2012). Accumulation and ablation measurements are
performed at the monthly scale with the classical glaciological method (snow pits and ablation
stakes) since 2006 for La Conejeras and 2008 Ritacuba glacier. Recently, the entire monthly
surface mass balance data series of La Conejeras glacier has been reanalyzed by Mölg et al.
(2017). The reader will refer to this publication for more details on the monitoring network
and the results of this 10-yr monitoring program.
4. RESULTS
4.1. 2016 Colombian glaciers inventory
Table 2 gives an overview of the distribution of glaciers according to size classes for the 2016
inventory for the whole Colombian glaciers and considering the four main glacierized areas:
Sierra Nevada de Santa Marta, Sierra Nevada de El Coquy, Parque Nacional Los Nevados
(including los nevados del Ruiz, de Santa Isabel and de Tolima) and Nevado del Huila.
Glaciers of the Colombian Andes covered 41 km2 in early 2016 with 7.2 km² in the Sierra
Nevada de Santa Marta, 15.5 km² in the Sierra Nevada de El Coquy, 10.5 km² in the Parque
Nacional Los Nevados and 7.9 km² for the Nevado del Huila. The size of the glaciers ranged
from 0.01 km² (minimum size considered in the inventories) to 8.85 km² (ice cap covering the
Nevado del Ruiz in the Parque Nacional Los Nevados). At the scale of the Colombian Andes:
196
197
198
199
200
201
202
203
204
205
206
207
208
209
210
211
212
213
214
215
216
217
218
219
220

mean glacier size was 0.48 km² (median = 0.18 km², indicating that the distribution is clearly
dissymmetric toward small-size glaciers); glaciers < 0.5 km² represented 76% of all glaciers
and 26% of the total glacierized area; one glacier is bigger than 5 km² and accounted for 22%
of the glacierized area. Glaciers > 1 km² accounted for 84%, 66%, 16% and 14% of the
glacierized area in the Parque Nacional Los Nevados, Sierra Nevada de El Coquy, Sierra
Nevada de Santa Marta and Nevado del Huila respectively.
Size class (km²) Colombia
Sta Marta
El Coquy
P.N. Los Nev. Huila
<0.1 Number 29 13 6 10Number (%) 34 46 24 59Area (km²) 1.65 0.74 0.37 0.54Area (%) 4 10 2 5
0.1-0.5 Number 36 11 11 6 8Number (%) 42 39 44 35 53Area (km²) 9.11 2.70 2.54 1.11 2.76Area (%) 22 38 16 11 35
0.5-1 Number 12 3 3 6Number (%) 14 11 12 40Area (km²) 8.88 2.61 2.28 4.00Area (%) 22 36 15 51
1-5 Number 7 1 5 1Number (%) 8 4 20 7Area (km²) 12.55 1.13 10.28 1.14Area (%) 31 16 66 14
> 5 Number 1 1Number (%) 1 6Area (km²) 8.85 8.85Area (%) 22 84
Total Number 85 28 25 17 15Area (km²) 41.0 7.2 15.5 10.5 7.9
Table 2: Summary statistics (number and area) on glaciers in Colombia for the 2016 inventory.
221
222
223
224
225
226
227
228
229
Glacier minimum, maximum, and mean altitudes have been computed from the ASTER
GDEM V2. This global DEM has been realized from ASTER images dating from the period
2000-2010. The exact dating for each region is unknown but it can be considered that the
elevation provided by this DEM is representative of the 2000s. The mean altitude has been
computed from the area-altitude distribution. Indeed, such mean altitude can be considered as
a proxy of the balanced-budget equilibrium-line altitude corresponding to the glacier extent
(Rabatel et al., 2013b; Braithwaite, 2015). Considering the different glacierized regions, the
average of the mean altitude of each individual glacier are 5167 m a.s.l., 4912 m a.s.l., 4923 m
a.s.l. and 5019 m a.s.l. for Sierra Nevada de Santa Marta, Sierra Nevada de El Coquy, Parque
Nacional Los Nevados, and Nevado del Huila respectively.
The maximum altitude of the glacier is an interesting variable, because when compared to the
equilibrium-line altitude it allows computing the altitudinal extent of the accumulation zone,
and together with the glacier-area distribution the accumulation-area ratio. The highest
altitudes of glaciers’ top can be found in the Sierra Nevada de Santa Marta where they range
between 4970 and 5678 m a.s.l. On the Nevado del Huila, the altitude of glaciers’ top ranges
between 5160 and 5425 m a.s.l. In the two other glacierized areas, the uppermost elevations
are lower, ranging between 4784 and 5346 m a.s.l. for the Sierra Nevada de El Coquy and
between 4775 and 5315 m a.s.l. in the Parque Nacional Los Nevados.
In terms of altitudinal extent (difference between the minimum and maximum elevations of
the glacier), the Colombian glaciers span over limited ranges: 600 m on the Nevado del Huila,
340 m in the Sierra Nevada de Santa Marta, 300m in the Sierra Nevada de El Coquy and 200
m in the Parque Nacional Los Nevados.
4.2. Historical glacier surface area changes
230
231
232
233
234
235
236
237
238
239
240
241
242
243
244
245
246
247
248
249
250
251
252
253

Table 3 presents the surface area changes in the different glacierized areas of the Colombian
Andes. Note that the Parque Nacional Los Nevados encompasses the three volcanos Ruiz,
Santa Isabel and Tolima (Fig. 1C). These changes are also illustrated in Figures 5A and 5B
including the rates of mean annual surface area loss in %/yr for each glacierized area since the
mid-20th century.
Santa Marta El Coquy Ruiz Santa Isabel Tolima Huila Total(km²) (km²) (km²) (km²) (km²) (km²) (km²)
LIA max 82.6 148.7 47.5 27.8 8.6 33.7 348.91939 21.41946 10.8 3.11954 19.41955 38.9 108.91958 2.71959 21 9.4 17.51965 16.31975 19.61981 16.1 15.41985 18.7 87.91986 31.5 171987 6.4 1.61989 121990 14.1 13.91994 23.71995 11.1 67.51996 5.3 13.31997 11.8 1.22001 12.92002 8.4 10.3 3.3 1 55.82003 19.82007 7.7 18.6 10 2.6 1 10.8 50.72008 17.72009 17.42010 7.4 16 9.7 1.8 0.7 9.7 45.32016 7.2 15.5 8.8 1.0 0.7 7.8 41
2007-2016 -14 % -17 % -12 % -62 % -33 % -27 % -22 %1995-2016 -40 % -35 % -25 % -81 % -45 % -41 % -41 %1985-2016 -59 % -51 % -53 % -84 % -59 % -49 % -55 %1955-2016 -66 % -60 % -58 % -89 % -76 % -55 % -64 %LIA-2016 -92 % -90 % -81 % -96 % -92 % -77 % -89 %
254
255
256
257
258
259

Table 3: Surface area changes since the Little Ice Age maximum. For each glacierized area
the surface area (km²) for each date is presented as well as the loss for different periods (in %
of the initial surface area for the considered period).
The overall glacierized surface area in the Colombian Andes decreased by ~90% since the
Little Ice Age maximal extent (undated). Considering the glacierized surface area in the mid
20th century (about 110 km²), the current extent is about 65% lower. In the last two decades
(i.e. since 1995) the glacierized surface area has decreased by about 40%.
However, Figure 5 illustrates that the trend has not been homogeneous since the mid-20 th
century, both temporally and spatially. Indeed, the mean annual surface area loss rate has
remained close to -1% per year from the 1940s till the mid-1970s, even with a slight decrease
between the mid-1960s and the mid-1970s. Since the mid-1970s, the mean annual surface
area loss rate has increased continuously, reaching -3% per year during the current decade in
average for all the Colombian glacierized areas. On the other hand, this retreating trend is
spatially highly contrasted, with the most important loss rate found for Santa Isabel and
Tolima volcanoes, which is in agreement with their lowest elevations.
260
261
262
263
264
265
266
267
268
269
270
271
272
273
274
275
276

Figure 5: A) Glacier surface area
changes in the different glacierized
areas of Colombia since the 1940s.
B) Rates of mean annual area loss in
%/yr for each glacierized area. The
black curve and grey area represent
the average with 1 st-dev. interval.
The average has been smoothed
using a polynomial fit.
4.3. Glacier volume estimation from field data at La Conejeras glacier
The 2014 ice thickness data from the 14 cross profiles and two longitudinal ones acquired on
La Conejeras glacier (Fig. 2) have been interpolated using the software PCI-Geomatica
(MQSINT: multiquadratic spline interpolation). Figure 6 presents the resulting raster with a
spatial resolution of 15 m (pixel size). The maximum ice thickness located in the central part
of the glacier was slightly above 50 m in 2014. The estimated total ice volume was estimated
to 4.325 x10⁶ m3, which corresponds to 3.893 x10⁶ m3 of water equivalent (using an ice
density of 0.9). Considering a surface area of 0.199 km², the average ice thickness of La
Conejeras glacier was about 22 m in 2014.
Considering an uncertainty of 2 m in the in situ ice thickness measurements with the radar, the
uncertainty in the mean thickness and glacier volume estimates are about 10%.
277
278
279
280
281
282
283
284
285
286
287
288
289

Figure 6: Map of ice thickness in 2014 at La
Conejeras glacier.
5. FUTURE CHANGES OF COLOMBIAN GLACIERS AND CONSEQUENCES
In-situ mass balance measurements over the last decade on La Conejeras and Ritacuba
glaciers, respectively in the Parque Nacional Los Nevados – Nevado Santa Isabel and in the
Sierra Nevada de El Coquy, have shown a clear unbalanced situation (Ceballos et al., 2012).
Indeed, the balacance-budget Equilibrium Line Altitude (ELA0, cf. Cogley et al. 2011)
derived from the surface mass balance measurements for La Conejeras glacier is about 4920
m a.s.l., thus 160 m above its mean altitude (i.e. 4760 m a.s.l.), and 120 m above the mean
altitude of the glaciers located on the Nevado Santa Isabel. This is the same for the Sierra
Nevada de El Coquy where the mean altitude of the glaciers is 4910 m a.s.l., 120 m below the
ELA0 derived from in situ measurements on Ritacuba glacier.
Reanalyzing the 10-yr monthly mass balance time series of La Conejeras glacier, Mölg et al.
(2017) have shown that the mean annual mass balance has been close to -3 m w.e. yr-1 over
the period 2006-2015 (Fig. 7 where annual mass balance are plotted). Mölg et al. (2017) also
290
291
292
293
294
295
296
297
298
299
300
301
302
303

showed that the annual ELA was on average close to the glacier maximum altitude during the
monitoring period, with an accumulation-area ratio of about 4%, i.e. almost no accumulation
zone.
On the other hand, the comparison between the 2014 Lidar DEM and the photogrammetric
DEM from 1987 (see section 3.3) showed that the glacier-surface elevation has lowered by 80
m at 4700 m a.s.l. (altitude of the glacier surface in 2014) between the two dates. The geodetic
mass balance was -2.56 m w.e. yr-1 for the period 1987-2005 and -2.46 m w.e. yr-1 for the
period 2005-2014 (Fig. 7). Note that the in situ surface mass balance averaged over the closest
period (i.e. 2007-2014) was -2.45 m w.e. yr-1. This very good agreement between the two
independent methods shows that the well distributed network of in situ measurements at the
surface of La Conejeras glacier allows an accurate quantification of the mass balance using
the glaciological method. Computed at the scale of the entire Santa Isabel ice cap, the
geodetic mass balance between 1987 and 2005 was -2.69 m w.e. yr-1, i.e. slightly more
negative than considering La Conejeras glacier only.
Figure 7 also shows the evolution of the volume of La Conejeras glacier computed on the
basis of the ice thicknesses measured in 2014, the annual changes in surface-area and the
surface mass balances in situ measured since 2006. Extrapolating linearly the glacier volume
changes of the last decade for the future La Conejeras glacier would disappear in the first
years of the 2020s, and so will probably do the other glaciers of Nevado Santa Isabel.
304
305
306
307
308
309
310
311
312
313
314
315
316
317
318
319
320
321
322
323

Figure 7: Surface mass balance and volume changes of La Conejeras glacier. Red squares
show the annual surface mass balance with the average for the period 2006-2015 (red line)
from Mölg et al. (2017). The green lines illustrate the average glacier-wide annual mass
balance computed from the difference between the 1987, 2005 and 2014 DEM. The blue
diamonds show the annual glacier volume computed on the basis of 2014 estimate (dark blue
diamond) using thickness measurements; the black line shows the linear regression.
At the scale of the Colombian glaciers, although the mass balance measured on La Conejeras
glacier cannot be directly extrapolated to the other glaciers, as neighboring glaciers under
similar climate conditions can show different mass balances in relation with the dynamic
response of glaciers to a change in climate forcing (e.g., Rabatel et al., 2016), the important
shrinkage of the Colombian glaciers since the mid-20th century, which is increasing since the
mid-1970s, clearly shows that these glaciers are strongly unbalanced with the current climate
conditions.
Assuming linear trends on the observed glacier shrinkage in the different glacierized areas of
Colombia during the last decades (Fig. 5A) allows a rough estimation of their future changes
and disappearance. Accordingly, glaciers on the Nevado Santa Isabel and Nevado de Tolima
324
325
326
327
328
329
330
331
332
333
334
335
336
337
338
339
340
341

will likely disappear before 2030, and most of the glaciers in the Sierra Nevada de Santa
Marta and Sierra Nevada de El Coquy before 2050. Only the few largest glaciers with the
highest maximum elevations on Nevado el Huila, Nevado del Ruiz and in the Sierra Nevada
de Santa Marta and Sierra Nevada de El Coquy will probably persist after the mid-21st century
although strongly reduced. Our results suggest that glacier extinction in Colombia happens
much faster than the corresponding estimates in the 4th IPCC report (Magrin et al. 2007:
“within the next 100 years”), but not as dramatic as suggested by Poveda and Pineda (2009:
“by the late 2010-20 decade”). The latter estimates are based on LandsatTM and ETM+
images from 1989-2007 and result in slightly smaller total areas for 2004-07, and
correspondingly higher loss rates, than the present study.
Conversely to other regions of the tropical Andes where glaciers represent a non-negligible
water reservoir for human consuming, for example in La Paz - Bolivia where the water
coming from the glaciers represents up to 30% of the runoff during the dry season (Soruco et
al., 2015), their potential impact in Colombia is mainly related to the Páramo ecosystems
(Brown and others, 2007), as well as for local agriculture and tourism. However, the
glacierized volcanos in Colombia remain – at least for the next few decades - a natural
hazards, as dramatically shown with the example of the post-eruption and particularly to
lahars with the dramatic example of the Nevado del Ruiz in 1985 (Thouret, 1990). Because
the Nevado del Ruiz presents the largest ice coverage in Colombia (8.85 km²) with an
estimated ice volume of 765 x106 m3 (measured maximum thickness of 190 m in 2000, J.
Ramirez, pers. Com.), the risk of lahar will still persist for several decades. As a consequence,
to better estimate the potential water release resulting from an eruption of the Nevado del
Ruiz and to prepare potential impact scenarios, an accurate mapping to the ice thickness and
distribution, as we presented here for La Conejeras glacier, is urgently recommended.
342
343
344
345
346
347
348
349
350
351
352
353
354
355
356
357
358
359
360
361
362
363
364
365
366

5. CONCLUSION
In this study we presented the results of a new glacier inventory of the Colombian Andes
performed using 2016 Landsat images, in combination with in situ measurements of glacier
thickness using radar and of glacier surface topography using lidar and aerial photogrammetry
on the well studied La Conejeras glacier located on the Nevado Santa Isabel in the Parque
Nacional de Los Nevados.
The main results showed that:
- The glaciations is very reduced in Colombia, with a total ice covered in 2016 of 41 km².
The mean glacier size was 0.48 km², and small size glaciers largely predominate (76 % <
0.5 km²).
- The glacier shrinkage is strong since the mid-1970s and almost constantly increasing
reaching a mean annual area loss rate of -3% yr-1 during the last years.
- Mass loss on the Santa Isabel ice cap has been strongly negative over the last three decades
with an average annual mass balance of about -2.5 m w.e. yr-1 since 1987 quantified using
aerial photogrammetry and terrestrial lidar.
Considering the imbalance of the glaciers in Colombia with the current climate conditions and
the relative low altitude of the Colombian glaciers, most of them will most likely disappear in
the coming decades and only the largest ones located on the highest summit will persist until
the mid-21st century.
Author contribution statement
A. Rabatel conducted the GPR monitoring on La Conejeras glacier, realized the 2016 glacier
inventory, analyzed the data wrote the manuscript and produced the figures and tables. N.
Micheletti conducted the LiDAR measurements on La Conejeras glacier and produced the
DEM. J.L. Ceballos (with colleagues from IDEAM) performed ten years of mass balance in-
367
368
369
370
371
372
373
374
375
376
377
378
379
380
381
382
383
384
385
386
387
388
389
390
391

situ measurements on La Conejeras glacier and analyzed the data with N. Mölg. J.L. Ceballos
and C. Huggel made the glacier mapping from the satellite images from 2007 to 2010. E.
Jordan, Michael Braitmeier and Javier Gonzales realized the photogrammetric DEMs of
Nevado Santa Isabel for 1987 and 2005. M. Zemp led the Andean part of the CATCOS
project and together with J.L. Ceballos managed the 2014 field campaign. All the co-authors
revised the manuscript.
ACKNOWLEDGEMENTS
This study was conducted in the context of the project Capacity Building and Twinning for
Climate Observing Systems (CATCOS) supported by the Federal Office of Meteorology and
Climatology MeteoSwiss, contract no. 7F-08114.1, between the Swiss Agency for
Development and Cooperation (SDC) and MeteoSwiss, by the Swiss State Secretariat for
Economic Affairs (SECO). NASA/METI/AIST/Japan Space systems, U.S./Japan ASTER
Science Team are acknowledged for the release of the ASTER GDEM V2. Antoine Rabatel
aknowledges the contributions of the SNO GLACIOCLIM (use of the IPR), the LMI
GREAT-ICE (Institut de Recherche pour le Développement, IRD) and the Labex
OSUG@2020 (Investissements d'avenir – ANR10 LABX56).
REFERENCES
Basantes Serrano, R., Rabatel, A., Francou, B., Vincent, C., Maisincho, L., Cáceres, B.,
Galarraga, R., Alvarez, D., 2016. Slight mass loss revealed by reanalyzing glacier mass
balance observations on Glaciar Antisana 15 (inner tropics) during the 1995-2012 period.
Journal of Glaciology, 62(231), 124-136. doi: 10.1017/jog.2016.17
392
393
394
395
396
397
398
399
400
401
402
403
404
405
406
407
408
409
410
411
412
413
414

Braithwaite, R.J., 2015. From Doktor Kurowski’s Schneegrenze to our modern glacier
equilibrium-line altitude (ELA). The Cryosphere, 9, 2135-2148, doi:10.5194/tc-9-2135-
2015
Braitmeier, M., 2003. Die Energiebilanz an der Oberfläche des Nevado Santa Isabel,
Kolumbien. PhD Thesis, Heinrich Heine Universität, Düsseldorf, Germany, 116 p.
Ceballos, J.L., Euscategui, C., Ramirez, J., Canon, M., Huggel, C., Haeberli, W., Machguth,
H., 2006. Fast shrinkage of tropical glaciers in Colombia. Annals of Glaciology, 43, 194-
201.
Ceballos, J.L., Rodriguez Murcia, C.E., Real Nuñez, E.L., 2012. Glaciares de Colombia más
que montañas con hielo. IDEAM, Bogotá, Colombia, 344 p.
Cogley, J.G., 2009. Geodetic and direct mass-balance measurements: comparison and joint
analysis. Annals of Glaciology, 50, 96-100.
Florez, A., 1992. Los nevados de Colombia, glaciales y glaciaciones. Análisis Geográficos,
22, 15-55.
Gardent, M., Rabatel, A., Dedieu, J.-P., Deline, P., 2014. Multitemporal glacier inventory of
the French Alps from the late 1960s to the late 2000s. Global and Planetary Change, 120,
24-37. doi: 10.1016/j.gloplacha.2014.05.004
González J., Jordan E., Blanco, D., Castillo, K., Ponce de León, F., Torres, J., Vélez, F.,
20XX. Desaparición de los glaciares en el Parque Nacional de los Nevados en Colombia,
Caso Santa Isabel y su investigación glacio-fotogramétrica. FUENTE
Herrera, G., Ruiz, J., 2009. Retroceso glaciar en la Sierra Nevada del Cocuy, Boyaca –
Colombia, 1986–2007. Perspectiva Geográfica, 13, 27-36.
Huggel, C., Ceballos, J.L., Pulgarin, B., Ramirez, J., and Thouret, J., 2007. Review and
reassessment of hazards owing to volcano-glacier interactions in Colombia. Annals of
Glaciology, 45, 128-136.
415
416
417
418
419
420
421
422
423
424
425
426
427
428
429
430
431
432
433
434
435
436
437
438
439

Jomelli, V., Favier, V., Rabatel, A., Brunstein, D., Hoffmann, G., Francou, B., 2009.
Fluctuations of glaciers in the tropical Andes over the last millennium and paleoclimatic
implications: a review. Palaeogeography, Palaeoclimatology, Palaeoecology, 281, 269-
282. doi:10.1016/j.palaeo.2008.10.033
Mingo, L., Flowers, G.E., 2010. An integrated lightweight ice penetrating radar system.
Journal of Glaciology, 56(198), 709-714. doi: 10.3189/002214310793146179
Mölg, N., Ceballos, J.L., Huggel, C., Micheletti, N., Rabatel, A., Zemp, M., 2017. Ten years
of monthly mass balance of Conejeras glacier, Colombia, and their evaluation using
different interpolation methods. Geografiska Annaler: Serie A, Physical Geography, under
review.
Morris, J.N., Poole, A.J., Klein, A.G., 2006. Retreat of tropical glaciers in Colombia and
Venezuela from 1984 to 2004 as measured from ASTER and Landsat images. Proc. 63rd
Eastern Snow Conference, Newark, Delaware, USA, 181-191.
Poveda, G., Pineda, K., 2009. Reassessment of Colombia’s tropical glaciers retreat rates: are
they bound to disappear during the 2010–2020 decade? Advances in Geosciences, 22, 107-
116. doi:10.5194/adgeo-22-107-2009
Rabatel, A., Jomelli, V., Naveau, P., Francou, B., Grancher, D., 2005. Dating fluctuations of
glaciers during the Little Ice Age in the tropical Andes: Charquini glaciers (Bolivia, 16°S).
Comptes-Rendus Géoscience, 337 (15), 1311-1322. doi: 10.1016/j.crte.2005.07.009.
Rabatel, A., Machaca, A., Francou, B., Jomelli, V., 2006. Glacier recession on the Cerro
Charquini (Bolivia, 16°S) since the maximum of the Little Ice Age (17th century). Journal
of Glaciology, 52 (176), 110-118. doi: 10.3189/172756506781828917
Rabatel, A., Francou, B., Jomelli, V., Naveau, P., Grancher, D., 2008. A chronology of the
Little Ice Age in the tropical Andes of Bolivia (16°S) and its implications for climate
reconstruction. Quaternary Research, 70, 198-212. doi: 10.1016/j.yqres.2008.02.012
440
441
442
443
444
445
446
447
448
449
450
451
452
453
454
455
456
457
458
459
460
461
462
463
464

Rabatel, A., Francou, B., Soruco, A., Gomez, J., Caceres, B., Ceballos, J.L., Basantes, R.,
Vuille, M., Sicart, J.E., Huggel, C., Scheel, M., Lejeune, Y., Arnaud, Y., Collet, M.,
Condom, T., Consoli, G., Favier, V., Jomelli, V., Galarraga, R., Ginot, P., Maisincho, L.,
Ménégoz, M., Mendoza, J., Ramirez, E., Ribstein, P., Suarez, W., Villacis, M., Wagnon,
P., 2013a. Current state of glaciers in the tropical Andes: a multi-century perspective on
glacier evolution and climate change. The Cryosphere, 7, 81-102. doi: 10.5194/tc-7-81-
2013
Rabatel, A., Letréguilly, A., Dedieu, J.-P., Eckert, N., 2013b. Changes in glacier equilibrium-
line altitude in the western Alps from 1984 to 2010: evaluation by remote sensing and
modeling of the morpho-topographic and climate controls. The Cryosphere, 7, 1455–1471,
doi:10.5194/tc-7-1455-2013
Rabatel, A., Dedieu, J.-P., Vincent, C., 2016. Spatio-temporal changes in glacier-wide mass
balance quantified by optical remote sensing on 30 glaciers in the French Alps for the
period 1983–2014. Journal of Glaciology, in press. doi: 10.1017/jog.2016.113
Sicart, J.E., Villacis, M., Condom, T., Rabatel, A., 2015. GREAT ICE monitors glaciers in the
tropical Andes. Eos, 96, doi: 10.1029/2015EO037993
Soruco, A., Vincent, C., Rabatel, A., Francou, B., Thibert, E., Sicart, J.E., Condom, T., 2015.
Impacts of glacier shrinkage on water resources of La Paz city, Bolivia (16°S). Annals of
Glaciology, 56(70), 147-154. doi: 10.3189/2015AoG70A001
Thouret, J.C., 1990. Effects of the November 13, 1985 eruption on the snow pack and ice cap
of Nevado del Ruiz volcano, Colombia. Journal of Volcanology and Geothermal
Research, 41(1-4), 177-201.
Troll, C., 1941. Studien zur vergleichenden Geographie der Hochgebirge der Erde. Bonner
Mitteilungen, Bonn, Germany.
465
466
467
468
469
470
471
472
473
474
475
476
477
478
479
480
481
482
483
484
485
486
487
488

WGMS. 2016. Glacier Thickness Database 2.0. Gärtner-Roer, I., Andreassen, L.M., Bjerre,
E., Farinotti, D., Fischer, A., Fischer, M., Helfricht, K., Huss, M., Knecht, T., Kutuzov, S.,
Landmann, J., Lavrentiev, I., Li, H., Li, Z., Machguth, H., Naegeli, K., Navarro, F.,
Rabatel, A., Stentoft, P., Zemp, M. (eds.), World Glacier Monitoring Service, Zurich,
Switzerland. doi: 10.5904/wgms-glathida-2016-07
489
490
491
492
493

![Randolph Glacier Inventory: A Dataset of Global Glacier ... · Zheltyhina. 2012, Randolph Glacier Inventory [v2.0]: A Dataset of Global Glacier Outlines. Global Land Ice Measurements](https://img.pdfslide.net/doc/110x75/5f1037d37e708231d448062a/randolph-glacier-inventory-a-dataset-of-global-glacier-zheltyhina-2012-randolph.jpg)