Embed Size (px)
Citation preview
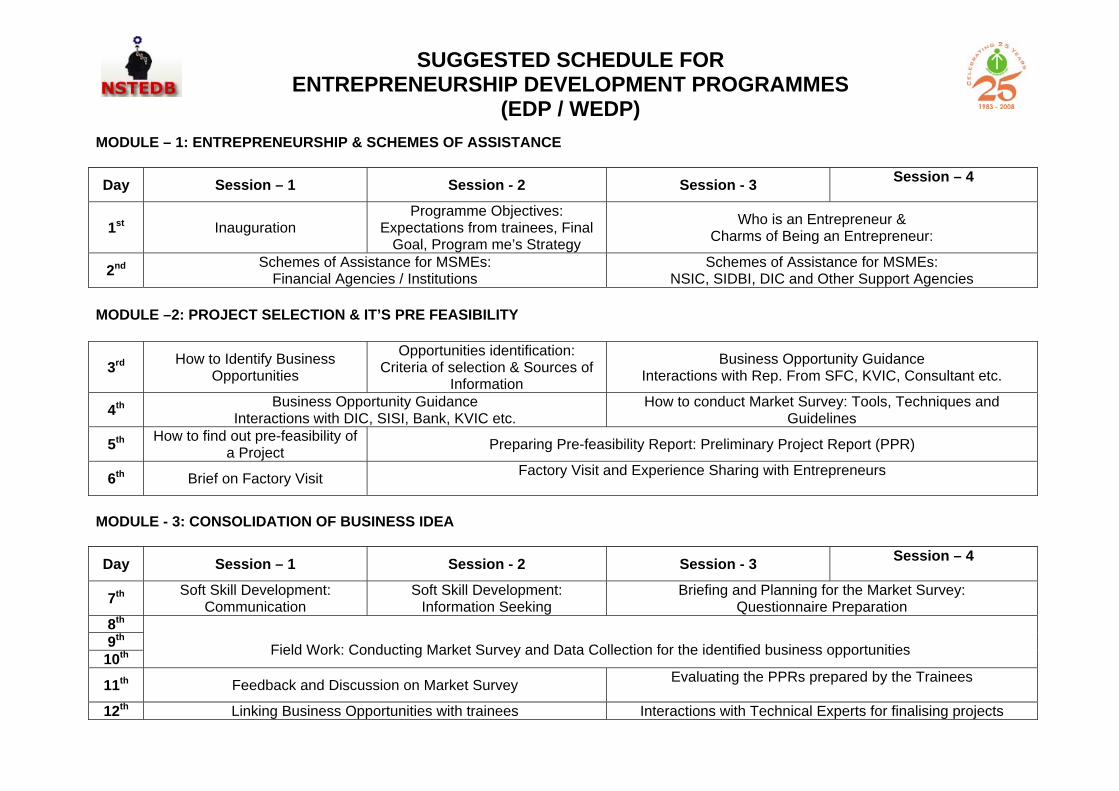
MODULE – 1: ENTREPRENEURSHIP & SCHEMES OF ASSISTANCE
Day Session – 1 Session - 2 Session - 3 Session – 4
1st Inauguration Programme Objectives:
Expectations from trainees, Final Goal, Program me’s Strategy
Who is an Entrepreneur & Charms of Being an Entrepreneur:
2nd Schemes of Assistance for MSMEs: Financial Agencies / Institutions
Schemes of Assistance for MSMEs: NSIC, SIDBI, DIC and Other Support Agencies
MODULE –2: PROJECT SELECTION & IT’S PRE FEASIBILITY
3rd How to Identify Business Opportunities
Opportunities identification: Criteria of selection & Sources of
Information
Business Opportunity Guidance Interactions with Rep. From SFC, KVIC, Consultant etc.
4th Business Opportunity Guidance Interactions with DIC, SISI, Bank, KVIC etc.
How to conduct Market Survey: Tools, Techniques and Guidelines
5th How to find out pre-feasibility of a Project Preparing Pre-feasibility Report: Preliminary Project Report (PPR)
6th Brief on Factory Visit Factory Visit and Experience Sharing with Entrepreneurs
MODULE - 3: CONSOLIDATION OF BUSINESS IDEA
Day Session – 1 Session - 2 Session - 3 Session – 4
7th Soft Skill Development: Communication
Soft Skill Development: Information Seeking
Briefing and Planning for the Market Survey: Questionnaire Preparation
8th
9th
10th
Field Work: Conducting Market Survey and Data Collection for the identified business opportunities
11th Feedback and Discussion on Market Survey Evaluating the PPRs prepared by the Trainees
12th Linking Business Opportunities with trainees Interactions with Technical Experts for finalising projects
SUGGESTED SCHEDULE FOR ENTREPRENEURSHIP DEVELOPMENT PROGRAMMES
(EDP / WEDP)
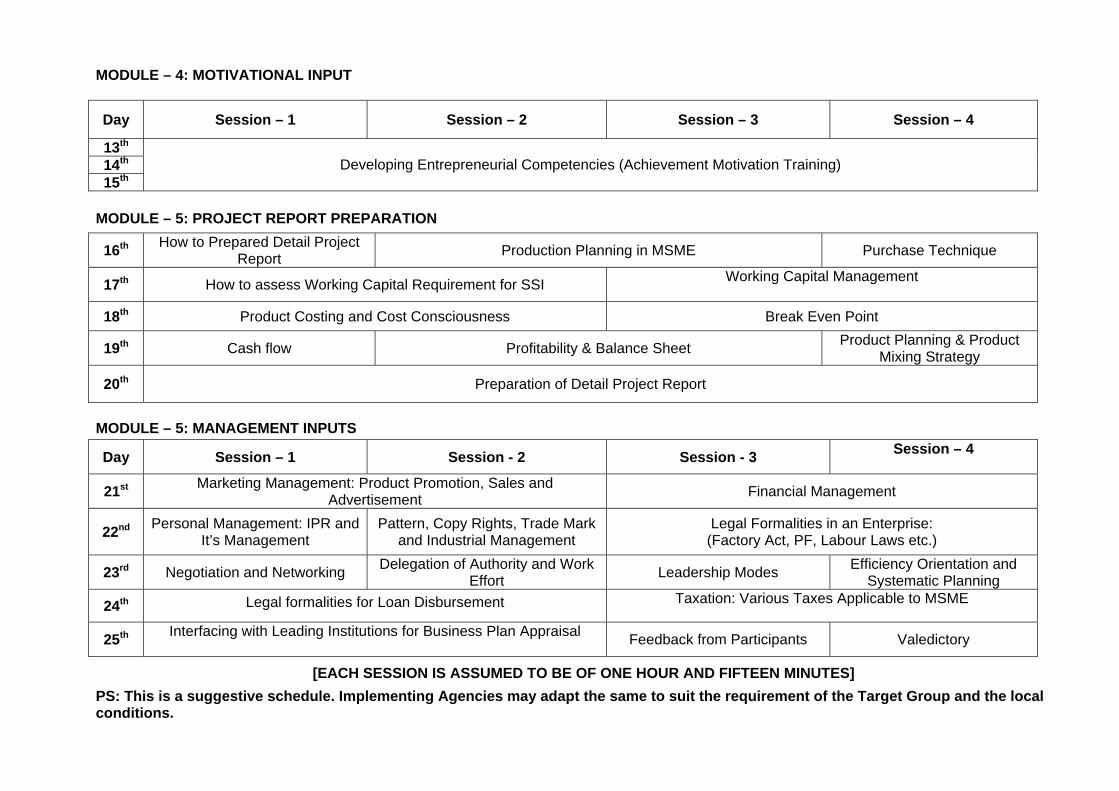
MODULE – 4: MOTIVATIONAL INPUT
Day Session – 1 Session – 2 Session – 3 Session – 4
13th
14th
15th
Developing Entrepreneurial Competencies (Achievement Motivation Training)
MODULE – 5: PROJECT REPORT PREPARATION
16th How to Prepared Detail Project Report Production Planning in MSME Purchase Technique
17th How to assess Working Capital Requirement for SSI Working Capital Management
18th Product Costing and Cost Consciousness Break Even Point
19th Cash flow Profitability & Balance Sheet Product Planning & Product Mixing Strategy
20th Preparation of Detail Project Report
MODULE – 5: MANAGEMENT INPUTS
Day Session – 1 Session - 2 Session - 3 Session – 4
21st Marketing Management: Product Promotion, Sales and Advertisement Financial Management
22nd Personal Management: IPR and It’s Management
Pattern, Copy Rights, Trade Mark and Industrial Management
Legal Formalities in an Enterprise: (Factory Act, PF, Labour Laws etc.)
23rd Negotiation and Networking Delegation of Authority and Work Effort Leadership Modes Efficiency Orientation and
Systematic Planning
24th Legal formalities for Loan Disbursement
Taxation: Various Taxes Applicable to MSME
25th Interfacing with Leading Institutions for Business Plan Appraisal Feedback from Participants Valedictory
[EACH SESSION IS ASSUMED TO BE OF ONE HOUR AND FIFTEEN MINUTES]
PS: This is a suggestive schedule. Implementing Agencies may adapt the same to suit the requirement of the Target Group and the local conditions.
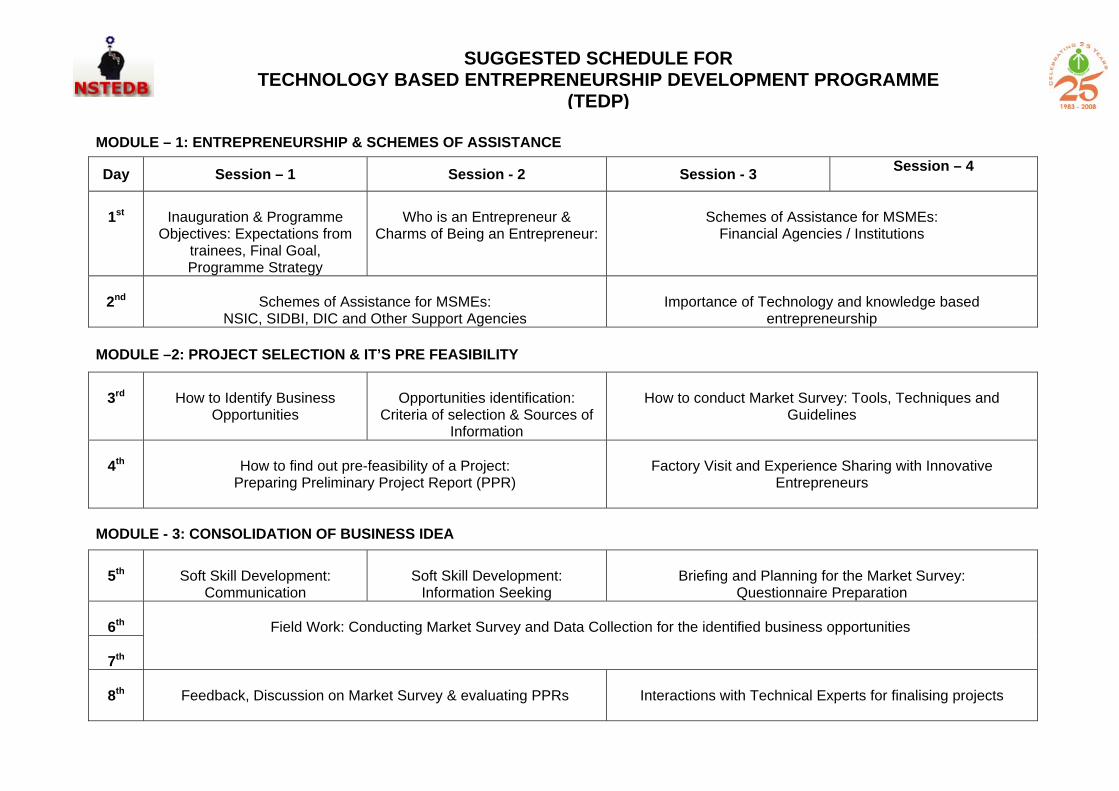
MODULE – 1: ENTREPRENEURSHIP & SCHEMES OF ASSISTANCE
Day Session – 1 Session - 2 Session - 3 Session – 4
1st
Inauguration & Programme
Objectives: Expectations from trainees, Final Goal, Programme Strategy
Who is an Entrepreneur &
Charms of Being an Entrepreneur:
Schemes of Assistance for MSMEs:
Financial Agencies / Institutions
2nd
Schemes of Assistance for MSMEs:
NSIC, SIDBI, DIC and Other Support Agencies
Importance of Technology and knowledge based
entrepreneurship MODULE –2: PROJECT SELECTION & IT’S PRE FEASIBILITY
3rd
How to Identify Business
Opportunities
Opportunities identification:
Criteria of selection & Sources of Information
How to conduct Market Survey: Tools, Techniques and
Guidelines
4th
How to find out pre-feasibility of a Project:
Preparing Preliminary Project Report (PPR)
Factory Visit and Experience Sharing with Innovative
Entrepreneurs
MODULE - 3: CONSOLIDATION OF BUSINESS IDEA
5th
Soft Skill Development:
Communication
Soft Skill Development:
Information Seeking
Briefing and Planning for the Market Survey:
Questionnaire Preparation
6th
7th
Field Work: Conducting Market Survey and Data Collection for the identified business opportunities
8th
Feedback, Discussion on Market Survey & evaluating PPRs
Interactions with Technical Experts for finalising projects
SUGGESTED SCHEDULE FOR TECHNOLOGY BASED ENTREPRENEURSHIP DEVELOPMENT PROGRAMME
(TEDP)
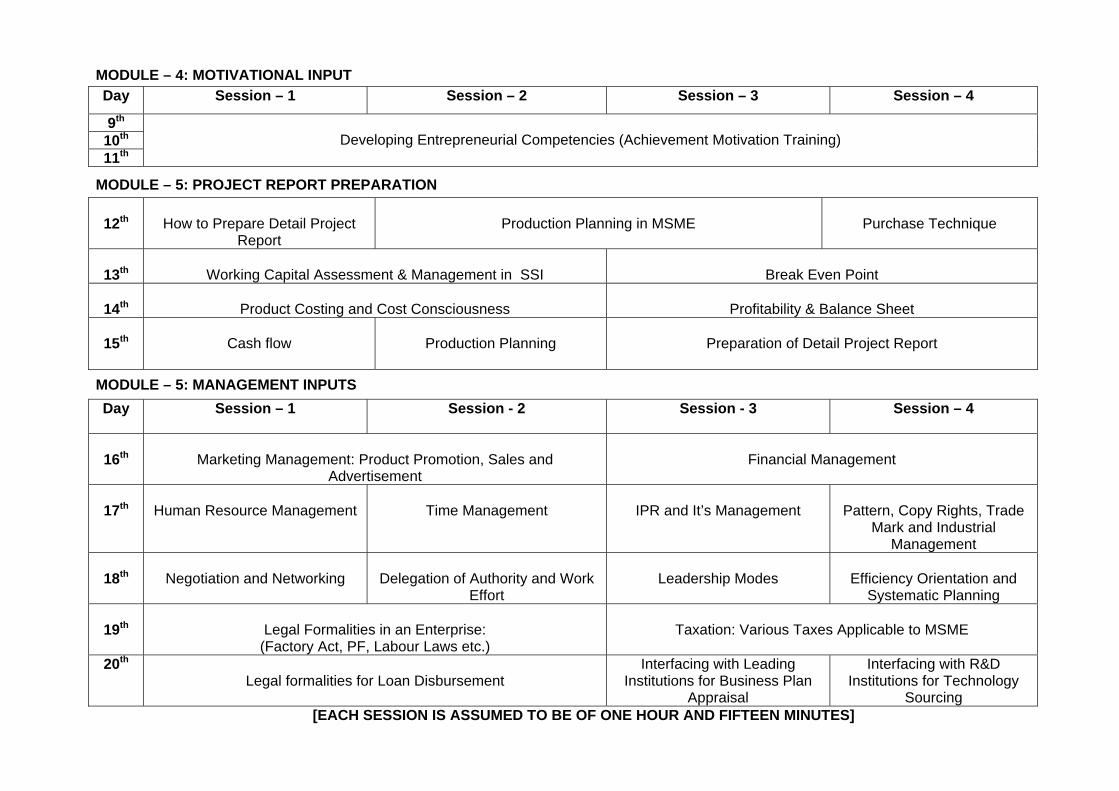
MODULE – 4: MOTIVATIONAL INPUT
Day Session – 1 Session – 2 Session – 3 Session – 4
9th 10th 11th
Developing Entrepreneurial Competencies (Achievement Motivation Training)
MODULE – 5: PROJECT REPORT PREPARATION
12th
How to Prepare Detail Project
Report
Production Planning in MSME
Purchase Technique
13th
Working Capital Assessment & Management in SSI
Break Even Point
14th
Product Costing and Cost Consciousness
Profitability & Balance Sheet
15th
Cash flow
Production Planning
Preparation of Detail Project Report
MODULE – 5: MANAGEMENT INPUTS
Day Session – 1 Session - 2 Session - 3 Session – 4
16th
Marketing Management: Product Promotion, Sales and
Advertisement
Financial Management
17th
Human Resource Management
Time Management
IPR and It’s Management
Pattern, Copy Rights, Trade
Mark and Industrial Management
18th
Negotiation and Networking
Delegation of Authority and Work
Effort
Leadership Modes
Efficiency Orientation and
Systematic Planning
19th
Legal Formalities in an Enterprise: (Factory Act, PF, Labour Laws etc.)
Taxation: Various Taxes Applicable to MSME
20th Legal formalities for Loan Disbursement
Interfacing with Leading Institutions for Business Plan
Appraisal
Interfacing with R&D Institutions for Technology
Sourcing [EACH SESSION IS ASSUMED TO BE OF ONE HOUR AND FIFTEEN MINUTES]
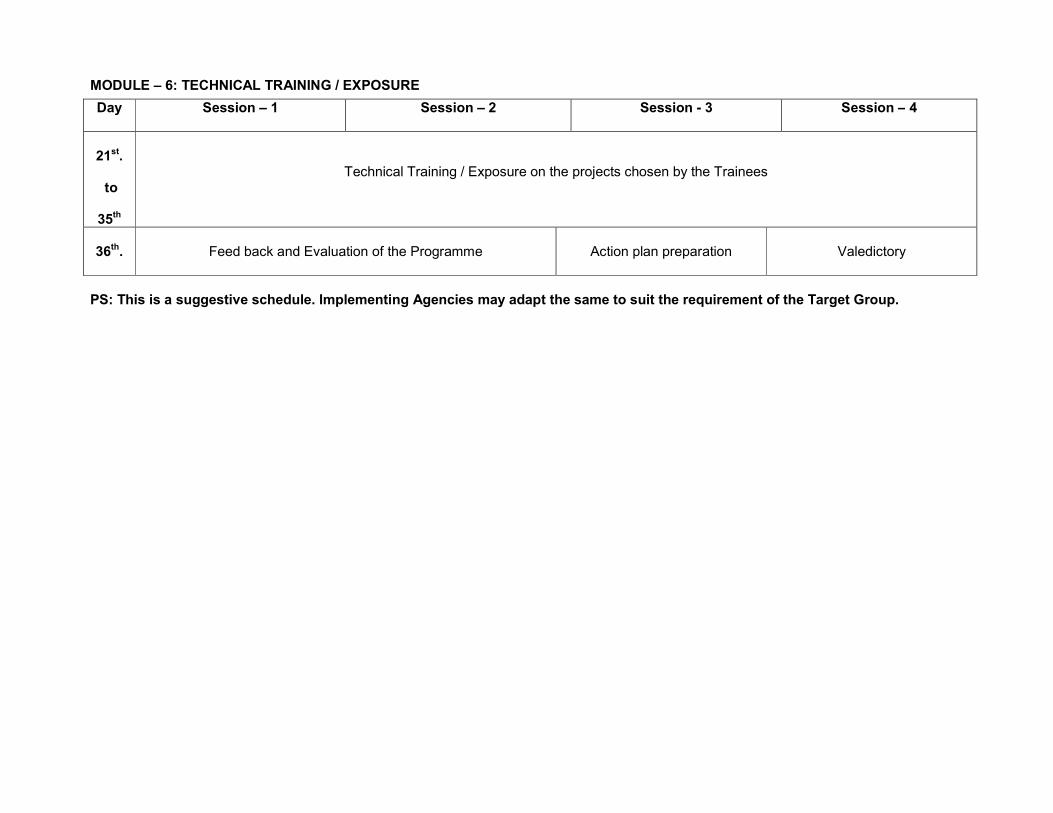
MODULE – 6: TECHNICAL TRAINING / EXPOSURE
Day Session – 1 Session – 2 Session - 3 Session – 4
21st.
to
35th
Technical Training / Exposure on the projects chosen by the Trainees
36th.
Feed back and Evaluation of the Programme
Action plan preparation
Valedictory
PS: This is a suggestive schedule. Implementing Agencies may adapt the same to suit the requirement of the Target Group.
SUGGESTED READING / REFERENCE MATERIAL FOR
ENTREPRENEURSHIP DEVELOPMENT PROGRAMMES (EDP/WEDP/TEDP)
By:
Dr. Dinesh Awasthi Mr. Raman Jaggi
Mr. V Padmanand
Entrepreneurship Development Institute of India, Ahmedabad
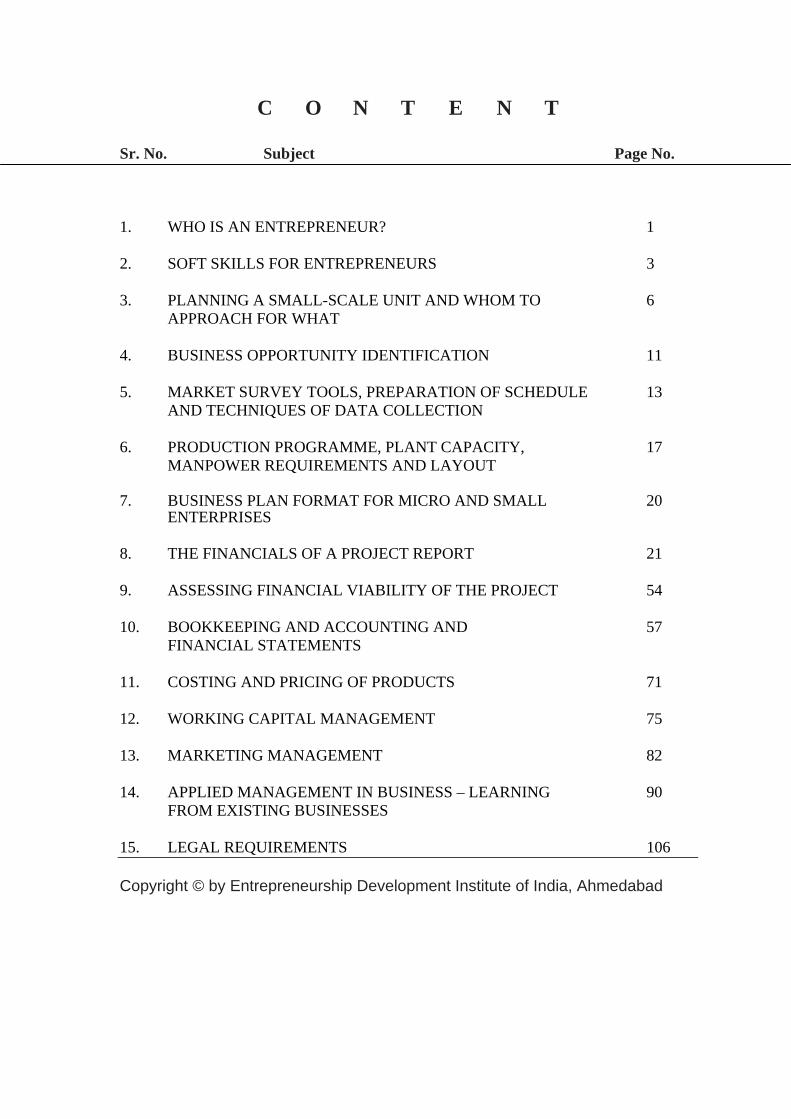
C O N T E N T Sr. No. Subject Page No.
1. WHO IS AN ENTREPRENEUR? 1 2. SOFT SKILLS FOR ENTREPRENEURS 3 3. PLANNING A SMALL-SCALE UNIT AND WHOM TO 6
APPROACH FOR WHAT 4. BUSINESS OPPORTUNITY IDENTIFICATION 11 5. MARKET SURVEY TOOLS, PREPARATION OF SCHEDULE 13
AND TECHNIQUES OF DATA COLLECTION 6. PRODUCTION PROGRAMME, PLANT CAPACITY, 17
MANPOWER REQUIREMENTS AND LAYOUT 7. BUSINESS PLAN FORMAT FOR MICRO AND SMALL 20
ENTERPRISES 8. THE FINANCIALS OF A PROJECT REPORT 21 9. ASSESSING FINANCIAL VIABILITY OF THE PROJECT 54 10. BOOKKEEPING AND ACCOUNTING AND 57
FINANCIAL STATEMENTS 11. COSTING AND PRICING OF PRODUCTS 71 12. WORKING CAPITAL MANAGEMENT 75 13. MARKETING MANAGEMENT 82 14. APPLIED MANAGEMENT IN BUSINESS – LEARNING 90
FROM EXISTING BUSINESSES 15. LEGAL REQUIREMENTS 106 Copyright © by Entrepreneurship Development Institute of India, Ahmedabad
EDI / DST – NIMAT / Entrepreneurship Development Programmes
1
1
CHAPTER – 1
WHO IS AN ENTREPRENEUR? If you wish to start and succeed in your enterprise, you need to play different roles at different stages. Some essential qualities for entrepreneurs are: 1) A strong desire to win. (NEED FOR ACHIEVEMENT) Most people dream of success, but seldom do anything to implement it. In contrast, entrepreneurs have a strong desire to continuously hit new goals and will not rest till they win. 2) An approach of never-say-die. (PERSEVERANCE) Once committed to a goal and a course of action, entrepreneurs never retract. Difficulties do not deter them and they work hard till the entire project is successfully accomplished. 3) Entrepreneurs prefer a middle-of-the-road strategy while handling tricky
situations. (MODERATE RISK TAKER) They don’t take high risks; they are not gamblers. They prefer a moderate risk to a wild gamble, high enough to be exciting and containing a reasonable winning chance. 4) Alert to opportunities and seizing them to their advantage.
(ABILITY TO FIND AND EXPLORE OPPORTUNITY) Entrepreneurs are innovative and can convert crisis into opportunities. But they are realistic enough to ensure that the opportunity suitably dovetails into realizing their goals. 5) They have a dispassionate approach to problems.
(ANALYTICAL ABILITY) Entrepreneurs will not let personal likes or dislikes come in the way of their taking a business decision based on ground realities. They seek out experts for assistance rather than friends and relatives. Their decisions are objective and not emotional or impulsive. 6) It is important for them to know how they are faring when they work on
their goals. (USING FEEDBACK) Entrepreneurs take immediate feedback on performance and prefer prompt and accurate data, irrespective of whether they are favourable or not. Unfavourable news spurs them into making amends to attain their goals. 7) Entrepreneurs do not get deterred by unfamiliar situations but interesting
situations. (FACING UNCERTAINTY) Achievement-driven people are optimistic even in unfamiliar situations. Even if they find the odds daunting, they see no reason why they can’t succeed with their treasure of abilities. They march undeterred, making the best of the fine opportunities that come their way even without guidelines. They quickly come to grips with the new environment and present a picture of boldness and prudence. They apply their special insight and skill. Applying their special insight and skill, they quickly understand the environment and adjust to it.
EDI / DST – NIMAT / Entrepreneurship Development Programmes
2
2
8) They dislike working for others. (INDEPENDENCE) Entrepreneurs do not like to work for others and therefore start off on their own. They wish to be their own masters and be responsible for their own decisions. 9) They are flexible. (FLEXIBILITY) Successful entrepreneurs have an open mind and do not hesitate to change their decisions, if after weighing the pros and cons, find that the situation so demands. 10) Entrepreneurs think ahead of others and plan for the future. (PLANNER) Most successful people set goals for themselves and plan to realize them in a time frame. 11) Entrepreneurs can deal with people at all levels.
(INTERPERSONAL SKILLS) An entrepreneur comes across all kinds of people. He has to make them work for him and with him to help realize his objectives. He likes working with people and has skills to deal with them. 12) They can influence others. (MOTIVATOR) A successful entrepreneur can influence others and motivate them to think and act in his way. 13) They can work for long hours and simultaneously tackle different problems.
(STRESS TAKER) As a key figure in his enterprise, the entrepreneur has to cope with several situations simultaneously and take right decisions, even if it involves physical and emotional stress. This is possible if one has the capacity to work long hours and still keep cool. 14) They know themselves. (POSITIVE SELF-CONCEPT) An achiever channelises his fantasies into worthwhile, achievable goals and sets standards for excellence. He can do this for he knows his strengths and weaknesses, as well as adopts a positive approach. He is seldom negative. 15) Entrepreneurs think ahead. (ORIENTATION FOR FUTURE) They have the ability to look into the future. They won’t allow the past to bother them and think only of the present and the future. “Bygones are bygones, what of now?” This is their usual response. An individual may not have all these qualities, but most will have many. The first step for a person aspiring to become an entrepreneur is to make an inventory of his traits. This self-awareness and analysis will help him define his strengths and overcome weaknesses.
EDI / DST – NIMAT / Entrepreneurship Development Programmes
3
3
CHAPTER - 2
SOFT SKILLS FOR ENTREPRENEURS
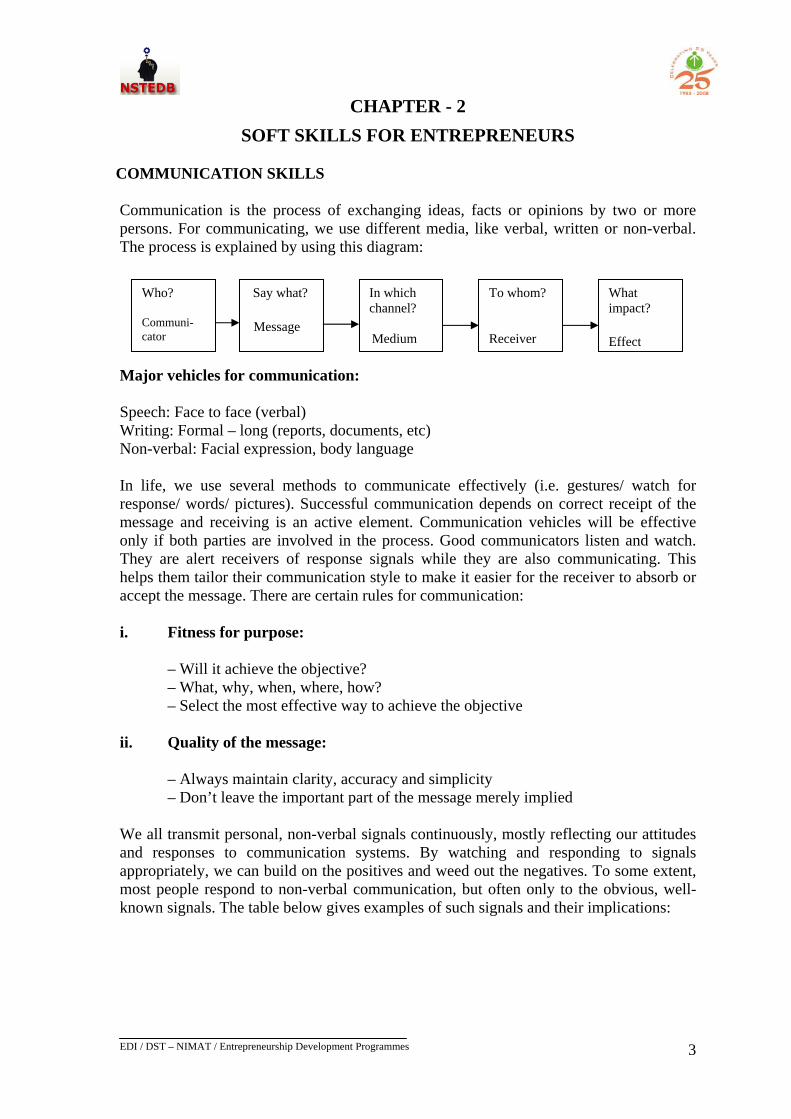
COMMUNICATION SKILLS Communication is the process of exchanging ideas, facts or opinions by two or more persons. For communicating, we use different media, like verbal, written or non-verbal. The process is explained by using this diagram: Who?
Communi-cator
Say what? Message
In which channel? Medium
To whom? Receiver
What impact? Effect
Major vehicles for communication: Speech: Face to face (verbal) Writing: Formal – long (reports, documents, etc) Non-verbal: Facial expression, body language In life, we use several methods to communicate effectively (i.e. gestures/ watch for response/ words/ pictures). Successful communication depends on correct receipt of the message and receiving is an active element. Communication vehicles will be effective only if both parties are involved in the process. Good communicators listen and watch. They are alert receivers of response signals while they are also communicating. This helps them tailor their communication style to make it easier for the receiver to absorb or accept the message. There are certain rules for communication: i. Fitness for purpose:
– Will it achieve the objective? – What, why, when, where, how? – Select the most effective way to achieve the objective
ii. Quality of the message:
– Always maintain clarity, accuracy and simplicity – Don’t leave the important part of the message merely implied
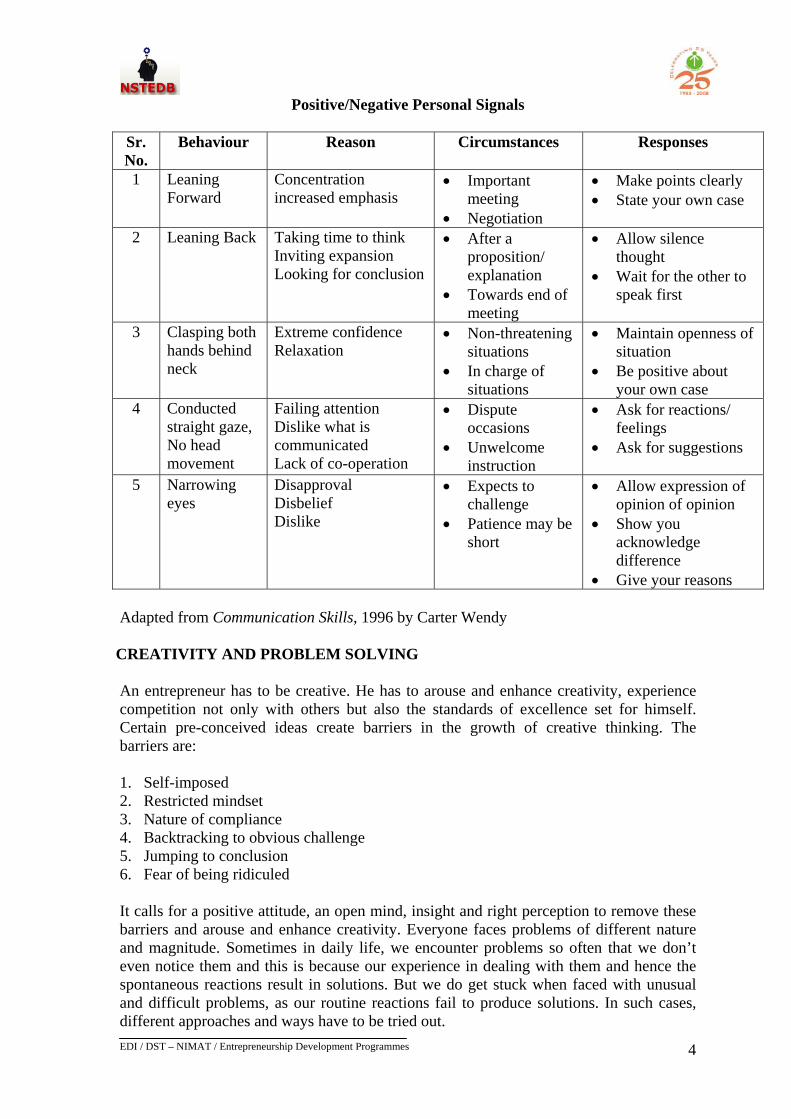
We all transmit personal, non-verbal signals continuously, mostly reflecting our attitudes and responses to communication systems. By watching and responding to signals appropriately, we can build on the positives and weed out the negatives. To some extent, most people respond to non-verbal communication, but often only to the obvious, well-known signals. The table below gives examples of such signals and their implications:
EDI / DST – NIMAT / Entrepreneurship Development Programmes
4
4
Positive/Negative Personal Signals Sr. No.
Behaviour Reason Circumstances Responses
1 Leaning Forward
Concentration increased emphasis
• Important meeting
• Negotiation
• Make points clearly • State your own case
2 Leaning Back Taking time to think
Inviting expansion Looking for conclusion
• After a proposition/ explanation
• Towards end of meeting
• Allow silence thought
• Wait for the other to speak first
3 Clasping both
hands behind neck
Extreme confidence Relaxation
• Non-threatening situations
• In charge of situations
• Maintain openness of situation
• Be positive about your own case
4 Conducted straight gaze, No head movement
Failing attention Dislike what is communicated Lack of co-operation
• Dispute occasions
• Unwelcome instruction
• Ask for reactions/ feelings
• Ask for suggestions
5 Narrowing eyes
Disapproval Disbelief Dislike
• Expects to challenge
• Patience may be short
• Allow expression of opinion of opinion
• Show you acknowledge difference
• Give your reasons
Adapted from Communication Skills, 1996 by Carter Wendy CREATIVITY AND PROBLEM SOLVING An entrepreneur has to be creative. He has to arouse and enhance creativity, experience competition not only with others but also the standards of excellence set for himself. Certain pre-conceived ideas create barriers in the growth of creative thinking. The barriers are: 1. Self-imposed 2. Restricted mindset 3. Nature of compliance 4. Backtracking to obvious challenge 5. Jumping to conclusion 6. Fear of being ridiculed It calls for a positive attitude, an open mind, insight and right perception to remove these barriers and arouse and enhance creativity. Everyone faces problems of different nature and magnitude. Sometimes in daily life, we encounter problems so often that we don’t even notice them and this is because our experience in dealing with them and hence the spontaneous reactions result in solutions. But we do get stuck when faced with unusual and difficult problems, as our routine reactions fail to produce solutions. In such cases, different approaches and ways have to be tried out.
EDI / DST – NIMAT / Entrepreneurship Development Programmes
5
5
Similarly, as an entrepreneur you may face several problems while managing your small-scale enterprise. If you develop an appropriate system, approach and methodology to solve problems, it will prepare you to manage your affairs and problems smoothly and without tension. There are several qualitative and quantitative approaches evolved in management science to help solve problems. The right strategy would be to understand your own environment, resources, capacities, limitations, strengths and weaknesses to design the right approach. This approach will help you, initially, in working on problems and, later, in formulating your own strategy to solve them. These steps help you have a problem-solving attitude and mechanism:
• Create a desire to solve problems. • Recognize the problem. • Formulate the possible causes. • Specify the problem. • Test each cause. • Explain each cause with minimum of assumptions. • Verify your explanation and determine the cause. • Establish objectives about the resources to be produced and resources used. • Classify objectives into ‘MUST, DESIRABLE' and 'CAN BE IGNORED'
categories. • Generate alternative solutions. • Choose one solution. • Compare each solution in terms of positive and adverse consequences. • Make a decision to implement. • Internalize the process.
EDI / DST – NIMAT / Entrepreneurship Development Programmes
6
6
CHAPTER – 3
PLANNING A SMALL-SCALE UNIT AND WHOM TO APPROACH FOR WHAT
Speed with which you implement your project is critical during these days of competition. If you have planned in advance and evaluated resources required, your project will be implemented in the shortest possible time. The first step to initiate planning is to identify a suitable project. PROJECT IDENTIFICATION There are no set rules to identify a suitable project, though this is one decision on which the success of your entire venture hinges. So, don’t take hasty decisions. Most prospective entrepreneurs tend to display the herd tendency and go for a project, which people have already ventured into. This is not a healthy attitude as success of one in a particular field does not guarantee success of the other. While identifying a suitable project, you should make a SWOT analysis of your own strengths and weaknesses. The next step, after you have selected your project, is to collect all information about it. The most important information is about the potential market of the items you selected. There are several ways for this. You may go for a basic desk survey, a snap survey or a detailed market survey. PROJECT REPORT: A FORECAST PLAN Now, you will need to prepare a feasibility report about your project. A feasibility report will broadly contain:
a) The background of the entrepreneur and the constitution of the business b) Market potential and marketing strategy c) Selection of location d) Requirements for land and building e) Manufacturing process f) Requirements of plant and machinery g) Requirement of utilities h) Requirement of raw material i) Estimated cost of the project j) Proposed means of finance k) Cost of production and profitability l) Break-even point m) Cash flow statement n) Internal rte of return, and o) Economic viability
REQUIREMENTS TO START A BUSINESS Selection of Location: A Vital Decision This is extremely important. Usually, small-scale entrepreneurs are found to have a predetermined location. The location should be decided according to the proximity to
EDI / DST – NIMAT / Entrepreneurship Development Programmes
7
7
sources of raw materials, consumption centers, availability of infrastructure, necessary skills in surrounding areas and availability of incentives. Sometimes the requirements conflict with one another and a particular location may not match all. Such situations want you to balance out the requirements, while also ensuring that they do not affect the viability of the project. Experience shows most entrepreneurs attaching more importance to available financial incentives and ignoring other important aspects guiding the selection of the location. Such misplaced emphasis may run the project into un-viability in the long run. Your decision on the location, therefore, should not just be based on incentives, but more on availability of infrastructure and skills. Land and Building: Make Correct Assessment Before assessing land requirements, you must draw up a plant layout based on the type of facilities proposed to be installed. Normally, the land should not exceed five to six times the built-up area; but it all finally depends upon the project. Land in excess of the requirement will block up funds, which could otherwise be utilized for productive purposes. The land should be free from any encumbrances and should be non-agricultural. Select the Right Manufacturing Process Suitable manufacturing processes have to be identified for production. Some products may need a particular process depending upon raw material availability, the prices and the quality requirement of the end product. A detailed flow chart may also be drawn with all operating parameters. Government Formalities and Procedures The process of planning also includes planning for execution of various government formalities. Though the government in the post-liberalisation era intends to reduce permissions/clearances to free the industry from bureaucratic controls, you need to clear specific formalities to avail certain benefits. The following formalities need to be considered for small-scale units: i) SSI Registration: Required for the Records Though SSI registration is not mandatory according to recent changes in the rules, it is advisable you register your small-scale unit with the District Industries Centre (DIC) of the district your project will be located. The government requires this registration to plan for future needs of the industry and it is in your interest to register your unit. ii) Acquisition of Infrastructure Facilities If you plan to locate your project in an industrial estate promoted by a government agency, you may apply for a built-up shed or a plot of land. You can start your activities once the shed/plot is offered. If you have been allotted a plot, you can start construction after your building plans are approved. In either case, you have to apply for power connection to the State Electricity Board and for water to the authorities concerned.
EDI / DST – NIMAT / Entrepreneurship Development Programmes
8
8
iii) Pollution Control Clearance: Obtain NOC or Consent You should also apply for obtaining an NOC from the State Pollution Control Board (PCB). If your unit is likely to be a pollution hazard or may discharge effluents, the PCB first issues an NOC with certain conditions to install facilities to check air or water pollution to specific levels. After you have installed the necessary facilities and they are satisfied, the PCB gives its consent to start the operations. iv) Constitution of the Business You should decide on the organizational form of your business, viz. if it should be a proprietorship, partnership or a private limited company, according to the size of its operations and the degree of risk involved. In proprietorship, the gains and losses of the business rest with the proprietor, while in partnership, all the partners share the gains and the losses except the minor partners, who are exempt from bearing the losses. In a private limited company, the members take the gain or losses as per their holding in the company, for it is considered to be a separate legal entity. Once the business constitution is decided, you may undertake necessary formalities for registering the firm accordingly. v) Arrangement of Finance for Fixed Assets and Current Assets After taking these clearances, you may apply for a term loan either to a state-level financial institution or a commercial bank, with a techno-economic feasibility report, including market survey, and all documentary evidence justifying your claim for the project being feasible. Once the loan is sanctioned, you may have to execute necessary legal documents mortgaging your assets. The disbursement of the term loan usually starts after you have fulfilled all the conditions and also after 50 per cent of your own capital is raised and invested in the project. The institutions generally disburse 75 per cent of the loan sanctioned on a matching basis. Thereafter, you should raise and invest the rest of your contribution to stake your claim for disbursal of the balance term loan. Simultaneously, you can also negotiate with your bankers to sanction the working capital requirements. The bankers would, however, consider the working capital loan only after the term loan is sanctioned. If you propose to locate your project in developing areas eligible for State incentives, you will need to apply for registration and sanction with the State authority to avail the incentives. Only after you get the sanctions can you start implementing your project. vi) Government Formalities Need to be Viewed in Proper Perspective Experience shows that many people do not give adequate weightage to complying with various government formalities. Utmost care should be taken in this connection during the planning stage itself, as in the case of ignorance the project implementation gets delayed and incurs cost overruns, and sometimes derails the entire project. You must also be aware of the sequence of steps to be followed while planning a small-scale unit. There are no rigid rules, but experience reveals that nothing important will be missed if you follow the sequence. Some activities can be handled simultaneously. The sequence may vary according to the needs and size of your project. You may decide basing on ground realities. The steps above will help you develop an insight into project planning. Fine-tuning project implementation activities at the planning stage will help you
EDI / DST – NIMAT / Entrepreneurship Development Programmes
9
9
coordinate resources appropriately in keeping with the project needs and avoid slippage in implementation and cost overruns. Whom to Approach for What? New entrepreneurs must know where to go for a particular piece of information as this knowledge will help them avoid a lot of running around. For this, they must know clearly what they are looking for. Some of you may be completely ignorant, a few may know about marketing or production or finance, etc. The completely ignorant will require initial desk work and discussions with knowledgeable persons like the EDP trainer, extension officers, businessmen, small-scale industrialists, etc. This will help you accelerate the process of enterprise establishment. Those with some knowledge will require specific information. It will be useful for them to list the various things to be completed to set up their enterprise. This desk work will give them a clear idea about the assistance they need to fulfill their activities. Various development agencies assist entrepreneurs: a) Some agencies provide only general information and you yourself have to collect
specific information. b) Some provide technical/marketing expertise in specialized areas. c) Some provide guidance in technical and financial matters, besides taking up turnkey
responsibility (implementation assistance). But government formalities will have to be completed by the entrepreneurs themselves. They can contact the concerned departments/offices for information. You should only retain the relevant information/data while collecting information. You must keep important information at a proper place to find them when needed. The compilation and segregation of information will need table work and it should be compared with the checklist prepared earlier to ensure all data has been collected before actual commencement of work. Expert guidance will help in decision-making process. It will be useful to acquire first-hand information from institutions to get the clear picture of the entire exercise. A table below shows various sources of information for a new entrepreneur. They need not contact all agencies except the relevant ones. However, they must contact at least the following agencies to have knowledge about small-scale industries and the procedures: • District Industries Centre • Directorate / Commissioner of Industries Office • State Financial Corporation • Technical Consultancy Organization and • Agencies Conducting Entrepreneurship Development Programmes.
EDI / DST – NIMAT / Entrepreneurship Development Programmes
10
10
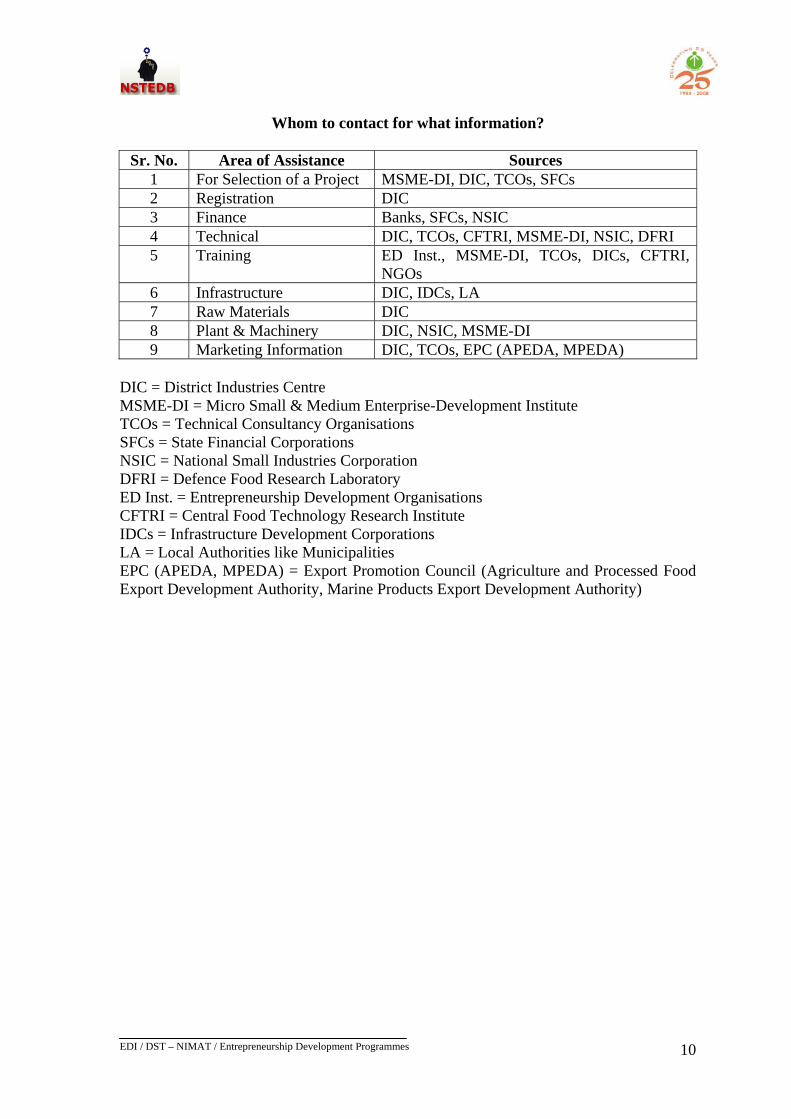
Whom to contact for what information?
Sr. No. Area of Assistance Sources
1 For Selection of a Project MSME-DI, DIC, TCOs, SFCs 2 Registration DIC 3 Finance Banks, SFCs, NSIC 4 Technical DIC, TCOs, CFTRI, MSME-DI, NSIC, DFRI 5 Training ED Inst., MSME-DI, TCOs, DICs, CFTRI,
NGOs 6 Infrastructure DIC, IDCs, LA 7 Raw Materials DIC 8 Plant & Machinery DIC, NSIC, MSME-DI 9 Marketing Information DIC, TCOs, EPC (APEDA, MPEDA)
DIC = District Industries Centre MSME-DI = Micro Small & Medium Enterprise-Development Institute TCOs = Technical Consultancy Organisations SFCs = State Financial Corporations NSIC = National Small Industries Corporation DFRI = Defence Food Research Laboratory ED Inst. = Entrepreneurship Development Organisations CFTRI = Central Food Technology Research Institute IDCs = Infrastructure Development Corporations LA = Local Authorities like Municipalities EPC (APEDA, MPEDA) = Export Promotion Council (Agriculture and Processed Food Export Development Authority, Marine Products Export Development Authority)
EDI / DST – NIMAT / Entrepreneurship Development Programmes
11
11
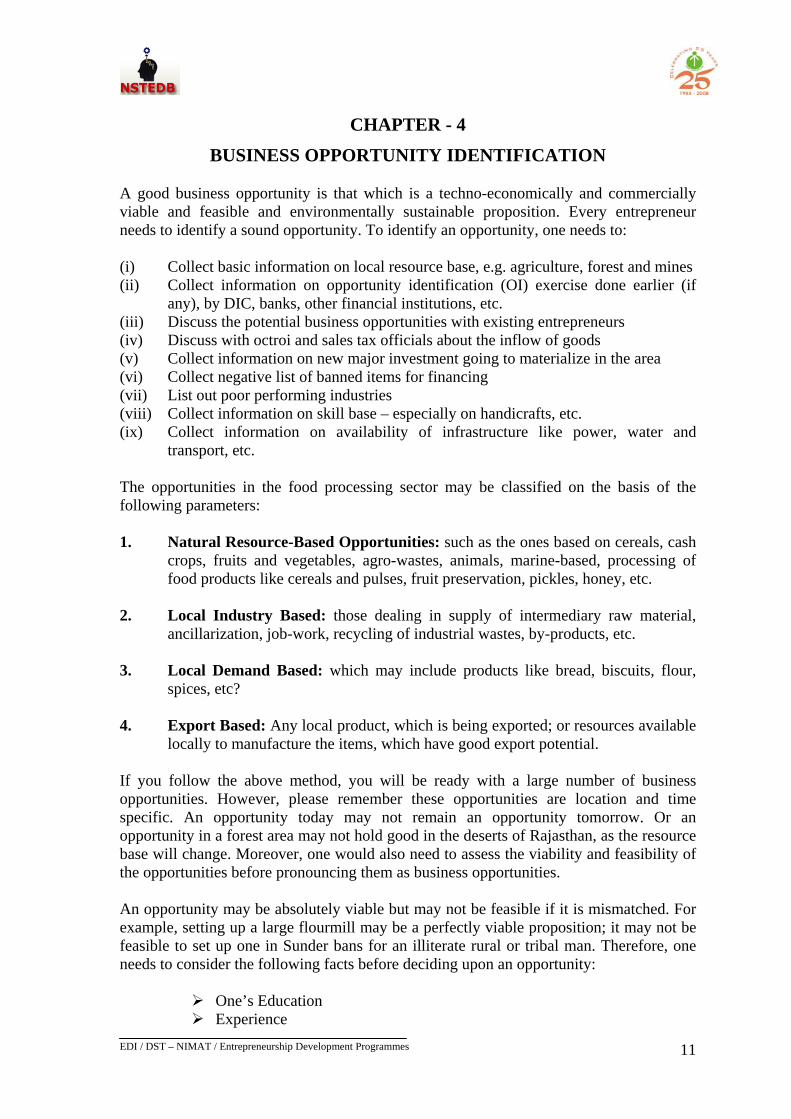
CHAPTER - 4
BUSINESS OPPORTUNITY IDENTIFICATION A good business opportunity is that which is a techno-economically and commercially viable and feasible and environmentally sustainable proposition. Every entrepreneur needs to identify a sound opportunity. To identify an opportunity, one needs to: (i) Collect basic information on local resource base, e.g. agriculture, forest and mines (ii) Collect information on opportunity identification (OI) exercise done earlier (if
any), by DIC, banks, other financial institutions, etc. (iii) Discuss the potential business opportunities with existing entrepreneurs (iv) Discuss with octroi and sales tax officials about the inflow of goods (v) Collect information on new major investment going to materialize in the area (vi) Collect negative list of banned items for financing (vii) List out poor performing industries (viii) Collect information on skill base – especially on handicrafts, etc. (ix) Collect information on availability of infrastructure like power, water and
transport, etc. The opportunities in the food processing sector may be classified on the basis of the following parameters: 1. Natural Resource-Based Opportunities: such as the ones based on cereals, cash
crops, fruits and vegetables, agro-wastes, animals, marine-based, processing of food products like cereals and pulses, fruit preservation, pickles, honey, etc.
2. Local Industry Based: those dealing in supply of intermediary raw material,
ancillarization, job-work, recycling of industrial wastes, by-products, etc. 3. Local Demand Based: which may include products like bread, biscuits, flour,
spices, etc? 4. Export Based: Any local product, which is being exported; or resources available
locally to manufacture the items, which have good export potential. If you follow the above method, you will be ready with a large number of business opportunities. However, please remember these opportunities are location and time specific. An opportunity today may not remain an opportunity tomorrow. Or an opportunity in a forest area may not hold good in the deserts of Rajasthan, as the resource base will change. Moreover, one would also need to assess the viability and feasibility of the opportunities before pronouncing them as business opportunities. An opportunity may be absolutely viable but may not be feasible if it is mismatched. For example, setting up a large flourmill may be a perfectly viable proposition; it may not be feasible to set up one in Sunder bans for an illiterate rural or tribal man. Therefore, one needs to consider the following facts before deciding upon an opportunity:
One’s Education Experience
EDI / DST – NIMAT / Entrepreneurship Development Programmes
12
12
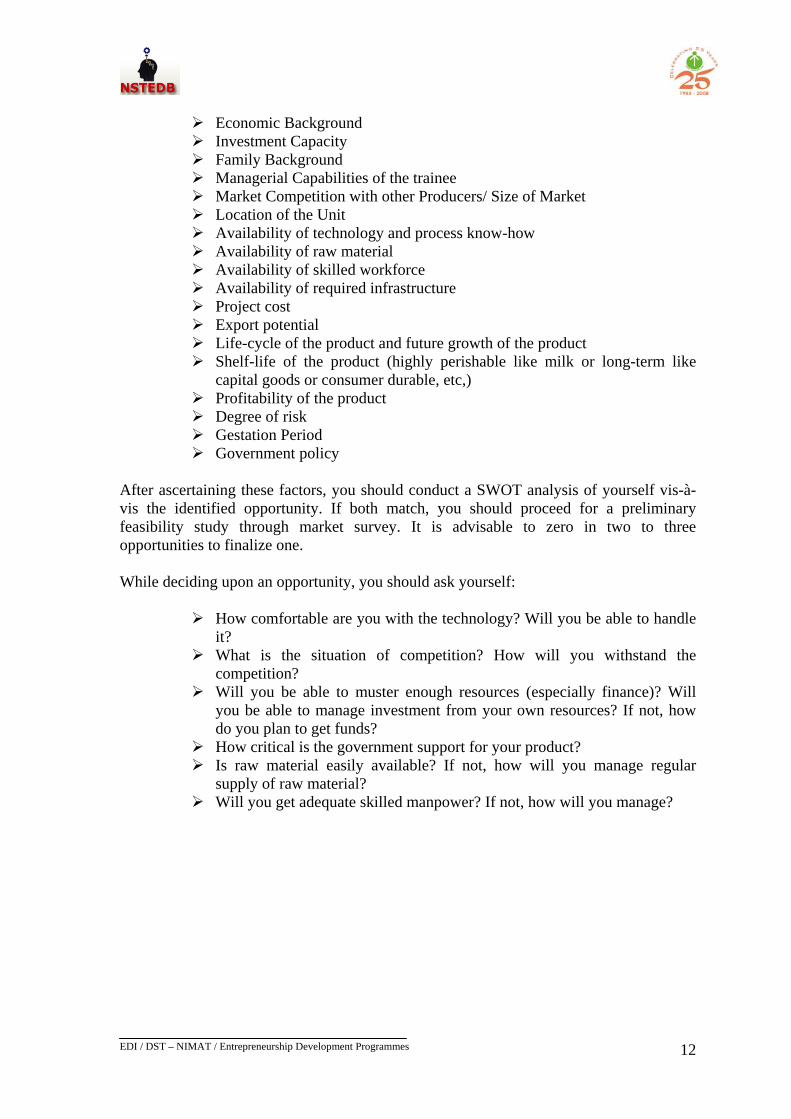
Economic Background Investment Capacity Family Background Managerial Capabilities of the trainee Market Competition with other Producers/ Size of Market Location of the Unit Availability of technology and process know-how Availability of raw material Availability of skilled workforce Availability of required infrastructure Project cost Export potential Life-cycle of the product and future growth of the product Shelf-life of the product (highly perishable like milk or long-term like
capital goods or consumer durable, etc,) Profitability of the product Degree of risk Gestation Period Government policy
After ascertaining these factors, you should conduct a SWOT analysis of yourself vis-à-vis the identified opportunity. If both match, you should proceed for a preliminary feasibility study through market survey. It is advisable to zero in two to three opportunities to finalize one. While deciding upon an opportunity, you should ask yourself:
How comfortable are you with the technology? Will you be able to handle it?
What is the situation of competition? How will you withstand the competition?
Will you be able to muster enough resources (especially finance)? Will you be able to manage investment from your own resources? If not, how do you plan to get funds?
How critical is the government support for your product? Is raw material easily available? If not, how will you manage regular
supply of raw material? Will you get adequate skilled manpower? If not, how will you manage?
EDI / DST – NIMAT / Entrepreneurship Development Programmes
13
13
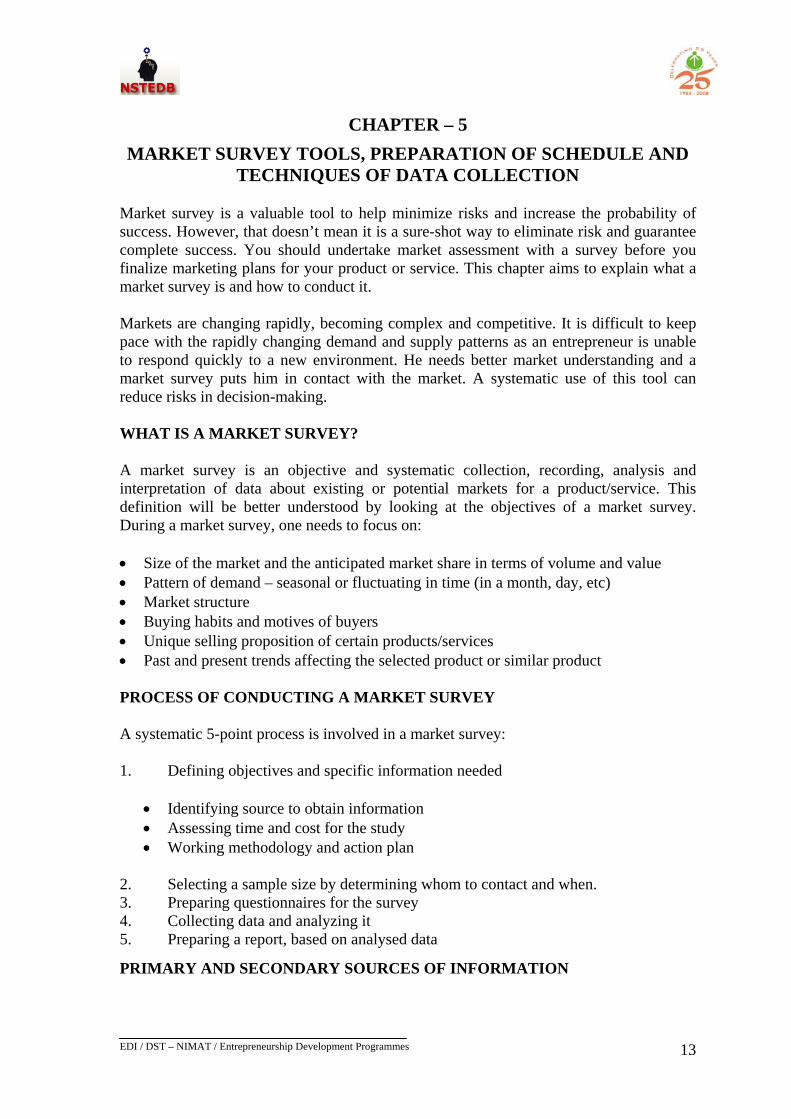
CHAPTER – 5
MARKET SURVEY TOOLS, PREPARATION OF SCHEDULE AND TECHNIQUES OF DATA COLLECTION
Market survey is a valuable tool to help minimize risks and increase the probability of success. However, that doesn’t mean it is a sure-shot way to eliminate risk and guarantee complete success. You should undertake market assessment with a survey before you finalize marketing plans for your product or service. This chapter aims to explain what a market survey is and how to conduct it. Markets are changing rapidly, becoming complex and competitive. It is difficult to keep pace with the rapidly changing demand and supply patterns as an entrepreneur is unable to respond quickly to a new environment. He needs better market understanding and a market survey puts him in contact with the market. A systematic use of this tool can reduce risks in decision-making. WHAT IS A MARKET SURVEY? A market survey is an objective and systematic collection, recording, analysis and interpretation of data about existing or potential markets for a product/service. This definition will be better understood by looking at the objectives of a market survey. During a market survey, one needs to focus on:
• Size of the market and the anticipated market share in terms of volume and value • Pattern of demand – seasonal or fluctuating in time (in a month, day, etc) • Market structure • Buying habits and motives of buyers • Unique selling proposition of certain products/services • Past and present trends affecting the selected product or similar product PROCESS OF CONDUCTING A MARKET SURVEY A systematic 5-point process is involved in a market survey: 1. Defining objectives and specific information needed
• Identifying source to obtain information • Assessing time and cost for the study • Working methodology and action plan
2. Selecting a sample size by determining whom to contact and when. 3. Preparing questionnaires for the survey 4. Collecting data and analyzing it 5. Preparing a report, based on analysed data
PRIMARY AND SECONDARY SOURCES OF INFORMATION
EDI / DST – NIMAT / Entrepreneurship Development Programmes
14
14
Conducting a market survey does not always mean contacting people directly. There may be information in the form of reports, published material or documents of trade/industry associations. Data may be collected from two sources: • Primary data sources: Information coming straight from those in the specified market,
e.g. in the toy market, information obtained from toy manufacturers and traders. • Secondary data sources: Data existing in reports or published form and may not have
been collected for specific purpose. Such information can also be had from census office, banks, traders and manufacturers’ association or other published data. E.g. published reports on ice-cream market.
SCHEDULE FOR MARKET SURVEY A market survey is not restricted to collecting information on the market for a product, but also about marketing infrastructure and existing market conditions. Designing a market survey schedule could fetch a lot of data. Questions may be designed on these areas: • Existence of competitors, their products and marketing strategies • Information on consumers of all types • Information on competing products/ similar products • Attitude of existing/potential consumers, including buying preferences, behaviour etc. DON’TS OF CONDUCTING A MARKET SURVEY • Do not be prejudiced. As an entrepreneur, you must be open-minded and confident • Do not be impatient or argumentative. Your objective is to get information • Do not reveal privileged information to others, for you may lose the trust of your
sources • Avoid taking notes while discussing. Make notes immediately after an interview.
People are not comfortable if one writes while talking. • Don’t do an interview without preparation and sequencing of questions. Ensure that
the interviewee has time for you. • Don’t approach competitors as “likely competitors” but meet them as potential clients
to get best results. MARKETING RESEARCH: 10 TIPS TO BE MORE EFFECTIVE 1. Clearly identify the issue/problem that needs to be investigated. See if any
published/secondary sources of information are available for this problem. 2. Based on existing information, check if the problem can be defined or narrowed
down. Further, with this as your basis, write down “terms of reference” for any subsequent study
3. Try to look at the problems from different angles: • your own point of view as producer or seller • customers/consumers’ viewpoint as buyer and end users of products/services • competitors’ viewpoint for they may have addressed similar problems
EDI / DST – NIMAT / Entrepreneurship Development Programmes
15
15
4. Try to remain objective throughout the market research process and check
impulses/gut feeling from totally influencing the research. 5. Prepare schedule in as simple and clear a form as possible. 6. Maintain a tight control on the subject. If other subjects surface during the
research, give them the attention they deserve. 7. Complete the research promptly and maintain confidentiality lest the competitors
hear of it and forge ahead in the market. 8. Be prepared to take necessary action, which the research identifies. 9. Use the research immediately for the good of the enterprise. 10. Review all market research exercise and processes – the lessons learnt and how
can it be improved next time? MODEL QUESTIONNAIRE FOR MARKET SURVEY For Market Potential For this, collect data about sources of market information like consumers, suppliers and manufacturers. A. Consumers
- What is their annual consumption and requirement? - What is their present source of supply? - What is the customer’s brand loyalty and preferences about price, quality,
payment terms, etc? - Are they satisfied with the present product and supply? - What is their purchasing criteria and purchasing power? - What is the consumption pattern? (basis to calculate their requirements) - What could be the future consumption pattern, in quantity and quality due to
technological changes, etc? - What is the size of the average order, specifications and time and frequency of
their placement? - Will any government institutions/departments or any company/industry buy the
products? Is it possible to establish linkages with them, and how? - What is the life of your potential buyer? - Their age group, sex? - What geographical area they live in? Urban, village and which part of the
country? B. Suppliers (Traders) - Who are the principal traders in the item, their range of products and business
terms/commissions, etc? - What is the possibility to trade with them and on what business terms? - What is the normal stock level maintained and problems in stocking? - What are future predictions on business conditions? C. Manufacturers and Competitors - What is their product range, installed capacity, selling price?
EDI / DST – NIMAT / Entrepreneurship Development Programmes
16
16
- What are their normal business terms about payment, price, etc? - What are their salient features, like technical skill, finance, other resources, etc.? - What are their strengths and weaknesses? (Try to do their SWOT analysis) - Where do they market and profile of their customers? For Information on Raw Materials • Who are the major manufacturers/suppliers? • Time required to get raw material after order placement? Supply terms (tax structure,
price, packing, payment, etc)? Cost of transportation? • What is the standard or minimum order quantity? • Is raw material freely available or is there a quota system? • Will any decision/policy affect its availability or price? For Information on Machinery and Equipment • Who are the manufacturers/suppliers? • What capacity, specifications and brands available in market? • Price of the machine? (Consider all costs – taxes, transport, accessories, etc.) • What electrical equipment like motors, starters, switches, is needed? • What performance guarantees/warranties are given? Is the supplier/manufacturer
reputed and reliable? • The normal repair/maintenance cost per year? • Spares/parts to be frequently required? • What quality and maximum output (production) a machine can give? • Does the supplier train you/staff to acquire skills to operate machinery?

EDI / DST – NIMAT / Entrepreneurship Development Programmes
17
17
CHAPTER – 6
PRODUCTION PROGRAMME, PLANT CAPACITY, MANPOWER REQUIREMENTS AND LAYOUT
PRODUCTION PROGRAMME Production programme of a unit is based on several parameters, local conditions, market access and technology. Your programme should be justified in relation to: • Market requirement and marketing strategy • Input requirements and supply schedule – seasonal nature • Technology and economy of scale • Minimum economic size and equipment constraints • Resource and input constraints • Performance of staff/labour PLANT CAPACITY You must consider these to determine your plant capacity: • Project cost corresponding to various sizes and whether you have financial resources
to meet the cost and whether you are prepared to run a risk commensurate with the project cost.
• Minimum economically viable size of plant • Popular plant size of existing small-scale enterprises making similar products • Comparative capital cost of major plant sizes, within the maximum of the project cost
you have estimated, offered by machinery producers and their operating income/expenditure implications. A comparison of net financial impact of individual plant sizes.
• Market size and growth prospects (biscuit market in India is growing rapidly and a well-organised promoter may find himself unable to meet the demand, if he chooses too small a size)
• SSI in India gets benefit in excise duty and interest rate concessions. But there is a legal ceiling on the investments in plant and machinery to avail these concessions. No wonder, most plants are priced just around that ceiling. You may choose a size matching the ceiling, for exceeding it will deprive you of excise/interest benefits.
• The cost of expanding the plant capacity vis-à-vis setting up a larger plant must be considered for it might be cheaper to establish a larger plant of 5 MT per day than to expand capacity from 2 MT to 5 MT.
MANPOWER REQUIREMENT You will need manpower for: • Production (workers) • Supervision (Technicians) • Administration, sales, miscellaneous work (staff)
EDI / DST – NIMAT / Entrepreneurship Development Programmes
18
18
In a small unit, it is possible the entrepreneur handles administration, sales and technical supervision, and thus has limited manpower needs. It is, however, important to analyse workload and arrive at a gross manpower need. Your worker requirement will be decided by manufacturing operations, material handling and packing jobs. It is useful to classify your worker-need in three categories – skilled, semi-skilled and unskilled. The wage rate for each category varies. You will have to pay special attention to hiring and retaining skilled workers. Look at the availability of skills at the selected location and plan for their recruitment. It may be, for instance, difficult for a biscuit manufacturing unit in Himachal Pradesh being established at Parwanoo to source biscuit machine operators locally. They may have to be brought from Delhi/Chandigarh. It is difficult to find skilled people in industrially backward areas and you may have to scout for them in nearby towns. Arrangements will have to be made for technical and other staff also. Keep in mind that such employees expect better living conditions or compensation and won’t move in otherwise. SELECTION OF LOCATION Ideally you will want to locate your project in your home town or your native place, but there may be a problem of high land price if that place is a large city. Usually, the government offers investment subsidy and tax concessions to enterprises in specified areas. You must be aware of various physical and commercial facilities to run an enterprise. The hometown or native place may not be an ideal choice. You should consider various parameters while deciding a location. You will then have to select a site – a specific piece of land in a given town where your enterprise will be located. Sometimes, you may also have to drop a location for want of a good site. How should one go about location/site selection? We recommend a two-stage procedure. Practically, only a few locations will merit consideration. In the first stage, identify two-three such locations. Identify one or two sites at each location. In the second stage, examine each location/site according to a six-dimension selection checklist: Basic consideration (development status of the town and its location vis-à-vis enterprise needs) • Status of physical infrastructure (power, water, etc) • Status of commercial infrastructure (telecom, banking, etc) • Status of social infrastructure (housing, health, etc) • Financial incentive position (investment subsidy, tax concessions etc) • Site-specific considerations (land price, contours, etc) You should put down the findings against each parameter before you finally commit a location.
EDI / DST – NIMAT / Entrepreneurship Development Programmes
19
19
Sources of Information on Location How do we get answers to the checklist? We try to tap the right sources of information:
• Industrial Estate Officials • Local Authorities • Revenue Department • State Electricity Board • Public Works Department • Office-bearers of Local Industry Associations • Local knowledgeable Persons/Businessmen • Banks/State Financial Corporation • District Industries Centre • Landowners, Residents of Nearby Villages/Towns, Local Opinion Leaders, etc. It is important you visit the location, armed with the checklist and put down answers to each point. You may also get water and soil tests done. You must review the data objectively and then decide your location/site. PLANT LAYOUT PLAN You will need to develop a factory layout plan to decide on location of each facility like raw material, storage, individual machines, packaging, finished goods storage and quality control unit. Work out the space for each. The distance between one facility and another or one machine and another should meet technical requirements. Usually, the flows of production process and space requirements for material handling and manpower determine the layout. It calls for considerable technical knowledge. Without the layout plan, it is not possible to decide the gross built-up area of the enterprise.
EDI / DST – NIMAT / Entrepreneurship Development Programmes
20
20
CHAPTER - 7
BUSINESS PLAN FORMAT FOR MICRO AND SMALL ENTERPRISES
A business plan helps the entrepreneur set out objectives, targets and benchmarks. It is also a prerequisite to get credit from lending agencies like banks and State Financial Corporations, etc. It is a blueprint or a road map for your business. The purpose of a business plan is: • to arrange thoughts logically • to highlight resource needs and their sources • to raise funds from a bank or other source • to demonstrate viability of the business proposition and potential to repay credit • to stimulate reality and anticipate pitfalls before they occur Your business plan must answer these questions: • What do you intend to do/how do you intend to do it/when do you intend to do it? • How much do you wish to borrow? • When will you repay it? • Will you be able to pay the interest? • Can your business survive a setback in its plans? • What is the security available for lending? • How many jobs will be created? • Is the business proposal commercially viable? • Will the business be profitable? • Can the business cope with inflation? Your business plan must include the following in sequential order: • Summary of the Project/ Project at a Glance
(The purpose of the business plan, location, resource needs, volume of business, brief note on market, customers, promoters and financial highlights)
• General information (About the business and promoter’s qualification, training and relevant experience)
• Details of the Proposed Project (Requirement of fixed and working capital, project cost and means of finance)
• Market Potential (A note on marketing strategy, potential customers, competition, market size and future prospects)
• Manufacturing Process (Step-by-step description of the manufacturing process, plant capacity, expansion plans and quality control procedures, etc)
• Production Programme/Sales Revenue (Plant capacity, capacity utilization, quantity produced/sold and sale realization)
• Cost of Manufacturing (Cost of raw material, utilities, manpower, repairs and maintenance, selling and distribution expenses, administrative overheads, interest on loans availed, depreciation and any other expenses)
• Profitability Projects (Sales, cost of manufacturing, tax liabilities, repayments, retained profit/loss)
EDI / DST – NIMAT / Entrepreneurship Development Programmes
21
21
CHAPTER – 8
THE FINANCIALS OF A PROJECT REPORT A SCAN OF ACTORS PRIOR TO PREPARATION OF A PLAN Before you prepare a business plan, you must analyse various factors and related actors. This manual stresses this aspect repeatedly. This chapter analyses actors existing in a district, including other enterprises, particularly relating to institution-information-enterprise gaps and problems. The findings about raw material stocking and market issues are to be incorporated in the financials of a business plan in the context of dehydrated vegetable unit and a grain processing enterprise. Consider Patna district in Bihar, where the crops grown are vegetables, grains and grams. A study of enterprises in the region shows that the food processing sector is less developed than the agricultural sector. There are several rice and flourmills. The agricultural resources are vital raw material for such enterprises. Milling activities include paddy milling. The by-products are rice, bran and husk. Several dal mills are also there. Their main activity is green and bengal gram milling. The State Government encourages self-help groups to set up small food processing units making pickles, spice powder, papads etc and these enterprises and others dominate the local market. Institutions/associations at local level include industry associations, District Rural Development Agency (DRDA) and financial institutions. According to Government of India’s capital investment criteria, in case enterprise engaged in the Manufacturing or Production of Goods pertaining to any industry as per First Schedule to the Industries (Development & Regulation) Act 1951 is classified as- Micro Enterprises: in which the investment in fixed assets in plant and Machinery does not exceed Rs. 25 Lacs (Rupees Twenty Five Lacs Only) Small Enterprises: in which the investment in fixed assets in plant and Machinery is more than Rs. 25 Lacs (Rupees Twenty Five Lacs Only) but does not exceed Rs. 5 Crore. Medium Enterprises: in which the investment in fixed assets in plant and Machinery is more than Rs. 5 Crore but does not exceed Rs. 10 Crore. In case of Enterprises engaged in providing or Rendering Services as: Micro Enterprises: in which the investment in fixed assets in plant and Machinery does not exceed Rs. 10 Lacs (Rupees Ten Lacs Only) Small Enterprises: in which the investment in fixed assets in plant and Machinery is more than Rs. 10 Lacs (Rupees Ten Lacs Only) but does not exceed Rs. 2 Crore. Medium Enterprises: in which the investment in fixed assets in plant and Machinery is more than Rs. 2 Crore but does not exceed Rs. 5 Crore.
EDI / DST – NIMAT / Entrepreneurship Development Programmes
22
22
Lacunae in Information and Support System Linkages The main activity of the units here is processing of jams, pickles, papads, spices and rice and dal milling. Within similar product-mix, medium and smaller units cater to the brand and quality conscious affluent sections. Packaging quality is better and prices are higher. In the lower end, tiny and cottage units vie with each other for their market share through lower price and margins. Their market comprises low income group consumers, who buy non-branded and low priced products. Units without their own marketing outlets undertake distribution through local outlets. The State Government is encouraging Self Help Groups (SHGs) to sell their products through exhibitions. Most products have simple packing material with the manufacturer’s name on the pack. ‘Unorganised’ enterprises are hardly aware of food related norms. Rice and dal mills procure raw material through commission agents. Rice millers used to sell rice to the Food Corporation of India (FCI) and in the open market through commission agents. In the processing sector, rice millers face problems like high percentage of brokens and need upgraded technology. The milling and polishing of paddy require electricity. Consumption of electricity is high in this case. The reason is use of rewound and and higher HP motors. Most milling units face problems with institutional finance. Local suppliers largely meet the machine and equipment needs of the units. Also, the main weakness of enterprises here is the lack of testing facilities and access to information on advanced technology, quality and food-related norms. Few SSI units are aware of the Mysore-based CFTRI, which has excellent infrastructure to provide consultancy on technology, equipment design etc. Yet, options like value-added products or reducing ‘brokens’ by involving agencies like CFTRI are unexplored. There is dearth of information on packaging to improve shelf life with the support of agencies like DRDA, while the latter has backed such initiatives in other regions. Can Policy Incentives Substitute for such Gaps? The Bihar Government offers several special fiscal concessions like sales tax relief/exemption on purchase of raw material/exemption in excise duty. Fiscal incentives include investment subsidy up to 25 % of fixed investment, subsidy between 20% and 25% on cost of installing captive power generators, subsidy on cost of preparing feasibility/project reports, subsidy on technical know-how, etc. The Bihar State Industrial Development Corporation offers equity participation in ventures. The State Government’s five-year policy, effective from 1.1.90, had, in fact decided to continue capital investment subsidy to all new units set up in all districts at a rate of 15% of the equity (maximum Rs. 1.5 million). This facility is also available for expansion programmes of existing units, provided the capacity is raised by at least 50% of the installed capacity. Additional 5% (limited to Rs. 5 lakhs) capital investment subsidy is given to units located in notified growth centers, units promoted by NRIs and cent percent export–oriented units. Additional 10% subsidy (maximum Rs. 1 million) is for investment on energy saving schemes based on energy audit reports or otherwise for small and medium units. Subsidy on power, water and such utilities is also available. However, although incentives are important, there are other aspects also which are crucial. Be it Bihar or Assam, other critical parameters like raw material availability and their prices/quality/domestic market potential/labour availability need to be considered
EDI / DST – NIMAT / Entrepreneurship Development Programmes
23
23
before structuring the project costs, means of finance and working capital requirements. On this basis, financial statements may be developed with profitability analysis. Such structuring is presented in the form of a pulse processing enterprise in Patna in sub-section 5 of this chapter. First, two cases of grain processing units are given here to help understand how not to structure your project costs/means of finance. INTERNAL FACTORS KILL AN ENTERPRISE: SINHA RICE MILLS, PATNA, BIHAR Established in 1997 near Patna, the mill was engaged in de-husking paddy and rice shelling with an installed capacity of 2,400 MT paddy per annum. The target market was Patna city. A term loan was provided by the SFC and working capital by a commercial bank. But by 2001, the unit became unviable. Depressed Project Cost and Working Capital Finance and hence Means of Finance: The Culprit The enterprise was doomed since inception due to under finance. It faced a problem in the first two years because of poor monsoon with the failure of paddy crop. The paddy prices in other regions were high, while payments were getting delayed. This resulted in a cash crunch. Then, the bank discontinued its cash credit. Written assurances by the promoter to liquidate over drawl of CC limit in monthly installments and application for relief were not entertained. The bankers later froze the account and the unit was strapped for working capital. As a cumulative effect of delayed payments and high input costs, the unit worked at very low capacity and incurred huge losses. With no institutional support for working capital, poor capacity utilization contributed to the tragedy. The enterprise closed for three months. But later, bumper harvests of paddy made purchase easier and cheaper. The promoter borrowed money from friends in the form of unsecured loans and re-started operations. The main problems were the failure of paddy crop for two years and subsequent increase in input costs. The problem seems external and not internal, but it is not. In fact, even during a ‘good’ year input prices fluctuate up to 200 per cent depending on the ‘season’ or ‘non-season’ timing of purchase. In his project report, the promoter simply took the average of purchase price trends of previous years. Had he taken the weighted average purchase price of the months when a price level prevails, he would have projected a purchase price and working capital double than what he had asked. It was his fault that he did not project his working capital needs and margin higher. Besides, he had also misjudged the importance of a credit strategy to push sales. In other grain milling enterprises in the region, 70% sales were on two-month credit. His was only 50%, but he had not even consider credit sale necessary while projecting working capital nor did he include the relevant margin in his report submitted to and sanctioned by the term lender and banker. Infuse Funds as Working Capital and Focus on the Procurement front to Revive Manufacturing facilities of the enterprise were good, while the main raw material, paddy, was available locally. But, resources and equipment do not make an enterprise. He need, in future, reinvest all surplus earnings in business as working capital to enable him to procure and stock raw material when prices are low and use it over a period of time. Sustainable management is all about taking timely decisions and procuring adequate raw material inputs.
EDI / DST – NIMAT / Entrepreneurship Development Programmes
24
24
At 60% capacity utilization, sales of basmati, husk, rice barn etc and paddy milling could have touched Rs. 150 lakhs. At this level of operation, the enterprise could earn Rs. 20 lakhs profit by incurring Rs. 130 lakhs expenditure. These expenses also cover the liabilities on term loan and working capital. In two years, it could have earned Return on Investment (RoI) of 29%. For a few months, the enterprise could mobilize funds from friends and relatives and regularize repayment of dues of term loan and working capital. Over two years, the surpluses generated could replace such support. The irregularity in existing term loan and interest since its disbursement can be corrected during this period. With additional doses of working capital, the unit can become viable. Offering cash discount for cash purchase and identifying alternative sources of procurement to avoid adverse input problems in the region are other options the enterprise may pursue for revival. INGTY DAL MILLS, ASSAM: EXTERNAL FACTORS LIKE BAD DEBTS COULD ALSO AFFECT PERFORMANCE Ingty Dal Mills, a sole proprietary firm, was promoted by Ingty to manufacture dal, besan and flour with an installed capacity of 12 MT/day for dal, 4 MT for besan and 8 MT for flour. This capacity is based on 300 working days in one shift of 8 hours. The Department of Industries and Commerce (DIC) granted the unit permission to grind wheat in 1997. There are other Roller flour mills in the district for wheat milling. All are operational. This is the only unit engaged in processing of grams and other gram products i.e. dal and besan. The enterprise had potential for the local market and was doing well till 2000 and could repay interest and principal obligations to institutions in time. Later, payments were blocked owing to recessionary conditions and the enterprise had to be closed down due to non-recovery of receivables. An analysis of the Enterprise’s Performance: Indicators of Un-sustainability The financial statements of the enterprise for the last two-three years showed in 2001-02 and 2002-03 that it made ‘cash’ losses. An analysis of the structural strength and liquidity viz. ability to meet short-term liabilities, profitability and performance of the enterprise is revealing. Structural strength: The unit had promoter’s fund of Rs. 10 lakhs in 2001-02. However, the accumulated losses by 2002-03 were Rs. 6.62 lakhs. Total outside liabilities had been rising because of non-payment of interest liabilities. Liquidity: The current ratio viz. current assets over current liabilities was 0.76 in 2001-02 and it declined to 0.52 in 2002-03, showing that current assets were insufficient to meet current liabilities. Current assets largely included stock and debtors while current liabilities were creditors. Though the promoters infused Rs. 8 lakhs into the business in last three years, the liabilities of creditors remain high. Turnover: Stock of finished goods and receivables for credit sales were high in 2001-02 and 2002-03. Profitability: Since the unit was near Guwahati and the local market had good potential, the unit did well initially and the dues were regularly paid up to 2000. Performance deteriorated rapidly due to repayment problems from two major traders (debtors).
EDI / DST – NIMAT / Entrepreneurship Development Programmes
25
25
A revival plan could have been evolved based on analysis of past performance and future projections on various parameters. Evolving cost of project and means of finance for revival was possible in the past when financial institutions were not finicky about reducing their Non-Performing Asset (NPA) portfolio. Today, most institutions prefer one-time settlement of dues. The only option for evolving, implementing and managing a sustainable project is to structure the cost of project and means of finance by properly estimating the cost of raw material procurement, working capital etc, as well as income, and deciding on the optimal means of finance through a capital structure analysis. FINANCIAL VIABILITY OF PREPARATION AND ANALYSIS Analysis of financial feasibility of a project or business plan helps study a project’s potential from financial angle. It also helps understand investment requirements and its sources. Some major components of financial viability are: • Cost of establishing a project • Means of finance or sources contributing to project cost • Capacity utilization and income and expenditure estimates on an annual basis • Profitability projections on an annual basis Income, expenditure and profit projections are made till the period of repayment to financial institutions. An eight-year period could be ideal. Projections may be made in such a manner that capacity utilization improves over the years. Parameters such as, selling price and cost of raw material may be changed every year. It is obviously difficult to project the direction or extent of such change. It is normally assumed that increase in costs over time will be matched with increase in selling price. And so, they can be assumed constant over the years. The following sub-sections introduce major components of financial viability preparations and assessment. Project Cost Project cost comprises investment for establishing an enterprise. The significant elements of project cost are land and site development, building, machinery, other fixed assets, technical know-how expenses, preliminary and pre-operative expenses, including interest during construction period, working capital margin and contingency costs. Certain administrative and financial expenses are incurred before production starts. These are Preliminary and Pre-operative (P&P) expenses. They include rent, interest during construction, Pollution Board licence, collateral related expenses like stamp duty, trial production expenses, deposits for utilities and processing fees of financial institutions. Contingency is a provision made for escalation of cost of equipment, for instance, in the lag between plan preparation and project implementation. These are the key components of project cost: 1. Land and site development: Cost of land, legal charges, leveling and developing
charges, fencing etc. 2. Civil works: Factory building, office, warehouse, drainage facilities, etc 3. Plant and machinery: Price of machinery/equipment and excise duty, sales tax,
freight, octroi and installation costs
EDI / DST – NIMAT / Entrepreneurship Development Programmes
26
26
4. Other fixed assets: Furniture, office equipment like fax machines, vehicles, laboratory
and pollution control equipment, diesel generating sets, etc. Comparative quotations from several suppliers may be invited to convince lending institutions about cost of plant and machinery. Institutions, sometimes, specify ‘acceptable’ suppliers. For valuation of land and building, lender offers loan against the ‘book price’ as per documents and not ‘market price.’ A promoter should know these aspects and work closely with lending institutions. Means of Finance The common means of finance are term loan, subsidy or equity. State financial or industrial development corporation and even commercial banks offer term loan against project cost. Repayment terms vary with institutions and with schemes. The MoFPI offers subsidy on a proportion of the cost of fixed assets. Equity capital is promoters’ contribution or money contribution by others in terms of deposits and unsecured loans. The minimum amount of promoter contribution, irrespective of such private participation, could be specified at a minimum 17.5 per cent of project costs by lending institutions. Working Capital, Relevant Margin and its Assessment Funds required to operate an enterprise is Working Capital. A certain minimum amount of working capital is permanently invested in business. The entrepreneur will have to contribute this fund initially. Working capital margin, which is included in the project cost, is estimated on the basis of the year when the enterprise breaks even. The estimation of this margin depends on projections of working capital needs: • Projecting output over different years of operation • Projecting raw material input needed and unit price of each input required to produce
output and the amount of material an enterprise must carry, given first year production targets. For the latter, the ‘lead’ time between order placement and receipt should be considered. Enterprises in the food processing sector need to carry high raw material inventory, given the seasonality of production. Price of inputs vary drastically and enterprises need to stock up to reap advantage of favourable prices. The value of raw material, to be stocked, should be ascertained, as also that of other consumables and packing material to be stocked up.
• Projecting value of goods under production at any time. This will depend on the
length of the manufacturing cycle. For such valuation, direct costs of raw material, wages and utilities should be considered. You may ignore depreciation, administrative and marketing expenses.
• Projecting the level of stock of finished goods. An enterprise producing in
anticipation of demand, as do most processing enterprises may carry substantial stock of processed/semi-processed finished goods. The quantity of such stock should be valued at cost, viz. direct and indirect, sans depreciation.
• Projecting total sales on credit in terms of duration or amount of outstanding receivables. Only production cost of sales is considered.
EDI / DST – NIMAT / Entrepreneurship Development Programmes
27
27
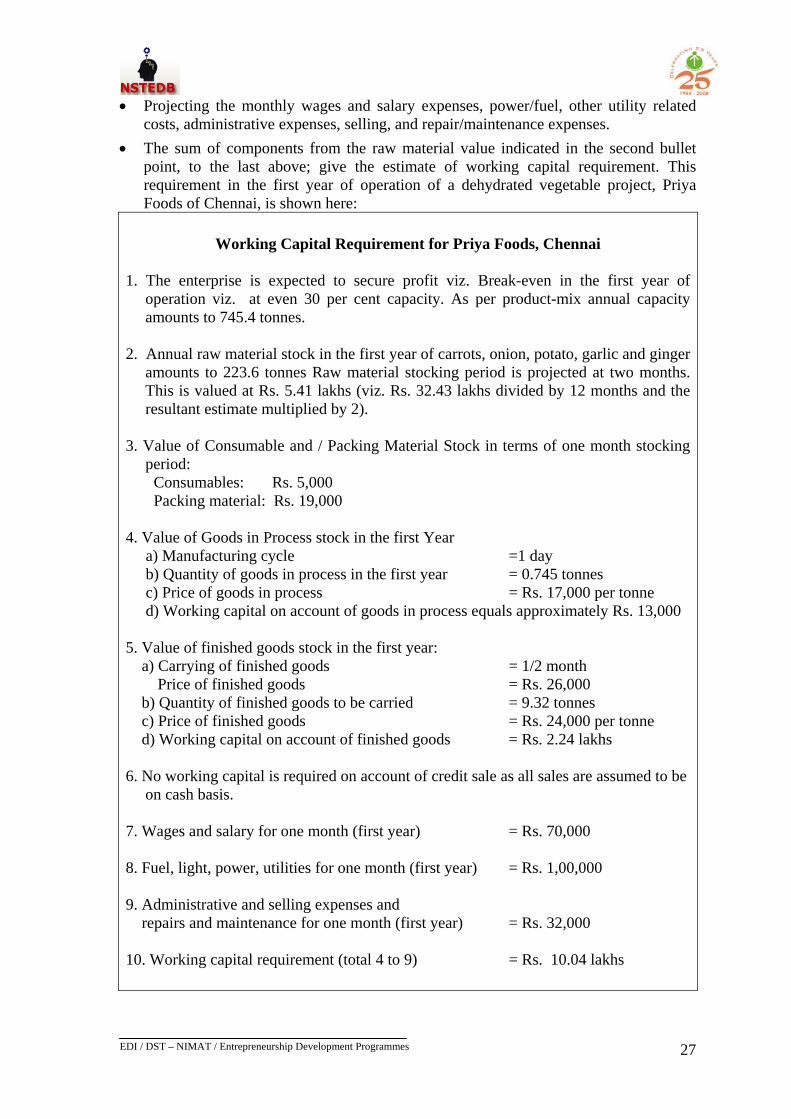
• Projecting the monthly wages and salary expenses, power/fuel, other utility related costs, administrative expenses, selling, and repair/maintenance expenses.
• The sum of components from the raw material value indicated in the second bullet point, to the last above; give the estimate of working capital requirement. This requirement in the first year of operation of a dehydrated vegetable project, Priya Foods of Chennai, is shown here:
Working Capital Requirement for Priya Foods, Chennai 1. The enterprise is expected to secure profit viz. Break-even in the first year of
operation viz. at even 30 per cent capacity. As per product-mix annual capacity amounts to 745.4 tonnes.
2. Annual raw material stock in the first year of carrots, onion, potato, garlic and ginger
amounts to 223.6 tonnes Raw material stocking period is projected at two months. This is valued at Rs. 5.41 lakhs (viz. Rs. 32.43 lakhs divided by 12 months and the resultant estimate multiplied by 2).
3. Value of Consumable and / Packing Material Stock in terms of one month stocking
period: Consumables: Rs. 5,000 Packing material: Rs. 19,000 4. Value of Goods in Process stock in the first Year a) Manufacturing cycle =1 day b) Quantity of goods in process in the first year = 0.745 tonnes c) Price of goods in process = Rs. 17,000 per tonne d) Working capital on account of goods in process equals approximately Rs. 13,000 5. Value of finished goods stock in the first year: a) Carrying of finished goods = 1/2 month Price of finished goods = Rs. 26,000 b) Quantity of finished goods to be carried = 9.32 tonnes c) Price of finished goods = Rs. 24,000 per tonne d) Working capital on account of finished goods = Rs. 2.24 lakhs 6. No working capital is required on account of credit sale as all sales are assumed to be
on cash basis. 7. Wages and salary for one month (first year) = Rs. 70,000 8. Fuel, light, power, utilities for one month (first year) = Rs. 1,00,000 9. Administrative and selling expenses and repairs and maintenance for one month (first year) = Rs. 32,000 10. Working capital requirement (total 4 to 9) = Rs. 10.04 lakhs
EDI / DST – NIMAT / Entrepreneurship Development Programmes
28
28
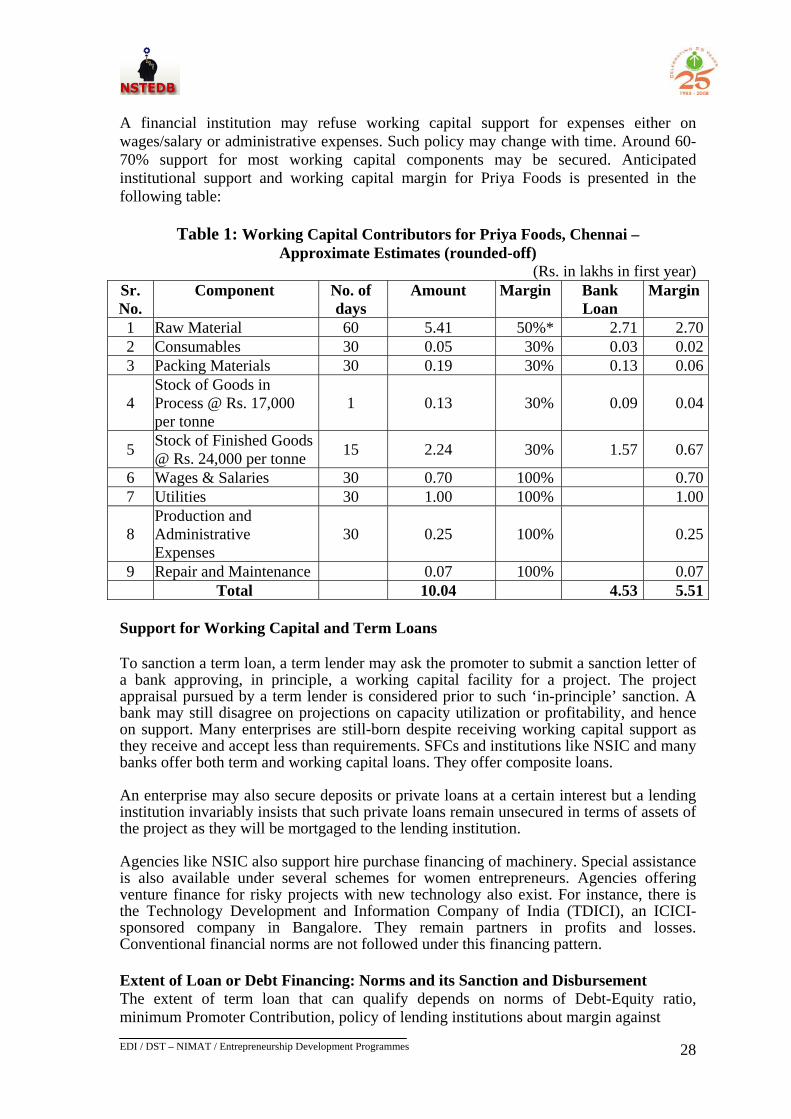
A financial institution may refuse working capital support for expenses either on wages/salary or administrative expenses. Such policy may change with time. Around 60-70% support for most working capital components may be secured. Anticipated institutional support and working capital margin for Priya Foods is presented in the following table:
Table 1: Working Capital Contributors for Priya Foods, Chennai – Approximate Estimates (rounded-off)
(Rs. in lakhs in first year) Sr. No.
Component No. of days
Amount Margin Bank Loan
Margin
1 Raw Material 60 5.41 50%* 2.71 2.702 Consumables 30 0.05 30% 0.03 0.023 Packing Materials 30 0.19 30% 0.13 0.06
4 Stock of Goods in Process @ Rs. 17,000 per tonne
1 0.13 30% 0.09 0.04
5 Stock of Finished Goods @ Rs. 24,000 per tonne 15 2.24 30% 1.57 0.67
6 Wages & Salaries 30 0.70 100% 0.707 Utilities 30 1.00 100% 1.00
8 Production and Administrative Expenses
30 0.25 100%
0.25
9 Repair and Maintenance 0.07 100% 0.07 Total 10.04 4.53 5.51
Support for Working Capital and Term Loans To sanction a term loan, a term lender may ask the promoter to submit a sanction letter of a bank approving, in principle, a working capital facility for a project. The project appraisal pursued by a term lender is considered prior to such ‘in-principle’ sanction. A bank may still disagree on projections on capacity utilization or profitability, and hence on support. Many enterprises are still-born despite receiving working capital support as they receive and accept less than requirements. SFCs and institutions like NSIC and many banks offer both term and working capital loans. They offer composite loans. An enterprise may also secure deposits or private loans at a certain interest but a lending institution invariably insists that such private loans remain unsecured in terms of assets of the project as they will be mortgaged to the lending institution. Agencies like NSIC also support hire purchase financing of machinery. Special assistance is also available under several schemes for women entrepreneurs. Agencies offering venture finance for risky projects with new technology also exist. For instance, there is the Technology Development and Information Company of India (TDICI), an ICICI-sponsored company in Bangalore. They remain partners in profits and losses. Conventional financial norms are not followed under this financing pattern. Extent of Loan or Debt Financing: Norms and its Sanction and Disbursement The extent of term loan that can qualify depends on norms of Debt-Equity ratio, minimum Promoter Contribution, policy of lending institutions about margin against
EDI / DST – NIMAT / Entrepreneurship Development Programmes
29
29
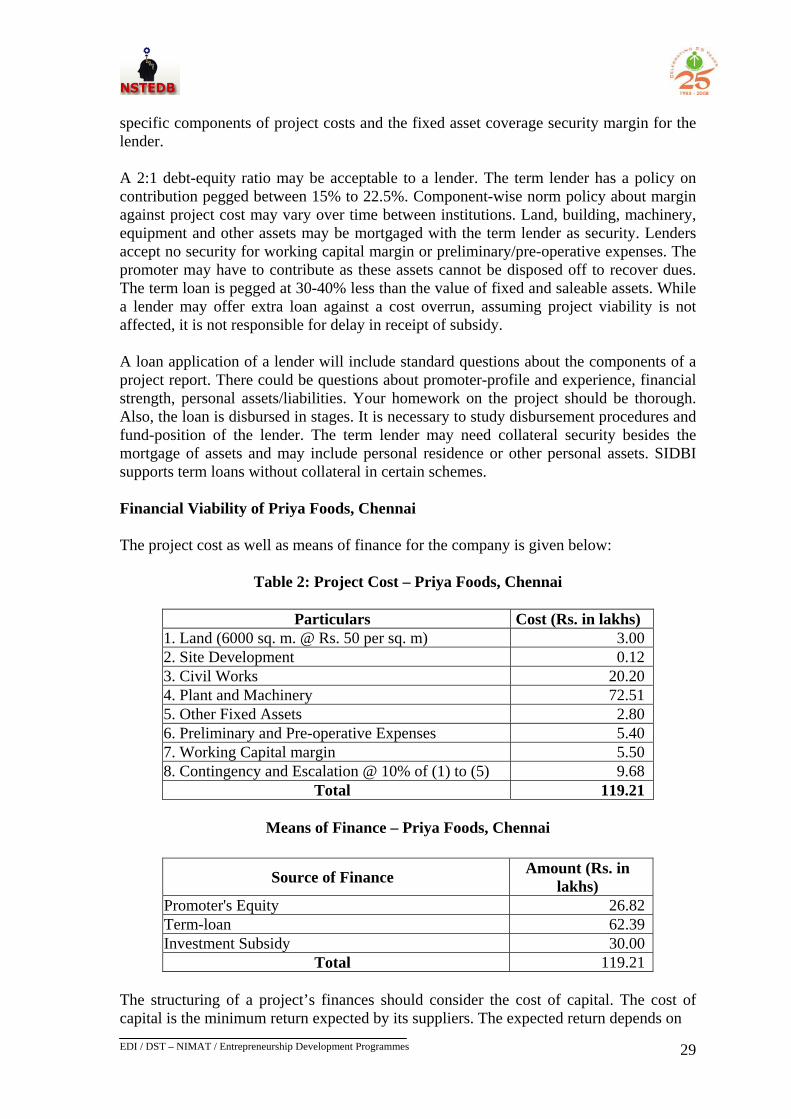
specific components of project costs and the fixed asset coverage security margin for the lender. A 2:1 debt-equity ratio may be acceptable to a lender. The term lender has a policy on contribution pegged between 15% to 22.5%. Component-wise norm policy about margin against project cost may vary over time between institutions. Land, building, machinery, equipment and other assets may be mortgaged with the term lender as security. Lenders accept no security for working capital margin or preliminary/pre-operative expenses. The promoter may have to contribute as these assets cannot be disposed off to recover dues. The term loan is pegged at 30-40% less than the value of fixed and saleable assets. While a lender may offer extra loan against a cost overrun, assuming project viability is not affected, it is not responsible for delay in receipt of subsidy. A loan application of a lender will include standard questions about the components of a project report. There could be questions about promoter-profile and experience, financial strength, personal assets/liabilities. Your homework on the project should be thorough. Also, the loan is disbursed in stages. It is necessary to study disbursement procedures and fund-position of the lender. The term lender may need collateral security besides the mortgage of assets and may include personal residence or other personal assets. SIDBI supports term loans without collateral in certain schemes. Financial Viability of Priya Foods, Chennai The project cost as well as means of finance for the company is given below:
Table 2: Project Cost – Priya Foods, Chennai
Particulars Cost (Rs. in lakhs) 1. Land (6000 sq. m. @ Rs. 50 per sq. m) 3.00 2. Site Development 0.12 3. Civil Works 20.20 4. Plant and Machinery 72.51 5. Other Fixed Assets 2.80 6. Preliminary and Pre-operative Expenses 5.40 7. Working Capital margin 5.50 8. Contingency and Escalation @ 10% of (1) to (5) 9.68
Total 119.21
Means of Finance – Priya Foods, Chennai
Source of Finance Amount (Rs. in lakhs)
Promoter's Equity 26.82 Term-loan 62.39 Investment Subsidy 30.00
Total 119.21 The structuring of a project’s finances should consider the cost of capital. The cost of capital is the minimum return expected by its suppliers. The expected return depends on
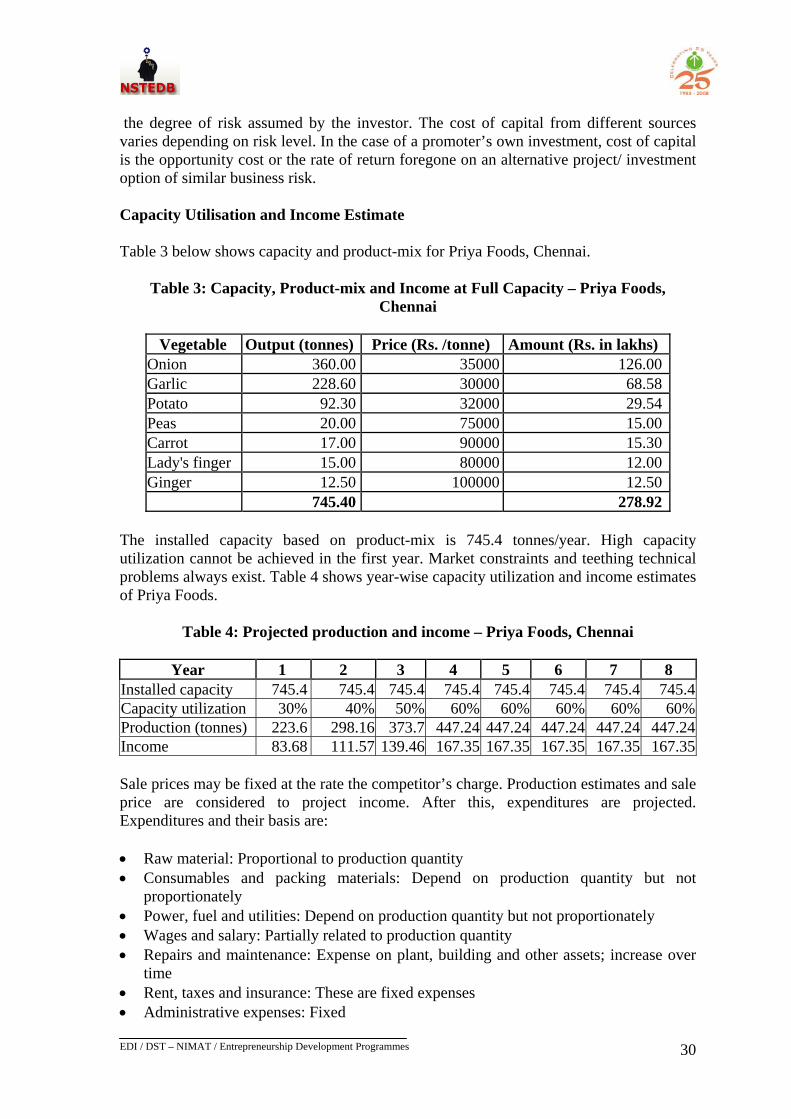
EDI / DST – NIMAT / Entrepreneurship Development Programmes
30
30
the degree of risk assumed by the investor. The cost of capital from different sources varies depending on risk level. In the case of a promoter’s own investment, cost of capital is the opportunity cost or the rate of return foregone on an alternative project/ investment option of similar business risk. Capacity Utilisation and Income Estimate Table 3 below shows capacity and product-mix for Priya Foods, Chennai.
Table 3: Capacity, Product-mix and Income at Full Capacity – Priya Foods, Chennai
Vegetable Output (tonnes) Price (Rs. /tonne) Amount (Rs. in lakhs)
Onion 360.00 35000 126.00Garlic 228.60 30000 68.58Potato 92.30 32000 29.54Peas 20.00 75000 15.00Carrot 17.00 90000 15.30Lady's finger 15.00 80000 12.00Ginger 12.50 100000 12.50 745.40 278.92
The installed capacity based on product-mix is 745.4 tonnes/year. High capacity utilization cannot be achieved in the first year. Market constraints and teething technical problems always exist. Table 4 shows year-wise capacity utilization and income estimates of Priya Foods.
Table 4: Projected production and income – Priya Foods, Chennai
Year 1 2 3 4 5 6 7 8 Installed capacity 745.4 745.4 745.4 745.4 745.4 745.4 745.4 745.4Capacity utilization 30% 40% 50% 60% 60% 60% 60% 60%Production (tonnes) 223.6 298.16 373.7 447.24 447.24 447.24 447.24 447.24Income 83.68 111.57 139.46 167.35 167.35 167.35 167.35 167.35 Sale prices may be fixed at the rate the competitor’s charge. Production estimates and sale price are considered to project income. After this, expenditures are projected. Expenditures and their basis are: • Raw material: Proportional to production quantity • Consumables and packing materials: Depend on production quantity but not
proportionately • Power, fuel and utilities: Depend on production quantity but not proportionately • Wages and salary: Partially related to production quantity • Repairs and maintenance: Expense on plant, building and other assets; increase over
time • Rent, taxes and insurance: These are fixed expenses • Administrative expenses: Fixed
EDI / DST – NIMAT / Entrepreneurship Development Programmes
31
31
• Selling expenses: Include fixed expenses as advertising and salesmen’s salary as well
as variable expenses like commission to dealers • Interest on term loan: Outstanding loan due Loan repayment plan is fixed by the term-lending agency and interest on working capital fixed by working capital provider. Interest rates depend on working capital requirement, which in turn depends on sale/production quantity and working capital margin. There are cash and non-cash expenses. Cash expenses have to be projected annually for raw material, packing, utilities, wages/salaries, repairs/maintenance, administration, selling expenses, interest on loan, rent, etc. Income minus such cash expense is cash profit. To account profit, both cash and non-cash expenses are deducted from income. Non-cash expenses include depreciation, amortization of P&P expenses and write-off of technical know-how expenditure. Value of fixed assets like building, machinery and office equipment depreciates every year. Depreciation in ‘accounting’ measures such reduction in the asset value. It also helps build a cash reserve for replacement of the existing asset later. Land’s value does not depreciate and no depreciation is provided for it. Amortization or gradual write-off of intangible assets are stipulated in income tax rules, viz. how and by how much every year. One may write off P&P and technical know-how expenditures in 10 and 6 years respectively. Contingency/escalation expenditure may be added to estimate asset cost and depreciation is provided on the resultant amount. Depreciation can be provided by two methods, straight line (SL) and written down value (WDV) method. Depreciation rates are stipulated by law and vary according to asset and industry. The WDV method enables making substantial provisions in the initial years, thereby increasing expenditure and reducing accounting profit, and hence, income tax. The SL method may be used to prepare a projected profit statement, while the WDV may be used to estimate income-tax obligations. Income Tax Projections The tax burden can be estimated as follows: • The WDV depreciation amount is subtracted from profit before tax. A percentage of
preliminary and know-how related expenditure may be deducted every year as per norms to correspondingly reduce taxable profit before tax. It is also possible to carry forward losses. Losses incurred in a particular year may be offset against profit in the following years.
• Tax incentives offered for enterprises in a region or sub-sector should be incorporated and subtracted.
• Tax calculation depends on tax rate, which depends on assessee status and legal form of an enterprise’s constitution. It may be a sole proprietary, a Hindu Undivided Family (HUF), a private or public limited company or a cooperative society. Tax rates vary accordingly. Tax is deducted from profit before tax (PBT) to arrive at profit after tax (PAT).
Financial viability and cash flow of an enterprise Viability from the lender’s point of view is the ability to repay the term loan. A financial ratio measures the enterprise’s capacity to meet term loan and interest. Related obligation
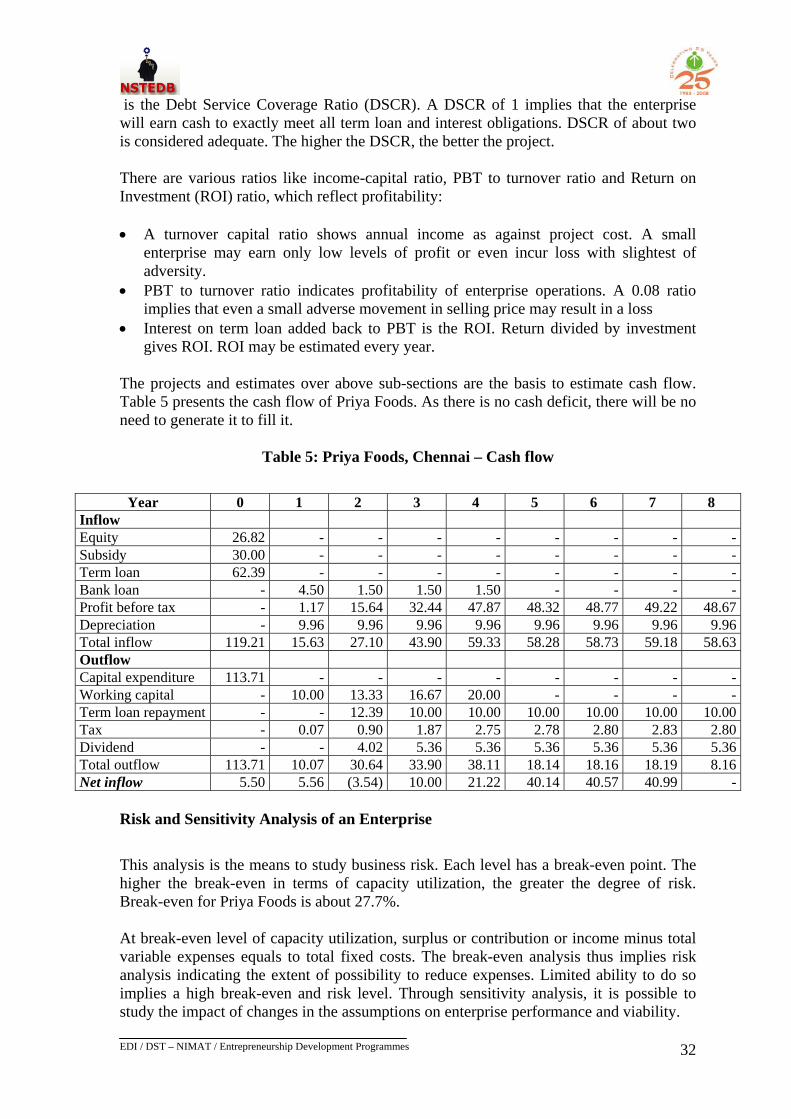
EDI / DST – NIMAT / Entrepreneurship Development Programmes
32
32
is the Debt Service Coverage Ratio (DSCR). A DSCR of 1 implies that the enterprise will earn cash to exactly meet all term loan and interest obligations. DSCR of about two is considered adequate. The higher the DSCR, the better the project. There are various ratios like income-capital ratio, PBT to turnover ratio and Return on Investment (ROI) ratio, which reflect profitability: • A turnover capital ratio shows annual income as against project cost. A small
enterprise may earn only low levels of profit or even incur loss with slightest of adversity.
• PBT to turnover ratio indicates profitability of enterprise operations. A 0.08 ratio implies that even a small adverse movement in selling price may result in a loss
• Interest on term loan added back to PBT is the ROI. Return divided by investment gives ROI. ROI may be estimated every year.
The projects and estimates over above sub-sections are the basis to estimate cash flow. Table 5 presents the cash flow of Priya Foods. As there is no cash deficit, there will be no need to generate it to fill it.
Table 5: Priya Foods, Chennai – Cash flow
Year 0 1 2 3 4 5 6 7 8
Inflow Equity 26.82 - - - - - - - -Subsidy 30.00 - - - - - - - -Term loan 62.39 - - - - - - - -Bank loan - 4.50 1.50 1.50 1.50 - - - -Profit before tax - 1.17 15.64 32.44 47.87 48.32 48.77 49.22 48.67Depreciation - 9.96 9.96 9.96 9.96 9.96 9.96 9.96 9.96Total inflow 119.21 15.63 27.10 43.90 59.33 58.28 58.73 59.18 58.63Outflow Capital expenditure 113.71 - - - - - - - -Working capital - 10.00 13.33 16.67 20.00 - - - -Term loan repayment - - 12.39 10.00 10.00 10.00 10.00 10.00 10.00Tax - 0.07 0.90 1.87 2.75 2.78 2.80 2.83 2.80Dividend - - 4.02 5.36 5.36 5.36 5.36 5.36 5.36Total outflow 113.71 10.07 30.64 33.90 38.11 18.14 18.16 18.19 8.16Net inflow 5.50 5.56 (3.54) 10.00 21.22 40.14 40.57 40.99 -
Risk and Sensitivity Analysis of an Enterprise
This analysis is the means to study business risk. Each level has a break-even point. The higher the break-even in terms of capacity utilization, the greater the degree of risk. Break-even for Priya Foods is about 27.7%. At break-even level of capacity utilization, surplus or contribution or income minus total variable expenses equals to total fixed costs. The break-even analysis thus implies risk analysis indicating the extent of possibility to reduce expenses. Limited ability to do so implies a high break-even and risk level. Through sensitivity analysis, it is possible to study the impact of changes in the assumptions on enterprise performance and viability.
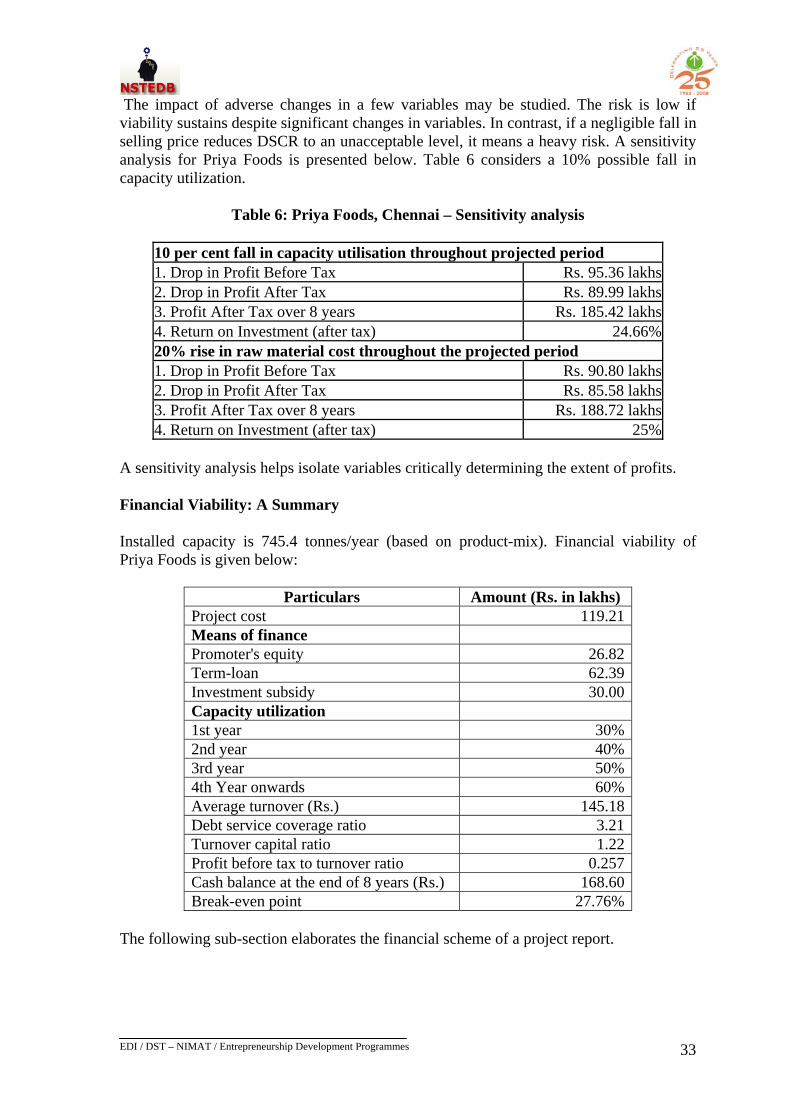
EDI / DST – NIMAT / Entrepreneurship Development Programmes
33
33
The impact of adverse changes in a few variables may be studied. The risk is low if viability sustains despite significant changes in variables. In contrast, if a negligible fall in selling price reduces DSCR to an unacceptable level, it means a heavy risk. A sensitivity analysis for Priya Foods is presented below. Table 6 considers a 10% possible fall in capacity utilization.
Table 6: Priya Foods, Chennai – Sensitivity analysis
10 per cent fall in capacity utilisation throughout projected period 1. Drop in Profit Before Tax Rs. 95.36 lakhs 2. Drop in Profit After Tax Rs. 89.99 lakhs 3. Profit After Tax over 8 years Rs. 185.42 lakhs 4. Return on Investment (after tax) 24.66% 20% rise in raw material cost throughout the projected period 1. Drop in Profit Before Tax Rs. 90.80 lakhs 2. Drop in Profit After Tax Rs. 85.58 lakhs 3. Profit After Tax over 8 years Rs. 188.72 lakhs 4. Return on Investment (after tax) 25%
A sensitivity analysis helps isolate variables critically determining the extent of profits. Financial Viability: A Summary Installed capacity is 745.4 tonnes/year (based on product-mix). Financial viability of Priya Foods is given below:
Particulars Amount (Rs. in lakhs) Project cost 119.21 Means of finance Promoter's equity 26.82 Term-loan 62.39 Investment subsidy 30.00 Capacity utilization 1st year 30% 2nd year 40% 3rd year 50% 4th Year onwards 60% Average turnover (Rs.) 145.18 Debt service coverage ratio 3.21 Turnover capital ratio 1.22 Profit before tax to turnover ratio 0.257 Cash balance at the end of 8 years (Rs.) 168.60 Break-even point 27.76%
The following sub-section elaborates the financial scheme of a project report.
EDI / DST – NIMAT / Entrepreneurship Development Programmes
34
34
A CASE ON DEVELOPING THE FINANCIAL SCHEME OF A PROJECT REPORT OR BUSINESS PLAN An entrepreneur plans to establish a mini-pulse processing unit. Advanced ‘Durham’ quality pulse is to be processed. The enterprise, to be established in an industrial estate in Guwahati, is to have an installed capacity of 24,000 kgs. per annum working in double shifts (16 hours) for 310 days a year. It is to operate at 60% of installed capacity in the first year, 70% the second year and 80% in future years. The project expense of land cost, site development and fencing is Rs. 17,000. One thousand and fifty kg of whole pulse yields 1,000 kgs. of processed dal. The price of whole-pulse is Rs. 62 a kg. It is considered sufficient to carry raw material and finished goods stock for 30 days. The production cycle time is two days. The cost of constructing buildings, including warehouse, office and factory is Rs. 2 lakhs, while that of stores, consumables and packing is estimated at Rs. 2 per kg of output. The stocking period of these items is believed to be the same as that of raw material. The cost of machinery and equipment is Rs. 4.6 lakhs and includes excise duty. Besides, sales tax and freight, insurance and octroi are estimated at 5%, each, of post-excise duty of machinery. Machinery and equipment related installation expenses are around Rs. 30,000. The average finished goods inventory is estimated at one month and 50 per cent of total sale is expected to be on credit basis, while balance will be cash sales. The credit sale will carry credit at an average of 30 days. Rs. 4,000 is required as expense on office furniture, while other such miscellaneous assets are likely to cost Rs. 6,000 more. A provision of 10% each, against possible price escalation/contingencies in fixed/miscellaneous assets be made. The term lender is expected to offer loan up to 75% of project cost. The State Bank of India, the potential working capital provider, gives assistance up to 75% for goods in process and finished goods. The bank supports up to 70% for raw material, stores, packing material and 60% of value of sundry debtors or accounts receivables. The rate of interest on working capital is 17%. Salary and wages are estimated at Rs. 7,000 a month, while administrative expenses at Rs. 3,000. The power consumption will be 15 units a day. The subsidized power tariff is Rs. 3 per unit. The selling commission to be paid is Rs. 2.50 per kg of output. Repairs and maintenance are likely to touch Rs. 30,000 per annum for the first year and rise by Rs. 2,000 thereafter. Construction period of factory is 6 months from sanction of term loan. Term loan interest is 12%. First registration and other preliminary expenses are put at Rs. 4,000. Rs. 1,000 will be needed in trial production. The selling price of dal is Rs. 110 a kg. The income tax rates for taxable profit in the range of Rs. 0.75 to Rs. 1.0 lakhs, Rs. 1.00 to Rs. 1.25 lakhs; Rs. 1.25 lakhs to Rs. 1.75 lakhs is 10%, 13%, 15% and 16.5% respectively. To estimate the financial viability of the project, various statements are needed: Project cost, working capital, means of finance, capacity utilization and income projections,
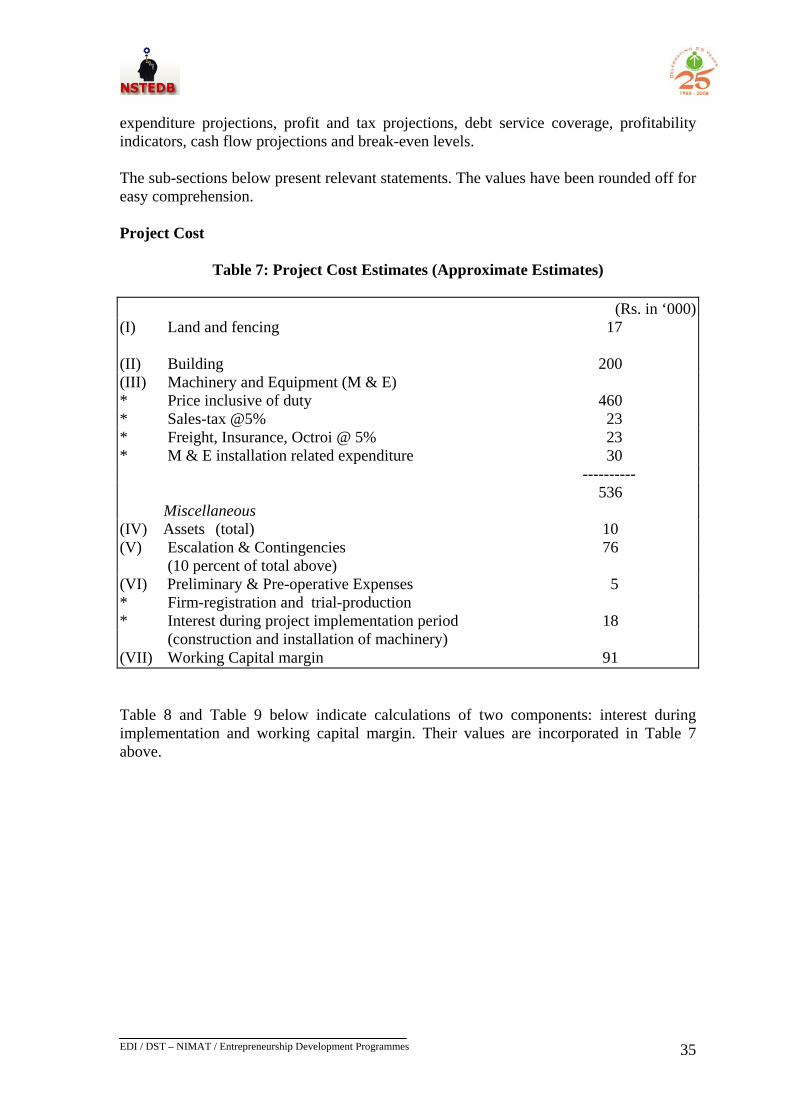
EDI / DST – NIMAT / Entrepreneurship Development Programmes
35
35
expenditure projections, profit and tax projections, debt service coverage, profitability indicators, cash flow projections and break-even levels. The sub-sections below present relevant statements. The values have been rounded off for easy comprehension. Project Cost
Table 7: Project Cost Estimates (Approximate Estimates)
(Rs. in ‘000) (I) Land and fencing 17 (II) Building 200 (III) Machinery and Equipment (M & E) * Price inclusive of duty 460 * Sales-tax @5% 23 * Freight, Insurance, Octroi @ 5% 23 * M & E installation related expenditure 30 ---------- 536 Miscellaneous (IV) Assets (total) 10 (V) Escalation & Contingencies 76 (10 percent of total above) (VI) Preliminary & Pre-operative Expenses 5 * Firm-registration and trial-production * Interest during project implementation period 18
(construction and installation of machinery) (VII) Working Capital margin 91 Table 8 and Table 9 below indicate calculations of two components: interest during implementation and working capital margin. Their values are incorporated in Table 7 above.
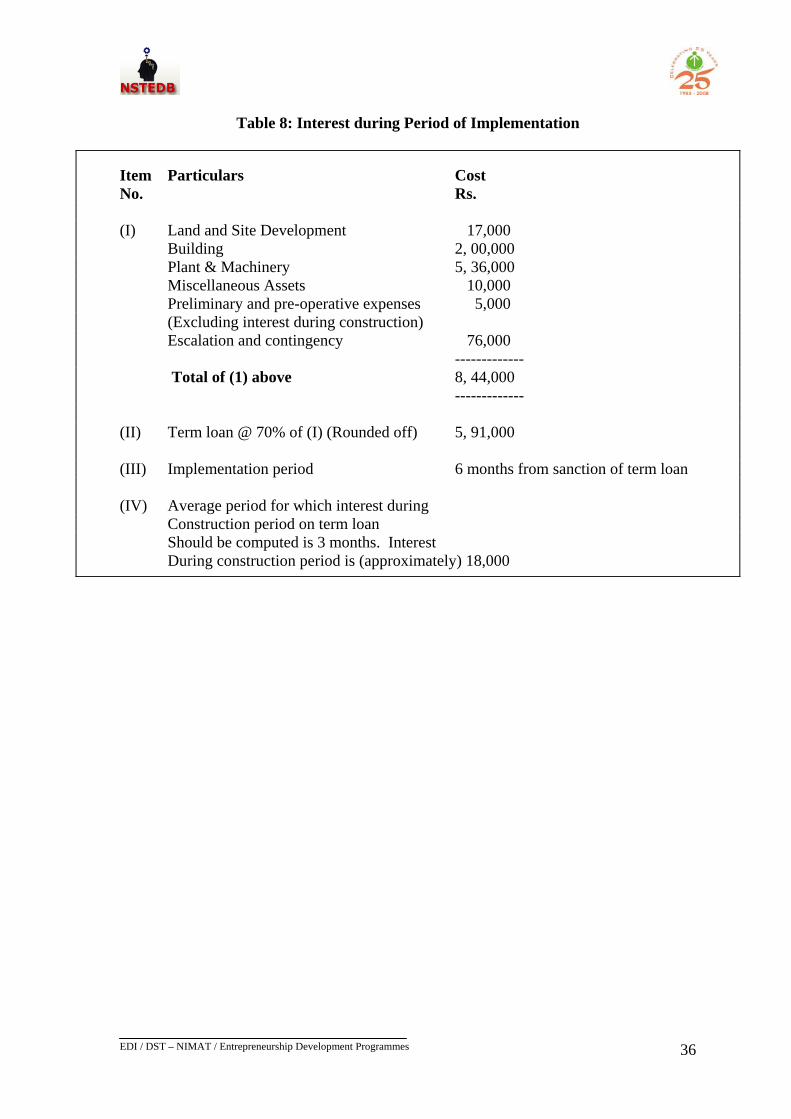
EDI / DST – NIMAT / Entrepreneurship Development Programmes
36
36
Table 8: Interest during Period of Implementation
Item Particulars Cost No. Rs. (I) Land and Site Development 17,000
Building 2, 00,000 Plant & Machinery 5, 36,000 Miscellaneous Assets 10,000 Preliminary and pre-operative expenses 5,000
(Excluding interest during construction) Escalation and contingency 76,000
------------- Total of (1) above 8, 44,000 ------------- (II) Term loan @ 70% of (I) (Rounded off) 5, 91,000 (III) Implementation period 6 months from sanction of term loan (IV) Average period for which interest during
Construction period on term loan Should be computed is 3 months. Interest During construction period is (approximately) 18,000
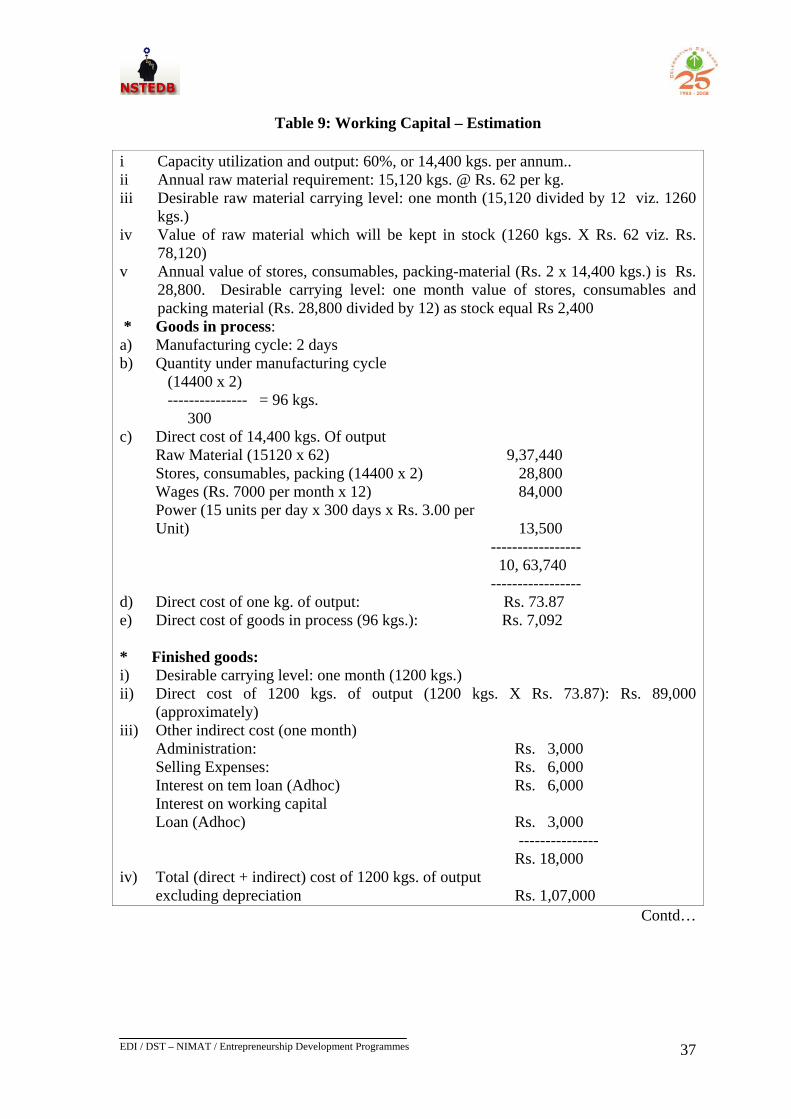
EDI / DST – NIMAT / Entrepreneurship Development Programmes
37
37
Table 9: Working Capital – Estimation
i Capacity utilization and output: 60%, or 14,400 kgs. per annum.. ii Annual raw material requirement: 15,120 kgs. @ Rs. 62 per kg. iii Desirable raw material carrying level: one month (15,120 divided by 12 viz. 1260
kgs.) iv Value of raw material which will be kept in stock (1260 kgs. X Rs. 62 viz. Rs.
78,120) v Annual value of stores, consumables, packing-material (Rs. 2 x 14,400 kgs.) is Rs.
28,800. Desirable carrying level: one month value of stores, consumables and packing material (Rs. 28,800 divided by 12) as stock equal Rs 2,400
* Goods in process: a) Manufacturing cycle: 2 days b) Quantity under manufacturing cycle
(14400 x 2) --------------- = 96 kgs. 300
c) Direct cost of 14,400 kgs. Of output Raw Material (15120 x 62) 9,37,440 Stores, consumables, packing (14400 x 2) 28,800 Wages (Rs. 7000 per month x 12) 84,000 Power (15 units per day x 300 days x Rs. 3.00 per Unit) 13,500
----------------- 10, 63,740 ----------------- d) Direct cost of one kg. of output: Rs. 73.87 e) Direct cost of goods in process (96 kgs.): Rs. 7,092 * Finished goods: i) Desirable carrying level: one month (1200 kgs.) ii) Direct cost of 1200 kgs. of output (1200 kgs. X Rs. 73.87): Rs. 89,000
(approximately) iii) Other indirect cost (one month)
Administration: Rs. 3,000 Selling Expenses: Rs. 6,000 Interest on tem loan (Adhoc) Rs. 6,000 Interest on working capital Loan (Adhoc) Rs. 3,000
--------------- Rs. 18,000
iv) Total (direct + indirect) cost of 1200 kgs. of output excluding depreciation Rs. 1,07,000
Contd…
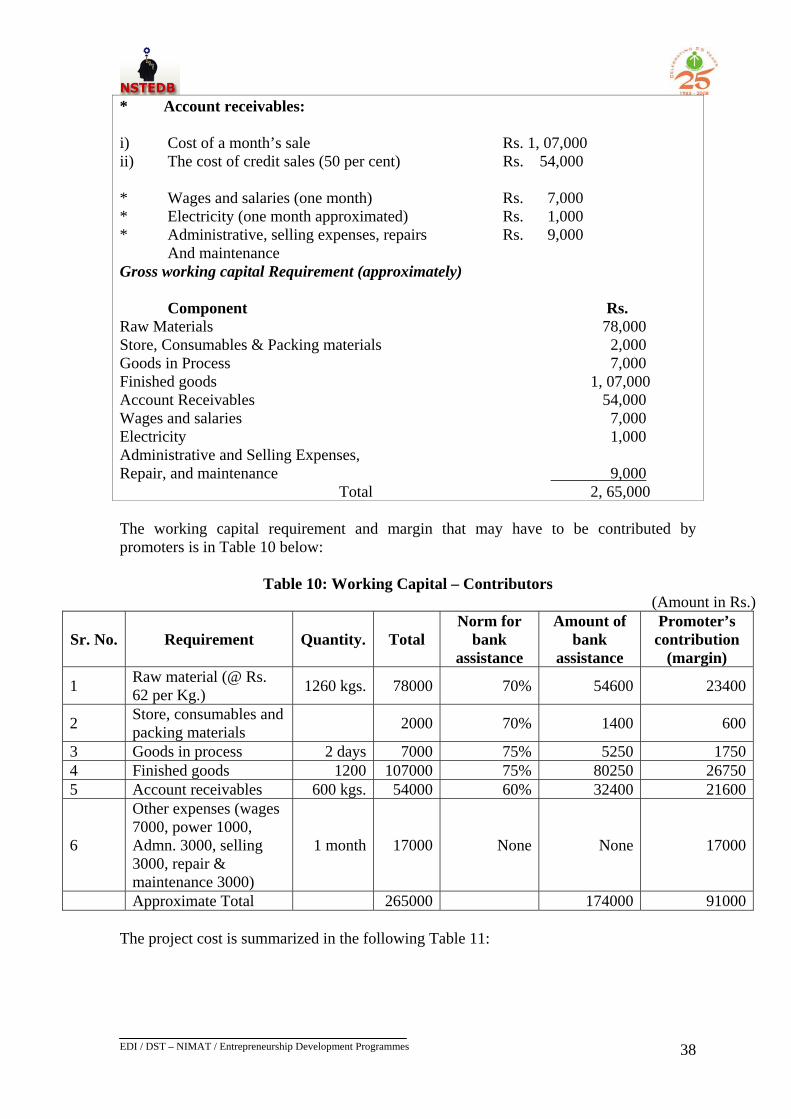
EDI / DST – NIMAT / Entrepreneurship Development Programmes
38
38
* Account receivables: i) Cost of a month’s sale Rs. 1, 07,000 ii) The cost of credit sales (50 per cent) Rs. 54,000 * Wages and salaries (one month) Rs. 7,000 * Electricity (one month approximated) Rs. 1,000 * Administrative, selling expenses, repairs Rs. 9,000 And maintenance Gross working capital Requirement (approximately)
Component Rs. Raw Materials 78,000 Store, Consumables & Packing materials 2,000 Goods in Process 7,000 Finished goods 1, 07,000 Account Receivables 54,000 Wages and salaries 7,000 Electricity 1,000 Administrative and Selling Expenses, Repair, and maintenance 9,000 Total 2, 65,000 The working capital requirement and margin that may have to be contributed by promoters is in Table 10 below:
Table 10: Working Capital – Contributors
(Amount in Rs.)
Sr. No. Requirement Quantity. Total Norm for
bank assistance
Amount of bank
assistance
Promoter’s contribution
(margin)
1 Raw material (@ Rs. 62 per Kg.) 1260 kgs. 78000 70% 54600 23400
2 Store, consumables and packing materials 2000 70% 1400 600
3 Goods in process 2 days 7000 75% 5250 17504 Finished goods 1200 107000 75% 80250 267505 Account receivables 600 kgs. 54000 60% 32400 21600
6
Other expenses (wages 7000, power 1000, Admn. 3000, selling 3000, repair & maintenance 3000)
1 month 17000 None None 17000
Approximate Total 265000 174000 91000 The project cost is summarized in the following Table 11:
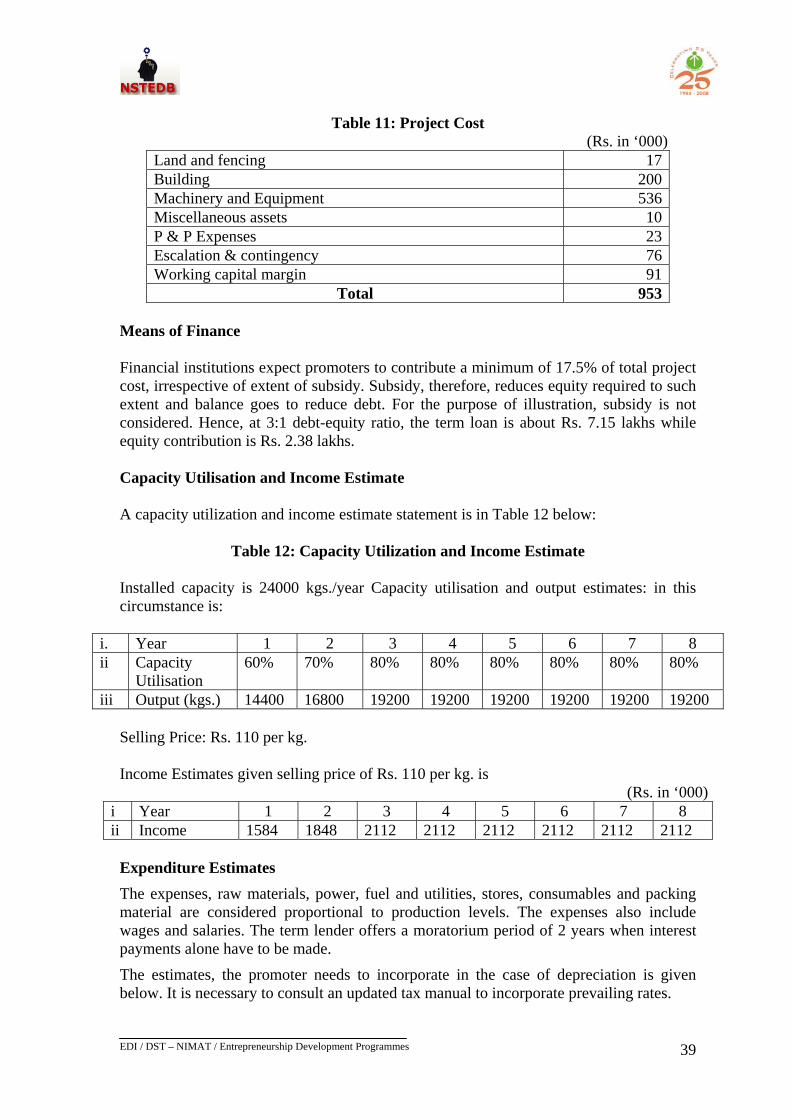
EDI / DST – NIMAT / Entrepreneurship Development Programmes
39
39
Table 11: Project Cost
(Rs. in ‘000) Land and fencing 17Building 200Machinery and Equipment 536Miscellaneous assets 10P & P Expenses 23Escalation & contingency 76Working capital margin 91
Total 953 Means of Finance
Financial institutions expect promoters to contribute a minimum of 17.5% of total project cost, irrespective of extent of subsidy. Subsidy, therefore, reduces equity required to such extent and balance goes to reduce debt. For the purpose of illustration, subsidy is not considered. Hence, at 3:1 debt-equity ratio, the term loan is about Rs. 7.15 lakhs while equity contribution is Rs. 2.38 lakhs.
Capacity Utilisation and Income Estimate A capacity utilization and income estimate statement is in Table 12 below:
Table 12: Capacity Utilization and Income Estimate Installed capacity is 24000 kgs./year Capacity utilisation and output estimates: in this circumstance is:
i. Year 1 2 3 4 5 6 7 8 ii Capacity
Utilisation 60% 70% 80% 80% 80% 80% 80% 80%
iii Output (kgs.) 14400 16800 19200 19200 19200 19200 19200 19200 Selling Price: Rs. 110 per kg. Income Estimates given selling price of Rs. 110 per kg. is
(Rs. in ‘000) i Year 1 2 3 4 5 6 7 8 ii Income 1584 1848 2112 2112 2112 2112 2112 2112
Expenditure Estimates
The expenses, raw materials, power, fuel and utilities, stores, consumables and packing material are considered proportional to production levels. The expenses also include wages and salaries. The term lender offers a moratorium period of 2 years when interest payments alone have to be made.
The estimates, the promoter needs to incorporate in the case of depreciation is given below. It is necessary to consult an updated tax manual to incorporate prevailing rates.
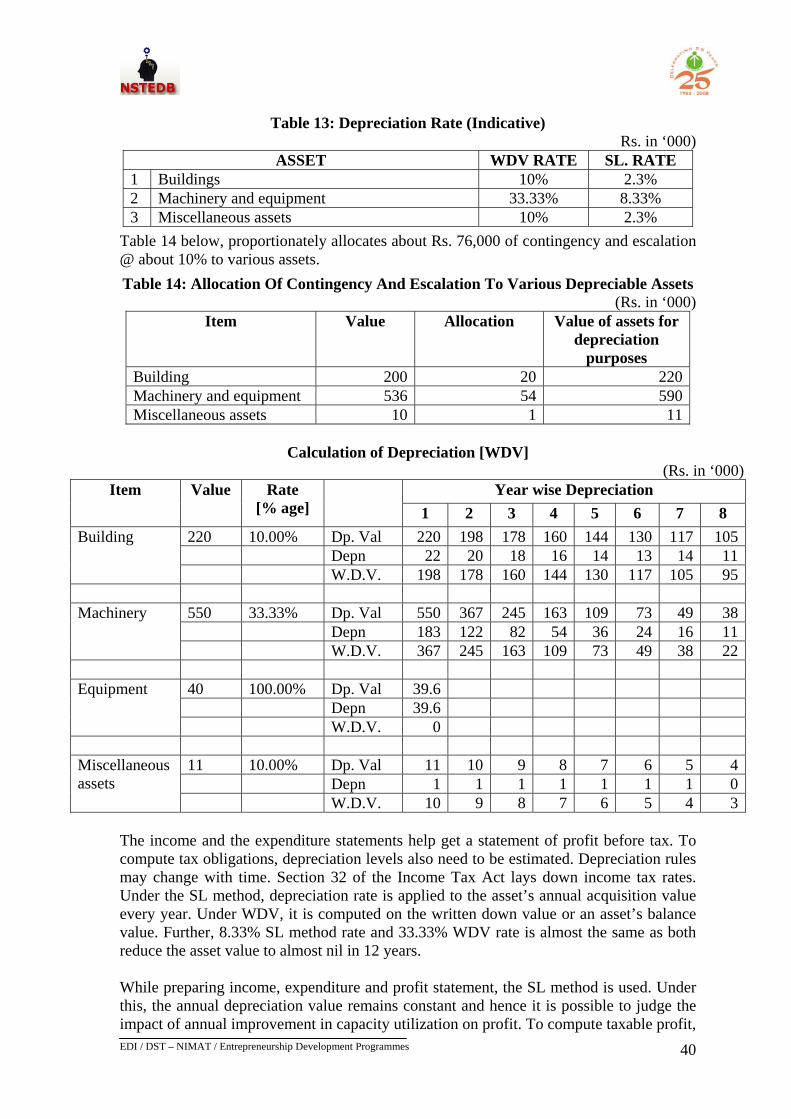
EDI / DST – NIMAT / Entrepreneurship Development Programmes
40
40
Table 13: Depreciation Rate (Indicative)
Rs. in ‘000) ASSET WDV RATE SL. RATE
1 Buildings 10% 2.3% 2 Machinery and equipment 33.33% 8.33% 3 Miscellaneous assets 10% 2.3%
Table 14 below, proportionately allocates about Rs. 76,000 of contingency and escalation @ about 10% to various assets.
Table 14: Allocation Of Contingency And Escalation To Various Depreciable Assets (Rs. in ‘000)
Item Value Allocation Value of assets for depreciation
purposes Building 200 20 220Machinery and equipment 536 54 590Miscellaneous assets 10 1 11
Calculation of Depreciation [WDV]
(Rs. in ‘000) Year wise Depreciation Item Value Rate
[% age]
1 2 3 4 5 6 7 8 220 10.00% Dp. Val 220 198 178 160 144 130 117 105 Depn 22 20 18 16 14 13 14 11
Building
W.D.V. 198 178 160 144 130 117 105 95
550 33.33% Dp. Val 550 367 245 163 109 73 49 38 Depn 183 122 82 54 36 24 16 11
Machinery
W.D.V. 367 245 163 109 73 49 38 22
40 100.00% Dp. Val 39.6 Depn 39.6
Equipment
W.D.V. 0
11 10.00% Dp. Val 11 10 9 8 7 6 5 4 Depn 1 1 1 1 1 1 1 0
Miscellaneous assets
W.D.V. 10 9 8 7 6 5 4 3 The income and the expenditure statements help get a statement of profit before tax. To compute tax obligations, depreciation levels also need to be estimated. Depreciation rules may change with time. Section 32 of the Income Tax Act lays down income tax rates. Under the SL method, depreciation rate is applied to the asset’s annual acquisition value every year. Under WDV, it is computed on the written down value or an asset’s balance value. Further, 8.33% SL method rate and 33.33% WDV rate is almost the same as both reduce the asset value to almost nil in 12 years. While preparing income, expenditure and profit statement, the SL method is used. Under this, the annual depreciation value remains constant and hence it is possible to judge the impact of annual improvement in capacity utilization on profit. To compute taxable profit,
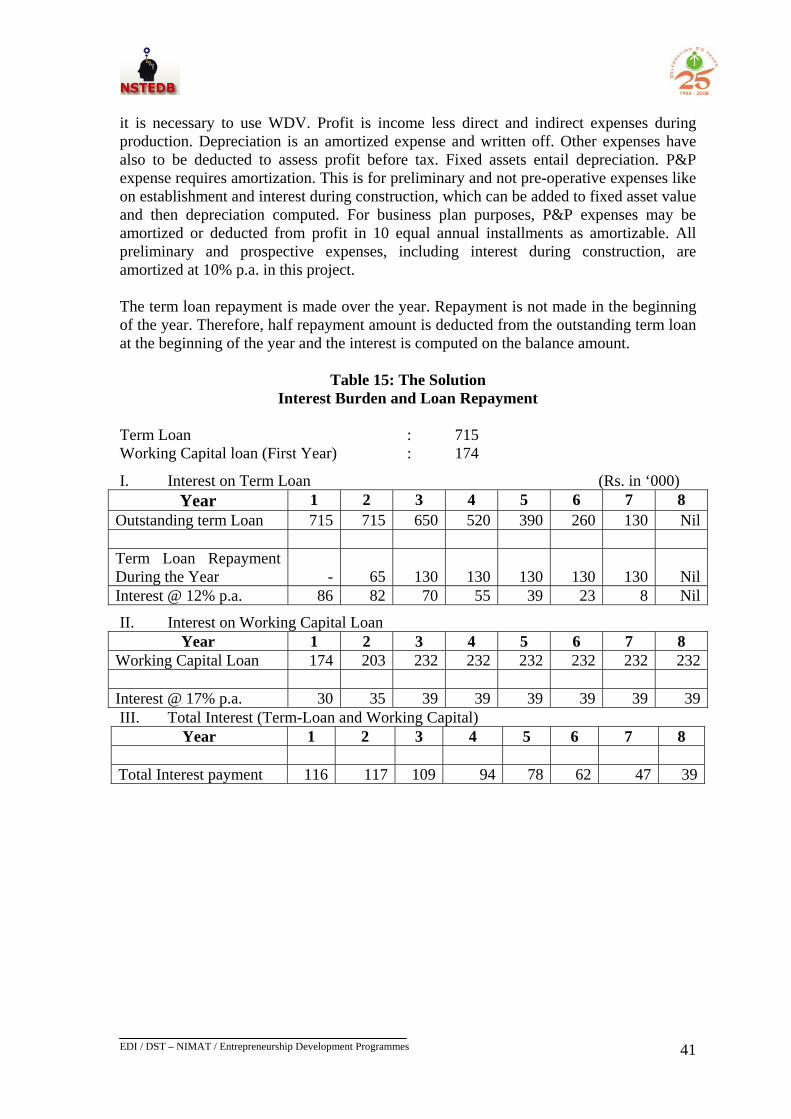
EDI / DST – NIMAT / Entrepreneurship Development Programmes
41
41
it is necessary to use WDV. Profit is income less direct and indirect expenses during production. Depreciation is an amortized expense and written off. Other expenses have also to be deducted to assess profit before tax. Fixed assets entail depreciation. P&P expense requires amortization. This is for preliminary and not pre-operative expenses like on establishment and interest during construction, which can be added to fixed asset value and then depreciation computed. For business plan purposes, P&P expenses may be amortized or deducted from profit in 10 equal annual installments as amortizable. All preliminary and prospective expenses, including interest during construction, are amortized at 10% p.a. in this project. The term loan repayment is made over the year. Repayment is not made in the beginning of the year. Therefore, half repayment amount is deducted from the outstanding term loan at the beginning of the year and the interest is computed on the balance amount.
Table 15: The Solution Interest Burden and Loan Repayment
Term Loan : 715 Working Capital loan (First Year) : 174
I. Interest on Term Loan (Rs. in ‘000) Year 1 2 3 4 5 6 7 8
Outstanding term Loan 715 715 650 520 390 260 130 Nil Term Loan Repayment During the Year - 65 130 130 130
130
130 Nil
Interest @ 12% p.a. 86 82 70 55 39 23 8 Nil
II. Interest on Working Capital Loan Year 1 2 3 4 5 6 7 8
Working Capital Loan 174 203 232 232 232 232 232 232 Interest @ 17% p.a. 30 35 39 39 39 39 39 39III. Total Interest (Term-Loan and Working Capital)
Year 1 2 3 4 5 6 7 8 Total Interest payment 116 117 109 94 78 62 47 39
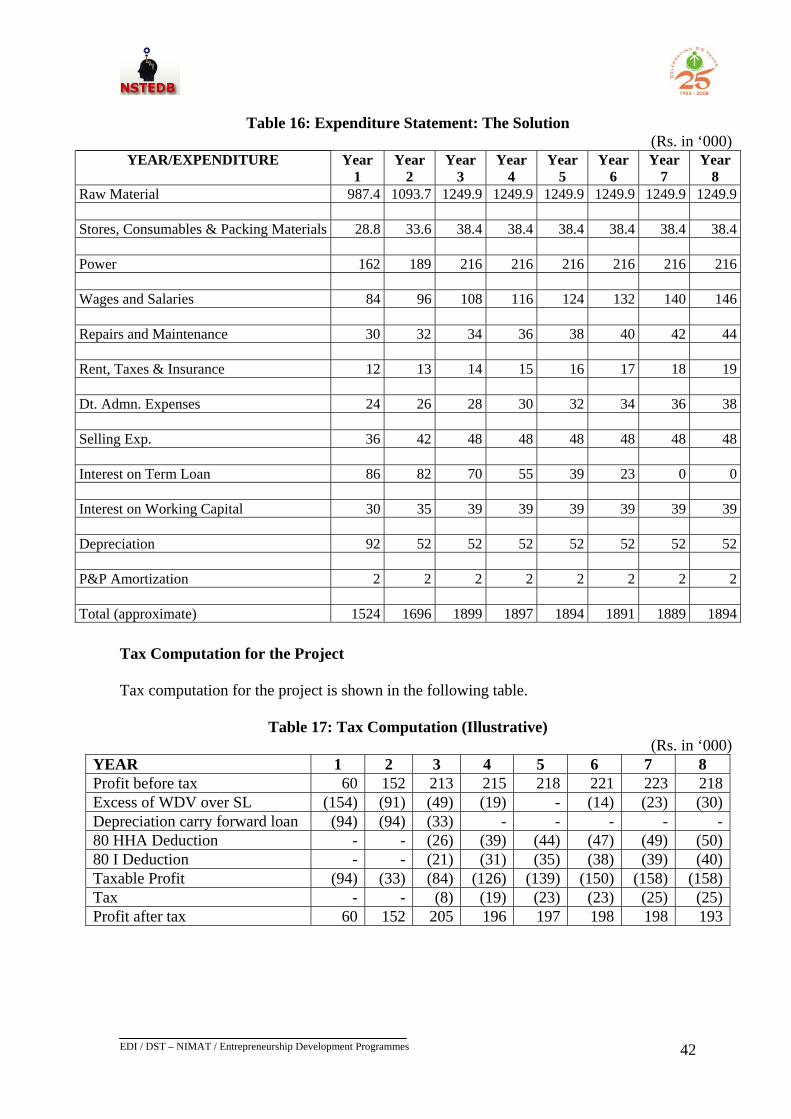
EDI / DST – NIMAT / Entrepreneurship Development Programmes
42
42
Table 16: Expenditure Statement: The Solution
(Rs. in ‘000) YEAR/EXPENDITURE Year
1 Year
2 Year
3 Year
4 Year
5 Year
6 Year
7 Year
8 Raw Material 987.4 1093.7 1249.9 1249.9 1249.9 1249.9 1249.9 1249.9 Stores, Consumables & Packing Materials 28.8 33.6 38.4 38.4 38.4 38.4 38.4 38.4 Power 162 189 216 216 216 216 216 216 Wages and Salaries 84 96 108 116 124 132 140 146 Repairs and Maintenance 30 32 34 36 38 40 42 44 Rent, Taxes & Insurance 12 13 14 15 16 17 18 19 Dt. Admn. Expenses 24 26 28 30 32 34 36 38 Selling Exp. 36 42 48 48 48 48 48 48 Interest on Term Loan 86 82 70 55 39 23 0 0 Interest on Working Capital 30 35 39 39 39 39 39 39 Depreciation 92 52 52 52 52 52 52 52 P&P Amortization 2 2 2 2 2 2 2 2 Total (approximate) 1524 1696 1899 1897 1894 1891 1889 1894
Tax Computation for the Project Tax computation for the project is shown in the following table.
Table 17: Tax Computation (Illustrative) (Rs. in ‘000)
YEAR 1 2 3 4 5 6 7 8 Profit before tax 60 152 213 215 218 221 223 218Excess of WDV over SL (154) (91) (49) (19) - (14) (23) (30)Depreciation carry forward loan (94) (94) (33) - - - - -80 HHA Deduction - - (26) (39) (44) (47) (49) (50)80 I Deduction - - (21) (31) (35) (38) (39) (40)Taxable Profit (94) (33) (84) (126) (139) (150) (158) (158)Tax - - (8) (19) (23) (23) (25) (25)Profit after tax 60 152 205 196 197 198 198 193
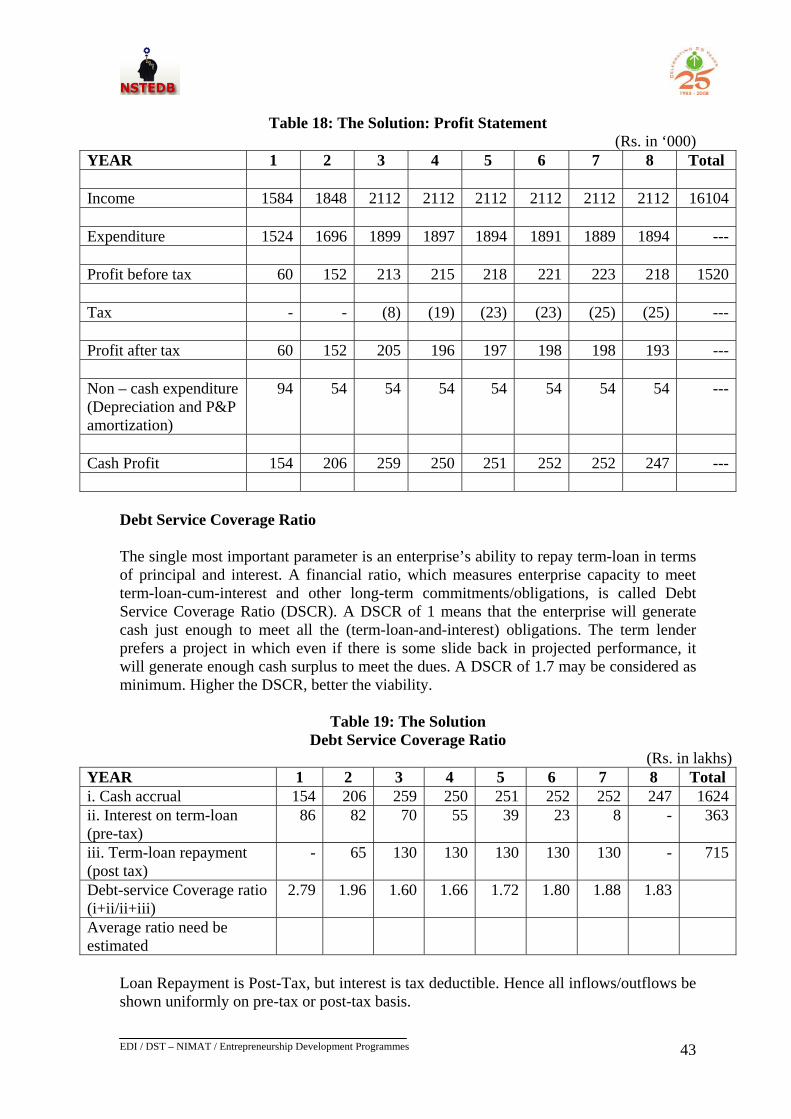
EDI / DST – NIMAT / Entrepreneurship Development Programmes
43
43
Table 18: The Solution: Profit Statement
(Rs. in ‘000) YEAR 1 2 3 4 5 6 7 8 Total Income 1584 1848 2112 2112 2112 2112 2112 2112 16104 Expenditure 1524 1696 1899 1897 1894 1891 1889 1894 --- Profit before tax 60 152 213 215 218 221 223 218 1520 Tax - - (8) (19) (23) (23) (25) (25) --- Profit after tax 60 152 205 196 197 198 198 193 --- Non – cash expenditure (Depreciation and P&P amortization)
94 54 54 54 54 54 54 54 ---
Cash Profit 154 206 259 250 251 252 252 247 ---
Debt Service Coverage Ratio The single most important parameter is an enterprise’s ability to repay term-loan in terms of principal and interest. A financial ratio, which measures enterprise capacity to meet term-loan-cum-interest and other long-term commitments/obligations, is called Debt Service Coverage Ratio (DSCR). A DSCR of 1 means that the enterprise will generate cash just enough to meet all the (term-loan-and-interest) obligations. The term lender prefers a project in which even if there is some slide back in projected performance, it will generate enough cash surplus to meet the dues. A DSCR of 1.7 may be considered as minimum. Higher the DSCR, better the viability.
Table 19: The Solution Debt Service Coverage Ratio
(Rs. in lakhs) YEAR 1 2 3 4 5 6 7 8 Total i. Cash accrual 154 206 259 250 251 252 252 247 1624ii. Interest on term-loan (pre-tax)
86 82 70 55 39 23 8 - 363
iii. Term-loan repayment (post tax)
- 65 130 130 130 130 130 - 715
Debt-service Coverage ratio (i+ii/ii+iii)
2.79 1.96 1.60 1.66 1.72 1.80 1.88 1.83
Average ratio need be estimated
Loan Repayment is Post-Tax, but interest is tax deductible. Hence all inflows/outflows be shown uniformly on pre-tax or post-tax basis.
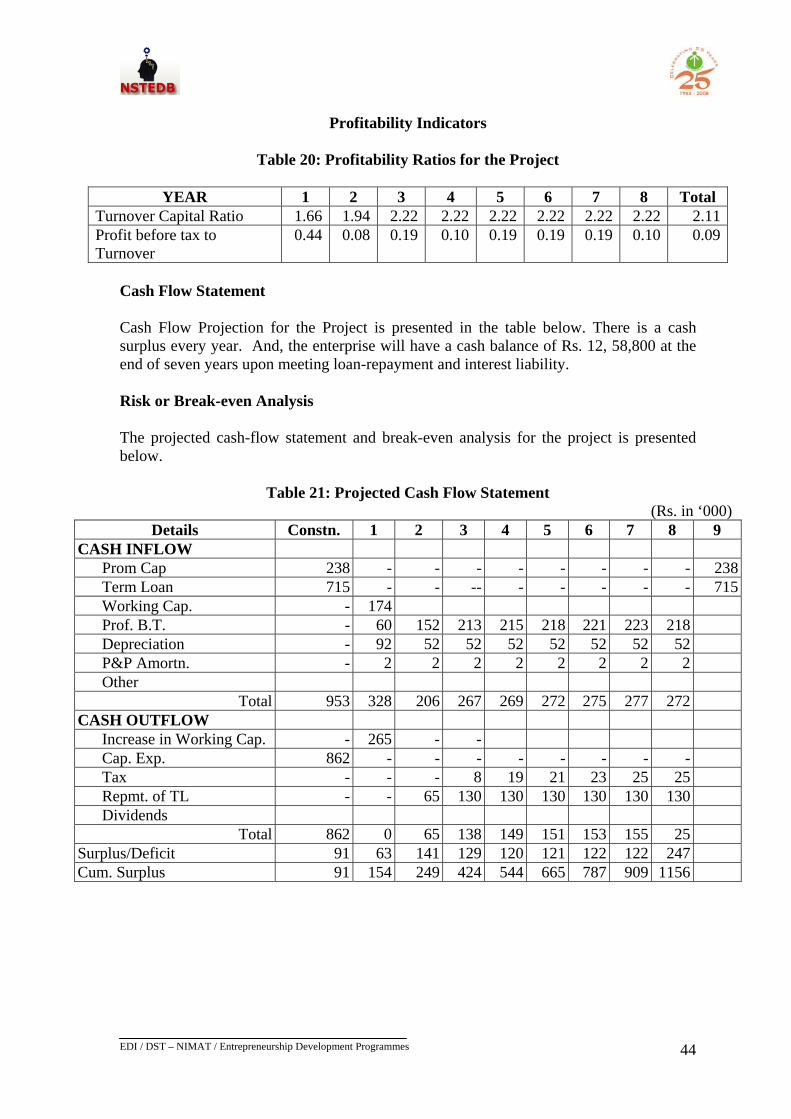
EDI / DST – NIMAT / Entrepreneurship Development Programmes
44
44
Profitability Indicators
Table 20: Profitability Ratios for the Project
YEAR 1 2 3 4 5 6 7 8 Total
Turnover Capital Ratio 1.66 1.94 2.22 2.22 2.22 2.22 2.22 2.22 2.11Profit before tax to Turnover
0.44 0.08 0.19 0.10 0.19 0.19 0.19 0.10 0.09
Cash Flow Statement Cash Flow Projection for the Project is presented in the table below. There is a cash surplus every year. And, the enterprise will have a cash balance of Rs. 12, 58,800 at the end of seven years upon meeting loan-repayment and interest liability. Risk or Break-even Analysis The projected cash-flow statement and break-even analysis for the project is presented below.
Table 21: Projected Cash Flow Statement (Rs. in ‘000)
Details Constn. 1 2 3 4 5 6 7 8 9 CASH INFLOW
Prom Cap 238 - - - - - - - - 238Term Loan 715 - - -- - - - - - 715Working Cap. - 174 Prof. B.T. - 60 152 213 215 218 221 223 218Depreciation - 92 52 52 52 52 52 52 52P&P Amortn. - 2 2 2 2 2 2 2 2Other
Total 953 328 206 267 269 272 275 277 272CASH OUTFLOW
Increase in Working Cap. - 265 - - Cap. Exp. 862 - - - - - - - -Tax - - - 8 19 21 23 25 25Repmt. of TL - - 65 130 130 130 130 130 130Dividends
Total 862 0 65 138 149 151 153 155 25Surplus/Deficit 91 63 141 129 120 121 122 122 247Cum. Surplus 91 154 249 424 544 665 787 909 1156
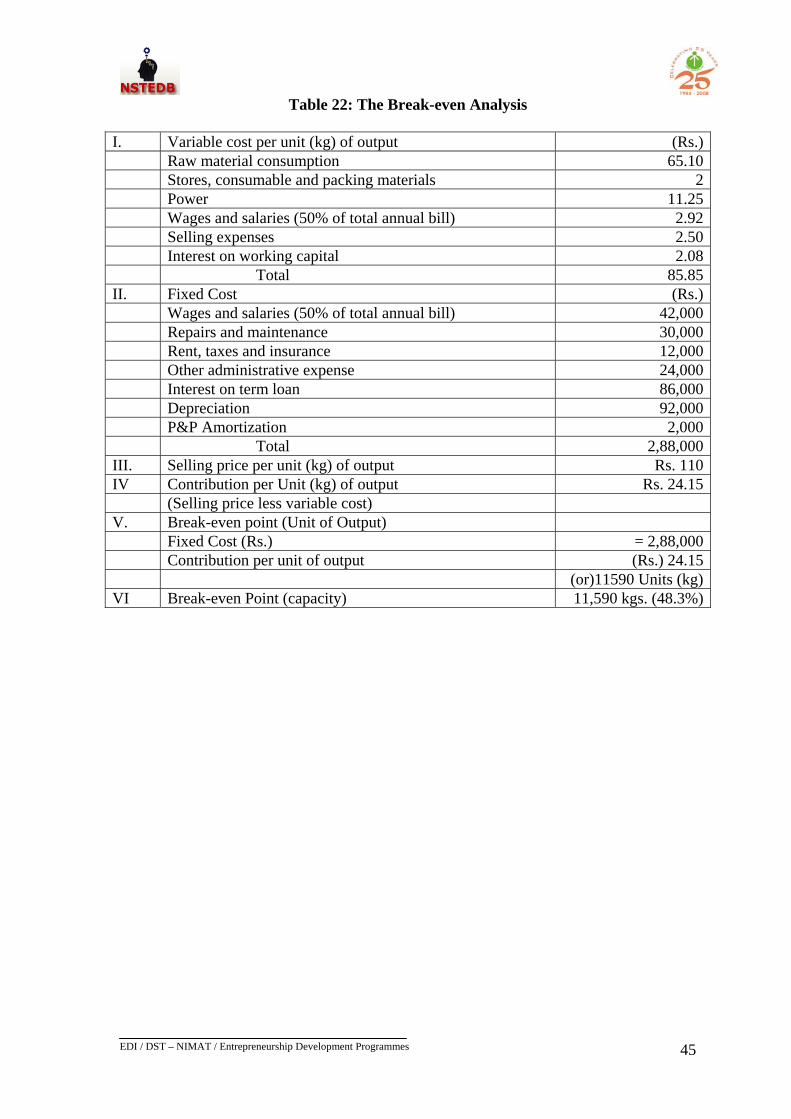
EDI / DST – NIMAT / Entrepreneurship Development Programmes
45
45
Table 22: The Break-even Analysis
I. Variable cost per unit (kg) of output (Rs.) Raw material consumption 65.10 Stores, consumable and packing materials 2 Power 11.25 Wages and salaries (50% of total annual bill) 2.92 Selling expenses 2.50 Interest on working capital 2.08 Total 85.85II. Fixed Cost (Rs.) Wages and salaries (50% of total annual bill) 42,000 Repairs and maintenance 30,000 Rent, taxes and insurance 12,000 Other administrative expense 24,000 Interest on term loan 86,000 Depreciation 92,000 P&P Amortization 2,000 Total 2,88,000III. Selling price per unit (kg) of output Rs. 110IV Contribution per Unit (kg) of output Rs. 24.15 (Selling price less variable cost) V. Break-even point (Unit of Output) Fixed Cost (Rs.) = 2,88,000 Contribution per unit of output (Rs.) 24.15 (or)11590 Units (kg)VI Break-even Point (capacity) 11,590 kgs. (48.3%)
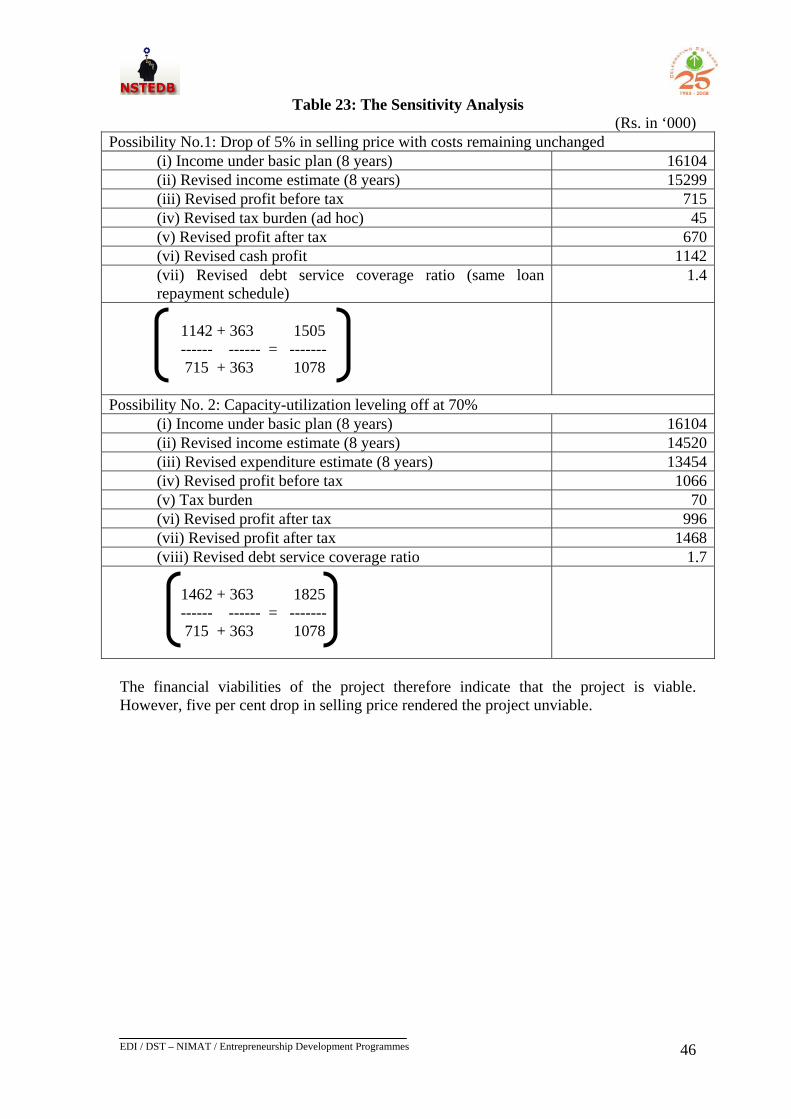
EDI / DST – NIMAT / Entrepreneurship Development Programmes
46
46
Table 23: The Sensitivity Analysis (Rs. in ‘000)
Possibility No.1: Drop of 5% in selling price with costs remaining unchanged (i) Income under basic plan (8 years) 16104(ii) Revised income estimate (8 years) 15299(iii) Revised profit before tax 715(iv) Revised tax burden (ad hoc) 45(v) Revised profit after tax 670(vi) Revised cash profit 1142(vii) Revised debt service coverage ratio (same loan repayment schedule)
1.4
1142 + 363 1505 ------ ------ = ------- 715 + 363 1078
Possibility No. 2: Capacity-utilization leveling off at 70% (i) Income under basic plan (8 years) 16104(ii) Revised income estimate (8 years) 14520(iii) Revised expenditure estimate (8 years) 13454(iv) Revised profit before tax 1066(v) Tax burden 70(vi) Revised profit after tax 996(vii) Revised profit after tax 1468(viii) Revised debt service coverage ratio 1.7
1462 + 363 1825 ------ ------ = ------- 715 + 363 1078
The financial viabilities of the project therefore indicate that the project is viable. However, five per cent drop in selling price rendered the project unviable.
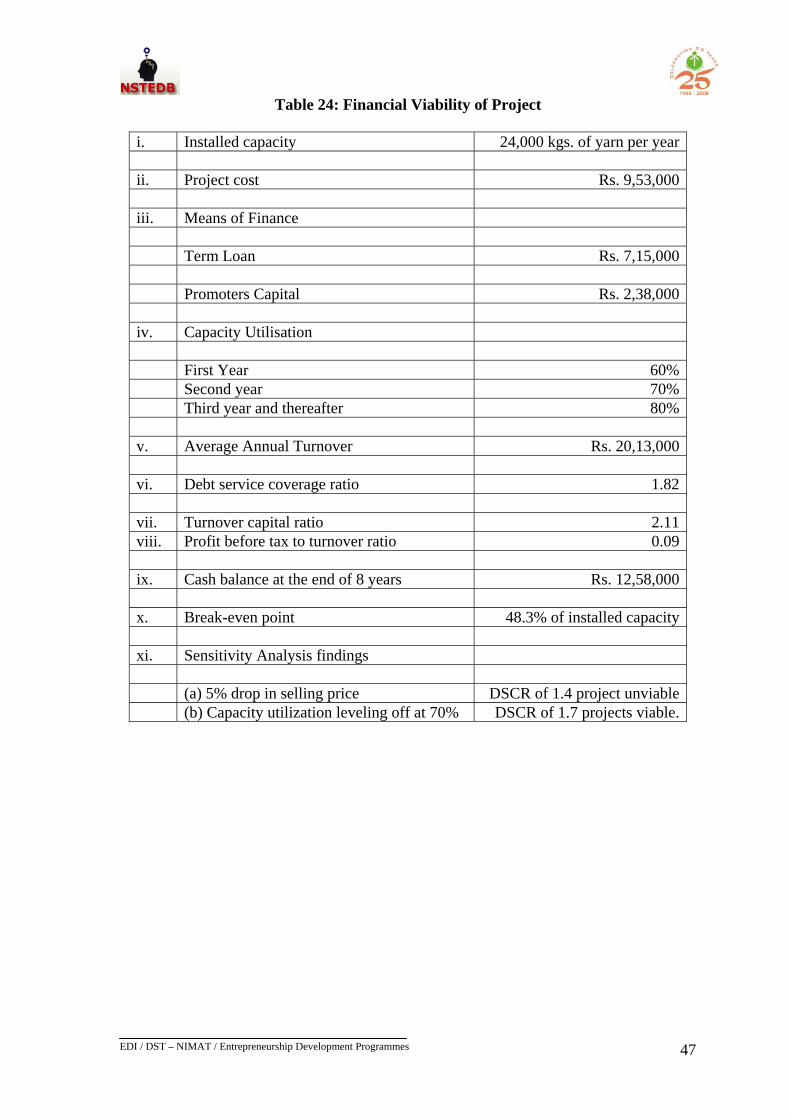
EDI / DST – NIMAT / Entrepreneurship Development Programmes
47
47
Table 24: Financial Viability of Project
i. Installed capacity 24,000 kgs. of yarn per year ii. Project cost Rs. 9,53,000 iii. Means of Finance Term Loan Rs. 7,15,000 Promoters Capital Rs. 2,38,000 iv. Capacity Utilisation First Year 60% Second year 70% Third year and thereafter 80% v. Average Annual Turnover Rs. 20,13,000 vi. Debt service coverage ratio 1.82 vii. Turnover capital ratio 2.11viii. Profit before tax to turnover ratio 0.09 ix. Cash balance at the end of 8 years Rs. 12,58,000 x. Break-even point 48.3% of installed capacity xi. Sensitivity Analysis findings (a) 5% drop in selling price DSCR of 1.4 project unviable (b) Capacity utilization leveling off at 70% DSCR of 1.7 projects viable.
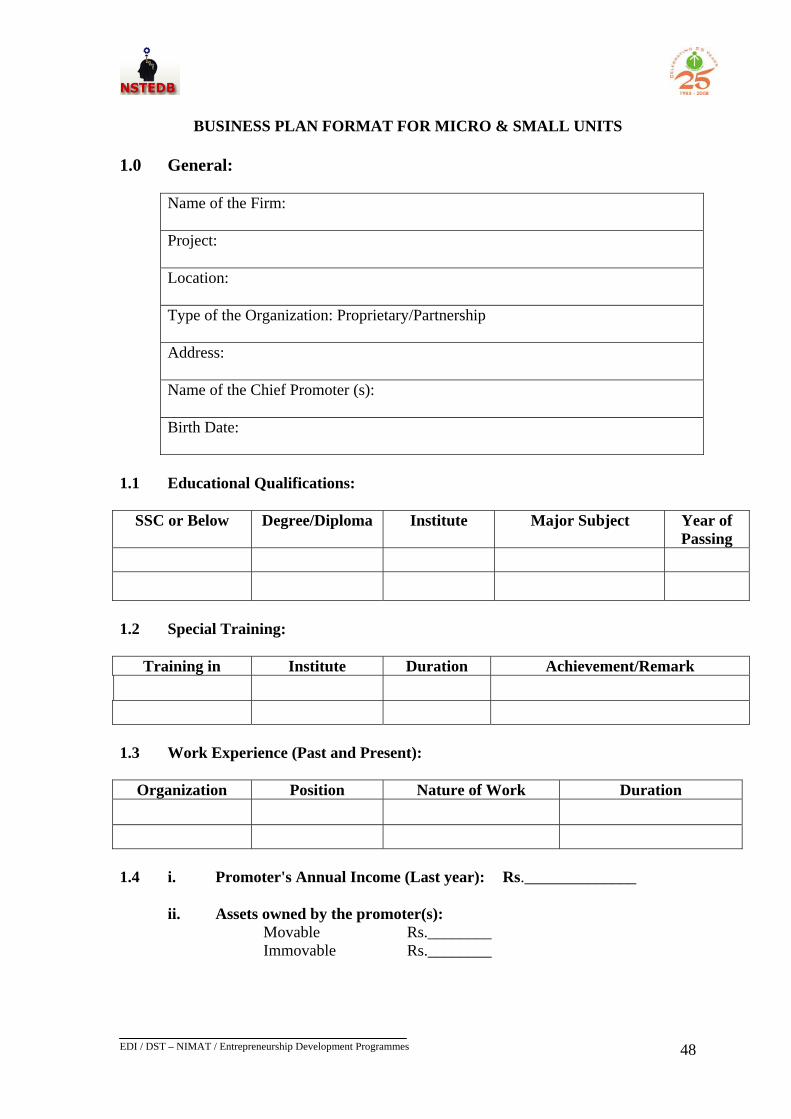
EDI / DST – NIMAT / Entrepreneurship Development Programmes
48
48
BUSINESS PLAN FORMAT FOR MICRO & SMALL UNITS
1.0 General:
Name of the Firm: Project: Location: Type of the Organization: Proprietary/Partnership Address: Name of the Chief Promoter (s): Birth Date:
1.1 Educational Qualifications:
SSC or Below Degree/Diploma Institute Major Subject Year of Passing
1.2 Special Training:
Training in Institute Duration Achievement/Remark 1.3 Work Experience (Past and Present):
Organization Position Nature of Work Duration
1.4 i. Promoter's Annual Income (Last year): Rs.______________ ii. Assets owned by the promoter(s):
Movable Rs.________ Immovable Rs.________
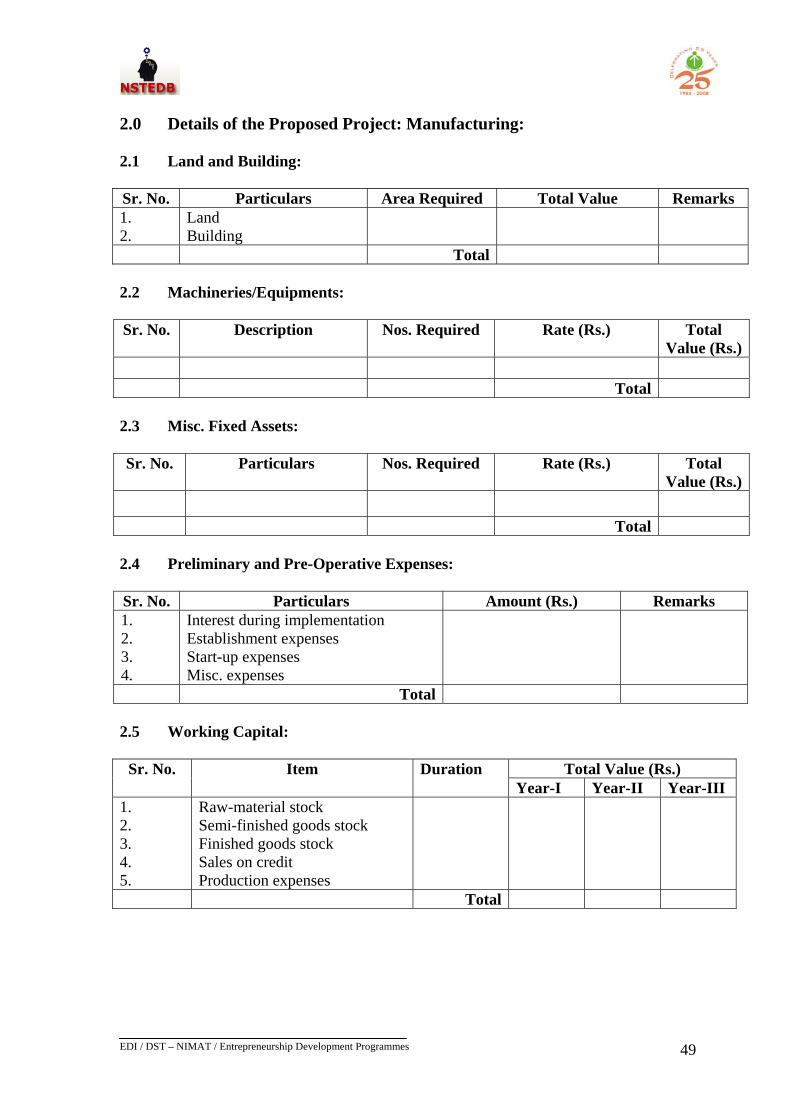
EDI / DST – NIMAT / Entrepreneurship Development Programmes
49
49
2.0 Details of the Proposed Project: Manufacturing: 2.1 Land and Building:
Sr. No. Particulars Area Required Total Value Remarks 1. 2.
Land Building
Total 2.2 Machineries/Equipments:
Sr. No. Description Nos. Required Rate (Rs.) Total
Value (Rs.) Total 2.3 Misc. Fixed Assets:
Sr. No. Particulars Nos. Required Rate (Rs.) Total
Value (Rs.) Total 2.4 Preliminary and Pre-Operative Expenses:
Sr. No. Particulars Amount (Rs.) Remarks 1. 2. 3. 4.
Interest during implementation Establishment expenses Start-up expenses Misc. expenses
Total 2.5 Working Capital:
Total Value (Rs.) Sr. No. Item Duration
Year-I Year-II Year-III 1. 2. 3. 4. 5.
Raw-material stock Semi-finished goods stock Finished goods stock Sales on credit Production expenses
Total
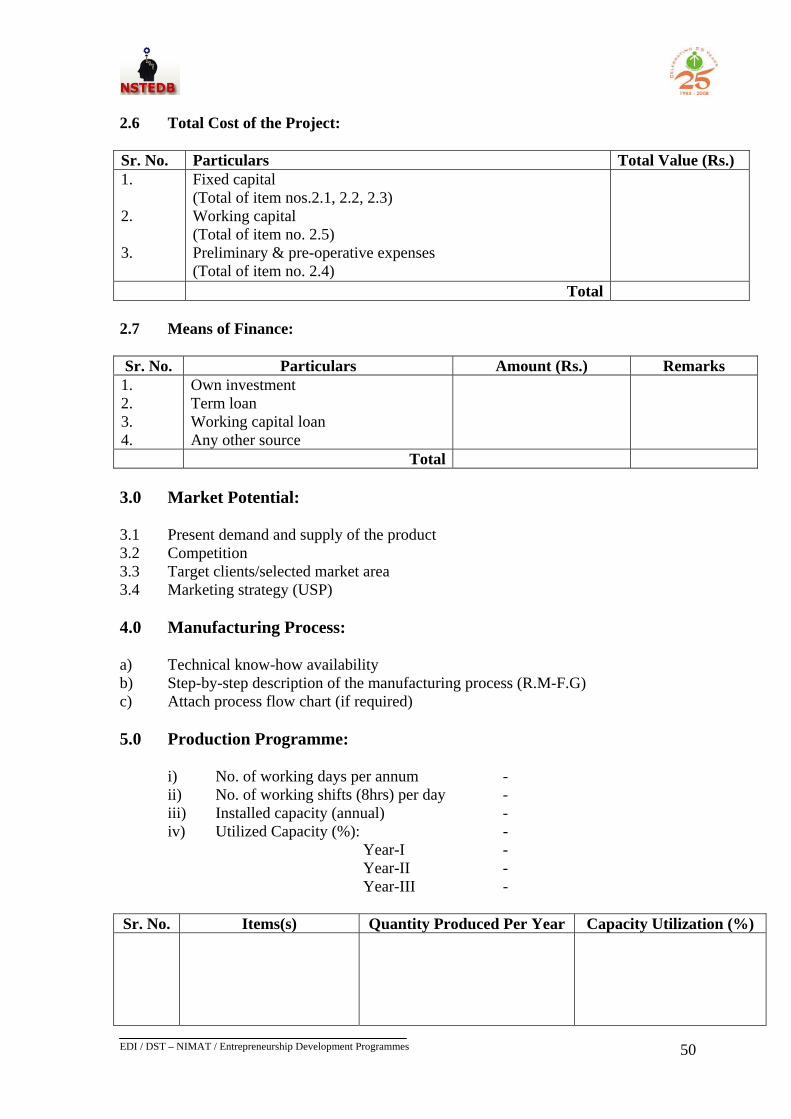
EDI / DST – NIMAT / Entrepreneurship Development Programmes
50
50
2.6 Total Cost of the Project: Sr. No. Particulars Total Value (Rs.) 1. 2. 3.
Fixed capital (Total of item nos.2.1, 2.2, 2.3) Working capital (Total of item no. 2.5) Preliminary & pre-operative expenses (Total of item no. 2.4)
Total 2.7 Means of Finance:
Sr. No. Particulars Amount (Rs.) Remarks 1. 2. 3. 4.
Own investment Term loan Working capital loan Any other source
Total 3.0 Market Potential: 3.1 Present demand and supply of the product 3.2 Competition 3.3 Target clients/selected market area 3.4 Marketing strategy (USP)
4.0 Manufacturing Process: a) Technical know-how availability b) Step-by-step description of the manufacturing process (R.M-F.G) c) Attach process flow chart (if required) 5.0 Production Programme:
i) No. of working days per annum - ii) No. of working shifts (8hrs) per day - iii) Installed capacity (annual) - iv) Utilized Capacity (%): -
Year-I - Year-II - Year-III -
Sr. No. Items(s) Quantity Produced Per Year Capacity Utilization (%)
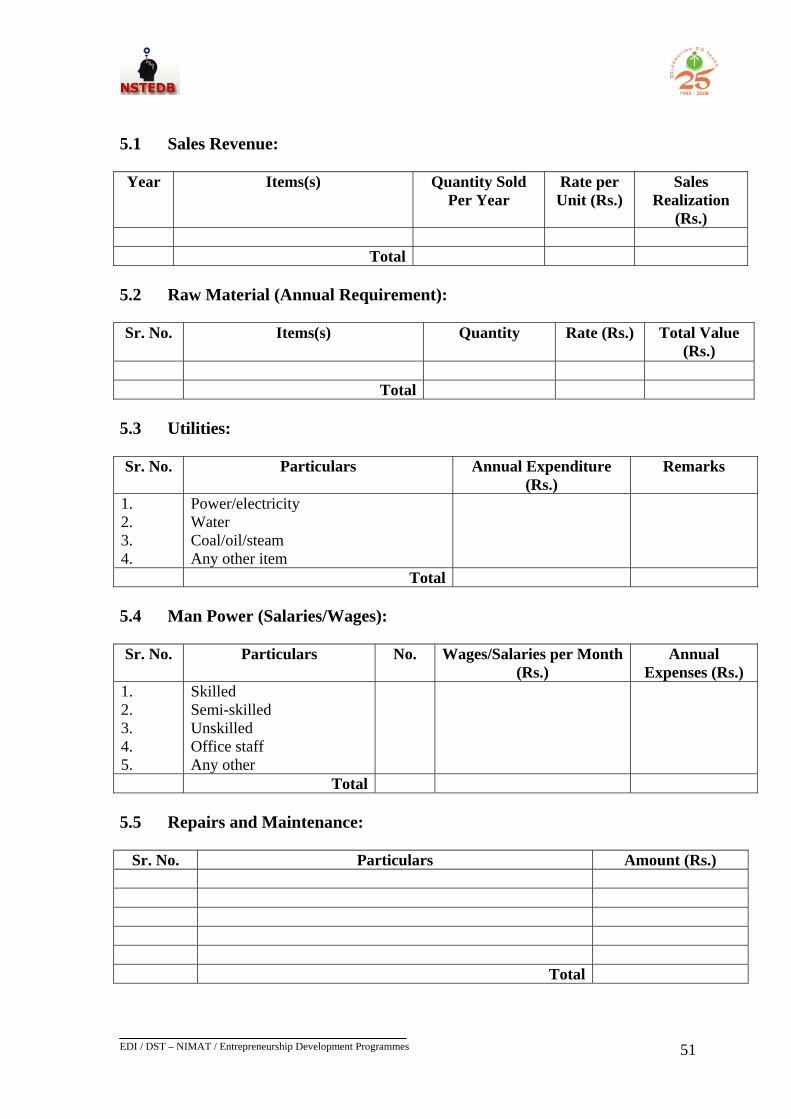
EDI / DST – NIMAT / Entrepreneurship Development Programmes
51
51
5.1 Sales Revenue: Year Items(s) Quantity Sold
Per Year Rate per Unit (Rs.)
Sales Realization
(Rs.) Total 5.2 Raw Material (Annual Requirement): Sr. No. Items(s) Quantity Rate (Rs.) Total Value
(Rs.) Total 5.3 Utilities: Sr. No. Particulars Annual Expenditure
(Rs.) Remarks
1. 2. 3. 4.
Power/electricity Water Coal/oil/steam Any other item
Total 5.4 Man Power (Salaries/Wages): Sr. No. Particulars No. Wages/Salaries per Month
(Rs.) Annual
Expenses (Rs.) 1. 2. 3. 4. 5.
Skilled Semi-skilled Unskilled Office staff Any other
Total 5.5 Repairs and Maintenance:
Sr. No. Particulars Amount (Rs.) Total
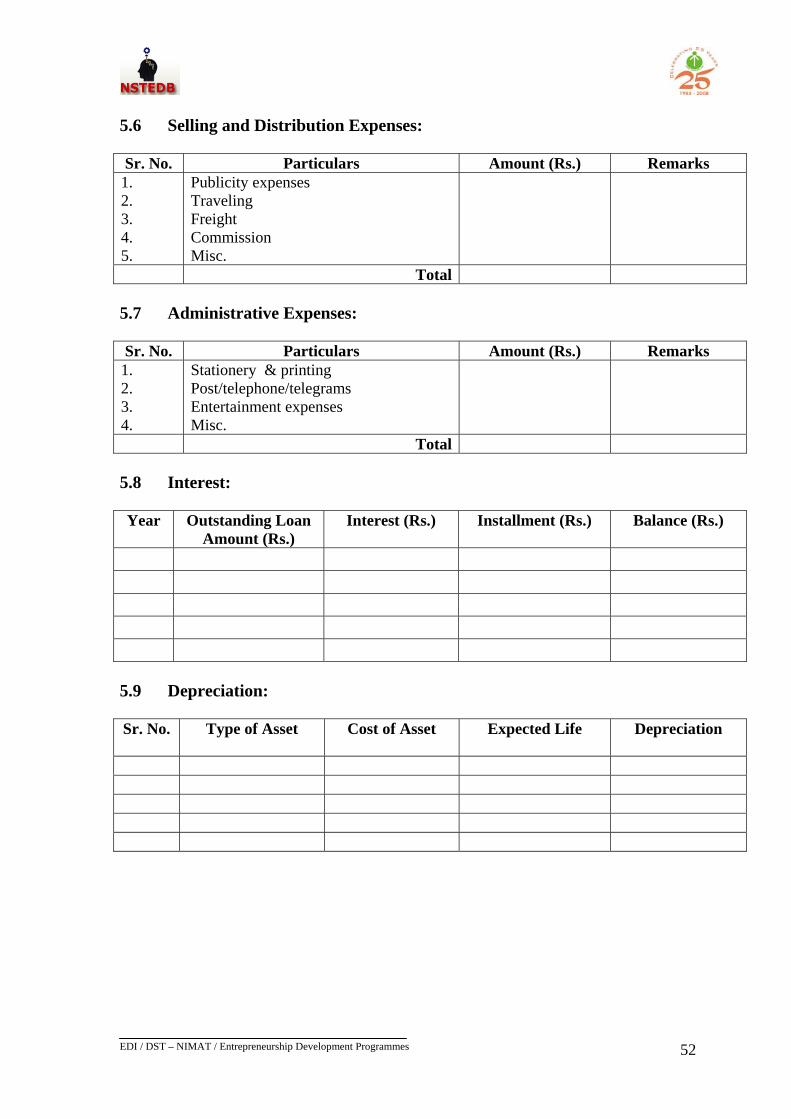
EDI / DST – NIMAT / Entrepreneurship Development Programmes
52
52
5.6 Selling and Distribution Expenses: Sr. No. Particulars Amount (Rs.) Remarks 1. 2. 3. 4. 5.
Publicity expenses Traveling Freight Commission Misc.
Total 5.7 Administrative Expenses: Sr. No. Particulars Amount (Rs.) Remarks 1. 2. 3. 4.
Stationery & printing Post/telephone/telegrams Entertainment expenses Misc.
Total 5.8 Interest: Year Outstanding Loan
Amount (Rs.) Interest (Rs.) Installment (Rs.) Balance (Rs.)
5.9 Depreciation: Sr. No. Type of Asset Cost of Asset Expected Life Depreciation
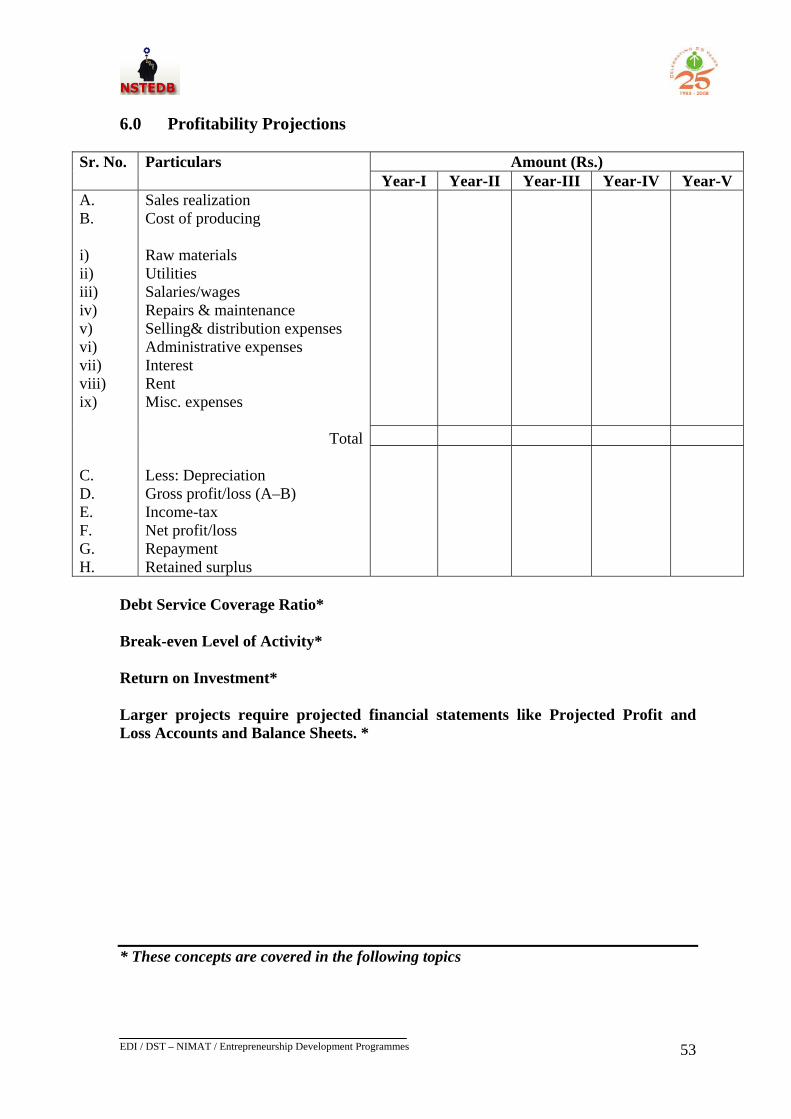
EDI / DST – NIMAT / Entrepreneurship Development Programmes
53
53
6.0 Profitability Projections
Amount (Rs.) Sr. No. Particulars Year-I Year-II Year-III Year-IV Year-V
A. B. i) ii) iii) iv) v) vi) vii) viii) ix) C. D. E. F. G. H.
Sales realization Cost of producing Raw materials Utilities Salaries/wages Repairs & maintenance Selling& distribution expenses Administrative expenses Interest Rent Misc. expenses
Total Less: Depreciation Gross profit/loss (A–B) Income-tax Net profit/loss Repayment Retained surplus
Debt Service Coverage Ratio* Break-even Level of Activity* Return on Investment* Larger projects require projected financial statements like Projected Profit and Loss Accounts and Balance Sheets. * * These concepts are covered in the following topics
EDI / DST – NIMAT / Entrepreneurship Development Programmes
54
54
CHAPTER – 9
ASSESSING FINANCIAL VIABILITY OF THE PROJECT Certain tools help us assess the financial viability of any project where investment is contemplated. We will discuss some tools in brief. Tools that determine the adequacy of the surplus: RETURN ON INVESTMENT
What is Return? As we know, a project collects funds from two sources for long-term investment. The amount collected is used to create assets and operation, which generates surplus for the enterprise. Surplus is required to be distributed to the contributors of the funds. Interest is the compensation given to contributors of borrowed capital, and net profit and depreciation are given to contributors of own capital. Why should you add depreciation here? Though depreciation reduces profit, it is a non-cash provision made to recover the original investment. Thus, the cash profit of the enterprise is increased to the extent of depreciation. The total surplus generated by the project over its entire life has to be averaged to find out yearly return. This yearly return, when calculated on the total investment needed for the project, tells us about the return on investment. Simply speaking, this ratio tells us the surplus-generating capacity of the investment. One must know how much RoI a viable project must generate. This is an important question that needs to be answered to know the financial viability. The simple rule to assess the viability is that the RoI must be greater than the cost of investment. First look at the investment cost. Investment comprises two major components:
i) Borrowed capital (Normally taken as loans from banks and financial
institutions) ii) Own capital (Normally contributed by entrepreneurs)
It is simple to calculate the cost of borrowed capital. Any borrower is required to commit the fixed service charge, i.e. interest at the time of sanctioning loan. Thus, the interest becomes the cost of borrowed capital. Interest is tax-allowed expense and, therefore, its effective weight is reduced by the actual rate of tax paid by the borrower. The entrepreneurs may have more than one investment alternative and under such conditions, the opportunity cost becomes the cost of entrepreneur’s capital. Acceptance Rule For the investment to be financially viable, the RoI should be greater than the cost of investment.
EDI / DST – NIMAT / Entrepreneurship Development Programmes
55
55
DEBT SERVICE COVERAGE RATIO (DSCR) Running an enterprise with financial support from banks/financial institutions, require their loans to be repaid with interest. Therefore, an entrepreneur must generate surplus, adequate to meet repayment obligations. The DSCR is a tool used to determine this. Its formula is: Net profit + interest (on long term loans) + depreciation Interest (on long term loans) + principal loan Acceptance Rule A project is considered financially viable if the cumulative DSCR during repayment period is at least 2:1 BREAK-EVEN POINT (BEP) This is another important tool. The break-even point is the level of activity where the total contribution is equal to the total fixed cost. Contribution is the excess of sales over variable cost, i.e.; Contribution = Sales – Variable Cost Contribution is a type of surplus that the business generates after paying fully the variable cost from the sales revenue. The break-even point is the point of activity where all cost (variable as well as fixed) is recovered from the sales values. The business, therefore, does not make profit or loss. For any activity below break-even, the business will incur loss, while it makes profit when activity is above it. So, when the business fully pays for the total fixed cost from contribution, the unit can be said to have achieved the BEP. When contribution fully pays for fixed cost, the business is said to have achieved break-even. Several formulae have been evolved to calculate break-even: 1. BEP = Total Fixed Cost
(In quantum of activity) Contribution per unit of activity 2. BEP = Total Fixed Cost X Sale price per unit
(In sales value) Contribution per unit of activity Acceptance Rule The BEP indicates the risk involved in a project. Normally, enterprises achieving break-even sales level at higher capacity utilization are considered to be more risky, while those achieving it at a lower level of capacity utilization are safer. The thumb rule is lowering the break-even betters the proposition. DEBT-EQUITY RATIO This ratio indicates the extent to which the promoter’s funds are leveraged to procure loans. The formula of DER is:

EDI / DST – NIMAT / Entrepreneurship Development Programmes
56
56
Total long-term debt Total promoter’s funds (includes subsidy)
A higher debt equity ratio indicates more risk due to a higher fixed cost of interest. The BEP of such enterprises will go up. Acceptance Rule It would be desirable to maintain the DER at a judicious level, say, varying between 2:1 and 3:1 for small and micro enterprises.
EDI / DST – NIMAT / Entrepreneurship Development Programmes
57
57
CHAPTER - 10
BOOKKEEPING AND ACCOUNTING AND FINANCIAL STATEMENTS
Any business activity, be it manufacturing, servicing or trading, involves monetary transactions. At the end, if the total money received is more than the total money spent, the business is said to have generated a ‘surplus’ or `profit'. If it is otherwise, the business is said have been in ‘deficit' or `losses. Every business intends to generate a surplus or profit. Therefore, the promoter(s) is/are always interested in knowing the outcome of the economic activity. Several transactions take place in the course of business. To remember all of them is almost impossible. A business therefore, needs to record all such transactions to find out the outcome of the business activity. A methodical and systematic science has been developed which helps the promoter to record all economic transactions properly and know the outcome of the business dealings. This science is called "Financial Accounting." Accounting is a name given to the system which measures records, analyses and reports the effect of business transactions and events taking place in business enterprises. Since such reporting is in financial units, the system is also known as financial accounting. It has been defined as the art and science of recording business transactions in a methodical manner so as to show (a) the true state of affairs of a business at a particular time, and (b) the surplus or deficiency, which has accrued during a specified period. Thus `Financial Accounting' involves (a) data recording and (b) data presenting technique used for recording various transactions. This is called Bookkeeping. The data recorded is summarized and systematically arranged and presented to various users in the form of Financial Statements. WHAT IS BOOKKEEPING? ‘Bookkeeping' is one of the functions of financial accounting. Bookkeeping entails maintaining proper records and books for recording complete details of transactions made during the course of business. Business transactions can be classified into several major activities/groups e.g. sales, purchases, assets, etc. Separate books for recording transactions pertaining to these activities are maintained, registering in them the details of respective transaction. This exercise is called Bookkeeping. Why are Books of Accounts Maintained? It is extremely important to have latest information about what is happening in the business. This helps in taking appropriate and timely action. A doctor needs details about the physiological conditions of a patient to diagnose the illness, its causes and its remedies. Just like that the owner of the business, creditor, or banker needs to know about the latest financial health of the business for taking suitable decisions about the future course of action. Bookkeeping helps in maintaining and providing the latest position of the business and, therefore, assumes great significance. It is advisable to maintain books of accounts for the following reasons as well:
EDI / DST – NIMAT / Entrepreneurship Development Programmes
58
58
• They provide up-to-date information about the business. • They reflect the outcome of transactions made during the period under review. • They give information about the state of affairs of the business at regular intervals. • They help governments and other authorities to decide about the incidence of
various taxes. • They help analyze the performance of the business. • They help compare the performance of several business firms. The accounting information of business is required not only by the owner of the business but by various other parties too. They are the government, suppliers, creditors, bankers, investors, shareholders, auditors, etc. They depend on the information prepared by financial accounting for taking various decisions pertaining to their activities. This emphasizes the need for writing books of accounts in a systematic and methodical way. Though, as an owner of the business you have the prime responsibility to write and maintain the books of accounts, you are not free to write the accounts, the way you like. You have to write the accounts as per the norms and principles of techniques and systems of accounting used the world over. There are a few accounting techniques available for writing accounts but the Double Entry Bookkeeping System has universal acceptability and credibility. It is the modern and scientific accounting system designed to reflect the true and fair position of the business. DOUBLE ENTRY BOOKKEEPING The concept of the Double Entry Bookkeeping System is based on the principle that every economic transaction has two effects, which are exactly opposite to each other. Any transaction can have only two effects: `debit' and `credit', and they are always equal. As a result, at the end of the accounting period, the accounts should `tally', meaning thereby that both `total debits’ and `total credits' should tally with each other. Double entry bookkeeping is designed in such a way that, while entering the credit entry of a particular transaction, the details of the corresponding debit entry is also given. Writing Accounts under Double Entry Bookkeeping Transactions In business, the promoter does several transactions. The effect of these transactions on the business is recorded in the books of accounts. Only those transactions, which result in exchange of money or exchange of goods or services, whose value can be measured in monetary terms, need accounting treatment. Transactions may be of the following nature:
(a) Exchange of goods against cash / credit (b) Exchange of services against cash / credit (c) Exchange of assets against cash / credit (d) Payment of cash to creditors (e) Receipt of cash from debtors (f) Exchange of goods against assets (g) Exchange of goods against services
Thus several types of transactions take place in business and they form the starting point of accounting. There are two types of transactions: (i) Cash transactions and (ii) Credit
EDI / DST – NIMAT / Entrepreneurship Development Programmes
59
59
transactions. Cash transaction results in exchange of cash, while credit transaction results in an obligation to pay / receive cash in the future. Accounts Transactions involve `accounts'. Each transaction is done through an `account' only. There are total three types of accounts: (i) Personal account or Individual account: This group of account includes all
accounts of individuals and organizations like a firm, a corporate entity, a society, etc.
(ii) Assets account: This group of accounts covers all types of assets. Assets mean all
those investments made in tangible or intangible form of assets, which have utility value or use value. Moreover, these assets can also be disinvested and converted into cash.
(iii) Income-expenditure account: This group of accounts encompasses all accounts,
which represent revenue income and revenue expenditure of the business. Rules of Debit and Credit In the Double Entry Book-Keeping System, each transaction has two effects. One is called `Debit' and the other is called `Credit'. Thus each transaction has minimum one debit effect and minimum one corresponding credit effect. There are prescribed rules for debiting and crediting various accounts, which are classified under three major groups as mentioned above. These rules form the basis of accounting under Double Entry Bookkeeping System. Below given are these rules: (i) Rule for ‘Personal Accounts’: "Debit the Receiver and Credit the Giver". Explanation: Any person involved in a transaction can either be a receiver of cash, asset or services, or be a giver of cash, asset or services, without any immediate consideration. The account of the person who receives is debited, while the account of the person who gives is credited. (ii) Rule for ‘Assets Accounts’: "Debit what comes in and Credit what goes out." Explanation: In business, goods and assets come and go. Whenever assets or goods come in the business its respective account is debited, while in the case of assets or goods going out of the business as a result of a transaction, its respective account is credited. (iii) Rule for `Income-Expenditure Accounts’: "Debit Expenses and Losses and Credit
Incomes and Gains" Explanation: This group of accounts covers all revenue income and expenditure accounts. All those revenue incomes that are generated during the course of the business are credited in their respective accounts and all such revenue expenditures incurred during the course of the business are debited in their respective accounts.
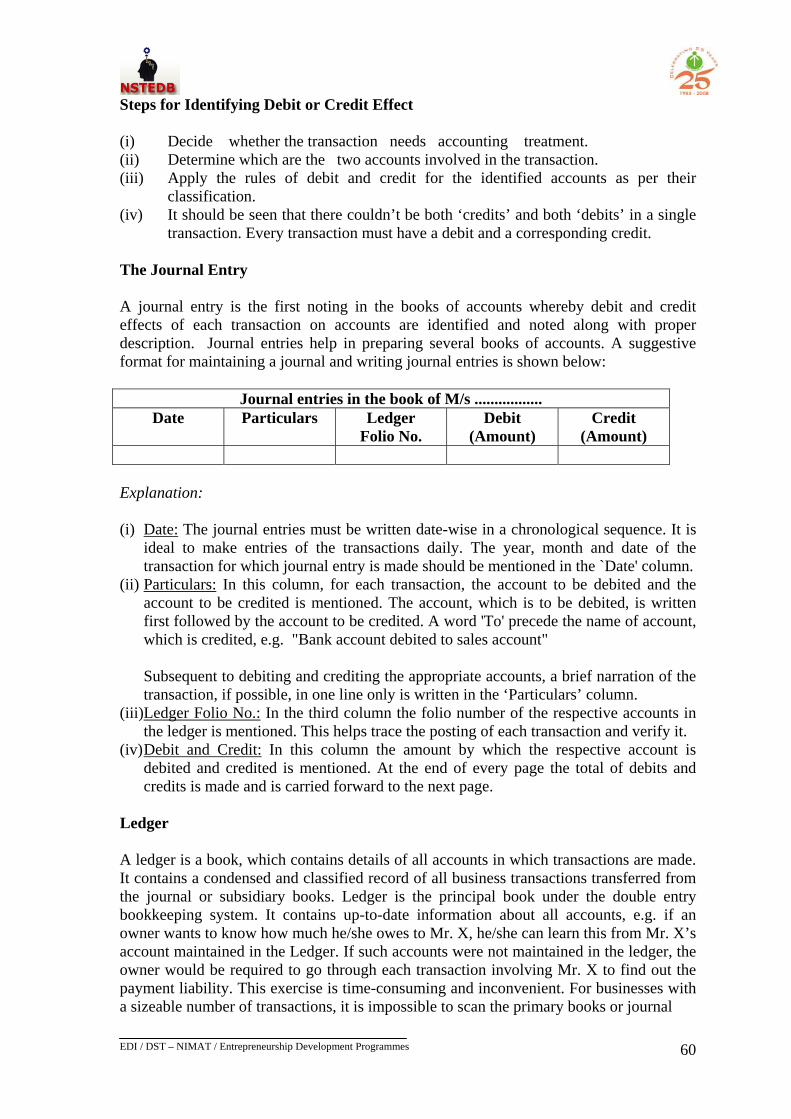
EDI / DST – NIMAT / Entrepreneurship Development Programmes
60
60
Steps for Identifying Debit or Credit Effect (i) Decide whether the transaction needs accounting treatment. (ii) Determine which are the two accounts involved in the transaction. (iii) Apply the rules of debit and credit for the identified accounts as per their
classification. (iv) It should be seen that there couldn’t be both ‘credits’ and both ‘debits’ in a single
transaction. Every transaction must have a debit and a corresponding credit. The Journal Entry A journal entry is the first noting in the books of accounts whereby debit and credit effects of each transaction on accounts are identified and noted along with proper description. Journal entries help in preparing several books of accounts. A suggestive format for maintaining a journal and writing journal entries is shown below:
Journal entries in the book of M/s ................. Date Particulars Ledger
Folio No. Debit
(Amount) Credit
(Amount) Explanation: (i) Date: The journal entries must be written date-wise in a chronological sequence. It is
ideal to make entries of the transactions daily. The year, month and date of the transaction for which journal entry is made should be mentioned in the `Date' column.
(ii) Particulars: In this column, for each transaction, the account to be debited and the account to be credited is mentioned. The account, which is to be debited, is written first followed by the account to be credited. A word 'To' precede the name of account, which is credited, e.g. "Bank account debited to sales account" Subsequent to debiting and crediting the appropriate accounts, a brief narration of the transaction, if possible, in one line only is written in the ‘Particulars’ column.
(iii)Ledger Folio No.: In the third column the folio number of the respective accounts in the ledger is mentioned. This helps trace the posting of each transaction and verify it.
(iv) Debit and Credit: In this column the amount by which the respective account is debited and credited is mentioned. At the end of every page the total of debits and credits is made and is carried forward to the next page.
Ledger A ledger is a book, which contains details of all accounts in which transactions are made. It contains a condensed and classified record of all business transactions transferred from the journal or subsidiary books. Ledger is the principal book under the double entry bookkeeping system. It contains up-to-date information about all accounts, e.g. if an owner wants to know how much he/she owes to Mr. X, he/she can learn this from Mr. X’s account maintained in the Ledger. If such accounts were not maintained in the ledger, the owner would be required to go through each transaction involving Mr. X to find out the payment liability. This exercise is time-consuming and inconvenient. For businesses with a sizeable number of transactions, it is impossible to scan the primary books or journal
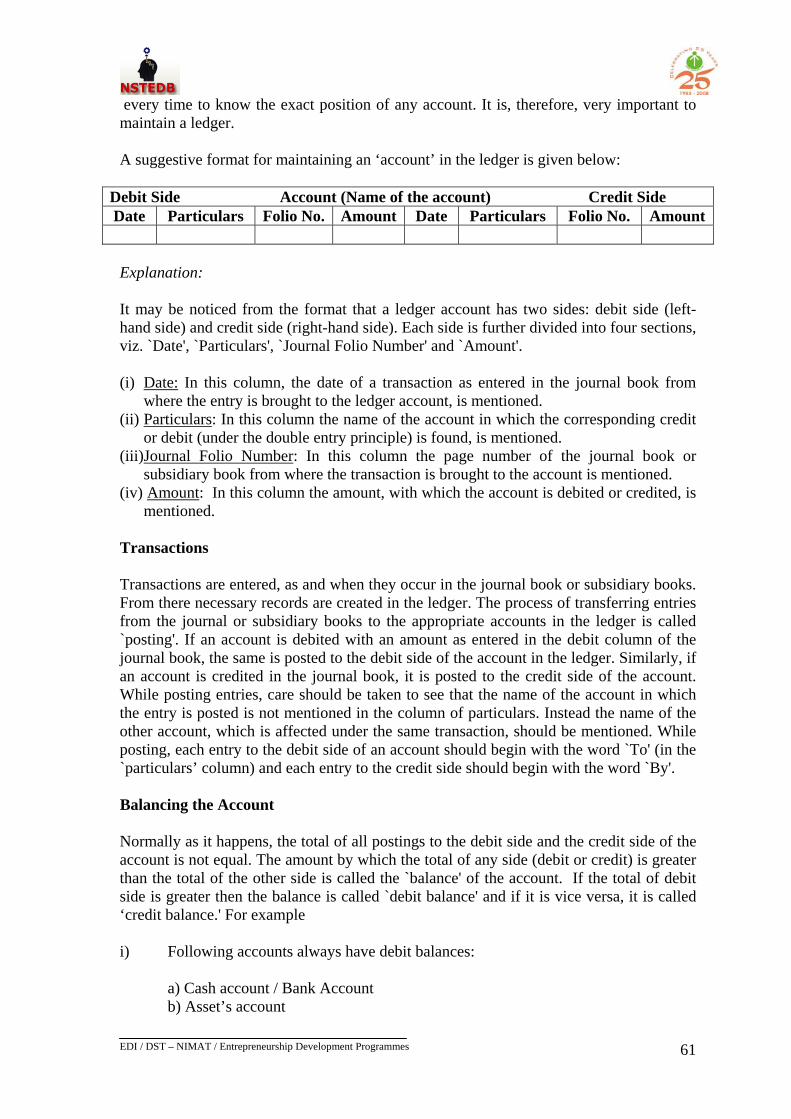
EDI / DST – NIMAT / Entrepreneurship Development Programmes
61
61
every time to know the exact position of any account. It is, therefore, very important to maintain a ledger. A suggestive format for maintaining an ‘account’ in the ledger is given below:
Debit Side Account (Name of the account) Credit Side Date Particulars Folio No. Amount Date Particulars Folio No. Amount
Explanation: It may be noticed from the format that a ledger account has two sides: debit side (left-hand side) and credit side (right-hand side). Each side is further divided into four sections, viz. `Date', `Particulars', `Journal Folio Number' and `Amount'. (i) Date: In this column, the date of a transaction as entered in the journal book from
where the entry is brought to the ledger account, is mentioned. (ii) Particulars: In this column the name of the account in which the corresponding credit
or debit (under the double entry principle) is found, is mentioned. (iii)Journal Folio Number: In this column the page number of the journal book or
subsidiary book from where the transaction is brought to the account is mentioned. (iv) Amount: In this column the amount, with which the account is debited or credited, is
mentioned. Transactions Transactions are entered, as and when they occur in the journal book or subsidiary books. From there necessary records are created in the ledger. The process of transferring entries from the journal or subsidiary books to the appropriate accounts in the ledger is called `posting'. If an account is debited with an amount as entered in the debit column of the journal book, the same is posted to the debit side of the account in the ledger. Similarly, if an account is credited in the journal book, it is posted to the credit side of the account. While posting entries, care should be taken to see that the name of the account in which the entry is posted is not mentioned in the column of particulars. Instead the name of the other account, which is affected under the same transaction, should be mentioned. While posting, each entry to the debit side of an account should begin with the word `To' (in the `particulars’ column) and each entry to the credit side should begin with the word `By'. Balancing the Account Normally as it happens, the total of all postings to the debit side and the credit side of the account is not equal. The amount by which the total of any side (debit or credit) is greater than the total of the other side is called the `balance' of the account. If the total of debit side is greater then the balance is called `debit balance' and if it is vice versa, it is called ‘credit balance.' For example i) Following accounts always have debit balances:
a) Cash account / Bank Account b) Asset’s account
EDI / DST – NIMAT / Entrepreneurship Development Programmes
62
62
c) Debtor’s account d) Stocks account e) Revenue expenses account f) Losses account g) Investment account
ii) Following accounts always have credit balances:
a) Creditor’s account b) Revenue income's account c) Gain’s or profit's account d) Bank loan account e) Interest received
As seen earlier, the journal book is the first book required to be kept in the business where all transactions are recorded. It is the book of original entry. Likewise, the ledger is the most important basic book, which records all accounts. So long as the transactions in the business are limited and simple, it is possible to enter all transactions first in the journal book and then in respective accounts in the ledger. But with the size of a business and the number of transactions increasing, it becomes difficult to maintain a journal book for all the transactions and post them in the ledger. Under such circumstances, it becomes necessary to divide the journal books and the ledger into some separate subsidiary books, each of which is reserved for recording one particular class of transactions, e.g. purchase book, sales book, cash book, etc. Books needed to be maintained for a Simple Accounting System For a small industrial enterprise, the usage of the simple financial accounting system is recommended. Such businesses must maintain a set of books as suggested below. By doing so, the businesses can get a correct and fair picture of the activities speedily. (a) Journal: All transactions (except those which are to be recorded in subsidiary books) are properly recorded here. (b) Subsidiary books (for journal)
(i) Purchase book: In the purchase book, all transactions pertaining to purchases, be it on credit or by cash, are recorded. Transactions of purchase returned are also recorded here separately.
(ii) Sales book: In the sales book, all transactions pertaining to credit or cash sales are recorded. Transactions of sales returned are also recorded separately.
(iii)Ledger: All accounts involved in the transactions recorded in the journal or its
subsidiary books are maintained here, and necessary posting is made. (iv) Cash book: The cashbook is a subsidiary book of the ledger where the account of
`cash' is maintained. Transactions involving ‘petty cash’ are also posted here separately.
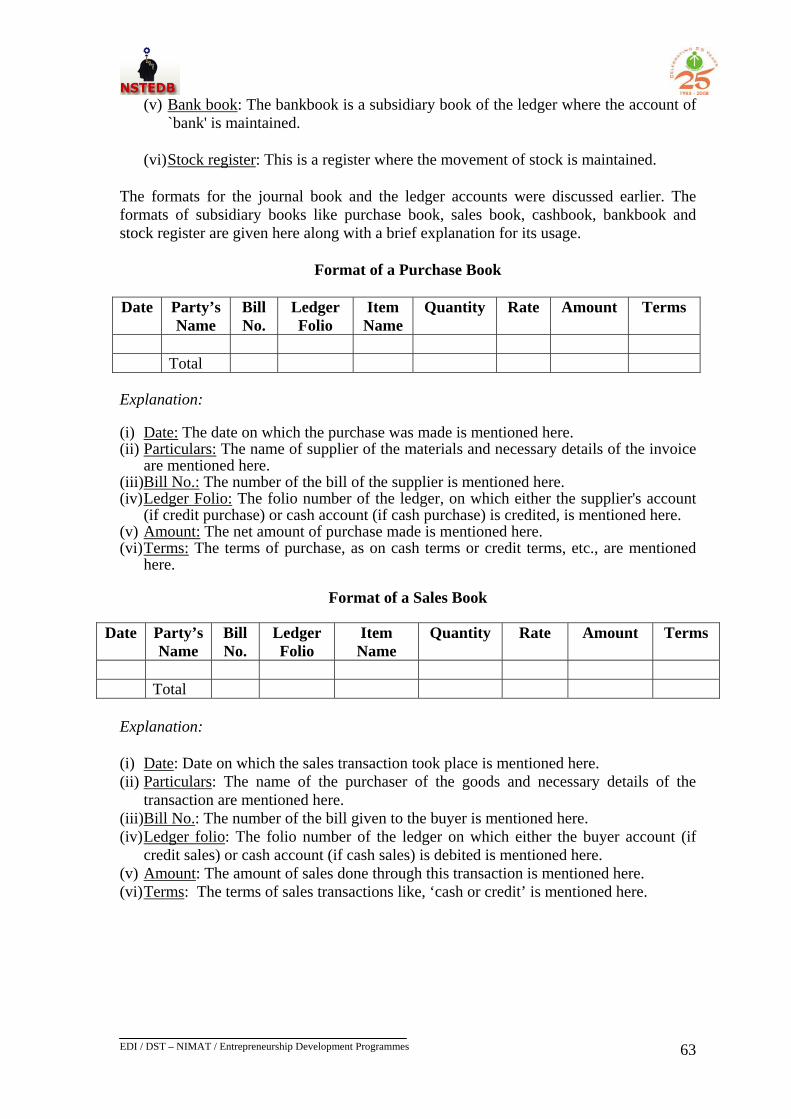
EDI / DST – NIMAT / Entrepreneurship Development Programmes
63
63
(v) Bank book: The bankbook is a subsidiary book of the ledger where the account of `bank' is maintained.
(vi) Stock register: This is a register where the movement of stock is maintained.
The formats for the journal book and the ledger accounts were discussed earlier. The formats of subsidiary books like purchase book, sales book, cashbook, bankbook and stock register are given here along with a brief explanation for its usage.
Format of a Purchase Book Date Party’s
Name Bill No.
Ledger Folio
Item Name
Quantity Rate Amount Terms
Total Explanation: (i) Date: The date on which the purchase was made is mentioned here. (ii) Particulars: The name of supplier of the materials and necessary details of the invoice
are mentioned here. (iii)Bill No.: The number of the bill of the supplier is mentioned here. (iv) Ledger Folio: The folio number of the ledger, on which either the supplier's account
(if credit purchase) or cash account (if cash purchase) is credited, is mentioned here. (v) Amount: The net amount of purchase made is mentioned here. (vi) Terms: The terms of purchase, as on cash terms or credit terms, etc., are mentioned
here.
Format of a Sales Book
Date Party’s Name
Bill No.
Ledger Folio
Item Name
Quantity Rate Amount Terms
Total
Explanation: (i) Date: Date on which the sales transaction took place is mentioned here. (ii) Particulars: The name of the purchaser of the goods and necessary details of the
transaction are mentioned here. (iii)Bill No.: The number of the bill given to the buyer is mentioned here. (iv) Ledger folio: The folio number of the ledger on which either the buyer account (if
credit sales) or cash account (if cash sales) is debited is mentioned here. (v) Amount: The amount of sales done through this transaction is mentioned here. (vi) Terms: The terms of sales transactions like, ‘cash or credit’ is mentioned here.
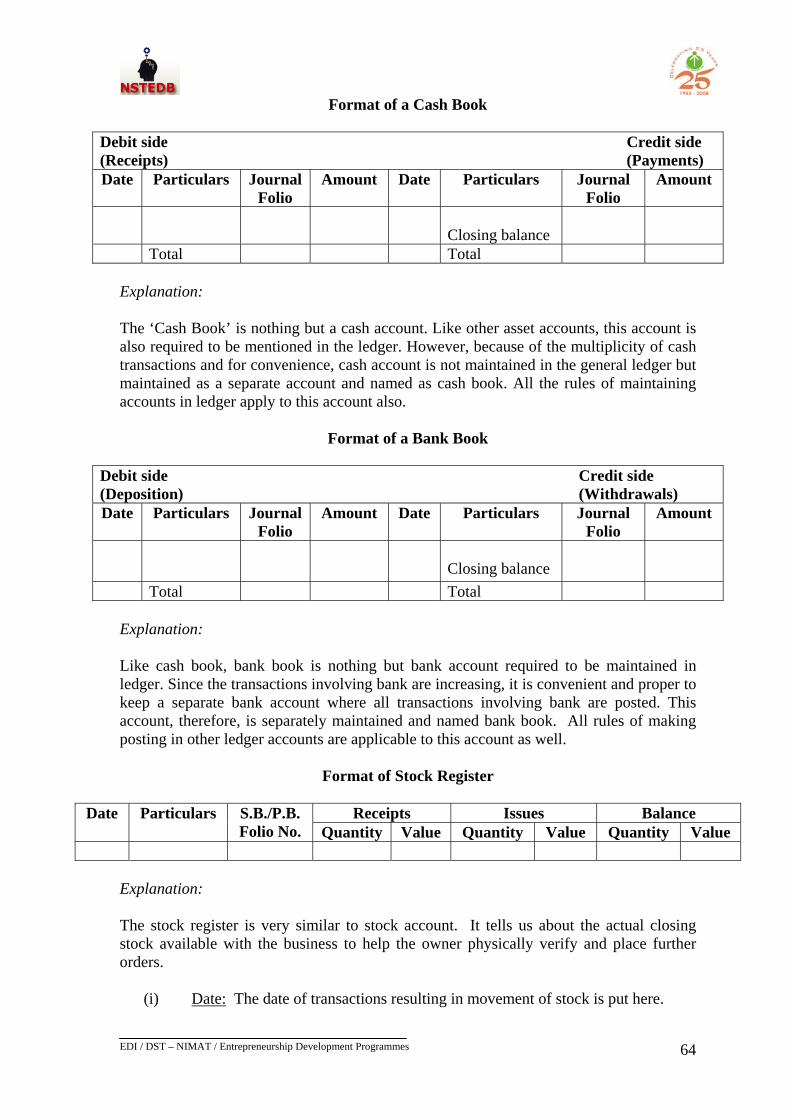
EDI / DST – NIMAT / Entrepreneurship Development Programmes
64
64
Format of a Cash Book
Debit side Credit side (Receipts) (Payments) Date Particulars Journal
Folio Amount Date Particulars Journal
Folio Amount
Closing balance
Total Total
Explanation: The ‘Cash Book’ is nothing but a cash account. Like other asset accounts, this account is also required to be mentioned in the ledger. However, because of the multiplicity of cash transactions and for convenience, cash account is not maintained in the general ledger but maintained as a separate account and named as cash book. All the rules of maintaining accounts in ledger apply to this account also.
Format of a Bank Book
Debit side Credit side (Deposition) (Withdrawals) Date Particulars Journal
Folio Amount Date Particulars Journal
Folio Amount
Closing balance
Total Total
Explanation: Like cash book, bank book is nothing but bank account required to be maintained in ledger. Since the transactions involving bank are increasing, it is convenient and proper to keep a separate bank account where all transactions involving bank are posted. This account, therefore, is separately maintained and named bank book. All rules of making posting in other ledger accounts are applicable to this account as well.
Format of Stock Register
Receipts Issues Balance Date Particulars S.B./P.B. Folio No. Quantity Value Quantity Value Quantity Value
Explanation: The stock register is very similar to stock account. It tells us about the actual closing stock available with the business to help the owner physically verify and place further orders.
(i) Date: The date of transactions resulting in movement of stock is put here.
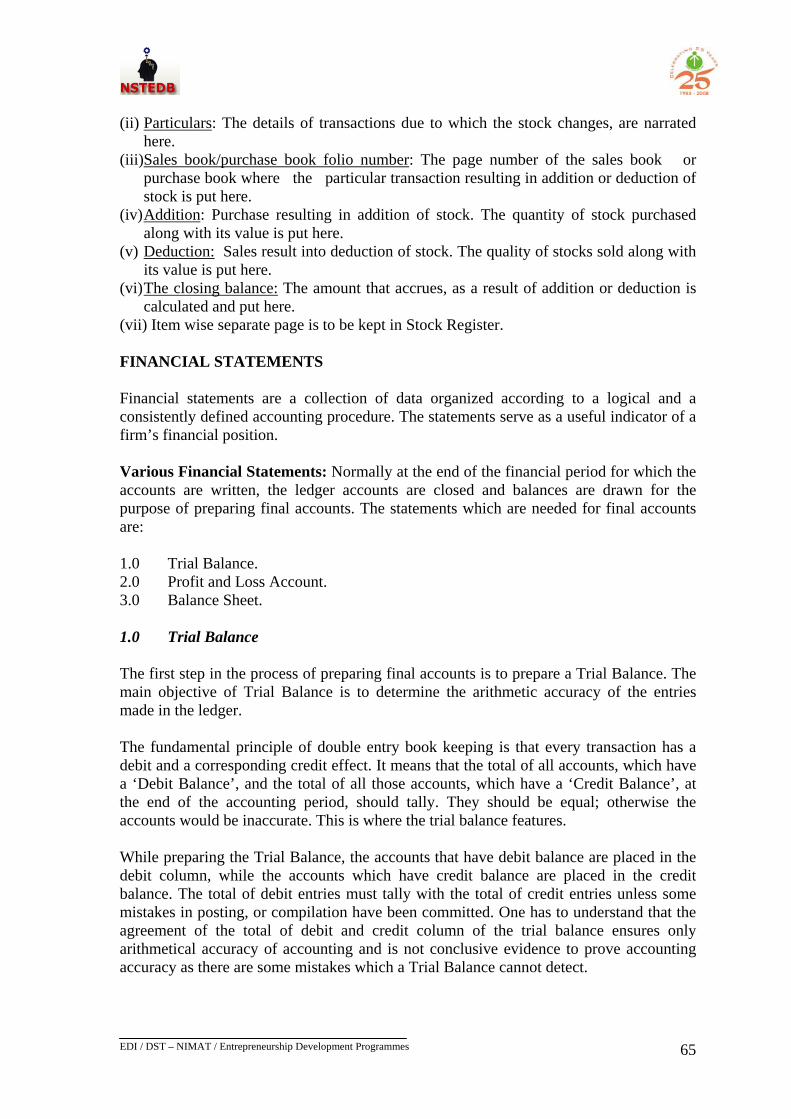
EDI / DST – NIMAT / Entrepreneurship Development Programmes
65
65
(ii) Particulars: The details of transactions due to which the stock changes, are narrated
here. (iii)Sales book/purchase book folio number: The page number of the sales book or
purchase book where the particular transaction resulting in addition or deduction of stock is put here.
(iv) Addition: Purchase resulting in addition of stock. The quantity of stock purchased along with its value is put here.
(v) Deduction: Sales result into deduction of stock. The quality of stocks sold along with its value is put here.
(vi) The closing balance: The amount that accrues, as a result of addition or deduction is calculated and put here.
(vii) Item wise separate page is to be kept in Stock Register. FINANCIAL STATEMENTS Financial statements are a collection of data organized according to a logical and a consistently defined accounting procedure. The statements serve as a useful indicator of a firm’s financial position. Various Financial Statements: Normally at the end of the financial period for which the accounts are written, the ledger accounts are closed and balances are drawn for the purpose of preparing final accounts. The statements which are needed for final accounts are: 1.0 Trial Balance. 2.0 Profit and Loss Account. 3.0 Balance Sheet. 1.0 Trial Balance The first step in the process of preparing final accounts is to prepare a Trial Balance. The main objective of Trial Balance is to determine the arithmetic accuracy of the entries made in the ledger. The fundamental principle of double entry book keeping is that every transaction has a debit and a corresponding credit effect. It means that the total of all accounts, which have a ‘Debit Balance’, and the total of all those accounts, which have a ‘Credit Balance’, at the end of the accounting period, should tally. They should be equal; otherwise the accounts would be inaccurate. This is where the trial balance features. While preparing the Trial Balance, the accounts that have debit balance are placed in the debit column, while the accounts which have credit balance are placed in the credit balance. The total of debit entries must tally with the total of credit entries unless some mistakes in posting, or compilation have been committed. One has to understand that the agreement of the total of debit and credit column of the trial balance ensures only arithmetical accuracy of accounting and is not conclusive evidence to prove accounting accuracy as there are some mistakes which a Trial Balance cannot detect.
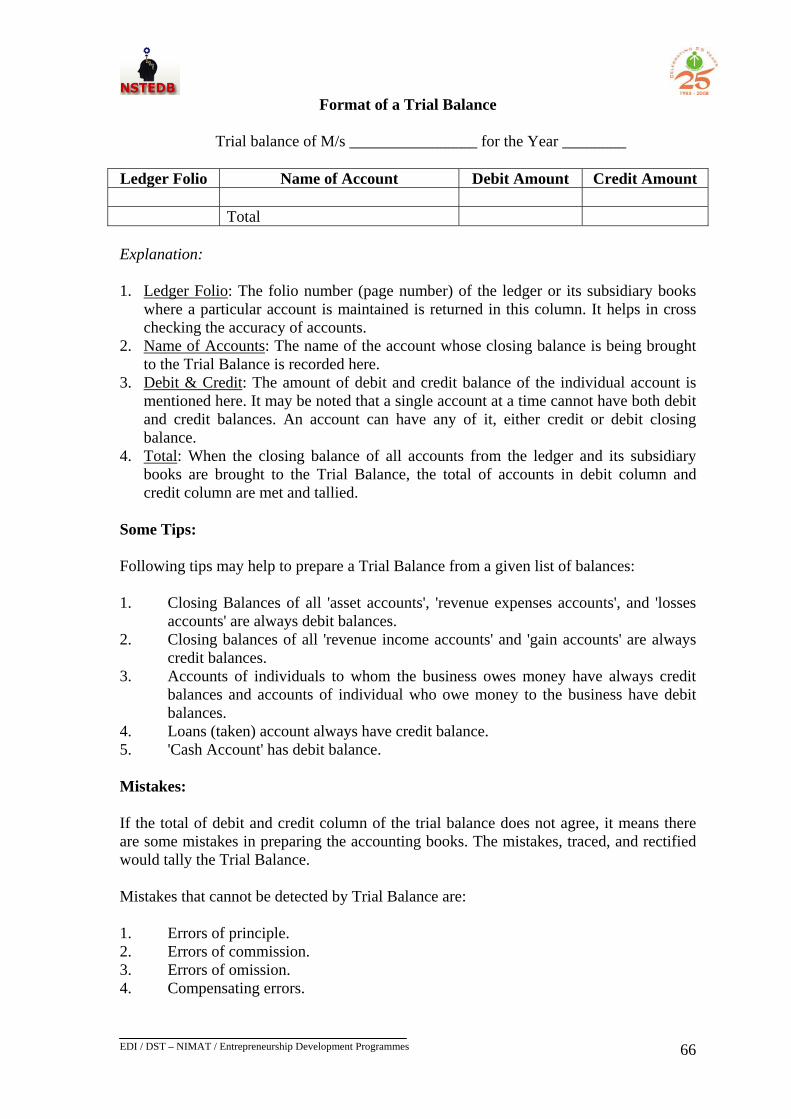
EDI / DST – NIMAT / Entrepreneurship Development Programmes
66
66
Format of a Trial Balance Trial balance of M/s ________________ for the Year ________ Ledger Folio Name of Account Debit Amount Credit Amount
Total Explanation: 1. Ledger Folio: The folio number (page number) of the ledger or its subsidiary books
where a particular account is maintained is returned in this column. It helps in cross checking the accuracy of accounts.
2. Name of Accounts: The name of the account whose closing balance is being brought to the Trial Balance is recorded here.
3. Debit & Credit: The amount of debit and credit balance of the individual account is mentioned here. It may be noted that a single account at a time cannot have both debit and credit balances. An account can have any of it, either credit or debit closing balance.
4. Total: When the closing balance of all accounts from the ledger and its subsidiary books are brought to the Trial Balance, the total of accounts in debit column and credit column are met and tallied.
Some Tips: Following tips may help to prepare a Trial Balance from a given list of balances: 1. Closing Balances of all 'asset accounts', 'revenue expenses accounts', and 'losses
accounts' are always debit balances. 2. Closing balances of all 'revenue income accounts' and 'gain accounts' are always
credit balances. 3. Accounts of individuals to whom the business owes money have always credit
balances and accounts of individual who owe money to the business have debit balances.
4. Loans (taken) account always have credit balance. 5. 'Cash Account' has debit balance. Mistakes: If the total of debit and credit column of the trial balance does not agree, it means there are some mistakes in preparing the accounting books. The mistakes, traced, and rectified would tally the Trial Balance. Mistakes that cannot be detected by Trial Balance are: 1. Errors of principle. 2. Errors of commission. 3. Errors of omission. 4. Compensating errors.
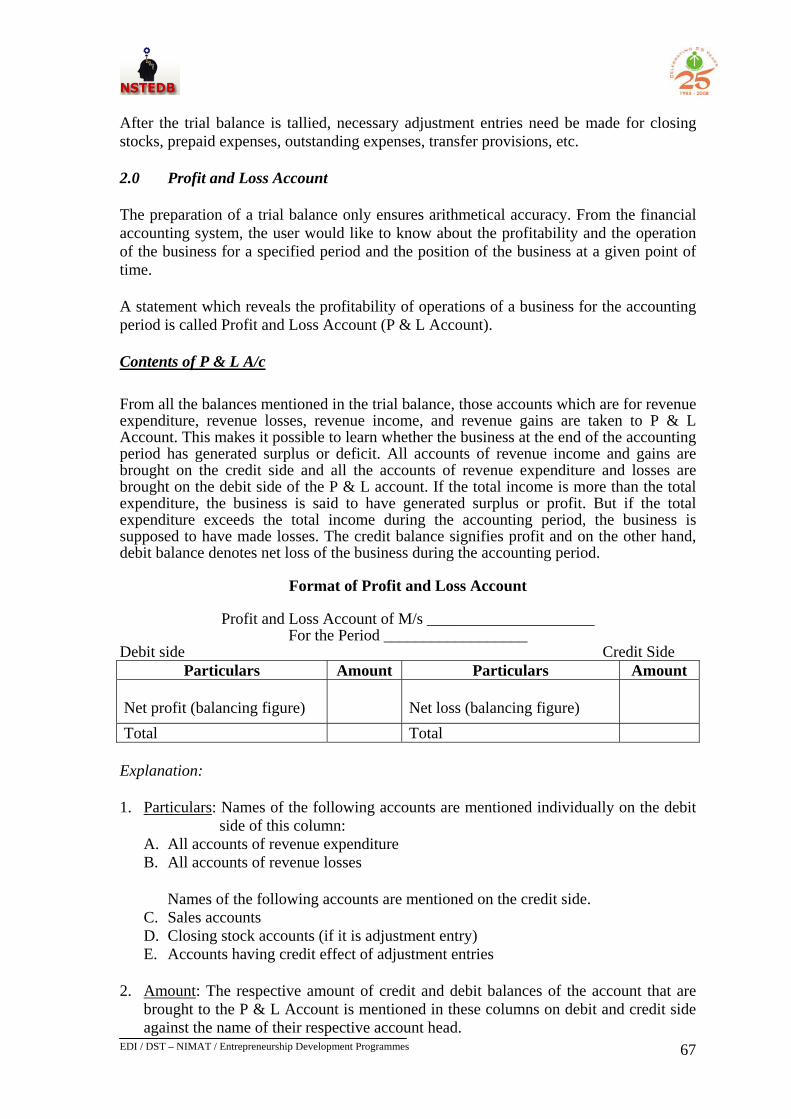
EDI / DST – NIMAT / Entrepreneurship Development Programmes
67
67
After the trial balance is tallied, necessary adjustment entries need be made for closing stocks, prepaid expenses, outstanding expenses, transfer provisions, etc. 2.0 Profit and Loss Account The preparation of a trial balance only ensures arithmetical accuracy. From the financial accounting system, the user would like to know about the profitability and the operation of the business for a specified period and the position of the business at a given point of time. A statement which reveals the profitability of operations of a business for the accounting period is called Profit and Loss Account (P & L Account). Contents of P & L A/c From all the balances mentioned in the trial balance, those accounts which are for revenue expenditure, revenue losses, revenue income, and revenue gains are taken to P & L Account. This makes it possible to learn whether the business at the end of the accounting period has generated surplus or deficit. All accounts of revenue income and gains are brought on the credit side and all the accounts of revenue expenditure and losses are brought on the debit side of the P & L account. If the total income is more than the total expenditure, the business is said to have generated surplus or profit. But if the total expenditure exceeds the total income during the accounting period, the business is supposed to have made losses. The credit balance signifies profit and on the other hand, debit balance denotes net loss of the business during the accounting period.
Format of Profit and Loss Account
Profit and Loss Account of M/s _____________________ For the Period __________________
Debit side Credit Side Particulars Amount Particulars Amount
Net profit (balancing figure)
Net loss (balancing figure)
Total Total Explanation: 1. Particulars: Names of the following accounts are mentioned individually on the debit
side of this column: A. All accounts of revenue expenditure B. All accounts of revenue losses Names of the following accounts are mentioned on the credit side. C. Sales accounts D. Closing stock accounts (if it is adjustment entry) E. Accounts having credit effect of adjustment entries
2. Amount: The respective amount of credit and debit balances of the account that are
brought to the P & L Account is mentioned in these columns on debit and credit side against the name of their respective account head.
EDI / DST – NIMAT / Entrepreneurship Development Programmes
68
68
Notes: a) It is to be understood that P & L Account contains only ‘Income and Expenditure
Accounts’ and not Individual, Personal, or Asset account. The accounts of ‘Income and Expenditure Accounts' get closed when they are brought to P & L Account, while the balance of 'Personal/Individual Accounts' and 'Assets Accounts' get carried forward to the subsequent year.
b) Net Profit and Net Loss: Subsequent to bringing all balances of the accounts to concerned debit and credit side, the total of their balance is made. If the total of credit side is more than the total of debit side then the business is said to have made net profit. The amount by which the total of credit side exceeds the total of debit side of P & L Account is called as 'Net Profit' generated during the accounting period. Likewise, the amount by which the total of debit side exceeds the total of credit side of the P & L Account is called as 'Net Loss' generated by the business during the year. Thus both figures of Net Profit and Net Loss are balancing figures. Adding them up with the total of debit or credit side as the case may be would make the totals of both the sides tally. But when the business generates neither profit nor loss, the total of credit side and the total of debit side of the P & L Account would tally with each other even otherwise. This is a situation where total income is equal to total expenses.
Thus, we can summarize as follows:
(1) Total of Credit Side of P& L A/c > Total of Debit Side of P& L A/c = Profit (2) Total of Credit Side of P & L A/c < Total of Debit Side of P& L A/c = Loss (3) Total of Credit Side of P & L A/c = Total of Debit Side of P& L A/c = No profit,
No loss Net profit or net loss is the result of business operations during the accounting period. They are transferred to the balance sheet where the capital account representing the financial involvement of the promoter is increased or decreased appropriately by the figures of net profit or net loss. 3.0 Balance Sheet As indicated, the purpose of financial accounting is to ascertain the result of business operation during an accounting year, and to understand the financial position of a business at a particular point of time. Profit and Loss Account serves the former purpose while Balance Sheet serves the latter objective. The accounts pertaining to the groups other than Income & Expenditure, viz. ‘Personal or Individual Account’ and ‘Assets Accounts’ are brought to the balance sheet. Unlike the accounts of the group of ‘Income and Expenditure Account’ the accounts brought to the balance sheet are not closed. Their closing balance at the time of the balance sheet finalisation is carried forward to the subsequent accounting period. They are shown on the balance sheet only to apprise the users about the position of accounts at that time.
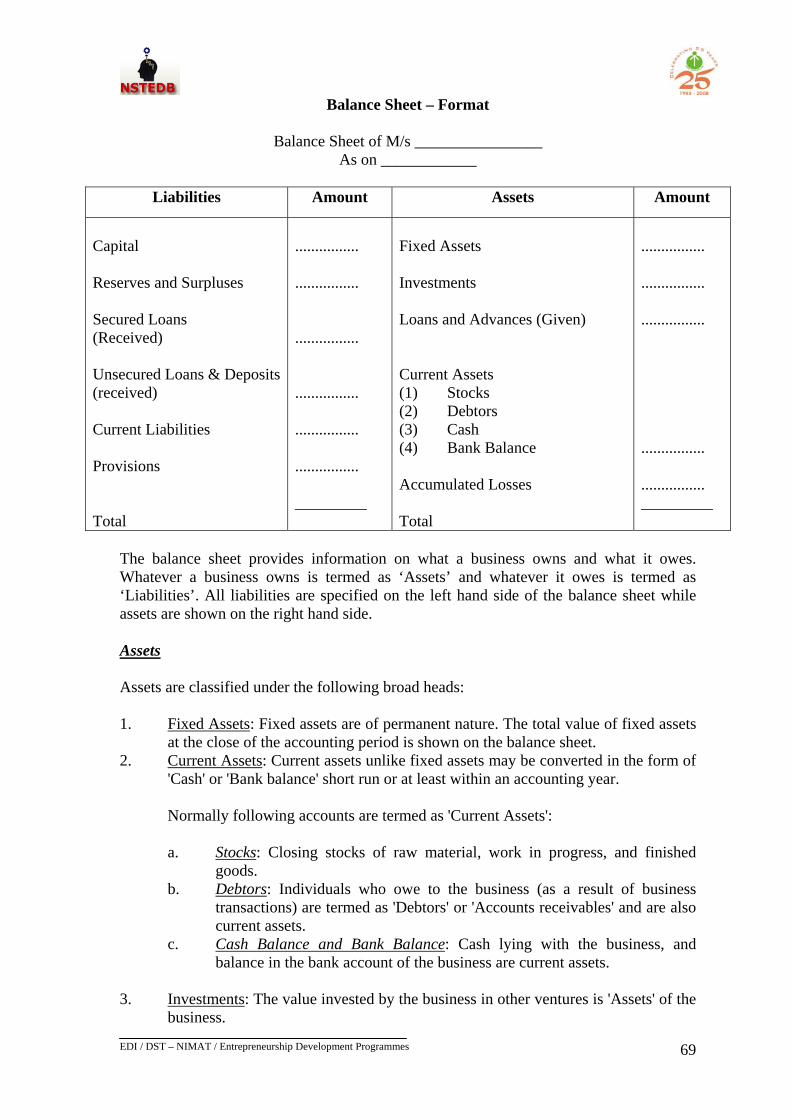
EDI / DST – NIMAT / Entrepreneurship Development Programmes
69
69
Balance Sheet – Format
Balance Sheet of M/s ________________ As on ____________
Liabilities Amount Assets Amount
Capital Reserves and Surpluses Secured Loans (Received) Unsecured Loans & Deposits (received) Current Liabilities Provisions Total
................ ................ ................ ................ ................ ................ _________
Fixed Assets Investments Loans and Advances (Given) Current Assets (1) Stocks (2) Debtors (3) Cash (4) Bank Balance Accumulated Losses Total
................ ................ ................ ................ ................ _________
The balance sheet provides information on what a business owns and what it owes. Whatever a business owns is termed as ‘Assets’ and whatever it owes is termed as ‘Liabilities’. All liabilities are specified on the left hand side of the balance sheet while assets are shown on the right hand side. Assets Assets are classified under the following broad heads: 1. Fixed Assets: Fixed assets are of permanent nature. The total value of fixed assets
at the close of the accounting period is shown on the balance sheet. 2. Current Assets: Current assets unlike fixed assets may be converted in the form of
'Cash' or 'Bank balance' short run or at least within an accounting year.
Normally following accounts are termed as 'Current Assets':
a. Stocks: Closing stocks of raw material, work in progress, and finished goods.
b. Debtors: Individuals who owe to the business (as a result of business transactions) are termed as 'Debtors' or 'Accounts receivables' and are also current assets.
c. Cash Balance and Bank Balance: Cash lying with the business, and balance in the bank account of the business are current assets.
3. Investments: The value invested by the business in other ventures is 'Assets' of the
business.
EDI / DST – NIMAT / Entrepreneurship Development Programmes
70
70
4. Loans and Advances (given): Loans or advances made to third parties are Assets
of an enterprise. These are not similar to the debtors (Current Assets) as in the case of debtors an individual becomes liable to pay to the business on account of purchase of a product of the business on credit terms.
5. Fictitious Assets: Fictitious assets are not tangible assets but are debit balances of accounts like P & L A/c, Accumulated Losses A/c, Expenses not written off A/c, etc.
Liabilities On the liabilities side, all 'personal' and 'individual' accounts to whom the business owes are mentioned. Liabilities can be classified in the following broad groups: 1. Capital: Money invested by the promoter is a liability. Business owes that much to
the promoter. 2. Reserves and Surplus: Accumulated profit which is not withdrawn and part of
profit which is reserved for some specific purpose also belong to the promoters. Business owes that much to the owner. They are, therefore, liabilities.
3. Secured Loans (received): Amount of loans taken by the business is liability for the business. These loans are secured against some assets which are offered to the institution/person who have given loans, as security or collateral.
4. Unsecured Loans and Deposits (received): These loans are also liabilities for the business. However, these loans are not secured.
5. Current liabilities: These are short-term funds taken for financing current assets. Normally, they are credits offered by the suppliers of raw materials and working capital loans given by the banks.
6. Provisions: They are liabilities for which payment provision has been made by the business from the profits, e.g. provision for tax liability.
Note: The total of 'Liabilities' side and 'Assets' side of the balance sheet must tally. If they don't, there has to be some mistake in preparing Final Accounts, which should be detected and rectified.
EDI / DST – NIMAT / Entrepreneurship Development Programmes
71
71
CHAPTER – 11
COSTING AND PRICING OF PRODUCTS A realistic and comprehensive knowledge on costing and pricing is required to build the financial management capabilities of entrepreneurs. This will help you run your enterprise successfully and enable you to give due importance to costing and pricing. Costing can be defined as the process of determining how much it costs to produce and sell a product or service. Costing is very important as the cost of a product can decide its profit or loss. There are two costs involved in determining the cost of a product / service, i.e. direct cost and indirect cost. Direct cost: The cost of those items that become part of the end-product are known as direct costs such as raw material, labour, packing material, etc. Indirect cost: All expenses incurred in running a business and that which cannot be directly identified with the end product are indirect costs. The following exercise could be used as an illustration for a better understanding of the concept: Costing Exercise Mr. Ramesh is processing mangoes for a pickles manufacturer, which subcontracts the work, when it has orders for processing less than 5,000 Kgs of mangoes. The pickles manufacturer provides raw mangoes, but all other inputs and expenses are the responsibility of Mr. Ramesh. To process 200 Kgs of mangoes, he needs spices and oil costing Rs. 400/- and fuel costing Rs. 100/-. In addition, he pays Rs. 2000/- to helpers who work for eight hours when he processes 2000 Kgs of mangoes. Calculate the price that he must quote per Kg of processing, to the pickle manufacturer if he decides to earn a minimum of Rs. 20 per Kg for himself. The correct solution is: Cost of processing 200 Kgs of Mangoes Rs. i) Spices and Oil 400.00 ii) Fuel 100.00 iii) Labour 200.00
--------- 700.00
He wants to earn Rs. 20/- per Kg. Hence for 200 Kgs targeted earning is Rs. 400/-. Therefore, he must quote Rs. 700.00 + Rs. 400.00 = Rs. 1100/- for 200 Kgs i.e. Rs. 55/-per Kg. Please note that more the price the higher the profitability. But then proper pricing should be done so that the product finds a place in the market. Cost reduction is the other way to
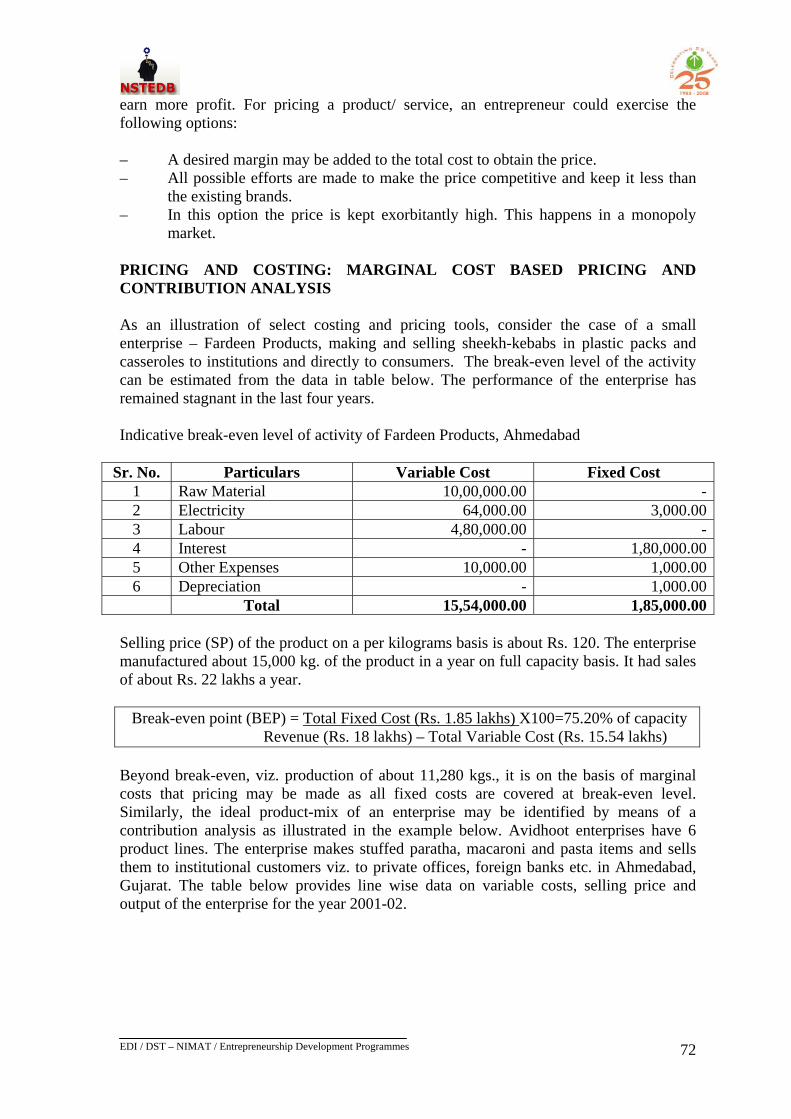
EDI / DST – NIMAT / Entrepreneurship Development Programmes
72
72
earn more profit. For pricing a product/ service, an entrepreneur could exercise the following options: – A desired margin may be added to the total cost to obtain the price. – All possible efforts are made to make the price competitive and keep it less than
the existing brands. – In this option the price is kept exorbitantly high. This happens in a monopoly
market. PRICING AND COSTING: MARGINAL COST BASED PRICING AND CONTRIBUTION ANALYSIS As an illustration of select costing and pricing tools, consider the case of a small enterprise – Fardeen Products, making and selling sheekh-kebabs in plastic packs and casseroles to institutions and directly to consumers. The break-even level of the activity can be estimated from the data in table below. The performance of the enterprise has remained stagnant in the last four years. Indicative break-even level of activity of Fardeen Products, Ahmedabad
Sr. No. Particulars Variable Cost Fixed Cost 1 Raw Material 10,00,000.00 -2 Electricity 64,000.00 3,000.003 Labour 4,80,000.00 -4 Interest - 1,80,000.005 Other Expenses 10,000.00 1,000.006 Depreciation - 1,000.00 Total 15,54,000.00 1,85,000.00
Selling price (SP) of the product on a per kilograms basis is about Rs. 120. The enterprise manufactured about 15,000 kg. of the product in a year on full capacity basis. It had sales of about Rs. 22 lakhs a year.
Break-even point (BEP) = Total Fixed Cost (Rs. 1.85 lakhs) X100=75.20% of capacity Revenue (Rs. 18 lakhs) – Total Variable Cost (Rs. 15.54 lakhs)
Beyond break-even, viz. production of about 11,280 kgs., it is on the basis of marginal costs that pricing may be made as all fixed costs are covered at break-even level. Similarly, the ideal product-mix of an enterprise may be identified by means of a contribution analysis as illustrated in the example below. Avidhoot enterprises have 6 product lines. The enterprise makes stuffed paratha, macaroni and pasta items and sells them to institutional customers viz. to private offices, foreign banks etc. in Ahmedabad, Gujarat. The table below provides line wise data on variable costs, selling price and output of the enterprise for the year 2001-02.
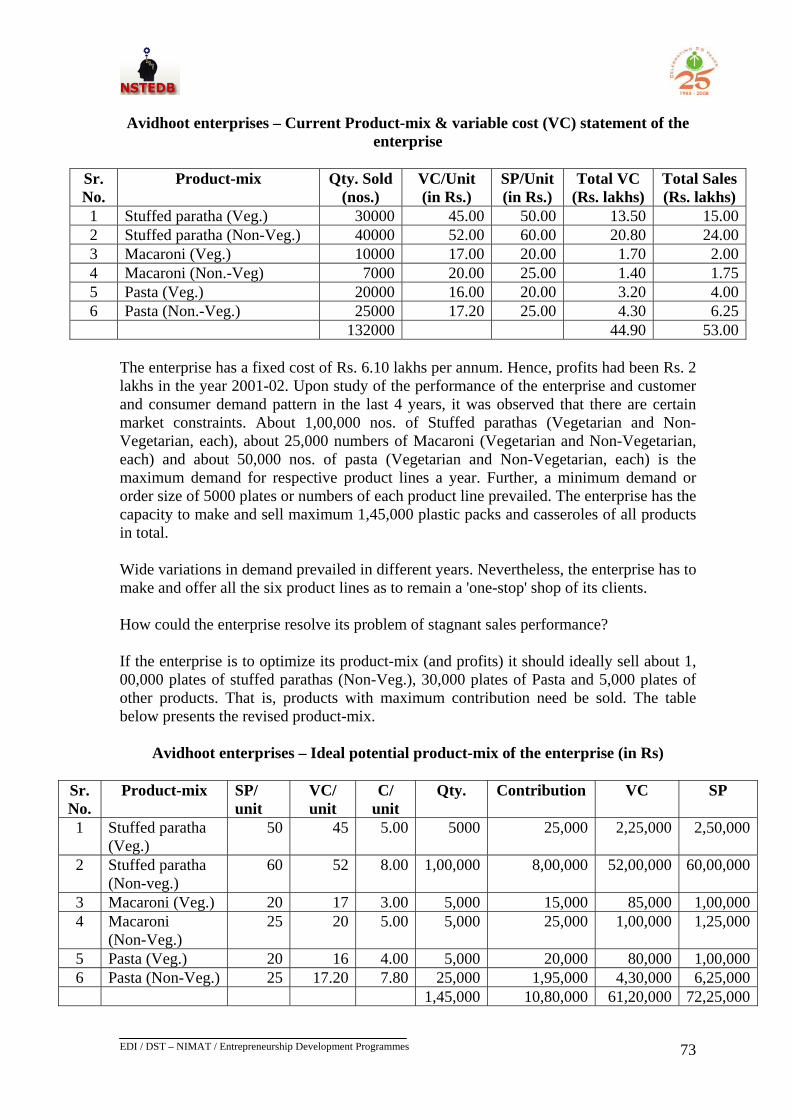
EDI / DST – NIMAT / Entrepreneurship Development Programmes
73
73
Avidhoot enterprises – Current Product-mix & variable cost (VC) statement of the
enterprise
Sr. No.
Product-mix Qty. Sold (nos.)
VC/Unit (in Rs.)
SP/Unit (in Rs.)
Total VC (Rs. lakhs)
Total Sales (Rs. lakhs)
1 Stuffed paratha (Veg.) 30000 45.00 50.00 13.50 15.002 Stuffed paratha (Non-Veg.) 40000 52.00 60.00 20.80 24.003 Macaroni (Veg.) 10000 17.00 20.00 1.70 2.004 Macaroni (Non.-Veg) 7000 20.00 25.00 1.40 1.755 Pasta (Veg.) 20000 16.00 20.00 3.20 4.006 Pasta (Non.-Veg.) 25000 17.20 25.00 4.30 6.25 132000 44.90 53.00
The enterprise has a fixed cost of Rs. 6.10 lakhs per annum. Hence, profits had been Rs. 2 lakhs in the year 2001-02. Upon study of the performance of the enterprise and customer and consumer demand pattern in the last 4 years, it was observed that there are certain market constraints. About 1,00,000 nos. of Stuffed parathas (Vegetarian and Non-Vegetarian, each), about 25,000 numbers of Macaroni (Vegetarian and Non-Vegetarian, each) and about 50,000 nos. of pasta (Vegetarian and Non-Vegetarian, each) is the maximum demand for respective product lines a year. Further, a minimum demand or order size of 5000 plates or numbers of each product line prevailed. The enterprise has the capacity to make and sell maximum 1,45,000 plastic packs and casseroles of all products in total. Wide variations in demand prevailed in different years. Nevertheless, the enterprise has to make and offer all the six product lines as to remain a 'one-stop' shop of its clients. How could the enterprise resolve its problem of stagnant sales performance? If the enterprise is to optimize its product-mix (and profits) it should ideally sell about 1, 00,000 plates of stuffed parathas (Non-Veg.), 30,000 plates of Pasta and 5,000 plates of other products. That is, products with maximum contribution need be sold. The table below presents the revised product-mix.
Avidhoot enterprises – Ideal potential product-mix of the enterprise (in Rs)
Sr. No.
Product-mix SP/ unit
VC/ unit
C/ unit
Qty. Contribution VC SP
1 Stuffed paratha (Veg.)
50 45 5.00 5000 25,000 2,25,000 2,50,000
2 Stuffed paratha (Non-veg.)
60 52 8.00 1,00,000 8,00,000 52,00,000 60,00,000
3 Macaroni (Veg.) 20 17 3.00 5,000 15,000 85,000 1,00,0004 Macaroni
(Non-Veg.) 25 20 5.00 5,000 25,000 1,00,000 1,25,000
5 Pasta (Veg.) 20 16 4.00 5,000 20,000 80,000 1,00,0006 Pasta (Non-Veg.) 25 17.20 7.80 25,000 1,95,000 4,30,000 6,25,000 1,45,000 10,80,000 61,20,000 72,25,000
EDI / DST – NIMAT / Entrepreneurship Development Programmes
74
74
If the enterprise can restructure its product-mix, it can increase its profit to Rs. 4.95 lakhs per year – more than double. However, an ideal selling incentive in terms of credit and discount strategy may have to be evolved as to encourage sales of product with higher contribution and in turn encouraging such shift in the product-mix. A similar analysis of the market mix with regard to marketing channels and customer or consumer segments or groups need be made and ideal strategies to encourage sales through such channels or customer or consumer segments that yield high contribution may be evolved. For instance, direct sale to consumers may yield higher contribution to a small ‘curry base and instant noodles’ manufacturer. In which case, a strategy of employing salespersons to directly market products to consumers with appropriate selling incentives to both the sales persons and consumers may be an ideal sales strategy than adopting the conventional dealer-retailer channel. The cases on product-mix, pricing, contribution analysis presented in this chapter indicates scope for sales promotion incentives and pricing of products as also on product positioning, packaging and real differentiation. The learning from these cases may be incorporated to enhance rigour in terms of market-mix and market-plan as a part of an efficient preparation of a business or project plan.
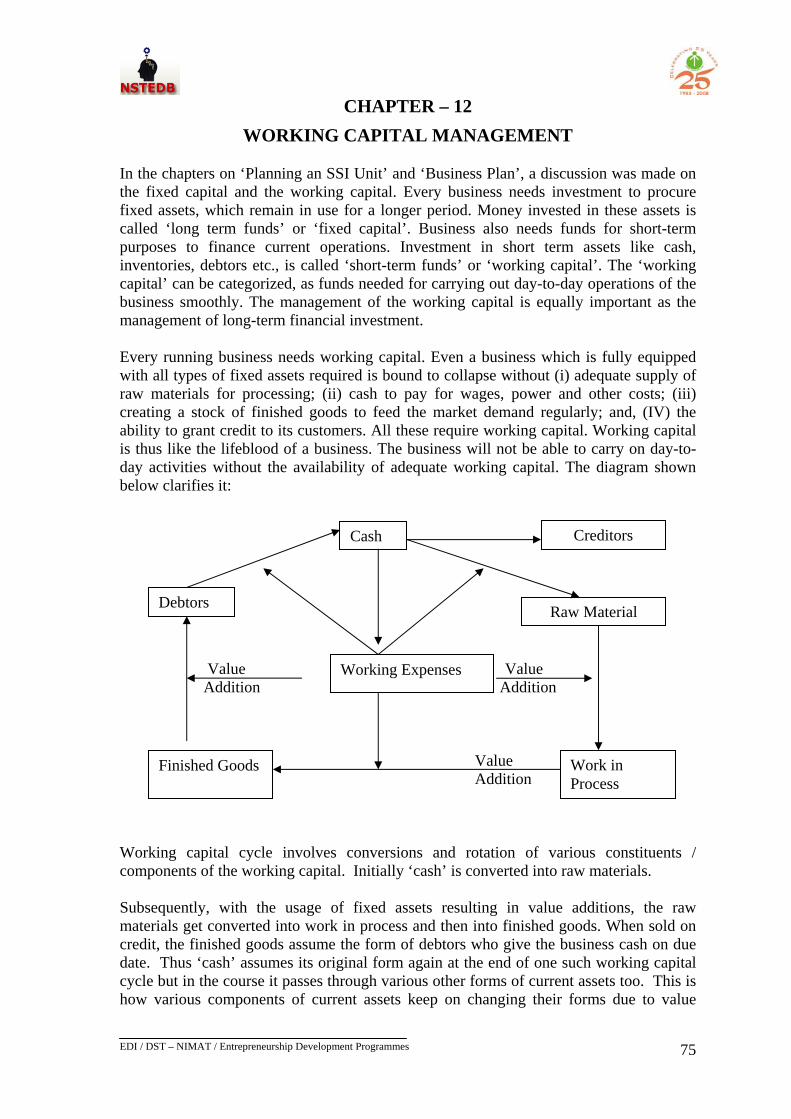
EDI / DST – NIMAT / Entrepreneurship Development Programmes
75
75
CHAPTER – 12
WORKING CAPITAL MANAGEMENT In the chapters on ‘Planning an SSI Unit’ and ‘Business Plan’, a discussion was made on the fixed capital and the working capital. Every business needs investment to procure fixed assets, which remain in use for a longer period. Money invested in these assets is called ‘long term funds’ or ‘fixed capital’. Business also needs funds for short-term purposes to finance current operations. Investment in short term assets like cash, inventories, debtors etc., is called ‘short-term funds’ or ‘working capital’. The ‘working capital’ can be categorized, as funds needed for carrying out day-to-day operations of the business smoothly. The management of the working capital is equally important as the management of long-term financial investment. Every running business needs working capital. Even a business which is fully equipped with all types of fixed assets required is bound to collapse without (i) adequate supply of raw materials for processing; (ii) cash to pay for wages, power and other costs; (iii) creating a stock of finished goods to feed the market demand regularly; and, (IV) the ability to grant credit to its customers. All these require working capital. Working capital is thus like the lifeblood of a business. The business will not be able to carry on day-to-day activities without the availability of adequate working capital. The diagram shown below clarifies it:
Value Value Addition Addition
Value Addition
Cash Creditors
Debtors
Working Expenses
Raw Material
Finished Goods Work in Process
Working capital cycle involves conversions and rotation of various constituents / components of the working capital. Initially ‘cash’ is converted into raw materials. Subsequently, with the usage of fixed assets resulting in value additions, the raw materials get converted into work in process and then into finished goods. When sold on credit, the finished goods assume the form of debtors who give the business cash on due date. Thus ‘cash’ assumes its original form again at the end of one such working capital cycle but in the course it passes through various other forms of current assets too. This is how various components of current assets keep on changing their forms due to value
EDI / DST – NIMAT / Entrepreneurship Development Programmes
76
76
addition. As a result, they rotate and business operations continue. Thus, the working capital cycle involves rotation of various constituents of the working capital. While managing the working capital, two characteristics of current assets should be kept in mind viz. (i) short life span, and (ii) swift transformation into other form of current asset. Each constituent of current asset has comparatively very short life span. Investment remains in a particular form of current asset for a short period. The life span of current assets depends upon the time required in the activities of procurement; production, sales and collection and degree of synchronization among them. A very short life span of current assets results into swift transformation into other form of current assets for a running business. These characteristics have certain implications: (i) Decision regarding management of the working capital has to be taken frequently
and on a repeat basis. (ii) The various components of the working capital are closely related and
mismanagement of any one component adversely affects the other components too.
(iii) The difference between the present value and the book value of profit is not significant.
The working capital has the following components, which are in several forms of current assets: - Stock of cash - Stock of raw material - Stock of finished goods - Value of debtors - Miscellaneous current assets like short term investment loans & advances, The working capital needs of a business are influenced by numerous factors. The important ones are discussed in brief as given below: i) Nature of enterprise The nature and the working capital requirements of an enterprise are interlinked. While a manufacturing industry has a long cycle of operation of the working capital, the same would be short in an enterprise involved in providing services. The amount required also varies as per the nature; an enterprise involved in production would require more working capital than a service sector enterprise. ii) Manufacturing/production policy Each enterprise in the manufacturing sector has its own production policy, some follow the policy of uniform production even if the demand varies from time to time, and others may follow the principle of 'demand-based production' in which production is based on the demand during that particular phase of time. Accordingly, the working capital requirements vary for both of them.
EDI / DST – NIMAT / Entrepreneurship Development Programmes
77
77
iii) Operations The requirement of working capital fluctuates for seasonal business. The working capital needs of such businesses may increase considerably during the busy season and decrease during the slack season. Ice creams and cold drinks have a great demand during summers, while in winters the sales are negligible. iv) Market condition If there is high competition in the product category that you are manufacturing, then you shall need to offer sops like credit, immediate delivery of goods etc. for which the working capital requirement will be high. Otherwise, if there is no competition or less competition in the market then your working capital requirements will be low. v) Availability of raw material If raw material is readily available then you will need not maintain a large stock of the same, thereby reducing your working capital investment in raw material stock. On the other hand, if raw material is not readily available then you shall need to maintain a large inventory/ stock thereby calling for substantial investment in the same. vi) Growth and expansion Growth and expansion in the volume of business results in enhancement of the working capital requirement. As a business grows and expands, it needs a larger amount of working capital. Normally, the need for increased working capital funds precedes growth in business activities. vii) Price level changes Generally, rising price level requires a higher investment in the working capital. With increasing prices, the same level of current assets needs enhanced investment. viii) Manufacturing cycle The manufacturing cycle starts with the purchase of raw material and is completed with the production of finished goods. If the manufacturing cycle involves a longer period, the need for working capital would be more. At times, business needs to estimate the requirement of working capital in advance for proper control and management. The factors discussed above influence the quantum of working capital in the business. The assessment of working capital requirement is made keeping these factors in view. Each constituent of working capital retains its form for a certain period and that holding period is determined by the factors discussed above. So for correct assessment of the working capital requirement, the duration at various stages of the working capital cycle is estimated. Thereafter, proper value is assigned to the respective current assets, depending on its level of completion. The basis for assigning value to each component is given here/below:
EDI / DST – NIMAT / Entrepreneurship Development Programmes
78
78
Component of working capital Basis of valuation
(i) Stock of raw material Purchase cost of raw materials (ii) Stock of work in process At cost or market value, whichever is lower (iii) Stock of finished goods Cost of production (iv) Debtors Cost of sales or sales value (v) Cash Working expenses Each constituent of the working capital is valued on the basis of valuation enumerated above for the holding period estimated. The total of all such valuation becomes the total estimated working capital requirement. The assessment of the working capital should be accurate even in the case of small and micro enterprises where business operation is not very large. We know that working capital has a very close relationship with day-to-day operations of a business. Negligence in proper assessment of the working capital, therefore, can affect the day-to-day operations severely. It may lead to cash crisis and ultimately to liquidation. An inaccurate assessment of the working capital may cause either under-assessment or over-assessment of the working capital and both of them are dangerous. CONSEQUENCES OF UNDERASSESSMENT OF WORKING CAPITAL • Growth may be stunted. It may become difficult for the enterprise to undertake
profitable projects due to non-availability of working capital. • Implementation of operating plans may become difficult and consequently the profit
goals may not be achieved. • Cash crisis may emerge due to paucity of working funds. • Optimum capacity utilization of fixed assets may not be achieved due to non-
availability of the working capital. • The business may fail to honour its commitment in time, thereby adversely affecting
its credibility. This situation may lead to business closure. • The business may be compelled to buy raw materials on credit and sell finished goods
on cash. In the process it may end up with increasing cost of purchases and reducing selling prices by offering discounts. Both these situations would affect profitability adversely.
• Non-availability of stocks due to non-availability of funds may result in production stoppage.
• While underassessment of working capital has disastrous implications on business, overassessment of working capital also has its own dangers.
CONSEQUENCES OF OVERASSESSMENT OF WORKING CAPITAL Excess of working capital may result in unnecessary accumulation of inventories. • It may lead to offer too liberal credit terms to buyers and very poor recovery system
and cash management. • It may make management complacent leading to its inefficiency.
EDI / DST – NIMAT / Entrepreneurship Development Programmes
79
79
• Over-investment in working capital makes capital less productive and may reduce return on investment.
Working capital is very essential for success of a business and, therefore, needs efficient management and control. Each of the components of the working capital needs proper management to optimize profit. Inventory management Inventory includes all types of stocks. For effective working capital management, inventory needs to be managed effectively. The level of inventory should be such that the total cost of ordering and holding inventory is the least. Simultaneously, stock out costs should also be minimized. Business, therefore, should fix the minimum safety stock level, re-order level and ordering quantity so that the inventory cost is reduced and its management becomes efficient. Receivables management Given a choice, every business would prefer selling its produce on cash basis. However, due to factors like trade policies, prevailing marketing conditions, etc., businesses are compelled to sell their goods on credit. In certain circumstances, a business may deliberately extend credit as a strategy of increasing sales. Extending credit means creating a current asset in the form of ‘debtors’ or ‘accounts receivable’. Investment in this type of current assets needs proper and effective management as it gives rise to costs such as: (i) Cost of carrying receivable (payment of interest etc.) (ii) Cost of bad debt losses Thus the objective of any management policy pertaining to accounts receivables would be to ensure that the benefits arising due to the receivables are more than the cost incurred for receivables and the gap between benefit and cost increases resulting in increased profits. An effective control of receivables helps a great deal in properly managing it. Each business should, therefore, try to find out average credit extended to its client using the below given formula: Average credit = Total amount of receivables Extended (in days) Average credit sales per day Each business should project expected sales and expected investment in receivables based on various factors, which influence the working capital requirement. From this it would be possible to find out the average credit days using the above given formula. A business should continuously try to monitor the credit days and see that the average credit offered to clients is not crossing the budgeted period. Otherwise, the requirement of investment in the working capital would increase and, as a result, activities may get squeezed. This may lead to cash crisis. Cash management Cash is the most liquid current asset. It is of vital importance to the daily operations of business. While the proportion of assets held in the form of cash is very small, its efficient
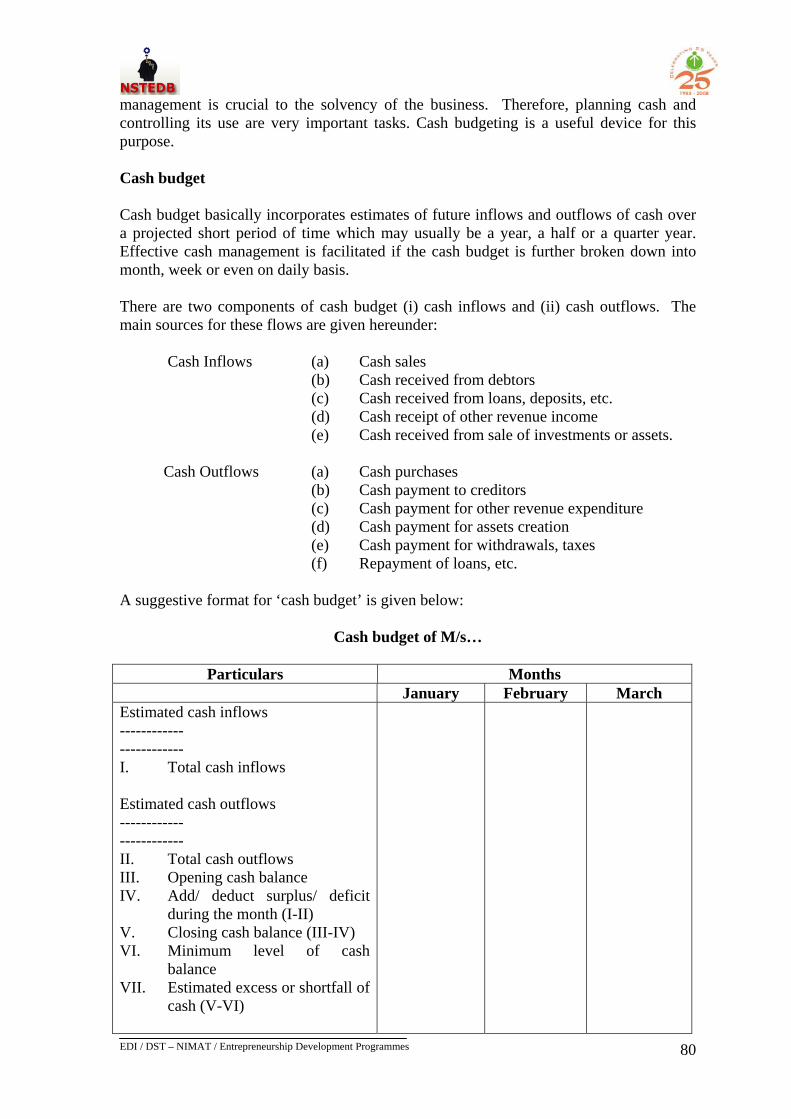
EDI / DST – NIMAT / Entrepreneurship Development Programmes
80
80
management is crucial to the solvency of the business. Therefore, planning cash and controlling its use are very important tasks. Cash budgeting is a useful device for this purpose. Cash budget Cash budget basically incorporates estimates of future inflows and outflows of cash over a projected short period of time which may usually be a year, a half or a quarter year. Effective cash management is facilitated if the cash budget is further broken down into month, week or even on daily basis. There are two components of cash budget (i) cash inflows and (ii) cash outflows. The main sources for these flows are given hereunder: Cash Inflows (a) Cash sales (b) Cash received from debtors (c) Cash received from loans, deposits, etc. (d) Cash receipt of other revenue income (e) Cash received from sale of investments or assets. Cash Outflows (a) Cash purchases (b) Cash payment to creditors
(c) Cash payment for other revenue expenditure (d) Cash payment for assets creation (e) Cash payment for withdrawals, taxes (f) Repayment of loans, etc. A suggestive format for ‘cash budget’ is given below:
Cash budget of M/s…
Particulars Months January February March
Estimated cash inflows ------------ ------------ I. Total cash inflows Estimated cash outflows ------------ ------------ II. Total cash outflows III. Opening cash balance IV. Add/ deduct surplus/ deficit during the month (I-II) V. Closing cash balance (III-IV) VI. Minimum level of cash balance VII. Estimated excess or shortfall of cash (V-VI)
EDI / DST – NIMAT / Entrepreneurship Development Programmes
81
81
Financing Working Capital Now let us understand the means to finance the working capital. Working capital or current assets are those assets, which unlike fixed assets change their forms rapidly. Due to this nature, they need to be financed through short-term funds. Short-term funds are also called current liabilities. The following are the major sources of raising short-term funds: (i) Supplier’s Credit At times, business gets raw material on credit from the suppliers. The cost of raw material is paid after some time, i.e. upon completion of the credit period. Thus, without having an outflow of cash the business is in a position to use raw material and continue the activities. The credit given by the suppliers of raw materials is for a short period and is considered current liabilities. These funds should be used for creating current assets like stock of raw material, work in process, finished goods, etc. (ii) Bank Loan for working capital This is a major source for raising short-term funds. Banks extend loans to businesses to help them create necessary current assets so as to achieve the required business level. The loans are available for creating the following current assets: • Stock of raw materials • Stock of work in process • Stock of finished goods • Debtors Banks give short-term loans against these assets, keeping some security margin. The advances given by banks against current assets are short-term in nature and banks have the right to ask for immediate repayment if they consider doing so. Thus bank loans for creation of current assets are also current liabilities. (iii) Promoter’s Fund It is advisable to finance a portion of current assets from the promoter’s funds. They are long-term funds and, therefore do not require immediate repayment. These funds increase the liquidity of the business.
EDI / DST – NIMAT / Entrepreneurship Development Programmes
82
82
CHAPTER – 13
MARKETING MANAGEMENT A production process acquires meaning only if it produces products which emerge out of anonymity and find a place in the market. Many small entrepreneurs produce quality products, but are unable to sell it due to poor understanding of the markets and marketing management. Most think marketing and selling to be the same and hence, face serious consequences. The fact however, remains that this is one of the most critical areas that entrepreneurs must master. You must develop the capability to understand your market and device your marketing strategies accordingly. You should be able to assess who will buy your product and why; and also your competitors and their strategies. THE CONCEPT OF MARKETING Most people think that marketing is all about selling and buying of goods and services in exchange for money. This is a very narrow view. There are three major facets of marketing. First is the production-driven approach where stress is laid on selling whatever is produced. This works during scarcity of goods. And the producer’s key function here is to sell goods available, at affordable prices. Most small and micro enterprises follow this approach. The second is the sale-driven approach that revolves round personal selling and advertising to convince customers to buy your product. This approach is adopted when there is an abundance of supply in the market. The last is the consumer-driven approach, which focuses on promoting sale by meeting the customers’ expectations in terms of quality, looks, aesthetics, prices and after-sales-service. The earlier two approaches where goods are tailor-made are producer-oriented and may not work satisfactorily as they requires a proper understanding of the consumer behaviour, preferences, tastes and needs before undertaking production. The third being consumer-driven, will last. This is why sales becomes a small part of an entire system called marketing that addresses planning, pricing, promotion and distribution of goods and services to satisfy customer needs. Therefore, you must understand that marketing is not just selling, but much more, and includes:
i) Market assessment ii) Market segmentation iii) Market targeting iv) Developing market mix
Market Assessment First, you need to know the demand for your proposed product and this requires market assessment. With this, you would know the volume that be bought by a defined customer-base in a defined geographical area and time-frame, under a defined marketing programme. The market demand can be estimated by multiplying the number of buyers by the average quantity bought at a given price. Though this may be difficult for small entrepreneurs to find out, they can still do a quick survey if the market is generally local or regional.
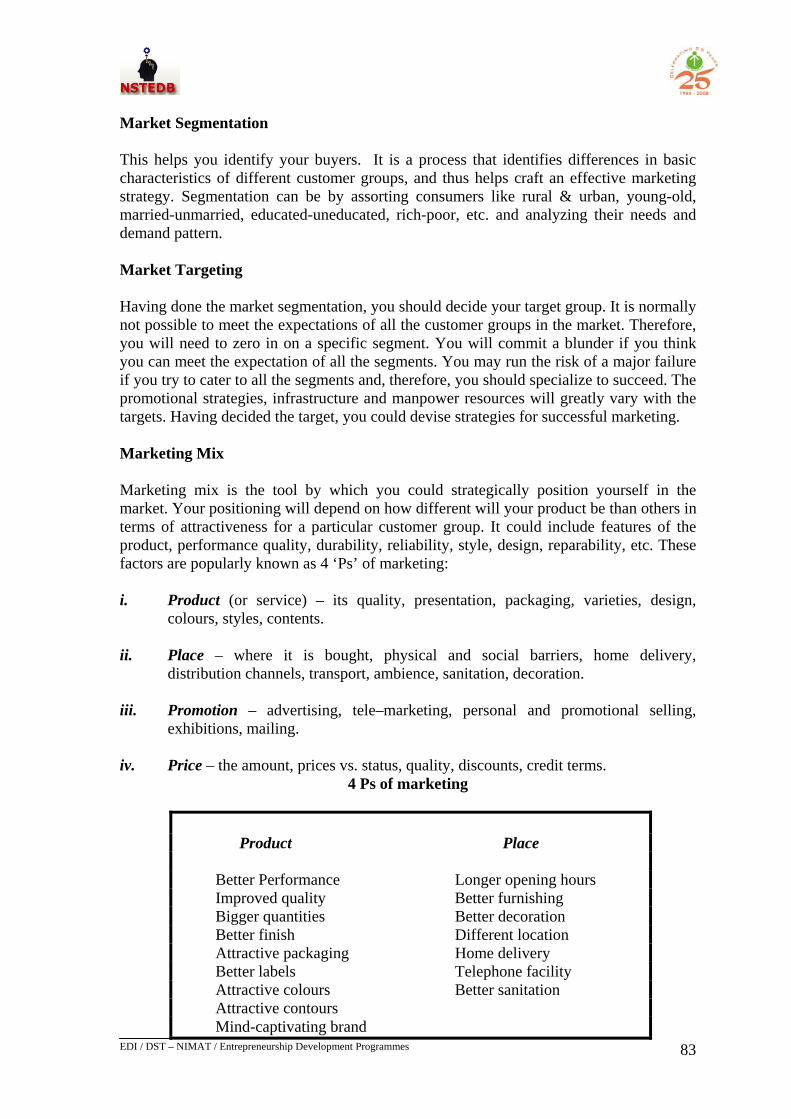
EDI / DST – NIMAT / Entrepreneurship Development Programmes
83
83
Market Segmentation This helps you identify your buyers. It is a process that identifies differences in basic characteristics of different customer groups, and thus helps craft an effective marketing strategy. Segmentation can be by assorting consumers like rural & urban, young-old, married-unmarried, educated-uneducated, rich-poor, etc. and analyzing their needs and demand pattern. Market Targeting Having done the market segmentation, you should decide your target group. It is normally not possible to meet the expectations of all the customer groups in the market. Therefore, you will need to zero in on a specific segment. You will commit a blunder if you think you can meet the expectation of all the segments. You may run the risk of a major failure if you try to cater to all the segments and, therefore, you should specialize to succeed. The promotional strategies, infrastructure and manpower resources will greatly vary with the targets. Having decided the target, you could devise strategies for successful marketing. Marketing Mix Marketing mix is the tool by which you could strategically position yourself in the market. Your positioning will depend on how different will your product be than others in terms of attractiveness for a particular customer group. It could include features of the product, performance quality, durability, reliability, style, design, reparability, etc. These factors are popularly known as 4 ‘Ps’ of marketing: i. Product (or service) – its quality, presentation, packaging, varieties, design,
colours, styles, contents.
ii. Place – where it is bought, physical and social barriers, home delivery, distribution channels, transport, ambience, sanitation, decoration.
iii. Promotion – advertising, tele–marketing, personal and promotional selling, exhibitions, mailing.
iv. Price – the amount, prices vs. status, quality, discounts, credit terms. 4 Ps of marketing
Product Place
Better Performance Longer opening hours Improved quality Better furnishing Bigger quantities Better decoration Better finish Different location Attractive packaging Home delivery Better labels Telephone facility Attractive colours Better sanitation Attractive contours Mind-captivating brand
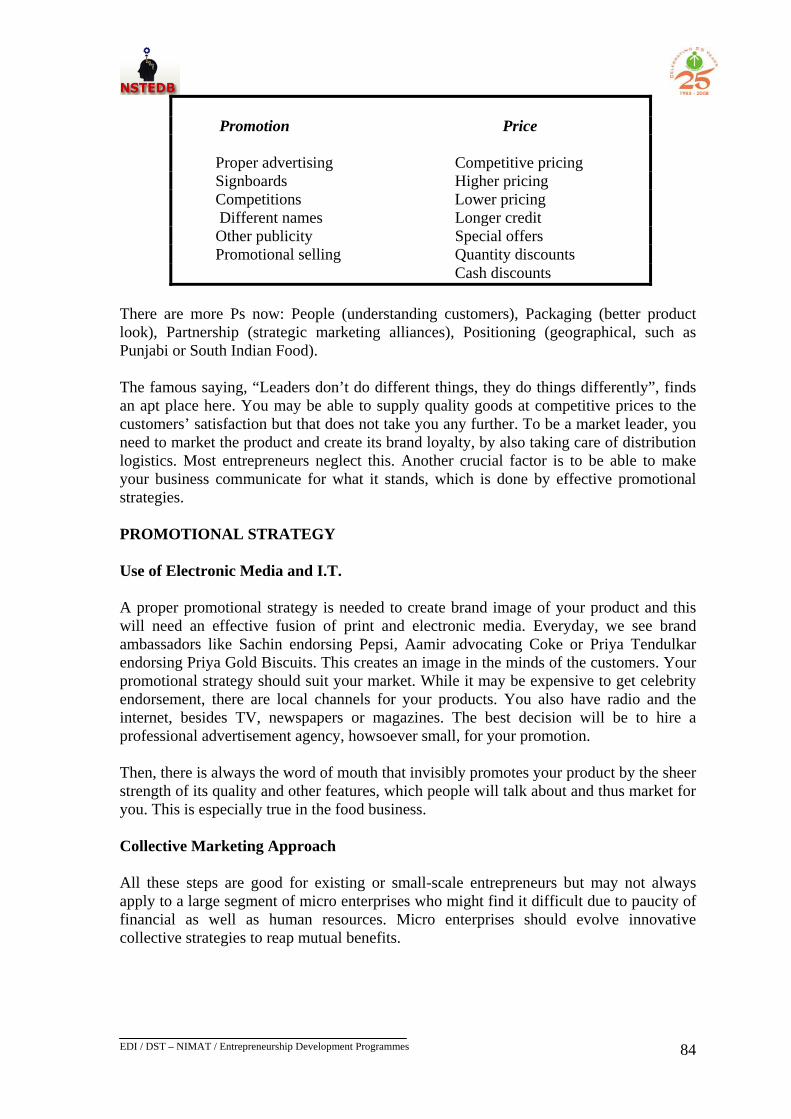
EDI / DST – NIMAT / Entrepreneurship Development Programmes
84
84
Promotion Price Proper advertising Competitive pricing Signboards Higher pricing Competitions Lower pricing Different names Longer credit Other publicity Special offers Promotional selling Quantity discounts Cash discounts
There are more Ps now: People (understanding customers), Packaging (better product look), Partnership (strategic marketing alliances), Positioning (geographical, such as Punjabi or South Indian Food). The famous saying, “Leaders don’t do different things, they do things differently”, finds an apt place here. You may be able to supply quality goods at competitive prices to the customers’ satisfaction but that does not take you any further. To be a market leader, you need to market the product and create its brand loyalty, by also taking care of distribution logistics. Most entrepreneurs neglect this. Another crucial factor is to be able to make your business communicate for what it stands, which is done by effective promotional strategies. PROMOTIONAL STRATEGY Use of Electronic Media and I.T. A proper promotional strategy is needed to create brand image of your product and this will need an effective fusion of print and electronic media. Everyday, we see brand ambassadors like Sachin endorsing Pepsi, Aamir advocating Coke or Priya Tendulkar endorsing Priya Gold Biscuits. This creates an image in the minds of the customers. Your promotional strategy should suit your market. While it may be expensive to get celebrity endorsement, there are local channels for your products. You also have radio and the internet, besides TV, newspapers or magazines. The best decision will be to hire a professional advertisement agency, howsoever small, for your promotion. Then, there is always the word of mouth that invisibly promotes your product by the sheer strength of its quality and other features, which people will talk about and thus market for you. This is especially true in the food business. Collective Marketing Approach All these steps are good for existing or small-scale entrepreneurs but may not always apply to a large segment of micro enterprises who might find it difficult due to paucity of financial as well as human resources. Micro enterprises should evolve innovative collective strategies to reap mutual benefits.
EDI / DST – NIMAT / Entrepreneurship Development Programmes
85
85
SEVEN TIPS FOR SUCCESSFUL MARKETING a) Know Your Consumers/Customers: There are two types of clients: i. BUYERS/CUSTOMERS who buy goods from you to sell to others. The
customers may not be the direct users of your products. Like wholesalers buy in bulk and sell to retailers, who sell to individual consumers or exporters, who in turn sell goods abroad to chain stores and retailers.
ii. Users who directly consume your products, who are CONSUMERS. b) Satisfy Your Customers/Consumers: They may be satisfied: i. When they are happy with the features and quality of the product. ii. When the price of your product is reasonable (reasonable means within the
budget). iii. When one delivers on time and maintains agreed terms. iv. When you put extra efforts to make them happy; like by working overnight to
deliver on time. c) Attract More Customers: Marketing must ensure that consumers repeatedly buy your products and also speak well about it to others. You should always remember the four Ps discussed earlier: i. Product
• Consumers want your product to satisfy their needs and they may want it to last long.
• You should make your product worth the money spent by buyers on it. • Your product should meet the best standards of quality and aesthetics.
ii. Price Your prices should be affordable and there are ways to make them acceptable also. Match your competitors’ prices. You could use the formula (price – cost = profit) when (i) you are relatively new to the business (ii) the competition is strong and (iii) when consumers are used to prevailing prices. Look at your costs You could set the price by adding a reasonable profit to your cost and this can be used during i. low competition, and ii. When your product is new.
EDI / DST – NIMAT / Entrepreneurship Development Programmes
86
86
Make your price attractive Your prices may be made attractive in other regions than your own by different ways. Attractive prices can, for instance, be like Rs. 49.95 for Rs. 50.00 iii. Promotion A satisfied client is your best promoter not only in terms of repeat orders but also for references. Some ways to promote your product Discount and credit offers can be publicized by placards placed in retail outlets or by distributing pamphlets to existing and potential clients. Discount and credit offers Give limited-period discounts or credits to regular and new clients as also bulk buyers. This will attract potential customers and strengthen the existing ones. Offer high discount on high-margin products as this is likely to encourage sale and manufacture of such products without affecting profits. Also, distribute pamphlets among exporters/wholesalers, if necessary. Promotional items Paperweights, calendars etc. with your brand name can be good advertisements. iv. Place Determine where you want to sell your product and where you want your client to find it.
d) Network and Reach-out to New Consumers: This helps you expand your customer base. There are several ways by which you can network and reach new customers and expand your market base:
i) Personal visits to potential clients. ii) Participation in trade fairs where potential is found. iii) Product catalogues and web pages which could be forwarded to distant
customers. iv) Promotion methods like selling incentives to increase sales.
Rather than waiting for customers to come, you should look for them. While i, iii and iv are means to network with new consumers, ii helps you network with both new and existing customers.
EDI / DST – NIMAT / Entrepreneurship Development Programmes
87
87
Participating in Trade Exhibits in Different Regions i) Prepare for an exhibition:
• Inquire about trade exhibitions from government offices and non-government organizations that organize such fairs.
• Participate in fairs after considering its location, the fees and products featured.
• Print business cards, product catalogue and price lists. • Prepare samples for display. • Keep a logbook to record your visitors’ contact details.
ii) During the trade exhibit:
• Approach visitors and talks informally about your products. • Encourage them to analyze your product. • Give your business card. • Request them to fill your logbook
e) Give Selling Incentives: Marketing starts even before business identification and often involves all management areas, while selling is about increasing sale. Selling incentives are various:
• Reduced price or discount • Multiple products for the price of one • Fixed-time discount coupons for repeat purchase • Better credit terms A processor may adopt any of these incentives. The following is a case study of a price discount incentive option: Arun Processors is a tiny unit and sells Rs. 5 lakhs worth pickles a year. They offer 30-day credit to customers. They got an extra order of Rs. 2 lakhs this year. But the trader backed out after the products were made. Arun Processors, therefore, evolved a new incentive plan to dispose off the additional production, under which they offered a three per cent discount in case payment was made in cash in 15 days of delivery and 90–day credit otherwise. Let us do a cost analysis of this strategy. Assume 50% sale is executed by discount option and 50% by 90-day credit scheme. If the production cost of increased sales is 70%, the actual cost of locked up funds in the credit sale would be three per cent a month. This is the rate he has to pay for credit purchase. Existing promotional and credit terms: 30 days Proposed promotional terms: 3/15 (or) 90 days
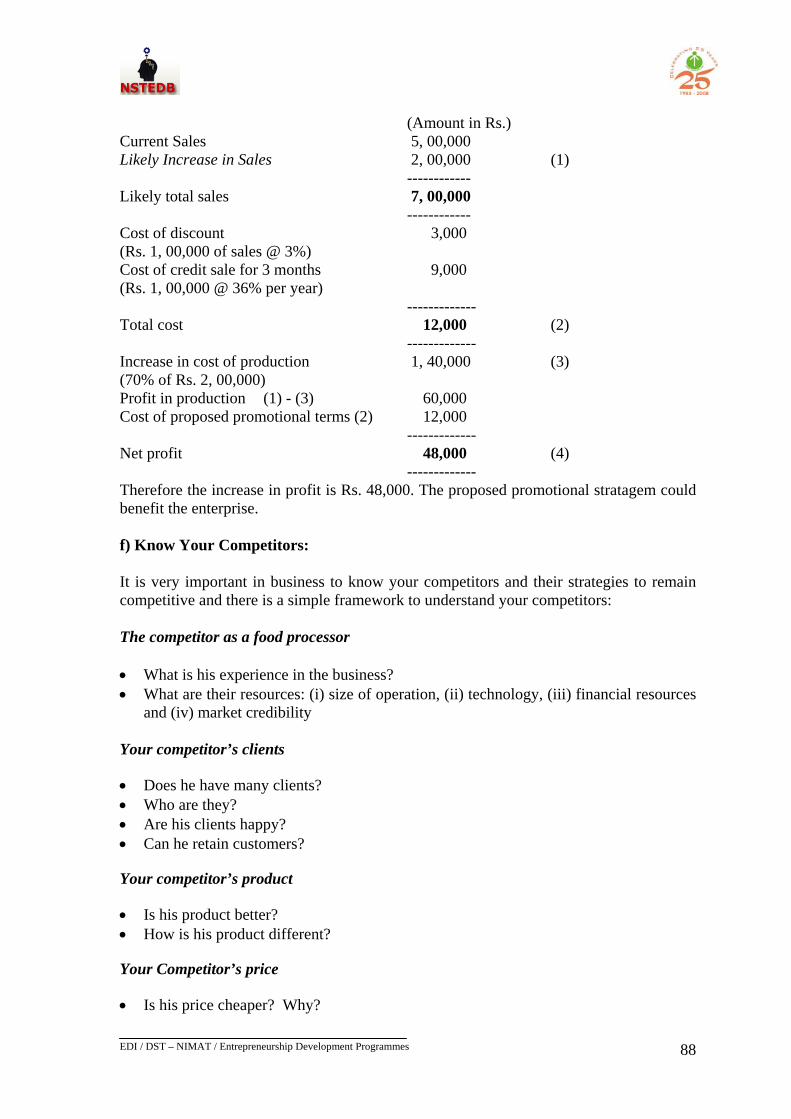
EDI / DST – NIMAT / Entrepreneurship Development Programmes
88
88
(Amount in Rs.)
Current Sales 5, 00,000 Likely Increase in Sales 2, 00,000 (1)
------------ Likely total sales 7, 00,000 ------------ Cost of discount 3,000 (Rs. 1, 00,000 of sales @ 3%) Cost of credit sale for 3 months 9,000 (Rs. 1, 00,000 @ 36% per year) ------------- Total cost 12,000 (2) ------------- Increase in cost of production 1, 40,000 (3) (70% of Rs. 2, 00,000) Profit in production (1) - (3) 60,000 Cost of proposed promotional terms (2) 12,000 ------------- Net profit 48,000 (4) ------------- Therefore the increase in profit is Rs. 48,000. The proposed promotional stratagem could benefit the enterprise. f) Know Your Competitors: It is very important in business to know your competitors and their strategies to remain competitive and there is a simple framework to understand your competitors: The competitor as a food processor • What is his experience in the business? • What are their resources: (i) size of operation, (ii) technology, (iii) financial resources
and (iv) market credibility Your competitor’s clients • Does he have many clients? • Who are they? • Are his clients happy? • Can he retain customers? Your competitor’s product • Is his product better? • How is his product different? Your Competitor’s price • Is his price cheaper? Why?
EDI / DST – NIMAT / Entrepreneurship Development Programmes
89
89
Your competitor’s promotional strategies
• Does he provide better credit/discounts? Your competitor’s place
• Does he directly deal with consumers? • Does he have agents/distributors? g) Developing a Sustainable Marketing Advantage: A business that does not develop any or all of the three advantages below is sure to lose out to competition: A sustainable cost advantage: This will help an enterprise offer lower prices. Cost savings can also help in offering better credits. A differentiation advantage: This offers buyers better value than competitors, as the product is different by its features and services as well as by brand image. A niche market: Here consumers are delivered specially customized products in small volumes. FINALLY, REMEMBER THE CARDINAL PRINCIPLES TO SUCCEED IN THE MARKET: • The customer is the most important person. • Put yourself in customers' shoes. • Good marketers sell products that never return but customers do. • Successful marketing is about building and sustaining human relationships. • Be flexible so as to encourage people do business with you.
EDI / DST – NIMAT / Entrepreneurship Development Programmes
90
90
CHAPTER - 14
APPLIED MANAGEMENT IN BUSINESS – LEARNING FROM EXISTING BUSINESSES
ANMOL FOOD PRODUCTS: STRUCTURING A PROJECT EFFICIENTLY WITH THRUST ON THE MARKET PLAN The enterprise, registered as a private limited company, has been involved in marketing processed food products. It now proposes to manufacture sauces, jams and other products. The unit is registered with the Ministry of Food Processing Industries. The key promoters include a cost accountant and a scientist who have earlier worked with CFTRI, Mysore. The cost accountant worked for a multinational and also has substantial experience in marketing confectionery in Karnataka. He also has experience in catering and has supplied packed meals to hospitals and banks in Mysore city. His enterprise had then undertaken contracts to run canteens in various large factories in Mysore. The experience of the promoters both in the catering field and in marketing products in the sector helped them evolve their project well. Several products are proposed to be manufactured by this enterprise. These include sauces, squashes, jams, ‘masala’ paste, ready-to-eat products and pickles. Sauces include tomato sauce, chilly sauce and soya sauce, for example. Jams include strawberry and pineapple jam. Ready-to-eat products comprise tamarind rice mix, tomato rice mix and sambhar. Pickles include mango, mixed vegetable, lemon, garlic, and green chilly. Products are offered in various packing sizes to meet purchase preferences of different customers and consumers. Squashes include mango, orange, grape, pineapple and strawberry, and ‘masala’ powders largely include ‘garam masala’ powder. Reducing production risk in terms of raw material price fluctuation The main ingredients for sauces are tomato, green chilly and soya, which are to be procured in season, processed and retained, in preserved form like puree. Inputs/ingredients are to be procured fresh and the food stuff prepared and then processed under high temperature and pressure in retorts under water for 20 minutes to sometimes several hours, depending on the properties of the products. With regard to pickles, for instance, main fruits, vegetables and ‘masala’ ingredients are to be procured in season. They are to be then converted into intermediaries like paste. The ‘masala’ ingredients are to be thoroughly cleaned and procured for preservation. When production of various pickles is planned the fruit/vegetable and ‘masala’ ingredients is processed into final products. So also with regard to ‘masala’ powders, raw materials and ingredients are procured during season, thoroughly cleaned and preserved, depending on product formulation. Different ingredients are drawn and processed either separately or together to obtain the final product. The enterprise proposes to effectively reduce the risk in terms of high raw material price fluctuations and develop scope to secure high margins during off season in different products. The machinery to be used mainly are fruit mills, boiler, steam vessels, pulverizers, ovens, blenders, filling machine, etc. Past experience of the promoters helped in evolving a market plan for the enterprise. The product and market mix of the project is planned in relative detail.
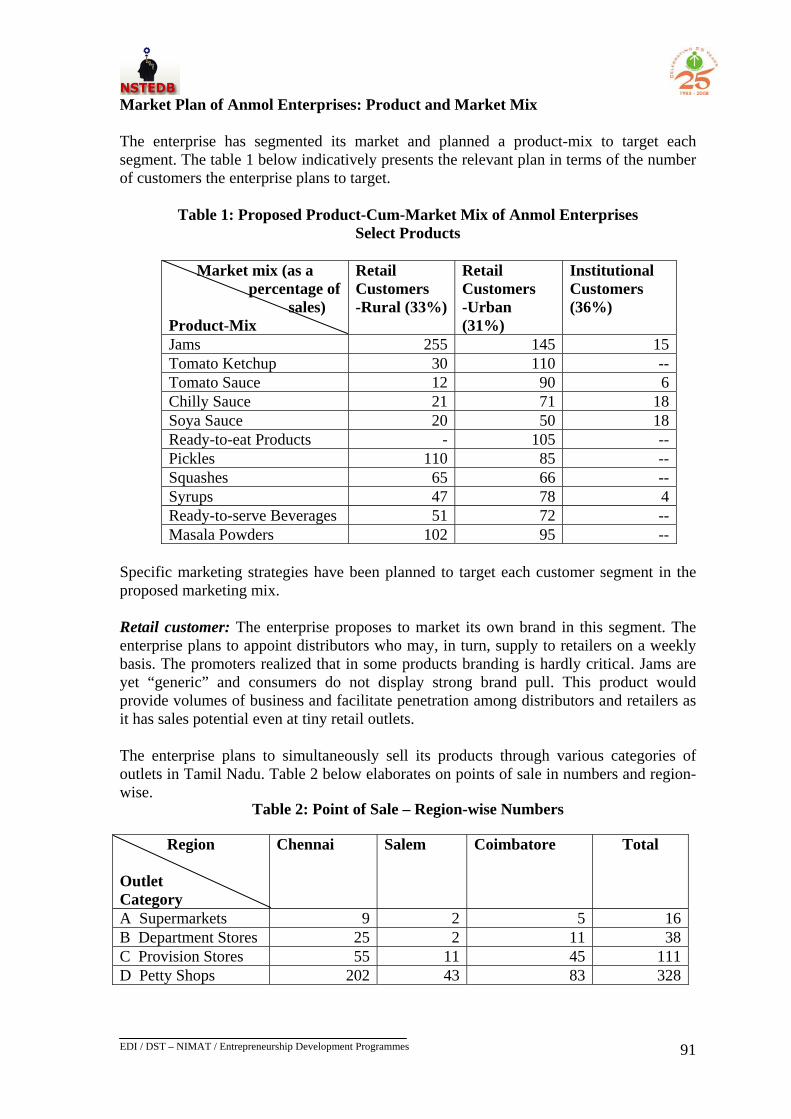
EDI / DST – NIMAT / Entrepreneurship Development Programmes
91
91
Market Plan of Anmol Enterprises: Product and Market Mix The enterprise has segmented its market and planned a product-mix to target each segment. The table 1 below indicatively presents the relevant plan in terms of the number of customers the enterprise plans to target.
Table 1: Proposed Product-Cum-Market Mix of Anmol Enterprises
Select Products
Market mix (as a percentage of sales) Product-Mix
Retail Customers -Rural (33%)
Retail Customers -Urban (31%)
Institutional Customers (36%)
Jams 255 145 15Tomato Ketchup 30 110 --Tomato Sauce 12 90 6Chilly Sauce 21 71 18Soya Sauce 20 50 18Ready-to-eat Products - 105 --Pickles 110 85 --Squashes 65 66 --Syrups 47 78 4Ready-to-serve Beverages 51 72 --Masala Powders 102 95 --
Specific marketing strategies have been planned to target each customer segment in the proposed marketing mix. Retail customer: The enterprise proposes to market its own brand in this segment. The enterprise plans to appoint distributors who may, in turn, supply to retailers on a weekly basis. The promoters realized that in some products branding is hardly critical. Jams are yet “generic” and consumers do not display strong brand pull. This product would provide volumes of business and facilitate penetration among distributors and retailers as it has sales potential even at tiny retail outlets. The enterprise plans to simultaneously sell its products through various categories of outlets in Tamil Nadu. Table 2 below elaborates on points of sale in numbers and region-wise.
Table 2: Point of Sale – Region-wise Numbers
Region
Outlet Category
Chennai Salem Coimbatore Total
A Supermarkets 9 2 5 16B Department Stores 25 2 11 38C Provision Stores 55 11 45 111D Petty Shops 202 43 83 328
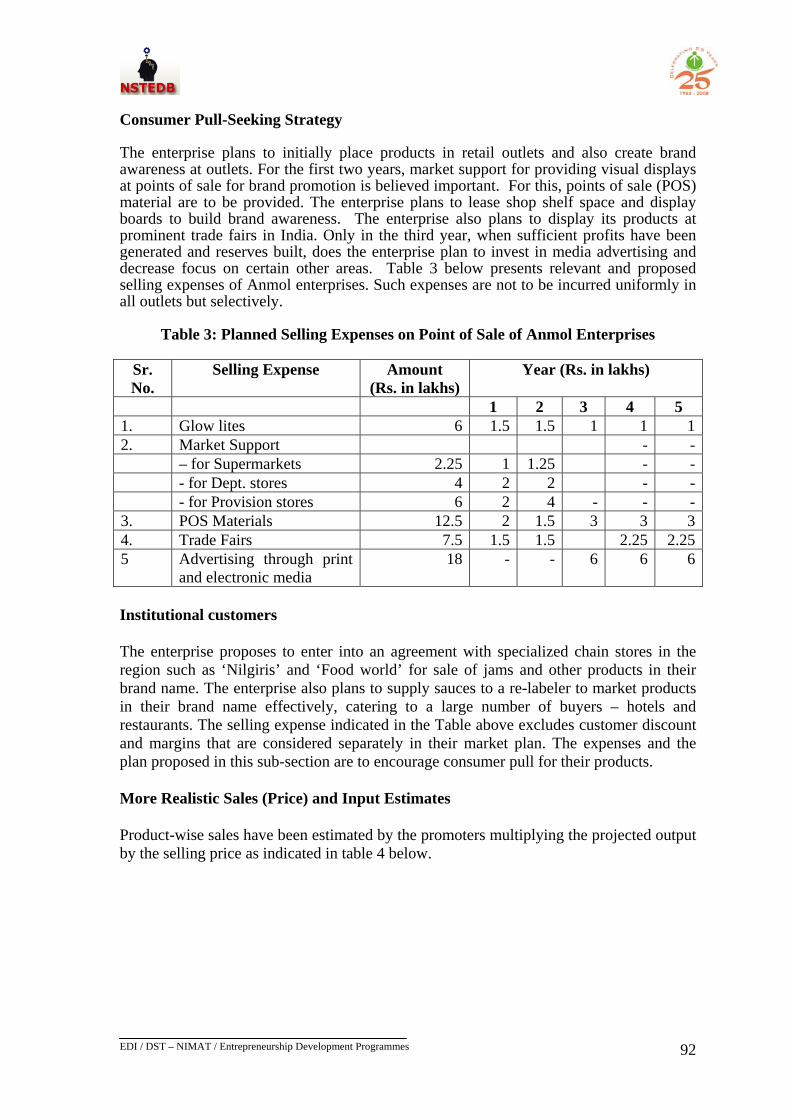
EDI / DST – NIMAT / Entrepreneurship Development Programmes
92
92
Consumer Pull-Seeking Strategy The enterprise plans to initially place products in retail outlets and also create brand awareness at outlets. For the first two years, market support for providing visual displays at points of sale for brand promotion is believed important. For this, points of sale (POS) material are to be provided. The enterprise plans to lease shop shelf space and display boards to build brand awareness. The enterprise also plans to display its products at prominent trade fairs in India. Only in the third year, when sufficient profits have been generated and reserves built, does the enterprise plan to invest in media advertising and decrease focus on certain other areas. Table 3 below presents relevant and proposed selling expenses of Anmol enterprises. Such expenses are not to be incurred uniformly in all outlets but selectively.
Table 3: Planned Selling Expenses on Point of Sale of Anmol Enterprises
Sr. No.
Selling Expense Amount (Rs. in lakhs)
Year (Rs. in lakhs)
1 2 3 4 5 1. Glow lites 6 1.5 1.5 1 1 12. Market Support - - – for Supermarkets 2.25 1 1.25 - - - for Dept. stores 4 2 2 - - - for Provision stores 6 2 4 - - -3. POS Materials 12.5 2 1.5 3 3 34. Trade Fairs 7.5 1.5 1.5 2.25 2.255 Advertising through print
and electronic media 18 - - 6 6 6
Institutional customers The enterprise proposes to enter into an agreement with specialized chain stores in the region such as ‘Nilgiris’ and ‘Food world’ for sale of jams and other products in their brand name. The enterprise also plans to supply sauces to a re-labeler to market products in their brand name effectively, catering to a large number of buyers – hotels and restaurants. The selling expense indicated in the Table above excludes customer discount and margins that are considered separately in their market plan. The expenses and the plan proposed in this sub-section are to encourage consumer pull for their products. More Realistic Sales (Price) and Input Estimates Product-wise sales have been estimated by the promoters multiplying the projected output by the selling price as indicated in table 4 below.
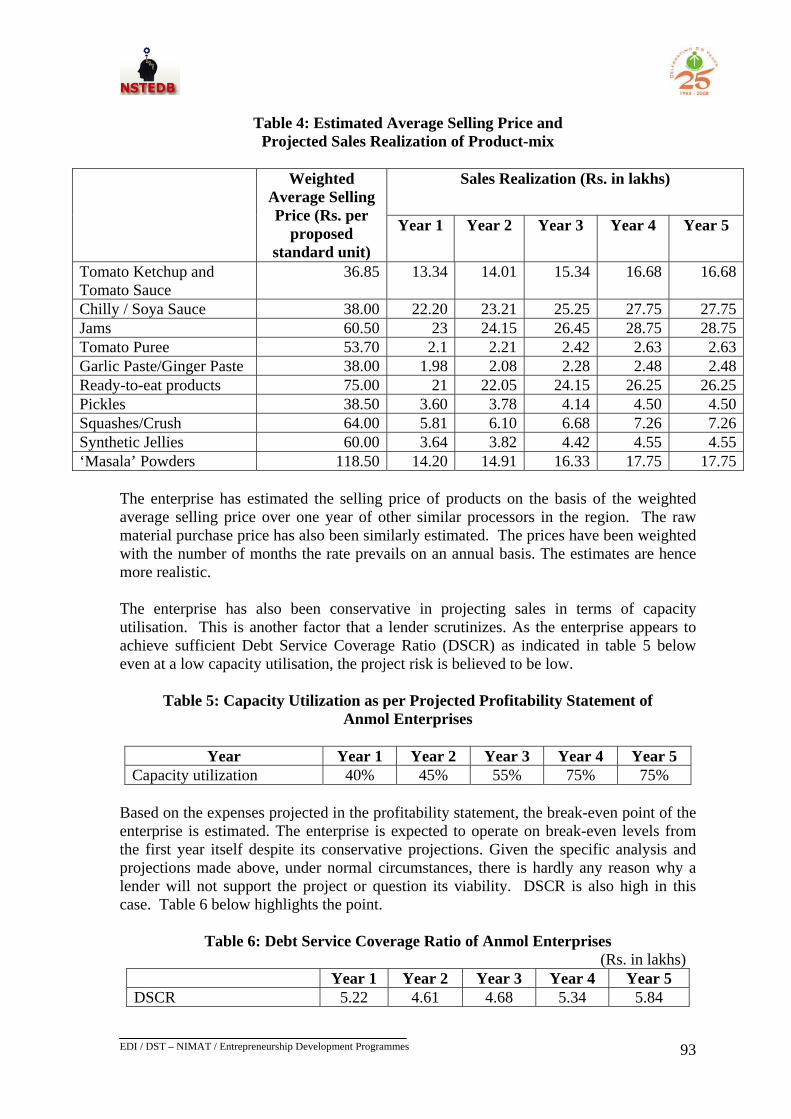
EDI / DST – NIMAT / Entrepreneurship Development Programmes
93
93
Table 4: Estimated Average Selling Price and
Projected Sales Realization of Product-mix
Sales Realization (Rs. in lakhs) Weighted Average Selling Price (Rs. per
proposed standard unit)
Year 1 Year 2 Year 3 Year 4 Year 5
Tomato Ketchup and Tomato Sauce
36.85 13.34 14.01 15.34 16.68 16.68
Chilly / Soya Sauce 38.00 22.20 23.21 25.25 27.75 27.75Jams 60.50 23 24.15 26.45 28.75 28.75Tomato Puree 53.70 2.1 2.21 2.42 2.63 2.63Garlic Paste/Ginger Paste 38.00 1.98 2.08 2.28 2.48 2.48Ready-to-eat products 75.00 21 22.05 24.15 26.25 26.25Pickles 38.50 3.60 3.78 4.14 4.50 4.50Squashes/Crush 64.00 5.81 6.10 6.68 7.26 7.26Synthetic Jellies 60.00 3.64 3.82 4.42 4.55 4.55‘Masala’ Powders 118.50 14.20 14.91 16.33 17.75 17.75
The enterprise has estimated the selling price of products on the basis of the weighted average selling price over one year of other similar processors in the region. The raw material purchase price has also been similarly estimated. The prices have been weighted with the number of months the rate prevails on an annual basis. The estimates are hence more realistic. The enterprise has also been conservative in projecting sales in terms of capacity utilisation. This is another factor that a lender scrutinizes. As the enterprise appears to achieve sufficient Debt Service Coverage Ratio (DSCR) as indicated in table 5 below even at a low capacity utilisation, the project risk is believed to be low.
Table 5: Capacity Utilization as per Projected Profitability Statement of Anmol Enterprises
Year Year 1 Year 2 Year 3 Year 4 Year 5
Capacity utilization 40% 45% 55% 75% 75% Based on the expenses projected in the profitability statement, the break-even point of the enterprise is estimated. The enterprise is expected to operate on break-even levels from the first year itself despite its conservative projections. Given the specific analysis and projections made above, under normal circumstances, there is hardly any reason why a lender will not support the project or question its viability. DSCR is also high in this case. Table 6 below highlights the point.
Table 6: Debt Service Coverage Ratio of Anmol Enterprises (Rs. in lakhs)
Year 1 Year 2 Year 3 Year 4 Year 5 DSCR 5.22 4.61 4.68 5.34 5.84
EDI / DST – NIMAT / Entrepreneurship Development Programmes
94
94
An entrepreneur needs to accord adequate consideration to the market plan. The case in this sub-section highlighted efficient procurement and production management and indicated only some critical aspects that need be given consideration when preparing a plan. The product and market mix analysis and conservativeness are fundamental issues. The product market plan is the basis for financial plan of an enterprise. ANALYSIS AND MANAGEMENT OF RISK IN AN ENTERPRISE: PARAG BISCUITS, AHMEDABAD There are other critical decisions to be made in a project. These are particularly on the cost and financial structure of an enterprise. Decisions need to be made on the risk and profitability orientation of a project. Consider an adverse environment with falling demand and increased competition. An analysis of the cost structure of Parag Biscuits reveals a thrust on fixed costs. This implies an aggressive or relatively risky cost structure as the environment is adverse for this enterprise in terms of falling sales and margins in the past two years. A break-even analysis highlights the level of sales at which the profit before tax (PBT) is zero. The following information is available on the enterprise. The data presented in Table 7 below is for 2001-02. Table 7: Expenses-Revenues-Profit for Parag Biscuits, Ahmedabad (2001-02)
Expenses-revenues-Profit Amount (in Rs.)
Sales 25,00, 000 (Less) Variable Costs (Interest on WC)
21,25,000 (70,000)
Contribution 3,75,000 (Less) Fixed costs 1,85,000 Profit before tax (PBT) 1,90,000
Break-even sales may be estimated by using the formula: Fixed costs over sales realisation minus Variable cost. Break-even sale is at about 50 per cent of current sales. Risk Analysis of the Enterprise Risk is estimated in terms of possible variability in profit. The variability in profits arises primarily because of variability in sales (volumes or margins or both). The impact on the PBT of Parag Biscuits if sales drop from its current level indicates a fall greater than the fall in sales. This is the degree of total leverage (DTL) and measures the risk arising out of the sensitivity of profits to sales. DTL = Contribution = 3, 75,000 = 1.97 PBT 1, 90,000 The risk includes: (i) the degree of operating leverage (DOL) arising from the structure of operating costs (variable costs that vary with output and fixed costs that do not) of the enterprise, (ii) the degree of financial leverage (DFL) arising from the financial structure of the enterprise. This refers to debt as against the equity structure in the capital of an enterprise.
EDI / DST – NIMAT / Entrepreneurship Development Programmes
95
95
The degree of operating leverage (DOL) measures the percentage change in PBT for a percent change in sales: An enterprise that has higher levels of fixed costs in operation will have a higher DOL.
DOL = Contribution = 3, 75,000 = 1.44 PBIT 2, 60,000 The degree of financial leverage (DFL) on the other hand measures the percentage change in PBT for a per cent change in PBIT. An enterprise that has taken more of institutional finance vis-à-vis own equity will have a high DFL.
DFL = PBIT = 2, 60,000 = 1.36 PBT 1, 90,000 The degree of total leverage (DTL) is the product of the DOL and the DFL: Fixed costs in operations cause a 1 per cent change in sales to lead to a more than 1 per cent change in the PBIT. Similarly, 1 per cent change in the PBIT causes profits to change by greater than 1 per cent. Fixed costs leverage the impact of changes in sales on profits. A high DTL is fine if sales have scope to increase and market growth is high in an industry. If not, it could be harmful to the enterprise as the fall in the PBT will be 1.97 per cent (DTL) for every 1 per cent fall in sales. Structuring an enterprise’s finance and cost is thus important to increase its returns or reduce its risk. The lessons for an entrepreneur do exist in the food processing sector in terms of exploring, outsourcing options of some activities as to reduce interest burden on fixed investment, which is a fixed cost, for example. Further, depending on the risk-return trade-off and potential of an enterprise, greater debt financing may be availed of and/or variable costs may be selectively converted into fixed costs as a part of the revised project report. SYSTEMS IN BUSINESS Management information and control systems (MICS) are important areas in enterprise management. As an illustration, consider the following case of an enterprise – Narsi’s Vegetable Processors engaged in the manufacture of mango pickles in Hyderabad, Andhra Pradesh. The enterprise buys mangoes from wholesalers and undertakes processing and marketing. The enterprise markets its products in Hyderabad. Purchasing and stocking decisions are most critical in this sub-sector as the availability of products is seasonal and the contribution of raw material cost to the total annual cost of production of such an enterprise is high. Purchase on the basis of economic order quantity is critical in such business to optimize the cost and the benefit by virtue of inventory management. Economic Order Quantity (EOQ) in Purchase Management information and control systems for larger enterprises may include utilization of production and scrap reports on a daily basis, batch consumption reports, material utilisation report and production report on a monthly basis and, a purchase and stores ledger. Nevertheless, most critically, the EOQ at the enterprise level has to be estimated for enterprises that are tiny and small to facilitate purchase and stocking decisions. For instance, Narsi’s Vegetable Processors in Hyderabad requires raw material
EDI / DST – NIMAT / Entrepreneurship Development Programmes
96
96
of 90,000 kg of mangoes a year. The enterprise works at an average for 300 days a year. The cost of processing an order is Rs. 30 and the carrying cost per kg. of mango is Rs. 2 for one year. Lead-time for receipt of inputs upon order is five days and the enterprise may keep a reserve stock of 4 days’ usage. The economic order quantity and the re-order point may be estimated incorporating the formula:
EOQ=√2AO/C, where A is the annual requirement of input, O is the ordering cost (communication, transport, etc.) and C is the carrying cost (storage etc.)
The EOQ works out to 5196 kg. The re-order point may be estimated as follows: Daily usage = 90,000/300 =300 kg. Re-order point = Safety stock X Usage rate + Lead time X Usage rate = 4 (300) + 5 (300) = 2,700 kg Obviously, the variations in sale price over different months need be given due consideration and then the EOQ decided upon. (The participants may be asked to work out EOQ of purchase of a hypothetical enterprise and discuss their estimations). Maintaining Information on the Cost Structure of a Business The table below presents the cost structure and activity levels of a food processing (jam making) enterprise for 2001-02. Maintaining information in this format will facilitate decision making in an enterprise.
Table: Cost Structure and Activity of an Enterprise for 2001-02
Sales (10, 000 jars @ Rs. 75 each) 7,50,000 Variable cost (10,000 jars @ Rs. 65 each) 6,50,000 Contribution 1,00,000 Fixed cost 30,000 Profit 70,000
Assume that the enterprise now receives an offer from an exporter on certain specific terms. The exporter offers to buy products from this enterprise at a price 20 per cent more than his current sale price. The exporter, however, guarantees off take of only 80 per cent of his current sale. He also insists that the manufacturer offers his product to no one else directly. Certain other expenses are likely to rise. The Table below summarizes the offer.
1. Offer of increase in prices = 20% 2. Reduction in sales = 20% (As the exporter would like the enterprise to to manufacture for him alone)
3. Variable expenses increase = 20% (in terms of better quality raw material related cost)
4. Fixed cost increase = 10% (in terms of additional expense on upgrading equipment)
EDI / DST – NIMAT / Entrepreneurship Development Programmes
97
97
Would the enterprise’s profits increase or decrease, if it accepts the offer? The cost structure and the activity of the enterprise, it accepts the offer, is presented in the Table below. Production 10,000 jars Total sales Rs. 9,00,000 Price Rs. 90 per jar Total variable cost Rs. 7,80,000 Variable cost Rs. 78 per jar Fixed cost Rs. 33,000 Therefore, profit equals Rs. 87, 000. Profit, therefore, increases if the enterprise accepts this offer. The decision to accept the offer may be made quickly and approximately, if an enterprise maintains ready data on its cost structure. As a second illustration, consider the concept of a simple systems tool presented below. Systems for cash management are important. If a business runs out of cash it may not be able to pay dues on time or take advantage of opportunities because of lack of funds to finance them. A portion of profit should be saved and ploughed back to business as retained earnings. Continuous informal borrowings will put pressures on an entrepreneur to pay high interest and could affect credibility. All cash receipts and expenses should be regularly recorded. A simple but extremely utilitarian tool appropriate for business decision-making is a cash-cum-cost sheet. A cash-cum-cost sheet allows keeping records of cash and cost. But, more importantly, it helps decision-making on purchase and sales (discount v/s credit) and on structuring of costs to take advantage of leveraging effects of fixed costs on profits, or alternatively, reduce business risk. A Cash-cum-Cost Sheet for Efficient Decision Making There are many reasons why an enterprise may run out of cash. Sales may be poor or perhaps containing credit, besides the burden of paying the raw material supplier for credit purchase. Cash goes out even before it comes in. Working capital is used on personal expenses or directed to the purchase of equipment. Short-term funds are diverted to long-term investment. A cash-cum-cost sheet is a tool that allows forecasting how much cash is earned and how much is spent on every operating cycle. It also shows the structure of costs. When cash is short at the end of one operating cycle, one can take remedial measures and purchase on credit and sell on cash, perhaps by offering discounts over the next operating cycle. One can also strive to convert fixed cost into variable costs when one is confident of sales or margins for the next operating cycle or next few cycles. Even elements of cost such as raw material purchase, which is invariably a variable cost, may be converted to a fixed cost temporarily or for longer periods by means of post-dated cheque payments (with bank guarantee) or higher inventory stockpiling. One can make entries in a cash-cum-cost sheet for the period of one operating cycle as to plan on purchase and sales decisions as well as on profitability orientation on the next. An Illustration on Maintaining a Cash-cum-Cost Sheet Cash transactions may be recorded on the left page. Cash received, cash disbursed, investments, revenues and costs may be recorded on the right page. Incomes are cash received and costs are cash disbursed.
EDI / DST – NIMAT / Entrepreneurship Development Programmes
98
98
As an illustration, consider a ‘papad’ and ‘masala’-making enterprise. The enterprise had about Rs. 5, 00,000 as cash balance as on February 1, 2001 and used it to buy materials worth Rs. 80,000 on February 10, 2001. On February 13, the enterprise again bought raw material for Rs. 50,000 and paid rental charges totalling Rs. 80,000. On February 25, there was sale of products to an exporter for Rs. 2, 00,000. On February 27, the enterprise sold more products to another trader for Rs. 8, 20,000. On February 28, the enterprise bought raw material for Rs. 7, 00, 000. These transactions are recorded in the following cash-cum- cost sheet.
LEFT PAGE (CASH SHEET)
Date Explanation To/ From Cash Received
Cash Disbursed
Cash Balance
2/1 5,00,0002/10 Bought raw material Rajan Traders 80,000 4,20,0002/13 Bought raw material Mahesh Traders 50,000 3,70,000 Paid rent (annual lease)
Arrangement paid every 6 months
80,000 2,90,000
2/25 Sales Alap Holds 2,00,000 4,90,0002/27 Sales Mukesh Enterprise 8,20,000 13,10,0002/28 Paid wages (piece-rate) Employees 7,00,000 6,10,000 Total 10,02,000 9,10,000
RIGHT PAGE (COST SHEET)
Start- Up/Investment Income Variable Cost Fixed Cost
5,00,000
80,000 50,000 80,000 2,00,000 8,20,000 7,00,000 80,000
5,00,000 10,02,000 8,30,000 In the cash-cum-cost sheet above, all expenses are recorded as variable or fixed costs simultaneously. As indicated earlier, such system tool facilitates decision-making on the purchase, sale and ‘outsourcing’ or profitability front. For instance, measures to consider when cash balance is inadequate given the working capital requirement for the following operating cycle, include offering shorter periods for credit sales and a discount for cash sales and suppliers requested for credit. Further, if not very confident of demand in the next cycle, one may also reduce business risk by reducing the fixed cost, perhaps by discontinuing the annual lease arrangement and utilizing the idle capacity of other enterprises on a monthly basis or by employing labour on contract than salary basis and by reducing the stocking of raw material and inputs. Alternatively, one may enhance the potential for increasing returns or margins by converting piece rate to salaried labour if
EDI / DST – NIMAT / Entrepreneurship Development Programmes
99
99
the cash balance is relatively higher and market demand exists. Costs may hence be reduced and margins increased. That is by converting variable costs into fixed costs. Almost all variable costs may be converted into fixed costs and vice versa. Such simple systems in business could help make or break an enterprise. These decisions also affect working capital requirements for the next operating cycle. Working capital management involves estimating quantities of raw material or components, stock-in-progress, finished goods stock and bills receivable to be carried at any time so that uninterrupted production and inflow of cash is maintained. Working capital investment has a cost in terms of interest on funds invested, if they are borrowed, or if it is equity financed, there is a loss of return that could have been earned if invested alternatively. Those dealing with exporters and working on orders may require working capital only for raw material and stock in process as finished goods may be dispatched immediately upon production. The fortunate ones may also have their payments received immediately. The cycle beginning with the holding of raw material or components and ending with the ‘carry’ of finished goods is known as production cycle. The cycle which extends beyond the stage of ‘finished goods carry’ up to ‘carry of receivables’ due from customers is called an ‘operating cycle’. A business has two kinds of assets: fixed assets such as machinery, land, building and, operating assets, which are enclosed by one operating cycle. Operating assets are called gross working capital. Current liabilities such as the amount due for purchase of raw material, components and stores, viz. bills payable and credit received for other services, payment to electricity and telephone departments or money from an ‘informal’ money lender, all constitute a source of working capital. The net working capital is thus the difference between these and the gross working capital. The cash credit facility is normally given by financial institutions to a business in the form of a running current account. Funds may be drawn from time to time for only working capital requirements. This account is subject to ‘drawing power’. The drawing power is the limit to which one can draw funds out of this account. The drawing power is determined on the basis of market value of stocks (raw materials, stock in process and finished goods) and book debts at a given point of time less the amount of margin contribution by the borrower (say, 20%) that is predetermined. The banker may require weekly, monthly or fortnightly certified statements of stock holdings and book debts outstanding. The bank may also insist on paying the supplier of raw material directly from out of the cash credit facility. A financial institution may also require certain documents that must be executed before provision of loan. Securities may include primary security and secondary or collateral security. Primary security includes tangible assets such as stock and book debts in the case of a cash credit facility and equipment or particular asset that is financed for a long-term use. Collateral security may include tangible assets such as property or intangibles such as guarantees from borrower or persons who are third parties. Advantage of Cash Purchase of Raw Materials Consider Parag Patel’s enterprise. He manufactures pickles at home. Raw material fruits and vegetables are available on credit, for every Rs. 100 of raw material purchased, Rs. 2, that is 2% is the interest for credit offered. An enterprise that buys about Rs. 1 lakh worth
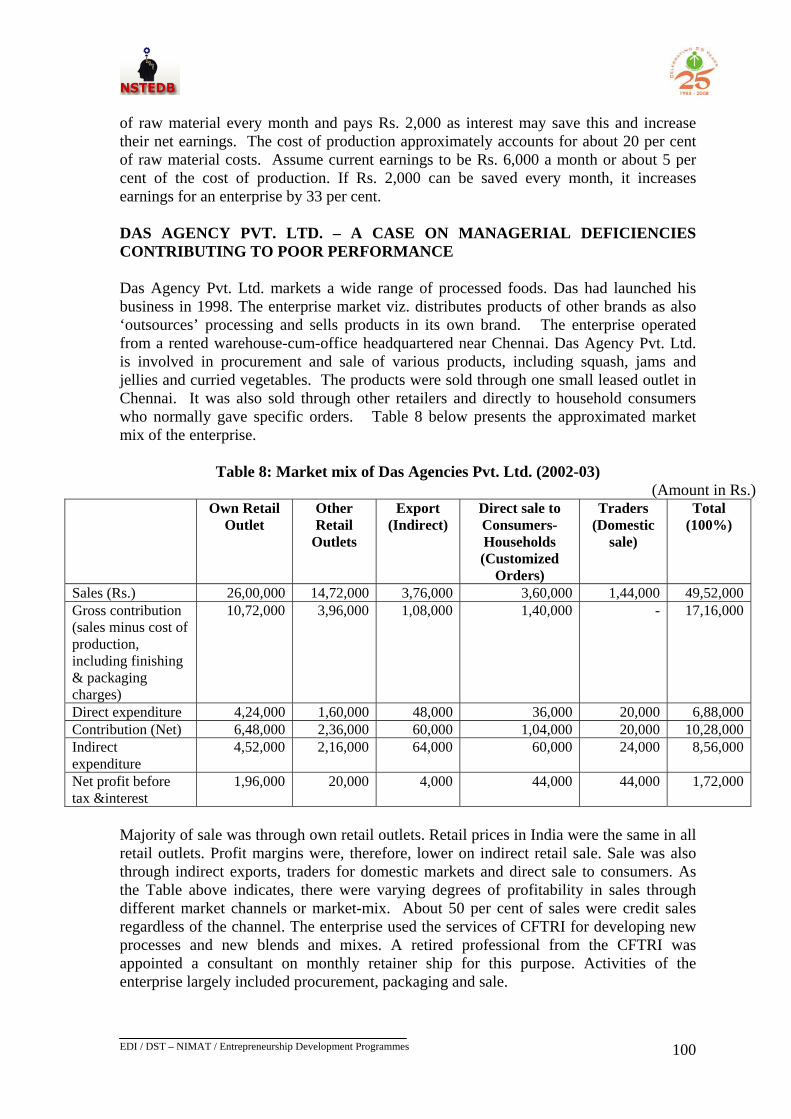
EDI / DST – NIMAT / Entrepreneurship Development Programmes
100
100
of raw material every month and pays Rs. 2,000 as interest may save this and increase their net earnings. The cost of production approximately accounts for about 20 per cent of raw material costs. Assume current earnings to be Rs. 6,000 a month or about 5 per cent of the cost of production. If Rs. 2,000 can be saved every month, it increases earnings for an enterprise by 33 per cent. DAS AGENCY PVT. LTD. – A CASE ON MANAGERIAL DEFICIENCIES CONTRIBUTING TO POOR PERFORMANCE Das Agency Pvt. Ltd. markets a wide range of processed foods. Das had launched his business in 1998. The enterprise market viz. distributes products of other brands as also ‘outsources’ processing and sells products in its own brand. The enterprise operated from a rented warehouse-cum-office headquartered near Chennai. Das Agency Pvt. Ltd. is involved in procurement and sale of various products, including squash, jams and jellies and curried vegetables. The products were sold through one small leased outlet in Chennai. It was also sold through other retailers and directly to household consumers who normally gave specific orders. Table 8 below presents the approximated market mix of the enterprise.
Table 8: Market mix of Das Agencies Pvt. Ltd. (2002-03)
(Amount in Rs.) Own Retail
Outlet Other Retail
Outlets
Export (Indirect)
Direct sale to Consumers-Households (Customized
Orders)
Traders (Domestic
sale)
Total (100%)
Sales (Rs.) 26,00,000 14,72,000 3,76,000 3,60,000 1,44,000 49,52,000Gross contribution (sales minus cost of production, including finishing & packaging charges)
10,72,000 3,96,000 1,08,000 1,40,000 - 17,16,000
Direct expenditure 4,24,000 1,60,000 48,000 36,000 20,000 6,88,000Contribution (Net) 6,48,000 2,36,000 60,000 1,04,000 20,000 10,28,000Indirect expenditure
4,52,000 2,16,000 64,000 60,000 24,000 8,56,000
Net profit before tax &interest
1,96,000 20,000 4,000 44,000 44,000 1,72,000
Majority of sale was through own retail outlets. Retail prices in India were the same in all retail outlets. Profit margins were, therefore, lower on indirect retail sale. Sale was also through indirect exports, traders for domestic markets and direct sale to consumers. As the Table above indicates, there were varying degrees of profitability in sales through different market channels or market-mix. About 50 per cent of sales were credit sales regardless of the channel. The enterprise used the services of CFTRI for developing new processes and new blends and mixes. A retired professional from the CFTRI was appointed a consultant on monthly retainer ship for this purpose. Activities of the enterprise largely included procurement, packaging and sale.
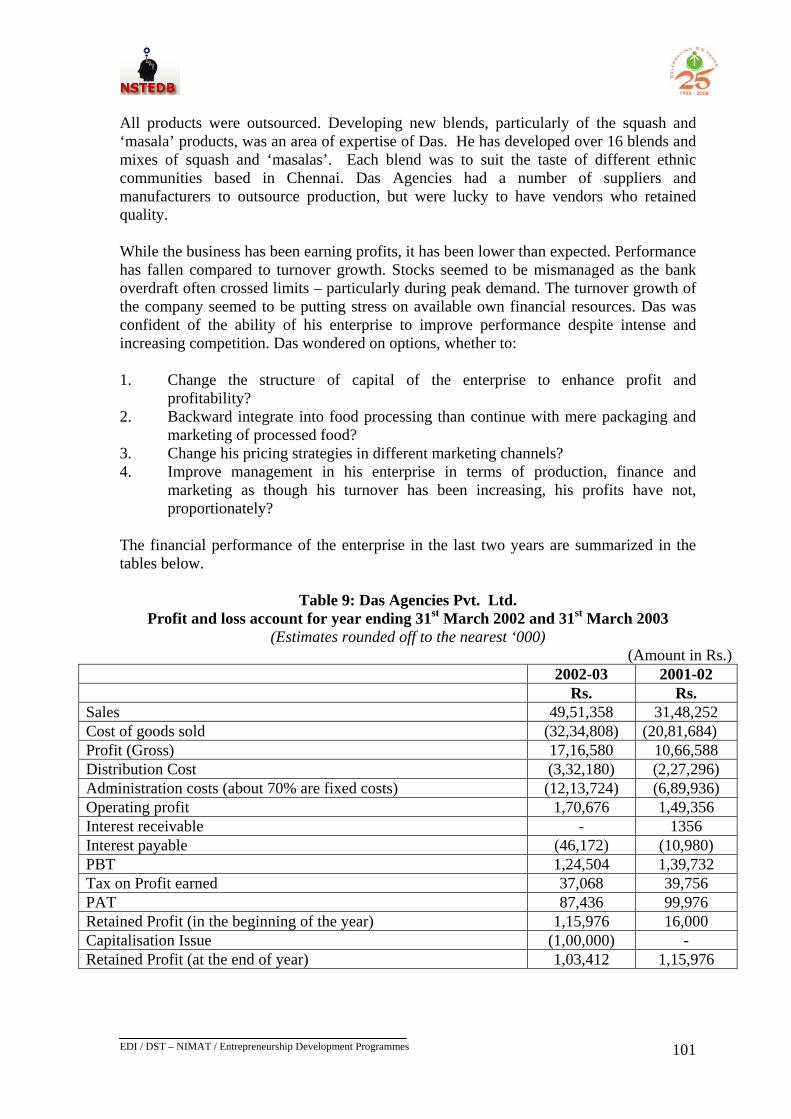
EDI / DST – NIMAT / Entrepreneurship Development Programmes
101
101
All products were outsourced. Developing new blends, particularly of the squash and ‘masala’ products, was an area of expertise of Das. He has developed over 16 blends and mixes of squash and ‘masalas’. Each blend was to suit the taste of different ethnic communities based in Chennai. Das Agencies had a number of suppliers and manufacturers to outsource production, but were lucky to have vendors who retained quality. While the business has been earning profits, it has been lower than expected. Performance has fallen compared to turnover growth. Stocks seemed to be mismanaged as the bank overdraft often crossed limits – particularly during peak demand. The turnover growth of the company seemed to be putting stress on available own financial resources. Das was confident of the ability of his enterprise to improve performance despite intense and increasing competition. Das wondered on options, whether to: 1. Change the structure of capital of the enterprise to enhance profit and
profitability? 2. Backward integrate into food processing than continue with mere packaging and
marketing of processed food? 3. Change his pricing strategies in different marketing channels? 4. Improve management in his enterprise in terms of production, finance and
marketing as though his turnover has been increasing, his profits have not, proportionately?
The financial performance of the enterprise in the last two years are summarized in the tables below.
Table 9: Das Agencies Pvt. Ltd.
Profit and loss account for year ending 31st March 2002 and 31st March 2003 (Estimates rounded off to the nearest ‘000)
(Amount in Rs.) 2002-03 2001-02 Rs. Rs.
Sales 49,51,358 31,48,252 Cost of goods sold (32,34,808) (20,81,684) Profit (Gross) 17,16,580 10,66,588 Distribution Cost (3,32,180) (2,27,296) Administration costs (about 70% are fixed costs) (12,13,724) (6,89,936) Operating profit 1,70,676 1,49,356 Interest receivable - 1356 Interest payable (46,172) (10,980) PBT 1,24,504 1,39,732 Tax on Profit earned 37,068 39,756 PAT 87,436 99,976 Retained Profit (in the beginning of the year) 1,15,976 16,000 Capitalisation Issue (1,00,000) - Retained Profit (at the end of year) 1,03,412 1,15,976
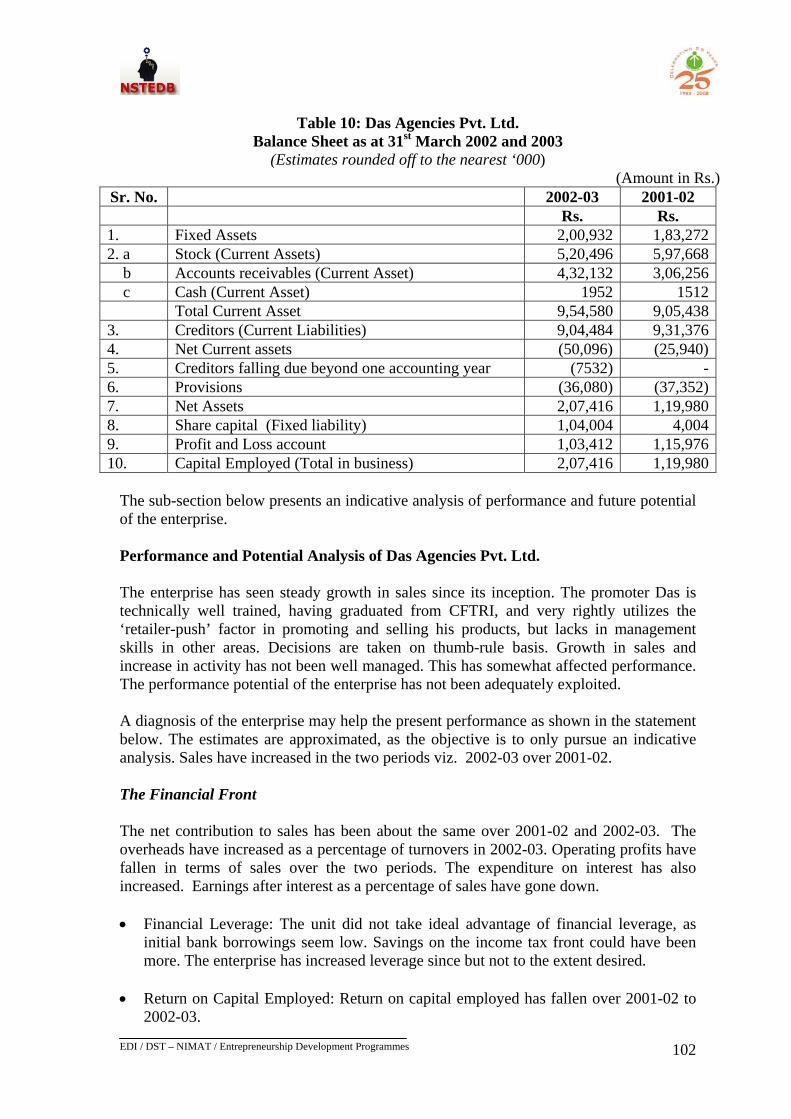
EDI / DST – NIMAT / Entrepreneurship Development Programmes
102
102
Table 10: Das Agencies Pvt. Ltd.
Balance Sheet as at 31st March 2002 and 2003 (Estimates rounded off to the nearest ‘000)
(Amount in Rs.) Sr. No. 2002-03 2001-02
Rs. Rs. 1. Fixed Assets 2,00,932 1,83,2722. a Stock (Current Assets) 5,20,496 5,97,668 b Accounts receivables (Current Asset) 4,32,132 3,06,256 c Cash (Current Asset) 1952 1512 Total Current Asset 9,54,580 9,05,4383. Creditors (Current Liabilities) 9,04,484 9,31,3764. Net Current assets (50,096) (25,940)5. Creditors falling due beyond one accounting year (7532) -6. Provisions (36,080) (37,352)7. Net Assets 2,07,416 1,19,9808. Share capital (Fixed liability) 1,04,004 4,0049. Profit and Loss account 1,03,412 1,15,97610. Capital Employed (Total in business) 2,07,416 1,19,980
The sub-section below presents an indicative analysis of performance and future potential of the enterprise. Performance and Potential Analysis of Das Agencies Pvt. Ltd. The enterprise has seen steady growth in sales since its inception. The promoter Das is technically well trained, having graduated from CFTRI, and very rightly utilizes the ‘retailer-push’ factor in promoting and selling his products, but lacks in management skills in other areas. Decisions are taken on thumb-rule basis. Growth in sales and increase in activity has not been well managed. This has somewhat affected performance. The performance potential of the enterprise has not been adequately exploited. A diagnosis of the enterprise may help the present performance as shown in the statement below. The estimates are approximated, as the objective is to only pursue an indicative analysis. Sales have increased in the two periods viz. 2002-03 over 2001-02. The Financial Front The net contribution to sales has been about the same over 2001-02 and 2002-03. The overheads have increased as a percentage of turnovers in 2002-03. Operating profits have fallen in terms of sales over the two periods. The expenditure on interest has also increased. Earnings after interest as a percentage of sales have gone down. • Financial Leverage: The unit did not take ideal advantage of financial leverage, as
initial bank borrowings seem low. Savings on the income tax front could have been more. The enterprise has increased leverage since but not to the extent desired.
• Return on Capital Employed: Return on capital employed has fallen over 2001-02 to
2002-03.
EDI / DST – NIMAT / Entrepreneurship Development Programmes
103
103
• Current Ratio: The current ratio of the enterprise has always been relatively poor.
The enterprise seems to have invested short-term funds for long-term purposes. Considering the current ratio, the enterprise seemed to have invested more than ideal levels of own funds in fixed assets. A term loan could have helped maintain better liquidity levels.
• Cash Flows and Problems: Cash balance has fallen considerably. The net
‘contribution’ as a percentage of sales is almost the same in both years. The Marketing Front • Growth Rate: The turnover of the enterprise has seen good growth over the years.
Turnover has increased considerably between 2001-02 and 2002-03. Net profits are however, a small percentage of sales. This is a poor margin on sales performance. They may reflect a poor market or product-mix with a tendency towards worsening circumstances.
• Debtor Turnover: Sale through own retail outlets has been on cash basis while
remaining sales were also on credit basis. The Debtor Turnover Ratio (viz. Credit sales to Debtors) is about the same, indicating poor focus upon market mix or discount vs. credit modes.
• Margins in terms of operating profits and Profit Before Tax (PBT) to sales have
dropped although sales has increased. This has occurred inspite of increase in sales as overheads (administrative expenses) have increased more than proportionately. Earnings after interest have fallen in terms of percentage of sales as interest expenses have increased several folds.
• Sales Mix: The sales mix in terms of product or market mix does not seem decided,
considering the contribution per rupee of sales but on thumb-rule basis. The scope for efficient pricing and discount stratagem on the basis of contribution analysis seems to have been ignored. This could have reduced debtor realization time and enhanced performance, including sales. Economies of scale do not seem effectively reaped in marketing. As sales have increased, ideally, overheads to sales ratio should have reduced. Rather, it has increased. This indicates the need for revamping product or market mix and evolving an ideal promotional stratagem perhaps in terms of credit and discount.
The Production Front
• Rise in Variable Costs: The enterprise is largely outsourcing entire ‘production’.
However, it has invested in equipment for packaging and labelling.
• Inventory Turnover: There may be mismanagement in terms of stocking raw material and finished goods inventory. Thus, inventory turnover ratios (ITOR) have fallen between the two years. This may lead to increased working capital requirements and a cash crisis. Analysis of stock turnover at the market and product-mix level seems ignored.
EDI / DST – NIMAT / Entrepreneurship Development Programmes
104
104
• Creditors: The level of non-bank creditors seems to be high. Interest cost has
increased several folds as compared to 2001-02. The use of non-bank creditors could imply higher interest charges over the years. This may have also affected performance, viz. margins.
Systems for planning seem to be on thumb rule basis. In essence, to enhance performance and sustainability, the enterprise could go in for higher levels of institutional debt finance, may consider integrating backwards into processing, as also develop the marketing front in terms of offering ‘credit and discounts’ in channels of products, where contribution is the highest to ensure that turnover increase will be matched with profit increase even while benefiting from a higher operating and financial leverage and hence profitability. In fact, these are aspects that need to have been considered earlier even during conception and implementation of the project. NETWORKING OPTIONS TO BE CLUBBED WITH MANAGEMENT EFFICIENCY In fact, management efficiency at the enterprise level needs to be clubbed with efficient networking. There are many regions with established food processing enterprises but with a weak technical knowledge base, weak information channels and limited facilities for testing and research. Legal and quality issues may be unknown. Legal compliance, support in HACCP certification and need for establishing food-testing laboratories are critical. An information portal www.foodindia.org with information on international product standards has been developed by the ‘Mahratta Chamber’ (MCCIA) in Pune, for instance. But, few are aware of the facility. Information gaps need to be reduced by networking with different support institutions. The food processing enterprises at Pune produce products such as jelly, squash, pickle, dehydrated ready food mixes, bakery products, milk products such as sweets, ice creams, confectionery items, ground cereal flours, papad, processed spices, etc. A consultant was called (FICCI, Quality Forum, New Delhi) to introduce HACCP. A food-testing laboratory was established not only to carry out testing facilities but also to carry out research and provide training facilities to firms. The laboratory was established to work on the areas of product testing, (quality control & quality assurance), product development and training in an integrated manner. The Food Research and Analysis Centre (FRAC), New Delhi, signed an MOU with MCCIA to pursue initiatives. FRAC helped the Pune laboratory in the selection of right machinery, staff and in training. In essence, SIDBI and the Ministry of Food Processing Industries provided financial support. MCCIA provided finance and management. The FRAC provided finance and management and the CFTRI provided training. Such interventions for the benefit of enterprises in a region may be catalysed only if enterprises work together to ensure the same. An information centre was developed for farmers, which strengthened backward linkage of processed food units. Potential entrepreneurs in other regions should learn of such options to enhance performance.
EDI / DST – NIMAT / Entrepreneurship Development Programmes
105
105
Grameen Information Centre (GIC) In the food processing region of Pune, IT is used to develop linkages between food- processing units and agriculture producers around the city. The GIC is a concept developed to provide information to facilitate better linkages. Information is provided on technology, prices, demand and supply situation in the international scenario, rules and regulations for exports, import duties, standards and specifications. A pilot GIC was established near Pune. Various activities of the GIC include ‘Rice Programmes’ to encourage better seeds and hybrid varieties; ‘Organisation farming programmes’ for the development of niche products; dissemination of information on Government sponsored schemes, new technologies in agriculture, post-harvest techniques, weather forecasting, guidance on crop protection. Development of Raw Material Purchase Consortia or ‘Raw Material Banks’ Input supplies to individual enterprises may be bought in volumes meriting discounts. Purchase consortia lend strength to small enterprises vis-à-vis supplies. It is necessary to secure information about raw material and input sources and quantity discount-related options. Agencies such as the NSIC may be approached for establishment of such raw material banks. For instance, in Ahmedabad for certain vegetables Rs. 5 crore is believed to be the optimal size of purchase (on a quarterly basis). Networking with other enterprises to purchase together may help even smaller individual enterprises benefit sustainably in terms of cost reduction. The ‘sub-optimal’ raw material purchase price of various inputs (as it is), often on a credit purchase basis and in an uneconomic quantity, affects the cost structure of many smaller enterprises in different sub-sectors. The cost of uneconomic purchase as also credit purchase need be avoided. The return on investment (pre-tax) to such common ventures (pre-tax) equals over 50 per cent. Even if partly bank (debt for working capital) financed, the ROE is likely to be very high, depending on the extent of rotation and amount and cost of working capital secured. Development of Common Facility Centres and Exploring Common Financing Options Common Facility Centers (CFCs) have the objective of providing necessary services to smaller enterprises. Shared facilities may be in terms of research and development and, product testing and standardization. The Peenya Industries Association in Bangalore has, for example, established a permanent exhibition-cum-display centre for members’ products. Such centers may be supported by various ministries such as the Ministry of SSI and ARI, DC (SSI) etc. Common Facility Centers help smaller enterprises utilize expensive facilities which they as individual enterprises cannot afford to develop and use. Common Financing options can be explored as it benefits tiny and small enterprises that do not have access to institutional working capital due to their inability to produce necessary documents on collateral. Mutual Credit Guarantee Fund Scheme (MCGFS) implemented by SIDBI is one such option. The options of networking are several. Entrepreneurs in the sector may explore networking options among themselves as also establish a good networking with support institutions to sustain performance.
EDI / DST – NIMAT / Entrepreneurship Development Programmes
106
106
CHAPTER - 15
LEGAL REQUIREMENTS All industrial activities are governed by certain legal provisions that come in force from time to time. A few of them are given here with brief explanation for your understanding. These could be divided into ‘general’ and ‘Food Processing Industry specific’. GENERAL LEGALITIES Factories Act, 1948 This is applicable to enterprises where the number of employees is: - Ten or more and where power is used; or - Twenty or more and power is not used The enterprises covered under the Act are required to keep certain records: • Muster Roll • Workers Register • Overtime Register • Advance Register • Register for Fine • Register for Deductions • Register of Wages • Register of Accidents and Dangerous Occurrences • Bond Inspection Book • Register of Cleaning and White Washing • Record of Examination of Parts of Machinery There is another Act known as Shops and Establishment Act which is applicable to shops and business undertakings employing 5 or more persons. Employees Provident Fund & Miscellaneous Provisions Act, 1952 The Act applies to every factory or establishment employing 20 or more employees. It, however, exempts a factory or establishment for an initial period of 3 years from commencement of business if the number of employees is more than 50 and for an initial period of 5 years if the number of employees is less than 50. Contribution The minimum contribution payable by the employer is 12% of the basic salary and Dearness Allowance. The employee also makes an equal contribution. The Act, however, does not specify a maximum contribution.
EDI / DST – NIMAT / Entrepreneurship Development Programmes
107
107
Employees’ State Insurance Act It provides benefits to employees in case of sickness, maternity and employment injury and for certain other matters in relation thereto. The Act also provides for payment of contributions by employers and employees at the rates specified in the First Schedule of the Act. The existing rates of employee’s contribution vary according to wages and the employer’s contribution is exactly double the employee’s contribution. It shall apply to factories employing 20 or more people. Payment of Wages Act, 1936 This Act is applicable to factories and establishments, which come under The Factories Act. The act is restricted in its application to the class of workers whose wages range upto to Rs. 1,600/- per month. Minimum Wages Act, 1948 The employer has to pay minimum wages to employees in certain scheduled industries. At present the minimum wages act is applicable in 44 scheduled industries. The Indian Partnership Act, 1932 The Indian Partnership Act, which was amended in 1932, provides for rules relating to foundation of a legal partnership. It states the rights and duties of the partners among themselves and outside, and lays down rules regarding the dissolution of partnership. Central Excise (CE) The Central Government is empowered to levy excise on all articles manufactured in India except alcohol, alcoholic preparations and narcotics. The liability to duty starts the moment a new commodity is manufactured. There are, however, certain exemptions granted to SSI units. However, there is no CE on fruit and vegetable products. Sales Tax Sales tax is tax levied by state and centre. Tax charged by state is called LST or Local Sales Tax and tax charged by Centre is known as CST or Central Sales Tax. The latter is charged when goods move out of a state. The Income Tax Act, 1911 The Act governs the levy of income tax in India. If defines various terms and expressions and states the liability of a person to pay income tax. The rates and pattern of taxation, however, are changed from time to time. The Pollution Control Act The State Air and Water Pollution Control Board is the body responsible for implementing this Act. The act is applicable to all kinds of industry.
EDI / DST – NIMAT / Entrepreneurship Development Programmes
108
108
FOOD PROCESSING SPECIFIC LEGALITIES In addition to the general legal requirements, there are a few legal requirements that are specific to Food Processing Industries. A food processing enterprise has to comply with several compulsory legal requirements. Implementation of these norms with regard to Small and Medium enterprises is relatively stringent while cottage and household level units sometimes tend to compromise on such stipulations. These laws include: a. Prevention of Food Adulteration Act (1954): This is the basic statute to protect
consumers against supply of adulterated food. ‘The Central Committee for Food Standards’ under the Directorate General of Health Services, Ministry of Health and Family Welfare, has specified the Standards.
b. Milk and Milk Products Order (MMPO): This order regulates milk and production
of milk products in the country. The order requires no permission for units handling less than 10,000 liters of liquid milk per day or milk solids upto 500 tpa.
c. Fruit Products Order (1955): This order that regulates manufacture and distribution
of all fruit and vegetable products, sweetened aerated waters, vinegar, and synthetic syrups. The license is issued by Regional Director of MoFPI located at Mumbai, Delhi, Kolkatta, Chennai and Guwahati, based on the satisfaction of the concerned officer with regard to quality of production, sanitation and hygiene, machinery and equipment, and work area standards.
d. Standard of Weights and Measures (Packaged Commodities) Rules, 1977: These
rules lay down certain obligations for all commodities in packed form with respect to their quality declaration. The Directorate of Weights and Measures under the Ministry of Food and Civil Supplies enforces these rules.
e. Export (Quality Control and Inspection) Act, 1963: The Export Inspection Council
is responsible for operation of this Act under which many exportable commodities have been notified for compulsory pre-shipment inspection unless specifically requested by the importer not to do so.
f. Voluntary Standards: They are regulated by organizations involved with voluntary
standardization and certificates systems concerning quality parameters in food. They are the Bureau of Indian Standards (BIS) and Directorate of Marketing and Inspection (DMI). The food processing industries sector as a whole involves other legislations.
g. Oils, Deoiled Meal and Edible Flour Control Order 1967 and Vegetables
Products Control Order, 1976: These orders control the production and distribution of solvent extracted oils, deoiled meals, edible oil seed flours, and hydrogenated vegetable oils (vanaspati).
h. Meat Food Products Control Order, 1973: This order regulates manufacture,
quality, and sale of all meat products and is operated by the Directorate of Marketing and Inspection.
EDI / DST – NIMAT / Entrepreneurship Development Programmes
109
109
16.0 SUPPORT INSTITUTIONS FOR PROMOTION OF SMEs
THE BASIC SUPPORT INSTITUTIONAL FRAMEWORK While information on various sources of information is presented in this chapter, potential entrepreneurs need not contact all agencies but only the relevant ones, depending on their informational needs and support. Important agencies for information on procedures and formalities include the District Industries Centres (DICs), Directorate/Commissioner of Industries, State Financial Corporations (SFCs), Technical Consultancy Organizations (TCOs), and agencies conducting Entrepreneurship Development Programmes such as state level and national level entrepreneurship development institutions and non-government organizations (NGOs). Central Food Technological Research Institute – CFTRI (www.cftri.com): The Institute provides the technologies for food processing enterprises. National Small Industries Corporation Ltd – NSIC (www.nsicindia.com): The Corporation provides integrated technology, marketing and financial support to the small scale sector. Small Industries Development Organization – SIDO (www.laghu-udhyog.com): The office of the Development Commissioner (Small Scale Industries) also known as Small Industries Development Organization (SIDO) functions as the nodal development agency for small industries. Export Credit Guarantee Corporation of India Limited – ECGC (www.ecgcindia.com): ECGC covers the risk of exporting on credit. Being essentially an export promotion organization, it functions under the administrative control of the Ministry of Commerce, Government of India. It provides a range of credit risk insurance covers to exporters against loss in export of goods and services. ECGC also provides information on creditworthiness/credit ratings of overseas buyers and various countries. Credit status information agencies abroad Dun & Bradstreet – D & B (www.dnb.co.in): D & B is one of the world's leading providers of business information, enabling business-to-business commerce for the past 160 years. D&B has the largest company database available, with information on more than 66 million companies worldwide – for credit, marketing and purchasing decisions. Businesses also use D&B's information and technology to authenticate and verify online the potential trading partners, thus increasing their trust and confidence in e-commerce transactions. Small Industries Development Bank of India – SIDBI (www.sidbi.com): The Small Industries Development Bank of India Act, 1989 envisaged SIDBI to be ‘the principal financial institution for the promotion, financing and development of industry in the small-scale sector and to co-ordinate the functions of the institutions engaged in the promotion and financing or developing industry in the small scale sector and for matters connected therewith or incidental thereto’. India Trade Promotion Organization – ITPO (www.indiatradepromotion.org): This is the nodal agency of the Government of India for promoting the country's external trade.

EDI / DST – NIMAT / Entrepreneurship Development Programmes
110
110
ITPO, during its existence for nearly three decades, in the form of Trade Fair Authority of India and Trade Development Authority, has played a proactive role in catalyzing trade, investment and technology transfer processes. Its promotional tools include organizing fairs and exhibitions in India and abroad, Buyer-Seller Meets, Contact Promotion Programmes, Product Promotion Programmes, Promotion through Overseas Department Stores, Market Surveys and Information Dissemination. Federation of Indian Export Organizations – FIEO (www.fieo.com): FIEO provides the content, direction and thrust to India’s expanding international trade. It symbolizes all the dynamism and resurgence that are the hallmark of India’s open, liberal and progressively market-friendly economic and trade regime, representing the Indian export promotion effort in its entirety. Export-Import Bank of India – EXIM Bank (www.eximbankindia.com): EXIM Bank, set up in 1982, for the purpose of financing, facilitating, and promoting foreign trade of India, is the principal financial institution in the country for co-coordinating working of institutions engaged in financing exports and imports.