Embed Size (px)
Citation preview
1134 Municipal Way Lansing, Michigan 48917
800.767.MERS (6377) www.mersofmich.com
for the fiscal year ending
12.31.2018
SUMMARY ANNUAL FINANCIAL REPORT
ABOUT THIS REPORTThis report provides a summary of the MERS Comprehensive Annual Financial Report (CAFR) for the fiscal year which ended December 31, 2018. The CAFR is prepared in accordance with Generally Accepted Accounting Principles (GAAP) and is subject to external audit. This Summary Annual Financial Report is also prepared in accordance with GAAP. The 2018 CAFR contains more detailed information and can be obtained by contacting MERS:
Website:www.mersofmich.com
By mail: Municipal Employees’ Retirement System of Michigan1134 Municipal WayLansing, MI 48917
By phone:800.767.MERS (6377)
The financial statements were audited by Plante & Moran, PLLC.
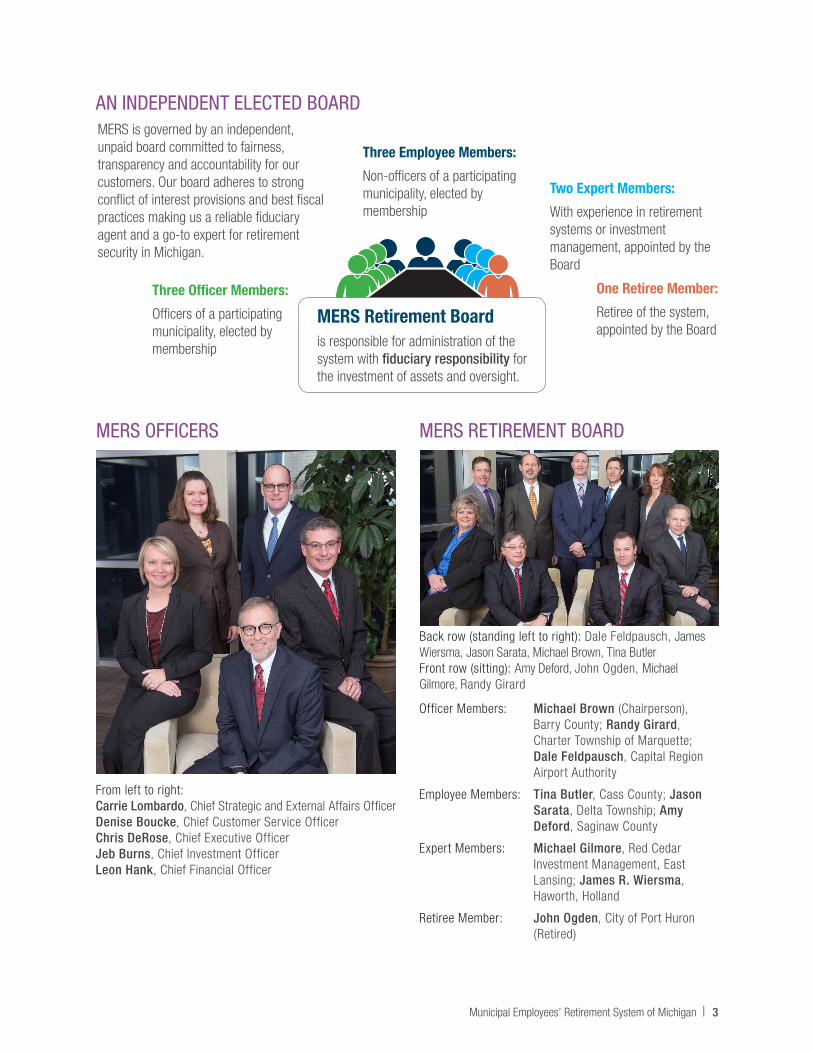
MERS received the Award for Outstanding Achievement in Popular Annual Financial Reporting from the Government Finance Officers Association for the 2017 Summary Annual Financial Report. This marks the 15th consecutive year MERS has received this honor.
CERTIFICATE OF ACHIEVEMENT FOR EXCELLENCE IN FINANCIAL REPORTING
for the fiscal year ending
12.31.2017
SUMMARY ANNUALFINANCIAL REPORT
1134 Municipal Way Lansing, Michigan 48917
800.767.MERS (6377) www.mersofmich.com
2 | www.mersofmich.com
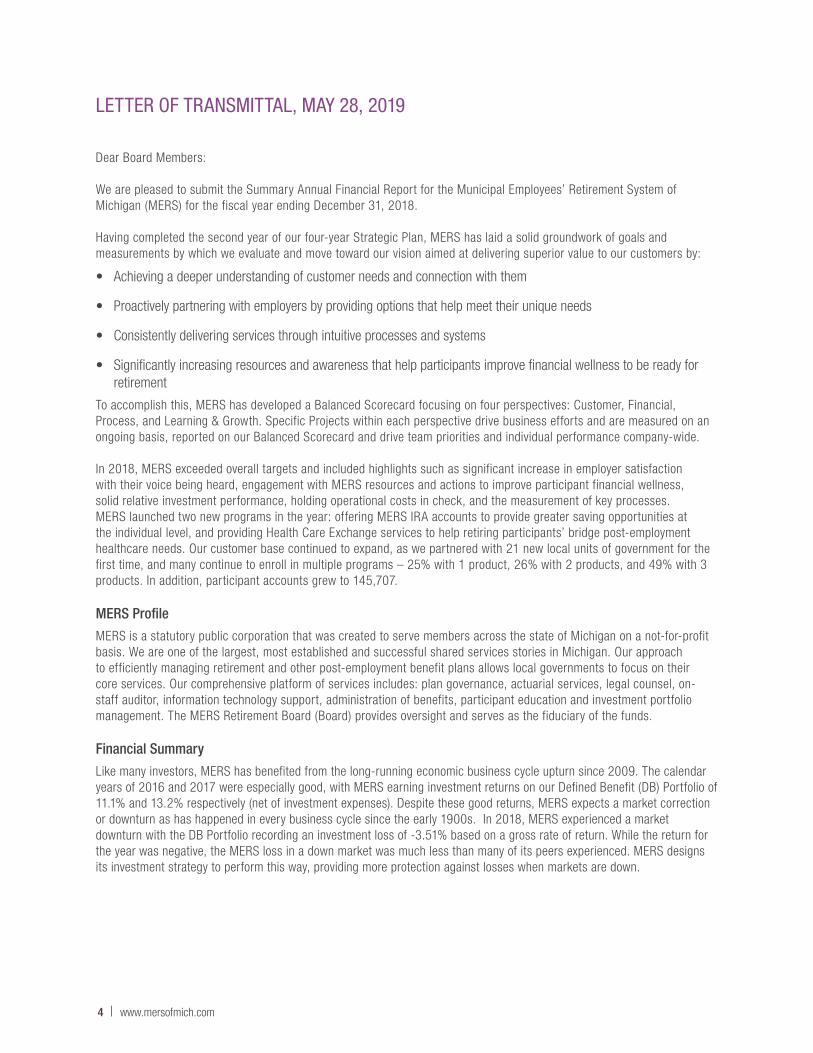
MERS OFFICERS MERS RETIREMENT BOARD
AN INDEPENDENT ELECTED BOARD
From left to right: Carrie Lombardo, Chief Strategic and External Affairs OfficerDenise Boucke, Chief Customer Service Officer Chris DeRose, Chief Executive Officer Jeb Burns, Chief Investment Officer Leon Hank, Chief Financial Officer
MERS Retirement Board is responsible for administration of the system with fiduciary responsibility for the investment of assets and oversight.
Three Officer Members:
Officers of a participating municipality, elected by membership
Three Employee Members:
Non-officers of a participating municipality, elected by membership
One Retiree Member:
Retiree of the system, appointed by the Board
Two Expert Members:
With experience in retirement systems or investment management, appointed by the Board
MERS is governed by an independent, unpaid board committed to fairness, transparency and accountability for our customers. Our board adheres to strong conflict of interest provisions and best fiscal practices making us a reliable fiduciary agent and a go-to expert for retirement security in Michigan.
Back row (standing left to right): Dale Feldpausch, James Wiersma, Jason Sarata, Michael Brown, Tina Butler Front row (sitting): Amy Deford, John Ogden, Michael Gilmore, Randy Girard
Officer Members: Michael Brown (Chairperson), Barry County; Randy Girard, Charter Township of Marquette; Dale Feldpausch, Capital Region Airport Authority
Employee Members: Tina Butler, Cass County; Jason Sarata, Delta Township; Amy Deford, Saginaw County
Expert Members: Michael Gilmore, Red Cedar Investment Management, East Lansing; James R. Wiersma, Haworth, Holland
Retiree Member: John Ogden, City of Port Huron (Retired)
Municipal Employees’ Retirement System of Michigan | 3
LETTER OF TRANSMITTAL, MAY 28, 2019
Dear Board Members:
We are pleased to submit the Summary Annual Financial Report for the Municipal Employees’ Retirement System of Michigan (MERS) for the fiscal year ending December 31, 2018.
Having completed the second year of our four-year Strategic Plan, MERS has laid a solid groundwork of goals and measurements by which we evaluate and move toward our vision aimed at delivering superior value to our customers by:
• Achieving a deeper understanding of customer needs and connection with them
• Proactively partnering with employers by providing options that help meet their unique needs
• Consistently delivering services through intuitive processes and systems
• Significantly increasing resources and awareness that help participants improve financial wellness to be ready for retirement
To accomplish this, MERS has developed a Balanced Scorecard focusing on four perspectives: Customer, Financial, Process, and Learning & Growth. Specific Projects within each perspective drive business efforts and are measured on an ongoing basis, reported on our Balanced Scorecard and drive team priorities and individual performance company-wide.
In 2018, MERS exceeded overall targets and included highlights such as significant increase in employer satisfaction with their voice being heard, engagement with MERS resources and actions to improve participant financial wellness, solid relative investment performance, holding operational costs in check, and the measurement of key processes. MERS launched two new programs in the year: offering MERS IRA accounts to provide greater saving opportunities at the individual level, and providing Health Care Exchange services to help retiring participants’ bridge post-employment healthcare needs. Our customer base continued to expand, as we partnered with 21 new local units of government for the first time, and many continue to enroll in multiple programs – 25% with 1 product, 26% with 2 products, and 49% with 3 products. In addition, participant accounts grew to 145,707.
MERS Profile
MERS is a statutory public corporation that was created to serve members across the state of Michigan on a not-for-profit basis. We are one of the largest, most established and successful shared services stories in Michigan. Our approach to efficiently managing retirement and other post-employment benefit plans allows local governments to focus on their core services. Our comprehensive platform of services includes: plan governance, actuarial services, legal counsel, on-staff auditor, information technology support, administration of benefits, participant education and investment portfolio management. The MERS Retirement Board (Board) provides oversight and serves as the fiduciary of the funds.
Financial Summary
Like many investors, MERS has benefited from the long-running economic business cycle upturn since 2009. The calendar years of 2016 and 2017 were especially good, with MERS earning investment returns on our Defined Benefit (DB) Portfolio of 11.1% and 13.2% respectively (net of investment expenses). Despite these good returns, MERS expects a market correction or downturn as has happened in every business cycle since the early 1900s. In 2018, MERS experienced a market downturn with the DB Portfolio recording an investment loss of -3.51% based on a gross rate of return. While the return for the year was negative, the MERS loss in a down market was much less than many of its peers experienced. MERS designs its investment strategy to perform this way, providing more protection against losses when markets are down.
4 | www.mersofmich.com
MERS ended the year with a net position of $10.9 billion for all plan types, down $477 million from 2017. The reduction in asset size occurred primarily due to the investment loss for the year. Contributions and transfers in from all plan types exceeded $1 billion for the first time in MERS history. Strong cost control measures helped MERS hold its administrative costs to $19.1 million, close to last year’s costs of $19.2 million, and comparable to costs going all the way back to its 2009 spending level. Lower administrative costs also have a positive impact on DB and other plan types.
In 2018, the MERS 457 program grew at the highest rate of any product, increasing in asset size by $26 million to $108.8 million. As an indicator of how municipalities are more aggressively addressing their other post-employment benefit (OPEB) obligations, the MERS Health Care Savings Program and Retiree Health Funding Vehicle net plan assets grew by $25 million in 2018.
One other measure of a defined benefit retirement system’s financial health is the percentage of its actuarial liabilities owed that is covered by its available actuarial assets. Using this ratio (calculated from the most recent 2017 calendar year valuation data), nearly 59% of MERS’ municipalities were funded at 70% or higher (427 municipalities), which is up from 56% (401 municipalities) in 2016.
We continue to partner with all municipalities in helping them set fiscal goals and discussing options to find the programs and provisions that best fit each municipality’s unique needs. There are 746 local units of government within MERS Defined Benefit and Hybrid Plans, which encompasses 2,915 divisions with unique benefit designs. In 2018, 37 divisions adopted a Hybrid Plan or a lower tier Defined Benefit Plan for new employees and 56 divisions adopted a Defined Contribution Plan for new employees. There were also 130 divisions that increased cost sharing to their employees. In 2018, 330 plans made voluntary contributions, contributing an additional $263 million to help increase funding levels. These efforts helped strengthen the financial condition of all these plans. In addition, new local units of government joining the MERS Defined Benefit Plan brought in an extra $2 million.
Respectfully submitted,
Chris DeRoseChief Executive Officer
Leon E. Hank, CPAChief Financial Officer
Municipal Employees’ Retirement System of Michigan | 5
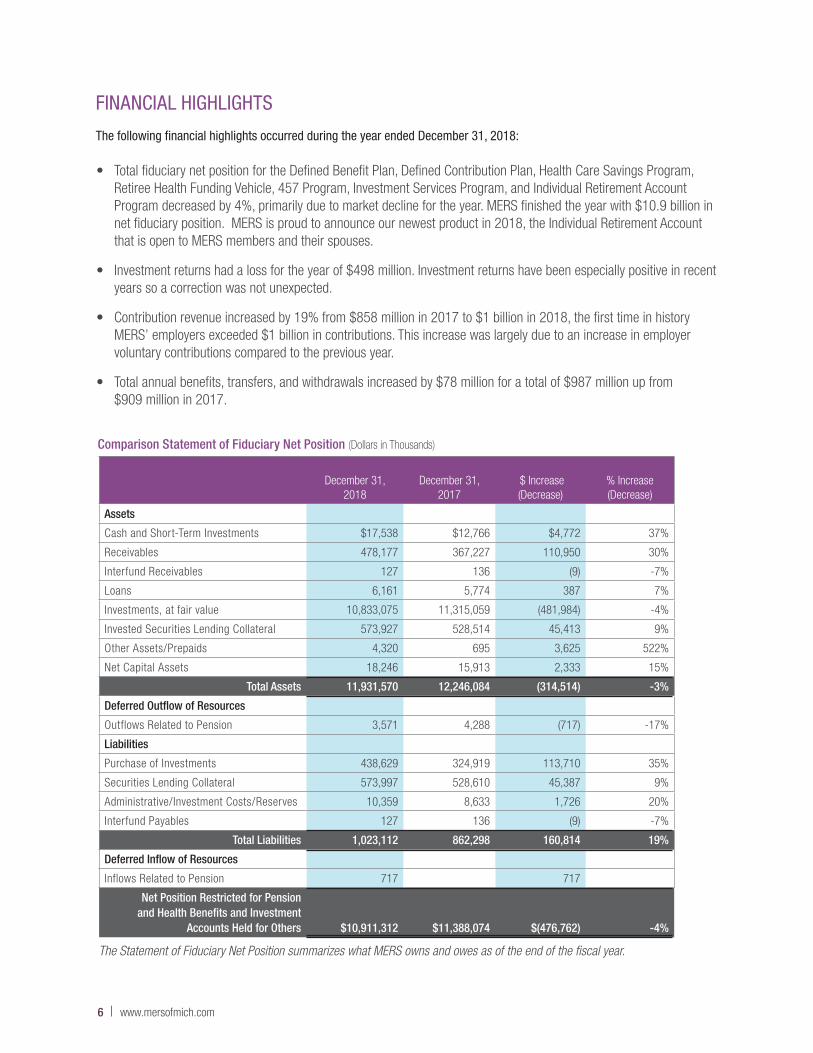
• Total fiduciary net position for the Defined Benefit Plan, Defined Contribution Plan, Health Care Savings Program, Retiree Health Funding Vehicle, 457 Program, Investment Services Program, and Individual Retirement Account Program decreased by 4%, primarily due to market decline for the year. MERS finished the year with $10.9 billion in net fiduciary position. MERS is proud to announce our newest product in 2018, the Individual Retirement Account that is open to MERS members and their spouses.
• Investment returns had a loss for the year of $498 million. Investment returns have been especially positive in recent years so a correction was not unexpected.
• Contribution revenue increased by 19% from $858 million in 2017 to $1 billion in 2018, the first time in history MERS’ employers exceeded $1 billion in contributions. This increase was largely due to an increase in employer voluntary contributions compared to the previous year.
• Total annual benefits, transfers, and withdrawals increased by $78 million for a total of $987 million up from $909 million in 2017.
FINANCIAL HIGHLIGHTS
The following financial highlights occurred during the year ended December 31, 2018:
Comparison Statement of Fiduciary Net Position (Dollars in Thousands)
December 31,
2018
December 31,
2017 $ Increase (Decrease)
% Increase (Decrease)
Assets
Cash and Short-Term Investments $17,538 $12,766 $4,772 37%
Receivables 478,177 367,227 110,950 30%
Interfund Receivables 127 136 (9) -7%
Loans 6,161 5,774 387 7%
Investments, at fair value 10,833,075 11,315,059 (481,984) -4%
Invested Securities Lending Collateral 573,927 528,514 45,413 9%
Other Assets/Prepaids 4,320 695 3,625 522%
Net Capital Assets 18,246 15,913 2,333 15%
Total Assets 11,931,570 12,246,084 (314,514) -3%
Deferred Outflow of Resources
Outflows Related to Pension 3,571 4,288 (717) -17%
Liabilities
Purchase of Investments 438,629 324,919 113,710 35%
Securities Lending Collateral 573,997 528,610 45,387 9%
Administrative/Investment Costs/Reserves 10,359 8,633 1,726 20%
Interfund Payables 127 136 (9) -7%
Total Liabilities 1,023,112 862,298 160,814 19%
Deferred Inflow of Resources
Inflows Related to Pension 717 717
Net Position Restricted for Pension and Health Benefits and Investment
Accounts Held for Others $10,911,312 $11,388,074 $(476,762) -4%
The Statement of Fiduciary Net Position summarizes what MERS owns and owes as of the end of the fiscal year.
6 | www.mersofmich.com
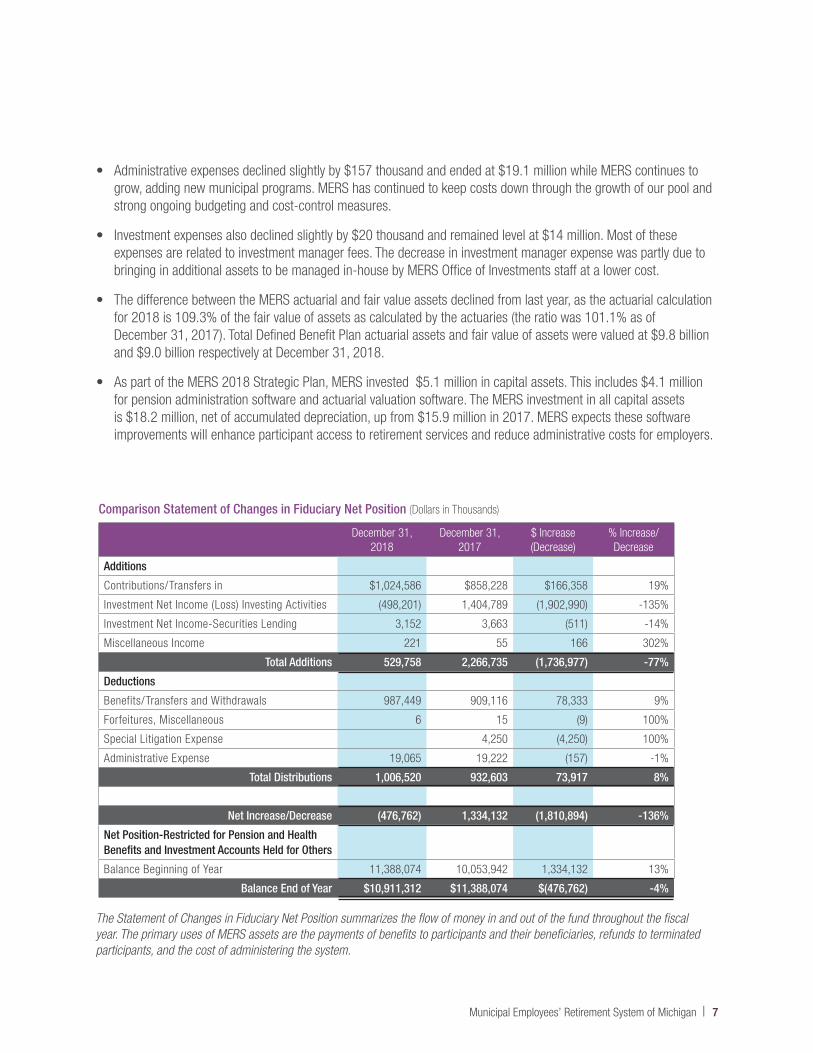
• Administrative expenses declined slightly by $157 thousand and ended at $19.1 million while MERS continues to grow, adding new municipal programs. MERS has continued to keep costs down through the growth of our pool and strong ongoing budgeting and cost-control measures.
• Investment expenses also declined slightly by $20 thousand and remained level at $14 million. Most of these expenses are related to investment manager fees. The decrease in investment manager expense was partly due to bringing in additional assets to be managed in-house by MERS Office of Investments staff at a lower cost.
• The difference between the MERS actuarial and fair value assets declined from last year, as the actuarial calculation for 2018 is 109.3% of the fair value of assets as calculated by the actuaries (the ratio was 101.1% as of December 31, 2017). Total Defined Benefit Plan actuarial assets and fair value of assets were valued at $9.8 billion and $9.0 billion respectively at December 31, 2018.
• As part of the MERS 2018 Strategic Plan, MERS invested $5.1 million in capital assets. This includes $4.1 million for pension administration software and actuarial valuation software. The MERS investment in all capital assets is $18.2 million, net of accumulated depreciation, up from $15.9 million in 2017. MERS expects these software improvements will enhance participant access to retirement services and reduce administrative costs for employers.
Comparison Statement of Changes in Fiduciary Net Position (Dollars in Thousands)
December 31, 2018
December 31, 2017
$ Increase (Decrease)
% Increase/ Decrease
Additions
Contributions/Transfers in $1,024,586 $858,228 $166,358 19%
Investment Net Income (Loss) Investing Activities (498,201) 1,404,789 (1,902,990) -135%
Investment Net Income-Securities Lending 3,152 3,663 (511) -14%
Miscellaneous Income 221 55 166 302%
Total Additions 529,758 2,266,735 (1,736,977) -77%
Deductions
Benefits/Transfers and Withdrawals 987,449 909,116 78,333 9%
Forfeitures, Miscellaneous 6 15 (9) 100%
Special Litigation Expense 4,250 (4,250) 100%
Administrative Expense 19,065 19,222 (157) -1%
Total Distributions 1,006,520 932,603 73,917 8%
Net Increase/Decrease (476,762) 1,334,132 (1,810,894) -136%
Net Position-Restricted for Pension and Health Benefits and Investment Accounts Held for Others
Balance Beginning of Year 11,388,074 10,053,942 1,334,132 13%
Balance End of Year $10,911,312 $11,388,074 $(476,762) -4%
The Statement of Changes in Fiduciary Net Position summarizes the flow of money in and out of the fund throughout the fiscal year. The primary uses of MERS assets are the payments of benefits to participants and their beneficiaries, refunds to terminated participants, and the cost of administering the system.
Municipal Employees’ Retirement System of Michigan | 7
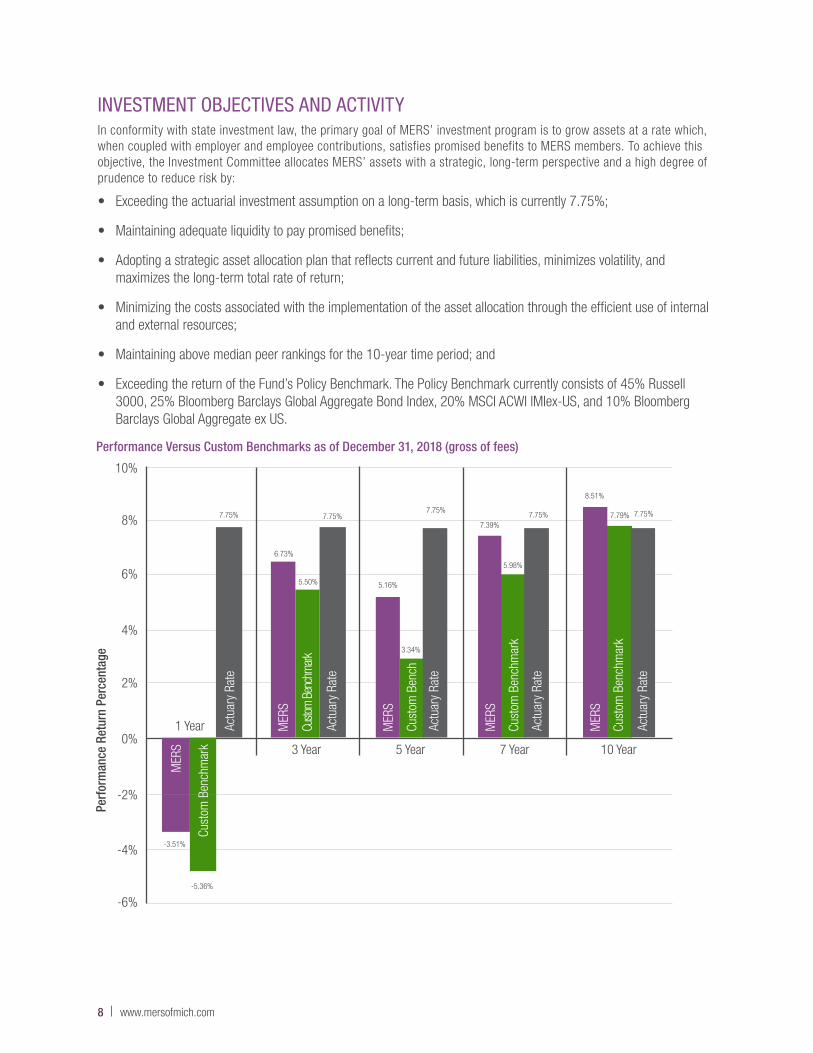
INVESTMENT OBJECTIVES AND ACTIVITYIn conformity with state investment law, the primary goal of MERS’ investment program is to grow assets at a rate which, when coupled with employer and employee contributions, satisfies promised benefits to MERS members. To achieve this objective, the Investment Committee allocates MERS’ assets with a strategic, long-term perspective and a high degree of prudence to reduce risk by:
• Exceeding the actuarial investment assumption on a long-term basis, which is currently 7.75%;
• Maintaining adequate liquidity to pay promised benefits;
• Adopting a strategic asset allocation plan that reflects current and future liabilities, minimizes volatility, and maximizes the long-term total rate of return;
• Minimizing the costs associated with the implementation of the asset allocation through the efficient use of internal and external resources;
• Maintaining above median peer rankings for the 10-year time period; and
• Exceeding the return of the Fund’s Policy Benchmark. The Policy Benchmark currently consists of 45% Russell 3000, 25% Bloomberg Barclays Global Aggregate Bond Index, 20% MSCI ACWI IMIex-US, and 10% Bloomberg Barclays Global Aggregate ex US.
Performance Versus Custom Benchmarks as of December 31, 2018 (gross of fees)
10%
-4%
8%
-6%
6%
4%
2%
0%1 Year
Perf
orm
ance
Ret
urn
Perc
enta
ge
3 Year 5 Year 7 Year 10 Year
6.73%
MER
S
5.50%
Custo
m B
ench
mark
7.75%
Actu
ary
Rate
3.34%
Cust
om B
ench
7.75%
Actu
ary
Rate
5.16%
MER
S
5.98%
Cust
om B
ench
mar
k7.75%
Actu
ary
Rate
7.39%
MER
S
7.79%
Cust
om B
ench
mar
k
7.75%
Actu
ary
Rate
8.51%
MER
S
7.75%
Actu
ary
Rate
-5.36%
Cust
om B
ench
mar
k
-3.51%
MER
S
-2%
8 | www.mersofmich.com
MERS INVESTMENT HIGHLIGHTS
• MERS Total Portfolio returned -3.51% gross of fees for the year, outperforming its policy benchmark by 1.85%. The five year return of 5.16% outperformed the policy benchmark by 1.82% on an annualized basis. The portfolio returned 8.51% at the 10-year mark and has outperformed the policy benchmark in all time periods.
• The Office of Investments completed work on a Valuation Based Allocation approach to its investment program.
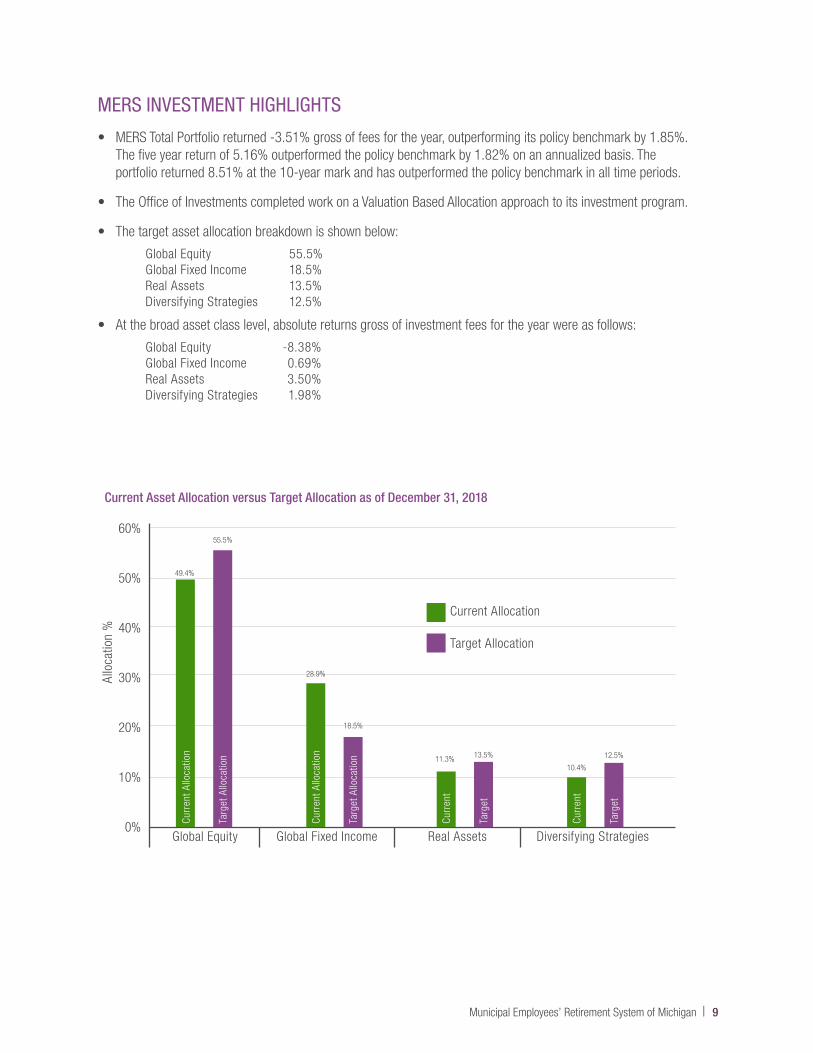
• The target asset allocation breakdown is shown below:
Global Equity 55.5% Global Fixed Income 18.5%Real Assets 13.5% Diversifying Strategies 12.5%
• At the broad asset class level, absolute returns gross of investment fees for the year were as follows:
Global Equity -8.38%Global Fixed Income 0.69%Real Assets 3.50%Diversifying Strategies 1.98%
Current Asset Allocation versus Target Allocation as of December 31, 2018
60%
50%
40%
30%
20%
0%
10%
Global Equity Global Fixed Income Real Assets Diversifying Strategies
49.4%
55.5%
Allo
catio
n %
28.9%
18.5%
11.3% 13.5%
10.4%
12.5%
Current Allocation
Target Allocation
Curr
ent A
lloca
tion
Targ
et A
lloca
tion
Targ
et A
lloca
tion
Targ
et
Targ
et
Curr
ent A
lloca
tion
Curr
ent
Curr
ent
Municipal Employees’ Retirement System of Michigan | 9
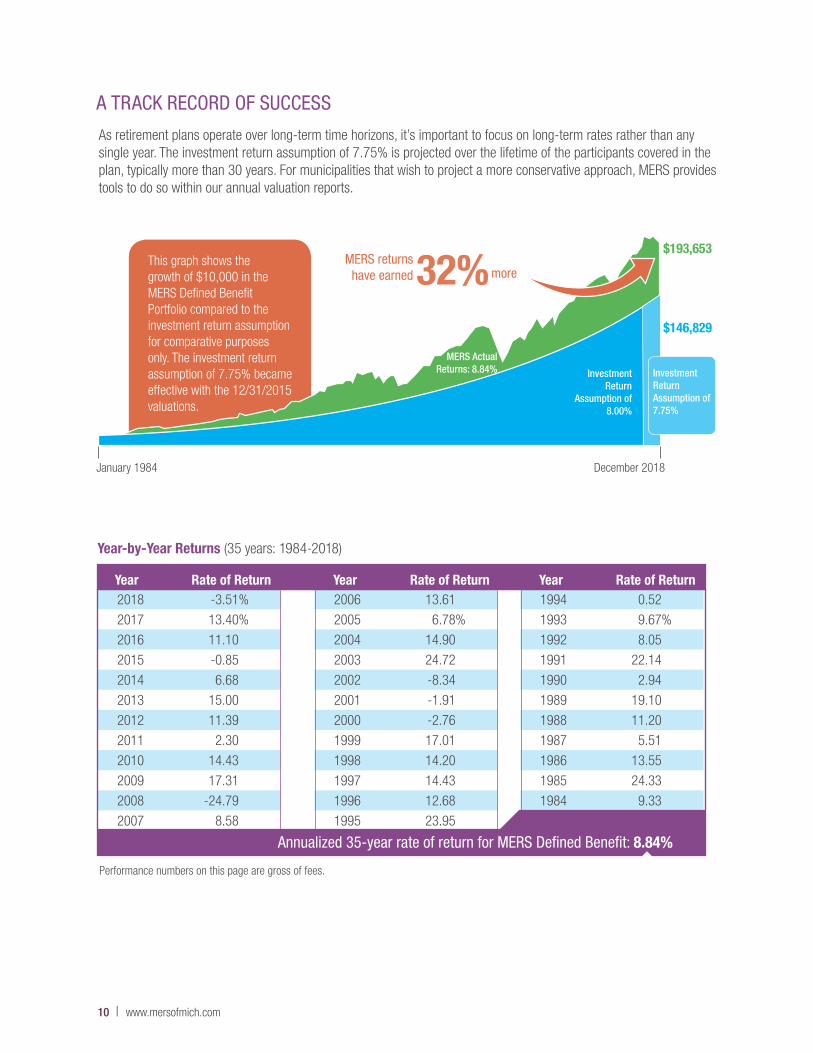
A TRACK RECORD OF SUCCESS
As retirement plans operate over long-term time horizons, it’s important to focus on long-term rates rather than any single year. The investment return assumption of 7.75% is projected over the lifetime of the participants covered in the plan, typically more than 30 years. For municipalities that wish to project a more conservative approach, MERS provides tools to do so within our annual valuation reports.
MERS Actual Returns: 8.84%
$193,653
$146,829
January 1984 December 2018
MERS returns have earned32%more
This graph shows the growth of $10,000 in the MERS Defined Benefit Portfolio compared to the investment return assumption for comparative purposes only. The investment return assumption of 7.75% became effective with the 12/31/2015 valuations.
Investment Return
Assumption of 8.00%
Investment Return Assumption of 7.75%
10 | www.mersofmich.com
2006 13.61
2005 6.78%
2004 14.90
2003 24.72
2002 -8.34
2001 -1.91
2000 -2.76
1999 17.01
1998 14.20
1997 14.43
1996 12.68
1995 23.95
Year-by-Year Returns (35 years: 1984-2018)
2018 -3.51%
2017 13.40%
2016 11.10
2015 -0.85
2014 6.68
2013 15.00
2012 11.39
2011 2.30
2010 14.43
2009 17.31
2008 -24.79
2007 8.58
1994 0.52
1993 9.67%
1992 8.05
1991 22.14
1990 2.94
1989 19.10
1988 11.20
1987 5.51
1986 13.55
1985 24.33
1984 9.33
Annualized 35-year rate of return for MERS Defined Benefit: 8.84%
Performance numbers on this page are gross of fees.
Year Rate of ReturnYear Rate of ReturnYear Rate of Return
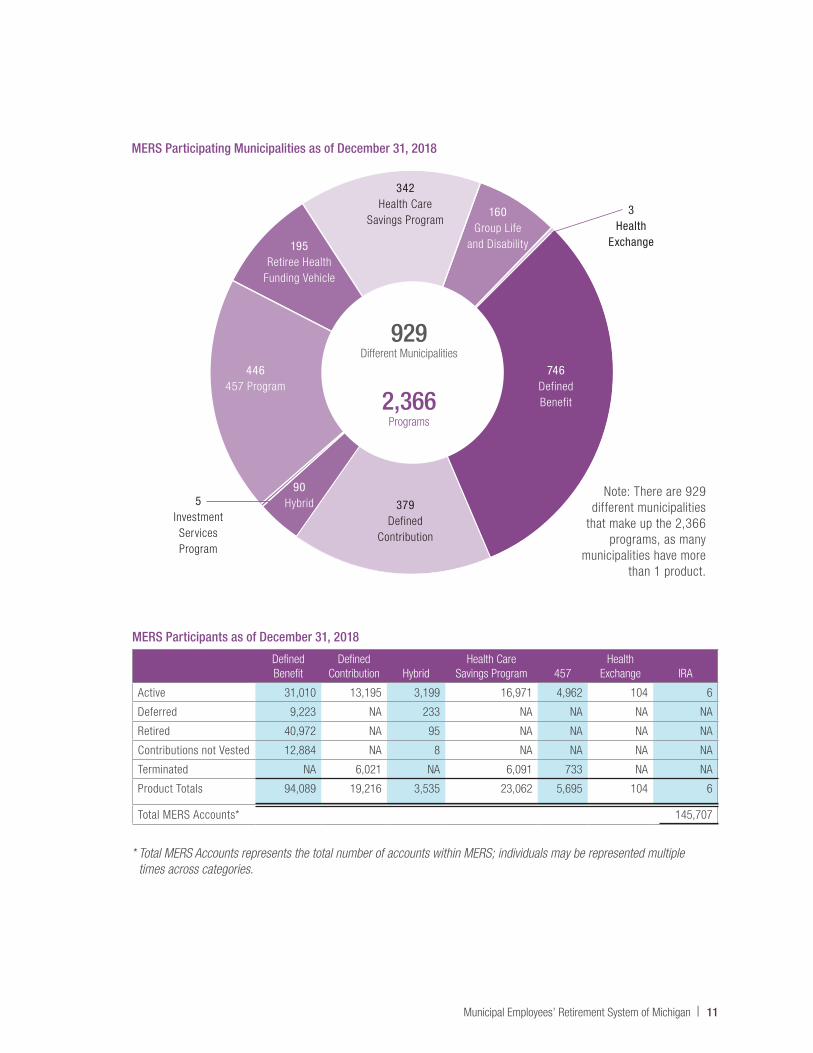
Defined Benefit
Defined Contribution Hybrid
Health Care Savings Program 457
Health Exchange IRA
Active 31,010 13,195 3,199 16,971 4,962 104 6
Deferred 9,223 NA 233 NA NA NA NA
Retired 40,972 NA 95 NA NA NA NA
Contributions not Vested 12,884 NA 8 NA NA NA NA
Terminated NA 6,021 NA 6,091 733 NA NA
Product Totals 94,089 19,216 3,535 23,062 5,695 104 6
Total MERS Accounts* 145,707
MERS Participating Municipalities as of December 31, 2018
Note: There are 929 different municipalities
that make up the 2,366 programs, as many
municipalities have more than 1 product.
746Defined Benefit
379Defined
Contribution
160Group Life
and Disability
90Hybrid
446457 Program
195Retiree Health
Funding Vehicle
342Health Care
Savings Program
5Investment Services Program
3Health
Exchange
929Different Municipalities
2,366Programs
* Total MERS Accounts represents the total number of accounts within MERS; individuals may be represented multiple times across categories.
MERS Participants as of December 31, 2018
Municipal Employees’ Retirement System of Michigan | 11
This publication contains a summary description of MERS benefits, policies or procedures. MERS has made every effort to ensure that the information provided is accurate and up to date (as of the date of publication 06/04/2019). If this publication conflicts with the relevant provisions of the Plan Document, the Plan Document Controls. MERS, as a governmental plan, is exempted by state and federal law from registration with the SEC. However, it employs registered investment advisors to manage the trust fund in compliance with Michigan Public Employee Retirement System Investment Act. Past Performance is not a guarantee of future returns. Please make independent investment decisions carefully and seek the assistance of independent experts when appropriate.
1134 Municipal Way Lansing, Michigan 48917
800.767.MERS (6377) www.mersofmich.com
PUB 8746 2019-06-04
12 | www.mersofmich.com
![OUR FINANCIAL HIGHLIGHTS Summary...OUR FINANCIAL HIGHLIGHTS [MILLIONS OF DOLLARS, EXCEPT PER SHARE AMOUNTS] This summary annual report format provides condensed financial statement](https://img.pdfslide.net/doc/110x75/5f9ec48484ea4414e6083932/our-financial-highlights-summary-our-financial-highlights-millions-of-dollars.jpg)