Embed Size (px)
Citation preview
NUREG/CR-6360
Summary of Air Permeability Data From Single-Hole Injection Tests in Unsaturated Fractured Tuffs at the Apache Leap Research Site: Results of Steady-State Test Interpretation
Manuscript Completed: May 1995 Date Published: March 1996
Prepared by A. G. Guzman, A. M. Geddis M. J. Henrich, C. F. Lohrstorfer, S. P. Neuman
Department of Hydrology and Water Resources The University of Arizona Tuscon, AZ 85721
T. Nicholson, NRC Project Manager
Prepared for Division of Regulatory Applications Office of Nuclear Regulatory Research U.S. Nuclear Regulatory Commission Washington, DC 20555-0001 NRC Job Code L1282
STER
DBTRIMONOF THIS DOGUfcreNT & UMMTED ,

DISCLAIMER
Portions of this document may be illegible in electronic image products. Images are produced from the best available original document
ABSTRACT
This document summarizes air permeability estimates obtained from single hole pneumatic
injection tests in unsaturated fractured tuffs at the Covered Borehole Site (CBS) within the larger
Apache Leap Research Site (ALRS). Only permeability estimates obtained from a steady state
interpretation of relatively stable pressure and flow rate data are included. Most of the reported
data were produced as part of work culminating in a doctoral dissertation, entitled "In-situ Air
Permeability Tests and Their Interpretation in Unsaturated Fractured Tuff," by Guzman (1995).
This dissertation complements the present report by providing additional details about the
methods of testing, test interpretation, and statistical analysis of the data. Tests were conducted
in five boreholes inclined at 45° to the horizontal, and one vertical borehole. Five of the boreholes
are 30 m long, one has a length of 45 m. Air injection was accomplished using a straddle packer
assembly. Over 180 borehole segments were tested by setting the packers 1 m apart. Additional
tests were conducted in segments of lengths 0.5,2.0, and 3.0 m in one borehole, and 2.0 m in
another borehole, bringing the total number of tests to over 270. Tests were conducted by
maintaining a constant injection rate until air pressure became relatively stable and remained so
for some time. The injection rate was then incremented by a constant value and the procedure
repeated. Three or more such incremental steps were conducted in each borehole segment while
recording the air injection rate, pressure, temperature, and relative humidity. For each relatively
stable period of injection rate and pressure, air permeability was estimated by treating the rock
around each test interval as a uniform, isotropic porous medium within which air flows as a single
phase under steady state, in a pressure field exhibiting prolate spheroidal symmetry. For each
permeability estimate we list the corresponding injection rate, pressure, temperature and relative
humidity. We also present selected graphs which show how the latter quantities vary with time;
logarithmic plots of pressure versus time which demonstrate the importance of borehole storage
effects during the early transient portion of each incremental test period; and semilogarithmic
plots of pressure versus recovery time at the end of each test sequence. A description of field
operating procedures used to insure compliance with QA/QC requirements is included.
iii
Table of Contents
ABSTRACT iii
LIST OF FIGURES vi
LIST OF TABLES vii
ACKNOWLEDGEMENTS viii
FOREWORD ix
0. EXECUTIVE SUMMARY 1
1. SITE DESCRIPTION AND BOREHOLE LOCATION 2
2. DESCRIPTION OF TESTS 8
3. ESTIMATION OF PERMEABILITY 10
4. DESCRIPTION OF DATA TABLES AND SELECTED GRAPHS 11 4.1 Description ofData Tables in Appendix B 11
4.2 Description of Appendix C 12
REFERENCES CITED 17
APPENDLX A: Field Operating Procedures A-l A.1 Testing Procedures and Equipment for Air Permeability Measurements A-2 A2 Zero Permeability Test A-6
APPENDLXB: Air Permeability Data Tables B-l
Table B.l Permeability measurements for borehole V2 - 1.0 m scale B-2
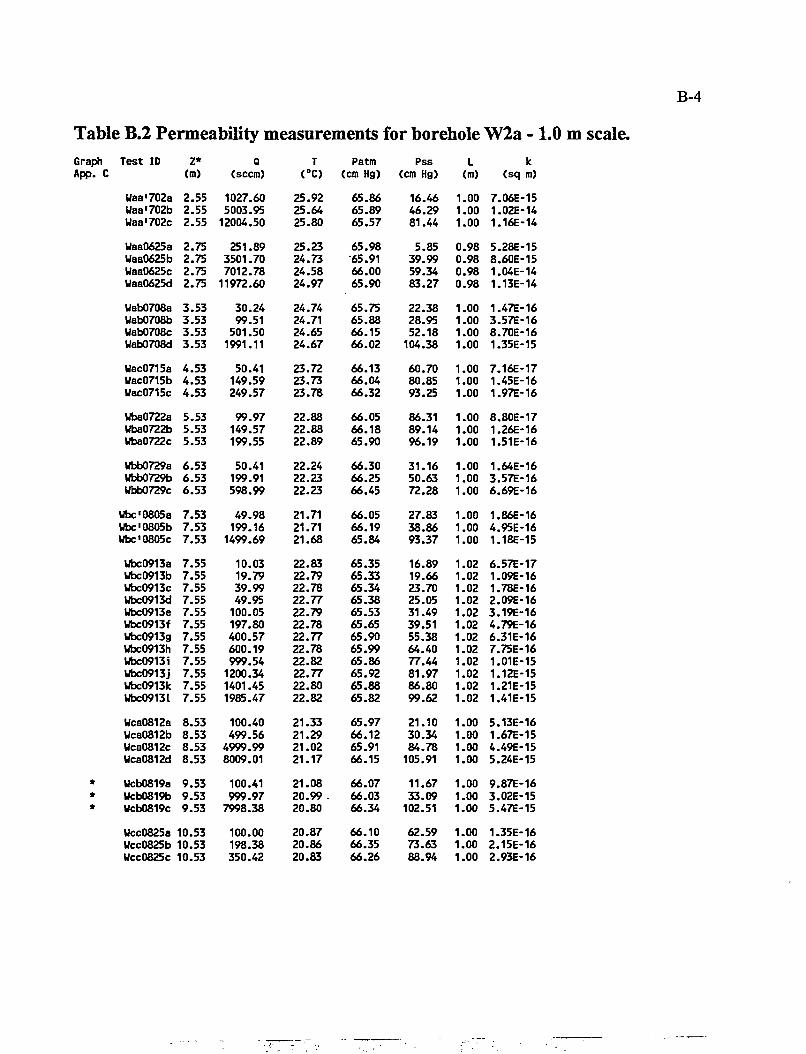
Table B.2 Permeability measurements for borehole W2a - 1.0 m scale B-4
Table B.3 Permeability measurements for borehole X2 - 1.0 m scale B-8
Table B.4 Permeability measurements for borehole X2 - 2.0 m scale B-l 1
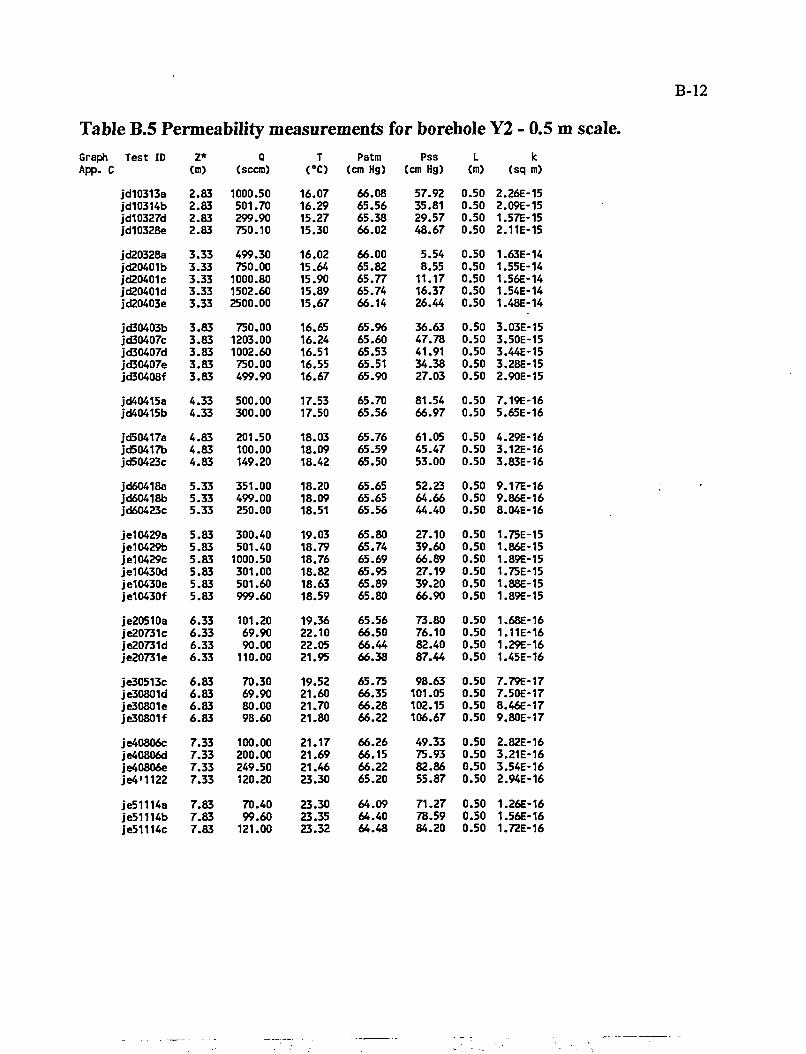
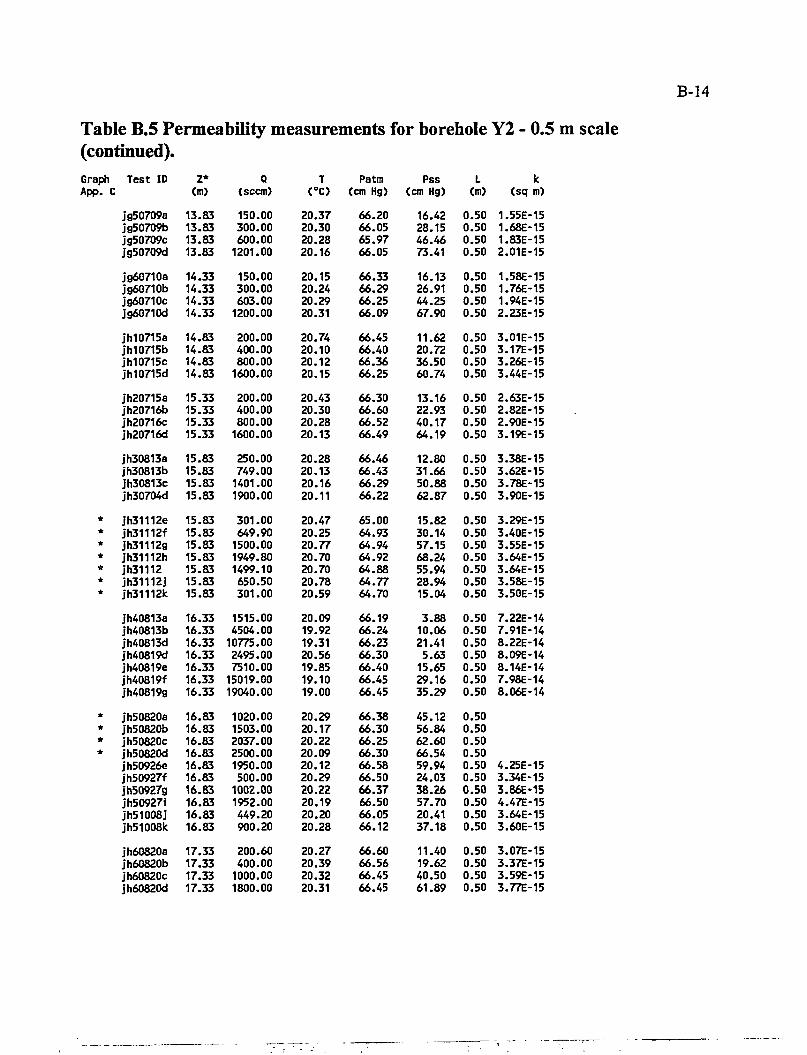
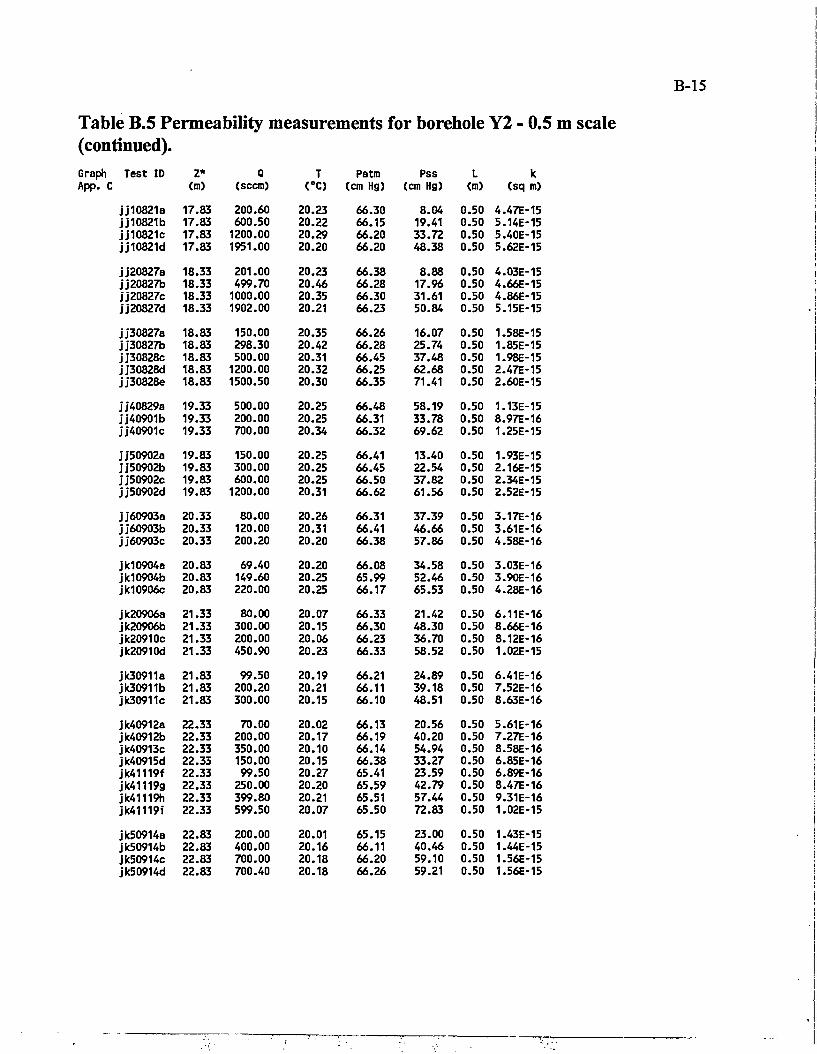
Table B.5 Permeability measurements for borehole Y2 - 0.5 m scale B-12
iv
Table of Contents - continued
Table B.6 Permeability measurements for borehole Y2 - 1.0 m scale B-17
Table B.7 Permeability measurements for borehole Y2 - 2.0 m scale B-20
Table B.8 Permeability measurements for borehole Y2 - 3.0 m scale B-21
Table B.9 Permeability measurements for borehole Y3 - 1.0 m scale B-22
Table B. 10 Permeability measurements for borehole Z2 - 1.0 m scale B-26
APPENDIX C: Graphs of Transient Data for Selected Tests C-l
Graphs from TableB.l V2 - 1.0 mData C-2
Graphs from Table B.2 W2a - 1.0 m Data C-12
Graphs from Table B.3 X2- 1.0 mData C-24
Graphs from TableB.4X2-2.0 mData C-34
Graphs from Table B.5 Y2 - 0.5 m Data C-46
Graphs from Table B.6 Y2 - 1.0 m Data C-58
Graphs from Table B.7 Y2-2.0 mData C-72
Graphs from Table B.8 Y2-3.0 mData C-84
Graphs from Table B.9 Y3 - 1.0 mData C-96
Graphs from Table B. 10 Z2- 1.0 mData C-120
v
LIST OF FIGURES
Figure 1.1 Location map for the Apache Leap Research Site (ALRS) 3
Figure 1.2 Schematic plan view of pertinent borehole locations at the ALRS-CBS 5
Figure 1.3 Schematic 3D view of 1.0 meter air permeability test locations 7
Figure 2.1 Schematic diagram of the air injection system 9
Figure 4.1 Example of a Test plot 14
Figure 4.2 Example of a Recovery plot (top) and a Storage plot (bottom) 15
Figure 4.3 Example of an atypical Test plot 16
Graphs from Table B.l V2 - 1.0 m Data C-2
Graphs from Table B.2 W2a - 1.0 m Data C-12
Graphs from TableB.3 X2 - 1.0 mData C-24
Graphs from Table B.4 X2 - 2.0 m Data C-34
Graphs from TableB.5 Y2 - 0.5 mData C-46
Graphs from Table B.6Y2- 1.0 mData C-58
Graphs from TableB.7 Y2 - 2.0 mData C-72
Graphs from Table B.8 Y2 - 3.0 m Data C-84
Graphs from Table B.9Y3 - l.OmData C-96
Graphs from Table B.10Z2 - 1.0 mData C-120
vi
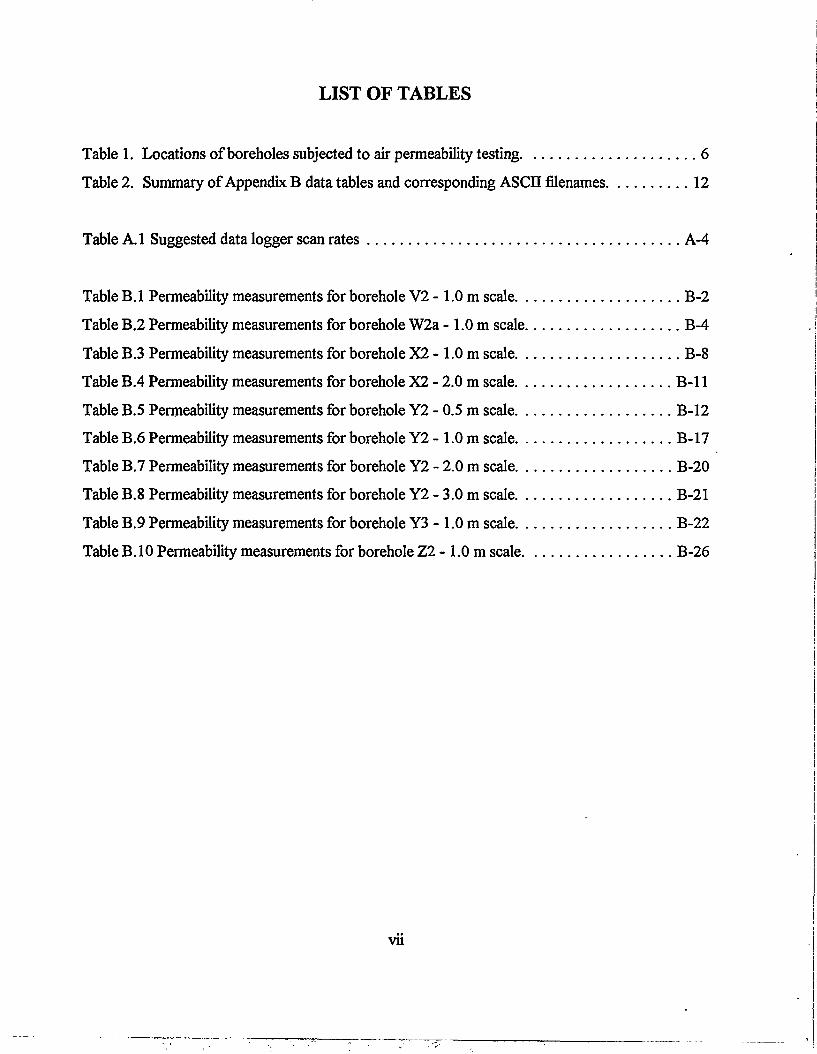
LIST OF TABLES
Table 1. Locations of boreholes subjected to air permeability testing 6
Table 2. Summary of Appendix B data tables and corresponding ASCII filenames 12
Table A.1 Suggested data logger scan rates A-4
Table B.l Permeability measurements for borehole V2 - 1.0 m scale B-2
Table B.2 Permeability measurements for borehole W2a - 1.0 m scale B-4 Table B.3 Permeability measurements for borehole X2 - 1.0 m scale B-8 Table B.4 Permeability measurements for borehole X2 - 2.0 m scale B-l 1 Table B.5 Permeability measurements for borehole Y2 - 0.5 m scale B-12 Table B.6 Permeability measurements for borehole Y2 - 1.0 m scale B-17 Table B.7 Permeability measurements for borehole Y2 - 2.0 m scale B-20 Table B.8 Permeability measurements for borehole Y2 - 3.0 m scale B-21 Table B.9 Permeability measurements for borehole Y3 - 1.0 m scale B-22 Table B.10 Permeability measurements for borehole Z2 - 1.0 m scale B-26
vii

ACKNOWLEDGEMENTS
The data included in this report have been collected by The University of Arizona, Department of Hydrology and Water Resources, for the U.S. Nuclear Regulatory Commission (NRC) under contract L1283. The NRC Project Monitor was Mr. Thomas J. Nicholson, and the Principal Investigators were Dr. Randy L. Bassett, Dr. Shlomo P. Neuman, and Dr. Peter J. Wierenga. The work led to a doctoral dissertation by Amado G.-Guzman under the supervision of Dr. Shlomo P. Neuman. Valuable assistance during the early stages of instrument development and field testing was provided by Ms. Ingrid Anderson, Mr. Bob Lien, and Mr. Charles Lohrstorfer. Numerous graduate students helped with the collection of field data. During the last two years of the project, much of the field work was conducted by Mr. Michael Henrich with able technical support from Mr. Dick Thompson. Support for this work by the U.S. Nuclear Regulatory Commission is gratefully acknowledged.
viii

FOREWORD
This technical report was prepared by The University of Arizona under their research project with the Waste Management Branch in the Office of Nuclear Regulatory Research (FIN L1282). The report provides data summaries and research results from air permeability experiments conducted in the field using single-hole pneumatic injection tests in unsaturated, heterogeneous, fractured rock. Specifically, the report includes tables of over 270 air permeability estimates and corresponding field data obtained from controlled tests in packed-off intervals of the shallow boreholes at the Apache Leap Research Site. The provided tables only list permeability estimates interpreted by means of steady-state formulae, and data which are relatively stable in time during the corresponding tests periods. Data retrieval instructions for accessing the tables in ASCII format through an anonymous FTP connection are given. Selected plots of measured variables versus time are also included to illustrate transient effects during the air injection tests. The research reported provides insights into conducting and interpreting single-hole air injection tests for estimating permeability values for partially saturated, heterogeneous, fractured rock. The lessons learned are relevant to site characterization and data analysis issues related to modeling unsaturated flow and transport in fractured rock.
NUREG/CR-6360 is not a substitute for NRC regulations, and compliance is not required. The approaches and/or methods described in this NUREG/CR are provided for information only. Publication of this report does not necessarily constitute NRC approval or agreement with the information contained herein. Use of product or trade names is for identification purposes only and does not constitute endorsement by the NRC or The University of Arizona.
ix
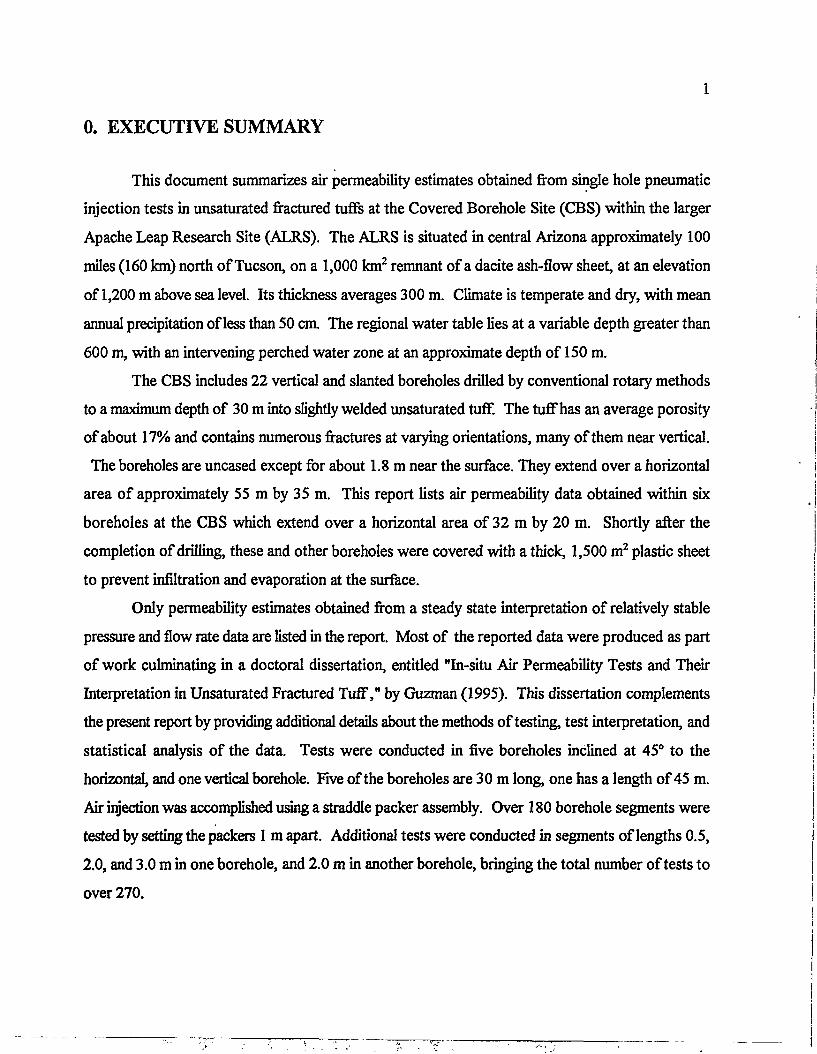
0. EXECUTIVE SUMMARY
1
This document summarizes air permeability estimates obtained from single hole pneumatic
injection tests in unsaturated fractured tuffs at the Covered Borehole Site (CBS) within the larger
Apache Leap Research Site (ALRS). The ALRS is situated in central Arizona approximately 100
miles (160 km) north of Tucson, on a 1,000 km2 remnant of a dacite ash-flow sheet, at an elevation
of 1,200 m above sea level. Its thickness averages 300 m. Climate is temperate and dry, with mean
annual precipitation of less than 50 cm. The regional water table lies at a variable depth greater than
600 m, with an intervening perched water zone at an approximate depth of 150 m.
The CBS includes 22 vertical and slanted boreholes drilled by conventional rotary methods
to a maximum depth of 30 m into slightly welded unsaturated tuff. The tuff has an average porosity
of about 17% and contains numerous fractures at varying orientations, many of them near vertical.
The boreholes are uncased except for about 1.8 m near the surface. They extend over a horizontal
area of approximately 55 m by 35 m. This report lists air permeability data obtained within six
boreholes at the CBS which extend over a horizontal area of 32 m by 20 m. Shortly after the
completion of drilling, these and other boreholes were covered with a thick, 1,500 m2 plastic sheet
to prevent infiltration and evaporation at the surface.
Only permeability estimates obtained from a steady state interpretation of relatively stable
pressure and flow rate data are listed in the report. Most of the reported data were produced as part
of work culminating in a doctoral dissertation, entitled "In-situ Air Permeability Tests and Their
Interpretation in Unsaturated Fractured Tuff," by Guzman (1995). This dissertation complements
the present report by providing additional details about the methods of testing, test interpretation, and
statistical analysis of the data. Tests were conducted in five boreholes inclined at 45° to the
horizontal, and one vertical borehole. Five of the boreholes are 30 m long, one has a length of 45 m.
Air injection was accomplished using a straddle packer assembly. Over 180 borehole segments were
tested by setting the packers 1 m apart. Additional tests were conducted in segments of lengths 0.5,
2.0, and 3.0 m in one borehole, and 2.0 m in another borehole, bringing the total number of tests to
over 270.
2
Tests were conducted by maintaining a constant injection rate until air pressure became relatively stable and remained so for some time. The injection rate was then incremented by a constant value and the procedure repeated. Three or more such incremental steps were conducted in each borehole segment while recording the air injection rate, pressure, temperature, and relative humidity. For each relatively stable period of injection rate and pressure, air permeability was estimated by treating the rock around each test interval as a uniform, isotropic porous medium within which air flows as a single phase under steady state, in a pressure field exhibiting prolate spheroidal symmetry. For each permeability estimate we list the corresponding injection rate, pressure, temperature and relative humidity.
The report also includes selected plots which illustrate how the latter quantities vary with time; logarithmic plots of pressure versus time which demonstrate the importance of borehole storage effects during the early transient portion of each incremental test period; and semilogarithmic plots of pressure versus recovery time at the end of each test sequence. A description of field operating procedures used to insure compliance with QA/QC requirements is included.
1. SITE DESCRIPTION AND BOREHOLE LOCATION
The Apache Leap Research Site (ALRS) is situated in central Arizona approximately 100 miles (160 km) north of Tucson, on a 1,000 km2 remnant of a dacite ash-flow sheet (Peterson, 1961), at an elevation of 1,200 m above sea level. Its thickness is highly variable and averages about 300 m. Climate is temperate and dry, with mean annual precipitation of less than 50 cm. The regional water table lies at a variable depth greater than 600 m, with an intervening perched water zone at an approximate depth of 150 m.
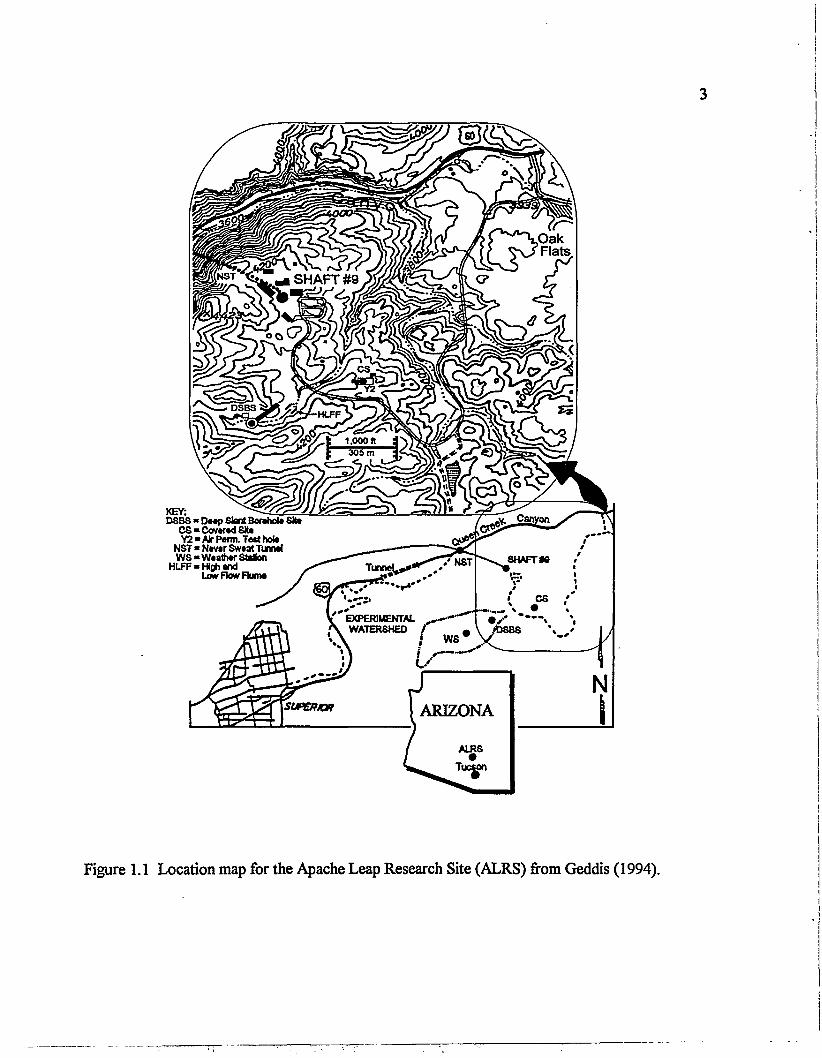
Figure 1.1 indicates two borehole research sites currently in operation: (1) the Covered Boreholes Site (CBS) with the slanted borehole Y2 as reference, and (2) the Deep Boreholes Site (DBS) with a deeper slanted borehole as references. The CBS is contained in the vadose zone, in an. upper layer of slightly welded tuff with an average porosity of approximately 17% (Rasmussen, et al., 1990; Geddis, 1994). The predominant fracture set is near vertical, but fractures exist at all
KEY: DfiBS » D M P Slant BorahoU Site
C S * Covered SM* Y2-Air Perm. Tu t hole
NST « Nevtr Swtat Tumol WS-Waathtr Station
HLFF-Hi^and Low Flow Fluma
Figure 1.1 Location map for the Apache Leap Research Site (ALRS) from Geddis (1994).
4
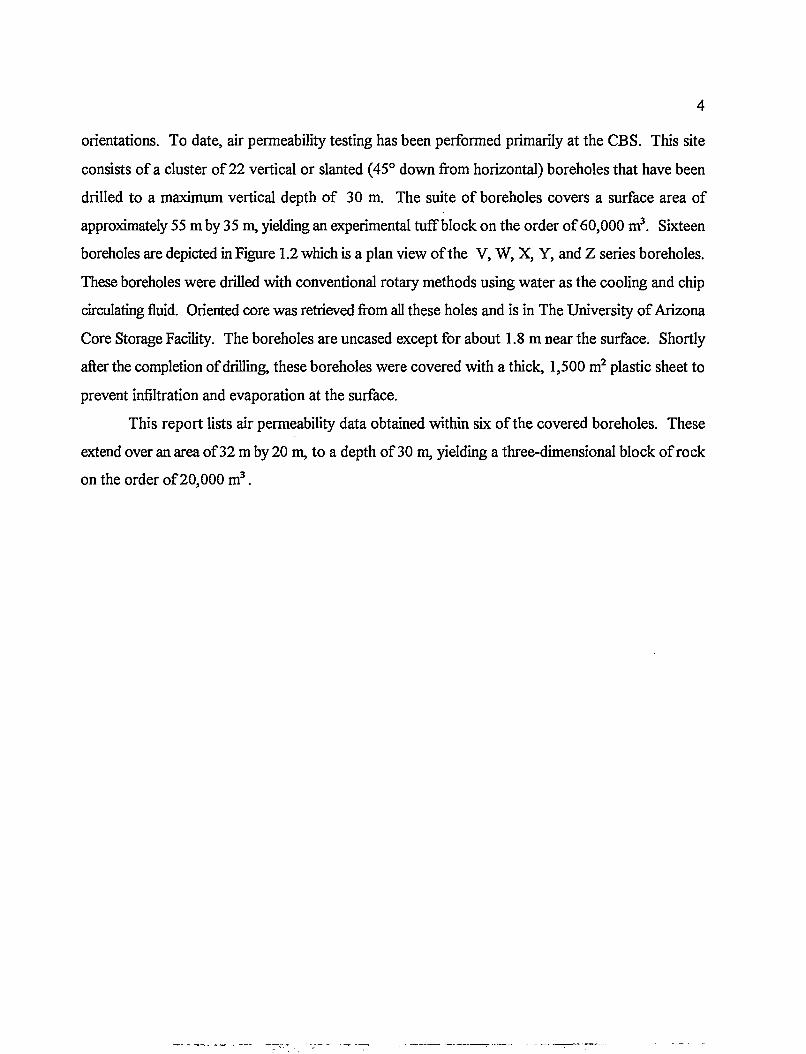
orientations. To date, air permeability testing has been performed primarily at the CBS. This site consists of a cluster of 22 vertical or slanted (45° down from horizontal) boreholes that have been drilled to a maximum vertical depth of 30 m. The suite of boreholes covers a surface area of approximately 55 m by 35 m, yielding an experimental tuffblock on the order of 60,000 m3. Sixteen boreholes are depicted in Figure 1.2 which is a plan view of the V, W, X, Y, and Z series boreholes. These boreholes were drilled with conventional rotary methods using water as the cooling and chip circulating fluid. Oriented core was retrieved from all these holes and is in The University of Arizona Core Storage Facility. The boreholes are uncased except for about 1.8 m near the surface. Shortly after the completion of drilling, these boreholes were covered with a thick, 1,500 m2 plastic sheet to prevent infiltration and evaporation at the surface.
This report lists air permeability data obtained within six of the covered boreholes. These extend over an area of 32 m by 20 m, to a depth of 30 m, yielding a three-dimensional block of rock on the order of 20,000 m 3.
35
Plan View of Covered Site Boreholes Large Circles Indicate Boreholes Tested by the Air Injection method
3 0 -
© W3
N
E, M> 25 -j
20- |
W2 ©
15 -
10 -
5 -
V1 ©
W1 ©
X1 ©
(V2) V3 W ® Y1
©
'X2 ©
©
X3 ©
Z3 i©
-r 10
- i —
15
XAxis(m)
Z1 ©
5 I
20 I
25 i
30 35
Plastic Cover
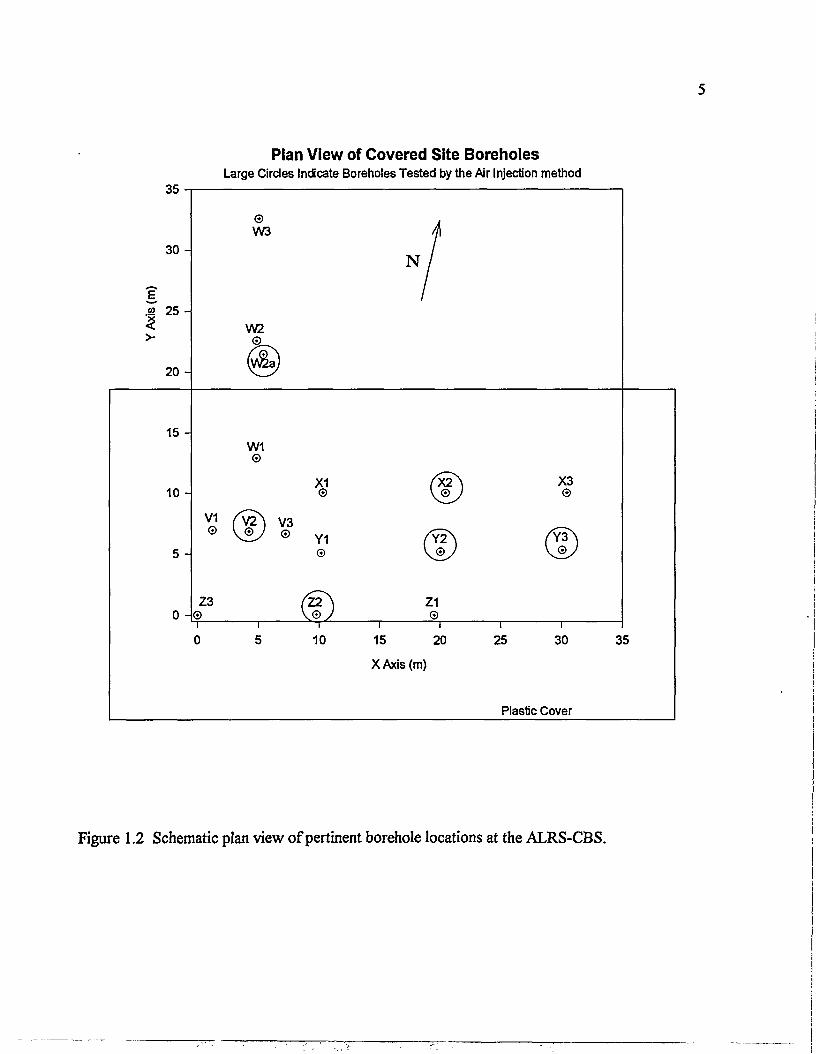
Figure 1.2 Schematic plan view of pertinent borehole locations at the ALRS-CBS.
6
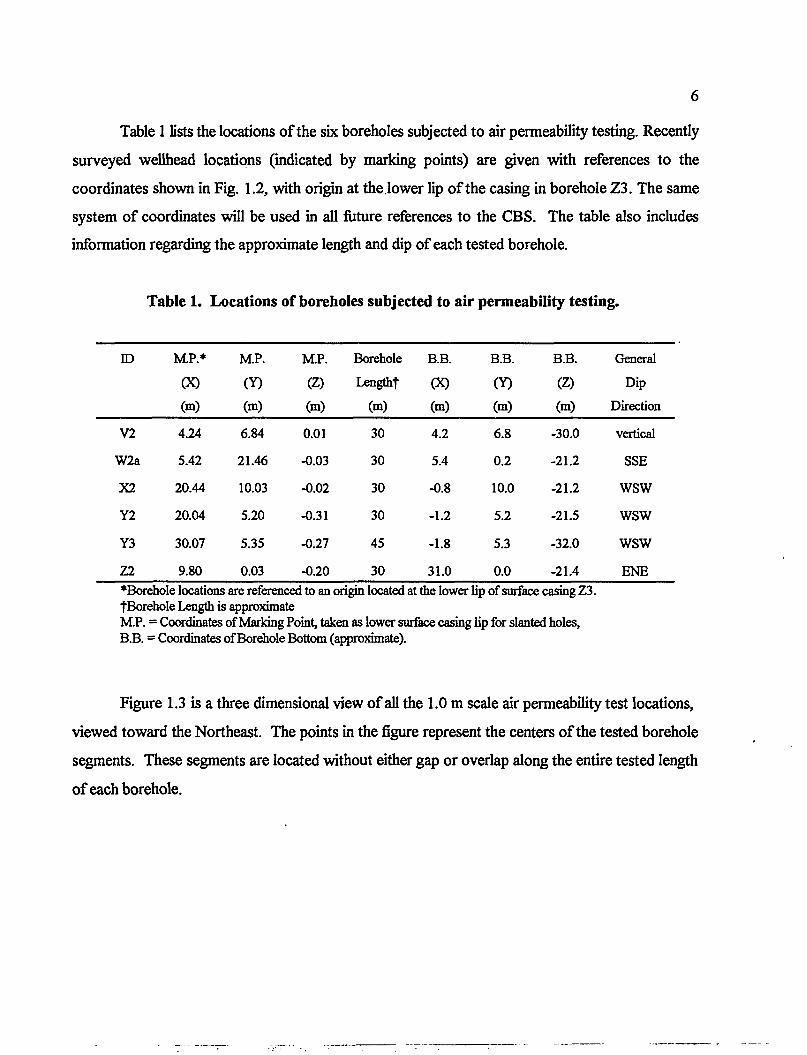
Table 1 lists the locations of the six boreholes subjected to air permeability testing. Recently surveyed wellhead locations (indicated by marking points) are given with references to the coordinates shown in Fig. 1.2, with origin at the.lower lip of the casing in borehole Z3. The same system of coordinates will be used in all future references to the CBS. The table also includes information regarding the approximate length and dip of each tested borehole.
Table 1. Locations of boreholes subjected to air permeability testing.
ID MP.* MP. MP. Borehole B.B. B.B. B.B. General
(X) (Y) (Z) Lengthf (X) 00 (Z) Dip
(m) (m) (m) (m) (m) (m) (m) Direction
V2 4.24 6.84 0.01 30 4.2 6.8 -30.0 vertical
W2a 5.42 21.46 -0.03 30 5.4 0.2 -21.2 SSE
X2 20.44 10.03 -0.02 30 -0.8 10.0 -21.2 WSW
Y2 20.04 5.20 -0.31 30 -1.2 5.2 -21.5 WSW
Y3 30.07 5.35 -0.27 45 -1.8 5.3 -32.0 WSW
Z2 9.80 0.03 -0.20 30 31.0 0.0 -21.4 ENE •Borehole locations are referenced to an origin located at the lower lip of surface casing Z3. fBorehole Length is approximate MP. = Coordinates of Marking Point, taken as lower surface casing Up for slanted holes, B.B. = Coordinates of Borehole Bottom (approximate).
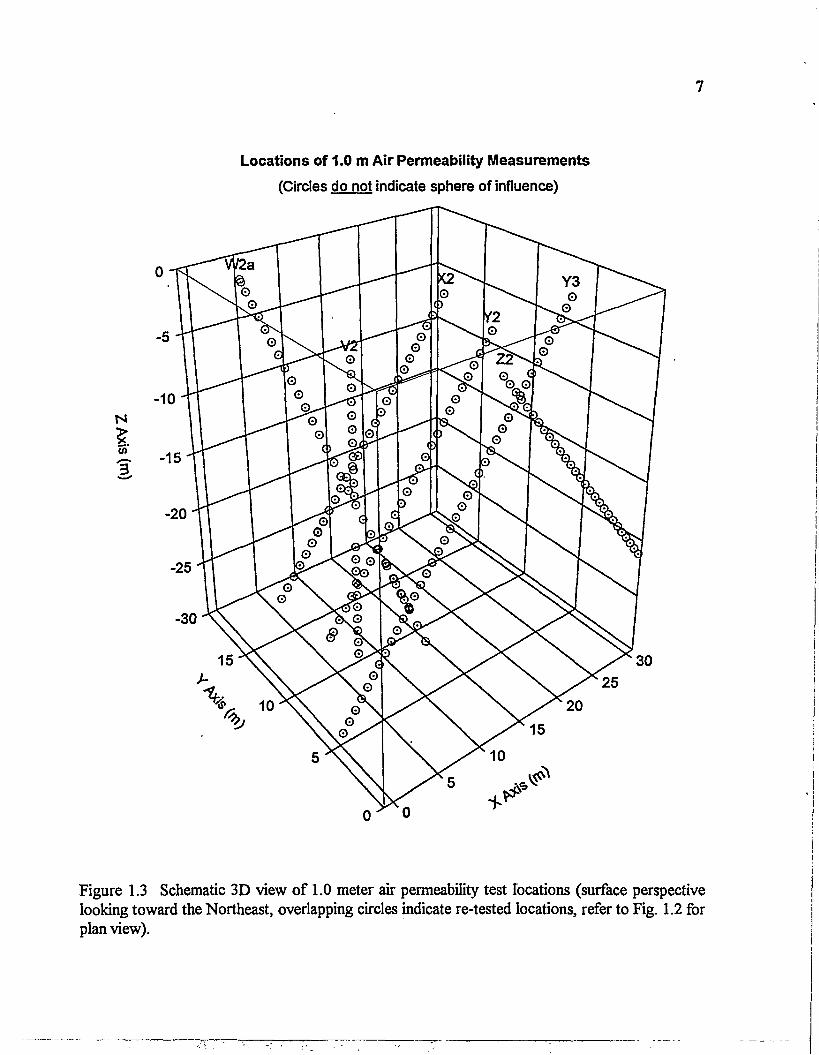
Figure 1.3 is a three dimensional view of all the 1.0 m scale air permeability test locations,
viewed toward the Northeast. The points in the figure represent the centers of the tested borehole
segments. These segments are located without either gap or overlap along the entire tested length
of each borehole.
7
Locations of 1.0 m Air Permeability Measurements (Circles do not indicate sphere of influence)
Figure 1.3 Schematic 3D view of 1.0 meter air permeability test locations (surface perspective looking toward the Northeast, overlapping circles indicate re-tested locations, refer to Fig. 1.2 for plan view).
2. DESCRIPTION OF TESTS
8
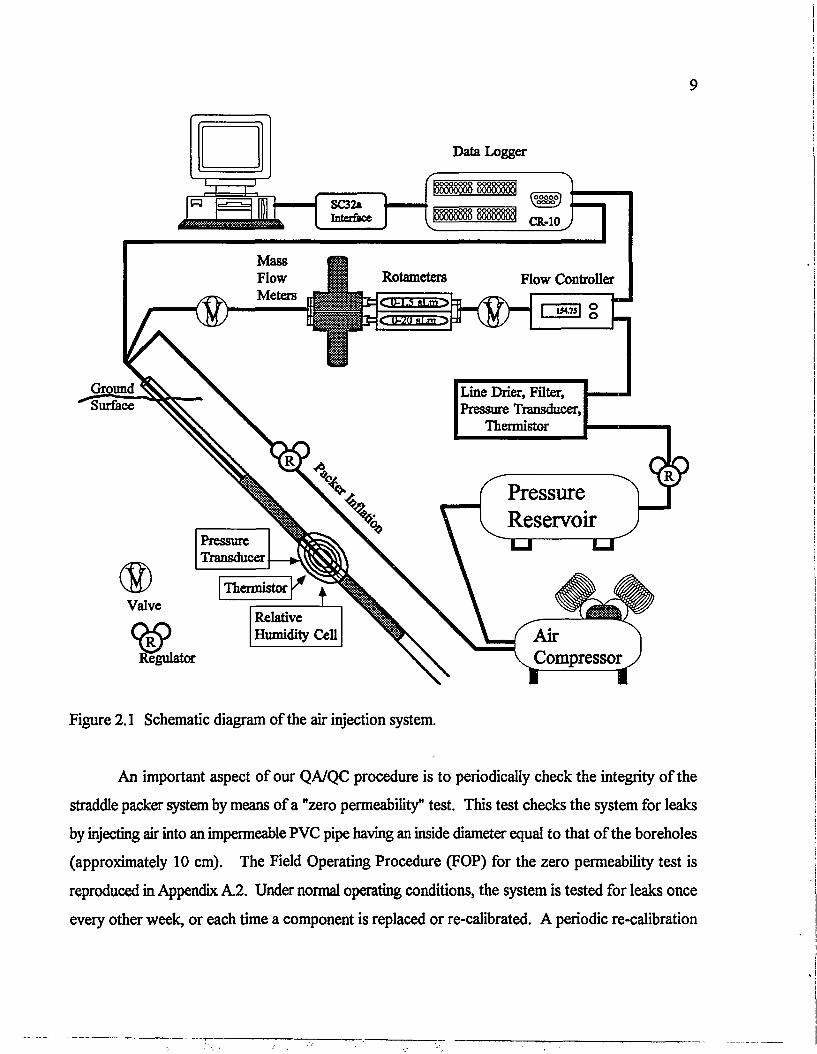
Figure 2.1 is a schematic diagram of the air injection system. It consists of a straddle packer assembly made out of two rubber bladders, a set of flow meters and flow controllers, pressure regulators and valves, and an electronic monitoring system to collect real-time field data. The distance between bladders can be adjusted to test different interval lengths. Interval pressure (P), temperature (T), and relative humidity (RH) are measured in the injection interval. A series of flow controllers and flow meters on the surface supply a constant injection flow rate (Q) that can be adjusted between 10 and 20,000 standard cmVmin (seem).
Test location is defined as distance along a borehole from the marking point listed in Table 1 to the middle of the test (injection) interval. A Field Operating Procedure outlining the steps taken during an air injection test is included in Appendix A. 1. Prior to each air injection test, the packers are inflated to isolate the test interval, and the resulting pressure is allowed to dissipate back to atmospheric. The test commences by injecting air into the packed off interval at a constant rate Q. This continues until the pressure P stabilizes so that it increases by not more than 1 mm Hg in 30 minutes. The test continues by incrementing Q and monitoring P until it attains a new stable value. Most tests include three or more such step increments of Q. Injection is then discontinued and the pressure allowed to recover to atmospheric. The packers are deflated, the instrument is repositioned in the borehole, and testing resumes until the entire length of the borehole has been tested. We found that testing at multiple injection rates is essential to properly characterize rock permeability in the vicinity of each test interval (Guzman, 1995). The method has proved reliable in that repeated testing of selected intervals, over several years, has given highly reproducible permeability estimates (Guzman, 1995; Bassett, et al., 1994). This is due in part to a strict quality assurance and quality control (QA/QC) procedure at each stage of testing.
9
Data Logger
Figure 2.1 Schematic diagram of the air injection system.
An important aspect of our QA/QC procedure is to periodically check the integrity of the
straddle packer system by means of a "zero permeabilityM test. This test checks the system for leaks
by injecting air into an impermeable PVC pipe having an inside diameter equal to that of the boreholes
(approximately 10 cm). The Field Operating Procedure (FOP) for the zero permeability test is
reproduced in Appendix A.2. Under normal operating conditions, the system is tested for leaks once
every other week, or each time a component is replaced or re-calibrated. A periodic re-calibration
10
of the pressure transducers, and factory re-calibration of the electronic flow meters and controllers,
are performed as part of the QA/QC procedure.
3. ESTIMATION OF PERMEABILITY
When air is injected into a rock that contains water at partial saturation, the latter acts to block its movement. Hence the permeability one computes for the air is lower than one would compute in the absence of a water phase. It follows that the computed air permeability is less than the intrinsic permeability of the rock. Guzman (1995) was able to demonstrate computationally that the higher is the applied pressure during a test, the closer is the computed air permeability to this intrinsic value.
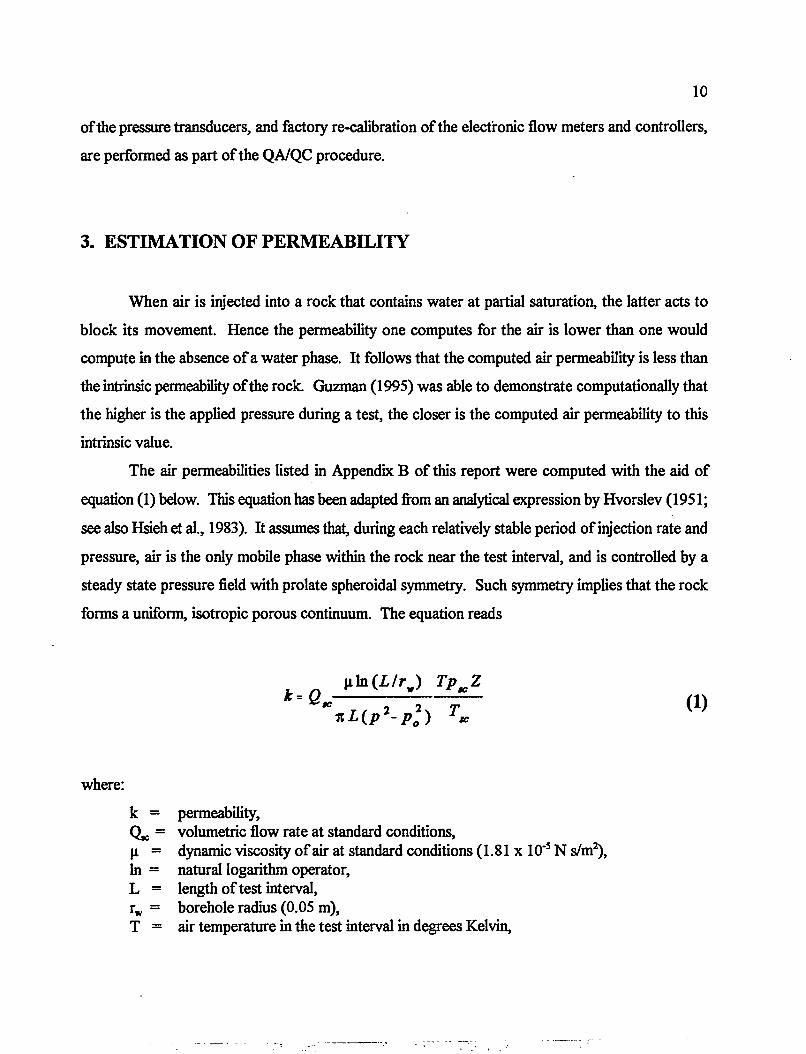
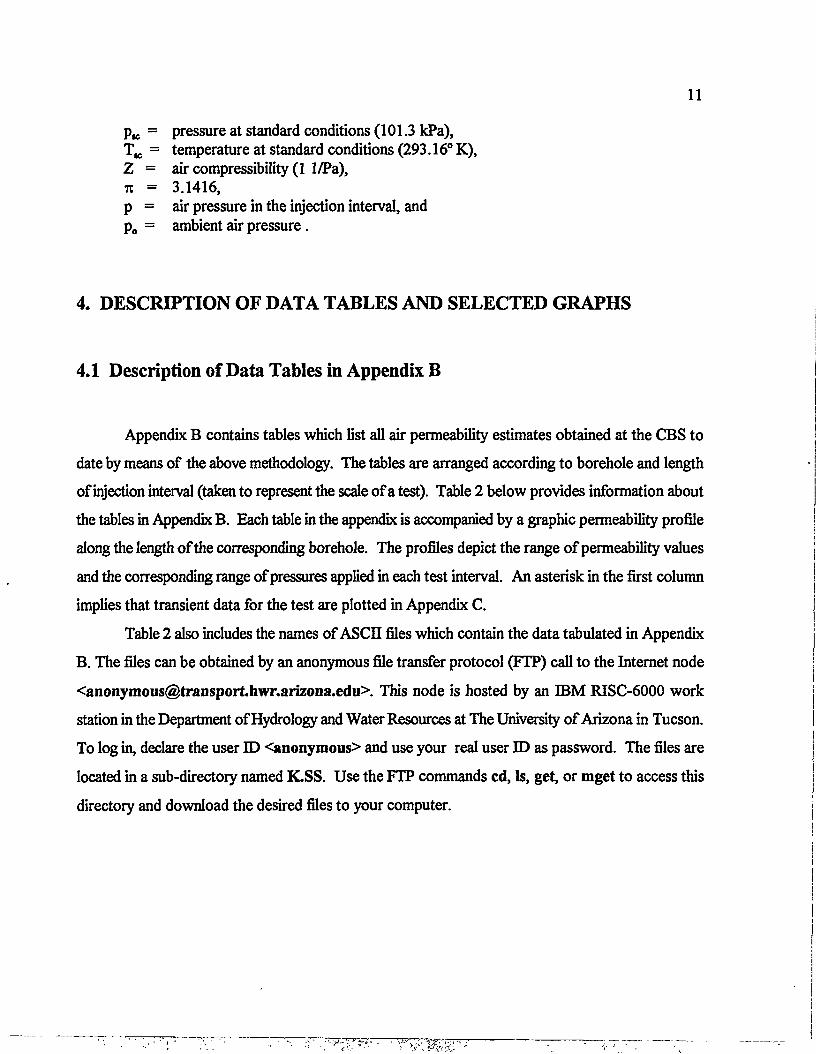
The air permeabilities listed in Appendix B of this report were computed with the aid of equation (1) below. This equation has been adapted from an analytical expression by Hvorslev (1951; see also Hsieh et al., 1983). It assumes that, during each relatively stable period of injection rate and pressure, air is the only mobile phase within the rock near the test interval, and is controlled by a steady state pressure field with prolate spheroidal symmetry. Such symmetry implies that the rock forms a uniform, isotropic porous continuum. The equation reads
uln(X/r w) TpKZ k = Q ~ r , 2 2, T (1)
where: k = permeability, Q,,. = volumetric flow rate at standard conditions, u = dynamic viscosity of air at standard conditions (1.81 x 10"5 N s/m2), In = natural logarithm operator, L = length of test interval, rw = borehole radius (0.05 m), T = air temperature in the test interval in degrees Kelvin,
11
pK = pressure at standard conditions (101.3 kPa), T K = temperature at standard conditions (293.16° K), Z = air compressibility (1 1/Pa), n = 3.1416, p = air pressure in the injection interval, and p 0 = ambient air pressure.
4. DESCRIPTION OF DATA TABLES AND SELECTED GRAPHS
4.1 Description of Data Tables in Appendix B
Appendix B contains tables which list all air permeability estimates obtained at the CBS to
date by means of the above methodology. The tables are arranged according to borehole and length
of injection interval (taken to represent the scale of a test). Table 2 below provides information about
the tables in Appendix B. Each table in the appendix is accompanied by a graphic permeability profile
along the length of the corresponding borehole. The profiles depict the range of permeability values
and the corresponding range of pressures applied in each test interval. An asterisk in the first column
implies that transient data for the test are plotted in Appendix C.
Table 2 also includes the names of ASCII files which contain the data tabulated in Appendix
B. The files can be obtained by an anonymous file transfer protocol (FTP) call to the Internet node
<[email protected]>. This node is hosted by an IBM RISC-6000 work
station in the Department of Hydrology and Water Resources at The University of Arizona in Tucson.
To log in, declare the user ID <anonymous> and use your real user ID as password. The files are
located in a sub-directory named K.SS. Use the FTP commands cd, Is, get, or mget to access this
directory and download the desired files to your computer.
12
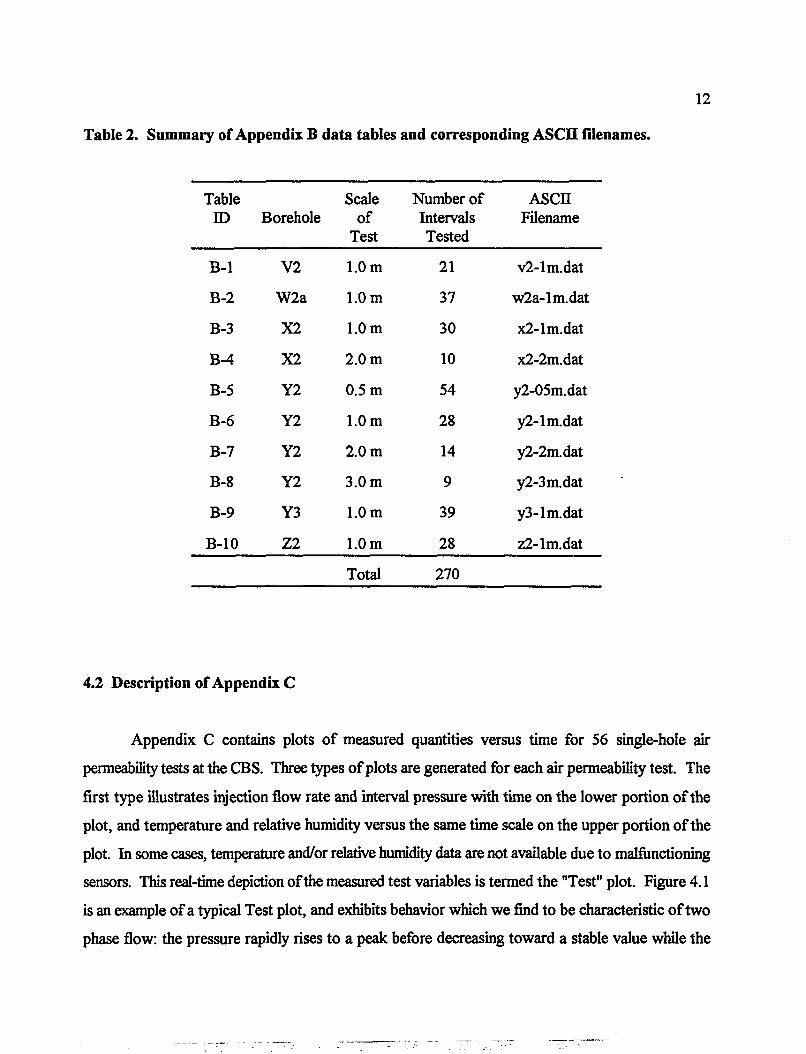
Table 2. Summary of Appendix B data tables and corresponding ASCII filenames.
Table Scale Number of ASCE ID Borehole of
Test Intervals Tested
Filename
B-1 V2 1.0 m 21 v2-lm.dat
B-2 W2a 1.0 m 37 w2a-lm.dat
B-3 X2 1.0 m 30 x2-lm.dat
B-4 X2 2.0 m 10 x2-2m.dat
B-5 Y2 0.5 m 54 y2-05m.dat
B-6 Y2 1.0 m 28 y2-lm.dat
B-7 Y2 2.0 m 14 y2-2m.dat
B-8 Y2 3.0 m 9 y2-3m.dat
B-9 Y3 1.0 m 39 y3-lm.dat
B-10 Z2 1.0 m 28 z2-lm.dat
Total 270
4.2 Description of Appendix C
Appendix C contains plots of measured quantities versus time for 56 single-hole air
permeability tests at the CBS. Three types of plots are generated for each air permeability test. The
first type illustrates injection flow rate and interval pressure with time on the lower portion of the
plot, and temperature and relative humidity versus the same time scale on the upper portion of the
plot. In some cases, temperature and/or relative humidity data are not available due to malfunctioning
sensors. This real-time depiction of the measured test variables is termed the "Test" plot. Figure 4.1
is an example of a typical Test plot, and exhibits behavior which we find to be characteristic of two
phase flow: the pressure rapidly rises to a peak before decreasing toward a stable value while the
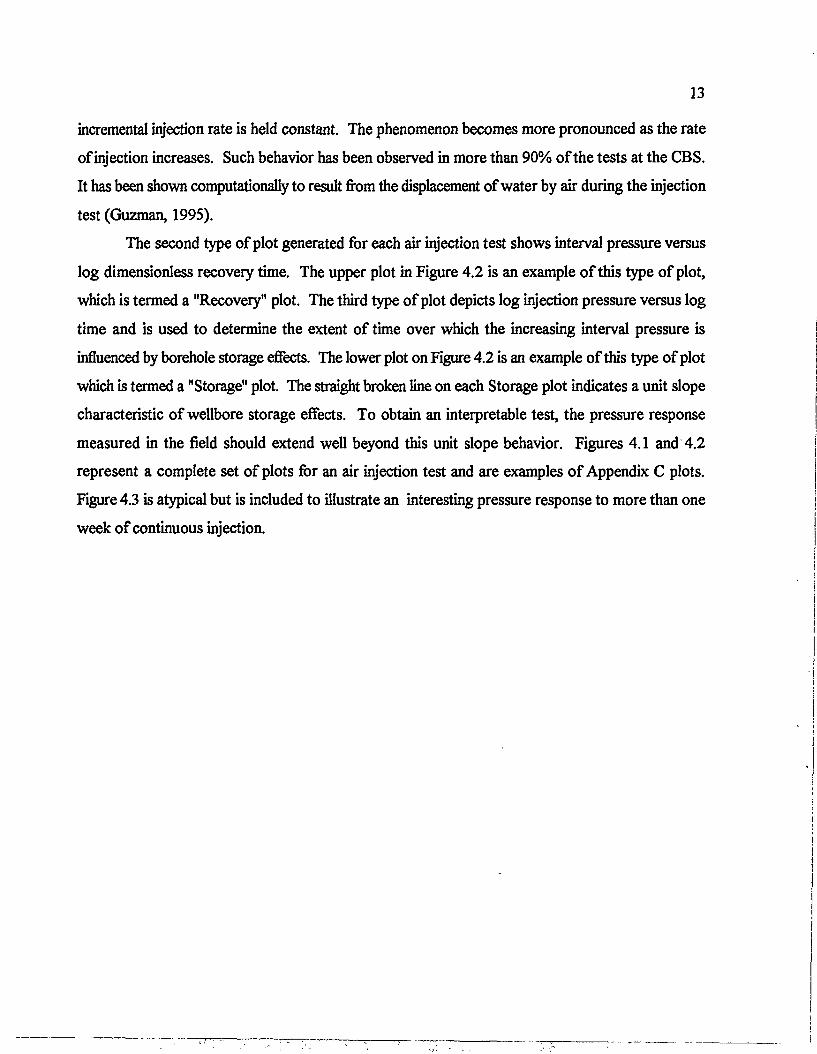
13
incremental injection rate is held constant. The phenomenon becomes more pronounced as the rate
of injection increases. Such behavior has been observed in more than 90% of the tests at the CBS.
It has been shown computationally to result from the displacement of water by air during the injection
test (Guzman, 1995).
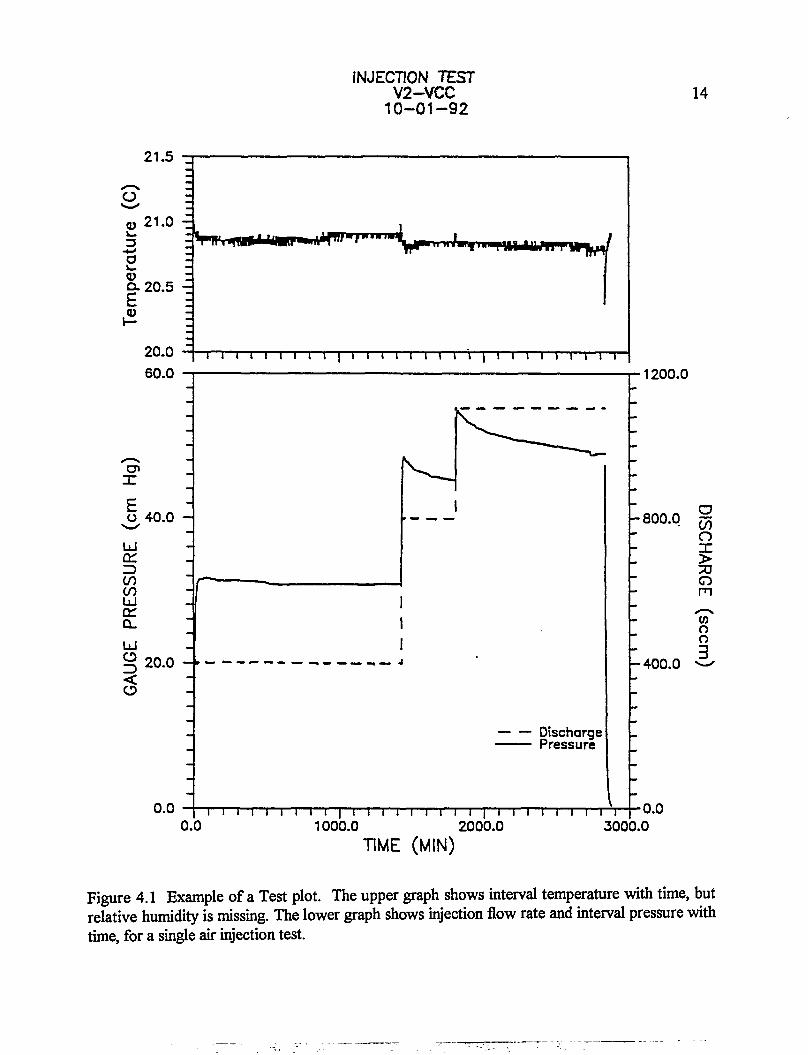
The second type of plot generated for each air injection test shows interval pressure versus
log dimensionless recovery time. The upper plot in Figure 4.2 is an example of this type of plot,
which is termed a "Recovery" plot. The third type of plot depicts log injection pressure versus log
time and is used to determine the extent of time over which the increasing interval pressure is
influenced by borehole storage effects. The lower plot on Figure 4.2 is an example of this type of plot
which is termed a "Storage" plot. The straight broken line on each Storage plot indicates a unit slope
characteristic of wellbore storage effects. To obtain an interpretable test, the pressure response
measured in the field should extend well beyond this unit slope behavior. Figures 4.1 and 4.2
represent a complete set of plots for an air injection test and are examples of Appendix C plots.
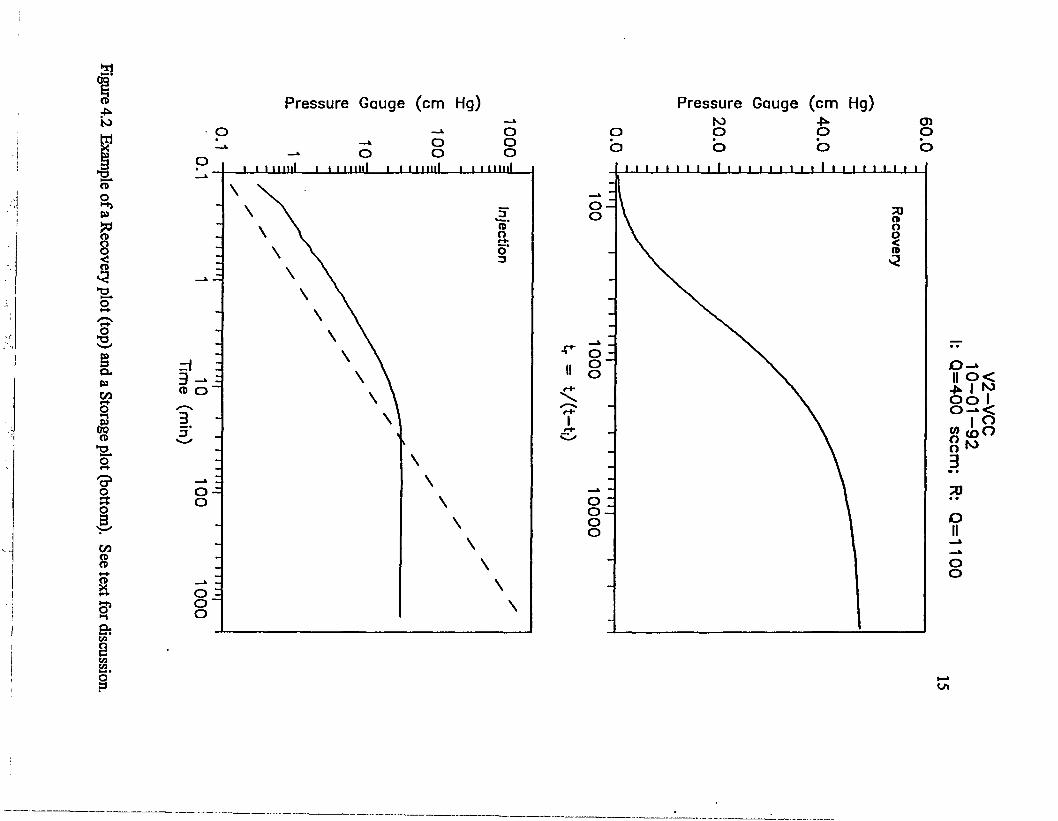
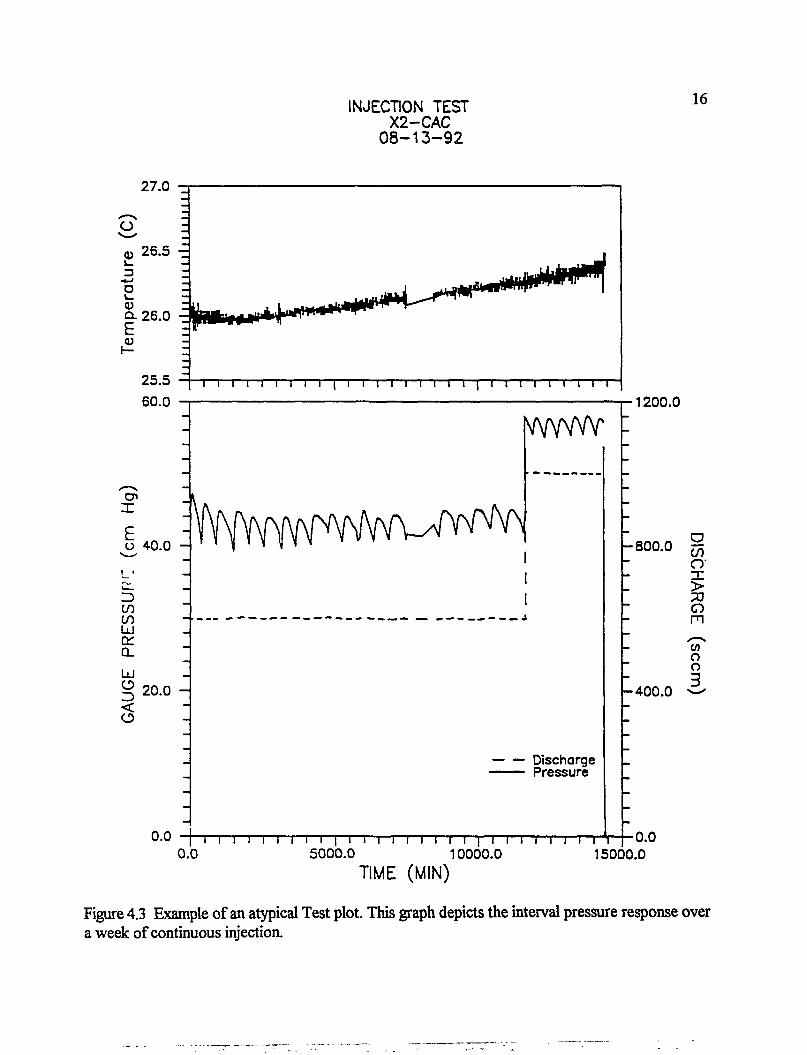
Figure 4.3 is atypical but is included to illustrate an interesting pressure response to more than one
week of continuous injection.
INJECTION TEST V2-VCC
10-01-92 14
21.5
<u 21.0 ^
•+•>
O i_ <U a. 20.5 -3 E V
EWftiMiiimw^nA^fP-y \ i - " " ^ " i ' > f n i ^ t f f l ^ i f f ^ /
2 0 . 0 I i i i i i i i i i | i i i i i i i i i i i i i i i i i i i 6 0 . 0
en
o 40.0 H
CO co Ld
Q_ LJ § 20.0 -+ <
0.0
f — — — — — - . — — , « . _ _ - , _ J
Discharge Pressure
-800.0 rk
l l l I I l l l I | l I l l l l I l l | I l 0.0 1000.0 2000.0
l I l l l
1200.0
- 4 0 0 . 0
O CO O X > o m
W o o 3
3000.0 0.0
TIME (MIN)
Figure 4.1 Example of a Test plot. The upper graph shows interval temperature with time, but relative humidity is missing. The lower graph shows injection flow rate and interval pressure with time, for a single air injection test.
Pressure Gauge (cm Hg) Pressure Gauge (cm Hg)
P .
«-*
1 09 TO
a S o B C/J TO TO
s 9 & on
4» I N> O O I °~*% I ° o 1° 3 70 • •
o o
I Lh
INJECTION TEST X2-CAC
08-13-92
16
27.0
25.5 60.0
i l I I I l I
o 40.0
3 CO CO Id rr Q_
bJ § 20.0 <
0.0
I I I I I I I I I I I I I I 1 I I I 1
iwvwv
Discharge Pressure
i i i i i i n r 0.0 5000.0
l I I I I I I I I I I I I I - I I I I S
- 8 0 0 . 0
1200.0
- 4 0 0 . 0
CO
o->
o m V) o a 3
•0.0
TIME (MIN) 10000.0 15000.0
Figure 4.3 Example of an atypical Test plot. This graph depicts the interval pressure response over a week of continuous injection.
17
REFERENCES CITED
Bassett, R.L., S.P. Neuman, T.C. Rasmussen, A. Guzman, G.R. Davidson, and C.F. Lohrstorfer, 1994, Validation Studies for Assessing Unsaturated Flow and Transport through Fractured Rock, U.S. Nuclear Regulatory Commission, Washington, D.C., NUREG/CR-6203.
Geddis, AM., 1994, Rapid Estimate of Solid Volume in Large Tuff Cores Using a Gas Pycnometer, Masters Thesis, Dept. of Hydrology and Water Resources, Univ. of Arizona, Tucson, 118 pp.
Guzman, A. G.-, 1995, Air Permeability Tests and Their Interpretation in Partially Saturated Fractured Tuffs, Doctoral Dissertation, Dept. of Hydrology and Water Resources, Univ. of Arizona, Tucson, 250 pp.
Hvorslev, M.J., 1951, Time Lag and Soil Permeability in Groundwater Observations, Bulletin 36, U.S. Army Corps of Engineers, Water Ways Experimental Station, Vicksburg, Michigan.
Hsieh, P.A., S.P. Neuman, and E.S. Simpson, 1983, Pressure Testing of Fractured Rocks: A Methodology Employing Three-Dimensional Cross-Hole Tests. U.S. Nuclear Regulatory Commission, NUREG/CR-3213.
Peterson, D.W., 1961, Dichotic Ash-Flow Sheet near Superior and Globe, Arizona, Doctoral Dissertation, Dept. of Geology, Stanford Univ., 130 pp, maps.
Rasmussen, T.C., D.D. Evans, P.J. Sheets, and J.H. Blanford, 1990, Unsaturated Fractured Rock Characterization Methods and Data Sets at the Apache Leap Tuff Site, NUREG/CR-5596, U.S. Nuclear Regulatory Commission, Washington, D.C.
A-l
APPENDIX A: Field Operating Procedures (FOP)
A.1 Injection System FOP A.2 Zero Permeability FOP
A-2
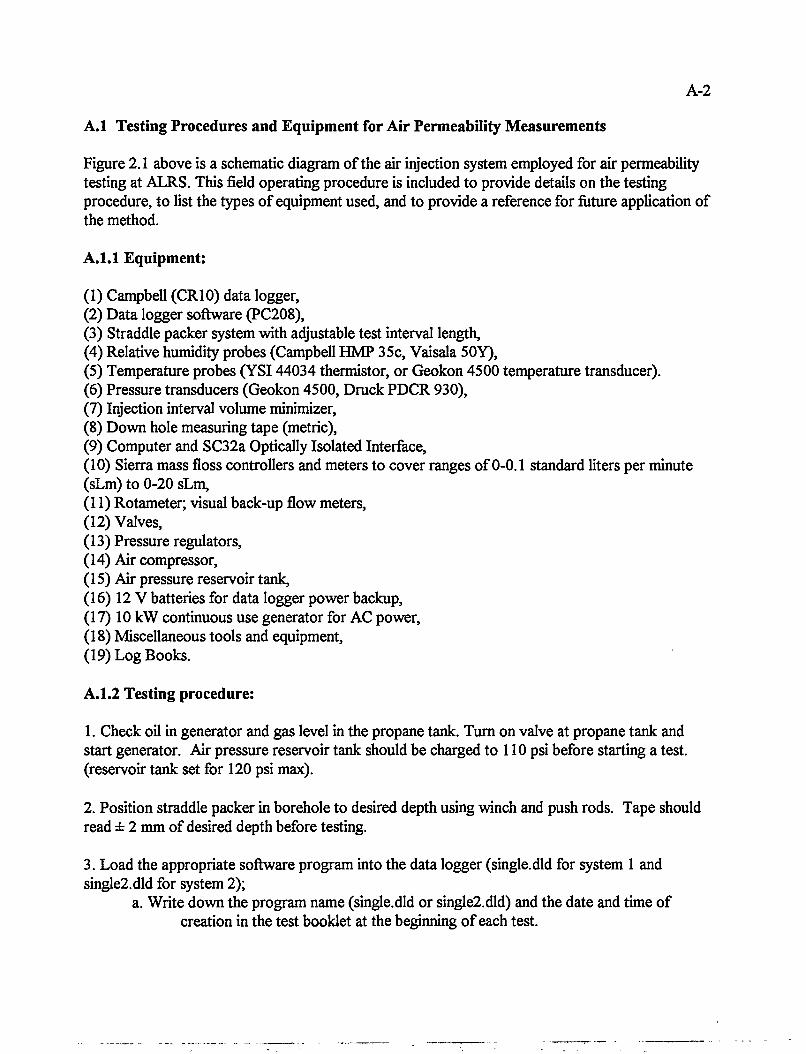
A.1 Testing Procedures and Equipment for Air Permeability Measurements
Figure 2.1 above is a schematic diagram of the air injection system employed for air permeability testing at ALRS. This field operating procedure is included to provide details on the testing procedure, to list the types of equipment used, and to provide a reference for future application of the method.
A.l.l Equipment:
(1) Campbell (CR10) data logger, (2) Data logger software (PC208), (3) Straddle packer system with adjustable test interval length, (4) Relative humidity probes (Campbell HMP 35c, Vaisala 50Y), (5) Temperature probes (YSI44034 thermistor, or Geokon 4500 temperature transducer). (6) Pressure transducers (Geokon 4500, Druck PDCR 930), (7) Injection interval volume minimizer, (8) Down hole measuring tape (metric), (9) Computer and SC32a Optically Isolated Interface, (10) Sierra mass floss controllers and meters to cover ranges of 0-0.1 standard liters per minute (sLm) to 0-20 sLm, (11) Rotameter; visual back-up flow meters, (12) Valves, (13) Pressure regulators, (14) Air compressor, (15) Air pressure reservoir tank, (16) 12 V batteries for data logger power backup, (17) 10 kW continuous use generator for AC power, (18) Miscellaneous tools and equipment, (19) Log Books.
A.1.2 Testing procedure:
1. Check oil in generator and gas level in the propane tank. Turn on valve at propane tank and start generator. Air pressure reservoir tank should be charged to 110 psi before starting a test, (reservoir tank set for 120 psi max).
2. Position straddle packer in borehole to desired depth using winch and push rods. Tape should read ± 2 mm of desired depth before testing.
3. Load the appropriate software program into the data logger (single, did for system 1 and single2.dld for system 2);
a. Write down the program name (single.dld or single2.dld) and the date and time of creation in the test booklet at the beginning of each test.
A-3
b. Connect the computer to the data logger. Type [term single] or [term single2]. An options menu will appear on screen. Type [D] to download program to the data logger. When prompted, type the program name to be downloaded (single or single2). Downloading will take a minute or two. When completed, type [esc] to return to the menu.
c. Set the time and date by selecting [K] from the menu. The screen will automatically return to the menu after a few seconds. Type [M] to monitor the test. Adjust decimal places by hitting [D], and the locations displayed by pressing [L].
4. Set scan rates to 10 sec. for table 1 input and 20 sec. for table 2 input. Table 1 corresponds to input locations 1 through 7 and table 2 corresponds to input locations 8 through 12. Set scan rates by typing [T7H] [enter] and then [*1] [10] [enter] for table 1 and [*2] [20] [enter] for table 2. Typing [*0] and [esc] returns the screen to monitor.
5. Set valve for injection line to closed and set valve immediately downstream of the flow meters to exhaust.
6. Check pressure gauges and regulators. The pressure gauge on the air holding tank should read 110 psi or greater. The pressure regulator for the packers should be set to 80 psi. The regulator for the injection line (from the air holding tank to the shed) should be set to 50 psi and the gauge in the shed should read about the same. The regulator inside the shed controls pressure at flow meters, P(f), and should be set to at least 25 psi to ensure that P(f) is in excess of 100 cm Hg during testing. At high injection rates, the P(f) regulator may need upward adjustment. This is necessary to maintain a positive pressure differential for the mass flow controllers.
7. Prepare the field book by recording all relevant information about the test; date, time, borehole, test ID#, distance along the borehole, operator, weather conditions, etc. Stamp the book a few times with the data format stamp to ensure speedy data collection at the beginning of the test.
8. Connect the appropriate packer line (sys. 1 or sys. 2). Packers will begin to inflate.
9. Monitor the pressure change within the interval caused by inflating the packers. This change is recorded on the monitor as P(p). Record the maximum P(p) value; it should occur within the first few minutes after connecting the packer line. Compare this value to those of previous tests to decide on an initial flow rate for the test. If P(p) fails to reach a maximum and continues to increase with time, packers should be retrieved and leak tested.
10. After recording the maximum P(p), exhaust the interval and set scan rates to 3 sec. and 20 sec. (for Table 1 and Table 2 respectively). When p(p) has returned to zero, turn injection valve back to open. P(p) should remain at or very close to zero. Record this information in the log book as the baseline.
A-4
11. Select the flowmeter needed to maintain the initial flow rate, based on the P(p) max. obtained during packer inflation. Turn the valve corresponding to the selected meter to test. Set the flow rate on the flow controller. Make sure you are using the proper flow controller and the proper channel.
12. Select a starting time for the test a few minutes a head of the current time. It is good to begin the test on an even minute.
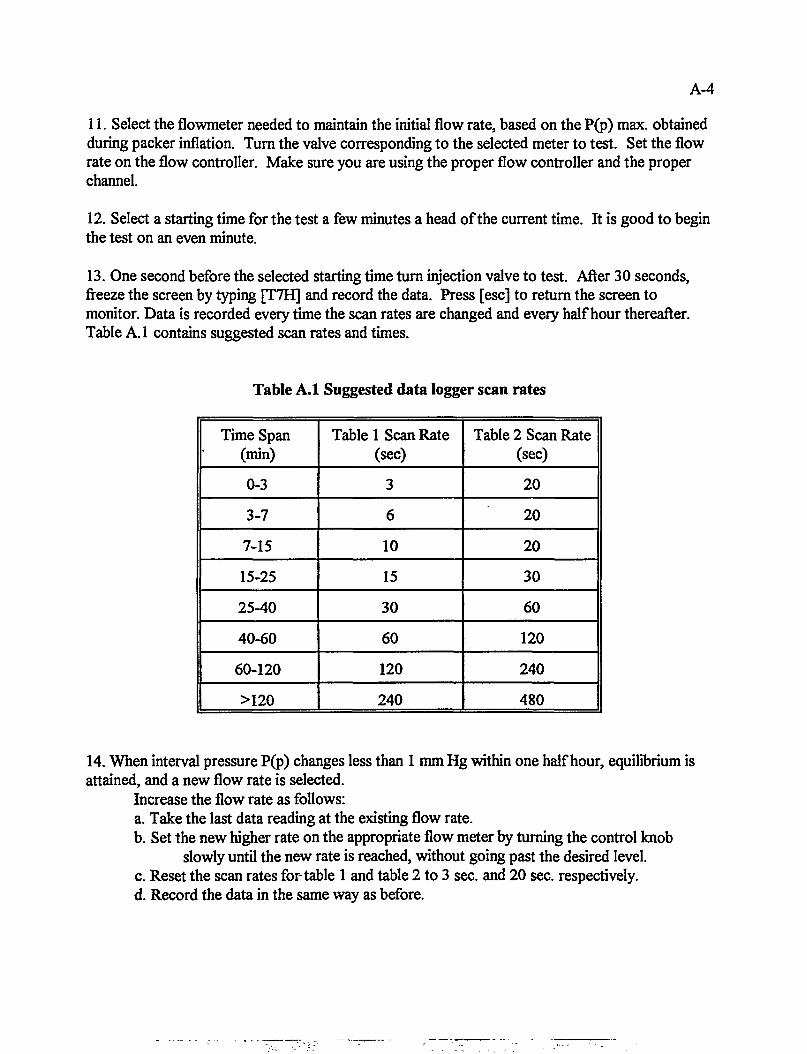
13. One second before the selected starting time turn injection valve to test. After 30 seconds, freeze the screen by typing [T7H] and record the data. Press [esc] to return the screen to monitor. Data is recorded every time the scan rates are changed and every half hour thereafter. Table A.1 contains suggested scan rates and times.
Table A.1 Suggested data logger scan rates
Time Span (min)
Table 1 Scan Rate (sec)
Table 2 Scan Rate (sec)
0-3 3 20
3-7 6 20
7-15 10 20
15-25 15 30
25-40 30 60
40-60 60 120
60-120 120 240
>120 240 480
14. When interval pressure P(p) changes less than 1 mm Hg within one half hour, equilibrium is attained, and a new flow rate is selected.
Increase the flow rate as follows: a. Take the last data reading at the existing flow rate. b. Set the new higher rate on the appropriate flow meter by turning the control knob
slowly until the new rate is reached, without going past the desired level. c. Reset the scan rates for-table 1 and table 2 to 3 sec. and 20 sec. respectively. d. Record the data in the same way as before.
A-5
When testing, a maximum number of flow rates should be attempted, with special attention to flow rates which result in P(p) values between 1 cm Hg and 10 cm Hg and between 90 cm Hg and 110 cm Hg. Ten flow rates for a test is good. As a rule, P(p) values should not exceed 120 cm Hg during testing. P(f) should always be maintained 20 cm Hg higher than P(p) to ensure a required pressure differential for the flow meters. For example, if while testing, P(p) is at 105 cm Hg, P(f) should be set to at least 130 cm Hg. Adjust P(f) with the regulator inside the shed.
15. Download data to diskette. Exit to DOS by hitting [esc] and selecting [OJ. Type [dwnld "filename".raw] [enter] for system 1 or [dwnld2 "filename.raw] [enter] for system 2. This batch file records the data from the data logger memory to the computer hard drive. Insert a diskette into the computer and type [copy "filename".raw a:] [enter]. After downloading return to screen monitor by typing [term single] or [term single2] and press [M] when the menu appears.
A-6
A.2 Zero Permeability Test
In order to conduct the testing effectively, it is necessary to ensure the straddle packer system described above is free of leaks that could impact the air permeability results. Of particular importance is the integrity of the test interval. An effective leak testing procedure has been developed. The zero permeability test is designed to determine the air leakage rate out of a straddle packer system under static positive gauge pressure. The leakage rate determined could be used to correct the obtained measurements. The necessary equipment and procedures are outlined as follows:
A.2.1 Equipment:
(1) Air compressor, (2) Air filter, (3) In-line desiccator, (4) System 1 or System 2 air injection straddle packer assembly, (5) Twenty feet of 4" I.D. PVC pipe, with >100 psi burst strength, (6) Soap solution, (7) Field book.
A.2.2 Procedure:
1. Record in the field book the date and name of the person conducting the test.
2. Rid the straddle packer of large debris along the rubber bladders and place it into the PVC pipe.
3. Connect the injection line from the compressor to the desiccator box and then into the flowmeter outlet for the active interval.
4. Download the appropriate program (zeroperm.dld) to the data logger and if necessary zero the flow meters and pressure transducers.
5. Connect packer line to the compressor and pressurize packers to 80 psig. As the packers are inflated a slight positive pressure will register on the pressure transducer in the interval. If this pressure does not stabilize or the stabilized value is greater than 2 centimeters of mercury, deflate the system and check for leakage along the body of the straddle packers using soap solution. Otherwise, open control valves and allow interval pressure to dissipate.
6. Record initial time and align control valves to allow metered airflow into the test interval of the straddle packer system. Allow for pressure buildup until a pressure of 75 cm Hg is achieved in the interval. Close all valves to isolate the straddle packer system from atmospheric pressure.
A-7
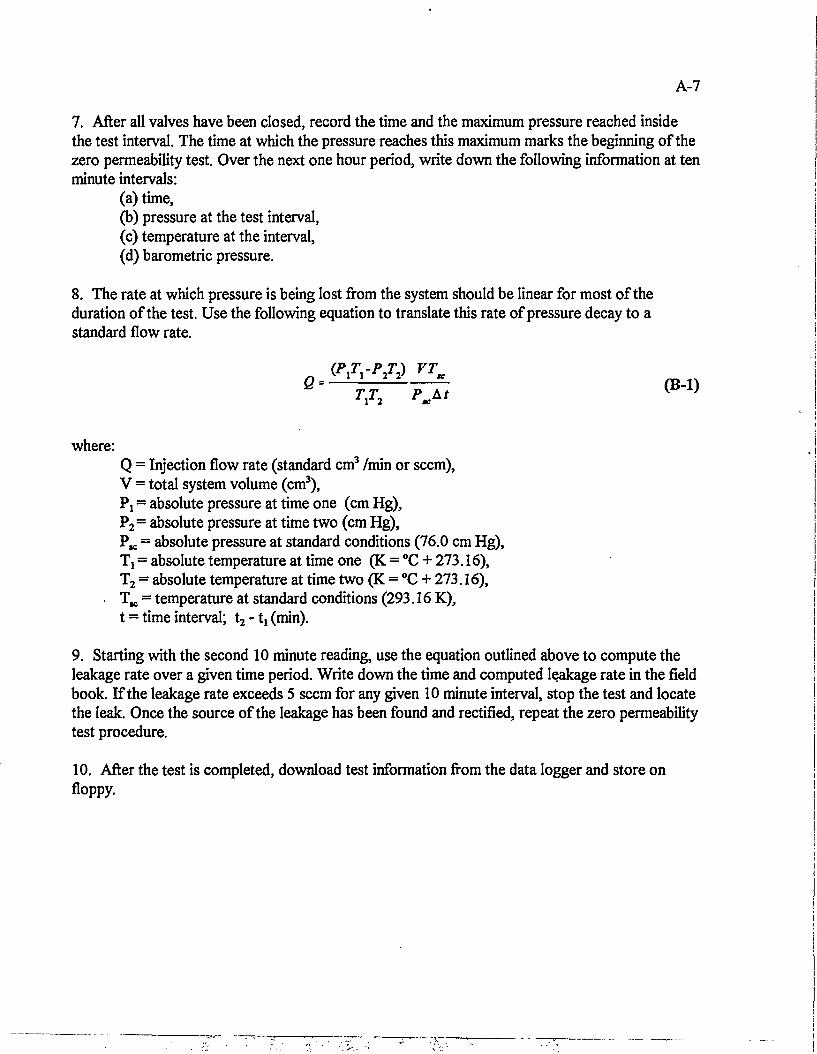
7. After all valves have been closed, record the time and the maximum pressure reached inside the test interval. The time at which the pressure reaches this maximum marks the beginning of the zero permeability test. Over the next one hour period, write down the following information at ten minute intervals:
(a) time, (b) pressure at the test interval, (c) temperature at the interval, (d) barometric pressure.
8. The rate at which pressure is being lost from the system should be linear for most of the duration of the test. Use the following equation to translate this rate of pressure decay to a standard flow rate.
(P T -PT) VT
O—VTTA' ^
where: Q = Injection flow rate (standard cm3 /min or seem), V = total system volume (cm3), Pj = absolute pressure at time one (cm Hg), P 2= absolute pressure at time two (cm Hg), P K = absolute pressure at standard conditions (76.0 cm Hg), T t = absolute temperature at time one (K = °C + 273.16), T2 = absolute temperature at time two (K = °C + 273.16), TK = temperature at standard conditions (293.16 K), t = time interval; t 2 - t t (min).
9. Starting with the second 10 minute reading, use the equation outlined above to compute the leakage rate over a given time period. Write down the time and computed leakage rate in the field book. If the leakage rate exceeds 5 seem for any given 10 minute interval, stop the test and locate the leak. Once the source of the leakage has been found and rectified, repeat the zero permeability test procedure.
10. After the test is completed, download test information from the data logger and store on floppy.

B-l
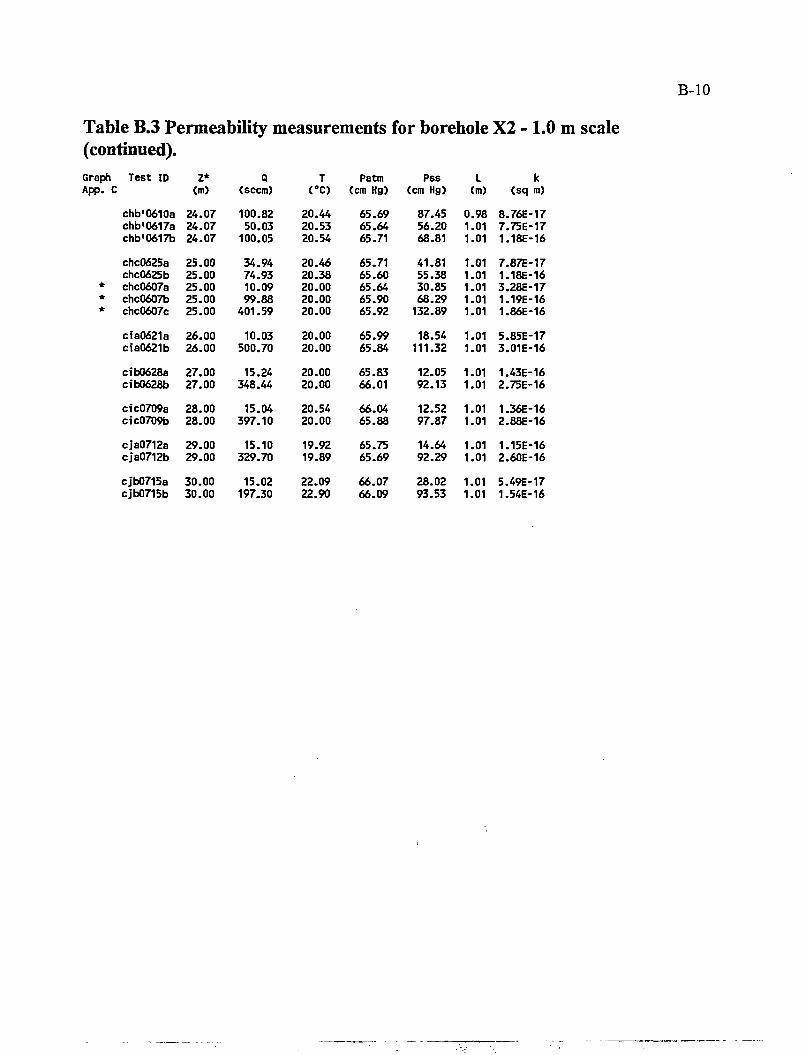
APPENDIX B: Air Permeability Data Tables Note:
The following is a brief description of the data table headings:
Graph App. C = An asterisk indicates that the graph for these flow rates appears in Appendix C.
Test ID = Test identifier that indicates borehole and interval name, month/day of flow rate
initiation, and flow step.
Z* (m) = Position of test in borehole measured from marking point to middle of injection
interval.
Q (seem) = Constant injection flow rate in standard cubic centimeters per minute.
T (°C) = Temperature of injection interval in degrees Celsius.
Patm (cm Hg) = Surface atmospheric pressure in cetimeters of mercury.
Pss (cm Hg) = Relatively steady interval pressure at which permeability is calculated.
L (m) = Distance between inflated packers (length of isolated borehole/scale of test).
k(sq m) = Permeability calculated with Equation 1.
B-2
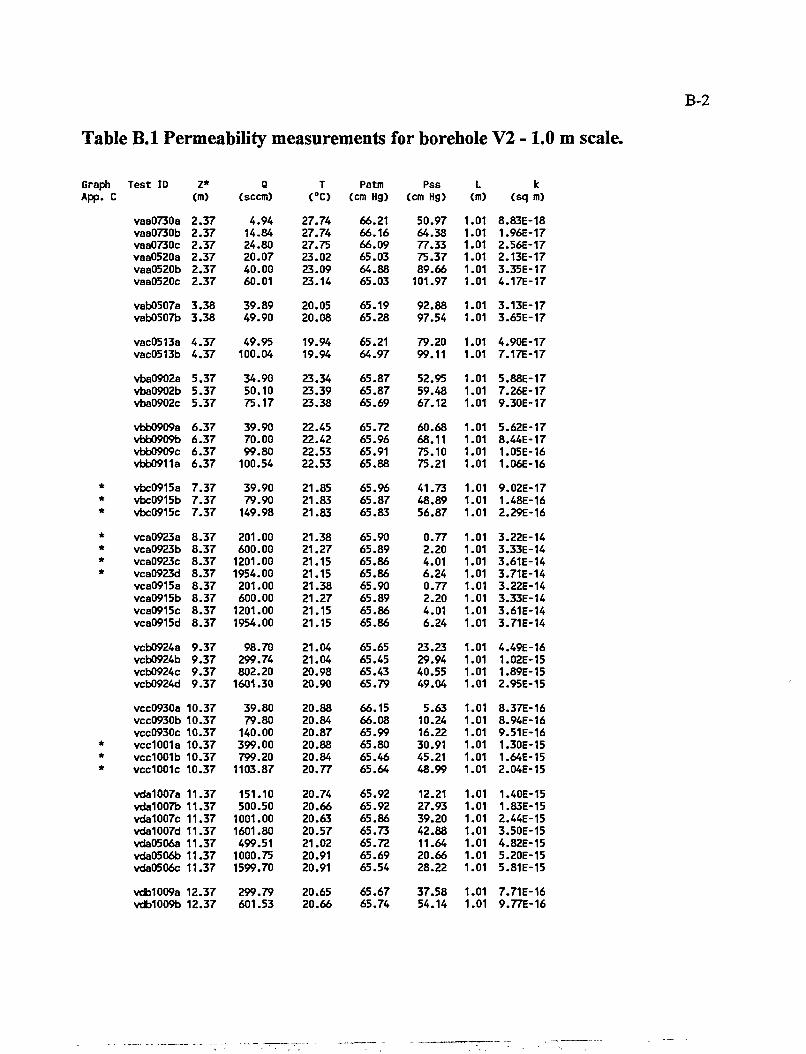
Table B.l Permeability measurements for borehole V2 - 1.0 m scale.
Graph Test ID Z* Q T Patm Pss L k App. C (m) (seem) (°C) (cm Hg) (cm Hg) (m) (sq m)
vaa0730a 2.37 4.94 27.74 66.21 50.97 1.01 8.83E-18 vaa0730b 2.37 14.84 27.74 66.16 64.38 1.01 1.96E-17 vaa0730c 2.37 24.80 27.75 66.09 77.33 1.01 2.56E-17 vaa0520a 2.37 20.07 23.02 65.03 75.37 1.01 2.13E-17 vaa0520b 2.37 40.00 23.09 64.88 89.66 1.01 3.35E-17 vaa0520c 2.37 60.01 23.14 65.03 101.97 1.01 4.17E-17 vab0507a 3.38 39.89 20.05 65.19 92.88 1.01 3.13E-17 vab0507b 3.38 49.90 20.08 65.28 97.54 1.01 3.65E-17 vac0513a 4.37 49.95 19.94 65.21 79.20 1.01 4.90E-17 vac0513b 4.37 100.04 19.94 64.97 99.11 1.01 7.17E-17 vba0902a 5.37 34.90 23.34 65.87 52.95 1.01 5.88E-17 vba0902b 5.37 50.10 23.39 65.87 59.48 1.01 7.26E-17 vba0902c 5.37 75.17 23.38 65.69 67.12 1.01 9.30E-17 vbb0909a 6.37 39.90 22.45 65.72 60.68 1.01 5.62E-17 vbb0909b 6.37 70.00 22.42 65.96 68.11 1.01 8.44E-17 vbb0909c 6.37 99.80 22.53 65.91 75.10 1.01 1.05E-16 vbb0911a 6.37 100.54 22.53 65.88 75.21 1.01 1.06E-16
* vbc0915a 7.37 39.90 21.85 65.96 41.73 1.01 9.02E-17 * vbc0915b 7.37 79.90 21.83 65.87 48.89 1.01 1.48E-16 * vbc0915c 7.37 149.98 21.83 65.83 56.87 1.01 2.29E-16 * vca0923a 8.37 201.00 21.38 65.90 0.77 1.01 3.22E-14 * vca0923b 8.37 600.00 21.27 65.89 2.20 1.01 3.33E-14 * vca0923c 8.37 1201.00 21.15 65.86 4.01 1.01 3.61E-14 * vca0923d 8.37 1954.00 21.15 65.86 6.24 1.01 3.71E-14
vca0915a 8.37 201.00 21.38 65.90 0.77 1.01 3.22E-14 vca0915b 8.37 600.00 21.27 65.89 2.20 1.01 3.33E-14 vca0915c 8.37 1201.00 21.15 65.86 4.01 1.01 3.61E-14 vca0915d 8.37 1954.00 21.15 65.86 6.24 1.01 3.71E-14 vcb0924a 9.37 98.70 21.04 65.65 23.23 1.01 4.49E-16 vcb0924b 9.37 299.74 21.04 65.45 29.94 1.01 1.02E-15 vcb0924c 9.37 802.20 20.98 65.43 40.55 1.01 1.89E-15 vcb0924d 9.37 1601.30 20.90 65.79 49.04 1.01 2.95E-15 vcc0930a 10.37 39.80 20.88 66.15 5.63 1.01 8.37E-16 vcc0930b 10.37 79.80 20.84 66.08 10.24 1.01 8.94E-16 vcc0930c 10.37 140.00 20.87 65.99 16.22 1.01 9.51E-16
* vcdOOIa 10.37 399.00 20.88 65.80 30.91 1.01 1.30E-15 * vcc1001b 10.37 799.20 20.84 65.46 45.21 1.01 1.64E-15 * vcc1001c 10.37 1103.87 20.77 65.64 48.99 1.01 2.04E-15
vda1007a 11.37 151.10 20.74 65.92 12.21 1.01 1.40E-15 vda1007b 11.37 500.50 20.66 65.92 27.93 1.01 1.83E-15 vda1007c 11.37 1001.00 20.63 65.86 39.20 1.01 2.44E-15 vda1007d 11.37 1601.80 20.57 65.73 42.88 1.01 3.50E-15 vda0506a 11.37 499.51 21.02 65.72 11.64 1.01 4.82E-15 vda0506b 11.37 1000.75 20.91 65.69 20.66 1.01 5.20E-15 vda0506c 11.37 1599.70 20.91 65.54 28.22 1.01 5.81E-15 vdb1009a 12.37 299.79 20.65 65.67 37.58 1.01 7.71E-16 vdb1009b 12.37 601.53 20.66 65.74 54.14 1.01 9.77E-16
B-3
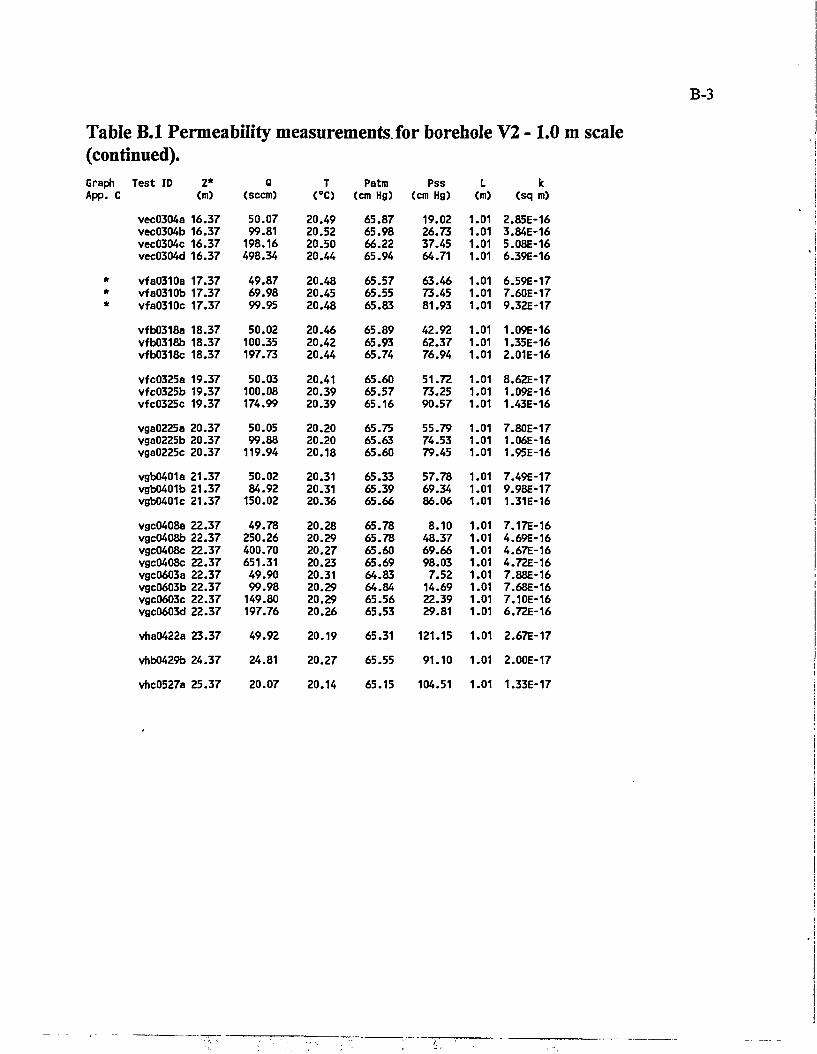
Table B.1 Permeability measurements, for borehole V2 - 1.0 m scale (continued). Graph Test ID V App. C (m)
Q (seem)
T (°C)
Patm (cm Hg)
Pss (cm Hg)
L (m)
k (sq m)
vec0304a 16.37 vec0304b 16.37 vec0304c 16.37 vec0304d 16.37
50.07 99.81
198.16 498.34
20.49 20.52 20.50 20.44
65.87 65.98 66.22 65.94
19.02 26.73 37.45 64.71
1.01 1.01 1.01 1.01
2.85E-16 3.84E-16 5.08E-16 6.39E-16
* vfa0310a 17.37 * vfa0310b 17.37 * vfa0310c 17.37
49.87 69.98 99.95
20.48 20.45 20.48
65.57 65.55 65.83
63.46 73.45 81.93
1.01 1.01 1.01
6.59E-17 7.60E-17 9.32E-17
vfb0318a 18.37 vfb0318b 18.37 vfb0318c 18.37
50.02 100.35 197.73
20.46 20.42 20.44
65.89 65.93 65.74
42.92 62.37 76.94
1.01 1.01 1.01
1.09E-16 1.35E-16 2.01E-16
vfc0325a 19.37 vfc0325b 19.37 vfc0325c 19.37
50.03 100.08 174.99
20.41 20.39 20.39
65.60 65.57 65.16
51.72 73.25 90.57
1.01 1.01 1.01
8.62E-17 1.09E-16 1.43E-16
vga0225a 20.37 vga0225b 20.37 vga0225c 20.37
50.05 99.88
119.94
20.20 20.20 20.18
65.75 65.63 65.60
55.79 74.53 79.45
1.01 1.01 1.01
7.80E-17 1.06E-16 1.95E-16
vgb0401a 21.37 vgb0401b 21.37 vgb0401c 21.37
50.02 84.92
150.02
20.31 20.31 20.36
65.33 65.39 65.66
57.78 69.34 86.06
1.01 1.01 1.01
7.49E-17 9.98E-17 1.31E-16
vgc0408a 22.37 vgc0408b 22.37 vgc0408c 22.37 vgc0408c 22.37 vgc0603a 22.37 vgc0603b 22.37 vgc0603c 22.37 vgc0603d 22.37
49.78 250.26 400.70 651.31 49.90 99.98
149.80 197.76
20.28 20.29 20.27 20.23 20.31 20.29 20.29 20.26
65.78 65.78 65.60 65.69 64.83 64.84 65.56 65.53
8.10 48.37 69.66 98.03
7.52 14.69 22.39 29.81
1.01 1.01 1.01 1.01 1.01 1.01 1.01 1.01
7.17E-16 4.69E-16 4.67E-16 4.72E-16 7.88E-16 7.68E-16 7.10E-16 6.72E-16
vha0422a 23.37 49.92 20.19 65.31 121.15 1.01 2.67E-17
vhb0429b 24.37 24.81 20.27 65.55 91.10 1.01 2.00E-17
vhc0527a 25.37 20.07 20.14 65.15 104.51 1.01 1.33E-17
B-4
Table B.2 Permeability measurements for borehole W2a - 1.0 m scale, Graph Test ID Z* Q T Patm Pss L k App. C <m) (seem) (°C> (cm Hg) (cm Hg) (m) (sq m)
Was'702a 2 .55 1027.60 25.92 65.86 16.46 1.00 7.06E-15 Uaa'702b 2 .55 5003.95 25.64 65.89 46.29 1.00 1.02E-14 Waa'702c 2 .55 12004.50 25.80 65.57 81.44 1.00 1.16E-14
Waa0625a 2 .75 251.89 25.23 65.98 5.85 0.98 5.28E-15 Waa0625b 2.75 3501.70 24.73 65.91 39.99 0.98 8.60E-15 Waa0625c 2.75 7012.78 24.58 66.00 59.34 0.98 1.04E-14 Uaa0625d 2.75 11972.60 24.97 65.90 83.27 0.98 1.13E-14
Uab0708a 3.53 30.24 24.74 65.75 22.38 1.00 1.47E-16 Uab0708b 3.53 99.51 24.71 65.88 28.95 1.00 3.57E-16 Wab0708c 3.53 501.50 24.65 66.15 52.18 1.00 8.70E-16 WabOTOSd 3.53 1991.11 24.67 66.02 104.38 1.00 1.35E-15
Uac0715a 4.53 50.41 23.72 66.13 60.70 1.00 7.16E-17 Uac0715b 4.53 149.59 23.73 66.04 80.85 1.00 1.45E-16 Wac0715c 4.53 249.57 23.78 66.32 93.25 1.00 1.97E-16
Wba0722a 5.53 99.97 22.88 66.05 86.31 1.00 8.80E-17 Uba0722b 5.53 149.57 22.88 66.18 89.14 1.00 1.26E-16 Wba0722c 5.53 199.55 22.89 65.90 96.19 1.00 1.51E-16
Wbb0729a 6.53 50.41 22.24 66.30 31.16 1.00 1.64E-16 Wbb0729b 6.53 199.91 22.23 66.25 50.63 1.00 3.57E-16 Ubb0729c 6.53 598.99 22.23 66.45 72.28 1.00 6.69E-16
Wbc'0805a 7.53 49.98 21.71 66.05 27.83 1.00 1.86E-16 Wbc'0805b 7.53 199.16 21.71 66.19 38.86 1.00 4.95E-16 Ubc'0805c 7.53 1499.69 21.68 65.84 93.37 1.00 1.18E-15
Wbc0913a 7.55 10.03 22.83 65.35 16.89 1.02 6.57E-17 Wbc0913b 7.55 19.79 22.79 65.33 19.66 1.02 1.09E-16 Wbc0913c 7.55 39.99 22.78 65.34 23.70 1.02 1.78E-16 Ubc0913d 7.55 49.95 22.77 65.38 25.05 1.02 2.09E-16 Ubc0913e 7.55 100.05 22.79 65.53 31.49 1.02 3.19E-16 Wbc0913f 7.55 197.80 22.78 65.65 39.51 1.02 4.79E-16 Ubc0913g 7.55 400.57 22.77 65.90 55.38 1.02 6.31E-16 Wbc0913h 7.55 600.19 22.78 65.99 64.40 1.02 7.75E-16 Wbc0913i 7.55 999.54 22.82 65.86 77.44 1.02 1.01E-15 Wbc0913j 7.55 1200.34 22.77 65.92 81.97 1.02 1.12E-15 Wbc0913k 7.55 1401.45 22.80 65.88 86.80 1.02 1.21E-15 Wbc0913l 7.55 1985.47 22.82 65.82 99.62 1.02 1.41E-15
Uca0812a 8.53 100.40 21.33 65.97 21.10 1.00 5.13E-16 Uca0812b 8.53 499.56 21.29 66.12 30.34 1.00 1.67E-15 Uca0812c 8.53 4999.99 21.02 65.91 84.78 1.00 4.49E-15 Uca0812d 8.53 8009.01 21.17 66.15 105.91 1.00 5.24E-15
* Wcb0819a 9.53 100.41 21.08 66.07 11.67 1.00 9.87E-16 * Ucb0819b 9.53 999.97 20.99 . 66.03 33.09 1.00 3.02E-15 * Ucb0819c 9.53 7998.38 20.80 66.34 102.51 1.00 5.47E-15
Ucc0825a 10.53 100.00 20.87 66.10 62.59 1.00 1.35E-16 Wcc0825b 10.53 198.38 20.86 66.35 73.63 1.00 2.15E-16 Ucc0825c 10.53 350.42 20.83 66.26 88.94 1.00 2.93E-16
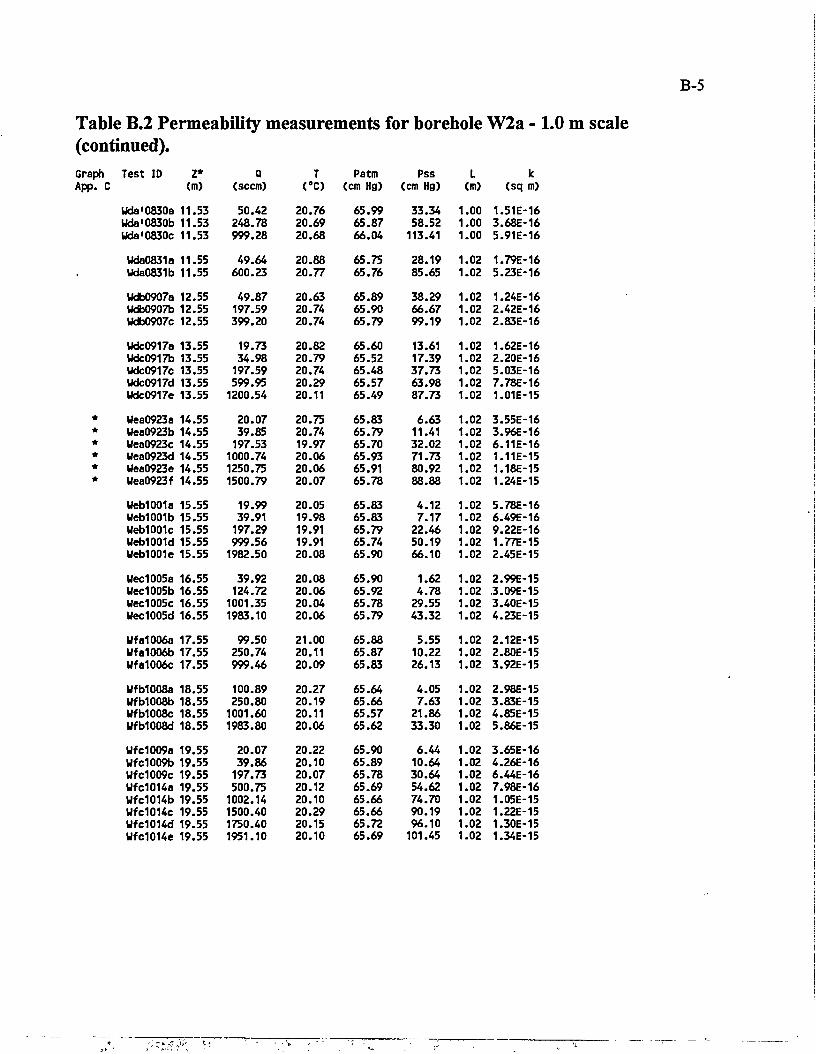
Table B.2 Permeability measurements for borehole W2a - 1.0 m scale (continued). Graph Test ID Z* Q T Patm Pss L k App. C (m) (seem) (°C) (cm Hg) (cm Hg) (m) (sq m)
Wda'0830a 11.53 50.42 20.76 65.99 33.34 1.00 1.51E-16 Uda'0830b 11.53 248.78 20.69 65.87 58.52 1.00 3.68E-16 Wda'0830c 11.53 999.28 20.68 66.04 113.41 1.00 5.91E-16
Uda0831a 11.55 49.64 20.88 65.75 28.19 1.02 1.79E-16 Uda0831b 11.55 600.23 20.77 65.76 85.65 1.02 5.23E-16
Udb0907a 12.55 49.87 20.63 65.89 38.29 1.02 1.24E-16 Wdb0907b 12.55 197.59 20.74 65.90 66.67 1.02 2.42E-16 Udb0907c 12.55 399.20 20.74 65.79 99.19 1.02 2.83E-16
Wdc0917a 13.55 19.73 20.82 65.60 13.61 1.02 1.62E-16 Udc0917b 13.55 34.98 20.79 65.52 17.39 1.02 2.20E-16 Udc0917c 13.55 197.59 20.74 65.48 37.73 1.02 5.03E-16 Wdc0917d 13.55 599.95 20.29 65.57 63.98 1.02 7.78E-16 Wdc0917e 13.55 1200.54 20.11 65.49 87.73 1.02 1.01E-15
* Wea0923a 14.55 20.07 20.75 65.83 6.63 1.02 3.55E-16 * Wea0923b 14.55 39.85 20.74 65.79 11.41 1.02 3.96E-16 * Uea0923c 14.55 197.53 19.97 65.70 32.02 1.02 6.11E-16 * Uea0923d 14.55 1000.74 20.06 65.93 71.73 1.02 1.11E-15 * Wea0923e 14.55 1250.75 20.06 65.91 80.92 1.02 1.18E-15 * Uea0923f 14.55 1500.79 20.07 65.78 88.88 1.02 1.24E-15
Web1001a 15.55 19.99 20.05 65.83 4.12 1.02 5.78E-16 Ueb1001b 15.55 39.91 19.98 65.83 7.17 1.02 6.49E-16 UeblOOIc 15.55 197.29 19.91 65.79 22.46 1.02 9.22E-16 Ueb1001d 15.55 999.56 19.91 65.74 50.19 1.02 1.77E-15 Ueb1001e 15.55 1982.50 20.08 65.90 66.10 1.02 2.45E-15
Uec1005a 16.55 39.92 20.08 65.90 1.62 1.02 2.99E-15 Uec1005b 16.55 124.72 20.06 65.92 4.78 1.02 3.09E-15 Uec1005c 16.55 1001.35 20.04 65.78 29.55 1.02 3.40E-15 Uec1005d 16.55 1983.10 20.06 65.79 43.32 1.02 4.23E-15
Wfa1006a 17.55 99.50 21.00 65.88 5.55 1.02 2.12E-15 Ufa1006b 17.55 250.74 20.11 65.87 10.22 1.02 2.80E-15 Wfa1006c 17.55 999.46 20.09 65.83 26.13 1.02 3.92E-15
Ufb1008a 18.55 100.89 20.27 65.64 4.05 1.02 2.98E-15 Wfb1008b 18.55 250.80 20.19 65.66 7.63 1.02 3.83E-15 Ufb1008c 18.55 1001.60 20.11 65.57 21.86 1.02 4.85E-15 Ufb1008d 18.55 1983.80 20.06 65.62 33.30 1.02 5.86E-15
Wfc1009a 19.55 20.07 20.22 65.90 6.44 1.02 3.65E-16 Wfc1009b 19.55 39.86 20.10 65.89 10.64 1.02 4.26E-16 Wfc1009c 19.55 197.73 20.07 65.78 30.64 1.02 6.44E-16 Ufc1014a 19.55 500.75 20.12 65.69 54.62 1.02 7.98E-16 Ufc1014b 19.55 1002.14 20.10 65.66 74.70 1.02 1.05E-15 WfdOKc 19.55 1500.40 20.29 65.66 90.19 1.02 1.22E-15 Ufc1014d 19.55 1750.40 20.15 65.72 96.10 1.02 1.30E-15 UfclOHe 19.55 1951.10 20.10 65.69 101.45 1.02 1.34E-15
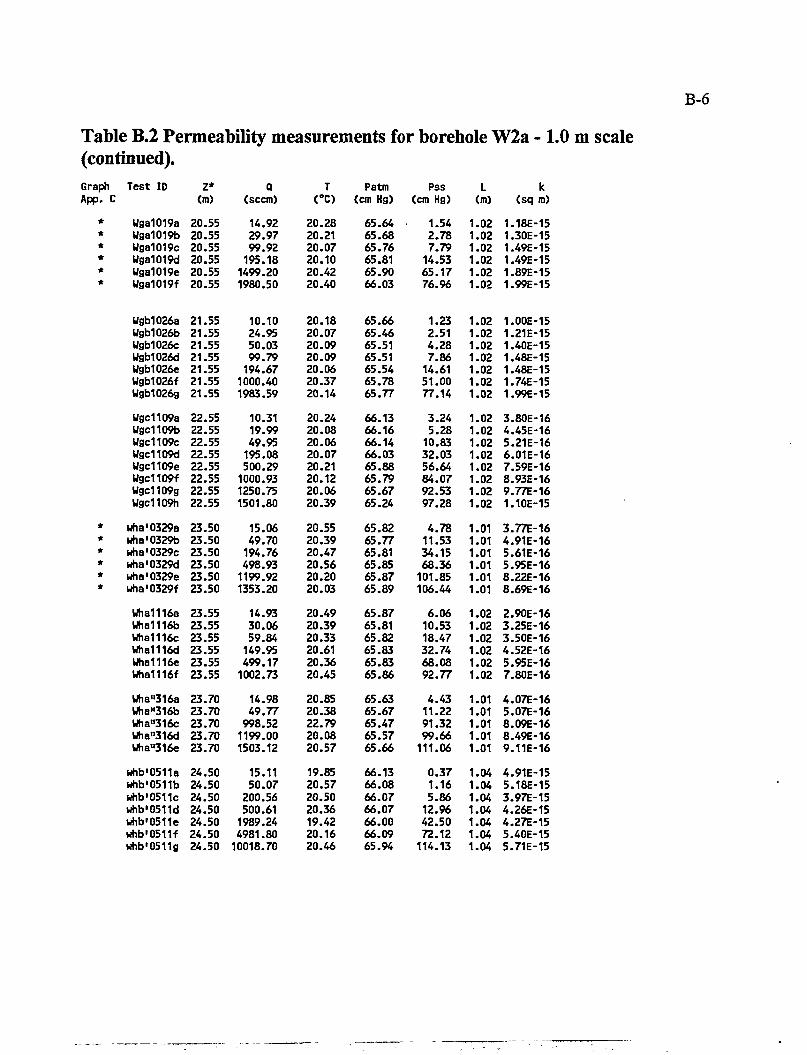
B-6
Table B.2 Permeability measurements for borehole W2a - 1.0 m scale (continued). Graph Test ID Z* Q T Patm Pss L k App. C (m) (seem) C O (cm Hg) (cm Hg) (m) (sq m)
* Uga1019a 20.55 14.92 20.28 65.64 1.54 1.02 1.18E-15 * Uga1019b 20.55 29.97 20.21 65.68 2.78 1.02 1.30E-15 * Uga1019c 20.55 99.92 20.07 65.76 7.79 1.02 1.49E-15 * Wga1019d 20.55 195.18 20.10 65.81 14.53 1.02 1.49E-15 * Wga1019e 20.55 1499.20 20.42 65.90 65.17 1.02 1.89E-15 * Uga1019f 20.55 1980.50 20.40 66.03 76.96 1.02 1.99E-15
Ugb1026a 21.55 10.10 20.18 65.66 1.23 1.02 1.00E-15 Ugb1026b 21.55 24.95 20.07 65.46 2.51 1.02 1.21E-15 Ugb1026c 21.55 50.03 20.09 65.51 4.28 1.02 1.40E-15 Ugb1026d 21.55 99.79 20.09 65.51 7.86 1.02 1.48E-15 Ugb1026e 21.55 194.67 20.06 65.54 14.61 1.02 1.48E-15 Ugb1026f 21.55 1000.40 20.37 65.78 51.00 1.02 1.74E-15 Ugb1Q26g 21.55 1983.59 20.14 65.77 77.14 1.02 1.99E-15 Wgc1109a 22.55 10.31 20.24 66.13 3.24 1.02 3.80E-16 Wgc1109b 22.55 19.99 20.08 66.16 5.28 1.02 4.45E-16 Ugc1109c 22.55 49.95 20.06 66.14 10.83 1.02 5.21E-16 Wgc1109d 22.55 195.08 20.07 66.03 32.03 1.02 6.01E-16 Ugc1109e 22.55 500.29 20.21 65.88 56.64 1.02 7.59E-16 Wgc1109f 22.55 1000.93 20.12 65.79 84.07 1.02 8.93E-16 Wgc1109g 22.55 1250.75 20.06 65.67 92.53 1.02 9.77E-16 Wgc1109h 22.55 1501.80 20.39 65.24 97.28 1.02 1.10E-15
* wha'0329a 23.50 15.06 20.55 65.82 4.78 1.01 3.77E-16 * wha'0329b 23.50 49.70 20.39 65.77 11.53 1.01 4.91E-16 * wha'0329c 23.50 194.76 20.47 65.81 34.15 1.01 5.61E-16 * wha'0329d 23.50 498.93 20.56 65.85 68.36 1.01 5.95E-16 * wha'0329e 23.50 1199.92 20.20 65.87 101.85 1.01 8.22E-16 * wha'0329f 23.50 1353.20 20.03 65.89 106.44 1.01 8.69E-16
Wha1116a 23.55 14.93 20.49 65.87 6.06 1.02 2.90E-16 Wha1116b 23.55 30.06 20.39 65.81 10.53 1.02 3.25E-16 Wha1116c 23.55 59.84 20.33 65.82 18.47 1.02 3.50E-16 Wha1116d 23.55 149.95 20.61 65.83 32.74 1.02 4.52E-16 Wha1116e 23.55 499.17 20.36 65.83 68.08 1.02 5.95E-16 Wha1116f 23.55 1002.73 20.45 65.86 92.77 1.02 7.80E-16 Wha»316a 23.70 14.98 20.85 65.63 4.43 1.01 4.07E-16 Wha"316b 23.70 49.77 20.38 65.67 11.22 1.01 5.07E-16 Wha"316c 23.70 998.52 22.79 65.47 91.32 1.01 8.09E-16 Uha"316d 23.70 1199.00 20.08 65.57 99.66 1.01 8.49E-16 Whau316e 23.70 1503.12 20.57 65.66 111.06 1.01 9.11E-16 whb'0511a 24.50 15.11 19.85 66.13 0.37 1.04 4.91E-15 whb'0511b 24.50 50.07 20.57 66.08 1.16 1.04 5.18E-15 whb'0511c 24.50 200.56 20.50 66.07 5.86 1.04 3.97E-15 whb'0511d 24.50 500.61 20.36 66.07 12.96 1.04 4.26E-15 whb'0511e 24.50 1989.24 19.42 66.00 42.50 1.04 4.27E-15 whb'0511f 24.50 4981.80 20.16 66.09 72.12 1.04 5.40E-15 whb'0511g 24.50 10018.70 20.46 65.94 114.13 1.04 5.71E-15
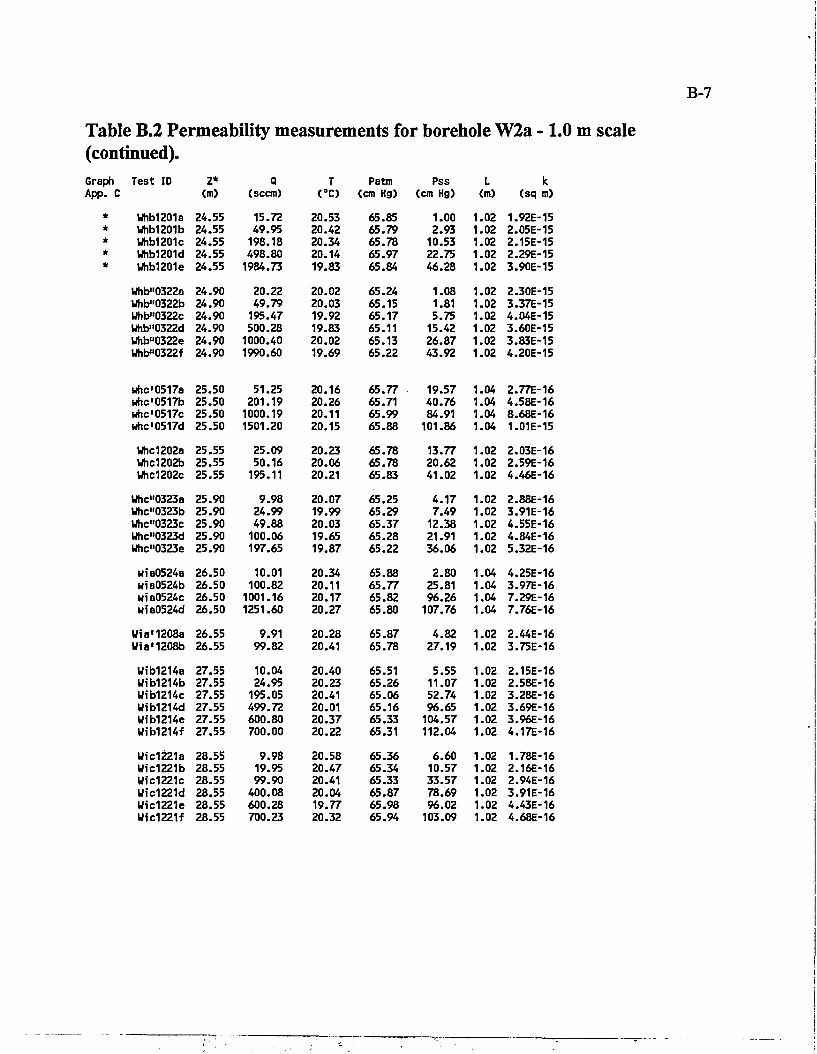
Table B.2 Permeability measurements for borehole W2a - 1.0 m scale (continued). Graph App. C
Test ID
Whb1201a Uhb1201b Whb1201c Whb1201d Whb1201e
Uhb"0322a Whb"0322b Whb"0322c Whb"0322d Uhb"0322e Whb"0322f
Z* <m)
24.55 24.55 24.55 24.55 24.55
24.90 24.90 24.90 24.90 24.90 24.90
Q (seem)
15.72 49.95
198.18 498.80
1984.73
20.22 49.79
195.47 500.28
1000.40 1990.60
T (°C)
20.53 20.42 20.34 20.14 19.83
20.02 20.03 19.92 19.83 20.02 19.69
Patm (cm Hg) 65.85 65.79 65.78 65.97 65.84
65.24 65.15 65.17 65.11 65.13 65.22
Pss (cm Hg)
1.00 2.93 10.53 22.75 46.28 1.08 1.81 5.75 15.42 26.87 43.92
L (m) 1.02 1.02 1.02 1.02 1.02
1.02 1.02 1.02 1.02 1.02 1.02
k (sq m)
1.92E-15 2.05E-15 2.15E-15 2.29E-15 3.90E-15
2.30E-15 3.37E-15 4.04E-15 3.60E-15 3.83E-15 4.20E-15
whc'0517a 25.50 51.25 whc'0517b 25.50 201.19 whc'0517c 25.50 1000.19 whc'0517d 25.50 1501.20 Whc1202a 25.55 Whc1202b 25.55 Whc1202c 25.55 Whc"0323a Uhc"0323b Whc"0323c Whc"0323d Uhc»0323e
25.90 25.90 25.90 25.90 25.90
Wfa'1208a 26.55 Wia'1208b 26.55 Wib1214a Uib1214b Uib1214c Uib1214d Uib1214e Uib1214f Uic1221a Uic1221b Uic1221c Wic1221d Uic1221e Uic1221f
27.55 27.55 27.55 27.55 27.55 27.55 28.55 28.55 28.55 28.55 28.55 28.55
25.09 50.16 195.11 9.98 24.99 49.88 100.06 197.65
wia0524a 26.50 10.01 wia0524b 26.50 100.82 wia0524c 26.50 1001.16 wia0524d 26.50 1251.60
9.91 99.82 10.04 24.95 195.05 499.72 600.80 700.00
9.98 19.95 99.90
400.08 600.28 700.23
20.16 20.26 20.11 20.15
20.23 20.06 20.21
20.07 19.99 20.03 19.65 19.87
20.34 20.11 20.17 20.27
20.28 20.41
20.40 20.23 20.41 20.01 20.37 20.22
20.58 20.47 20.41 20.04 19.77 20.32
65.77 65.71 65.99 65.88
65.78 65.78 65.83
65.25 65.29 65.37 65.28 65.22
65.88 65.77 65.82 65.80
65.87 65.78
65.51 65.26 65.06 65.16 65.33 65.31
65.36 65.34 65.33 65.87 65.98 65.94
19.57 1.04 2.77E-16 40.76 1.04 4.58E-16 84.91 1.04 8.68E-16
101.86 1.04 1.01E-15
13.77 1.02 2.03E-16 20.62 1.02 2.59E-16 41.02 1.02 4.46E-16
4.17 7.49
12.38 21.91 36.06
4.82 27.19
5.55 11.07 52.74 96.65
104.57 112.04
6.60 10.57 33.57 78.69 96.02
103.09
02 02 02 02 02
2.88E-16 3.91E-16 4.55E-16 4.84E-16 5.32E-16
2.80 1.04 4.25E-16 25.81 1.04 3.97E-16 96.26 1.04 7.29E-16
107.76 1.04 7.76E-16
1.02 1.02
1.02 1.02 1.02
02 02 02
02 02 02 02 02
2.44E-16 3.75E-16
2.15E-16 2.58E-16 3.28E-16 3.69E-16 3.96E-16 4.17E-16
1.78E-16 2.16E-16 2.94E-16 3.91E-16 4.43E-16
1.02 4.68E-16
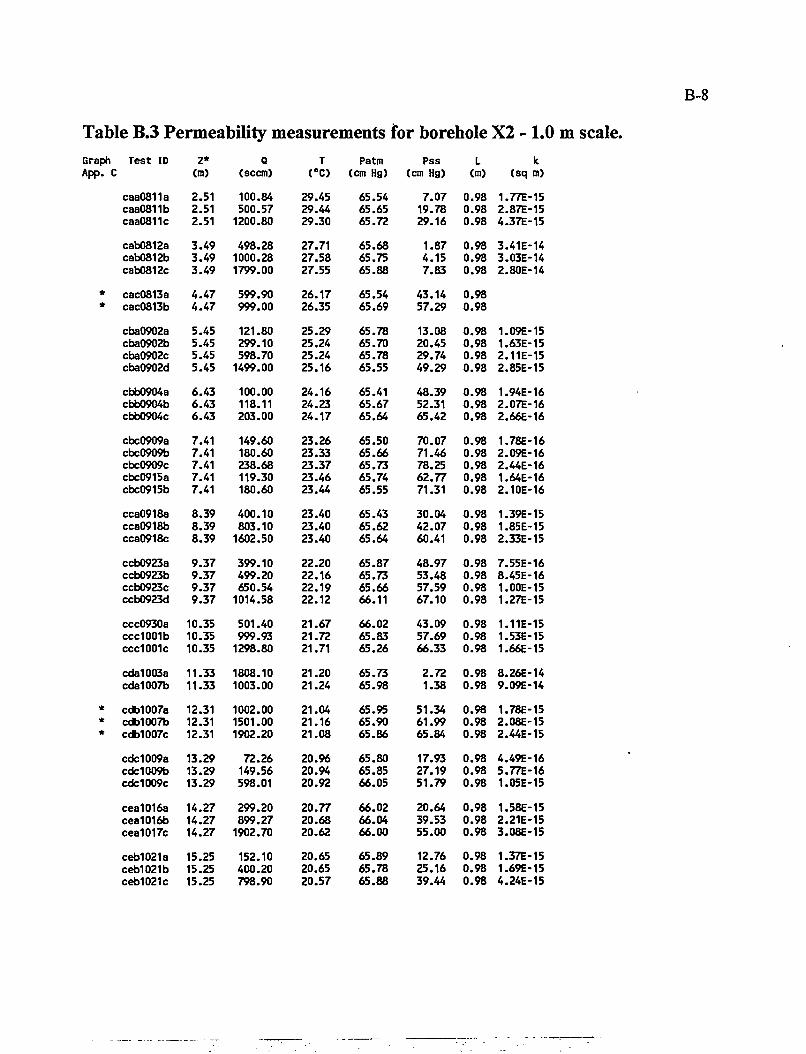
B-8
Table B.3 Permeability measurements for borehole X2 - 1.0 m scale. Graph Test ID App. C
Z* (m)
Q (seem)
T (°C)
Patm (cm Hg)
Pss (cm Hg)
L (m)
k (sq m)
caa0811a caa0811b caa0811c
2.51 2.51 2.51
100.84 500.57 1200.80
29.45 29.44 29.30
65.54 65.65 65.72
7.07 19.78 29.16
0.98 0.98 0.98
1.77E-15 2.87E-15 4.37E-15
cab0812a cab0812b cab0812c
3.49 3.49 3.49
498.28 1000.28 1799.00
27.71 27.58 27.55
65.68 65.75 65.88
1.87 4.15 7.83
0.98 0.98 0.98
3.41E-14 3.03E-14 2.80E-14
* cac0813a * cac0813b
4.47 4.47
599.90 999.00
26.17 26.35
65.54 65.69
43.14 57.29
0.98 0.98
cba0902a cba0902b cba0902c cba0902d
5.45 5.45 5.45 5.45
121.80 299.10 598.70 1499.00
25.29 25.24 25.24 25.16
65.78 65.70 65.78 65.55
13.08 20.45 29.74 49.29
0.98 0.98 0.98 0.98
1.09E-15 1.63E-15 2.11E-15 2.85E-15
cbb0904a cbb0904b cbb0904c
6.43 6.43 6.43
100.00 118.11 203.00
24.16 24.23 24.17
65.41 65.67 65.64
48.39 52.31 65.42
0.98 0.98 0.98
1.94E-16 2.07E-16 2.66E-16
cbc0909a cbe0909b cbc0909c cbc0915a cbc0915b
7.41 7.41 7.41 7.41 7.41
149.60 180.60 238.68 119.30 180.60
23.26 23.33 23.37 23.46 23.44
65.50 65.66 65.73 65.74 65.55
70.07 71.46 78.25 62.77 71.31
0.98 0.98 0.98 0.98 0.98
1.78E-16 2.09E-16 2.44E-16 1.64E-16 2.10E-16
cca0918a cca0918b cca0918c
8.39 8.39 8.39
400.10 803.10 1602.50
23.40 23.40 23.40
65.43 65.62 65.64
30.04 42.07 60.41
0.98 0.98 0.98
1.39E-15 1.85E-15 2.33E-15
ccb0923a ccb0923b ccb0923c ccb0923d
9.37 9.37 9.37 9.37
399.10 499.20 650.54 1014.58
22.20 22.16 22.19 22.12
65.87 65.73 65.66 66.11
48.97 53.48 57.59 67.10
0.98 0.98 0.98 0.98
7.55E-16 8.45E-16 1.00E-15 1.27E-15
ccc0930a ccc1001b ccc1001c
10.35 10.35 10.35
501.40 999.93 1298.80
21.67 21.72 21.71
66.02 65.83 65.26
43.09 57.69 66.33
0.98 0.98 0.98
1.11E-15 1.53E-15 1.66E-15
cda1003a cda1007b
11.33 11.33
1808.10 1003.00
21.20 21.24
65.73 65.98
2.72 1.38
0.98 0.98
8.26E-14 9.09E-14
* cdb1007a * cdb1007b * cdb1007c
12.31 12.31 12.31
1002.00 1501.00 1902.20
21.04 21.16 21.08
65.95 65.90 65.86
51.34 61.99 65.84
0.98 0.98 0.98
1.78E-15 2.08E-15 2.44E-15
cdc1009a cdc1009b cdc1009c
13.29 13.29 13.29
72.26 149.56 598.01
20.96 20.94 20.92
65.80 65.85 66.05
17.93 27.19 51.79
0.98 0.98 0.98
4.49E-16 5.77E-16 1.05E-15
cea1016a cea1016b cea1017c
14.27 14.27 14.27
299.20 899.27 1902.70
20.77 20.68 20.62
66.02 66.04 66.00
20.64 39.53 55.00
0.98 0.98 0.98
1.58E-15 2.21E-15 3.08E-15
ceb1021a ceb1021b ceb1021c
15.25 15.25 15.25
152.10 400.20 798.90
20.65 20.65 20.57
65.89 65.78 65.88
12.76 25.16 39.44
0.98 0.98 0.98
1.37E-15 1.69E-15 4.24E-15
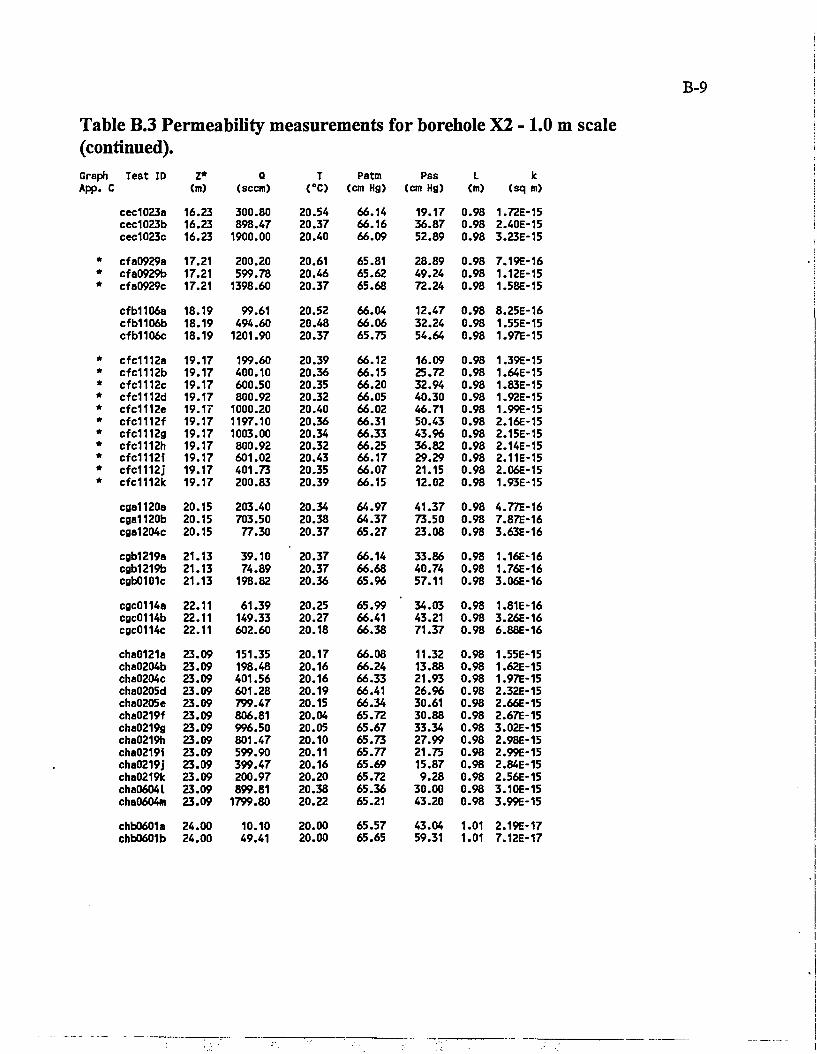
Table B.3 Permeability measurements for borehole X2 - 1.0 m scale (continued). Graph Test ID Z* Q T Patm Pss L Ic App. C <m) (seem) (°C> (cm Hg) (cm Hg) (m) (sq m)
cec1023a 16.23 300.80 20.54 66.14 19.17 0.98 1.72E-15 cec1023b 16.23 898.47 20.37 66.16 36.87 0.98 2.40E-15 cec1023c 16.23 1900.00 20.40 66.09 52.89 0.98 3.23E-15
* cfa0929a 17.21 200.20 20.61 65.81 28.89 0.98 7.19E-16 * cfa0929b 17.21 599.78 20.46 65.62 49.24 0.98 1.12E-15 * cfa0929c 17.21 1398.60 20.37 65.68 72.24 0.98 1.58E-15
cfb1106a 18.19 99.61 20.52 66.04 12.47 0.98 8.25E-16 cfb1106b 18.19 494.60 20.48 66.06 32.24 0.98 1.55E-15 cfb1106c 18.19 1201.90 20.37 65.75 54.64 0.98 1.97E-15
* cfc1112a 19.17 199.60 20.39 66.12 16.09 0.98 1.39E-15 * cfc1112b 19.17 400.10 20.36 66.15 25.72 0.98 1.64E-15 * cfc1112c 19.17 600.50 20.35 66.20 32.94 0.98 1.83E-15 * cfc1112d 19.17 800.92 20.32 66.05 40.30 0.98 1.92E-15 * cfc1112e 19.17 1000.20 20.40 66.02 46.71 0.98 1.99E-15 * cfc1112f 19.17 1197.10 20.36 66.31 50.43 0.98 2.16E-15 * cfc1112g 19.17 1003.00 20.34 66.33 43.96 0.98 2.15E-15 * cfc1112h 19.17 800.92 20.32 66.25 36.82 0.98 2.14E-15 * cfc1112i 19.17 601.02 20.43 66.17 29.29 0.98 2.11E-15 * cfc1112j 19.17 401.73 20.35 66.07 21.15 0.98 2.06E-15 * cfc1112k 19.17 200.83 20.39 66.15 12.02 0.98 1.93E-15
cga1120a 20.15 203.40 20.34 64.97 41.37 0.98 4.77E-16 cga1120b 20.15 703.50 20.38 64.37 73.50 0.98 7.87E-16 cga1204c 20.15 77.30 20.37 65.27 23.08 0.98 3.63E-16 cgb1219a 21.13 39.10 20.37 66.14 33.86 0.98 1.16E-16 cgb1219b 21.13 74.89 20.37 66.68 40.74 0.98 1.76E-16 cgb0101c 21.13 198.82 20.36 65.96 57.11 0.98 3.06E-16 cgc0114a 22.11 61.39 20.25 65.99 34.03 0.98 1.81E-16 cgc0114b 22.11 149.33 20.27 66.41 43.21 0.98 3.26E-16 cgc0114c 22.11 602.60 20.18 66.38 71.37 0.98 6.88E-16 cha0121a 23.09 151.35 20.17 66.08 11.32 0.98 1.55E-15 cha0204b 23.09 198.48 20.16 66.24 13.88 0.98 1.62E-15 cha0204c 23.09 401.56 20.16 66.33 21.93 0.98 1.97E-15 cha0205d 23.09 601.28 20.19 66.41 26.96 0.98 2.32E-15 cha0205e 23.09 799.47 20.15 66.34 30.61 0.98 2.66E-15 cha0219f 23.09 806.81 20.04 65.72 30.88 0.98 2.67E-15 cha0219g 23.09 996.50 20.05 65.67 33.34 0.98 3.02E-15 cha0219h 23.09 801.47 20.10 65.73 27.99 0.98 2.98E-15 cha0219i 23.09 599.90 20.11 65.77 21.75 0.98 2.99E-15 cha0219j 23.09 399.47 20.16 65.69 15.87 0.98 2.84E-15 cha0219k 23.09 200.97 20.20 65.72 9.28 0.98 2.56E-15 cha0604l 23.09 899.81 20.38 65.36 30.00 0.98 3.10E-15 cha0604m 23.09 1799.80 20.22 65.21 43.20 0.98 3.99E-15 chb0601a 24.00 10.10 20.00 65.57 43.04 1.01 2.19E-17 chb0601b 24.00 49.41 20.00 65.65 59.31 1.01 7.12E-17
B-10
Table B.3 Permeability measurements for borehole X2 - 1.0 m scale (continued).
Test ID Z* <m>
Q (seem)
T (°C)
Patm (cm Hg)
Pss (cm Hg)
L (m)
k (sq m)
chb'0610a chb'0617a chb'0617b
24.07 24.07 24.07
100.82 50.03 100.05
20.44 20.53 20.54
65.69 65.64 65.71
87.45 56.20 68.81
0.98 1.01 1.01
8.76E-17 7.75E-17 1.18E-16
chc0625a chc0625b chc0607a chc0607b chc0607c
25.00 25.00 25.00 25.00 25.00
34.94 74.93 10.09 99.88 401.59
20.46 20.38 20.00 20.00 20.00
65.71 65.60 65.64 65.90 65.92
41.81 55.38 30.85 68.29 132.89
1.01 1.01 1.01 1.01 1.01
7.87E-17 1.18E-16 3.28E-17 1.19E-16 1.86E-16
cia0621a cia0621b
26.00 26.00
10.03 500.70
20.00 20.00
65.99 65.84
18.54 111.32
1.01 1.01
5.85E-17 3.01E-16
cib0628a cib0628b
27.00 27.00
15.24 348.44
20.00 20.00
65.83 66.01
12.05 92.13
1.01 1.01
1.43E-16 2.75E-16
cic0709a cic0709b
28.00 28.00
15.04 397.10
20.54 20.00
66.04 65.88
12.52 97.87
1.01 1.01
1.36E-16 2.88E-16
cja0712a cja0712b
29.00 29.00
15.10 329.70
19.92 19.89
65.75 65.69
14.64 92.29
1.01 1.01
1.15E-16 2.60E-16
cjb0715a cjb0715b
30.00 30.00
15.02 197.30
22.09 22.90
66.07 66.09
28.02 93.53
1.01 1.01
5.49E-17 1.54E-16
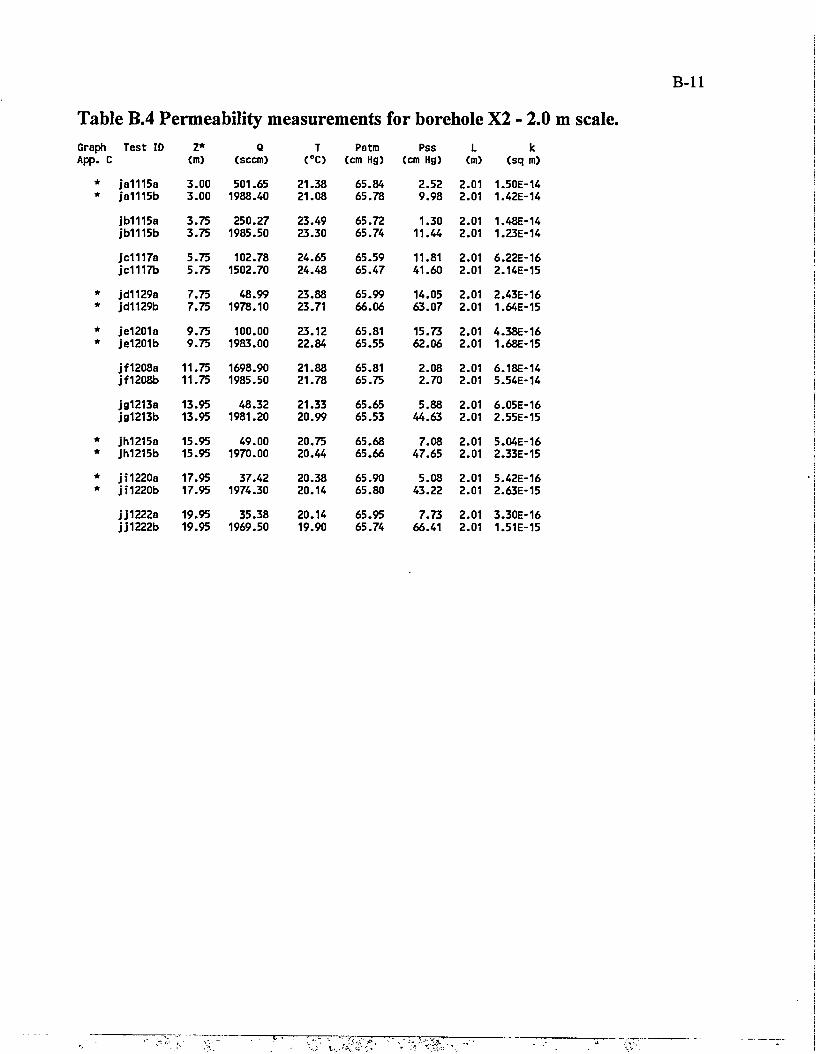
B-ll
Table B.4 Permeability measurements for borehole X2 - 2.0 m scale. Graph App.
Test ID C
Z* (m)
Q (seem)
T (°C)
Patm (cm Hg)
Pss (cm Hg)
L (m)
k (sq m)
* * ja1115a
ja1115b 3.00 3.00
501.65 1988.40
21.38 21.08
65.84 65.78
2.52 9.98
2.01 2.01
1.50E-14 1.42E-14
jb1115a jb1115b
3.75 3.75
250.27 1985.50
23.49 23.30
65.72 65.74
1.30 11.44
2.01 2.01
1.48E-14 1.23E-14
jc1117a jc1117b
5.75 5.75
102.78 1502.70
24.65 24.48
65.59 65.47
11.81 41.60
2.01 2.01
6.22E-16 2.14E-15
* * jd1129a
jd1129b 7.75 7.75
48.99 1978.10
23.88 23.71
65.99 66.06
14.05 63.07
2.01 2.01
2.43E-16 1.64E-15
* * je1201a
je1201b 9.75 9.75
100.00 1983.00
23.12 22.84
65.81 65.55
15.73 62.06
2.01 2.01
4.38E-16 1.68E-15
jf1208a jf1208b
11.75 11.75
1698.90 1985.50
21.88 21.78
65.81 65.75
2.08 2.70
2.01 2.01
6.18E-14 5.54E-14
jg1213a jg1213b
13.95 13.95
48.32 1981.20
21.33 20.99
65.65 65.53
5.88 44.63
2.01 2.01
6.05E-16 2.55E-15
* * jh1215a
jh1215b 15.95 15.95
49.00 1970.00
20.75 20.44
65.68 65.66
7.08 47.65
2.01 2.01
5.04E-16 2.33E-15
* * ji1220a
ji1220b 17.95 17.95
37.42 1974.30
20.38 20.14
65.90 65.80
5.08 43.22
2.01 2.01
5.42E-16 2.63E-15
jj1222a jj1222b
19.95 19.95
35.38 1969.50
20.14 19.90
65.95 65.74
7.73 66.41
2.01 2.01
3.30E-16 1.51E-15
B-12
Table B.5 Permeability measurements for borehole Y2 - 0.5 m scale. Graph Test ID App. C
Z* (m)
Q (seem)
T C O
Patm (cm Hg)
Pss (cm Hg)
L (m)
k (sq m)
jd10313a jd10314b jd10327d jd10328e
2.83 2.83 2.83 2.83
1000.50 501.70 299.90 750.10
16.07 16.29 15.27 15.30
66.08 65.56 65.38 66.02
57.92 35.81 29.57 48.67
0.50 0.50 0.50 0.50
2.26E-15 2.09E-15 1.57E-15 2.11E-15
jd20328a jd20401b jd20401c jd20401d jd20403e
3.33 3.33 3.33 3.33 3.33
499.30 750.00
1000.80 1502.60 2500.00
16.02 15.64 15.90 15.89 15.67
66.00 65.82 65.77 65.74 66.14
5.54 8.55
11.17 16.37 26.44
0.50 0.50 0.50 0.50 0.50
1.63E-14 1.55E-14 1.56E-14 1.54E-14 1.48E-14
jd30403b jd30407c jd30407d jd30407e jd30408f
3.83 3.83 3.83 3.83 3.83
750.00 1203.00 1002.60 750.00 499.90
16.65 16.24 16.51 16.55 16.67
65.96 65.60 65.53 65.51 65.90
36.63 47.78 41.91 34.38 27.03
0.50 0.50 0.50 0.50 0.50
3.03E-15 3.50E-15 3.44E-15 3.28E-15 2.90E-15
jd40415a jd40415b
4.33 4.33
500.00 300.00
17.53 17.50
65.70 65.56
81.54 66.97
0.50 0.50
7.19E-16 5.65E-16
jd50417a Jd50417b jd50423c
4.83 4.83 4.83
201.50 100.00 149.20
18.03 18.09 18.42
65.76 65.59 65.50
61.05 45.47 53.00
0.50 0.50 0.50
4.29E-16 3.12E-16 3.83E-16
jd60418a jd60418b Jd60423c
5.33 5.33 5.33
351.00 499.00 250.00
18.20 18.09 18.51
65.65 65.65 65.56
52.23 64.66 44.40
0.50 0.50 0.50
9.17E-16 9.86E-16 8.04E-16
je10429a je10429b je10429c je10430d je10430e je10430f
5.83 5.83 5.83 5.83 5.83 5.83
300.40 501.40
1000.50 301.00 501.60 999.60
19.03 18.79 18.76 18.82 18.63 18.59
65.80 65.74 65.69 65.95 65.89 65.80
27.10 39.60 66.89 27.19 39.20 66.90
0.50 0.50 0.50 0.50 0.50 0.50
1.75E-15 1.86E-15 1.89E-15 1.75E-15 1.88E-15 1.89E-15
je20510a je20731c je20731d je20731e
6.33 6.33 6.33 6.33
101.20 69.90 90.00
110.00
19.36 22.10 22.05 21.95
65.56 66.50 66.44 66.38
73.80 76.10 82.40 87.44
0.50 0.50 0.50 0.50
1.68E-16 1.11E-16 1.29E-16 1.45E-16
je30513c je30801d je30801e je30801f
6.83 6.83 6.83 6.83
70.30 69.90 80.00 98.60
19.52 21.60 21.70 21.80
65.75 66.35 66.28 66.22
98.63 101.05 102.15 106.67
0.50 0.50 0.50 0.50
7.79E-17 7.50E-17 8.46E-17 9.80E-17
je40806c je40806d je40806e je4'1122
7.33 7.33 7.33 7.33
100.00 200.00 249.50 120.20
21.17 21.69 21.46 23.30
66.26 66.15 66.22 65.20
49.33 75.93 82.86 55.87
0.50 0.50 0.50 0.50
2.82E-16 3.21E-16 3.54E-16 2.94E-16
je51114a je51114b je51114c
7.83 7.83 7.83
70.40 99.60
121.00
23.30 23.35 23.32
64.09 64.40 64.48
71.27 78.59 84.20
0.50 0.50 0.50
1.26E-16 1.56E-16 1.72E-16
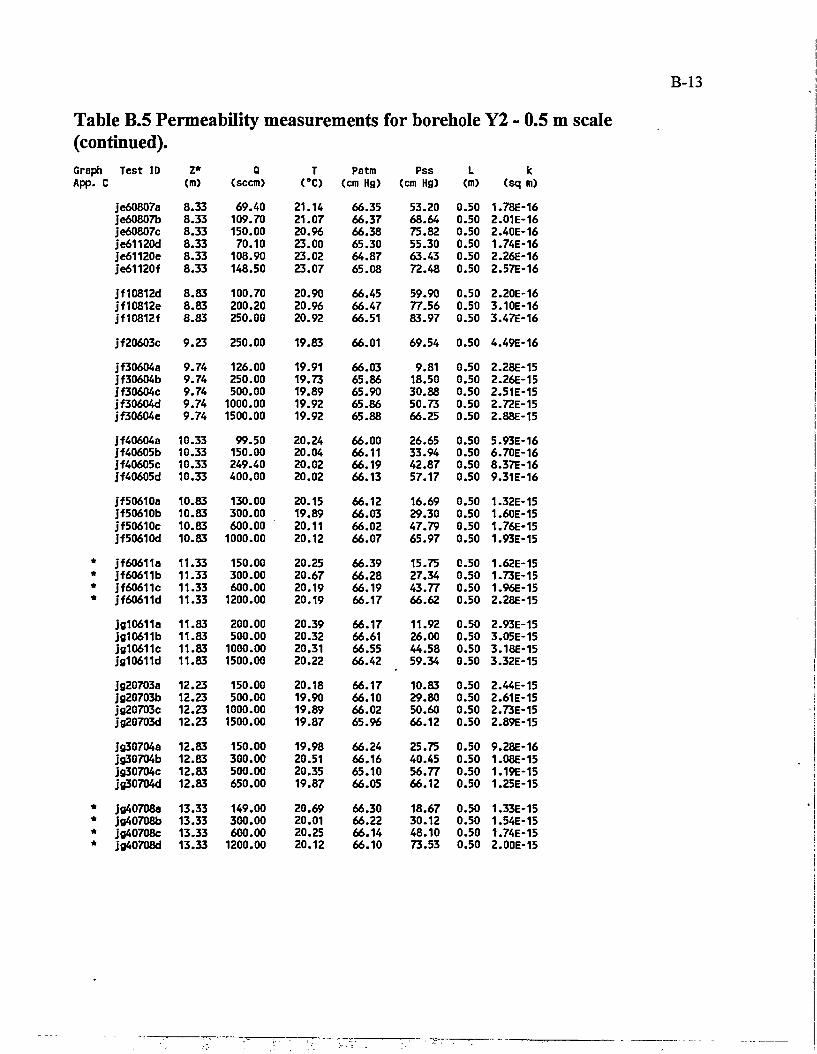
Table B.5 Permeability measurements for borehole Y2 (continued).
0.5
Graph Test ID Z* Q T Patm Pss L k App. C (m) (scon) <°C) (cm Hg) (cm Hg) (m) (sq m)
je60807a 8.33 69.40 21.14 66.35 53.20 0.50 1.78E-16 je60807b 8.33 109.70 21.07 66.37 68.64 0.50 2.01E-16 je60807c 8.33 150.00 20.96 66.38 75.82 0.50 2.40E-16 je61120d 8.33 70.10 23.00 65.30 55.30 0.50 1.74E-16 je61120e 8.33 108.90 23.02 64.87 63.43 0.50 2.26E-16 je61120f 8.33 148.50 23.07 65.08 72.48 0.50 2.57E-16 jf10812d 8.83 100.70 20.90 66.45 59.90 0.50 2.20E-16 Jf10812e 8.83 200.20 20.96 66.47 77.56 0.50 3.10E-16 jf10812f 8.83 250.00 20.92 66.51 83.97 0.50 3.47E-16 jf20603c 9.23 250.00 19.83 66.01 69.54 0.50 4.49E-16 jf30604a 9.74 126.00 19.91 66.03 9.81 0.50 2.28E-15 jf30604b 9.74 250.00 19.73 65.86 18.50 0.50 2.26E-15 jf30604c 9.74 500.00 19.89 65.90 30.88 0.50 2.51E-15 jf30604d 9.74 1000.00 19.92 65.86 50.73 0.50 2.72E-15 jf30604e 9.74 1500.00 19.92 65.88 66.25 0.50 2.88E-15 jf40604a 10.33 99.50 20.24 66.00 26.65 0.50 5.93E-16 jf40605b 10.33 150.00 20.04 66.11 33.94 0.50 6.70E-16 jf40605c 10.33 249.40 20.02 66.19 42.87 0.50 8.37E-16 jf40605d 10.33 400.00 20.02 66.13 57.17 0.50 9.31E-16 jf50610a 10.83 130.00 20.15 66.12 16.69 0.50 1.32E-15 jf50610b 10.83 300.00 19.89 66.03 29.30 0.50 1.60E-15 jf50610c 10.83 600.00 20.11 66.02 47.79 0.50 1.76E-15 jf50610d 10.83 1000.00 20.12 66.07 65.97 0.50 1.93E-15
* if60611a 11.33 150.00 20.25 66.39 15.75 0.50 1.62E-15 * jf60611b 11.33 300.00 20.67 66.28 27.34 0.50 1.73E-15 * if60611c 11.33 600.00 20.19 66.19 43.77 0.50 1.96E-15 * jf60611d 11.33 1200.00 20.19 66.17 66.62 0.50 2.28E-15
j'g10611a 11.83 200.00 20.39 66.17 11.92 0.50 2.93E-15 jg10611b 11.83 500.00 20.32 66.61 26.00 0.50 3.05E-15 jg10611c 11.83 1000.00 20.31 66.55 44.58 0.50 3.18E-15 j'g10611d 11.83 1500.00 20.22 66.42 59.34 0.50 3.32E-15 jg20703a 12.23 150.00 20.18 66.17 10.83 0.50 2.44E-15 ig20703b 12.23 500.00 19.90 66.10 29.80 0.50 2.61E-15 jg20703c 12.23 1000.00 19.89 66.02 50.60 0.50 2.73E-15 jg20703d 12.23 1500.00 19.87 65.96 66.12 0.50 2.89E-15 jg30704a 12.83 150.00 19.98 66.24 25.75 0.50 9.28E-16 jg30704b 12.83 300.00 20.51 66.16 40.45 0.50 1.08E-15 ig30704c 12.83 500.00 20.35 65.10 56.77 0.50 1.19E-15 jg30704d 12.83 650.00 19.87 66.05 66.12 0.50 1.25E-15
* jg40708a 13.33 149.00 20.69 66.30 18.67 0.50 1.33E-15 * ig40708b 13.33 300.00 20.01 66.22 30.12 0.50 1.54E-15 * ig40708c 13.33 600.00 20.25 66.14 48.10 0.50 1.74E-15 * ig40708d 13.33 1200.00 20.12 66.10 73.53 0.50 2.00E-15
B-14
Table B.5 Permeability measurements for borehole Y2 - 0.5 m scale (continued). Graph Test ID Z* Q T Patm Pss L k App. C <m) (seem) (°C) (cm Hg) (cm Hg) (m) (sq m)
jg50709a 13.83 150.00 20.37 66.20 16.42 0.50 1.55E-15 jg50709b 13.83 300.00 20.30 66.05 28.15 0.50 1.68E-15 jg50709c 13.83 600.00 20.28 65.97 46.46 0.50 1.83E-15 jg50709d 13.83 1201.00 20.16 66.05 73.41 0.50 2.01E-15
jg60710a 14.33 150.00 20.15 66.33 16.13 0.50 1.58E-15 jg60710b 14.33 300.00 20.24 66.29 26.91 0.50 1.76E-15 jg60710c 14.33 603.00 20.29 66.25 44.25 0.50 1.94E-15 jg60710d 14.33 1200.00 20.31 66.09 67.90 0.50 2.23E-15
jh10715a 14.83 200.00 20.74 66.45 11.62 0.50 3.01E-15 jh10715b 14.83 400.00 20.10 66.40 20.72 0.50 3.17E-15 jh10715c 14.83 800.00 20.12 66.36 36.50 0.50 3.26E-15 jh10715d 14.83 1600.00 20.15 66.25 60.74 0.50 3.44E-15
jh20715a 15.33 200.00 20.43 66.30 13.16 0.50 2.63E-15 jh20716b 15.33 400.00 20.30 66.60 22.93 0.50 2.82E-15 jh20716c 15.33 800.00 20.28 66.52 40.17 0.50 2.90E-15 jh20716d 15.33 1600.00 20.13 66.49 64.19 0.50 3.19E-15
jh30813a 15.83 250.00 20.28 66.46 12.80 0.50 3.38E-15 jh30813b 15.83 749.00 20.13 66.43 31.66 0.50 3.62E-15 jh30813c 15.83 1401.00 20.16 66.29 50.88 0.50 3.78E-15 jh30704d 15.83 1900.00 20.11 66.22 62.87 0.50 3.90E-15
* jh31112e 15.83 301.00 20.47 65.00 15.82 0.50 3.29E-15 * jh31112f 15.83 649.90 20.25 64.93 30.14 0.50 3.40E-15 * jh31112g 15.83 1500.00 20.77 64.94 57.15 0.50 3.55E-15 * jh31112h 15.83 1949.80 20.70 64.92 68.24 0.50 3.64E-15 » jh31112 15.S3 1499.10 20.70 64.88 55.94 0.50 3.64E-15 * jh31112j 15.83 650.50 20.78 64.77 28.94 0.50 3.58E-15 * jh31112k 15.83 301.00 20.59 64.70 15.04 0.50 3.50E-15
jh40813a 16.33 1515.00 20.09 66.19 3.88 0.50 7.22E-14 jh40813b 16.33 4504.00 19.92 66.24 10.06 0.50 7.91E-14 jh40813d 16.33 10775.00 19.31 66.23 21.41 0.50 8.22E-14 jh40819d 16.33 2495.00 20.56 66.30 5.63 0.50 8.09E-14 jh40819e 16.33 7510.00 19.85 66.40 15.65 0.50 8.14E-14 jh40819f 16.33 15019.00 19.10 66.45 29.16 0.50 7.98E-14 jh40819g 16.33 19040.00 19.00 66.45 35.29 0.50 8.06E-14
* jh50820a 16.83 1020.00 20.29 66.38 45.12 0.50 * jh50820b 16.83 1503.00 20.17 66.30 56.84 0.50 * jh50820c 16.83 2037.00 20.22 66.25 62.60 0.50 * jh50820d 16.83 2500.00 20.09 66.30 66.54 0.50
jh50926e 16.83 1950.00 20.12 66.58 59.94 0.50 4.25E-15 jh50927f 16.83 500.00 20.29 66.50 24.03 0.50 3.34E-15 jh50927g 16.83 1002.00 20.22 66.37 38.26 0.50 3.86E-15 jh50927i 16.83 1952.00 20.19 66.50 57.70 0.50 4.47E-15 jh51008j 16.83 449.20 20.20 66.05 20.41 0.50 3.64E-15 jh51008k 16.83 900.20 20.28 66.12 37.18 0.50 3.60E-15
jh60820a 17.33 200.60 20.27 66.60 11.40 0.50 3.07E-15 jh60820b 17.33 400.00 20.39 66.56 19.62 0.50 3.37E-15 jh60820c 17.33 1000.00 20.32 66.45 40.50 0.50 3.59E-15 jh60820d 17.33 1800.00 20.31 66.45 61.89 0.50 3.77E-15
B-15
Table B.5 Permeability measurements for borehole Y2 - 0.5 m scale (continued). Graph Test ID Z* Q T Patm Pss L k App. C (m) (seem) <°C) (cm Hg) (cm Hg) (m) (sq m)
jj10821a 17.83 200.60 20.23 66.30 8.04 0.50 4.47E-15 jj10821b 17.83 600.50 20.22 66.15 19.41 0.50 5.14E-15 jj10821c 17.83 1200.00 20.29 66.20 33.72 0.50 5.40E-15 jj10821d 17.83 1951.00 20.20 66.20 48.38 0.50 5.62E-15
jJ20827a 18.33 201.00 20.23 66.38 8.88 0.50 4.03E-15 jj20827b 18.33 499.70 20.46 66.28 17.96 0.50 4.66E-15 jj20827c 18.33 1000.00 20.35 66.30 31.61 0.50 4.86E-15 Jj20827d 18.33 1902.00 20.21 66.23 50.84 0.50 5.15E-15
jj30827a 18.83 150.00 20.35 66.26 16.07 0.50 1.58E-15 jj30827b 18.83 298.30 20.42 66.28 25.74 0.50 1.85E-15 Jj30828c 18.83 500.00 20.31 66.45 37.48 0.50 1.98E-15 jj30828d 18.83 1200.00 20.32 66.25 62.68 0.50 2.47E-15 jj30828e 18.83 1500.50 20.30 66.35 71.41 0.50 2.60E-15
jj40829a 19.33 500.00 20.25 66.48 58.19 0.50 1.13E-15 jj40901b 19.33 200.00 20.25 66.31 33.78 0.50 8.97E-16 jj40901c 19.33 700.00 20.34 66.32 69.62 0.50 1.25E-15
jj50902a 19.83 150.00 20.25 66.41 13.40 0.50 1.93E-15 jj50902b 19.83 300.00 20.25 66.45 22.54 0.50 2.16E-15 jj50902c 19.83 600.00 20.25 66.50 37.82 0.50 2.34E-15 jj50902d 19.83 1200.00 20.31 66.62 61.56 0.50 2.52E-15
jj60903a 20.33 80.00 20.26 66.31 37.39 0.50 3.17E-16 jj60903b 20.33 120.00 20.31 66.41 46.66 0.50 3.61E-16 jj60903c 20.33 200.20 20.20 66.38 57.86 0.50 4.58E-16
jk10904a 20.83 69.40 20.20 66.08 34.58 0.50 3.03E-16 j"k10904b 20.83 149.60 20.25 65.99 52.46 0.50 3.90E-16 jk10906c 20.83 220.00 20.25 66.17 65.53 0.50 4.28E-16
jk20906a 21.33 80.00 20.07 66.33 21.42 0.50 6.11E-16 jk20906b 21.33 300.00 20.15 66.30 48.30 0.50 8.66E-16 jk20910c 21.33 200.00 20.06 66.23 36.70 0.50 8.12E-16 jk20910d 21.33 450.90 20.23 66.33 58.52 0.50 1.02E-15
jk30911a 21.83 99.50 20.19 66.21 24.89 0.50 6.41E-16 jk30911b 21.83 200.20 20.21 66.11 39.18 0.50 7.52E-16 jk30911c 21.83 300.00 20.15 66.10 48.51 0.50 8.63E-16
jk40912a 22.33 70.00 20.02 66.13 20.56 0.50 5.61E-16 jk40912b 22.33 200.00 20.17 66.19 40.20 0.50 7.27E-16 jk40913c 22.33 350.00 20.10 66.14 54.94 0.50 8.58E-16 jk40915d 22.33 150.00 20.15 66.38 33.27 0.50 6.85E-16 jk41119f 22.33 99.50 20.27 65.41 23.59 0.50 6.89E-16 jk41119g 22.33 250.00 20.20 65.59 42.79 0.50 8.47E-16 Jk41119h 22.33 399.80 20.21 65.51 57.44 0.50 9.31E-16 jk41119i 22.33 599.50 20.07 65.50 72.83 0.50 1.02E-15
Jk50914a 22.83 200.00 20.01 65.15 23.00 0.50 1.43E-15 jk50914b 22.83 400.00 20.16 66.11 40.46 0.50 1.44E-15 jk50914c 22.83 700.00 20.18 66.20 59.10 0.50 1.56E-15 jk50914d 22.83 700.40 20.18 66.26 59.21 0.50 1.56E-15
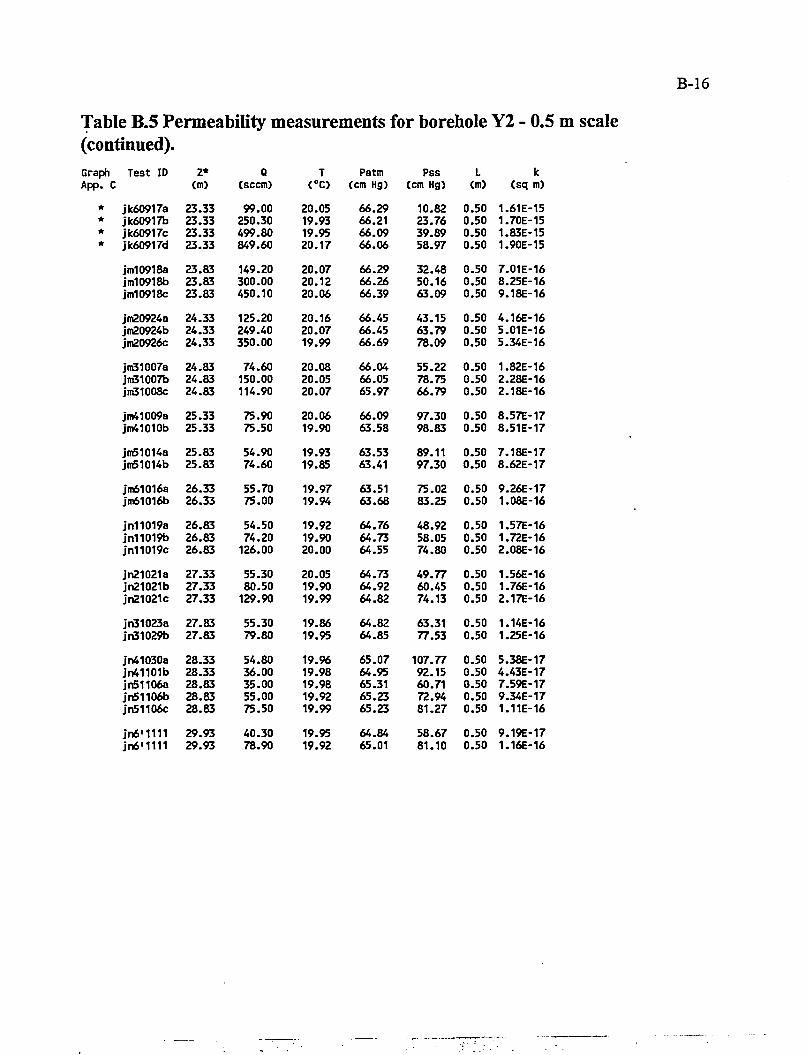
B-16
Table B.5 Permeability measurements for borehole Y2 - 0.5 m scale (continued).
Test ID 2* (m)
Q (seem)
T (°C)
Patm (cm Hg)
Pss (cm Hg)
L (ID)
k (sq m)
jk60917a jk60917b jk60917c jk60917d
23.33 23.33 23.33 23.33
99.00 250.30 499.80 849.60
20.05 19.93 19.95 20.17
66.29 66.21 66.09 66.06
10.82 23.76 39.89 58.97
0.50 0.50 0.50 0.50
1.61E-15 1.70E-15 1.83E-15 1.90E-15 III 23.83
23.83 23.83
149.20 300.00 450.10
20.07 20.12 20.06
66.29 66.26 66.39
32.48 50.16 63.09
0.50 0.50 0.50
7.01E-16 8.25E-16 9.18E-16
jm20924a jm20924b jm20926c
24.33 24.33 24.33
125.20 249.40 350.00
20.16 20.07 19.99
66.45 66.45 66.69
43.15 63.79 78.09
0.50 0.50 0.50
4.16E-16 5.01E-16 5.34E-16
jm31007a jm31007b jm31008c
24.83 24.83 24.83
74.60 150.00 114.90
20.08 20.05 20.07
66.04 66.05 65.97
55.22 78.75 66.79
0.50 0.50 0.50
1.82E-16 2.28E-16 2.18E-16
jm41009a jm41010b
25.33 25.33
75.90 75.50
20.06 19.90
66.09 63.58
97.30 98.83
0.50 0.50
8.57E-17 8.51E-17
jm51014a jm51014b
25.83 25.83
54.90 74.60
19.93 19.85
63.53 63.41
89.11 97.30
0.50 0.50
7.18E-17 8.62E-17
jm61016a jm61016b
26.33 26.33
55.70 75.00
19.97 19.94
63.51 63.68
75.02 83.25
0.50 0.50
9.26E-17 1.08E-16
jn11019a jnl1019b jnl1019c
26.83 26.83 26.83
54.50 74.20 126.00
19.92 19.90 20.00
64.76 64.73 64.55
48.92 58.05 74.80
0.50 0.50 0.50
1.57E-16 1.72E-16 2.08E-16
ill 27.33 27.33 27.33
55.30 80.50 129.90
20.05 19.90 19.99
64.73 64.92 64.82
49.77 60.45 74.13
0.50 0.50 0.50
1.56E-16 1.76E-16 2.17E-16
jn31023a jn31029b
27.83 27.83
55.30 79.80
19.86 19.95
64.82 64.85
63.31 77.53
0.50 0.50
1.14E-16 1.25E-16
jn41030a jn41101b jn51106a jn51106b jn51106c
28.33 28.33 28.83 28.83 28.83
54.80 36.00 35.00 55.00 75.50
19.96 19.98 19.98 19.92 19.99
65.07 64.95 65.31 65.23 65.23
107.77 92.15 60.71 72.94 81.27
0.50 0.50 0.50 0.50 0.50
5.38E-17 4.43E-17 7.59E-17 9.34E-17 1.11E-16
jn6'1111 jn6'1111
29.93 29.93
40.30 78.90
19.95 19.92
64.84 65.01
58.67 81.10
0.50 0.50
9.19E-17 1.16E-16
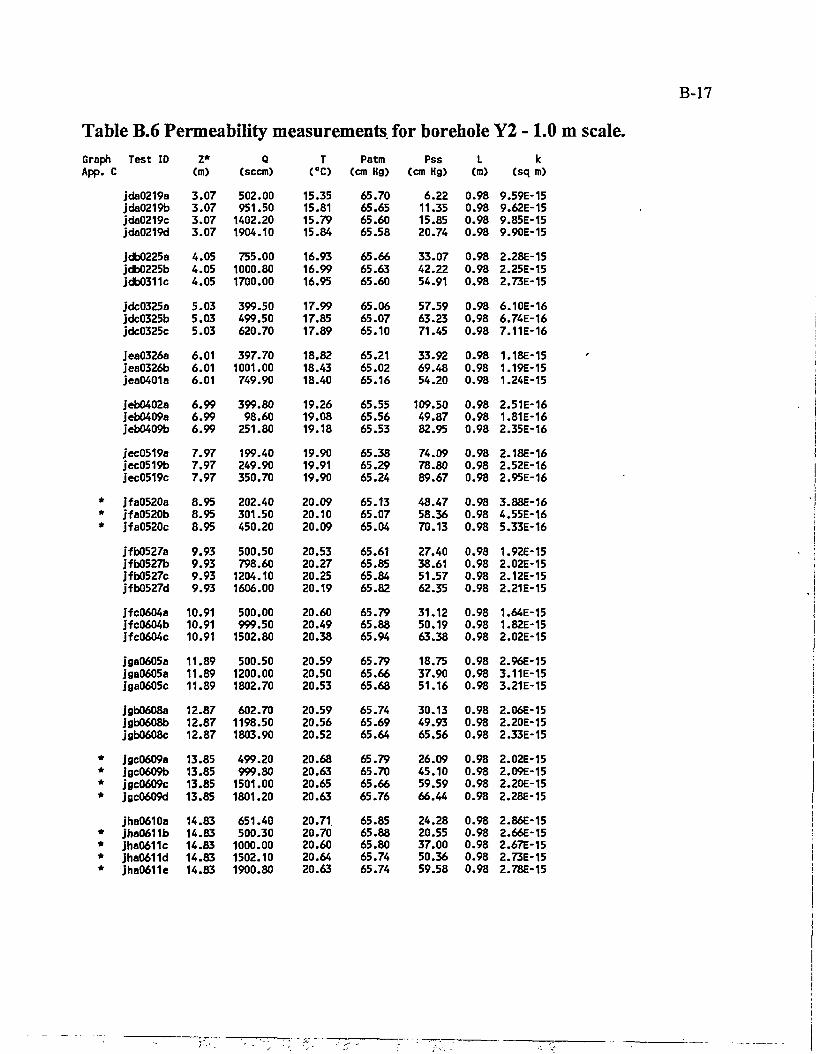
B-17
Table B.6 Permeability measurements, for borehole Y2 - 1.0 m scale Graph Test ID App. C
Z* (m)
Q (seem)
T (°C)
Patm (cm Hg)
Pss (cm Hg)
L (m)
k (sq m)
jda0219a jda0219b jda0219c jda0219d
3.07 3.07 3.07 3.07
502.00 951.50
1402.20 1904.10
15.35 15.81 15.79 15.84
65.70 65.65 65.60 65.58
6.22 11.35 15.85 20.74
0.98 0.98 0.98 0.98
9.59E-15 9.62E-15 9.85E-15 9.90E-15
jdb0225a jdb0225b jdb0311c
4.05 4.05 4.05
755.00 1000.80 1700.00
16.93 16.99 16.95
65.66 65.63 65.60
33.07 42.22 54.91
0.98 0.98 0.98
2.28E-15 2.25E-15 2.73E-15
jdc0325a jdc0325b jdc0325c
5.03 5.03 5.03
399.50 499.50 620.70
17.99 17.85 17.89
65.06 65.07 65.10
57.59 63.23 71.45
0.98 0.98 0.98
6.10E-16 6.74E-16 7.11E-16
jea0326a Jea0326b jea0401a
6.01 6.01 6.01
397.70 1001.00 749.90
18.82 18.43 18.40
65.21 65.02 65.16
33.92 69.48 54.20
0.98 0.98 0.98
1.18E-15 1.19E-15 1.24E-15
.*
jeb0402a jeb0409a jeb0409b
6.99 6.99 6.99
399.80 98.60
251.80
19.26 19.08 19.18
65.55 65.56 65.53
109.50 49.87 82.95
0.98 0.98 0.98
2.51E-16 1.81E-16 2.35E-16
jec0519a jec0519b jec0519c
7.97 7.97 7.97
199.40 249.90 350.70
19.90 19.91 19.90
65.38 65.29 65.24
74.09 78.80 89.67
0.98 0.98 0.98
2.18E-16 2.52E-16 2.95E-16
* Jfa0520a * jfa0520b * jfa0520c
8.95 8.95 8.95
202.40 301.50 450.20
20.09 20.10 20.09
65.13 65.07 65.04
48.47 58.36 70.13
0.98 0.98 0.98
3.88E-16 4.55E-16 5.33E-16
jfb0527a jfb0527b jfb0527c jfb0527d
9.93 9.93 9.93 9.93
500.50 798.60
1204.10 1606.00
20.53 20.27 20.25 20.19
65.61 65.85 65.84 65.82
27.40 38.61 51.57 62.35
0.98 0.98 0.98 0.98
1.92E-15 2.02E-15 2.12E-15 2.21E-15
jfc0604a jfc0604b jfc0604c
10.91 10.91 10.91
500.00 999.50
1502.80
20.60 20.49 20.38
65.79 65.88 65.94
31.12 50.19 63.38
0.98 0.98 0.98
1.64E-15 1.82E-15 2.02E-15
jga0605a jga0605a jga0605c
11.89 11.89 11.89
500.50 1200.00 1802.70
20.59 20.50 20.53
65.79 65.66 65.68
18.75 37.90 51.16
0.98 0.98 0.98
2.96E-15 3.11E-15 3.21E-15
jgb0608a jgb0608b jgb0608c
12.87 12.87 12.87
602.70 1198.50 1803.90
20.59 20.56 20.52
65.74 65.69 65.64
30.13 49.93 65.56
0.98 0.98 0.98
2.06E-15 2.20E-15 2.33E-15
* jgc0609a * jgc0609b * jgc0609c * jgc0609d
13.85 13.85 13.85 13.85
499.20 999.80
1501.00 1801.20
20.68 20.63 20.65 20.63
65.79 65.70 65.66 65.76
26.09 45.10 59.59 66.44
0.98 0.98 0.98 0.98
2.02E-15 2.09E-15 2.20E-15 2.28E-15
jha0610a * jha0611b * jha0611c * jha0611d * jha0611e
14.83 14.83 14.83 14.83 14.83
651.40 500.30
1000.00 1502.10 1900.80
20.71 20.70 20.60 20.64 20.63
65.85 65.88 65.80 65.74 65.74
24.28 20.55 37.00 50.36 59.58
0.98 0.98 0.98 0.98 0.98
2.86E-15 2.66E-15 2.67E-15 2.73E-15 2.78E-15
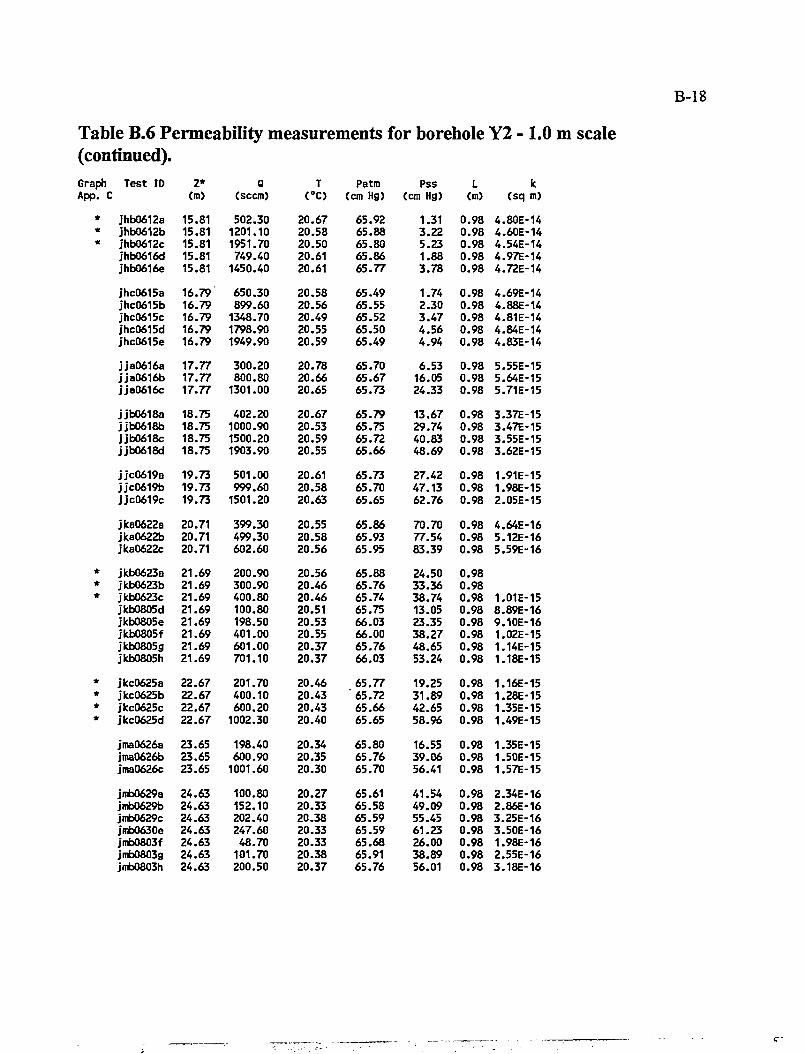
B-18
Tab le B.6 Permeability measurements for borehole Y2 - 1.0 m scale (continued). Graph Test ID Z* Q T Patm Pss L k App. C (m) (seem) <°C> (cm Hg) (cm Hg) (m) (sq m)
* jhb0612a 15.81 502.30 20.67 65.92 1.31 0.98 4.80E-14 * jhb0612b 15.81 1201.10 20.58 65.88 3.22 0.98 4.60E-14 * jhb0612c 15.81 1951.70 20.50 65.80 5.23 0.98 4.54E-14
Jhb0616d 15.81 749.40 20.61 65.86 1.88 0.98 4.97E-14 jhb0616e 15.81 1450.40 20.61 65.77 3.78 0.98 4.72E-14
jhc0615a 16.79 650.30 20.58 65.49 1.74 0.98 4.69E-14 jhc0615b 16.79 899.60 20.56 65.55 2.30 0.98 4.88E-14 jhc0615c 16.79 1348.70 20.49 65.52 3.47 0.98 4.81E-14 jhc0615d 16.79 1798.90 20.55 65.50 4.56 0.98 4.84E-14 jhc0615e 16.79 1949.90 20.59 65.49 4.94 0.98 4.83E-14
jja0616a 17.77 300.20 20.78 65.70 6.53 0.98 5.55E-15 jja0616b 17.77 800.80 20.66 65.67 16.05 0.98 5.64E-15 jja0616c 17.77 1301.00 20.65 65.73 24.33 0.98 5.71E-15
jjb0618a 18.75 402.20 20.67 65.79 13.67 0.98 3.37E-15 jjb0618b 18.75 1000.90 20.53 65.75 29.74 0.98 3.47E-15 jjb0618c 18.75 1500.20 20.59 65.72 40.83 0.98 3.55E-15 jjb0618d 18.75 1903.90 20.55 65.66 48.69 0.98 3.62E-15
jjc0619a 19.73 501.00 20.61 65.73 27.42 0.98 1.91E-15 jjc0619b 19.73 999.60 20.58 65.70 47.13 0.98 1.98E-15 jjc0619c 19.73 1501.20 20.63 65.65 62.76 0.98 2.05E-15
jka0622a 20.71 399.30 20.55 65.86 70.70 0.98 4.64E-16 jka0622b 20.71 499.30 20.58 65.93 77.54 0.98 5.12E-16 jka0622c 20.71 602.60 20.56 65.95 83.39 0.98 5.59E-16
* jkb0623a 21.69 200.90 20.56 65.88 24.50 0.98 • jkb0623b 21.69 300.90 20.46 65.76 33.36 0.98 * jkb0623c 21.69 400.80 20.46 65.74 38.74 0.98 1.01E-15
jkb0805d 21.69 100.80 20.51 65.75 13.05 0.98 8.89E-16 jkb0805e 21.69 198.50 20.53 66.03 23.35 0.98 9.10E-16 jkb0805f 21.69 401.00 20.55 66.00 38.27 0.98 1.02E-15 jkb0805g 21.69 601.00 20.37 65.76 48.65 0.98 1.14E-15 jkb0805h 21.69 701.10 20.37 66.03 53.24 0.98 1.18E-15
* jkc0625a 22.67 201.70 20.46 65.77 19.25 0.98 1.16E-15 * jkc0625b 22.67 400.10 20.43 65.72 31.89 0.98 1.28E-15 * jkc0625c 22.67 600.20 20.43 65.66 42.65 0.98 1.35E-15 * jkc0625d 22.67 1002.30 20.40 65.65 58.96 0.98 1.49E-15
jma0626a 23.65 198.40 20.34 65.80 16.55 0.98 1.35E-15 jma0626b 23.65 600.90 20.35 65.76 39.06 0.98 1.50E-15 Jma0626c 23.65 1001.60 20.30 65.70 56.41 0.98 1.57E-15
jmb0629a 24.63 100.80 20.27 65.61 41.54 0.98 2.34E-16 jmb0629b 24.63 152.10 20.33 65.58 49.09 0.98 2.86E-16 jmb0629c 24.63 202.40 20.38 65.59 55.45 0.98 3.25E-16 jmb0630e 24.63 247.60 20.33 65.59 61.23 0.98 3.50E-16 jmb0803f 24.63 48.70 20.33 65.68 26.00 0.98 1.98E-16 jmb0803g 24.63 101.70 20.38 65.91 38.89 0.98 2.55E-16 jmb0803h 24.63 200.50 20.37 65.76 56.01 0.98 3.18E-16
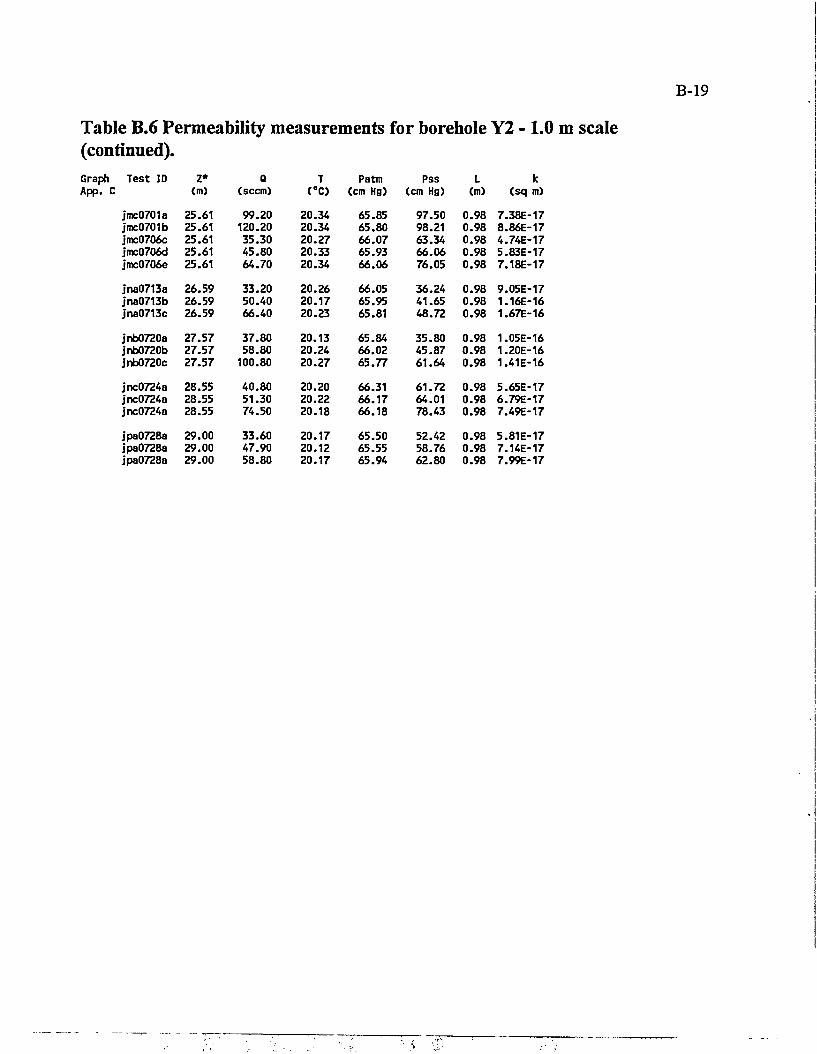
B-19
Table B.6 Permeability measurements for borehole Y2 - 1.0 m scale (continued). Graph Test ID App. C
Z* (m)
Q (seem)
T (°C)
Patm (cm Hg)
Pss (cm Hg)
L (m)
k (sq m)
jmc0701a jmc0701b jmc0706c jmc0706d jmc0706e
25.61 25.61 25.61 25.61 25.61
99.20 120.20 35.30 45.80 64.70
20.34 20.34 20.27 20.33 20.34
65.85 65.80 66.07 65.93 66.06
97.50 98.21 63.34 66.06 76.05
0.98 0.98 0.98 0.98 0.98
7.38E-17 8.86E-17 4.74E-17 5.83E-17 7.18E-17
jna0713a jna0713b jna0713c
26.59 26.59 26.59
33.20 50.40 66.40
20.26 20.17 20.23
66.05 65.95 65.81
36.24 41.65 48.72
0.98 0.98 0.98
9.05E-17 1.16E-16 1.67E-16
jnb0720a jnb0720b jnb0720c
27.57 27.57 27.57
37.80 58.80 100.80
20.13 20.24 20.27
65.84 66.02 65.77
35.80 45.87 61.64
0.98 0.98 0.98
1.05E-16 1.20E-16 1.41E-16
jnc0724a jnc0724a jnc0724a
28.55 28.55 28.55
40.80 51.30 74.50
20.20 20.22 20.18
66.31 66.17 66.18
61.72 64.01 78.43
0.98 0.98 0.98
5.65E-17 6.79E-17 7.49E-17
jpa0728a jpa0728a jpa0728a
29.00 29.00 29.00
33.60 47.90 58.80
20.17 20.12 20.17
65.50 65.55 65.94
52.42 58.76 62.80
0.98 0.98 0.98
5.81E-17 7.14E-17 7.99E-17
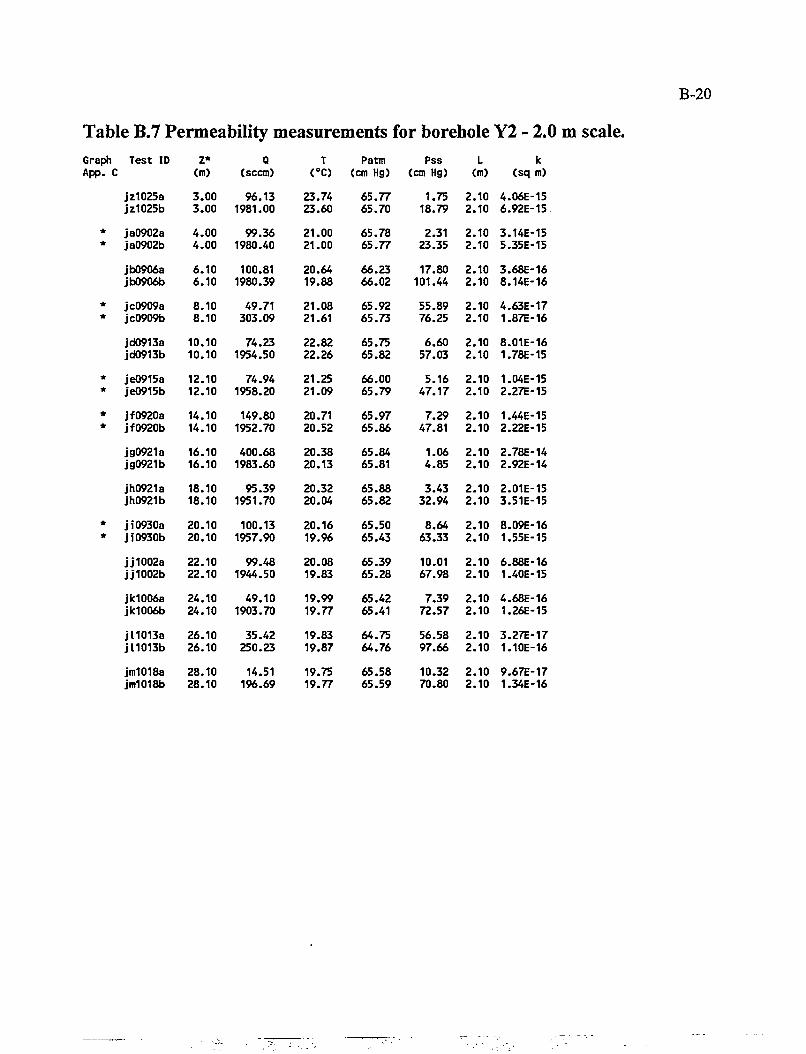
B-20
Table B.7 Permeability measurements for borehole Y2 - 2.0 m scale. Graph App. C
Test ID Z* (m)
Q (seem)
T (°C)
Patm (cm Hg)
Pss (cm Hg)
L (m)
k (sq m)
jz1025a jz1025b
3.00 3.00
96.13 1981.00
23.74 23.60
65.77 65.70
1.75 18.79
2.10 2.10
4.06E-15 6.92E-15
* * ja0902a
ja0902b 4.00 4.00
99.36 1980.40
21.00 21.00
65.78 65.77
2.31 23.35
2.10 2.10
3.14E-15 5.35E-15
jb0906a jb0906b
6.10 6.10
100.81 1980.39
20.64 19.88
66.23 66.02
17.80 101.44
2.10 2.10
3.68E-16 8.14E-16
* * jc0909a
jc0909b 8.10 8.10
49.71 303.09
21.08 21.61
65.92 65.73
55.89 76.25
2.10 2.10
4.63E-17 1.87E-16
jd0913a jd0913b
10.10 10.10
74.23 1954.50
22.82 22.26
65.75 65.82
6.60 57.03
2.10 2.10
8.01E-16 1.78E-15
* * je0915a
je0915b 12.10 12.10
74.94 1958.20
21.25 21.09
66.00 65.79
5.16 47.17
2.10 2.10
1.04E-15 2.27E-15
* * jf0920a
jf0920b 14.10 14.10
149.80 1952.70
20.71 20.52
65.97 65.86
7.29 47.81
2.10 2.10
1.44E-15 2.22E-15
jg0921a jg0921b
16.10 16.10
400.68 1983.60
20.38 20.13
65.84 65.81
1.06 4.85
2.10 2.10
2.78E-14 2.92E-14
jh0921a Jh0921b
18.10 18.10
95.39 1951.70
20.32 20.04
65.88 65.82
3.43 32.94
2.10 2.10
2.01E-15 3.51E-15
* * ji0930a
ji0930b 20.10 20.10
100.13 1957.90
20.16 19.96
65.50 65.43
8.64 63.33
2.10 2.10
8.09E-16 1.55E-15
jj1002a jj1002b
22.10 22.10
99.48 1944.50
20.08 19.83
65.39 65.28
10.01 67.98
2.10 2.10
6.88E-16 1.40E-15
jk1006a jk1006b
24.10 24.10
49.10 1903.70
19.99 19.77
65.42 65.41
7.39 72.57
2.10 2.10
4.68E-16 1.26E-15
j11013a j 11013b
26.10 26.10
35.42 250.23
19.83 19.87
64.75 64.76
56.58 97.66
2.10 2.10
3.27E-17 1.10E-16
jm1018a jm1018b
28.10 28.10
14.51 196.69
19.75 19.77
65.58 65.59
10.32 70.80
2.10 2.10
9.67E-17 1.34E-16
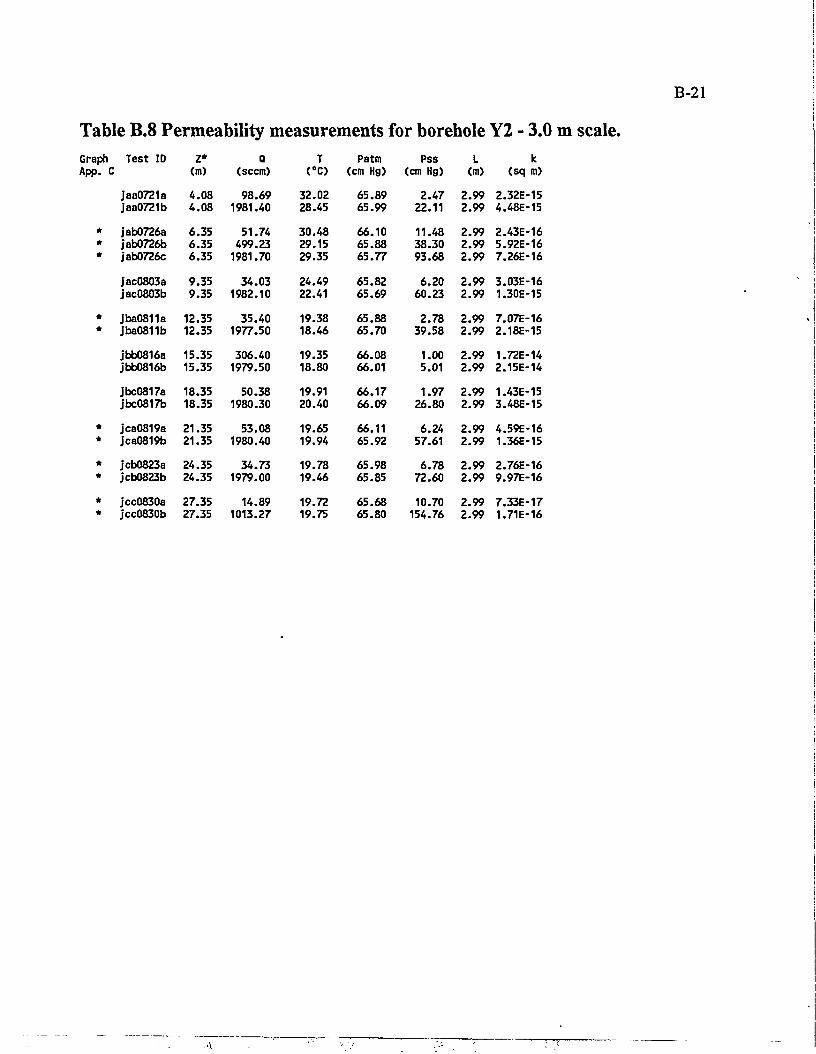
Table B.8 Permeability measurements for borehole Y2 - 3.0 m scale Graph App. C
Test ID Z* (m)
Q (seem)
T (°C)
Patm (cm Hg)
Pss (cm Hg)
L (m)
k (sq m)
jaa0721a jaa0721b
4.08 4.08
98.69 1981.40
32.02 28.45
65.89 65.99
2.47 22.11
2.99 2.99
2.32E-15 4.48E-15
* * *
jab0726a jab0726b jab0726c
6.35 6.35 6.35
51.74 499.23 1981.70
30.48 29.15 29.35
66.10 65.88 65.77
11.48 38.30 93.68
2.99 2.99 2.99
2.43E-16 5.92E-16 7.26E-16
jac0803a jac0803b
9.35 9.35
34.03 1982.10
24.49 22.41
65.82 65.69
6.20 60.23
2.99 2.99
3.03E-16 1.30E-15
* * jba0811a
jba0811b 12.35 12.35
35.40 1977.50
19.38 18.46
65.88 65.70
2.78 39.58
2.99 2.99
7.07E-16 2.18E-15
jbb0816a jbb0816b
15.35 15.35
306.40 1979.50
19.35 18.80
66.08 66.01
1.00 5.01
2.99 2.99
1.72E-14 2.15E-14
jbc0817a jbc0817b
18.35 18.35
50.38 1980.30
19.91 20.40
66.17 66.09
1.97 26.80
2.99 2.99
1.43E-15 3.48E-15
* * jca0819a
jca0819b 21.35 21.35
53.08 1980.40
19.65 19.94
66.11 65.92
6.24 57.61
2.99 2.99
4.59E-16 1.36E-15
* * jcb0823a
jcb0823b 24.35 24.35
34.73 1979.00
19.78 19.46
65.98 65.85
6.78 72.60
2.99 2.99
2.76E-16 9.97E-16
* * jcc0830a
jcc0830b 27.35 27.35
14.89 1013.27
19.72 19.75
65.68 65.80
10.70 154.76
2.99 2.99
7.33E-17 1.71E-16
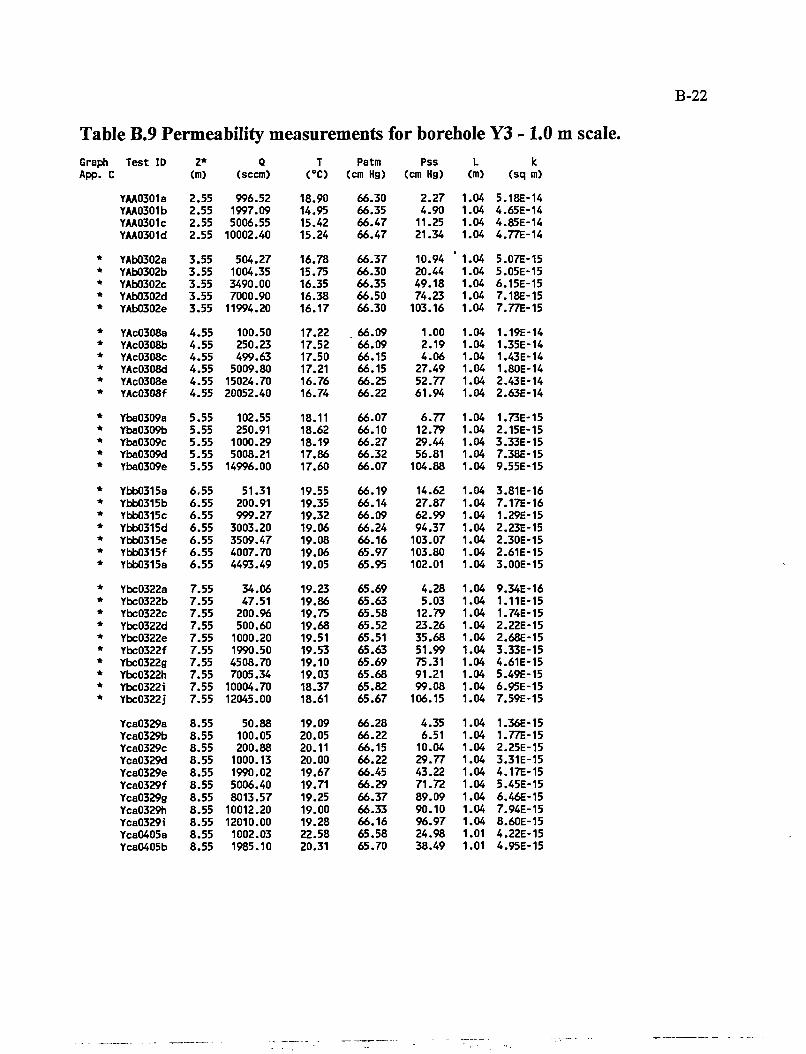
B-22
Table B.9 Permeability measurements for borehole Y3 - 1.0 m scale. Graph Test ID Z* Q T Patm Pss L k App. C (m) (seem) (°C> (cm Hg) (cm Hg) (m) (sq m)
YAA0301a 2.55 996.52 18.90 66.30 2.27 1.04 5.18E-14 YAA0301b 2.55 1997.09 14.95 66.35 4.90 1.04 4.65E-14 YAA0301c 2.55 5006.55 15.42 66.47 11.25 1.04 4.85E-14 YAA0301d 2.55 10002.40 15.24 66.47 21.34 1.04 4.77E-14
* YAb0302a 3.55 504.27 16.78 66.37 10.94 " 1.04 5.07E-15 * YAb0302b 3.55 1004.35 15.75 66.30 20.44 1.04 5.05E-15 * YAb0302c 3.55 3490.00 16.35 66.35 49.18 1.04 6.15E-15 * YAb0302d 3.55 7000.90 16.38 66.50 74.23 1.04 7.18E-15 * YAbO302e 3.55 11994.20 16.17 66.30 103.16 1.04 7.77E-15 * YAc0308a 4.55 100.50 17.22 66.09 1.00 1.04 1.19E-14 * YAc0308b 4.55 250.23 17.52 66.09 2.19 1.04 1.35E-14 * YAc0308c 4.55 499.63 17.50 66.15 4.06 1.04 1.43E-14 * YAc0308d 4.55 5009.80 17.21 66.15 27.49 1.04 1.80E-14 * YAc0308e 4.55 15024.70 16.76 66.25 52.77 1.04 2.43E-14 * YAc0308f 4.55 20052.40 16.74 66.22 61.94 1.04 2.63E-14 * Yba0309a 5.55 102.55 18.11 66.07 6.77 1.04 1.73E-15 * Yba0309b 5.55 250.91 18.62 66.10 12.79 1.04 2.15E-15 * Yba0309c 5.55 1000.29 18.19 66.27 29.44 1.04 3.33E-15 * Yba0309d 5.55 5008.21 17.86 66.32 56.81 1.04 7.38E-15 * Yba0309e 5.55 14996.00 17.60 66.07 104.88 1.04 9.55E-15 * Ybb0315a 6,55 51.31 19.55 66.19 14.62 1.04 3.81E-16 * Ybb0315b 6.55 200.91 19.35 66.14 27.87 1.04 7.17E-16 * Ybb0315c 6.55 999.27 19.32 66.09 62.99 1.04 1.29E-15 * Ybb0315d 6.55 3003.20 19.06 66.24 94.37 1.04 2.23E-15 * Ybb0315e 6.55 3509.47 19.08 66.16 103.07 1.04 2.30E-15 * Ybb0315f 6.55 4007.70 19.06 65.97 103.80 1.04 2.61E-15 * Ybb0315a 6.55 4493.49 19.05 65.95 102.01 1.04 3.00E-15 * Ybc0322a 7.55 34.06 19.23 65.69 4.28 1.04 9.34E-16 * Ybc0322b 7.55 47.51 19.86 65.63 5.03 1.04 1.11E-15 * Ybc0322c 7.55 200.96 19.75 65.58 12.79 1.04 1.74E-15 * Ybc0322d 7.55 500.60 19.68 65.52 23.26 1.04 2.22E-15 * Ybc0322e 7.55 1000.20 19.51 65.51 35.68 1.04 2.68E-15 * Ybc0322f 7.55 1990.50 19.53 65.63 51.99 1.04 3.33E-15 * Ybc0322g 7.55 4508.70 19.10 65.69 75.31 1.04 4.61E-15 * Ybc0322h 7.55 7005.34 19.03 65.68 91.21 1.04 5.49E-15 * Ybc0322i 7.55 10004.70 18.37 65.82 99.08 1.04 6.95E-15 * Ybc0322j 7.55 12045.00 18.61 65.67 106.15 1.04 7.59E-15
Yca0329a 8.55 50.88 19.09 66.28 4.35 1.04 1.36E-15 Yca0329b 8.55 100.05 20.05 66.22 6.51 1.04 1.77E-15 Yca0329c 8.55 200.88 20.11 66.15 10.04 1.04 2.25E-15 Yca0329d 8.55 1000.13 20.00 66.22 29.77 1.04 3.31E-15 Yca0329e 8.55 1990.02 19.67 66.45 43.22 1.04 4.17E-15 Yca0329f 8.55 5006.40 19.71 66.29 71.72 1.04 5.45E-15 Yca0329g 8.55 8013.57 19.25 66.37 89.09 1.04 6.46E-15 Yca0329h 8.55 10012.20 19.00 66.33 90.10 1.04 7.94E-15 Yca0329i 8.55 12010.00 19.28 66.16 96.97 1.04 8.60E-15 Yca0405a 8.55 1002.03 22.58 65.58 24.98 1.01 4.22E-15 Yca0405b 8.55 1985.10 20.31 65.70 38.49 1.01 4.95E-15
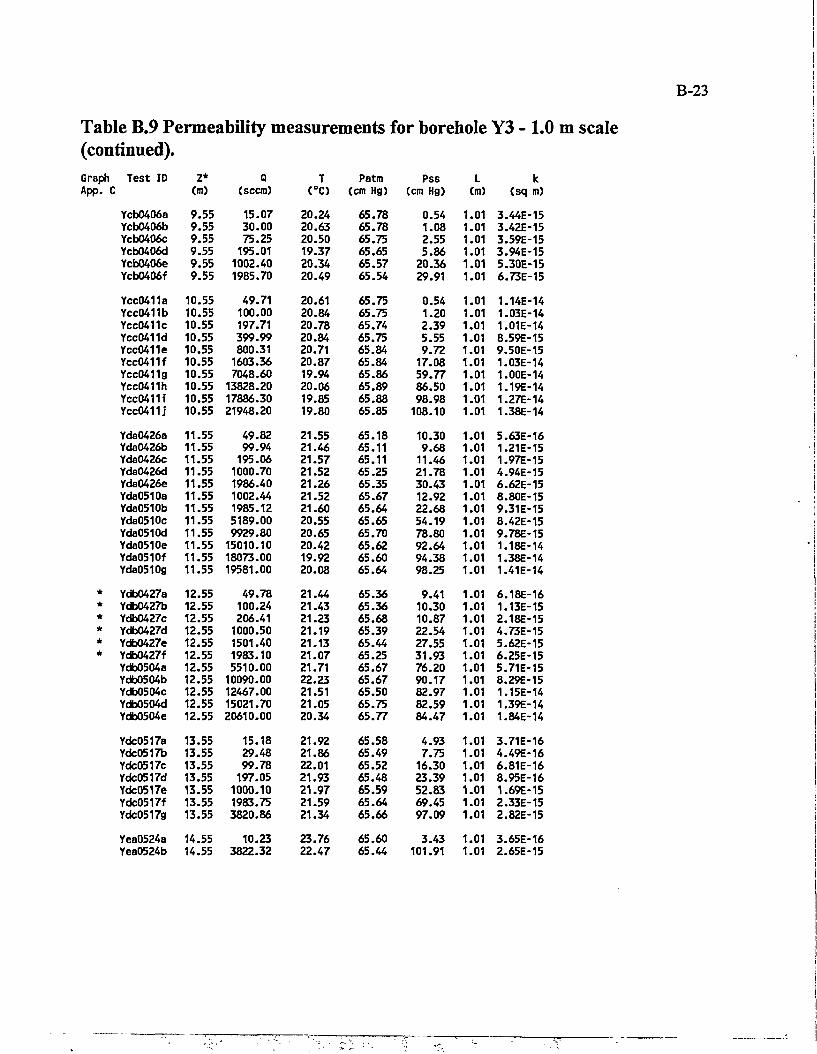
Table B.9 P ermei ibility measurements for borehole Y3 - 1.0 m scale (continued). Graph Test ID z* Q T Patm Pss L k App. C (m) (seem) C O (cm Hg) (cm Hg) (m) (sq m)
Ycb0406a 9.55 15.07 20.24 65.78 0.54 1.01 3.44E-15 Ycb0406b 9.55 30.00 20.63 65.78 1.08 1.01 3.42E-15 Ycb0406c 9.55 75.25 20.50 65.75 2.55 1.01 3.59E-15 Ycb0406d 9.55 195.01 19.37 65.65 5.86 1.01 3.94E-15 Ycb0406e 9.55 1002.40 20.34 65.57 20.36 1.01 5.30E-15 Ycb0406f 9.55 1985.70 20.49 65.54 29.91 1.01 6.73E-15
Ycc0411a 10.55 49.71 20.61 65.75 0.54 1.01 1.14E-14 Ycc0411b 10.55 100.00 20.84 65.75 1.20 1.01 1.03E-14 Ycc0411c 10.55 197.71 20.78 65.74 2.39 1.01 1.01E-14 Ycc0411d 10.55 399.99 20.84 65.75 5.55 1.01 8.59E-15 Ycc0411e 10.55 800.31 20.71 65.84 9.72 1.01 9.50E-15 Ycc0411f 10.55 1603.36 20.87 65.84 17.08 1.01 1.03E-14 Ycc0411g 10.55 7048.60 19.94 65.86 59.77 1.01 1.00E-14 Ycc0411h 10.55 13828.20 20.06 65.89 86.50 1.01 1.19E-14 Ycc0411i 10.55 17886.30 19.85 65.88 98.98 1.01 1.27E-14 Ycc0411j 10.55 21948.20 19.80 65.85 108.10 1.01 1.38E-14
Yda0426a 11.55 49.82 21.55 65.18 10.30 1.01 5.63E-16 Yda0426b 11.55 99.94 21.46 65.11 9.68 1.01 1.21E-15 Yda0426c 11.55 195.06 21.57 65.11 11.46 1.01 1.97E-15 Yda0426d 11.55 1000.70 21.52 65.25 21.78 1.01 4.94E-15 Yda0426e 11.55 1986.40 21.26 65.35 30.43 1.01 6.62E-15 Yda0510a 11.55 1002.44 21.52 65.67 12.92 1.01 8.80E-15 Yda0510b 11.55 1985.12 21.60 65.64 22.68 1.01 9.31E-15 Yda0510c 11.55 5189.00 20.55 65.65 54.19 1.01 8.42E-15 Yda0510d 11.55 9929.80 20.65 65.70 78.80 1.01 9.78E-15 Yda0510e 11.55 15010.10 20.42 65.62 92.64 1.01 1.18E-14 Yda0510f 11.55 18073.00 19.92 65.60 94.38 1.01 1.38E-14 Yda0510g 11.55 19581.00 20.08 65.64 98.25 1.01 1.41E-14
* Ydb0427a 12.55 49.78 21.44 65.36 9.41 1.01 6.18E-16 * Ydb0427b 12.55 100.24 21.43 65.36 10.30 1.01 1.13E-15 * Ydb0427c 12.55 206.41 21.23 65.68 10.87 1.01 2.18E-15 * Ydb0427d 12.55 1000.50 21.19 65.39 22.54 1.01 4.73E-15 * Ydb0427e 12.55 1501.40 21.13 65.44 27.55 1.01 5.62E-15 * Ydb0427f 12.55 1983.10 21.07 65.25 31.93 1.01 6.25E-15
Ydb0504a 12.55 5510.00 21.71 65.67 76.20 1.01 5.71E-15 Ydb0504b 12.55 10090.00 22.23 65.67 90.17 1.01 8.29E-15 Ydb0504c 12.55 12467.00 21.51 65.50 82.97 1.01 1.15E-14 Ydb0504d 12.55 15021.70 21.05 65.75 82.59 1.01 1.39E-14 Ydb0504e 12.55 20610.00 20.34 65.77 84.47 1.01 1.84E-14
Ydc0517a 13.55 15.18 21.92 65.58 4.93 1.01 3.71E-16 Ydc0517b 13.55 29.48 21.86 65.49 7.75 1.01 4.49E-16 Ydc0517c 13.55 99.78 22.01 65.52 16.30 1.01 6.81E-16 Ydc0517d 13.55 197.05 21.93 65.48 23.39 1.01 8.95E-16 Ydc0517e 13.55 1000.10 21.97 65.59 52.83 1.01 1.69E-15 Ydc0517f 13.55 1983.75 21.59 65.64 69.45 1.01 2.33E-15 Ydc0517g 13.55 3820.86 21.34 65.66 97.09 1.01 2.82E-15
Yea0524a 14.55 10.23 23.76 65.60 3.43 1.01 3.65E-16 Yea0524b 14.55 3822.32 22.47 65.44 101.91 1.01 2.65E-15
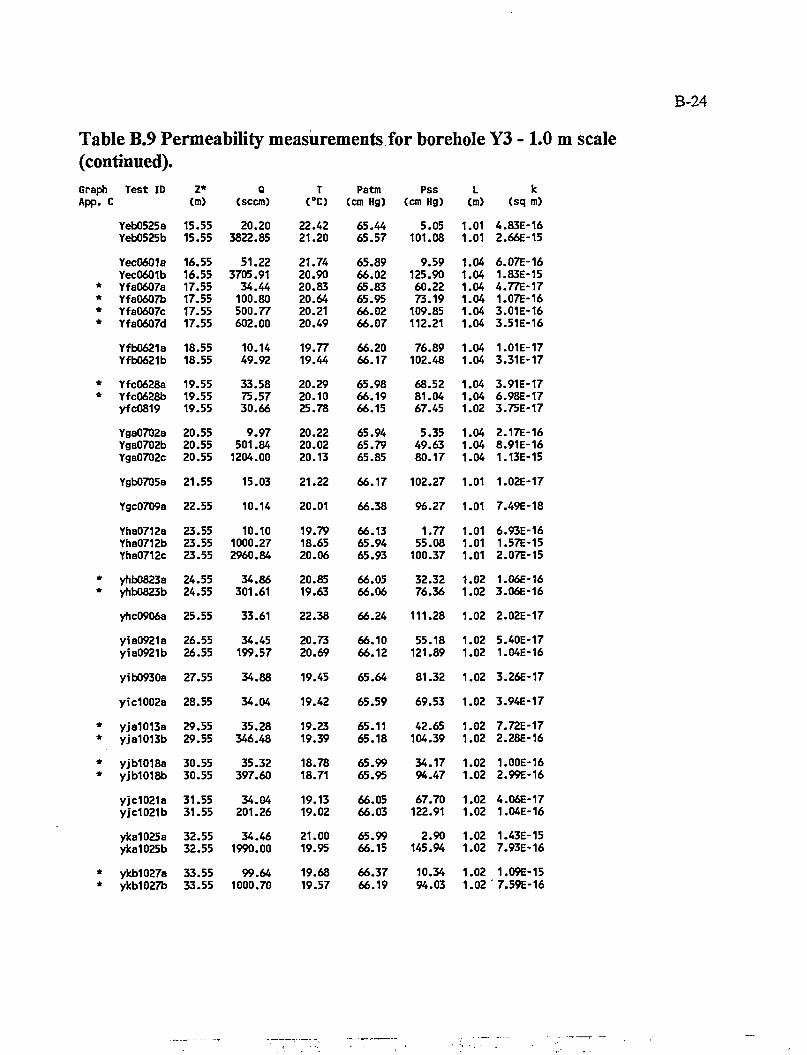
B-24
Table B.9 Permeability measurements for borehole Y3 - 1.0 m scale (continued).
Test ID Z* (m)
Q (seem)
T C°C)
Patm (cm Hg)
Pss (cm Hg)
L (m)
k (sq m)
Yeb0525a Yeb0525b
15.55 15.55
20.20 3822.85
22.42 21.20
65.44 65.57
5.05 101.08
1.01 1.01
4.83E-16 2.66E-15
Yec0601a Yec0601b Yfa0607a Yfa0607b Yfa0607c Yfa0607d
16.55 16.55 17.55 17.55 17.55 17.55
51.22 3705.91 34.44 100.80 500.77 602.00
21.74 20.90 20.83 20.64 20.21 20.49
65.89 66.02 65.83 65.95 66.02 66.07
9.59 125.90 60.22 73.19 109.85 112.21
1.04 1.04 1.04 1.04 1.04 1.04
6.07E-16 1.83E-15 4.77E-17 1.07E-16 3.01E-16 3.51E-16
Yfb0621a Yfb0621b
18.55 18.55
10.14 49.92
19.77 19.44
66.20 66.17
76.89 102.48
1.04 1.04
1.01E-17 3.31E-17
Yfc0628a Yfc0628b yfc0819
19.55 19.55 19.55
33.58 75.57 30.66
20.29 20.10 25.78
65.98 66.19 66.15
68.52 81.04 67.45
1.04 1.04 1.02
3.91E-17 6.98E-17 3.75E-17
Yga0702a Yga0702b Yga0702c
20.55 20.55 20.55
9.97 501.84 1204.00
20.22 20.02 20.13
65.94 65.79 65.85
5.35 49.63 80.17
1.04 1.04 1.04
2.17E-16 8.91E-16 1.13E-15
Ygb0705a 21.55 15.03 21.22 66.17 102.27 1.01 1.02E-17 Ygc0709a 22.55 10.14 20.01 66.38 96.27 1.01 7.49E-18 Yha0712a Yha0712b Yha0712c
23.55 23.55 23.55
10.10 1000.27 2960.84
19.79 18.65 20.06
66.13 65.94 65.93
1.77 55.08 100.37
1.01 1.01 1.01
6.93E-16 1.57E-15 2.07E-15
yhb0823a yhb0823b
24.55 24.55
34.86 301.61
20.85 19.63
66.05 66.06
32.32 76.36
1.02 1.02
1.06E-16 3.06E-16
yhc0906a 25.55 33.61 22.38 66.24 111.28 1.02 2.02E-17 yia0921a yia0921b
26.55 26.55
34.45 199.57
20.73 20.69
66.10 66.12
55.18 121.89
1.02 1.02
5.40E-17 1.04E-16
yib0930a 27.55 34.88 19.45 65.64 81.32 1.02 3.26E-17 yic1002a 28.55 34.04 19.42 65.59 69.53 1.02 3.94E-17 yja1013a yja1013b
29.55 29.55
35.28 346.48
19.23 19.39
65.11 65.18
42.65 104.39
1.02 1.02
7.72E-17 2.28E-16
yjb1018a yjb1018b
30.55 30.55
35.32 397.60
18.78 18.71
65.99 65.95
34.17 94.47
1.02 1.02
1.00E-16 2.99E-16
yjc1021a yj'c1021b
31.55 31.55
34.04 201.26
19.13 19.02
66.05 66.03
67.70 122.91
1.02 1.02
4.06E-17 1.04E-16
yka1025a yka1025b
32.55 32.55
34.46 1990.00
21.00 19.95
65.99 66.15
2.90 145.94
1.02 1.02
1.43E-15 7.93E-16
ykb1027a ykb1027b
33.55 33.55
99.64 1000.70
19.68 19.57
66.37 66.19
10.34 94.03
1.02 1.02
1.09E-15 7.59E-16
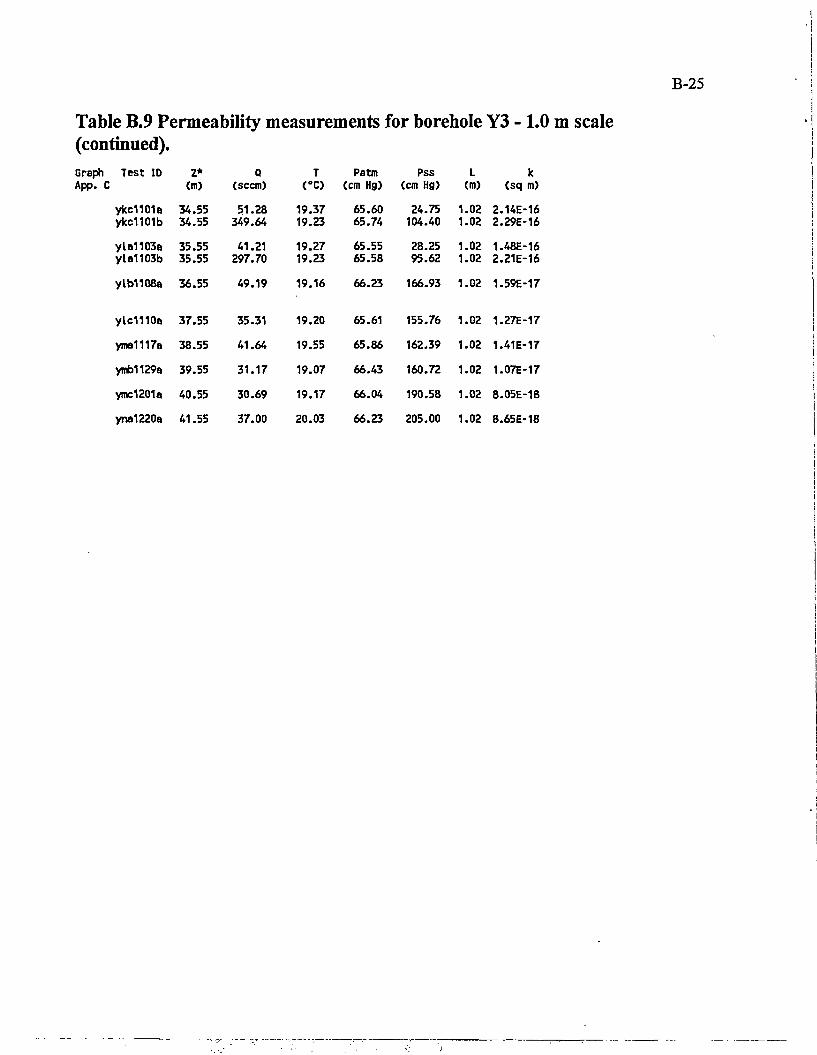
Table B.9 Permeability measurements for borehole Y3 - 1.0 m scale (continued).
Test ID Z* (m)
Q (seem)
T (°C)
Patm (cm Hg)
Pss (cm Hg)
L (m)
k (sq m)
ykc1101a ykc1101b
34.55 34.55
51.28 349.64
19.37 19.23
65.60 65.74
24.75 104.40
1.02 1.02
2.14E-16 2.29E-16
yla1103a yla1103b
35.55 35.55
41.21 297.70
19.27 19.23
65.55 65.58
28.25 95.62
1.02 1.02
1.48E-16 2.21E-16
ylb1108a 36.55 49.19 19.16 66.23 166.93 1.02 1.59E-17
ylc1110a 37.55 35.31 19.20 65.61 155.76 1.02 1.27E-17 yma1117a 38.55 41.64 19.55 65.86 162.39 1.02 1.41E-17 ymb1129a 39.55 31.17 19.07 66.43 160.72 1.02 1.07E-17 ymc1201a 40.55 30.69 19.17 66.04 190.58 1.02 8.05E-18 yna1220a 41.55 37.00 20.03 66.23 205.00 1.02 8.65E-18
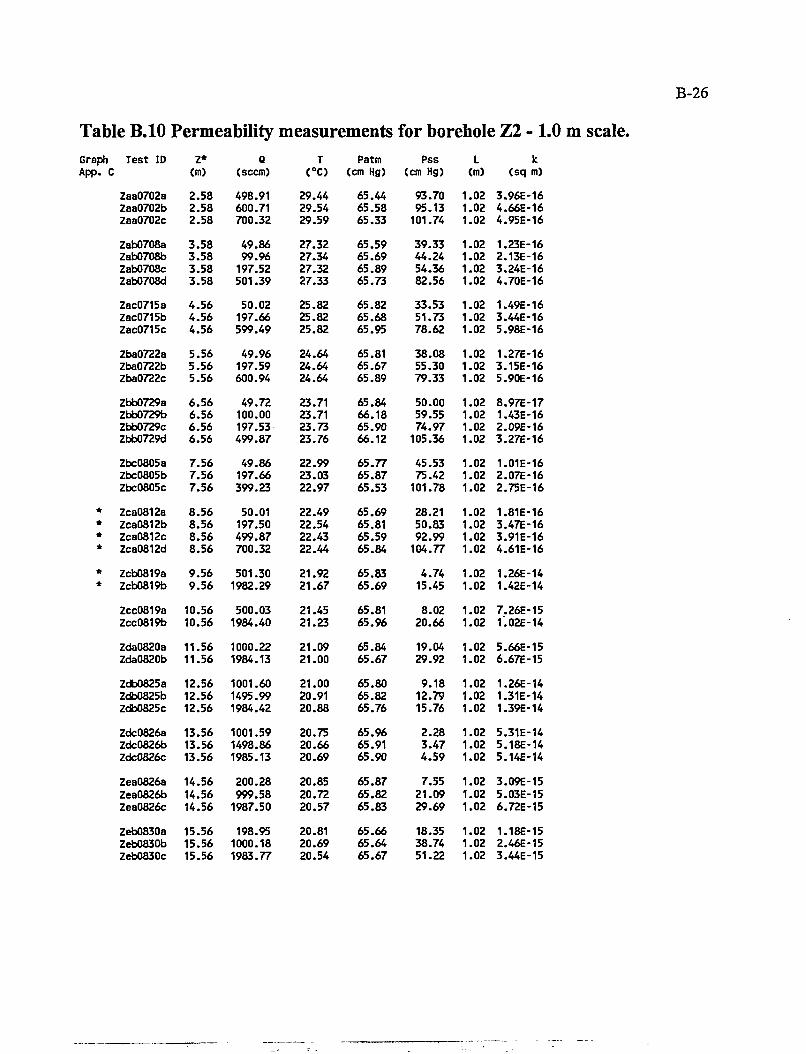
B-26
Table B.10 Permeability measurements for borehole Z2 - 1.0 m scale. Graph Test 10 App. C
Z* (m)
Q (seem)
T (°C)
Patm (cm Hg)
Pss (cm Hg)
L (m)
k (sq m)
Zaa0702a Zaa0702b Zaa0702c
2.58 2.58 2.58
498.91 600.71 700.32
29.44 29.54 29.59
65.44 65.58 65.33
93.70 95.13 101.74
1.02 1.02 1.02
3.96E-16 4.66E-16 4.95E-16
Zab0708a Zab0708b Zab0708c Zab0708d
3.58 3.58 3.58 3.58
49.86 99.96 197.52 501.39
27.32 27.34 27.32 27.33
65.59 65.69 65.89 65.73
39.33 44.24 54.36 82.56
1.02 1.02 1.02 1.02
1.23E-16 2.13E-16 3.24E-16 4.70E-16
Zac0715a Zac0715b Zac0715c
4.56 4.56 4.56
50.02 197.66 599.49
25.82 25.82 25.82
65.82 65.68 65.95
33.53 51.73 78.62
1.02 1.02 1.02
1.49E-16 3.44E-16 5.98E-16
Zba0722a Zba0722b Zba0722c
5.56 5.56 5.56
49.96 197.59 600.94
24.64 24.64 24.64
65.81 65.67 65.89
38.08 55.30 79.33
1.02 1.02 1.02
1.27E-16 3.15E-16 5.90E-16
Zbb0729a Zbb0729b Zbb0729c Zbb0729d
6.56 6.56 6.56 6.56
49.72 100.00 197.53 499.87
23.71 23.71 23.73 23.76
65.84 66.18 65.90 66.12
50.00 59.55 74.97 105.36
1.02 1.02 1.02 1.02
8.97E-17 1.43E-16 2.09E-16 3.27E-16
Zbc0805a Zbc0805b Zbc0805c
7.56 7.56 7.56
49.86 197.66 399.23
22.99 23.03 22.97
65.77 65.87 65.53
45.53 75.42 101.78
1.02 1.02 1.02
1.01E-16 2.07E-16 2.75E-16
* Zca0812a * Zca0812b * Zca0812c * Zca0812d
8.56 8.56 8.56 8.56
50.01 197.50 499.87 700.32
22.49 22.54 22.43 22.44
65.69 65.81 65.59 65.84
28.21 50.83 92.99 104.77
1.02 1.02 1.02 1.02
1.81E-16 3.47E-16 3.91E-16 4.61E-16
* Zcb0819a * Zcb0819b
9.56 9.56
501.30 1982.29
21.92 21.67
65.83 65.69
4.74 15.45
1.02 1.02
1.26E-14 1.42E-14
Zcc0819a Zcc0819b
10.56 10.56
500.03 1984.40
21.45 21.23
65.81 65.96
8.02 20.66
1.02 1.02
7.26E-15 1.02E-14
Zda0820a Zda0820b
11.56 11.56
1000.22 1984.13
21.09 21.00
65.84 65.67
19.04 29.92
1.02 1.02
5.66E-15 6.67E-15
Zdb0825a Zdb0825b Zdb0825c
12.56 12.56 12.56
1001.60 1495.99 1984.42
21.00 20.91 20.88
65.80 65.82 65.76
9.18 12.79 15.76
1.02 1.02 1.02
1.26E-14 1.31E-14 1.39E-14
Zdc0626a Zdc0826b Zdc0826c
13.56 13.56 13.56
1001.59 1498.86 1985.13
20.75 20.66 20.69
65.96 65.91 65.90
2.28 3.47 4.59
1.02 1.02 1.02
5.31E-14 5.18E-14 5.14E-14
Zea0826a Zea0826b Zea0826c
14.56 14.56 14.56
200.28 999.58 1987.50
20.85 20.72 20.57
65.87 65.82 65.83
7.55 21.09 29.69
1.02 1.02 1.02
3.09E-15 5.03E-15 6.72E-15
Zeb0830a Zeb0830b Zeb0830c
15.56 15.56 15.56
198.95 1000.18 1983.77
20.81 20.69 20.54
65.66 65.64 65.67
18.35 38.74 51.22
1.02 1.02 1.02
1.18E-15 2.46E-15 3.44E-15
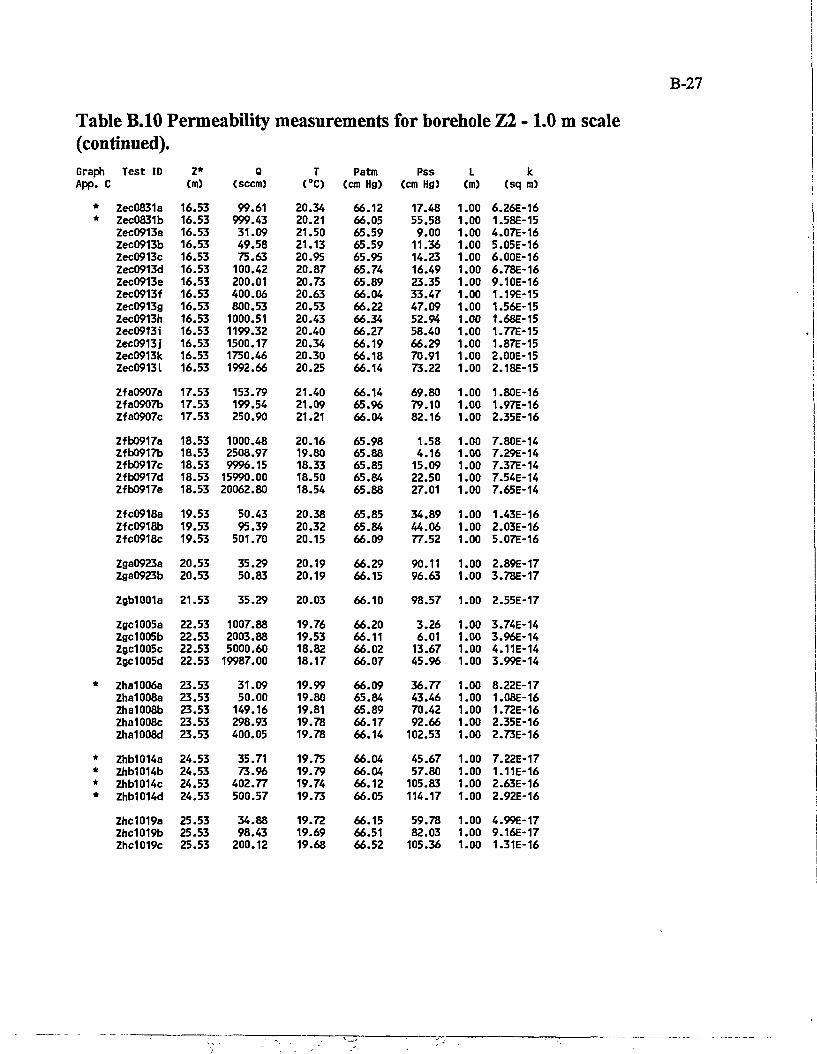
Table B.10 Permeability measurements for borehole Z2 -1.0 m scale (continued). Graph Test ID Z* Q T Patm Pss L k App. C (m) (seem) (°C) (cm Hg) (cm Hg) (m) (sq m)
* Zec0831a 16.53 99.61 20.34 66.12 17.48 1.00 6.26E-16 * Zec0831b 16.53 999.43 20.21 66.05 55.58 1.00 1.58E-15
Zec0913a 16.53 31.09 21.50 65.59 9.00 1.00 4.07E-16 Zec0913b 16.53 49.58 21.13 65.59 11.36 1.00 5.05E-16 Zec0913c 16.53 75.63 20.95 65.95 14.23 1.00 6.00E-16 Zec0913d 16.53 100.42 20.87 65.74 16.49 1.00 6.78E-16 Zec0913e 16.53 200.01 20.73 65.89 23.35 1.00 9.10E-16 Zec0913f 16.53 400.06 20.63 66.04 33.47 1.00 1.19E-15 Zec0913g 16.53 800.53 20.53 66.22 47.09 1.00 1.56E-15 Zec0913h 16.53 1000.51 20.43 66.34 52.94 1.00 1.68E-15 Zec0913i 16.53 1199.32 20.40 66.27 58.40 1.00 1.77E-15 Zec0913j 16.53 1500.17 20.34 66.19 66.29 1.00 1.87E-15 Zec0913k 16.53 1750.46 20.30 66.18 70.91 1.00 2.00E-15 Zec0913l 16.53 1992.66 20.25 66.14 73.22 1.00 2.18E-15 Zfa0907a 17.53 153.79 21.40 66.14 69.80 1.00 1.80E-16 Zfa0907b 17.53 199.54 21.09 65.96 79.10 1.00 1.97E-16 Zfa0907c 17.53 250.90 21.21 66.04 82.16 1.00 2.35E-16 Zfb0917a 18.53 1000.48 20.16 65.98 1.58 1.00 7.80E-14 Zfb0917b 18.53 2508.97 19.80 65.88 4.16 1.00 7.29E-14 Zfb0917c 18.53 9996.15 18.33 65.85 15.09 1.00 7.37E-14 Zfb0917d 18.53 15990.00 18.50 65.84 22.50 1.00 7.54E-14 Zfb0917e 18.53 20062.80 18.54 65.88 27.01 1.00 7.65E-14 Zfc0918a 19.53 50.43 20.38 65.85 34.89 1.00 1.43E-16 Zfc0918b 19.53 95.39 20.32 65.84 44.06 1.00 2.03E-16 Zfc0918c 19.53 501.70 20.15 66.09 77.52 1.00 5.07E-16 Zga0923a 20.53 35.29 20.19 66.29 90.11 1.00 2.89E-17 Zga0923b 20.53 50.83 20.19 66.15 96.63 1.00 3.78E-17 Zgb1001a 21.53 35.29 20.03 66.10 98.57 1.00 2.55E-17 Zgc1005a 22.53 1007.88 19.76 66.20 3.26 1.00 3.74E-14 Zgc1005b 22.53 2003.88 19.53 66.11 6.01 1.00 3.96E-14 Zgc1005c 22.53 5000.60 18.82 66.02 13.67 1.00 4.11E-14 Zgc1005d 22.53 19987.00 18.17 66.07 45.96 1.00 3.99E-14
* Zha1006a 23.53 31.09 19.99 66.09 36.77 1.00 8.22E-17 Zha1008a 23.53 50.00 19.80 65.84 43.46 1.00 1.08E-16 Zha1008b 23.53 149.16 19.81 65.89 70.42 1.00 1.72E-16 Zha1008c 23.53 298.93 19.78 66.17 92.66 1.00 2.35E-16 Zha1008d 23.53 400.05 19.78 66.14 102.53 1.00 2.73E-16
* Zhb1014a 24.53 35.71 19.75 66.04 45.67 1.00 7.22E-17 * ZhblOKb 24.53 73.96 19.79 66.04 57.80 1.00 1.11E-16 * Zhb1014c 24.53 402.77 19.74 66.12 105.83 1.00 2.63E-16 * Zhb1014d 24.53 500.57 19.73 66.05 114.17 1.00 2.92E-16
Zhc1019a 25.53 34.88 19.72 66.15 59.78 1.00 4.99E-17 Zhc1019b 25.53 98.43 19.69 66.51 82.03 1.00 9.16E-17 Zhc1019c 25.53 200.12 19.68 66.52 105.36 1.00 1.31E-16
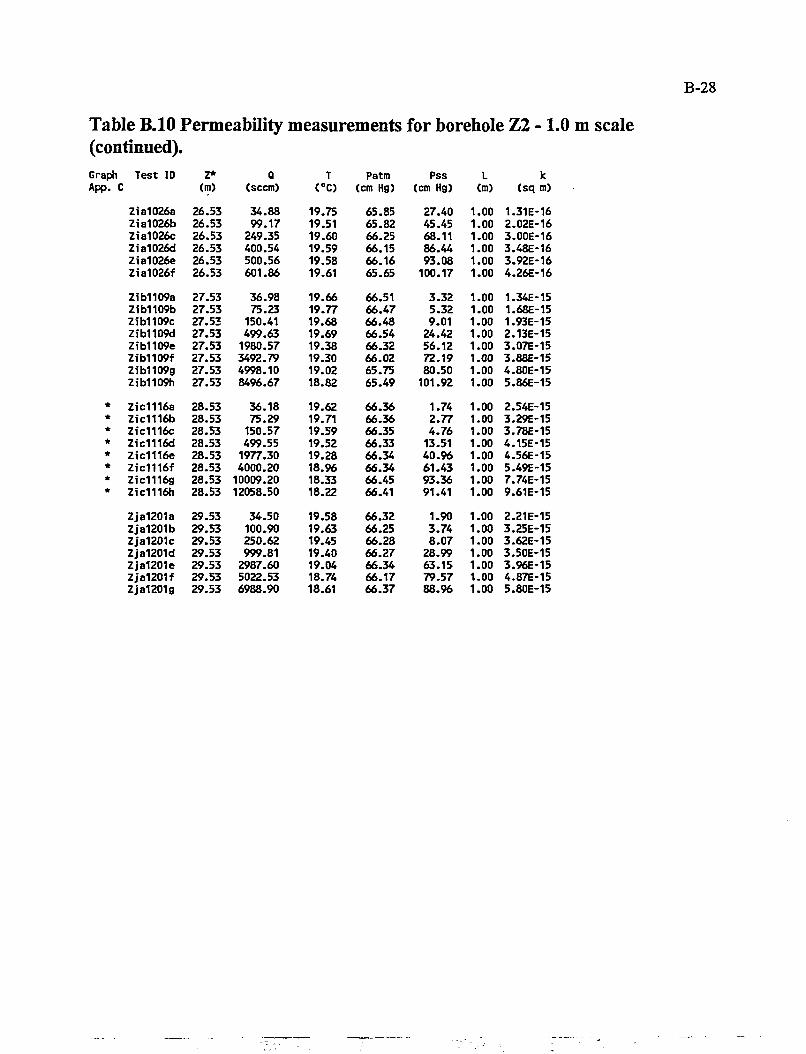
B-28
Table B.10 Permeability measurements for borehole Z2 - 1.0 m scale (continued). Graph Test ID Z* Q T Patm Pss L k App. C (m) (seem) <°C> (cm Hg) (cm Hg) (m) (sq m)
Zia1026a 26.53 34.88 19.75 65.85 27.40 1.00 1.31E-16 Zia1026b 26.53 99.17 19.51 65.82 45.45 1.00 2.02E-16 Zia1026c 26.53 249.35 19.60 66.25 68.11 1.00 3.00E-16 Zia1026d 26.53 400.54 19.59 66.15 86.44 1.00 3.48E-16 Zia1026e 26.53 500.56 19.58 66.16 93.08 1.00 3.92E-16 Zia1026f 26.53 601.86 19.61 65.65 100.17 1.00 4.26E-16 Zib1109a 27.53 36.98 19.66 66.51 3.32 1.00 1.34E-15 Zib1109b 27.53 75.23 19.77 66.47 5.32 1.00 1.68E-15 Zib1109c 27.53 150.41 19.68 66.48 9.01 1.00 1.93E-15 Zib1109d 27.53 499.63 19.69 66.54 24.42 1.00 2.13E-15 Zib1109e 27.53 1980.57 19.38 66.32 56.12 1.00 3.07E-15 Zib1109f 27.53 3492.79 19.30 66.02 72.19 1.00 3.88E-15 Zib1109g 27.53 4998.10 19.02 65.75 80.50 1.00 4.80E-15 Zib1109h 27.53 8496.67 18.82 65.49 101.92 1.00 5.86E-15
* Zic1116a 28.53 36.18 19.62 66.36 1.74 1.00 2.54E-15 * Zic1116b 28.53 75.29 19.71 66.36 2.77 1.00 3.29E-15 * Zic1116c 28.53 150.57 19.59 66.35 4.76 1.00 3.78E-15 * Zic1116d 28.53 499.55 19.52 66.33 13.51 1.00 4.15E-15 * Zic1116e 28.53 1977.30 19.28 66.34 40.96 1.00 4.56E-15 * Zic1116f 28.53 4000.20 18.96 66.34 61.43 1.00 5.49E-15 * Zic1116g 28.53 10009.20 18.33 66.45 93.36 1.00 7.74E-15 * Zic1116h 28.53 12058.50 18.22 66.41 91.41 1.00 9.61E-15
Zja1201a 29.53 34.50 19.58 66.32 1.90 1.00 2.21E-15 Zja1201b 29.53 100.90 19.63 66.25 3.74 1.00 3.25E-15 Zja1201c 29.53 250.62 19.45 66.28 8.07 1.00 3.62E-15 Zja1201d 29.53 999.81 19.40 66.27 28.99 1.00 3.50E-15 Zja1201e 29.53 2987.60 19.04 66.34 63.15 1.00 3.96E-15 Zja1201f 29.53 5022.53 18.74 66.17 79.57 1.00 4.87E-15 Zja1201g 29.53 6988.90 18.61 66.37 88.96 1.00 5.80E-15

C-l
APPENDIX C: Graphs of Transient Data for Selected Tests
Key to permeability versus depth graphs:
Each set of transient plots is accompaynied by a plot of permeability estimates as a function of position along the borehole, (see page C-3 for example). The permeability data are presented in the form of rectangles which delineate depth intervals and ranges of computed permeabilities (lower abcissa) resulting from each flow rate. Also shown are the minimum (dashed curve) and maximum (solid curve) pressures applied during each test (upper abcissa). In general, there is no indication of a systematic trend as a function of depth. However, a pseudo-periodic behavior becomes more prominent as the scale of measurement is reduced.
C-2
Graphs from Table B.l V2 -1.0 m Data
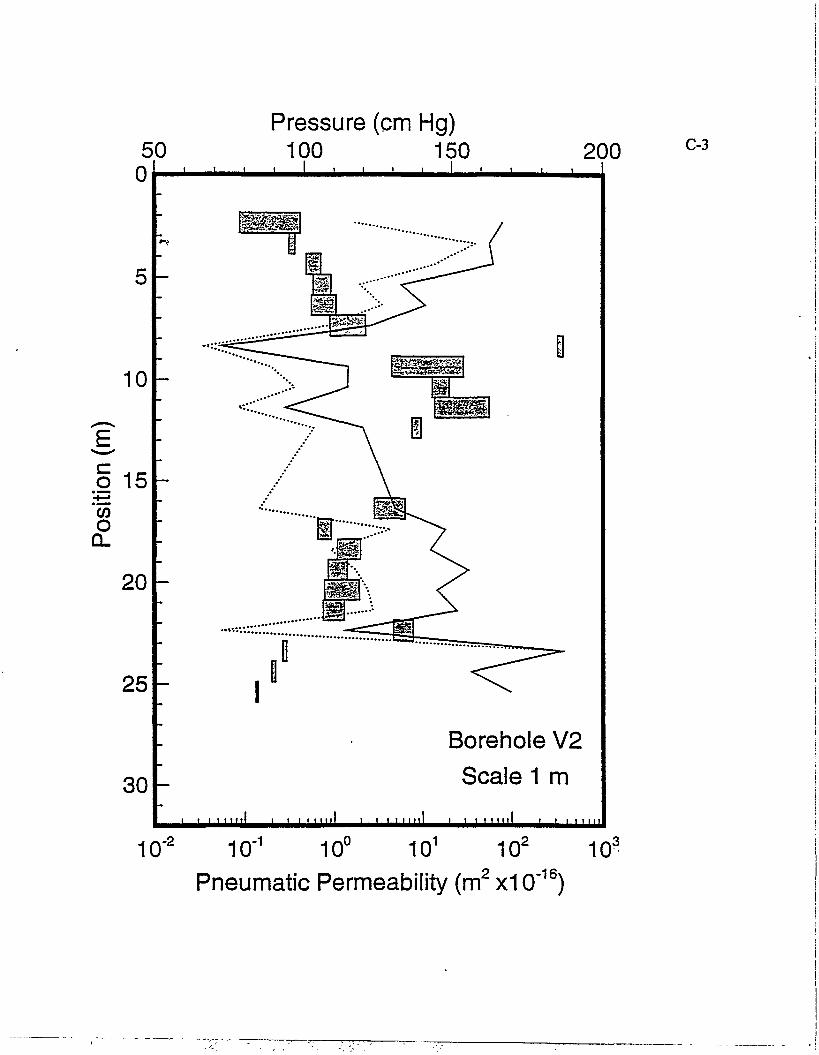
50 0^
5 -
Pressure (cm Hg) 100 150
_i i i i 200
Borehole V2 Scale 1 m
• ' " " " ' ' I I I I I t I I I I I H I I I I f I I I l l JJJ
10" 10"1 10c 101 102 10c
-16N Pneumatic Permeability (m x10 )
C-3
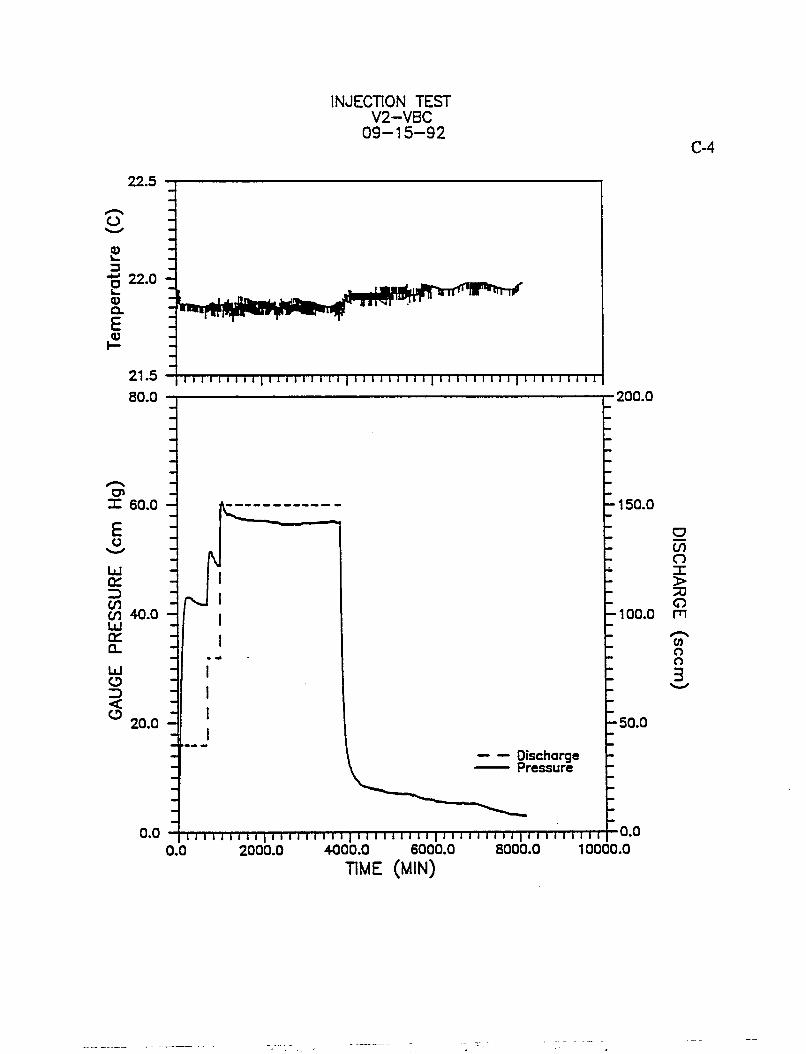
INJECTION TEST V2-VBC
09-15-92
22.5
O
3 22.0 H
03 Q .
E
21.5 80.0
l l l l l l l l l | l I l l l I I I l | l l l l l l l I I | l l l i l l l l l | I I I I I I I I I
o X 60.0
£
LU OH
C/J 40.0 LO rr UJ o Z> < ° 20.0 H
N
h 150.0
•200.0
h 100.0
Oischarge Pressure
0 . 0 | I i i i i | I I I | I I I i i I i i I | l l l l l l l I I | l l u l l I I I | l l I l l l l I I | 0 - 0 0.0 2000.0 4000.0 6000.0 8000.0 10000.0
•50.0
TIME (MIN)
o o X > o m 0) o o 3

Pressure Gauge (cm Hg) Pressure Gauge (cm Hg)
o o II <o< > I N> o-* I O l <
M I CD
• •
O II —*
o
•
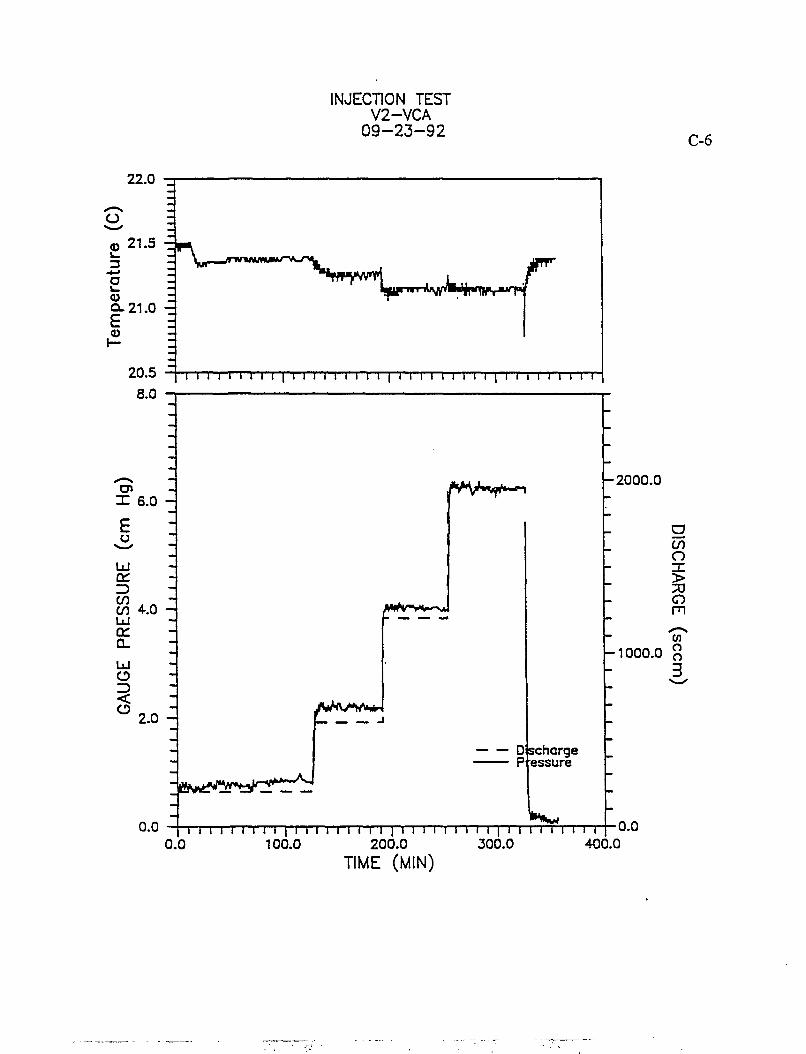
INJECTION TEST V2-VCA
09-23-92
/U..U
<? © 21.5 « i _ 3
- 4 - "
X^™NMJ^^\-*>u^ f^ o ^ " T n . L„ J t _ hjanrrMMiwUifmM. • irp* <D Q-21.0 E <D
H-
20.5 20.5 I I I I I I 1 I I | I I I I I I I I I | I I I I I I I I I | I I I I I 1 1 1 I
8.0 - r
X 6.0
E o
UJ DH
CO 4.0 UJ tr 0_
o <
2.0 -
0.0
JVV*V* ,-**I
tmhrv*~+
' i
I iii^^frtsir^^:
Discharge P essure
* * » *
•2000.0
g CO o X > a m en
•1000.0 £
I I I I I I I i I I I I I I I I I I I I I I I I I I I I I I I I I I I I I I "I 0.0 100.0 200.0 300.0 400.0
0.0
TIME (MIN)
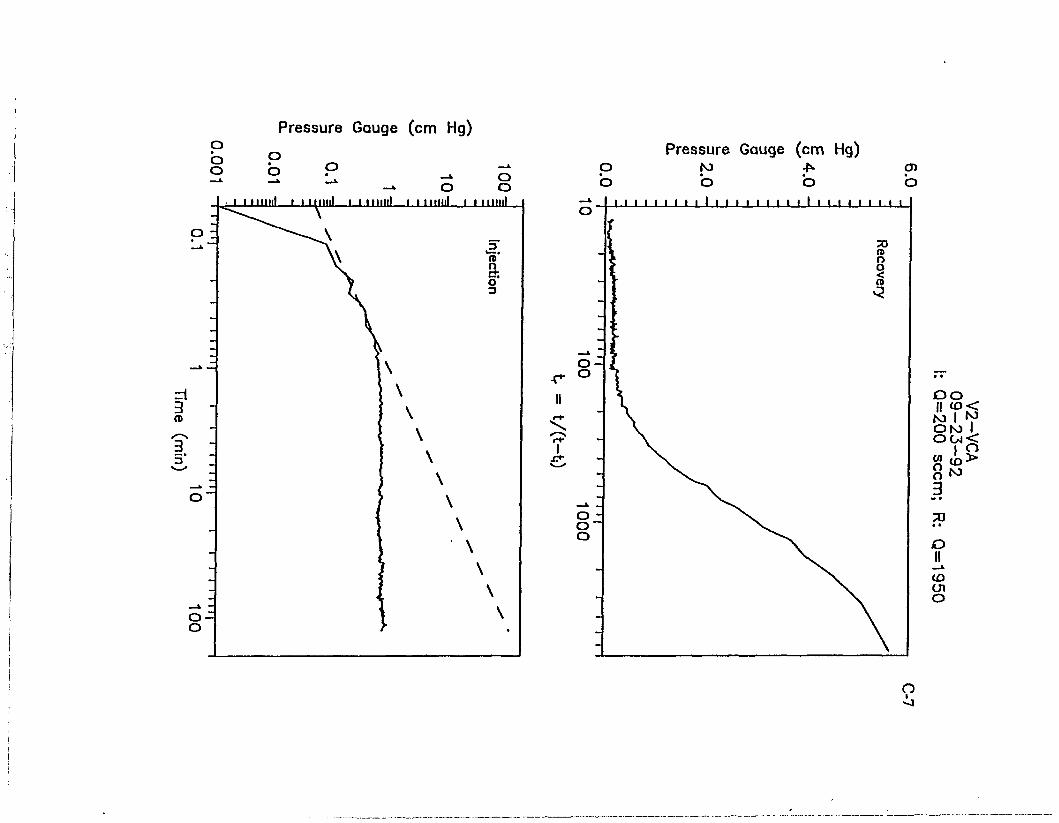
p b o
Pressure Gauge (cm Hg)
-* o o o
mini i i,until i i mini i in mil ...i i mini
Pressure Gauge (cm Hg) o M -f>> 0 1 • • • •
o o o o I I I I I I I I I I I I I I I t \ I I I I . I l l l l . l l
O O N3 I NJ O N ) I O O I <
I O o o 3 » •
to o
CO
•
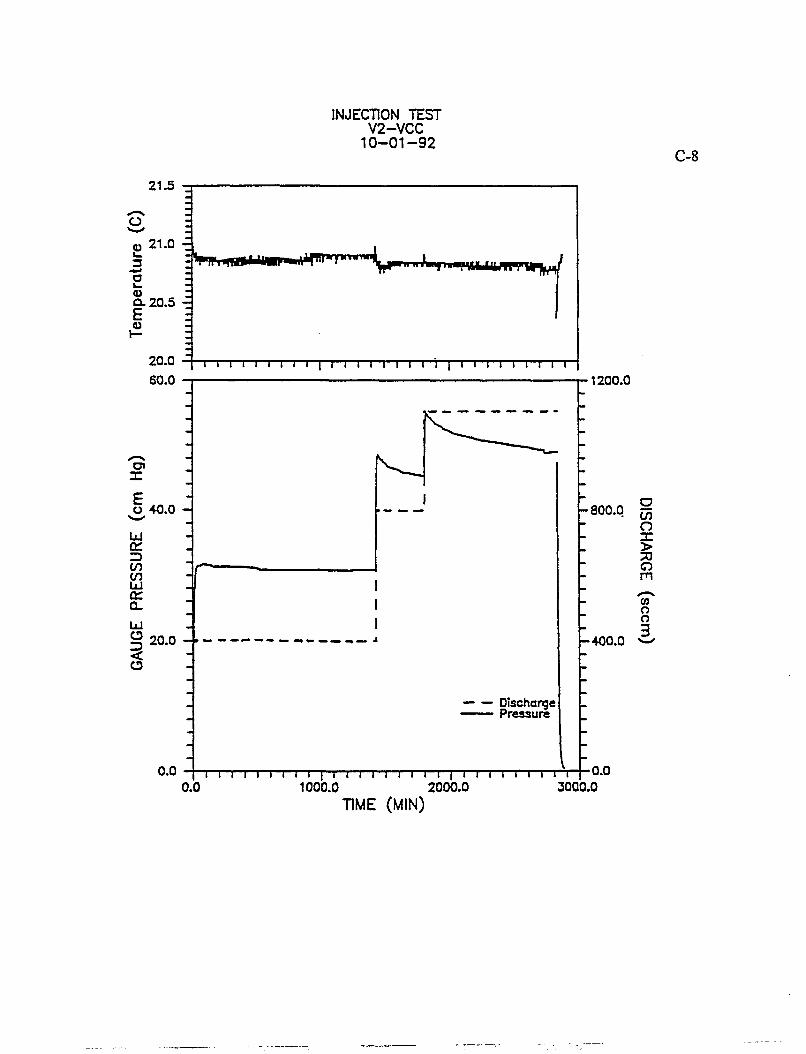
INJECTION TEST V2-VCC
10-01-92
21.5
O QJ 21.0 -3 l _ 3
•+->
o « -, a. 20.5 -3 E
20.0 60.0
rVH'inMHiiiMw^iiv'flt-r V " " nimi'«mmuiwmiiriftJ
i i i i i i i i i i i i i i i i i i i i i i i i i i i i i
X
o 40.0 H
or 3 (/) en cr Q_
:f UJ § 20.0 -J-<
0.0
— — — — — • » — - . — _ _ . . _ J
Discharge Pressure
•1200.0
-800.0
-400.0
O CO O X > o m
o o 3
i i i i i i i i i | i i i i • i i i i i i i i i i i i i i i 0.0 1000.0 2000.0 3000.0
0.0
TIME (MIN)
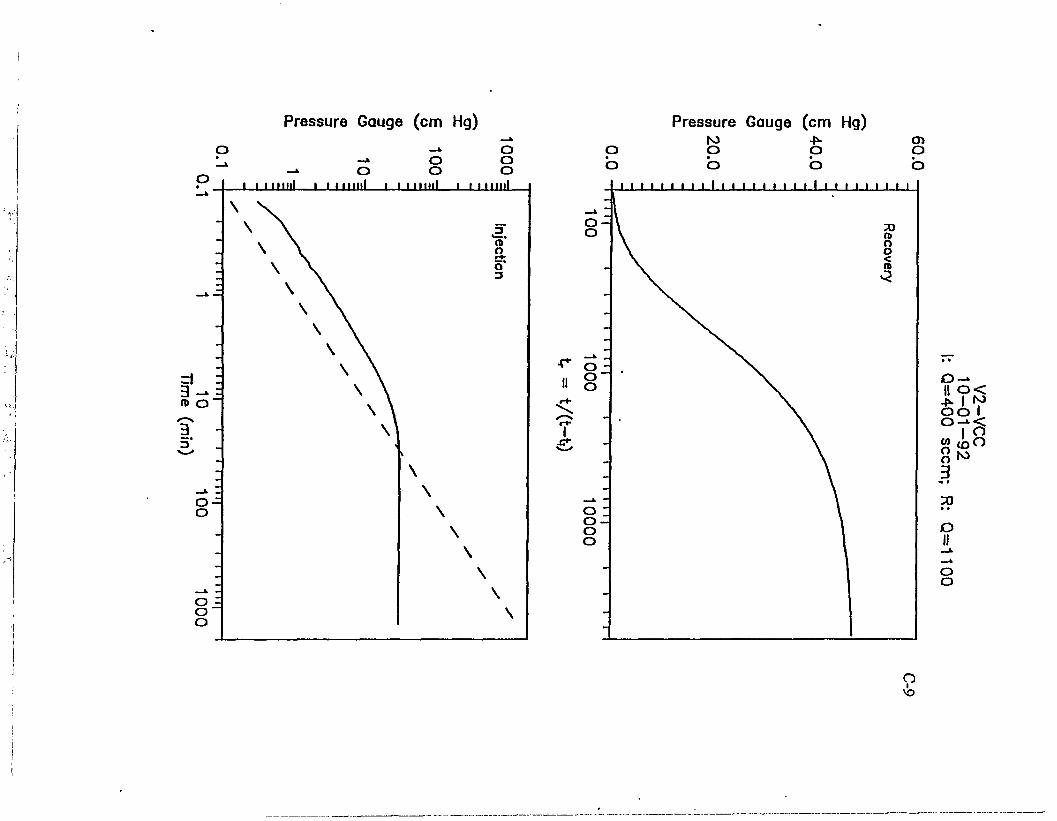
Pressure Gauge (cm Hg) Pressure Gauge (cm Hg) -*• o o o o o
i mill i i mini
II o < > I M o o I o-«.< I °
3 70 • # O
o o
I
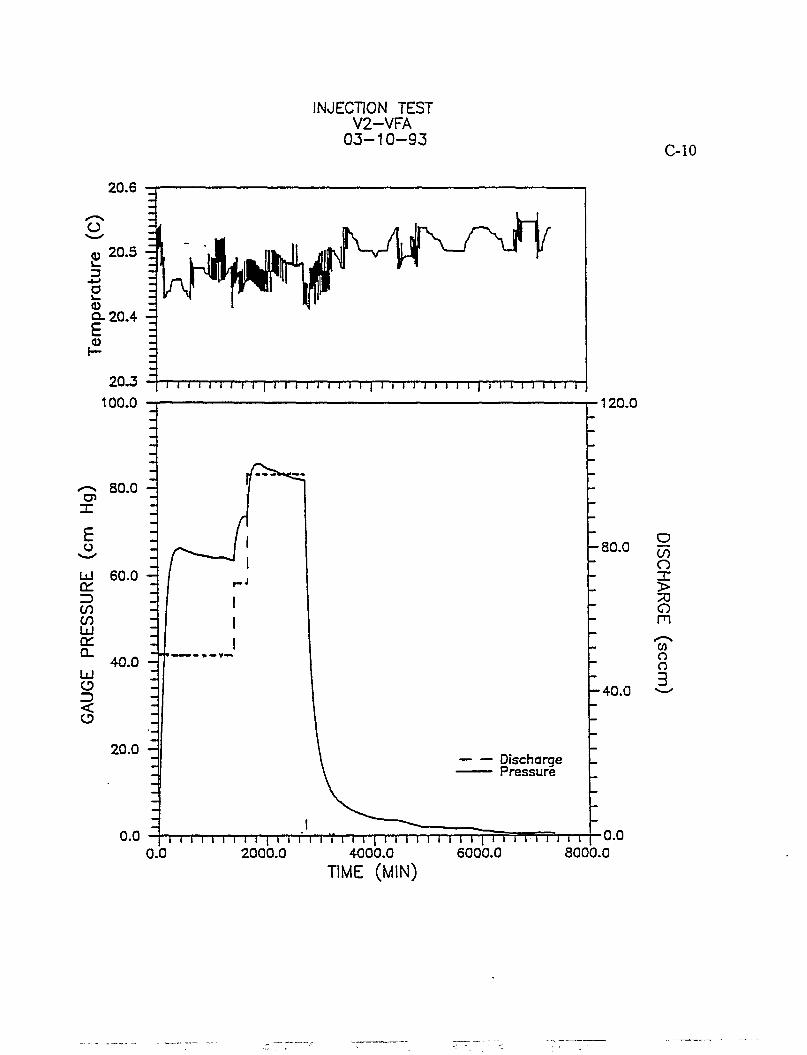
INJECTION TEST V2-VFA
03-10-93 C-10
20.6
20.3 100.0
i i i i i i i i i | i i i i i i i i i | i i i i J i J i i | i i i i i i i i i
80.0 -X
E o
Ld 60.0 CH ZD CO CO UJ cn 0_ 40.0 -UJ o ZD <
20.0 -
- 8 0 . 0
120.0
o CO
o > o m CO o o
- 4 0 . 0
0.0
Discharge [_ Pressure
0.0 i i i i i i i | i i f i i 'f i i i | i i i i i i i i i | T i rr i i i i i
2000.0 4000.0 6000.0 8000.0 0.0
TIME (MIN)
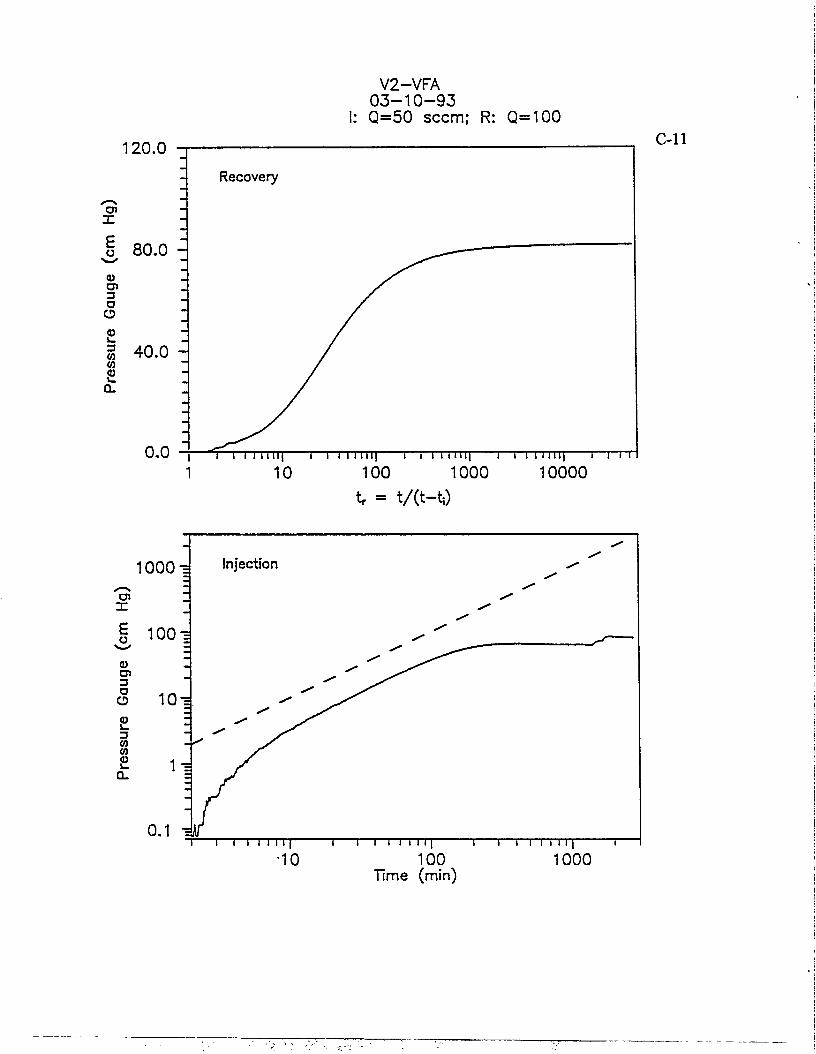
V2-VFA 03-10-93
I: Q=50 seem; R: Q=100
120.0
x I 80.0 CD en 3 O
o i_ 3 CO CO <u
40.0 -
0.0 10 100 1000
tr = t / (M)
i i i m i | r 10000
C-ll
1000-=
| 1 0 0 i <D Ol 3 O O <o i_ 3 CO CO
100 Time (min)
1000
C-12
Graphs from Table B.2 W2a -1.0 m Data
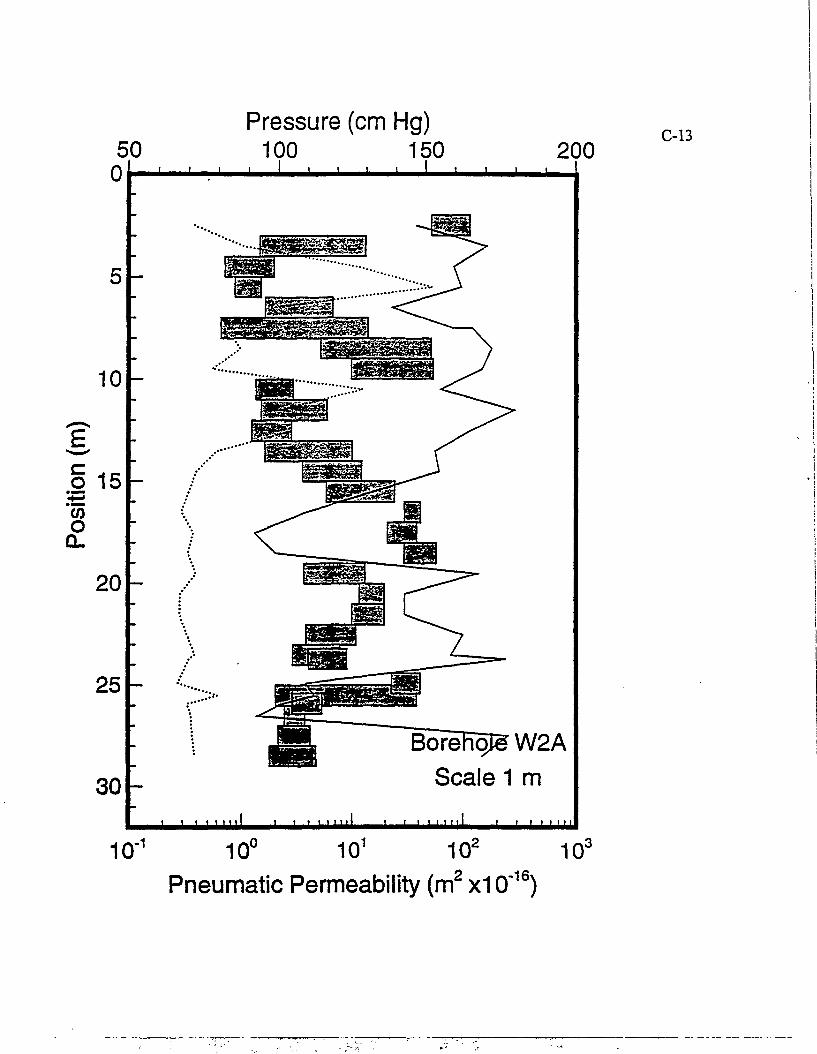
50
10
15
20
25
30
_i i i_
i i 11
Pressure (cm Hg) 100 150 200
i i i i _i i i
W2A Scale 1 m
I \ f | \ | 1 \ t t t 1 t t M 1 I I l l t l l l l I
10" 1 10° 10 1
P n e u m a t i c Permeabi l i ty ( r r f x10" 1 0 ) 1 0 2 10C
2 _ - i ri-16>
C-
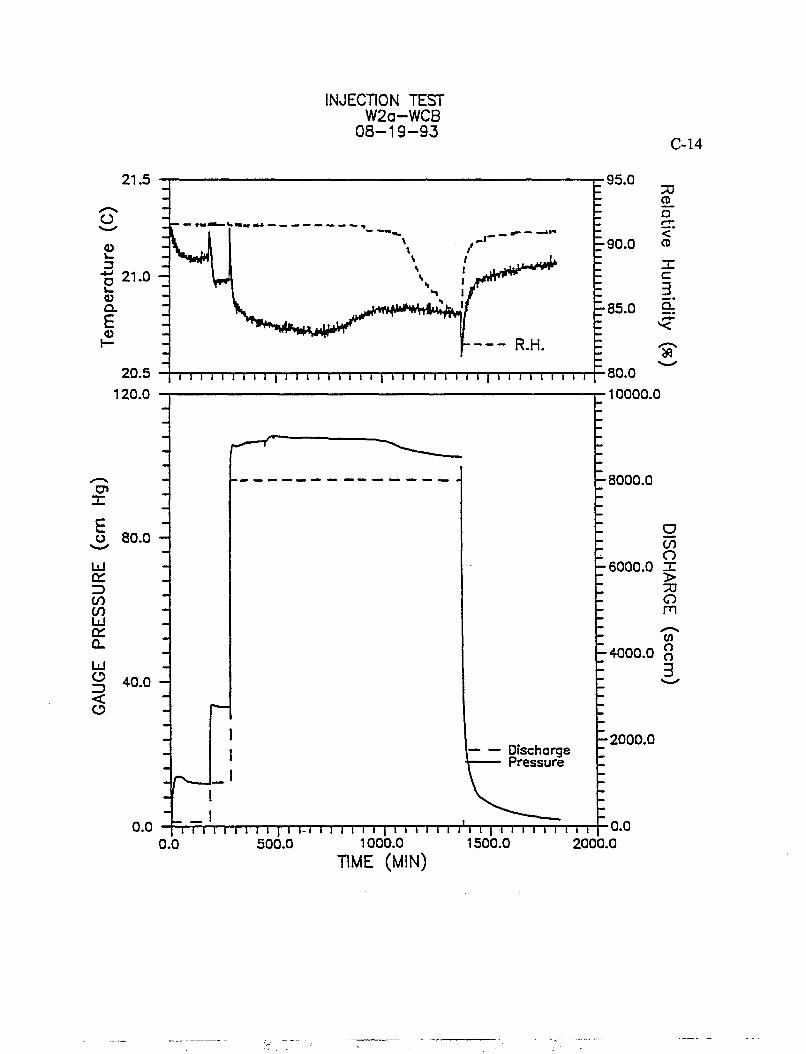
INJECTION TEST W2a-WCB
08-19-93 C-14
21.5
20.5 120.0
- 9 0 . 0
i i i i i i i i i ) i i i i i i i i i | i i i i i i i i i | i i i i i i i i i
•95.0 70 cp_ a r j -<" CD X c 3.
P85.0 9-!
$
a>
o 80.0
Ld QL *D CO CO LU a: a.
o *D <
40.0 -
-8000.0
-6000.0
Discharge Pressure
_ !
•80.0 •10000.0
CO O X > 7U o m CO
•4000.0 8
•2000.0
0.0 [~i i i i i i i i i | i i-1 i i i i i i | I I I i i i i' I i i I I I i i i i I i I 0-0 0.0 500.0 1000.0 1500.0 2000.0
TIME (MIN)
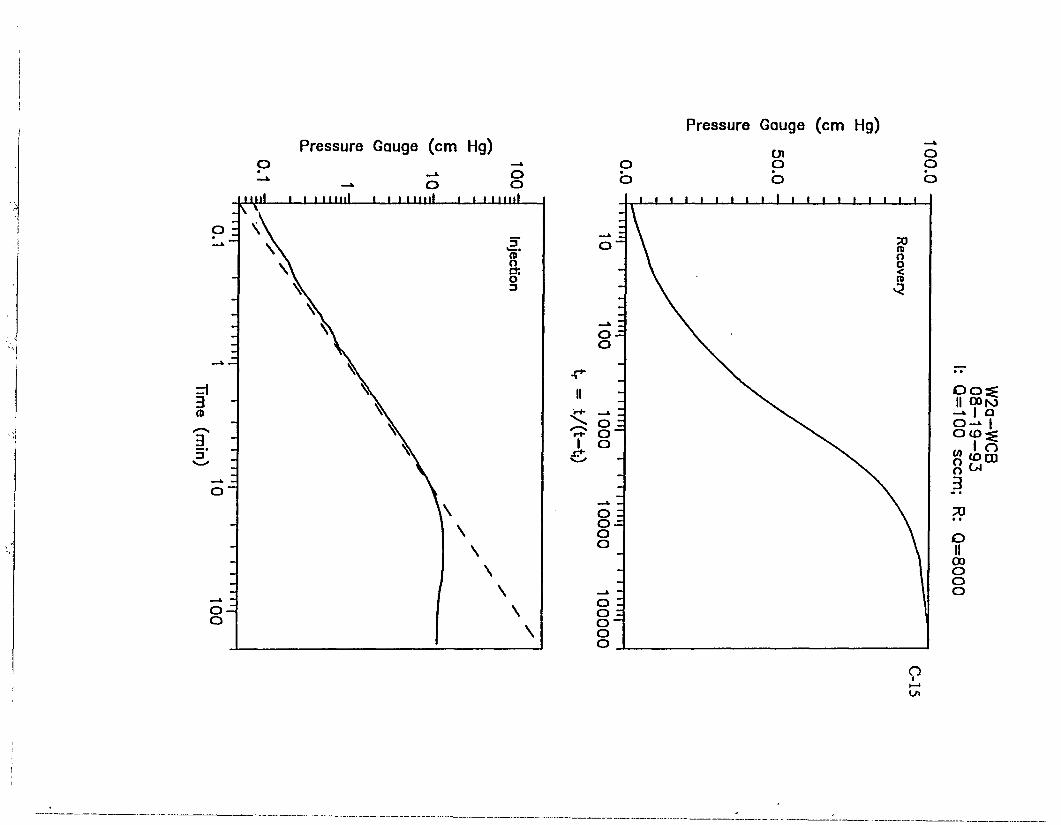
Pressure Gauge (cm Hg)
-«• O -» o o
mnl i, i i mill i i i mill
Pressure Gauge (cm Hg)
o b
en o o
o o
o o : g II qoro -* 1 a o-» I ocp-z
M 1 <">
o w
3 • • O II 00 O o o
o I
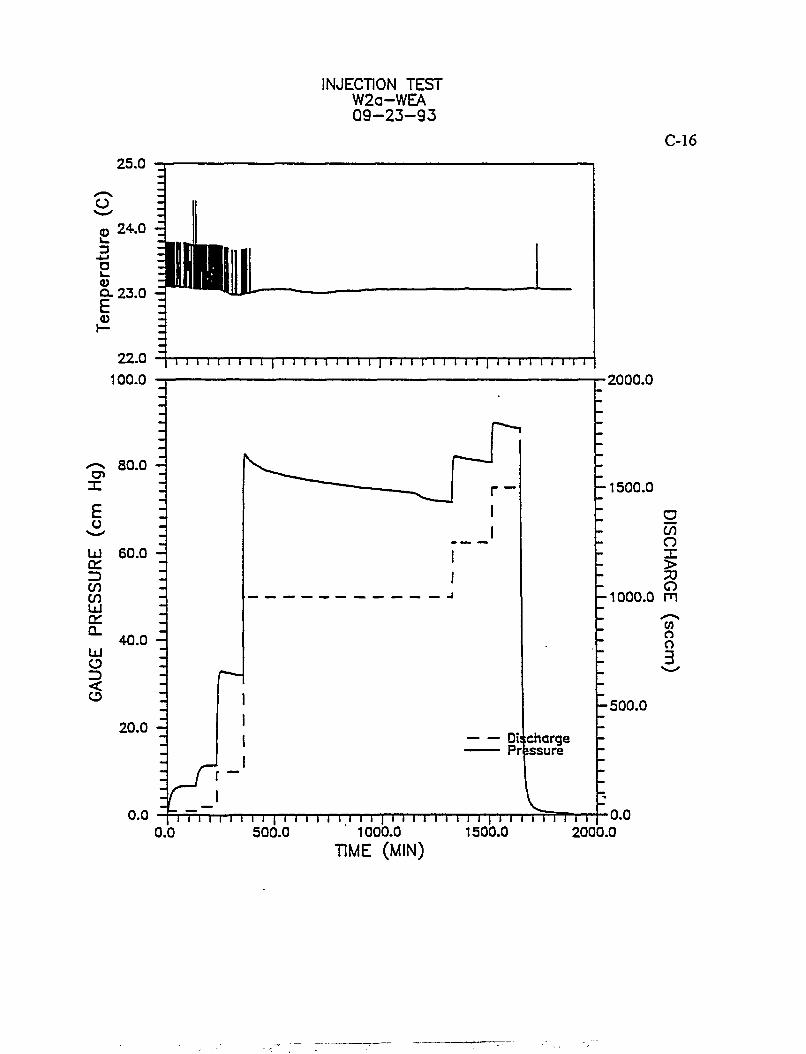
INJECTION TEST W2a-WEA 09-23-93
C-16 25.0
« 24.0 -E
< " - r
a. 23.0 -3 iiim
<D
22.0 100.0
I I I l I I l I I | i I I I I I l l I | M I I I l l ) l | I l I l i I I I I
^ 80.0 X
E o
^ ^ UJ 60.0 a: ID CO en (T °~ 40.0 LU O < 20.0 -
_ _ — __ _ J
0i:;charge Pressure
•2000.0
•1500.0
O CO O *T >
O •1000.0 m
o o 3
•500.0
0.0 p I I I I I I I I | I I I I I I I I I | I I I I I I I I I | I I I I T~l I I I 0.0 500.0 1000.0 1500.0 2000.0
TIME (MIN)
o.o
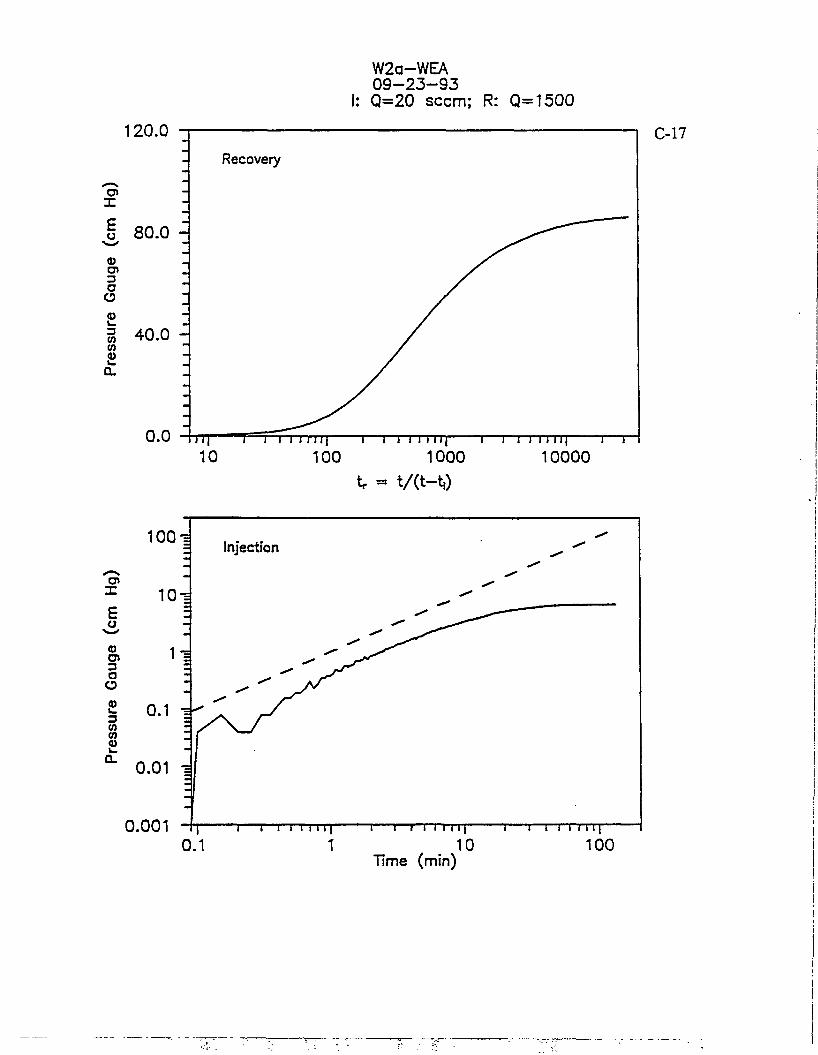
120.0
X E u <D Ol 3 O O
<i> L. 3 CO CO <0
80.0 -
40.0 -
W2a-WEA 09—23—93
I: Q=20 seem; R: Q=1500
i i n i | 1—i i i 11 i i [ 1—i i i 11 i i | 1—r
100 1000 tr = t/(t-tO
10000
X E o CO o> 3 a O CO L . 3 CO CO CO
0.001
0.01 -
T — i — r i i i i i | 10
Time (min)
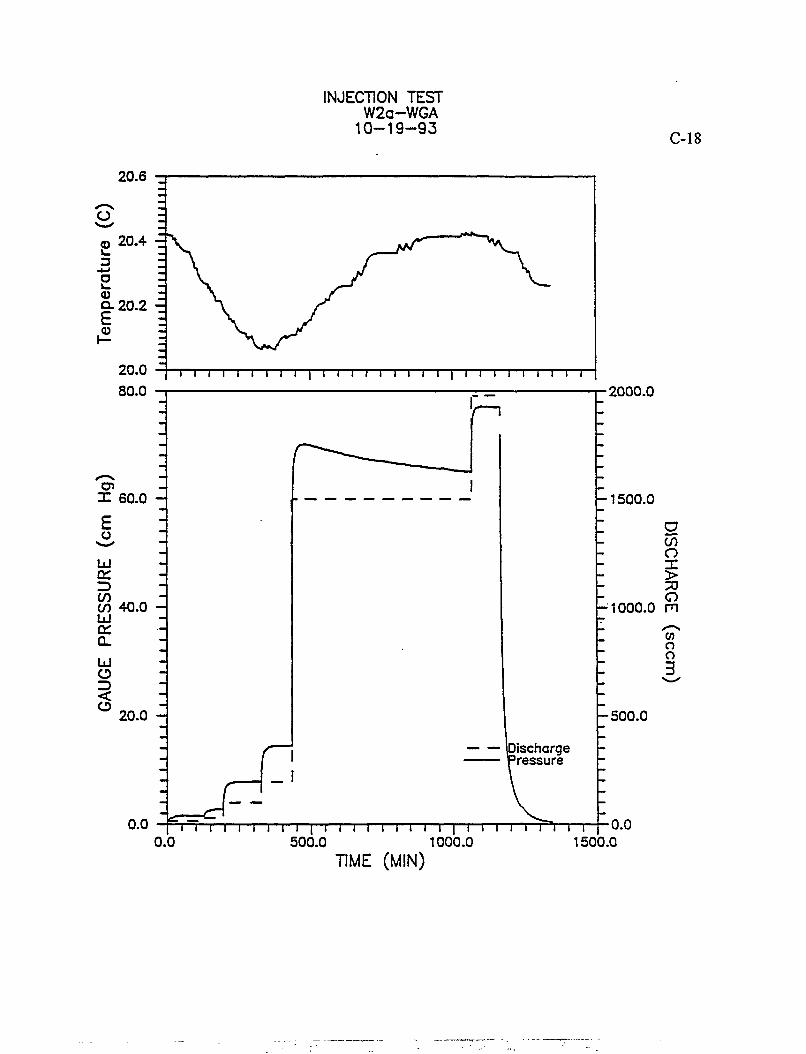
INJECTION TEST W2a-WGA
10-19-93 C-18
20.6
20.0 80.0
T i i i n i i i | i i i i i i i i i | i i i i i i i i r
X 60.0
E o
LtJ DC Z> (/) 40.0 LU en
Lul
o <
20.0 -
0.0
-1500.0
I I I I I I I I I I I I I I I I I I I I I I I I 0.0 500.0 1000.0
TIME (MIN)
Discharge 'ressure
•2000.0
-1000.0
g en o x > 70 O m en o o 3
•500.0
i i i r 1500.0
0.0
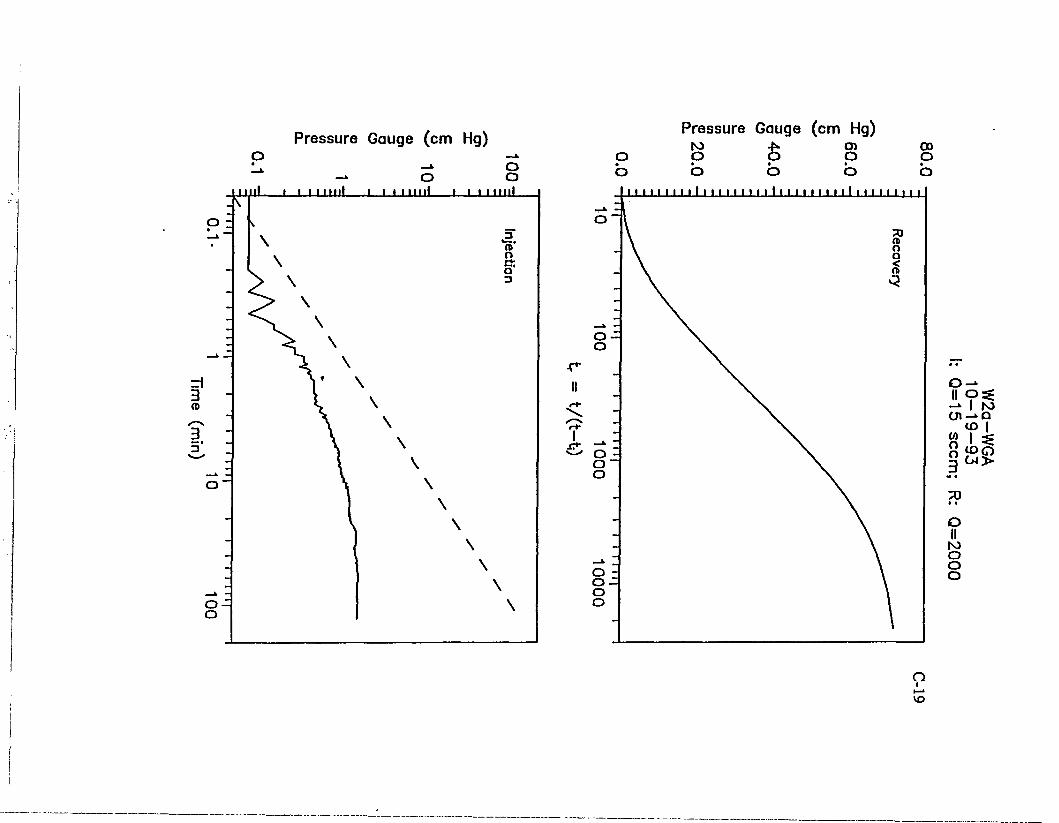
Pressure Gauge (cm Hg)
-* o -* o o
IIIJII i i i mill i i i mill »-i i mill
Pressure Gauge (cm Hg) ro .£. o>
o o o o • • • • • o o o o o
1 1 1 I I 1 1 1 1 1 1 1 1 1 1 1 1 1 1 1 1 1 1 1 1 1 1 1 1 1 1 1 1
00
o
o _ k
II ?== — i 1 M Ol - * Q to |
(A 1 =SE Q ^>o 3 C>4>
70 * • o II to O O O
o I I—>
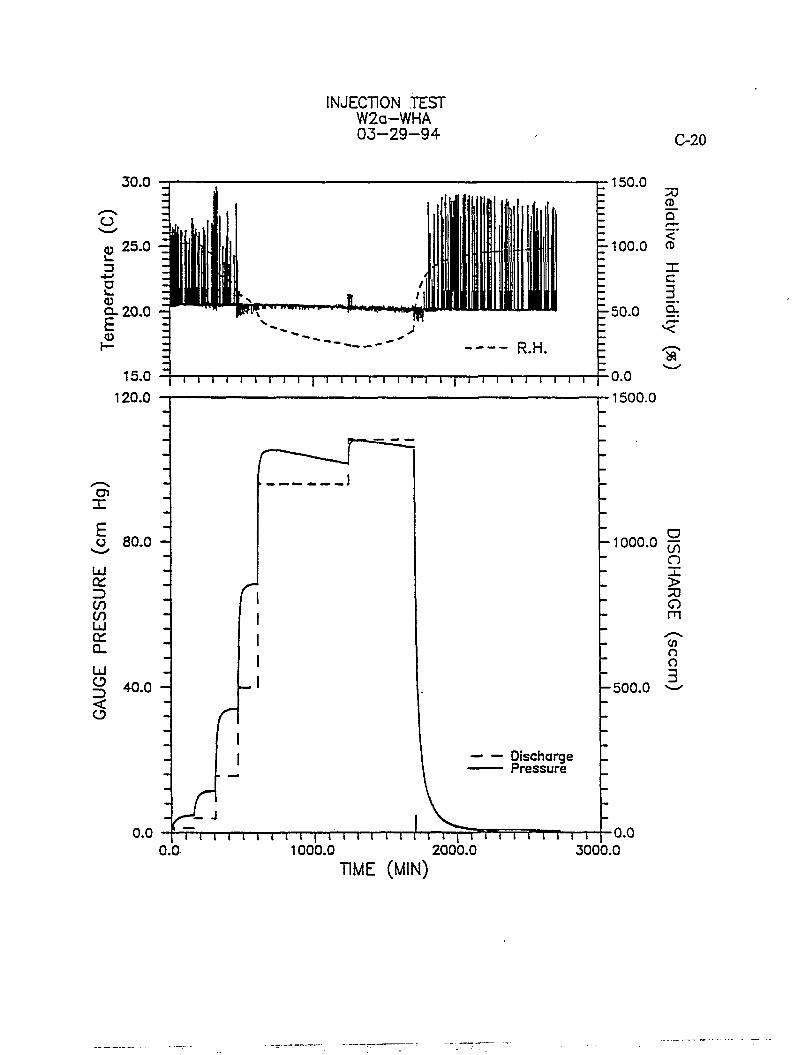
INJECTION TEST W2a-WHA 03-29-94 C-20
30.0
MliHpl »H»l|
R.H. 1 5 . 0 i i i i i i i i i [ | i i f-
120.0 l I i I I i I I i i I I
150.0 ZD
Q
• 100.0 CD X c
I. •50.0 9:
K
X
E o
LU CsL Z> (n Ld o_ ixl o ID <
80.0 -
40.0 -
0.0
J
r
n
-L J 4
Discharge Pressure
•0.0 •1500.0
1000.0 § Q > O m 0) n o 3 - 500 .0
i i i i i t i i ( i i i i i i i i i | ' i i i i r 0.G 1000.0 2000.0
1 \ I 3000.0
0.0
TIME (MIN)
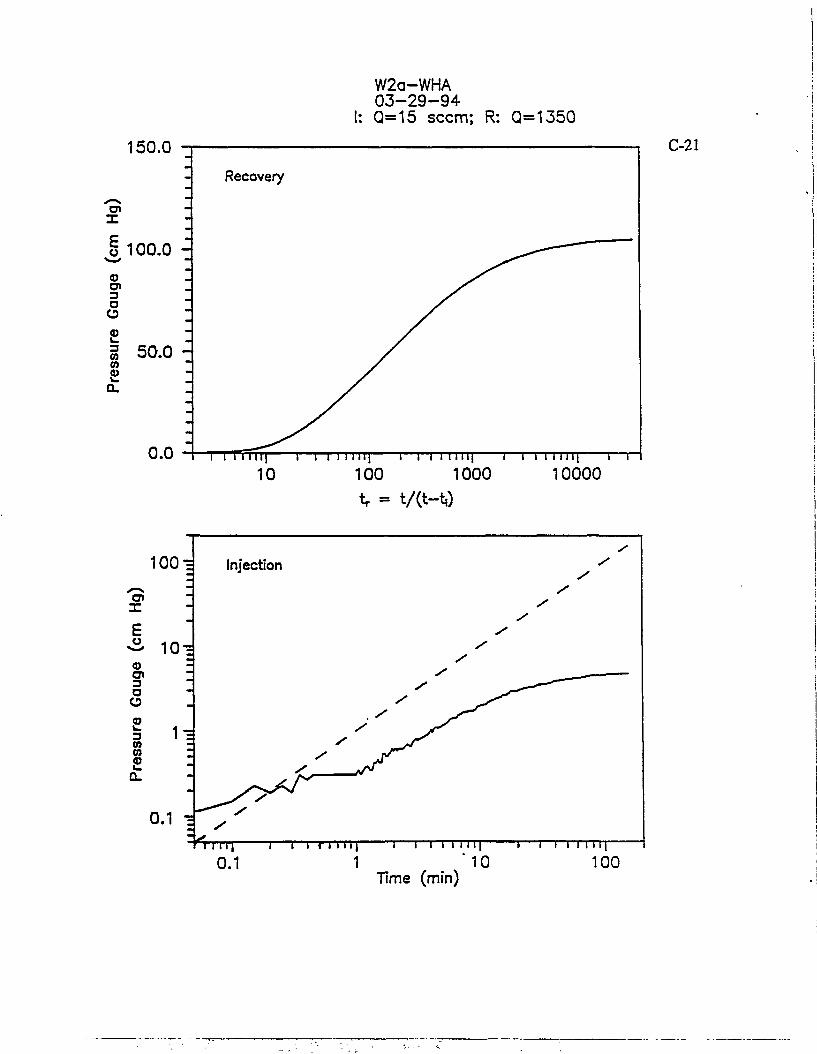
150.0
X
§ 100.0 <D C» 3 o o <D l _ 3 0] (0 V
50.0 -
W2a-WHA 03-29-94 Q=15 seem; R: Q=1350
0.0 10 100 1000
tr = t/(t-tO 10000
1 10 Time (min)
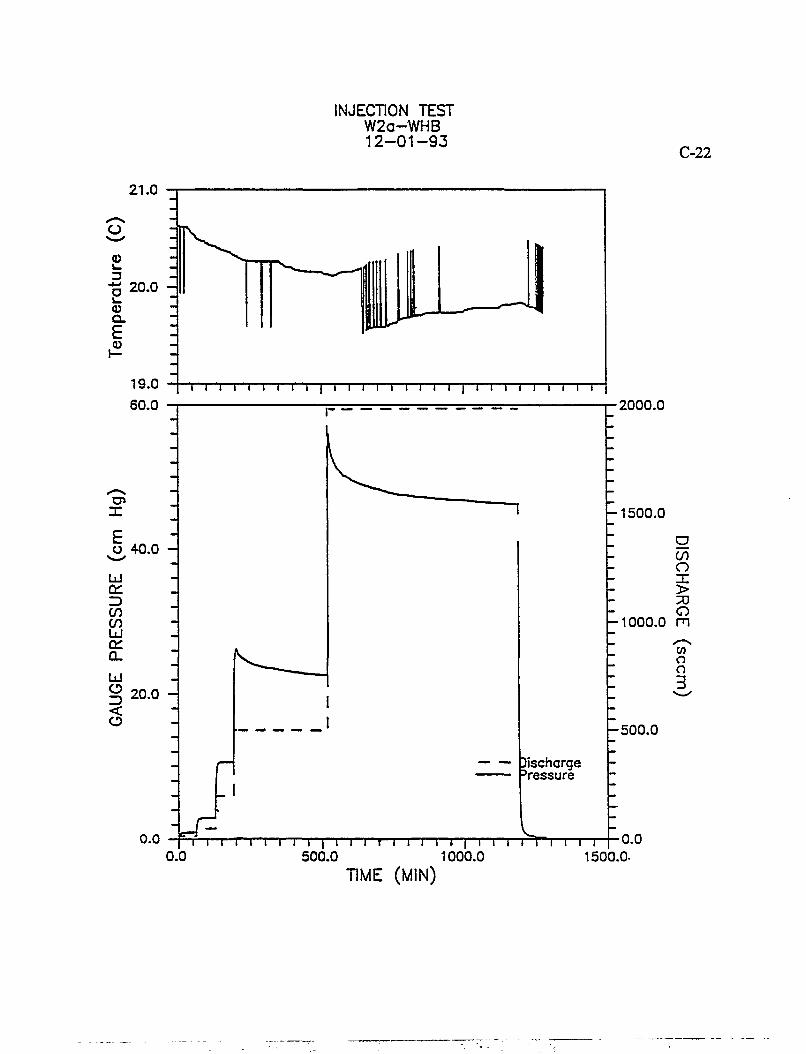
INJECTION TEST W2a-WHB 12-01-93
C-22
21.0
O
V
o
Q. E
20.0 -
19.0 60.0
i I I I I I ' I ' ' l I l l I i i i i I I
O 40.0
LxJ OH
co CO UJ en 0_
Z> <
20.0 -
0.0
I
_ l Discharge Pressure
0.0 i i i r i "i i i i | i i i r i i i i i I
•2000.0
-1500 .0
O U) O X > O
1000.0 m
a o 3
- 5 0 0 . 0
i i i r i i i r •0.0 500.0
TIME (MIN) 1000.0 1500.0-
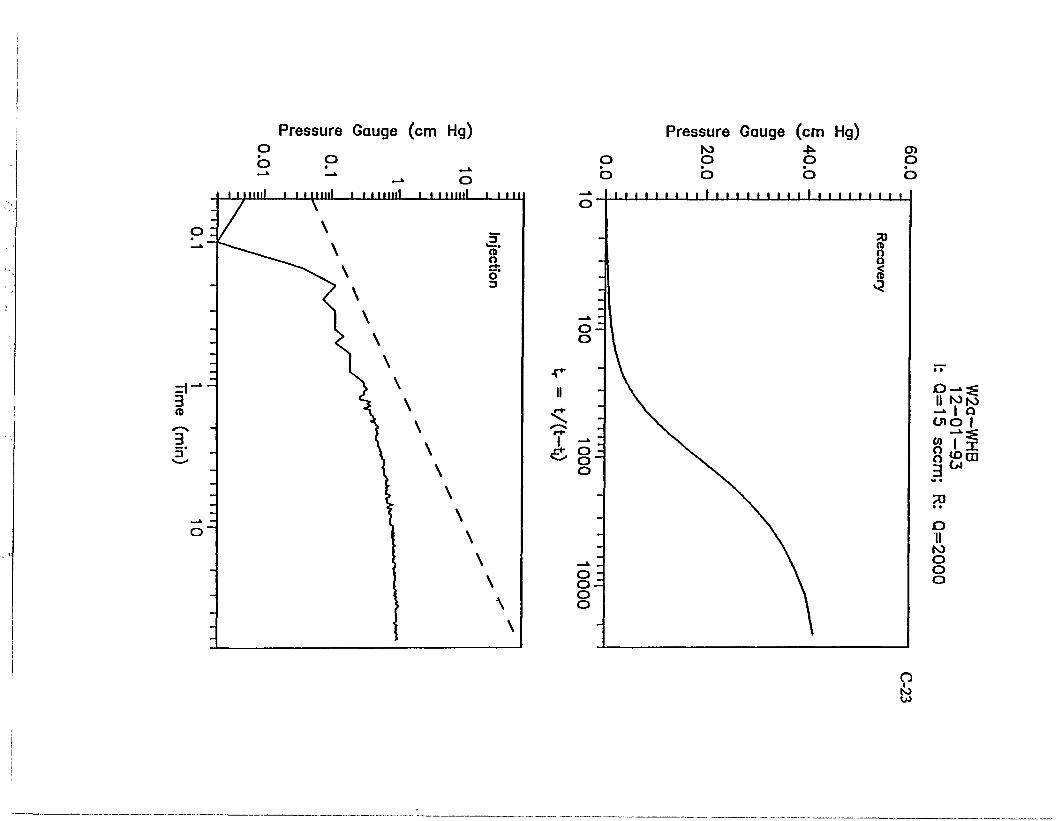
Pressure Gauge (cm Hg)
11J mil—ui i mill i-i mini i i mini i i in
Pressure Gauge (cm Hg)
II N>io -* I a cno | gTS o jo co
70 • • O II
K) O O O
o I
C-24
Graphs from Table B.3 X2 -1.0 m Data
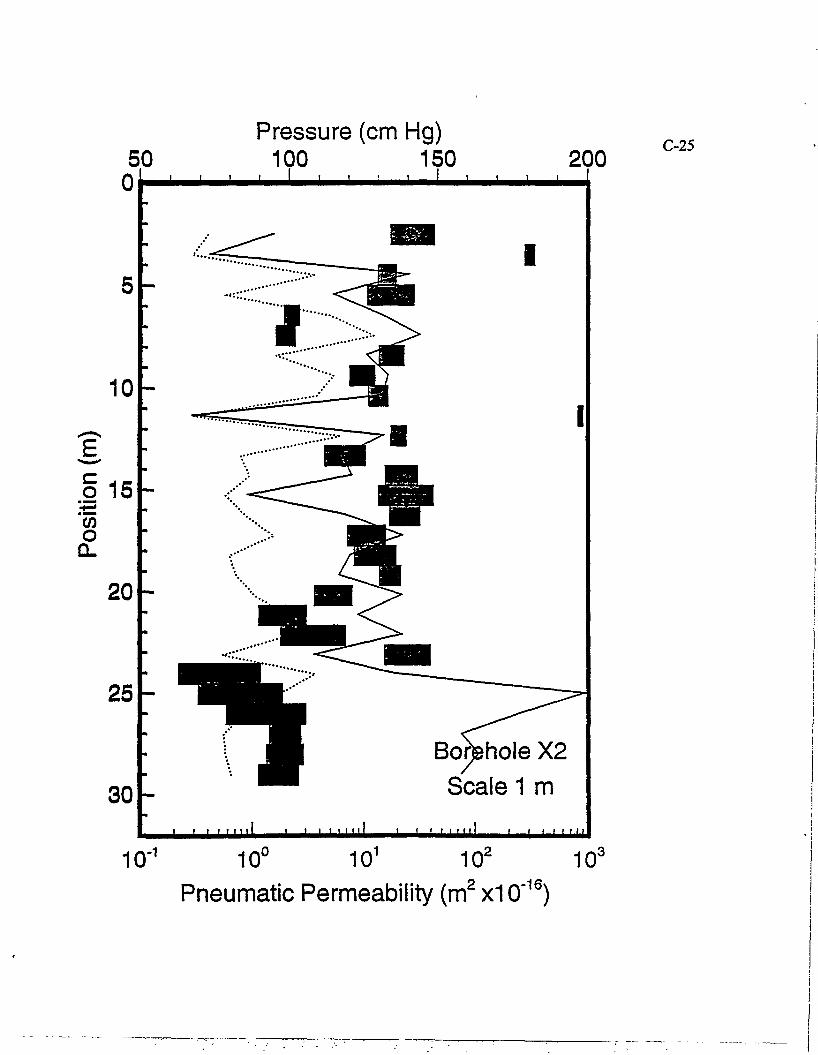
50
10
o 15h '(J)
o Q-
20-
25
30 i i i
Pressure (cm Hg) 100 150
_l I I I 200
_i i i i_
i i i i 11 i i i i i i i i 111 t t f f t f ? t
Scale 1 m i m i l i f i i m i
10"1 10° 101 10 2 10 3
Pneumatic Permeability (m x10 )
C-25
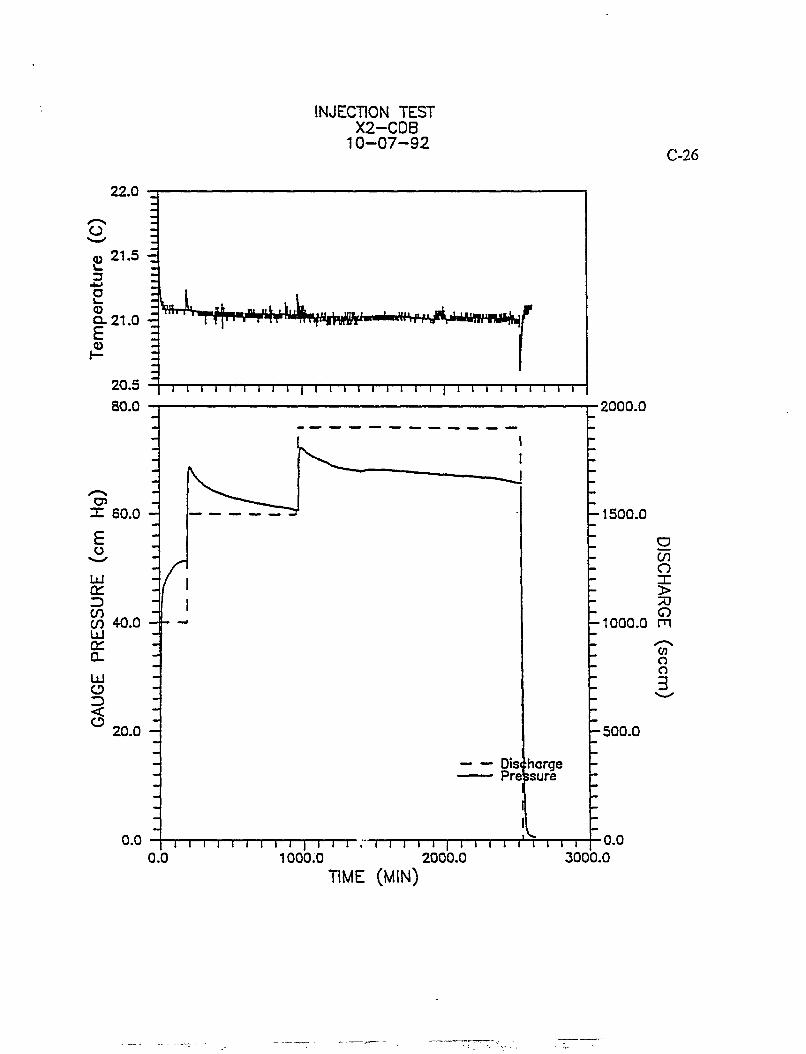
INJECTION TEST X2-CDB
10-07-92 C-26
22.0
O
£ 3
21.5 -=
<u a . 21.0 E
2 0 . 5 ^ i i i i i i i i i | i i i i i i i i i | i i i i i i i i i
80.0 - i r-2000.0
X 60.0 -
E o
a: CO 40.0 - 4 -UJ
0_ UJ O
< 20.0 H
0.0
r -1500 .0
a CO o X > 70 CD
•1000.0 m
en o o 3
- 5 0 0 . 0
Discharge Pressure
I 0.0
I I I I I I I I I | I I I ." I I I I I | I I I I I I I I i •0.0 1000.0 2000.0
TIME (MIN) 3000.0
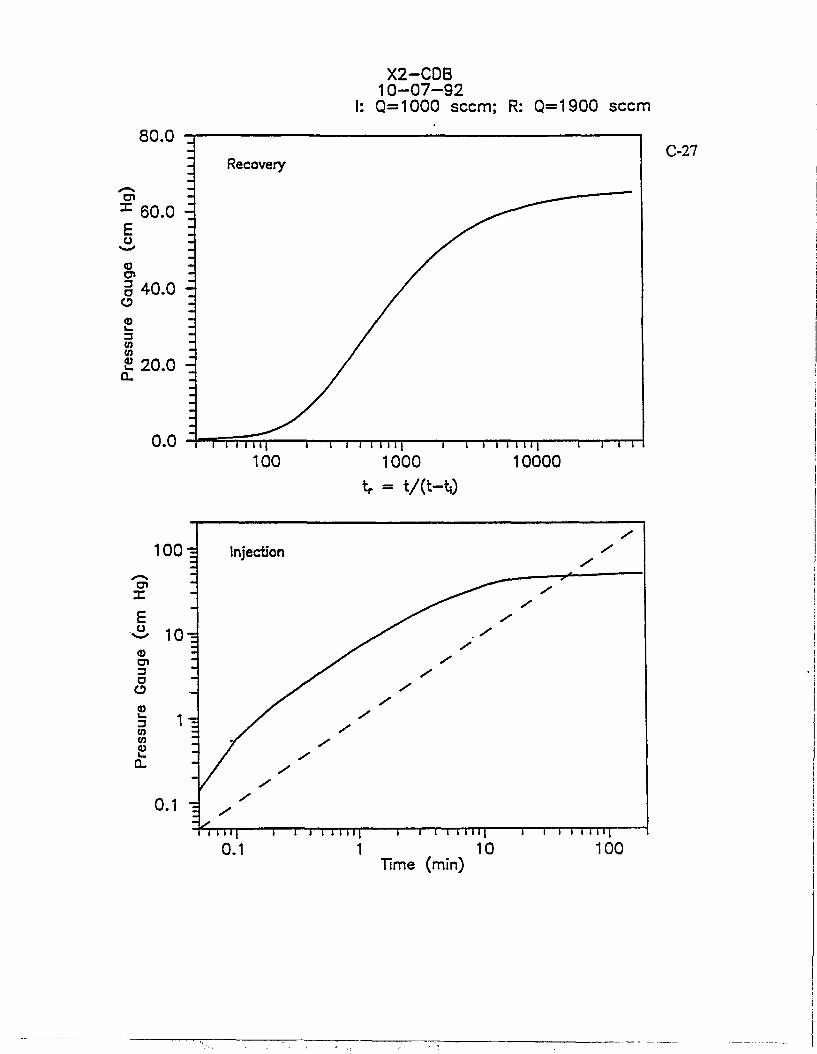
X2-CDB 1 0 - 0 7 - 9 2 Q=1000 seem; R: Q=1900 seem
80.0 -r
Recovery
x 60.0 E o
3 40.0 o
3 W 01 £ 20.0
Q.
0.0 I I 1 I I I I— 100
T—i—i i i i i i | 1—i—i M I N I 1—i—r-r 1000
tr = t/(t-t,) 10000
1 10 Time (min)
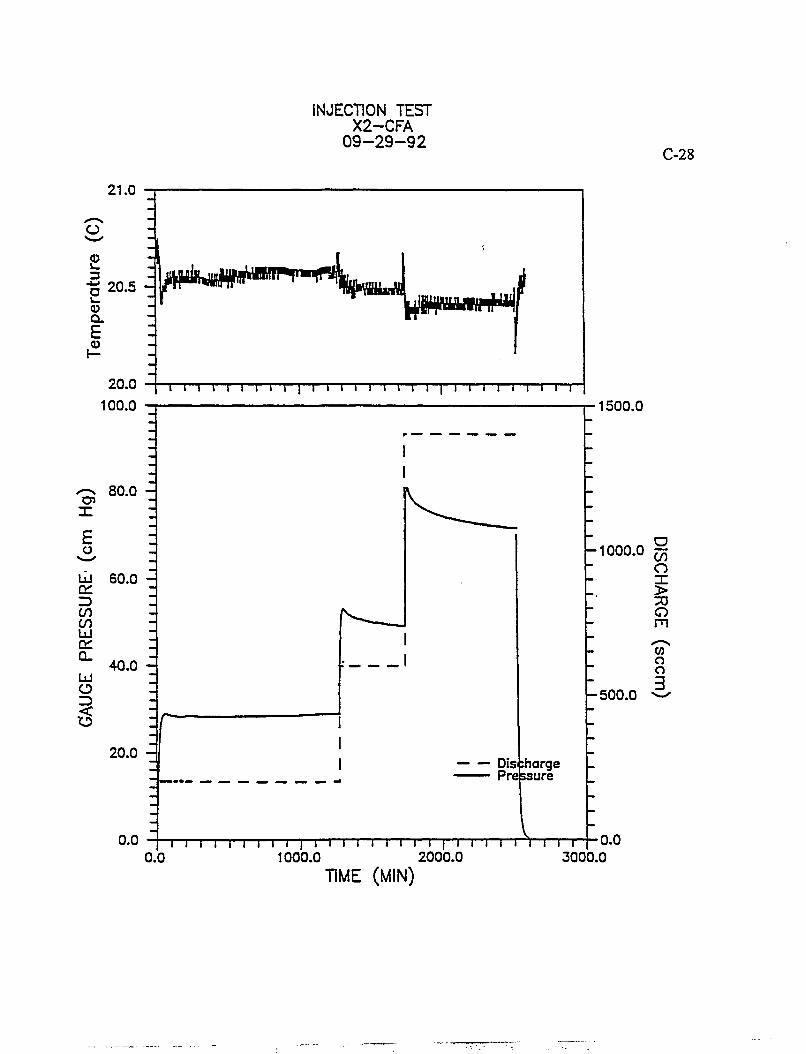
INJECTION TEST X2-CFA
09-29-92 C-28
21.0
O
<D
3 •K 20.5 -
Q. E
20.0 100.0
• -N 80.0 H o> X
E o
LU 60.0 en CO CO UJ C£ CL
O
5
40.0 -
20.0
0.0
t i l 1 l 1 l l l T n l i i r i i i i i i i i r
-1000 .0 77,
1500.0
-500.0
Dis :harge Pressure
I l I I I I I I l | I I l i i i i i i I i i i i i i i i i 0.0 1000.0 2000.0 3000.0
0.0
TIME (MIN)
o in o x > o n
o o 3
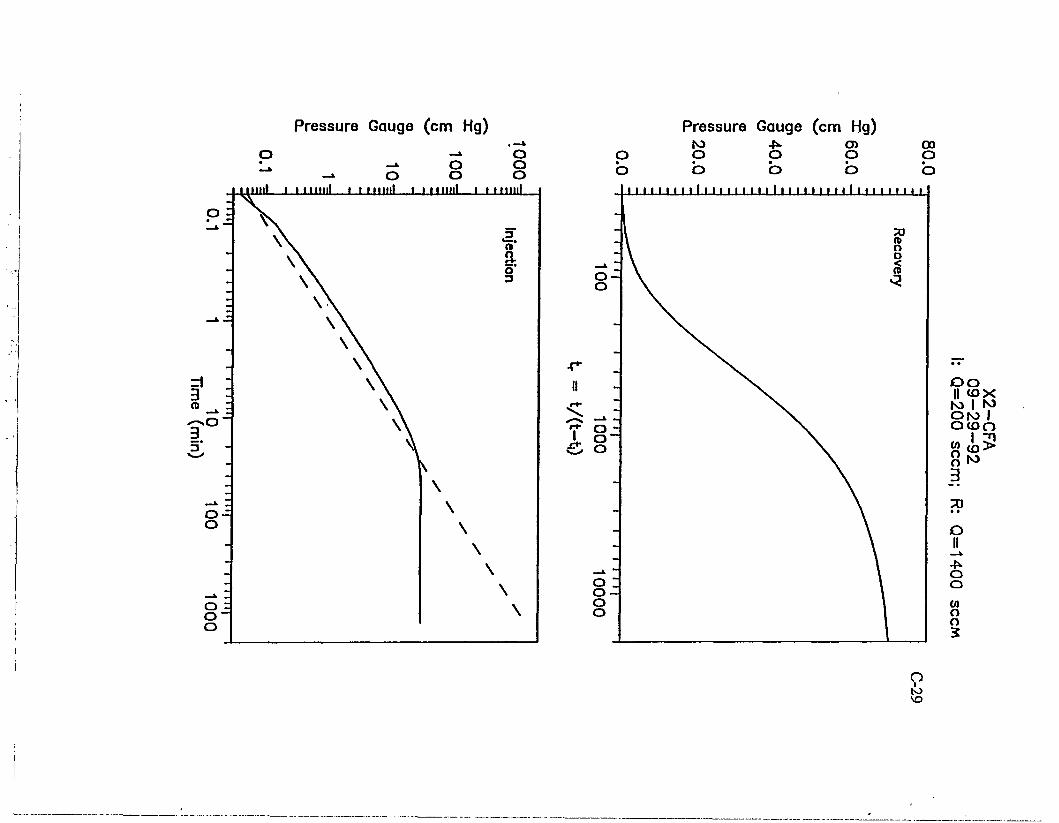
Pressure Gauge (cm Hg)
-* o _i o O
-» o o o Uilll i i mini i i imill i i M"»t I I IIIIIlL
Pressure Gauge (cm Hg)
o to
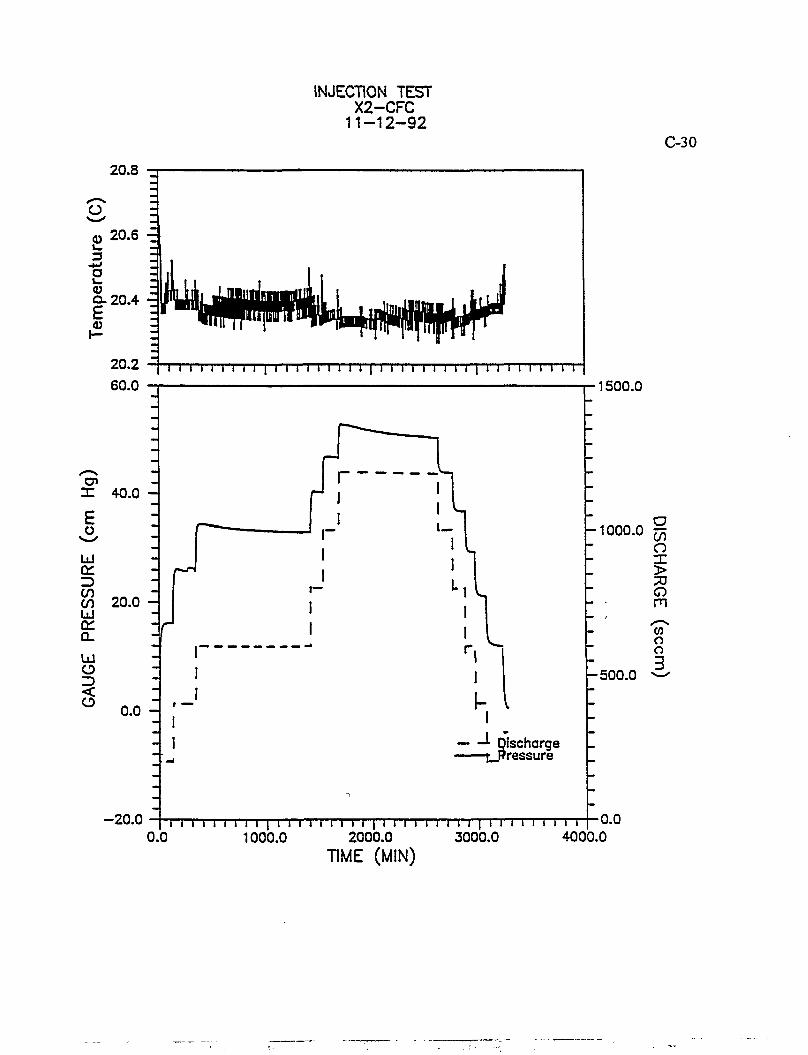
INJECTION TEST X2-CFC
11 -12 -92 C-30
20.8
20.2 60.0
I I I I I I I ) I I I I I i i i i I I | I I ) I | I I I I I I I I i
X
E o Ld or co co Ld 01 Q. LU
o <
40.0 -
20.0 -
r
0.0 -
-20.0
-1000.0 r5
I -
-* Discharge —t_Rressure
•1500.0
-500.0
l l 1 l I ( l I I | l l i 1 0.0 1000.0
1 I I I I I 1 I i I 2000.0
TIME (MIN)
i i i I i i i i 3000.0
l I l l 4000.0
0.0
g CO o X > 73 O m CO o o 3
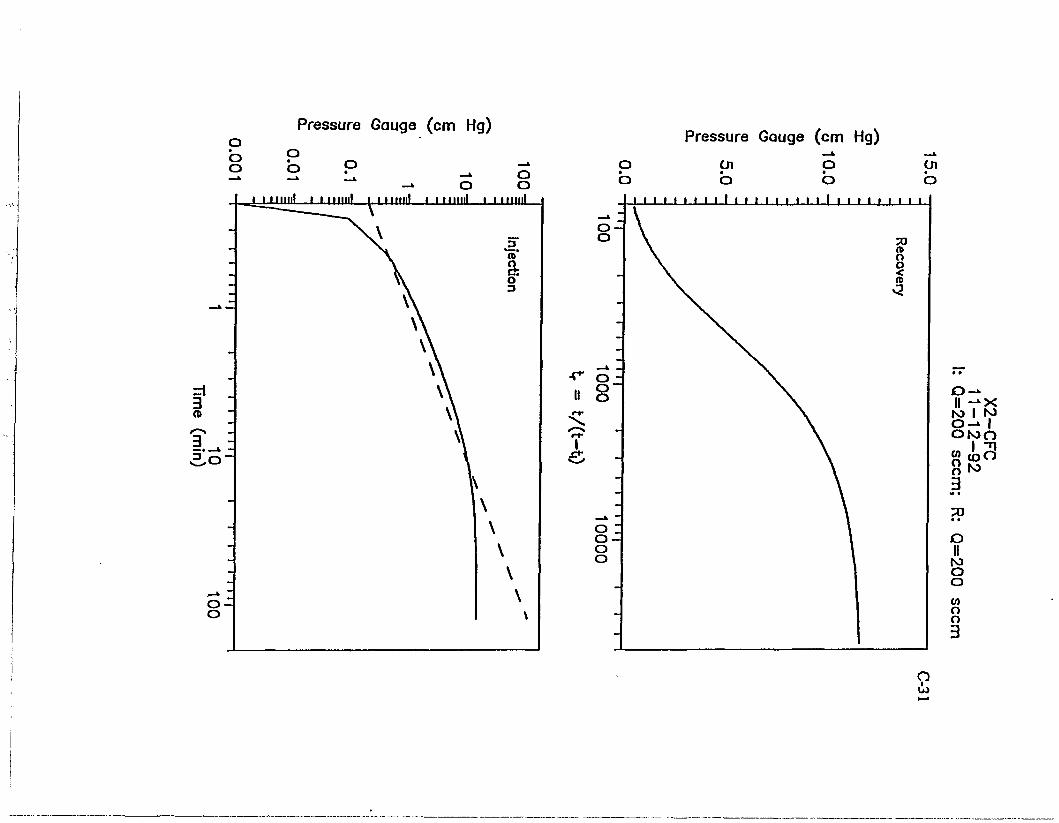
Pressure Gauge (cm Hg)
o o J I Illllll I I IHIIll I llllllll i M I I H I I i i mini
O o
J 1_1
Pressure Gauge (cm Hg)
pi p pi b o b
» ' t i i i i i i i i i t i i i i i i i i i i i i
II - *x M I N3 o-» l ONJO
I "n
3 • • O
II N> o o (/> o o 3
o
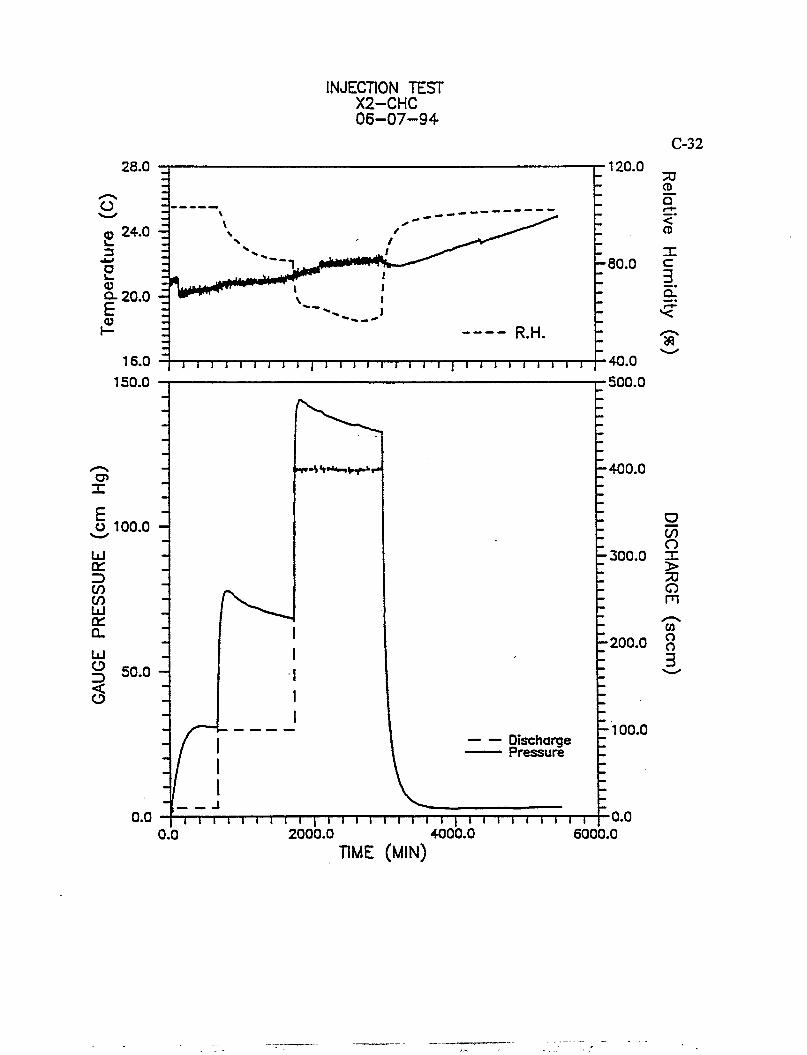
INJECTION TEST X2-CHC 06-07-94
28.0
16.0 150.0
R.H. i i i i i i i i i i i i i i i i i I i t i i i i i i i
a* X
^ 100.0
Id
z> to (/) bJ C£ Q. LLI O < O
50.0 -
0.0
Discharge Pressure
•120.0
- 8 0 . 0
-400 .0
•40.0 •500.0
-300 .0
- 2 0 0 . 0
- 1 0 0 . 0
1 I I I I I I l I | I I i i t i i i i I i i i i i i i i i 0.0 2000.0 4000.0 6000.0
0.0
TIME (MIN)
C-32
70 CD_ Q
<* CD
X c 3 CL.
35
if) O X > 70 m w o o 3
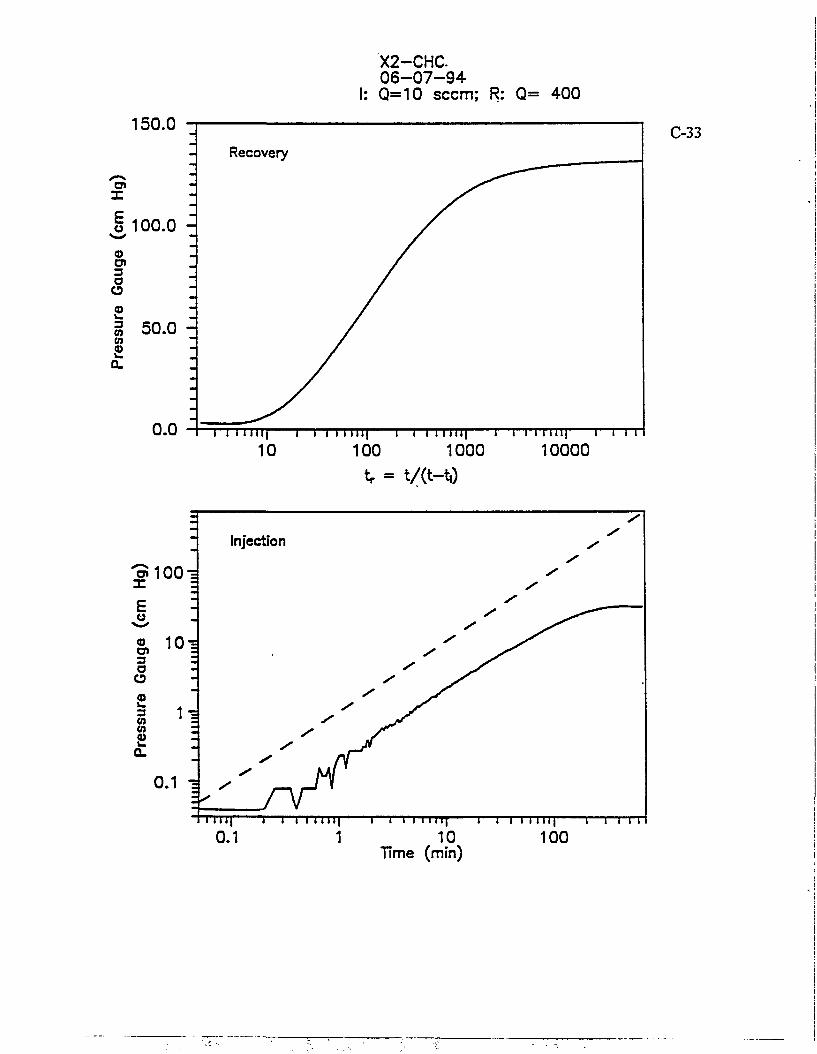
150.0
X
i 100.0
o Ol 3 O o © 3 0] CO CO
50.0 -
0.0
X2-CHC 06-07-94
I: Q=10 seem; R: Q= 400
C-33
i i i nil) 1—i i i ni i | 1—i i i iui| 1—i i i iui | 1—r-rr 10 100 1000 10000
V = t/(t-t,)
1 10 Time (min)
100
C-34
Graphs from Table B.4 X2 - 2.0 m Data
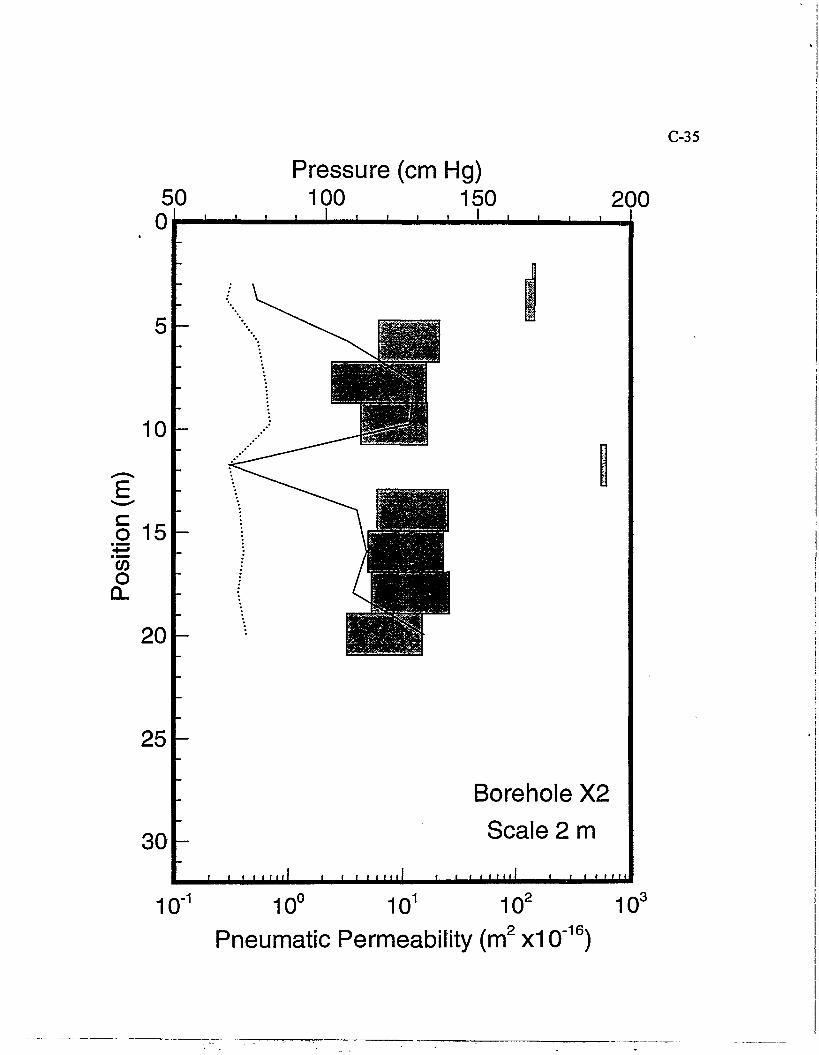
50 Ot
10
o 15 Hi o
DL
20
25 -
30
Pressure (cm Hg) 100 150
j i i I i i i i
J
200
Borehole X2 Scale 2 m
i i 1 1 1 1 1 i i i i 1 1 1 1 1 1 1 i i 1 1 1 1 1 1 1 i i 1 1 1 1 1
10"1 10° 101 102 10J
Pneumatic Permeabifity (m 2 x10"1 6)
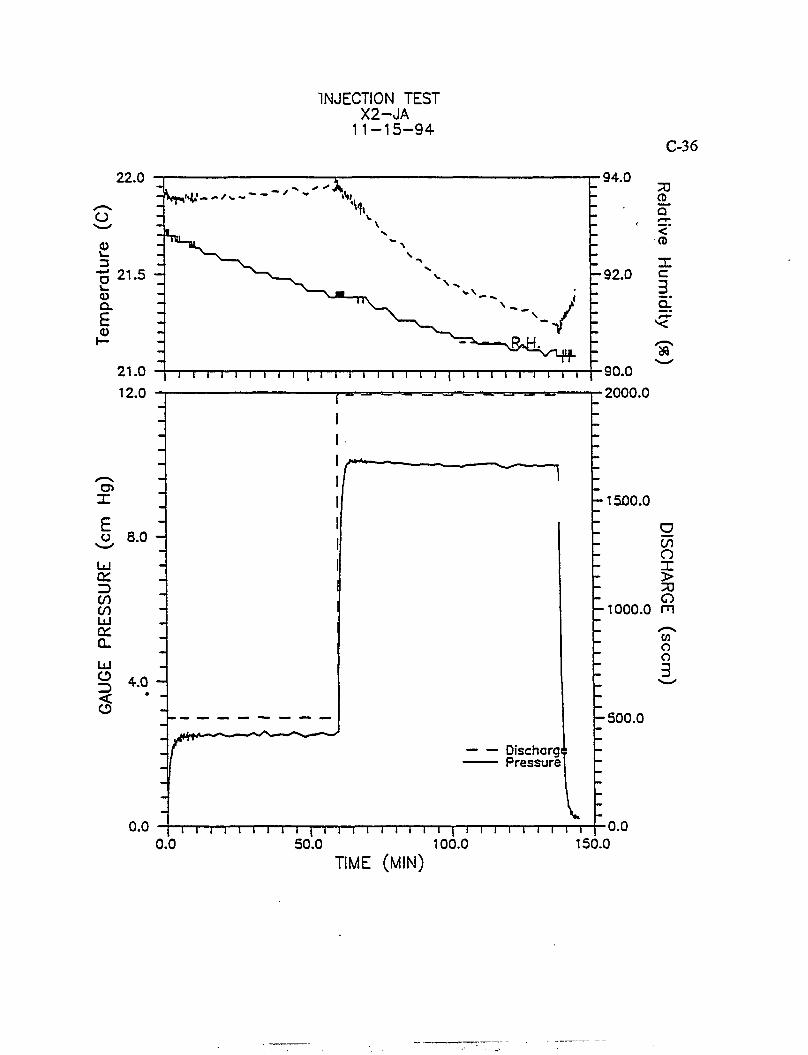
INJECTION TEST X2-JA
1 1 - 1 5 - 9 4 C-36
22.0 94.0
50.0 100.0 TIME (MIN)
150.0
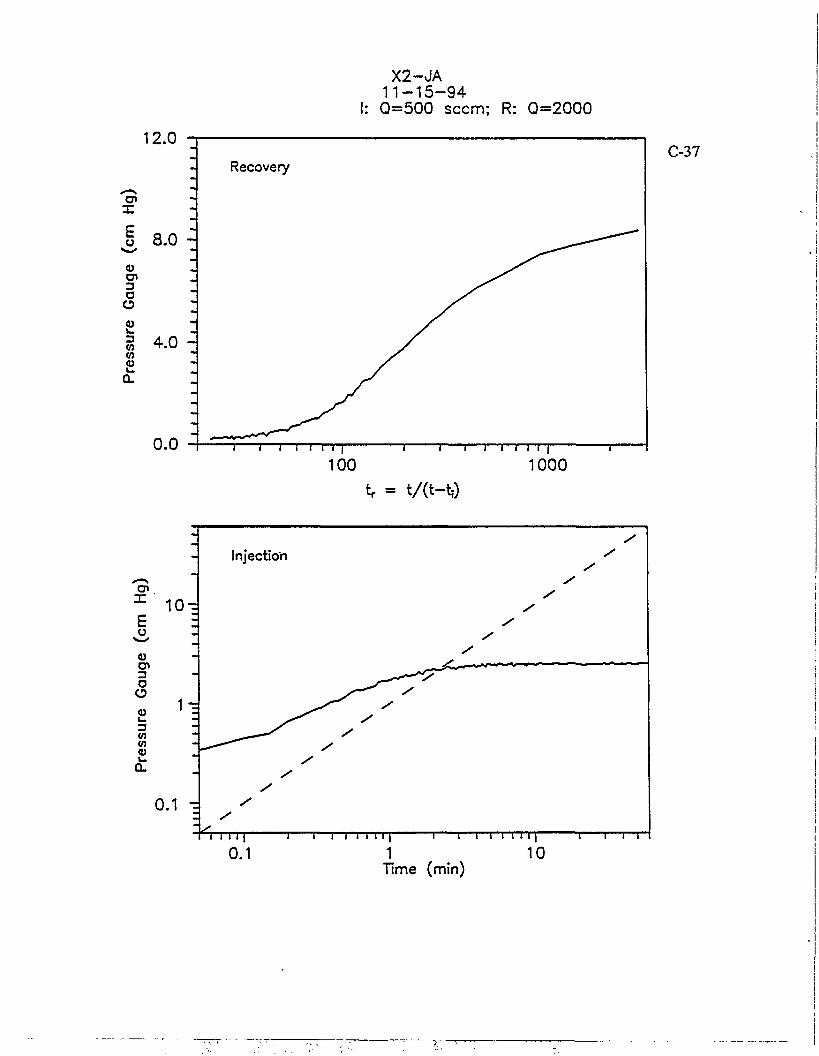
en X E u a.o -
3 a
O <u 3 <n V)
4.0 -
0.1 -
X2-JA 1 1 - 1 5 - 9 4 Q=500 seem; R: Q=2000
12.0
Recovery C-37
0.0 n 1—i—mr 1000
tr = t/(t-t0
Cn X
E o
1 0 -
Injectio'n y
/ /
/ /
en 3 O o <u L_ 3 W W <u
1-= /
/ /
/ y
i i 1 1 1 1 — i — i i i i i i | 1 — i — i i i i 1 1 1 T 1 T T i 0.1 1
Time (min) 10
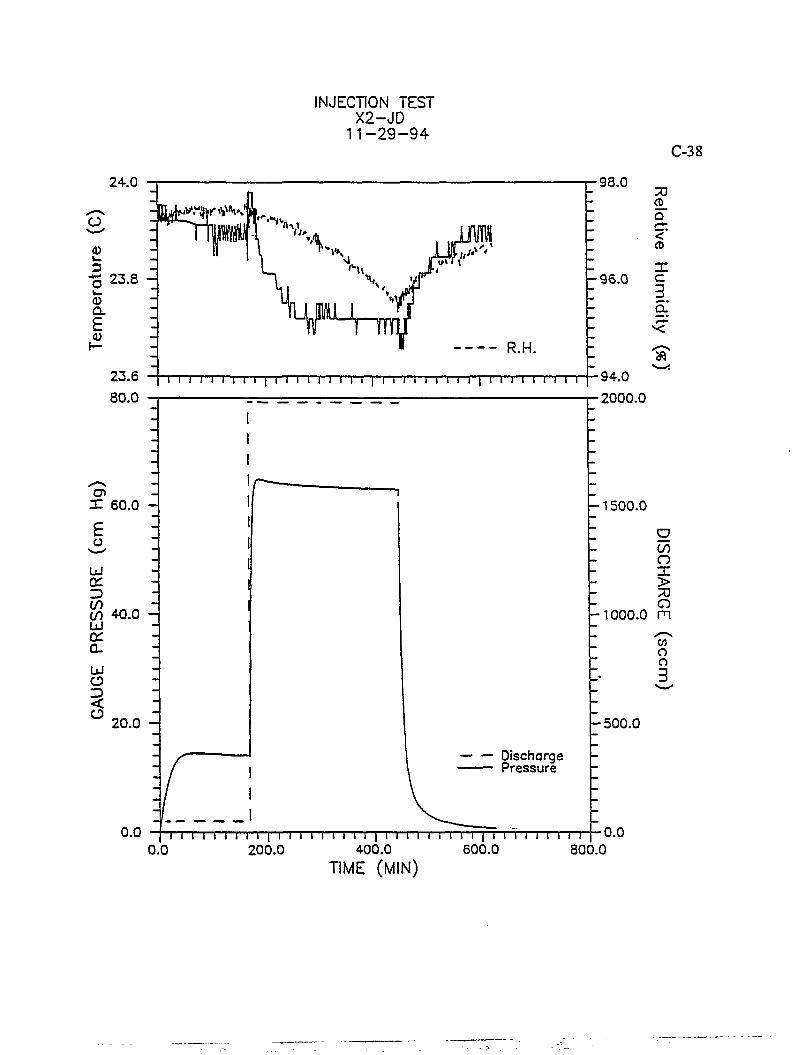
INJECTION TEST X2-JD
11-29-94 C-38
24.0
a, o v-3 23.8 -
a E a>
23.6 80.0
R.H. i i i i i i i i i I i i i i i i i i i I i i i i i i i i i i i i i i i i i
•98.0
- 9 6 . 0
70 <p_ Q £»• <* CD
X c 3 Q."
' »
X 60.0
E o
UJ
00 40.0 Ui cc Q. U O <
20.0 -
•94.0 •2000.0
-1500 .0
g CO o X > 70 a
1000.0 m
C/} o o 3
- 500 .0
Discharge Pressure
0.0 l I I i i I i i i | i I I I I I i I i | I I I I i i i i i | i I I I l r i I I 0.0 200.0 400.0 600.0 800.0
TIME (MIN)
0.0
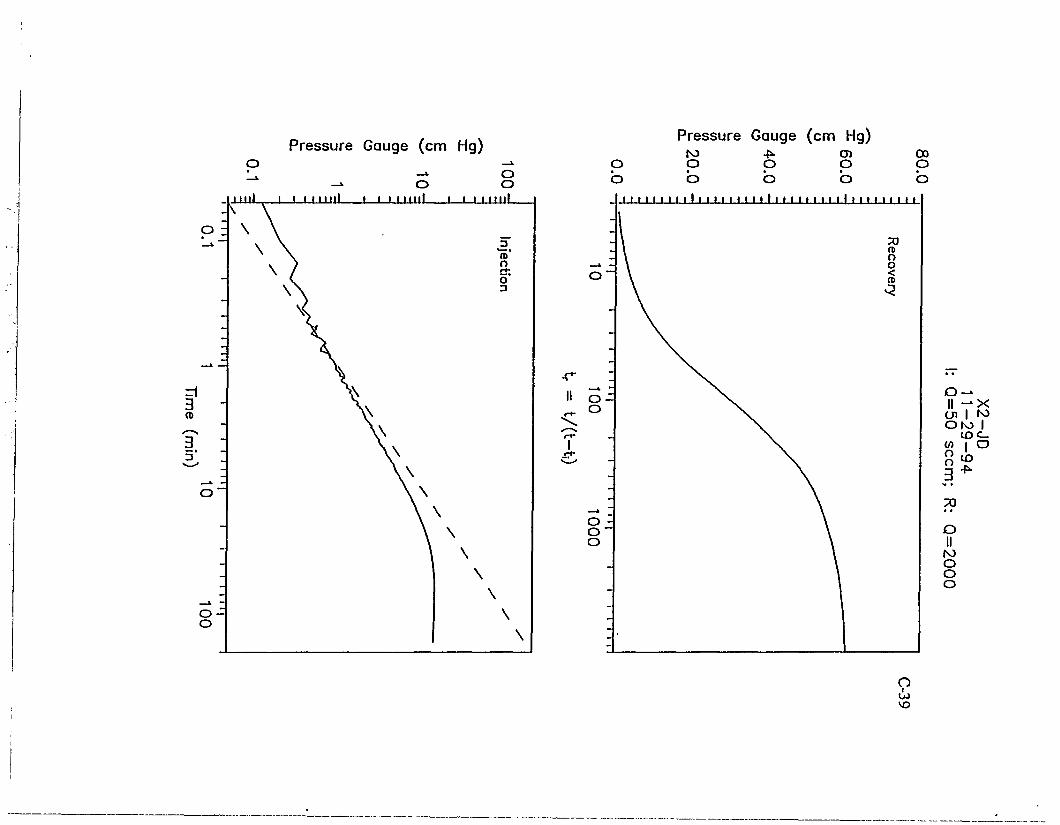
Pressure Gauge (cm Hg)
-» o -» o o
mil . i i i 111IJJ t i n mil i i i 111uL
Pressure Gauge (cm Hg)
II - x en I N> OK) I
tOC_ </> I O
• • o II
K) O O O
n • to vo
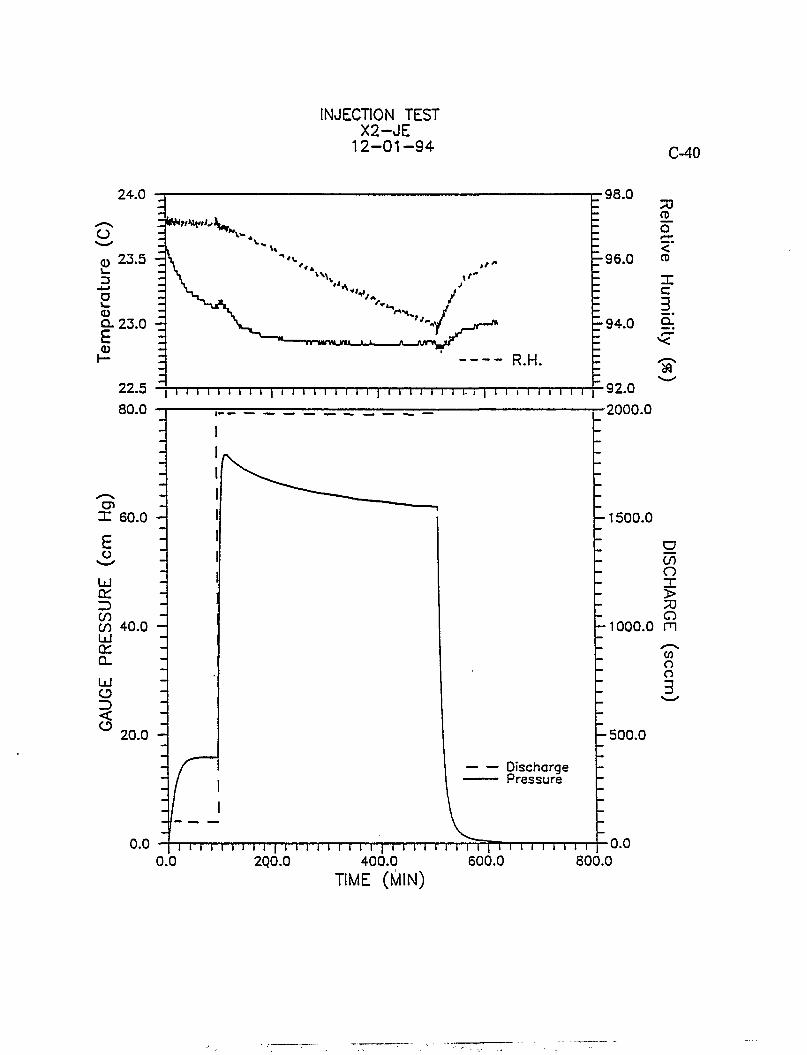
INJECTION TEST X2-JE
12-01-94 C-40
24.0
2 2 . 5 i i i i i i i i i | I i i I l l l l l | I I i i i I I I. i | I I i I I i I I i
80.0
•98.0 73 Q
•96.0 «
c
E-94.0 G:
SA 92.0 2000.0
I I l | I I I I l l l l l p I l 400.0 600.0
l l l l l 800.0
TIME (MIN)
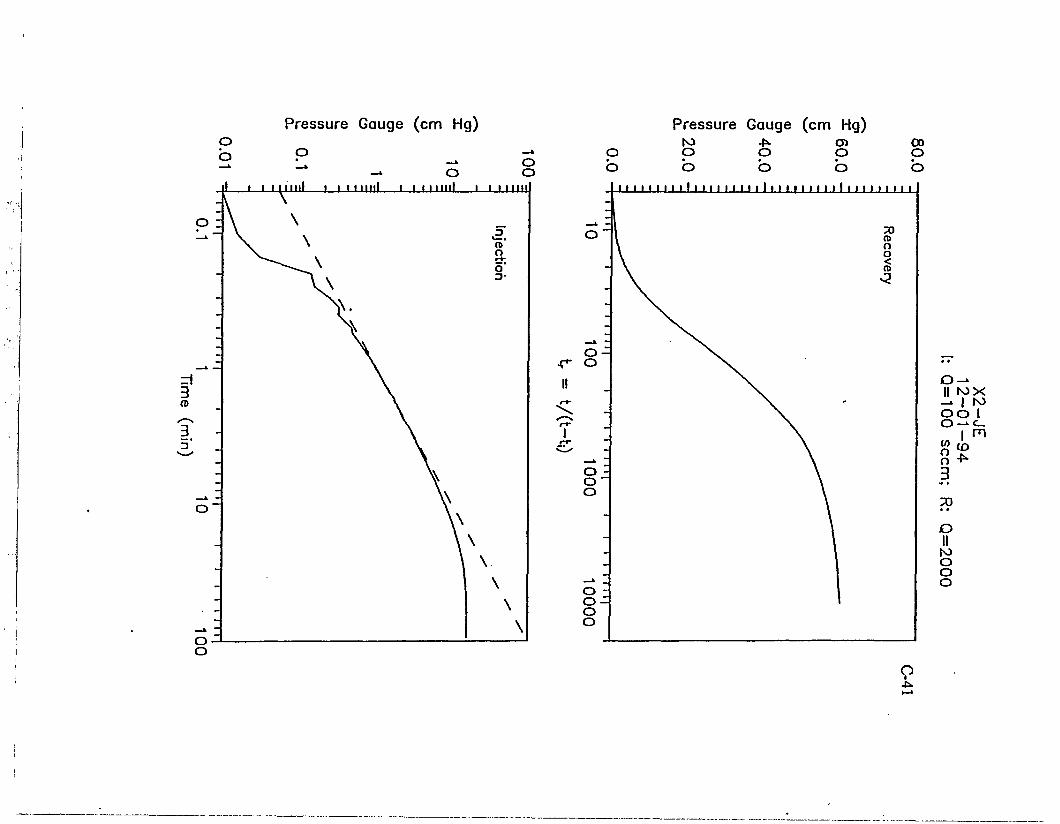
Pressure Gauge (cm Hg)
-* o o o
J i i i mill i i 11mil i i i mill i i i inn
Pressure Gauge (cm Hg)
II tox _ | K> o o I 0 - * c
I rn m to 8 *
70 • • O II M O O O
•
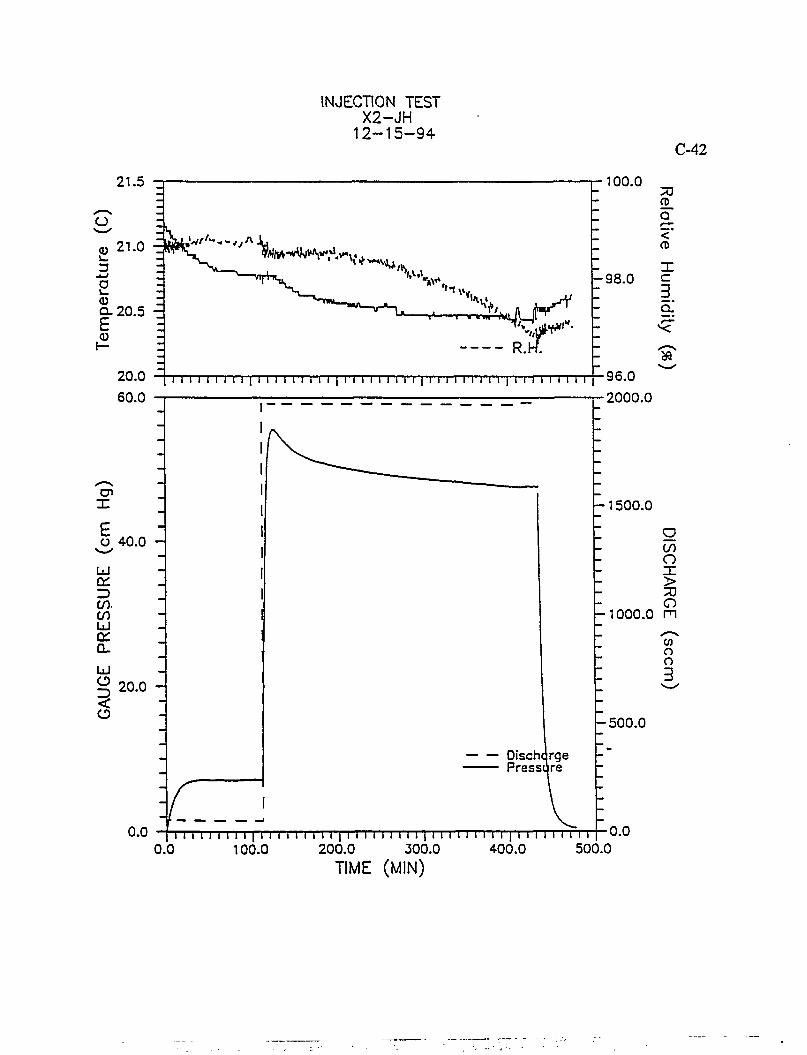
INJECTION TEST X2-JH
1 2 - 1 5 - 9 4 C-42
21.5
20.0 60.0
w h * ^ i » V , u ^ . + v ^
- H^J. R.H.
i i i i i i i i 1 1 i i i i i i i i i | i i i i i i 1 1 i 1 1 1 i i i i i i i | I i i i i i i i i
100.0 33 GL Q
<* CD
X h-98.0 c
3 ex
x £ O 40.0 u en coco LU Q£ 0_
Id ^ 20.0 <
•96.0 •2000.0
1500.0
O CO O X > O
•1000.0 m
C/) o o
Discharge Pressure
I
- 5 0 0 . 0
0.0 [ i i n i 11 11 11 i i i i i i i i | i i i i 11 11 i | 11 11 i i i i i | i i i i i i i i i I 0-0 0 . 0 1 0 0 . 0 2 0 0 . 0 3 0 0 . 0 4 0 0 . 0 5 0 0 . 0
TIME (MIN)
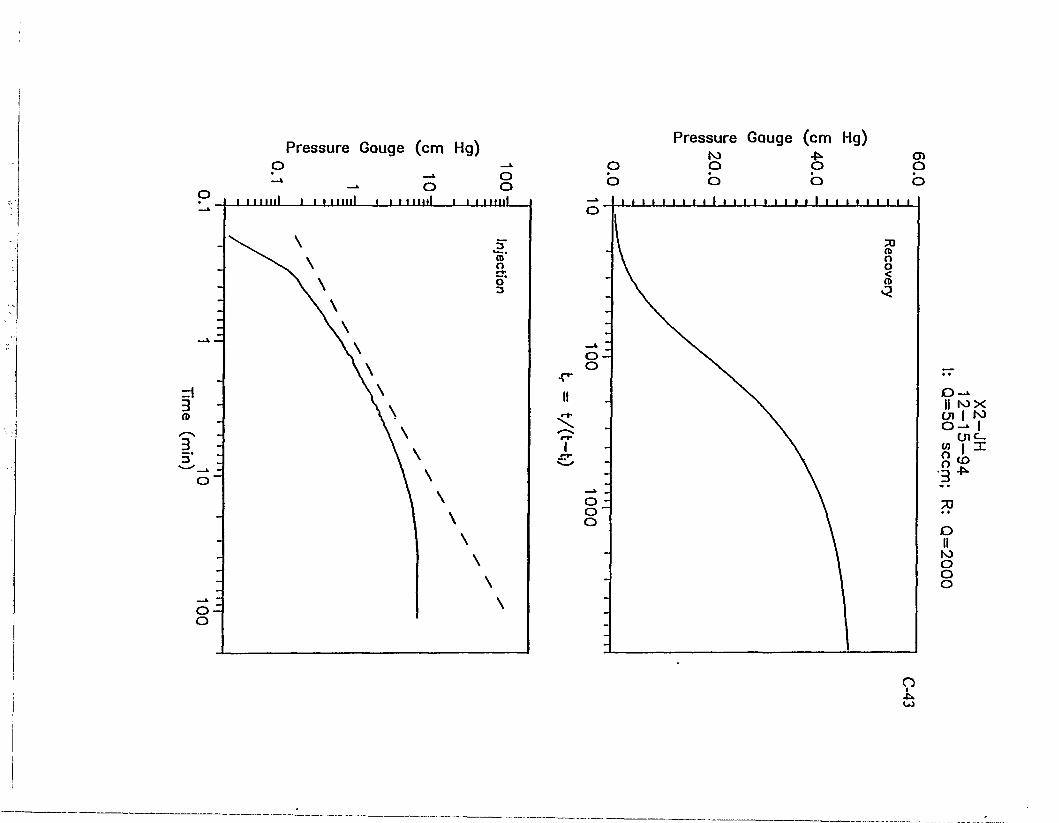
Pressure Gauge (cm Hg)
-* o -» o o
i mill i i i.mill i i i mill i i i nniL
Pressure Gauge (cm Hg)
p b
o o CO
o —x 1 1 1 1 1 1 1 1 1 1 1 1 1 1 1 1 1 1 1 1 1 1 1 1 1 1 1 1
o
-
Recovery
001
-
o -o~ o
-
O _* II I O X en 1 K> o -* 1
( n c M 1 n: o n
to 3 -^
7} • • o ll to o o o
I
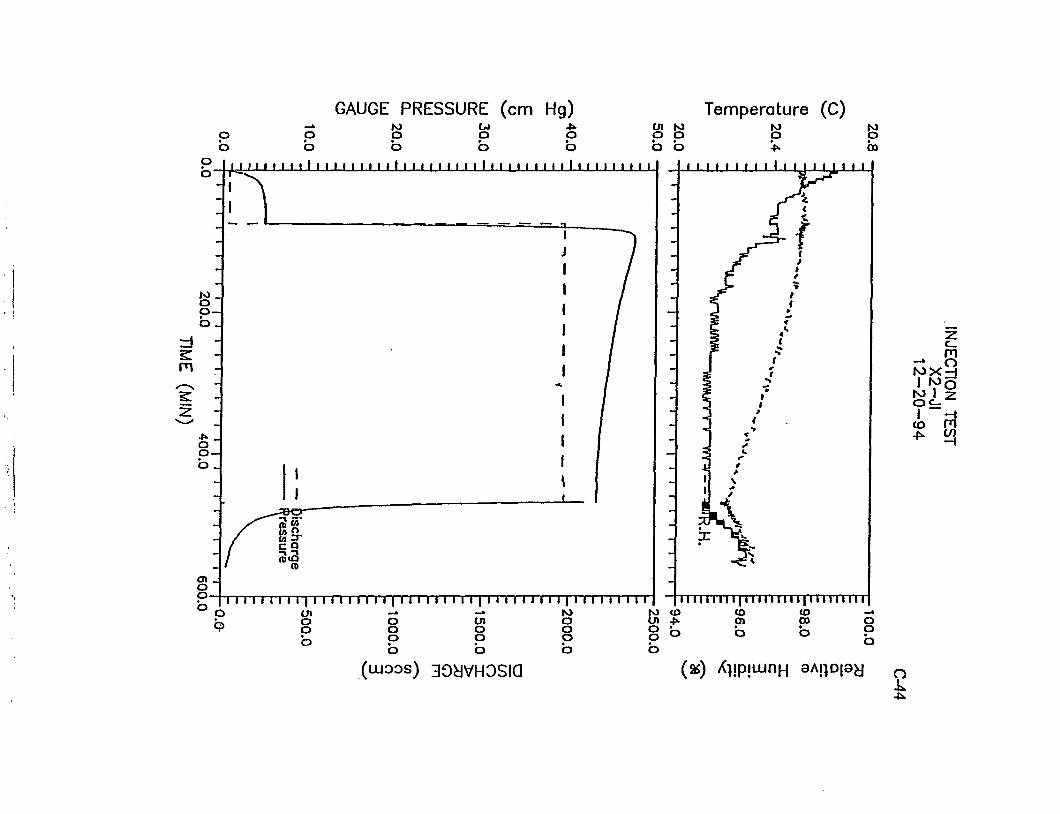
GAUGE PRESSURE (cm Hg) Temperature (C)
b o o
M O O o Ul o s s ro
o O O o o o •*>• oa
p b" , y n 1111111111111111»11111111111 u i 1111111 i i i M 11 n NJ _ O O —
o rd -§: -m -
2: -* • _ o o -
I I.I I I I I I I I.I I I I.I
11111111 n 111111111111111111111111ii11111111111111 -11111111111111111111111111111 • o m - * -» N3 M < O « O C O - »
j-, o o tn o tn > o> 00 o o b
o b
o b
(LUOOS) 39dVH0Sia (as) /typ-ujriH 8AjiD|sy
•z c_ m
M X ? I VO 1 ^
to m
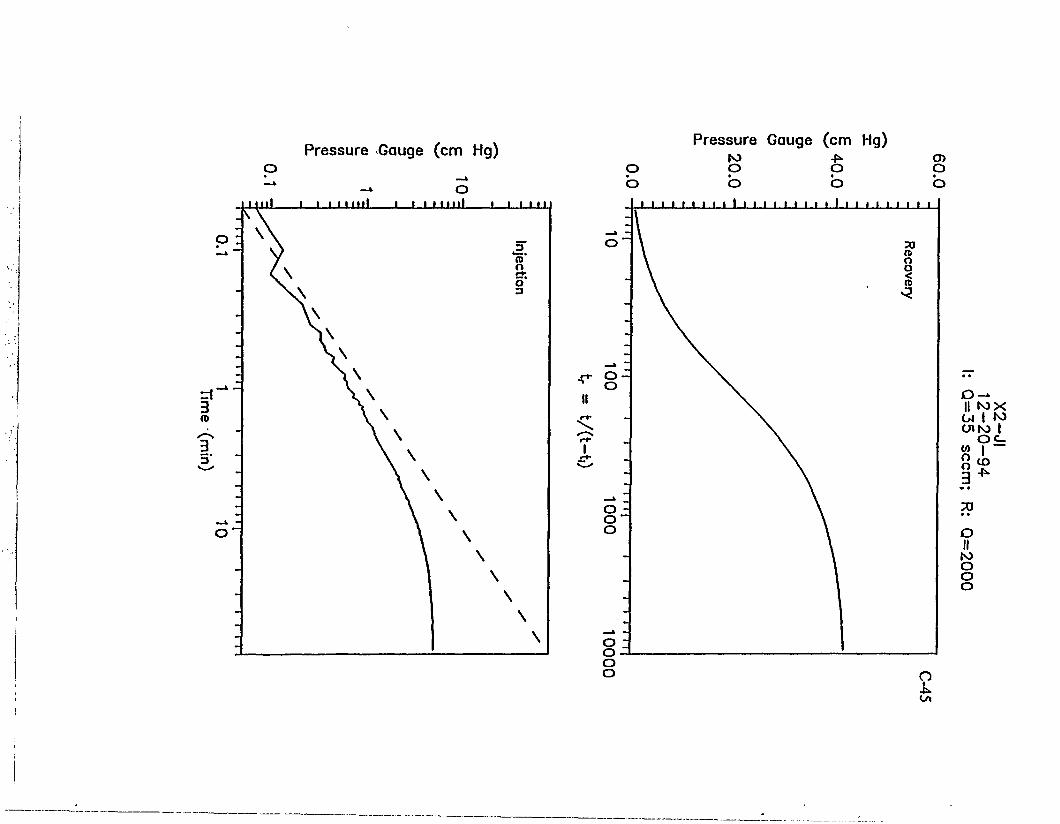
Pressure Gauge (cm Hg) Pressure Gauge (cm Hg)
II N3X CJ I M
O o 3
w *
73 • • O II to o o o
to

C-46
Graphs from Table B.5 Y2 - 0.5 m Data
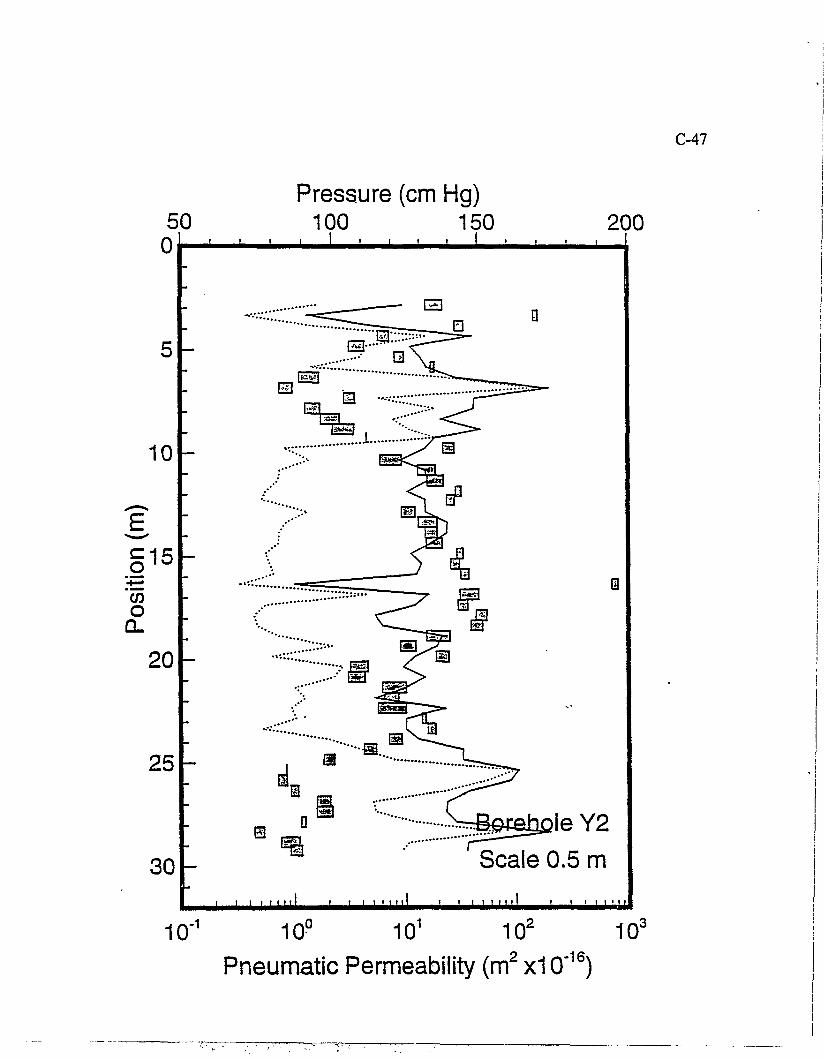
C-47
50 0
10
§ 1 5
C/D O a.
20
25
30
10 -1
Pressure (cm Hg) 100 150
• i i_ 200
Q
leY2 Scale 0.5 m
i 1 1 1 1 1 1 1 i i 1 1 • 1 1 1 1 • i 1 1 1 1 1 1 1 i > 1 1 1 • 11
10° 101 102 105
Pneumatic Permeability (m 2 x10"1 6)
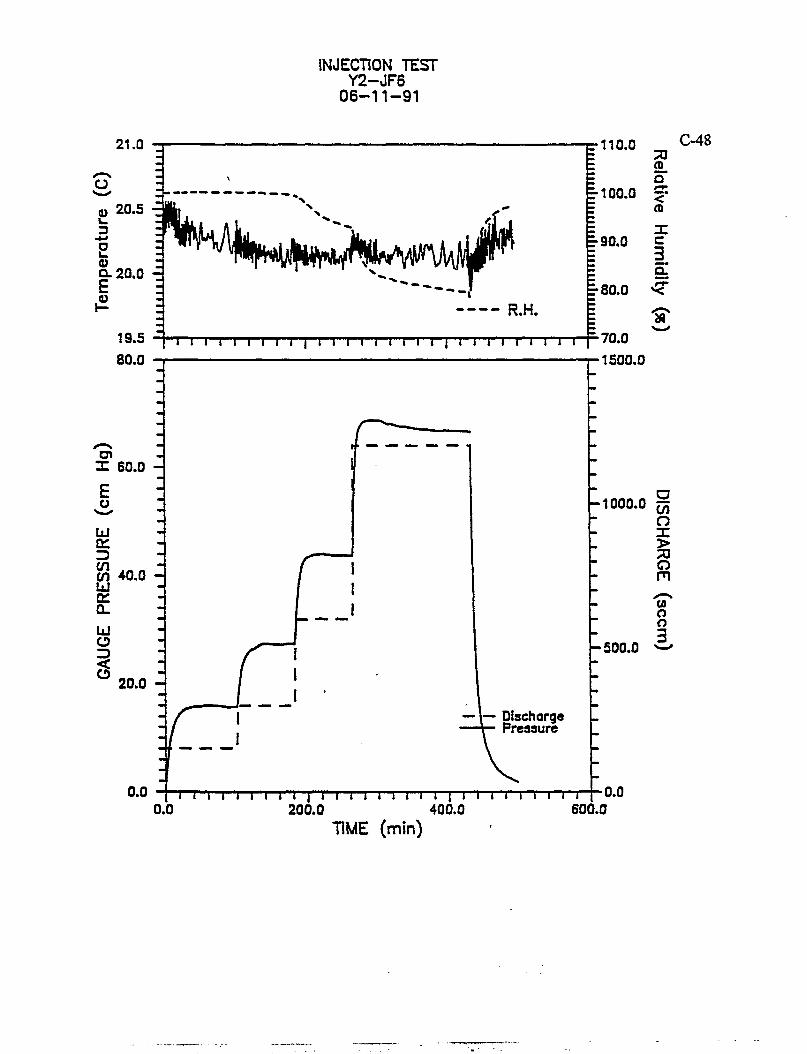
INJECTION TEST Y2-JF6
06-11-91
TIME (min)
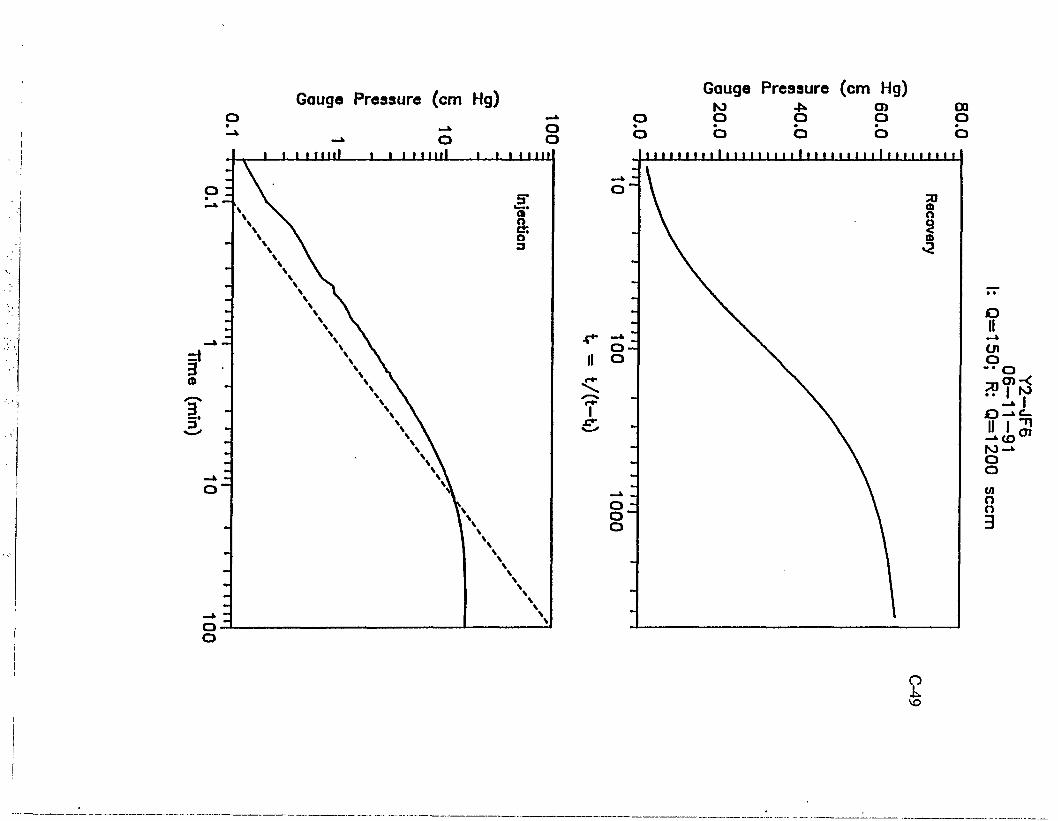
Gauge Pressure (cm Hg)
o o j i, i i m i l i i i i m i l i—i. I I I I I I
Gauge Pressure (cm Hg) N3 4*> a> 00
o o o o o % • • • • o o o o o 1 1 1 1 1 1 1 1 1 1 1 1 1 I I 1 1 1 1 1 1 1 1 1 1 1 1 1 1 1 1 1 1 1 1 1 1 1 1
a o -• o
"i? II I ^
to-A o o C/l o n 3
n
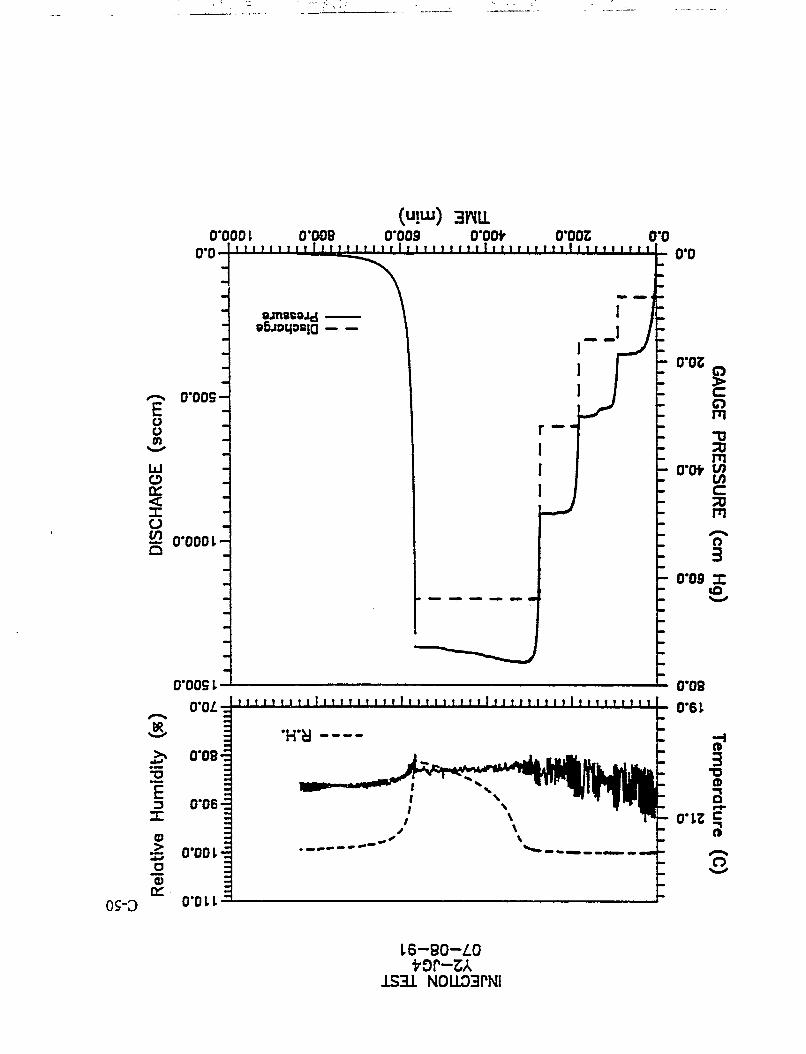
0*0001 0*099 (UIUJ) 3NU
0*009 O'ODt O'OOZ 0*0-
E u o m
Ixl o a: < x o CO
0*005-
0*0001-
0*0051 0*0£
^ - s t* £• 0'0B • a
E 3 0*06 X ©
1*3 0*001 a V tr
OS-D 0*0 U
i i i i m i i l i i | i i i i i i l i i i n i i i i l i i i i i m i l i m i i m 0*0
8jnsB8.y
0*0
J
- 0*03
c CD
**o **o m o*ot w w c re m
3 0*09 X to
0*08 j i i i i i i i i i l i i i i i i i i i l i i i i i i i i i l m i i i i i i l i i i i m t i l Q . 6 1
• H*y
• » '
3 *o 0 a
0*12 I"
O
16-80-10 fr0P-SA
1S31 N0LL03PNI
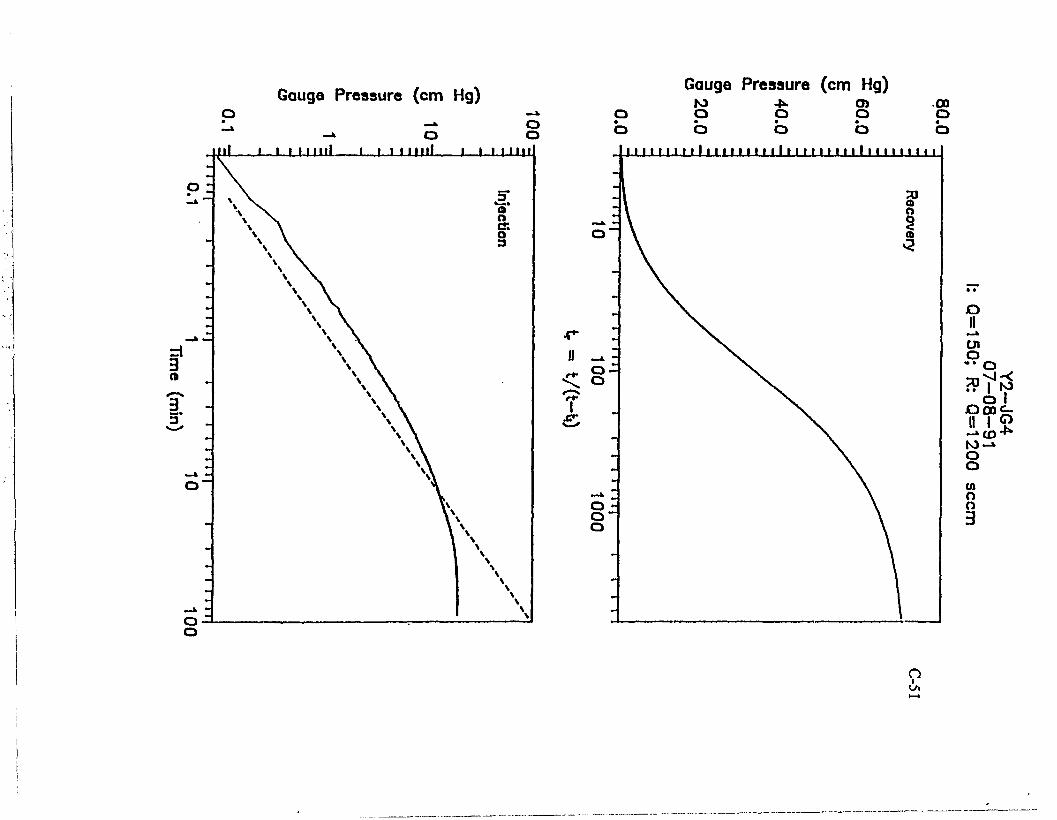
Gauge Pressure (cm Hg) Gauge Pressure (cm Hg) to -N O) 00
o o O o o • • • « o o o o o
o
en o -• o *? I w O00C-. ii i 2
o o (A o o 3
o I
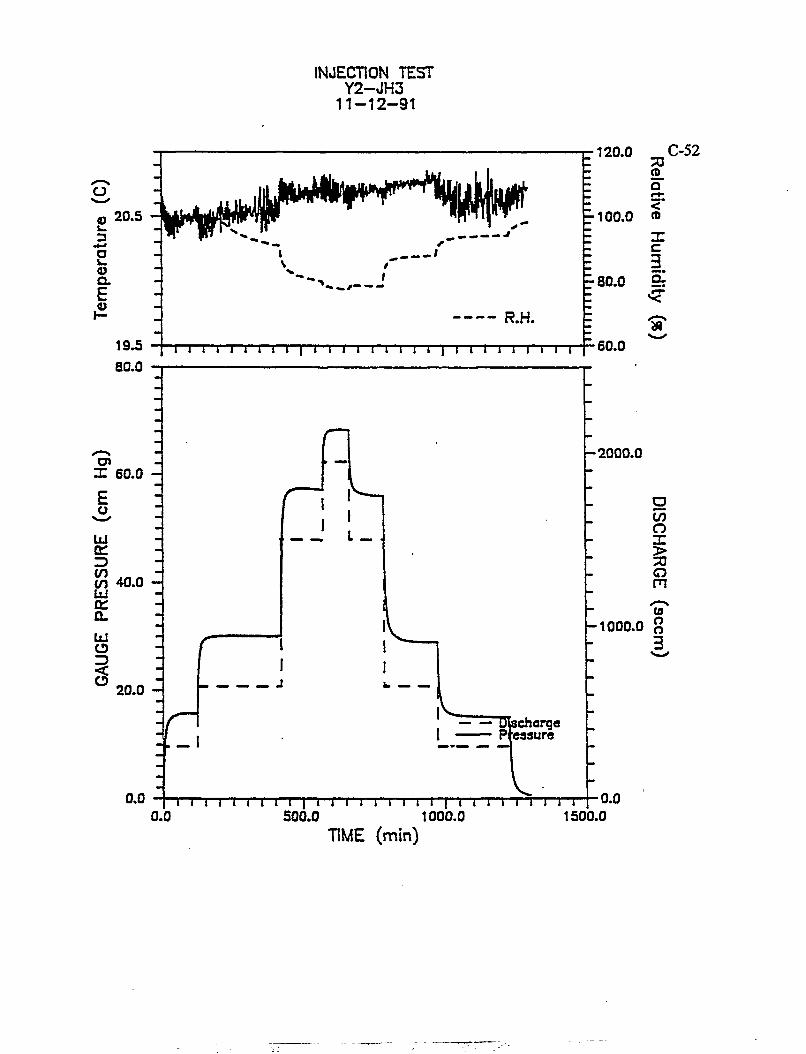
INJECTION TEST Y2-JH3
11-12-91
o 20.5
o Q. E
19.5 80.0
I
' • » ^ ^ — — -
R.H.
i > i i i < i i > i i • i ) i r i ' i i i i i i i i i i i i i
120.0 C-52 ""0 2L a
•100.0 o X C 3.
•80.0 9r.
V -60.0
X 60.0
E o
LLI
a: cn 40.0 UJ 01
a. o S 20.0 -
0.0
V
-2000.0
O w o X > o m en
-1000.0 o 3
"Discharge Pressure
I I 1 I 1 I I l I | l I l I I l I I l | I I I I i i i i i 0.0 500.0 1000.0 1500.0
0.0
TIME (min)
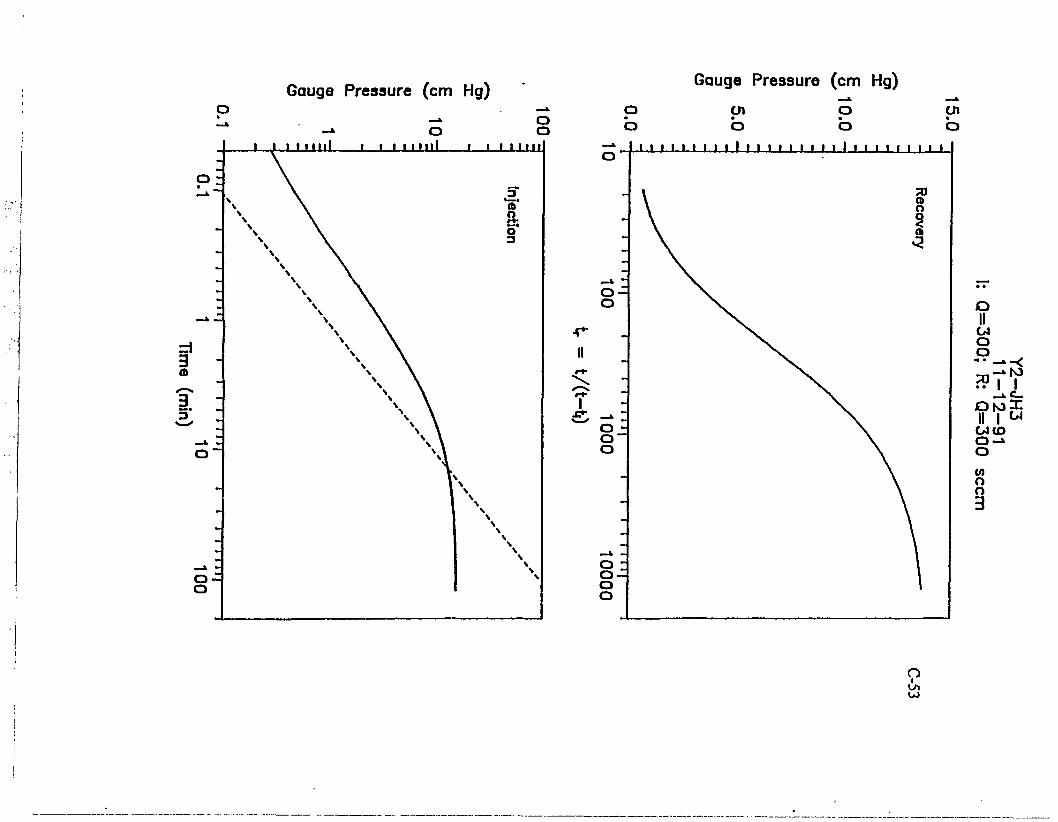
Gauge Pressure (cm Hg) Gauge Pressure (cm Hg) o en
o o o o
II
I
o II LA O O r? | I otopc II I w GJtO O to O o
O i
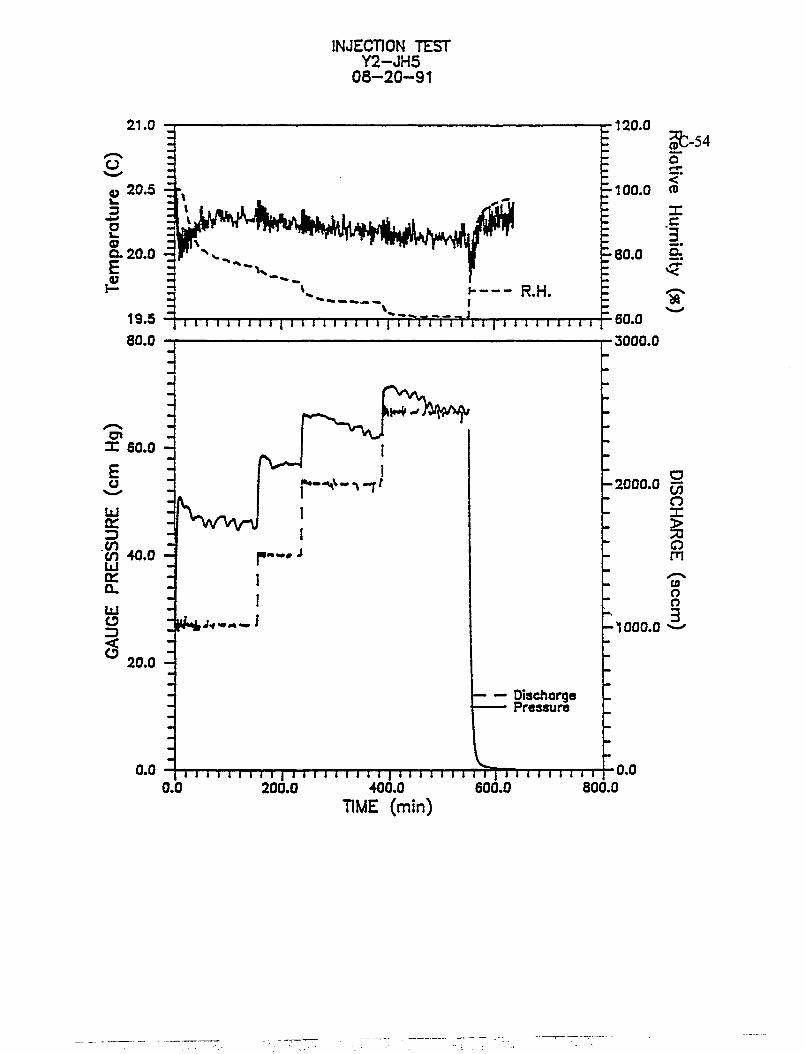
INJECTION TEST Y2-JH5
08-20-91
21.0
O 20.5 - •.
c-120.0
-100.0
[ 2oo P^^ i- R.H.
19.5 80.0
111111111111111111 I i rri*rrn fi 11 i i 111111 i
E80.0 a
jjfc-54 a «- <" (0 X C '3.
X 60.0 H
E o
or en en
a:
o
- ^ V ^ V V r v
{*•—sv~-\-7f
40.0 -
; ^ j y - - - l
20.0
0.0
»«»«•# J
Discharge Presaure
•60.0 -3000.0
•2000.0 § O X > o m u o o 3 1-1000.0
1 1 1 1 1 1 I I I j I I I I I I 1 I 1 I I 1 I 1 1 i i I 1 I I I t i 1 I 1 I i 0.0 200.0 400.0 600.0 800.0
0.0
TIME (min)
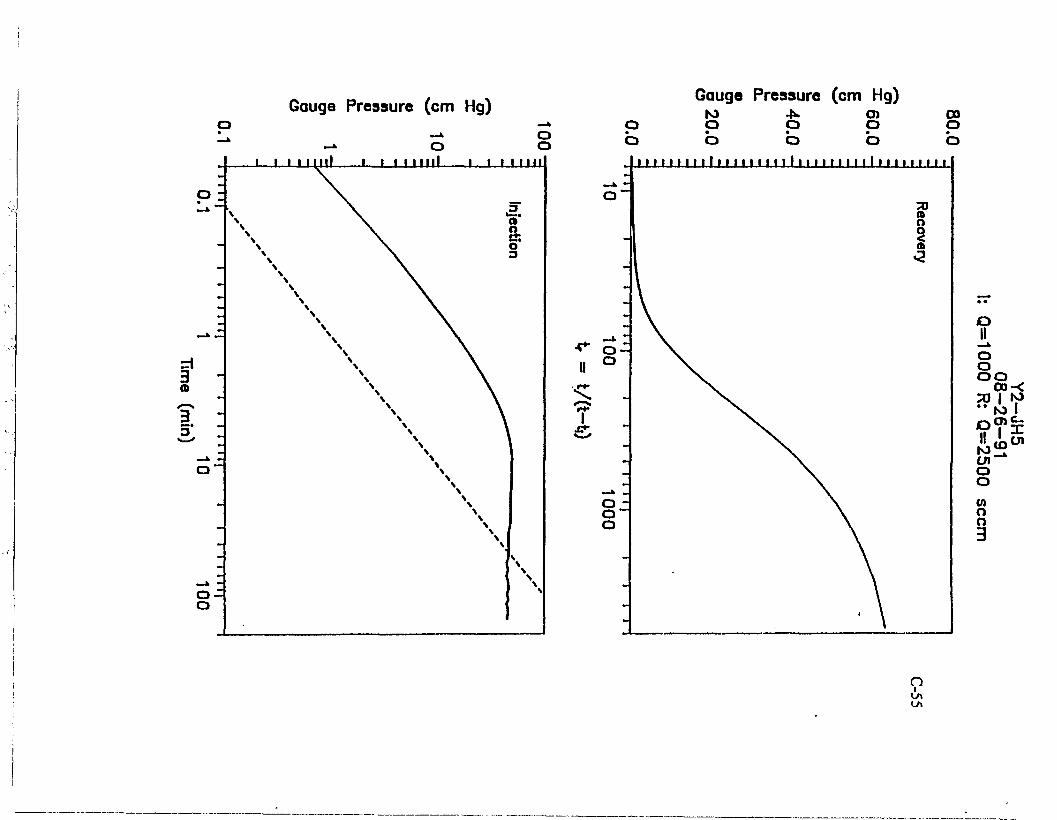
Gauge Pressure (cm Hg) Gauge Pressure (cm Hg)
n i
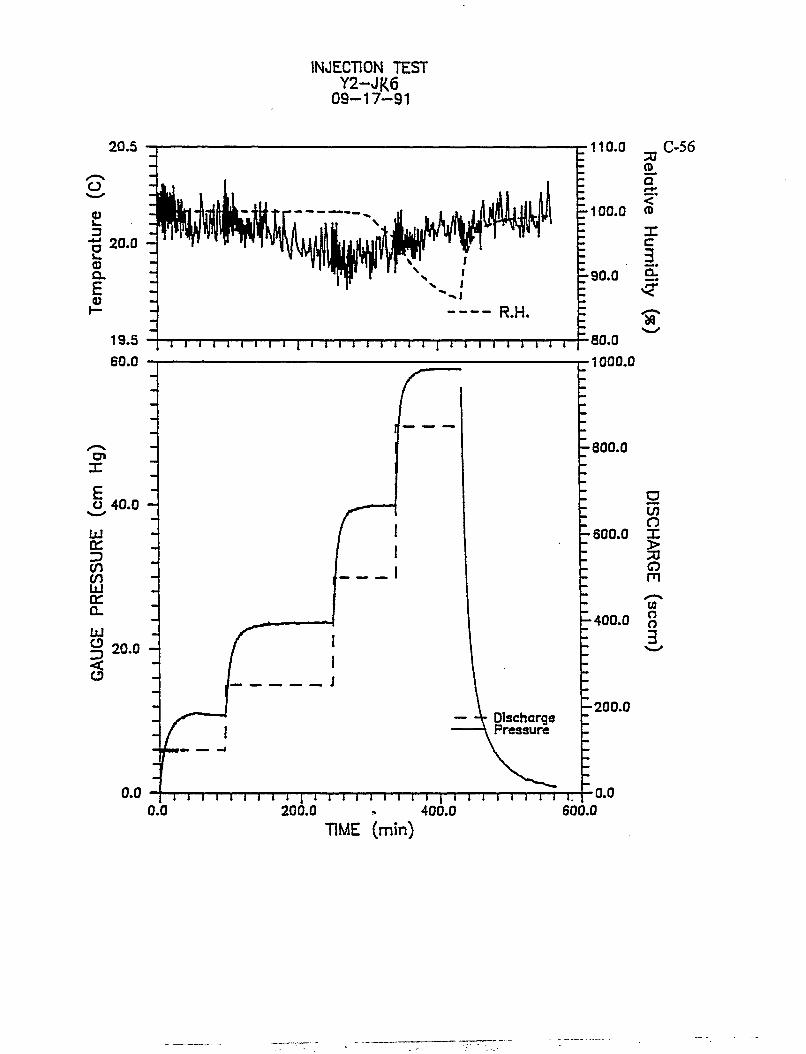
INJECTION TEST Y2-JK6
09-17-91
20.5
O
P
o o a. E
20.0 -
r 100.0
R.H.
19.5 60.0
1 I I I i I 1 1 'I I 1 • 1 I I I 1 1 I | i I I I I I I I I
•110.0 70 SL a 2 * <" CD
X c 3.
F-90.0 9 :
C-56
»
X
u 40.0
UJ a: *D cn en a: CL
o *D <
20.0 -
0.0
-800.0
-80.0 •1000.0
-600.0
-400 .0
Discharge Pressure
0.0
g o X
m (0 o o 3
-200 .0
I I I I I 1 i I I | 1 I I I I I i I I 1 I 1 1 I I I I I I . 200.0 . 400.0 600.0
TIME (min)
0.0
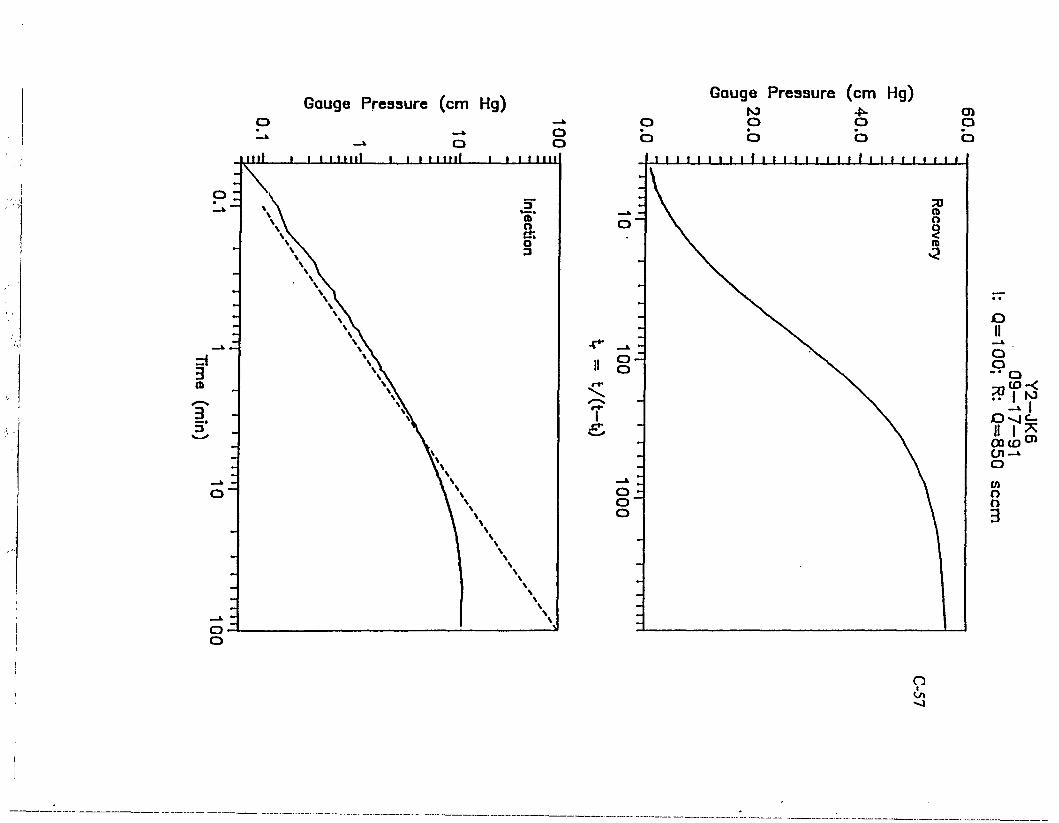
Gauge Pressure (cm Hg) Gauge Pressure (cm Hg)
o o o o
to o o en
a
ml i i i i mil i i i i mil i i t t mi
o
o o -• o r? I S3
- > I
CM C O 0 *
O
(A O O
3
o is*
C-58
Graphs from Table B.6 Y2 -1.0 m Data
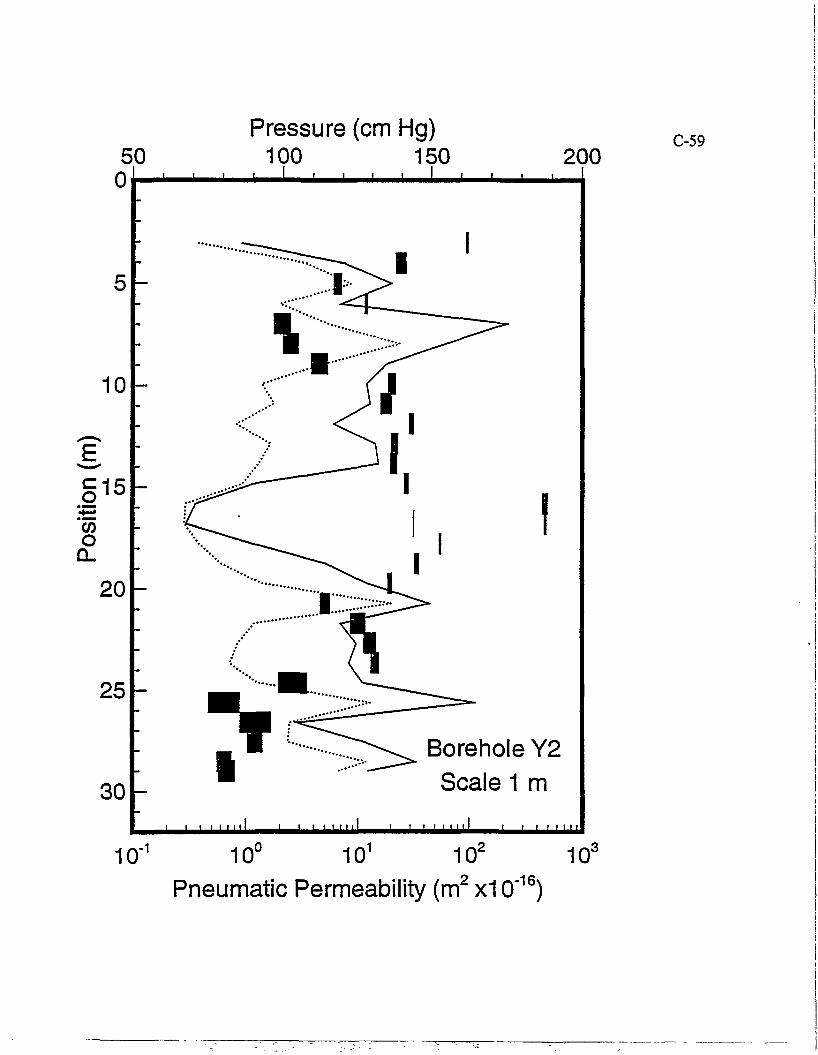
50 Ot
Pressure (cm Hg) 100 150
_ i i i _ •
200
10
15
o
20
25
30
10 -1
Borehole Y2 Scale 1 m
I I I ! I I I I 1 JmUJ, I I t I I I I 1 l 1 I I I I I I
1 0 c 101 1 0 4 10c
16> Pneumatic Permeability (m x10 )
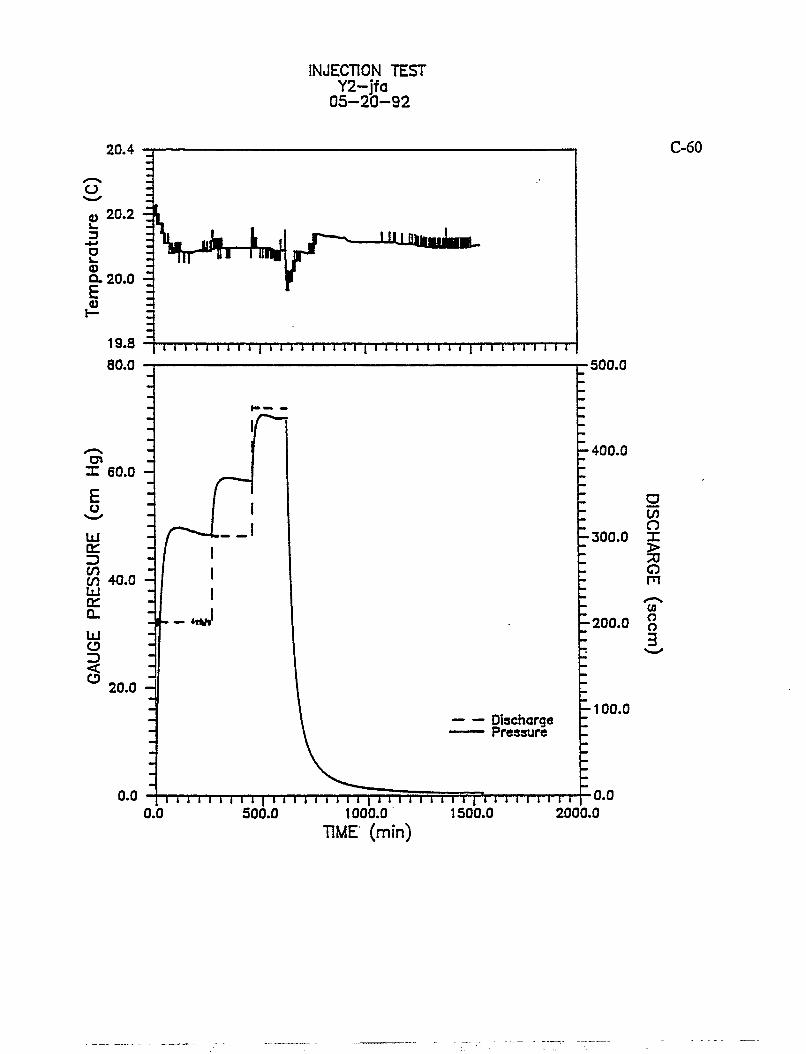
INJECTION TEST Y2-jfa
05-20-92
20.4
o 20.2 a>
i_ 3 a CD
Q.20.0 E o I—
19.8 80.0
j V ^ T - T W r JUJ
1 1 1 1 1 1 1 1 1 1 1 1 1 1 1 1 1 1 1 1 1 1 1 1 1 1 1 1 1 1 1 1 1 1 1 1 1 1 1
C-60
r X 60.0 E o
LU a: Z3 en 40.0 LU at: a. LU
o
-400.0
— *rtf»'
•500.0
a CO o 300.0 X > 70 O m CO
200.0 (J o
20.0 -
Discharge Pressure
-100.0
0.0 M I l I I ) 1 I | 1 I I I I 1 l 1 1 | 1 1 I I I l l i I | I l l I I l l l I 0.0 500.0 1000.0 1500.0 2000.0
0.0
TIME (min)
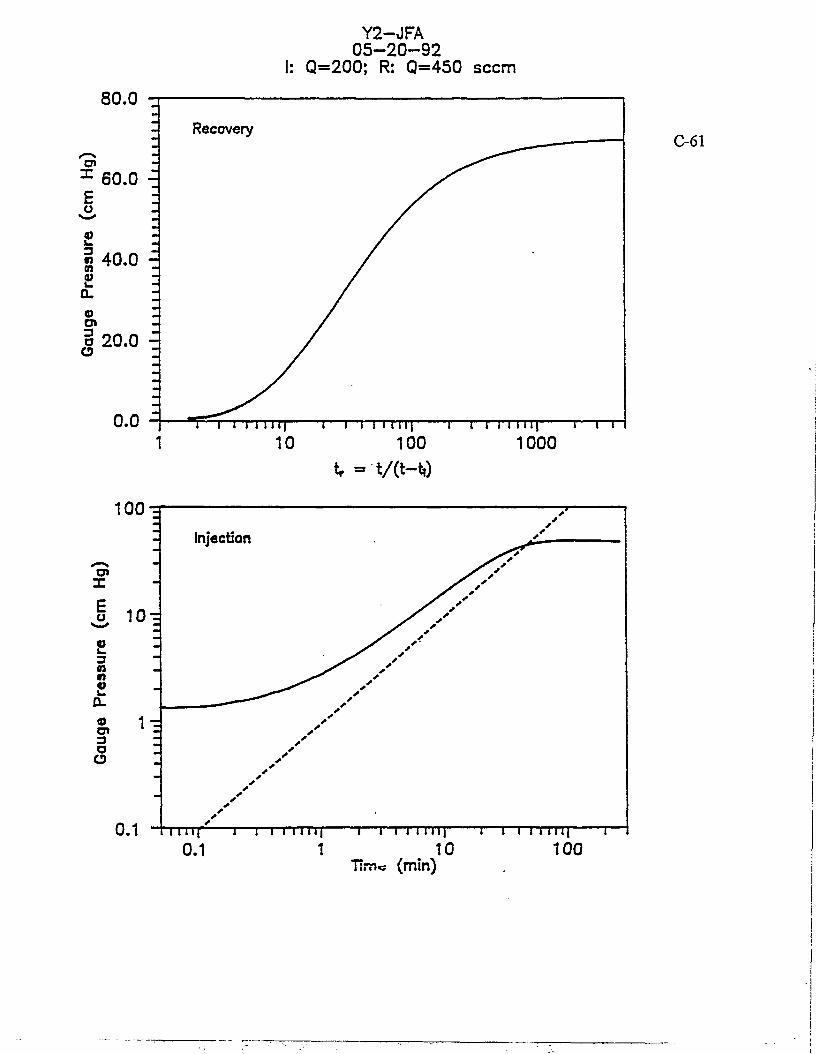
Y2-JFA 0 5 - 2 0 - 9 2
I: Q=200; R: Q=450 seem
ou.u
111111111
Recovery
111111111
Recovery
x 60.0 E o
IS 8 40.0 '
Pre
o
o 20.0 o -
0.0 0.0 ~i i i i n i l ] i i i I i i i i | i i i i 11 H I i i i
C-61
10 100 tr - t/(t-t,)
1000
1111f' i—i i i i n i | 1—i i J i u i | 1—i i i i u i | r 0.1 1 # 10 100
Time (min)
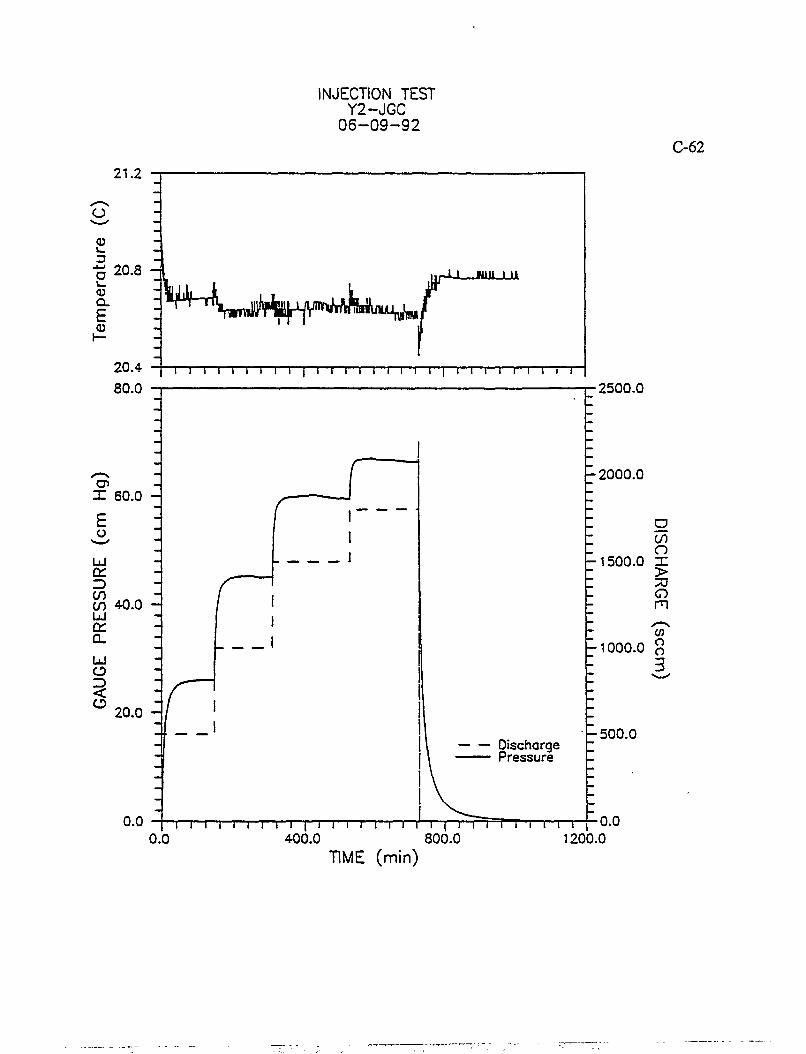
INJECTION TEST Y2-JGC
0 6 - 0 9 - 9 2 C-62
21.2
i i ( i i i i 400.0
T i i i [ r 800.0
i i i i i
1200.0 TIME (min)
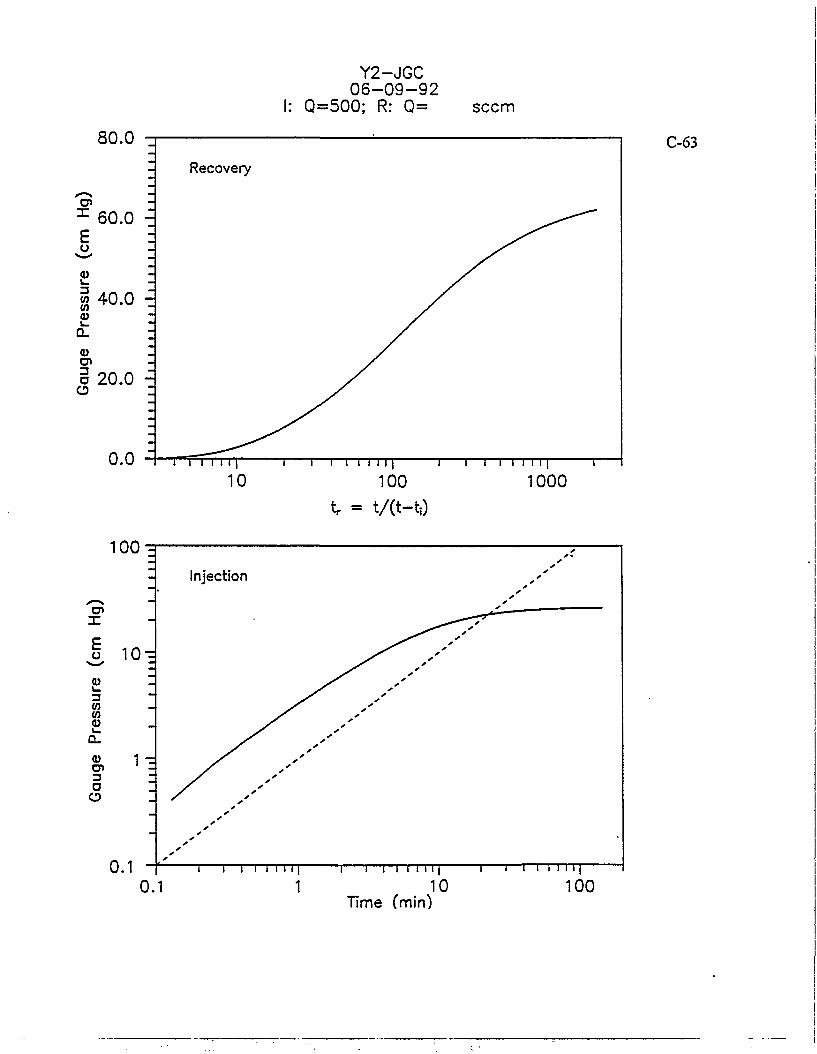
80.0
Y2-JGC 0 6 - 0 9 - 9 2
Q=500; R: Q= seem
C-63
i i i i 111
1000 tr = t/Ct-tO
lOO^r
1 1 — ! I I I I l | 1 1 — I ' l i 1 I I
10 100 Time (min)
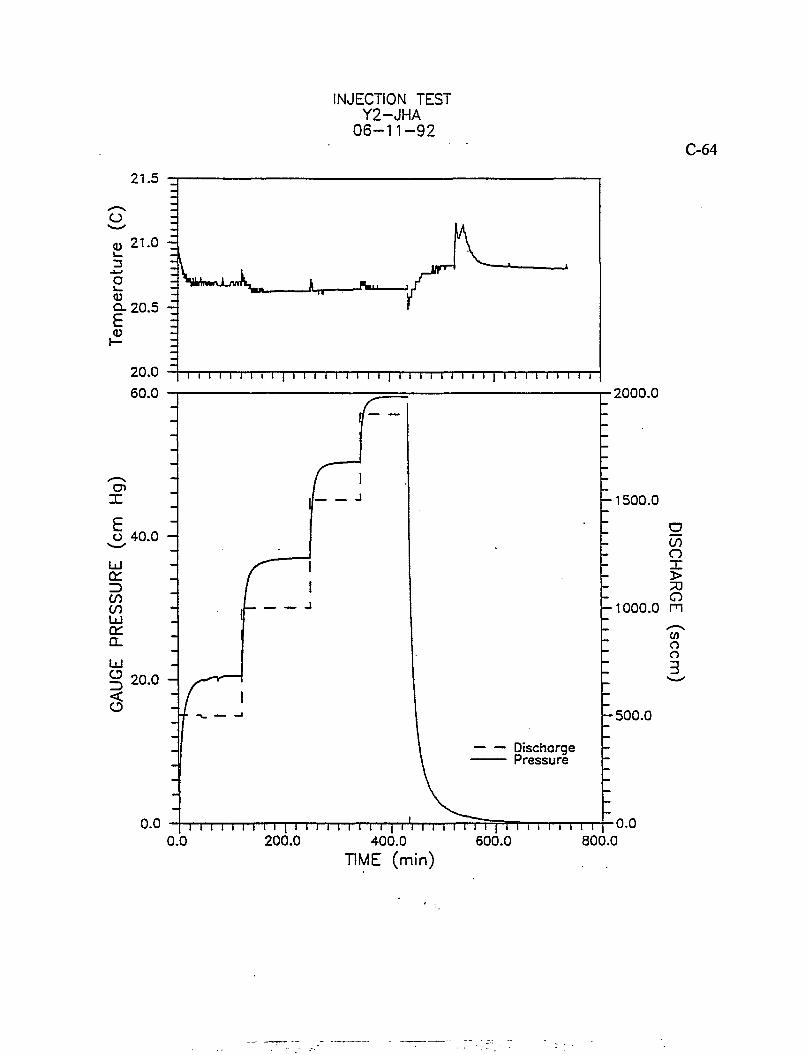
INJECTION TEST Y2-JHA
0 6 - 1 1 - 9 2 C-64
21.5
O <U 21.0 -3
o
Q-20.5 -3 E
20.0 60.0
^V fcUrxJuJ^ ^ \f
I I l l l I l | l l l l l l l l l | l i I I I l l l l | I l i l I l l l l
X
^ 4 0 . 0
Ld
co in UJ rr CL
o Z> <
20.0 -
0.0
Discharge Pressure
•2000.0
-1500.0
g CO O X > O
1000.0 m 03 o o 3
-500.0
I I I I I I I i i | i i i I I I l I I | i I I i i 0.0 200.0 400.0
I l | I I i i l I I l •0.0 600.0 800.0
TIME (min)
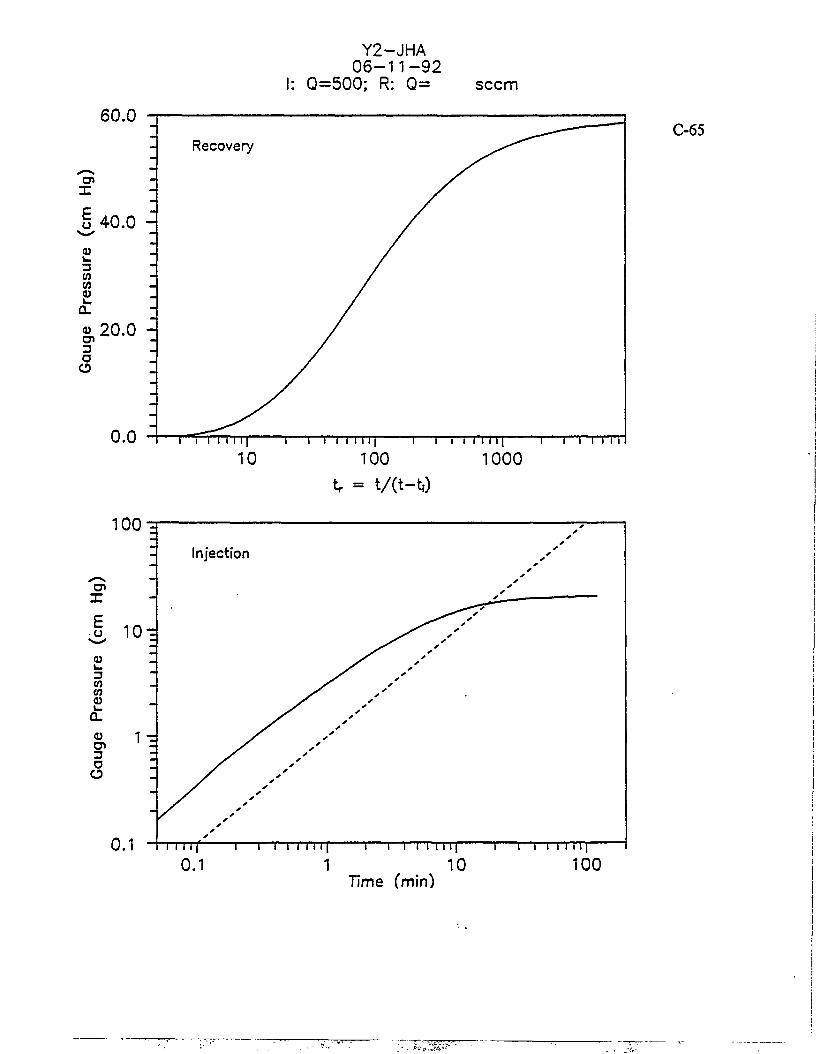
60.0
I 40.0 u 3 (/> (0 <u
£ 20.0 O o
0.0
Y2-JHA 0 6 - 1 1 - 9 2
I: Q=500; R: Q= seem
Recovery
i i i i i 1 1 1 1 i i i i I 1 1 1 1 i i i i i 1 1
C-65
100 tr = t /( t- tO
1000
1 0 0 ^
TTTT 1 1—I I I I I l | 1 1—I M l l l | I 1—I I I I i l |
0.1 1 10 100 Time (min)
•. >-i-?j.w^
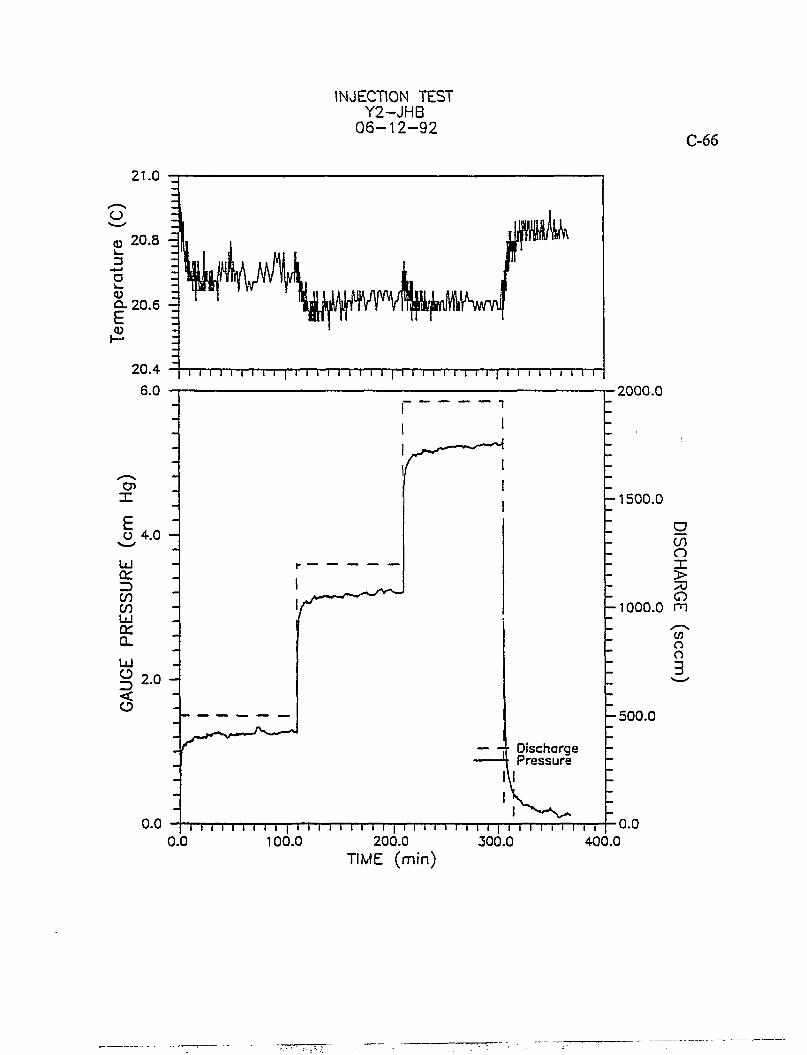
INJECTION TEST Y2-JHB
0 6 - 1 2 - 9 2 C-66
21.0
20.4 6.0
i i i i i l l i I | i l i i i i i i l | I I I i I I i i i J' l
Oi
O 4.0
UJ rr co co id rr Q-
UJ
o <
2.0 -
0.0
Discharge Pressure
'l l l M l I I I 0.0 100.0
I 1 I I I I I i 'I I I I I I I I I I I I I I
•2000.0
-1500 .0
g CO
o > 70 o
•1000.0 m o o 3
- 5 0 0 . 0
•0.0 200.0
TIME (min) 300.0 400.0
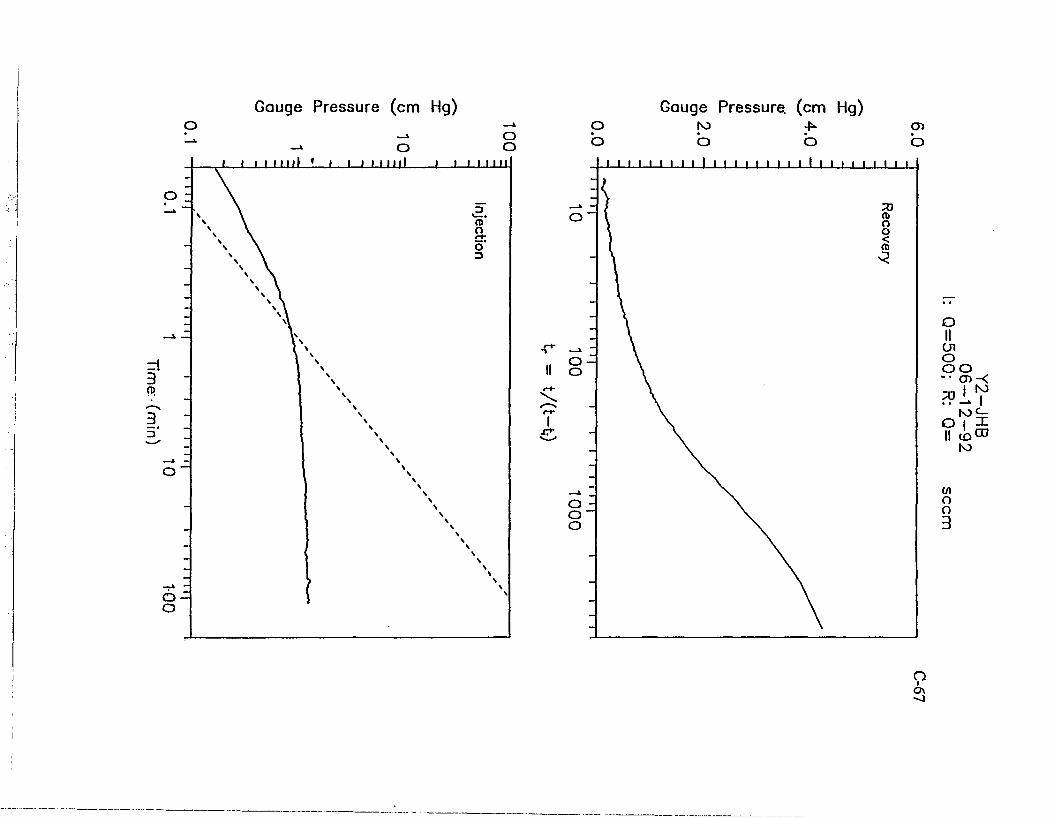
Gauge Pressure (cm Hg) Gauge Pressure, (cm Hg) O N) -£• a> • • • • o o o o
o II en o o o -• a»-< SiV o f * II l D r o
Ni
o o 3
o I
- 4
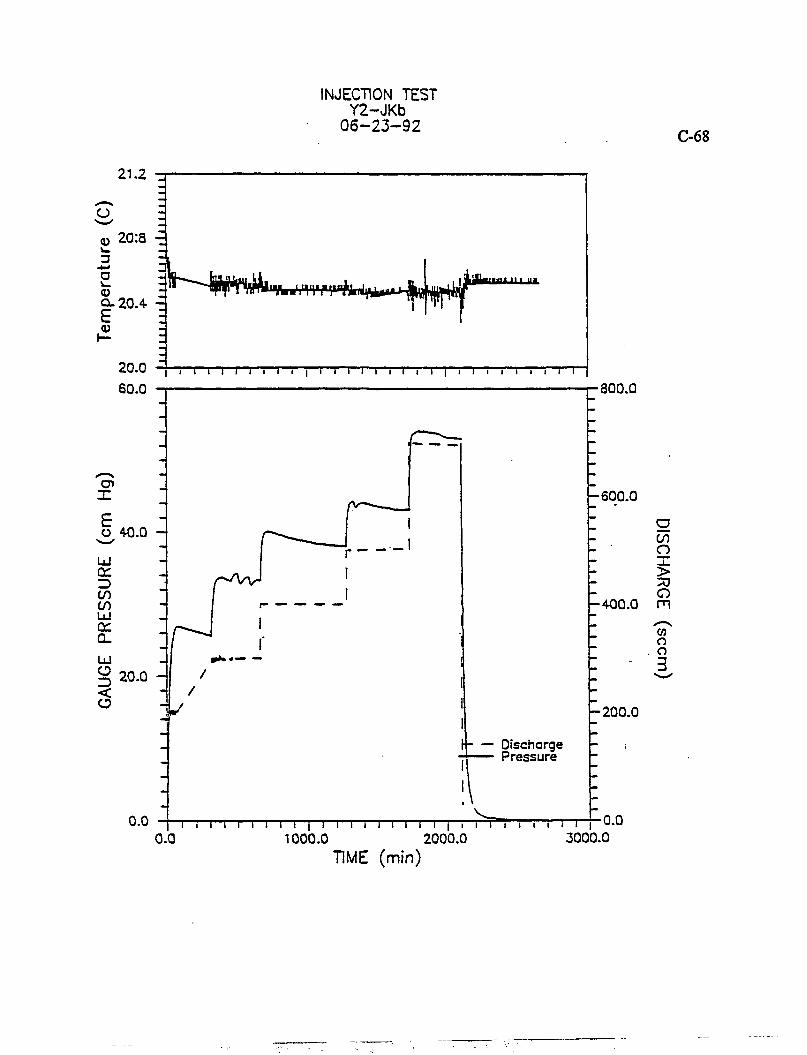
INJECTION TEST Y2-JKb
06-23-92
21.2
<u 20:8
•JmJ
a i_ <u O-20.4 <u
20.0 60.0
j ^ H s f t * ^
i i i i i i i i i i i i i i i i i i i i i i i i i i i i
X
O 40.0
-600 .0
\\ Discharge — Pressure
! \
•800.0
-400.0
-200.0
0.0 T -i n n i i i | i n i i n i i j r~ 0.0 1000.0 2000.0
I i i i I i r 3000.0
0.0
TIME (min)
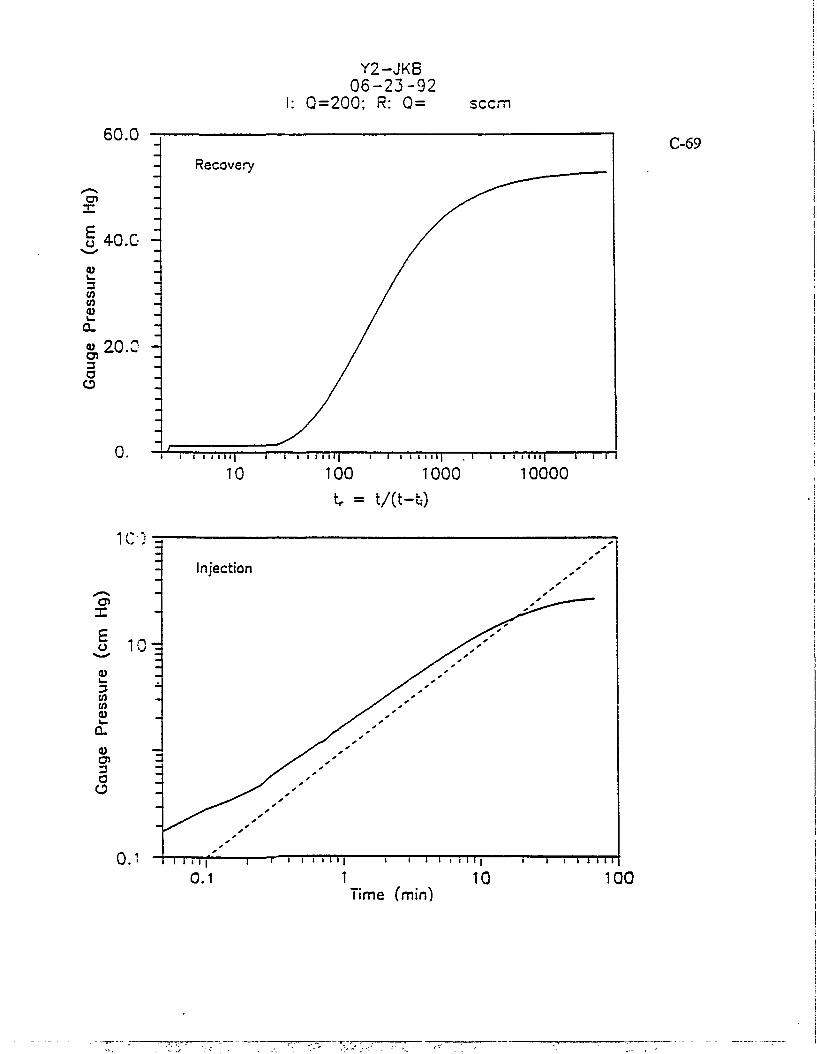
60.0
en
X
J , 40.G L. 3 CO CO <u A 20. CD D O o
Y2-JKB 0 6 - 2 3 - 9 2
G=200; R: Q= sccr
0.
C-69
i u j i i i 1 1 1 i i | i i i i 11 i i
10 100 1000 tr = t/(t-t;)
I I i i l l l | i T T
10000
en X
J, 10 CD k -
CO CO CD
en 3 O o
O.i
Injection
i i • | r
0.1 T I i i i I I | 1 I i i i I 1
1 _ 1 0
nme (min)
— i I 1 I 11 100
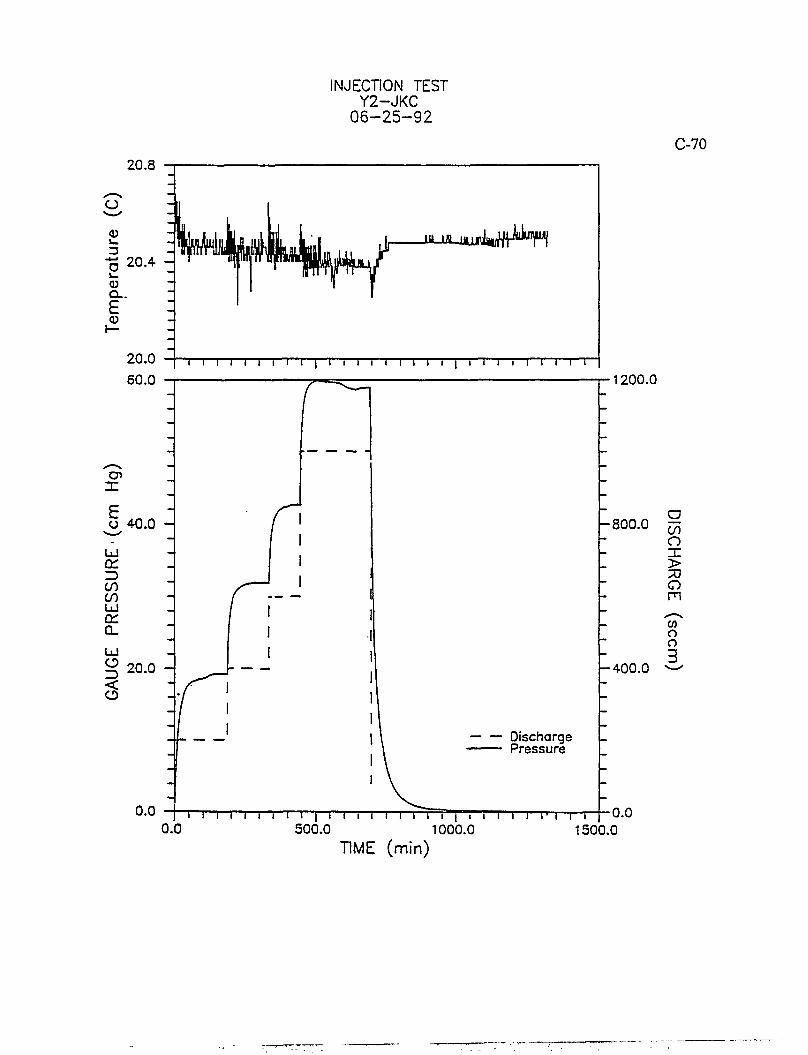
INJECTION TEST Y2-JKC
06-25-92
20.8
O
Q.. £
JU IfJjJUf. Jmrf^Tl
20.0 60.0
1 i 1 1 1 1 r 1 1 1 1 1 1 1 1 r 1 1 1 i i 1 i r
CP
y 40.0
UJ C£L ID CO CO UJ rr o_ LU
o <
20.0 -
1200.0
-800 .0
0.0 T 1 i i i n 1 1 | 1 1 1—r 0.0 500.0
- 4 0 0 . 0
Discharge Pressure
1 1 1 1 j 1
1000.0 TIME (min)
i i i" i ' i r •0.0 1500.0
g CO
o > 7D O m C/J o o 3
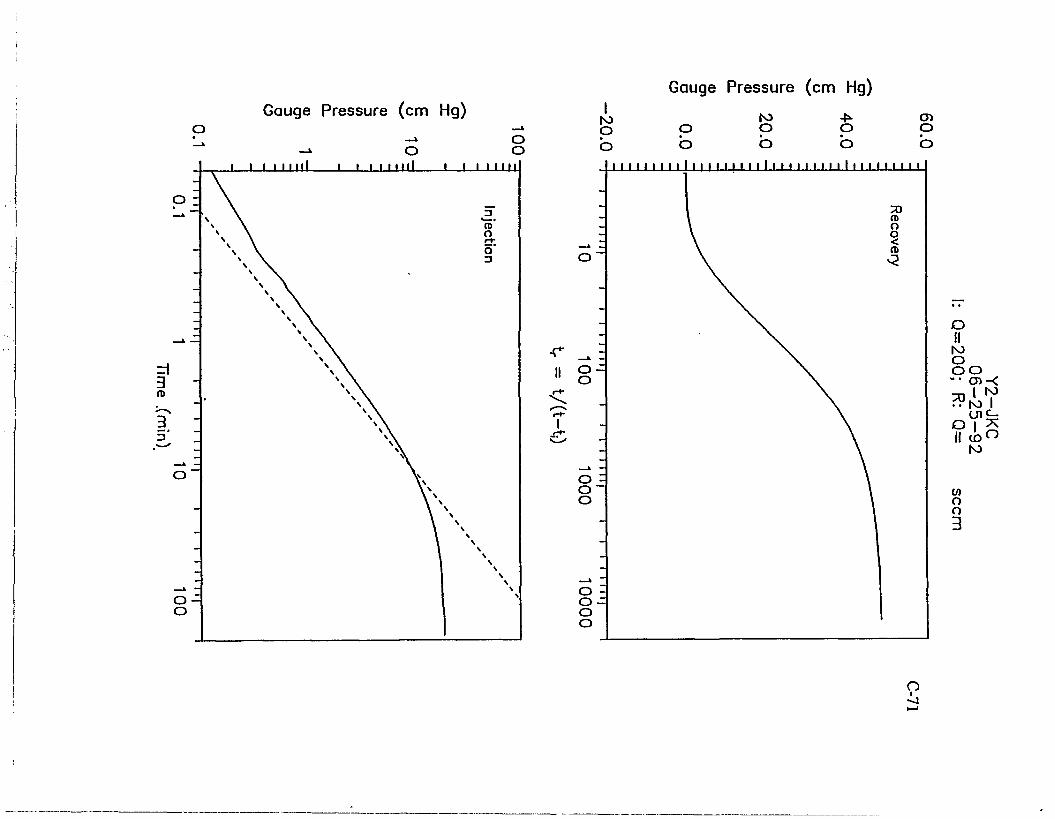
Gauge Pressure (cm Hg) Gauge Pressure (cm Hg)
KJ Ni > CD o o o o p b b b b b 1 1 1 11 1 1 1 1 1 1 I I 11 1 1 H I 11 11 111 1111 1 1 1
o ~
Recovery
• r -
ii o -o <
i i
000
L i
in 1
1 i
i i
! 1
1 1 1 1Ij
10000
o II N> O O O
- K ) I
° I £ II ( D n
to
W o o 3
C-72
Graphs from Table B.7 Y2 - 2.0 m Data
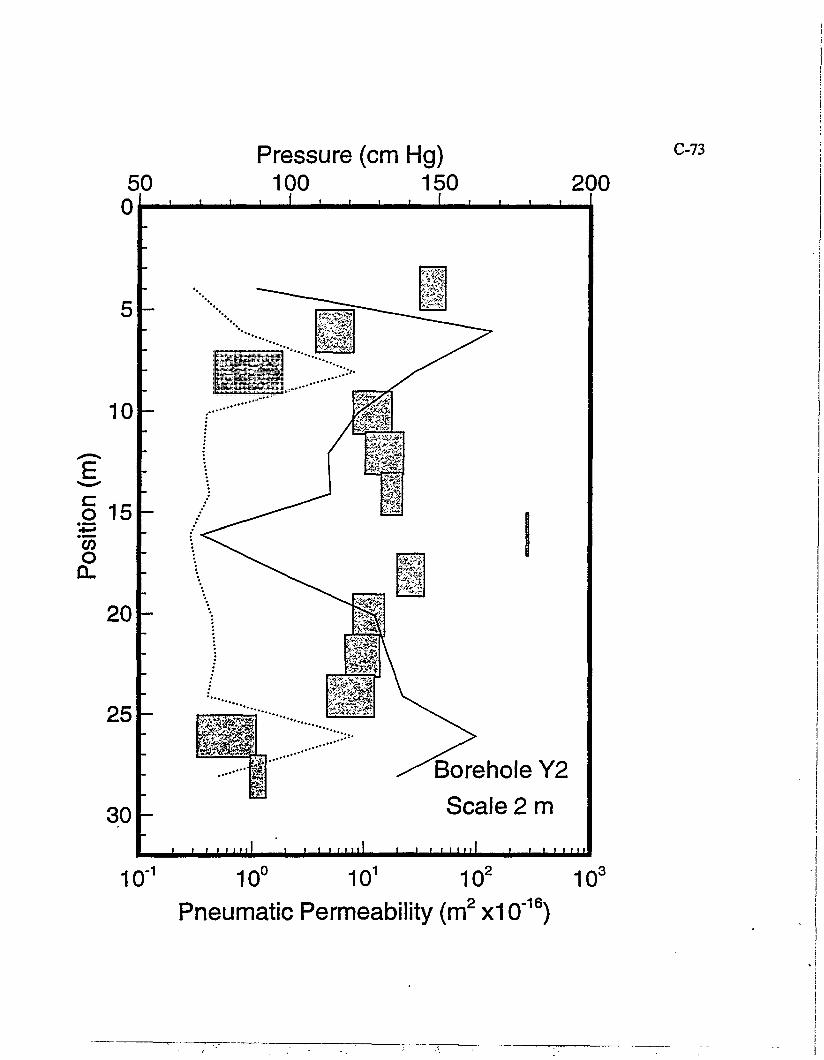
50 0
10
o 15 03 O
CL
20
25
30
Pressure (cm Hg) 100 150
C-73
200
Borehole Y2 Scale 2 m
i i i i m i l i i i 1 1 1 1 1 1 Ml i i i i i 111
10"1 10° 101 102 103
Pneumatic Permeability (m 2 x10"16)
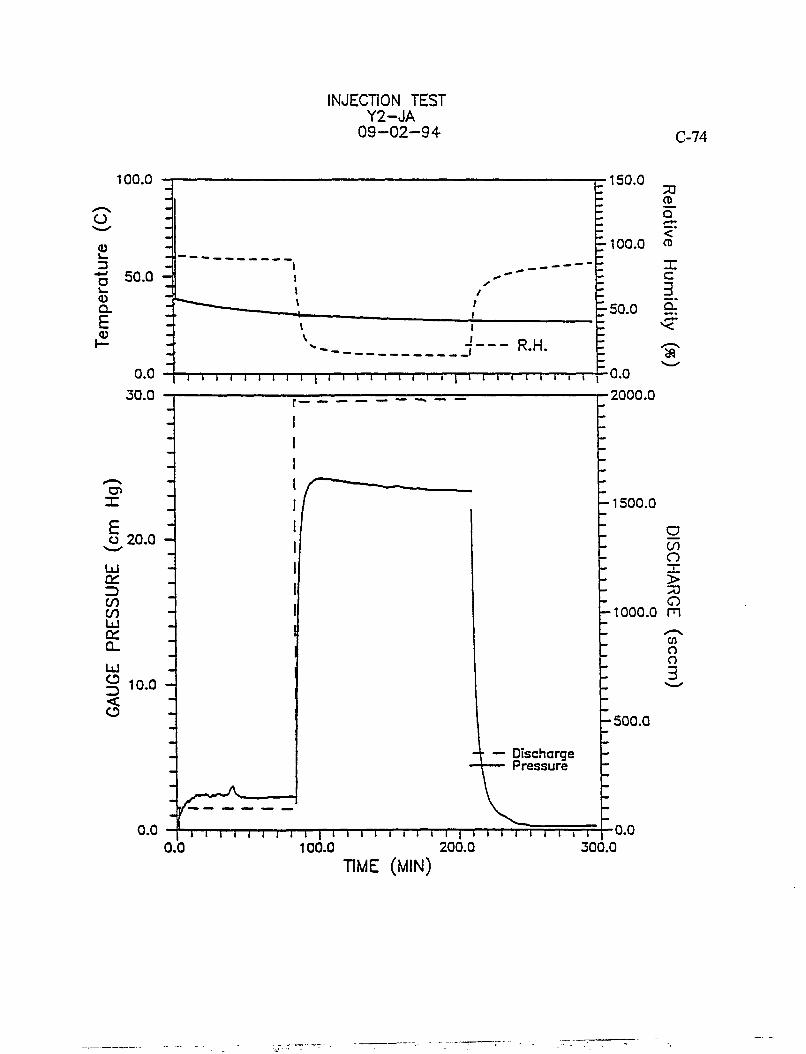
INJECTION TEST Y2-JA
09-02-94 C-74
100.0 150.0
0.0 100.0 200.Q TIME (MIN)
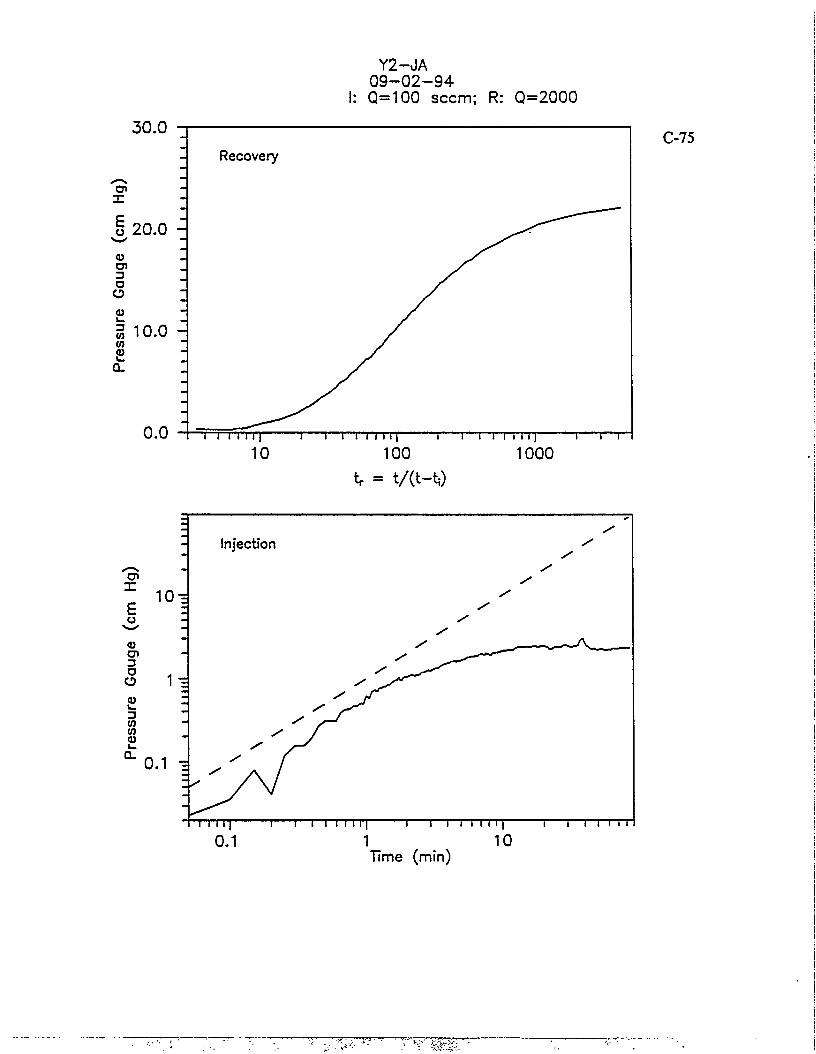
Y2-JA 0 9 - 0 2 - 9 4 Q=100 seem; R: Q=2000
30.0
X
I 20.0
3 O
o co
Recovery
g 10.0 -W CD
U.U I i I I I 111 l i i I I I N | I i i i I I I 11 I l l
C-75
10 100 tr = t / ( t - t ; )
1000
TTTT r 0.1
i i i i i i | 1 — i — i i i i 1 1 | 1 — i — i i i 1 1
1 10 Time (min)
- y - .••"•'••s i Twmr^
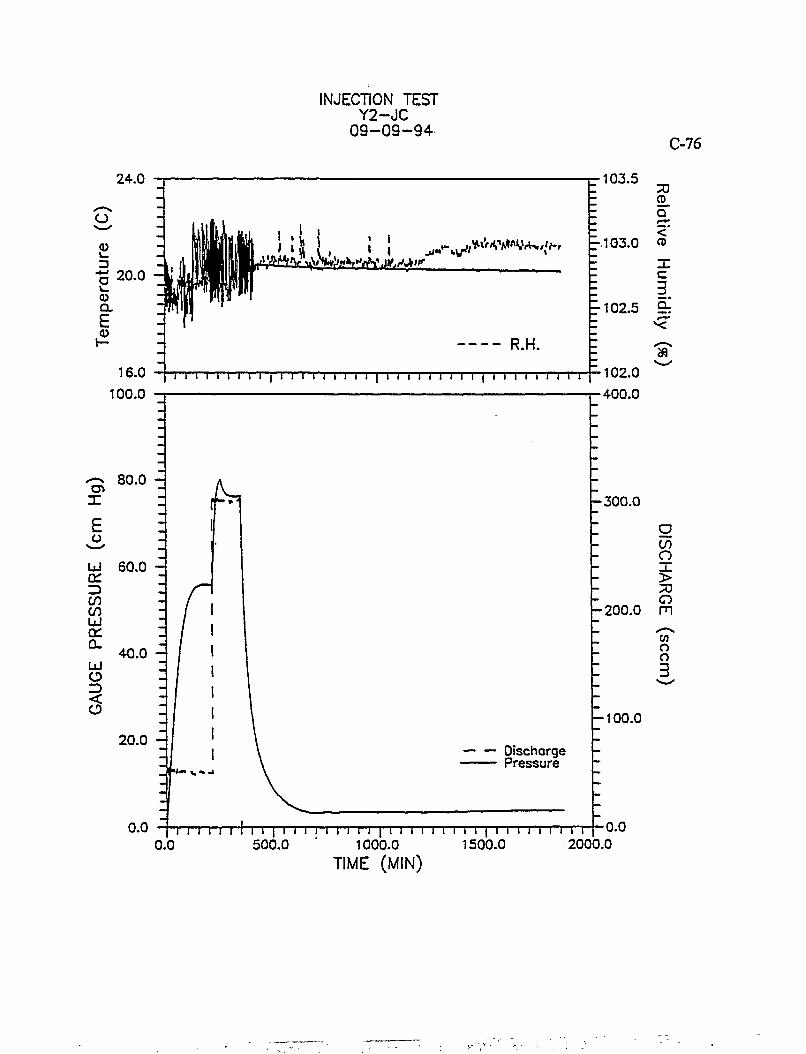
INJECTION TEST Y2-JC
09-09-94 C-76
24.0
20.0
Q.
£
16.0 100.0
TT
R.H. i i i i i | i i " i i ' i i " i i i | i i i i i i i i i | i i i i i i i i i
•103.5 CD
•103.0 » X c 3.
r 102.5 Si
»
X
£ o u or CO en u cc a. Ld o <
80.0 -
60.0 -
40.0 -
20.0 -
-300 .0
_PM-. v < . J
Discharge Pressure
•102.0 •400.0
-200 .0
O CO O -L. > o m en o o 3
-100 .0
o.o I i i i i i i I i i | i i ) i i i i i i [ i i i i i i i i i | i i i i i i i i i | o.o 0.0 500.0 1000.0 1500.0 2000.0
TIME (MIN)
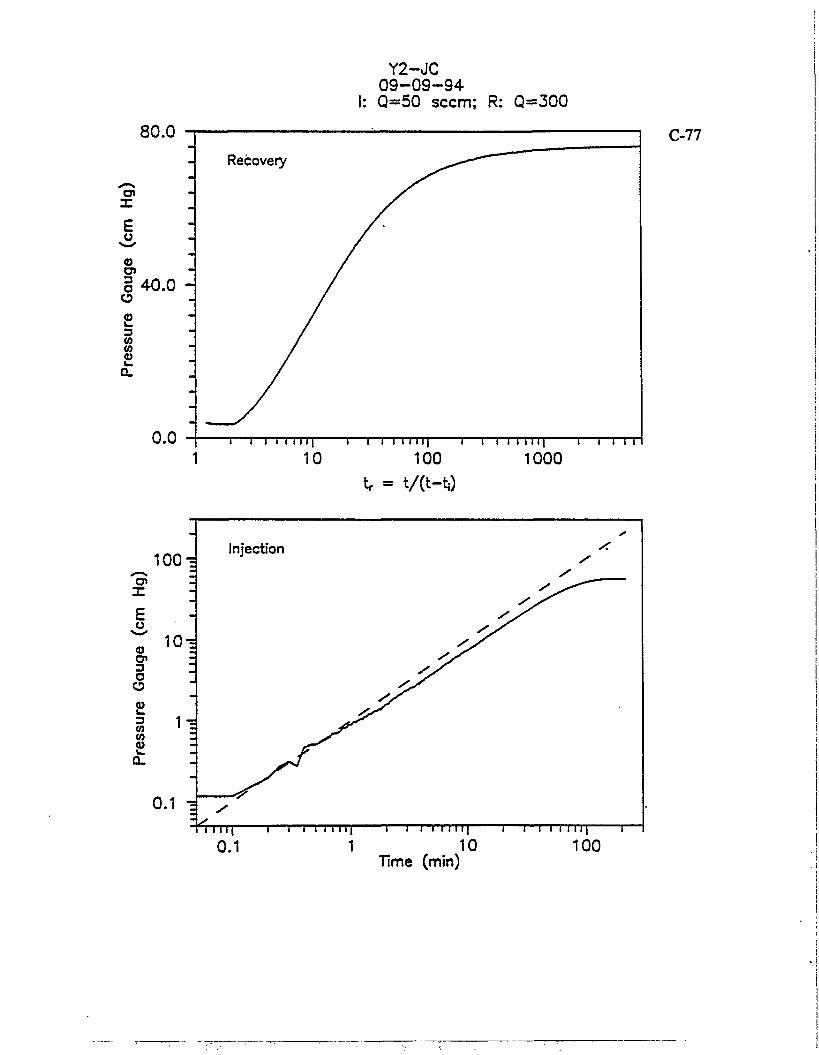
80.0
C« X E o
g 40.0 o
3 CO CO
o
0.0
Y2-JC 0 9 - 0 9 - 9 4 Q=50 seem; R: Q=300
Recovery
i i i i 1 1 1 1 | i i i i 1 1 1 1 1 i i i i i
C-77
100 tr = t/(t-tO
1000
TTTT 1 1 1 I I I l l | 1 1 I I I I l l | 1 1—I I l I l l j r
0.1 1 10 100 Time (min)
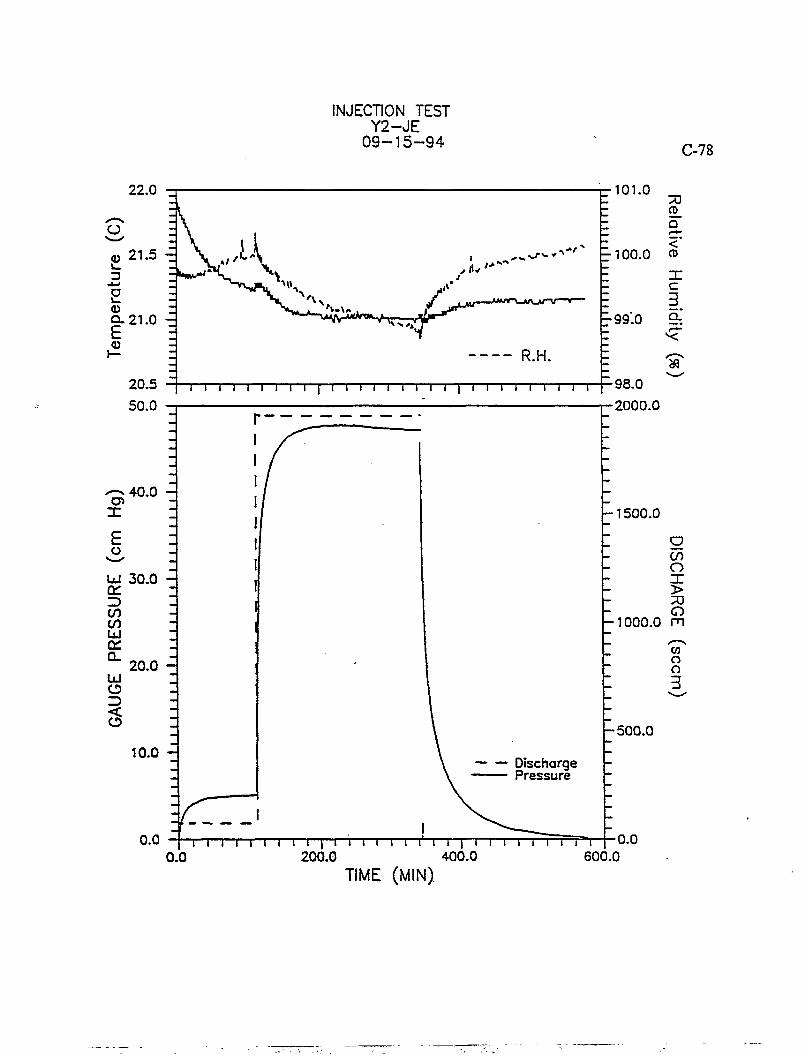
INJECTION TEST Y2-JE
09-15-94 C-78
22.0
^ - ^ ' E
R.H. 2 0 - 5 —j i i i i | i i i | | | i i i i i i i—|—| i i—i—|—|—|—|—j—[ 9 8 . 0
•101.0
Q
•100.0 <D X c
I. •99.0 9J
'ST
50.0
^ 4 0 . 0 H X
E o
Ld 30.0 or (/) (/) rr °" 20.0 o < o
io.o H Discharge Pressure
•2000.0
h 1500.0 O (/) o X > O
1000.0 m o o 3
h 500.0
o . o | i i i i i i i i i i i i i i i i r i i i i i i i i~i i i -i [ o . o 0.0 200.0 400.0 600.0
TIME (MIN).
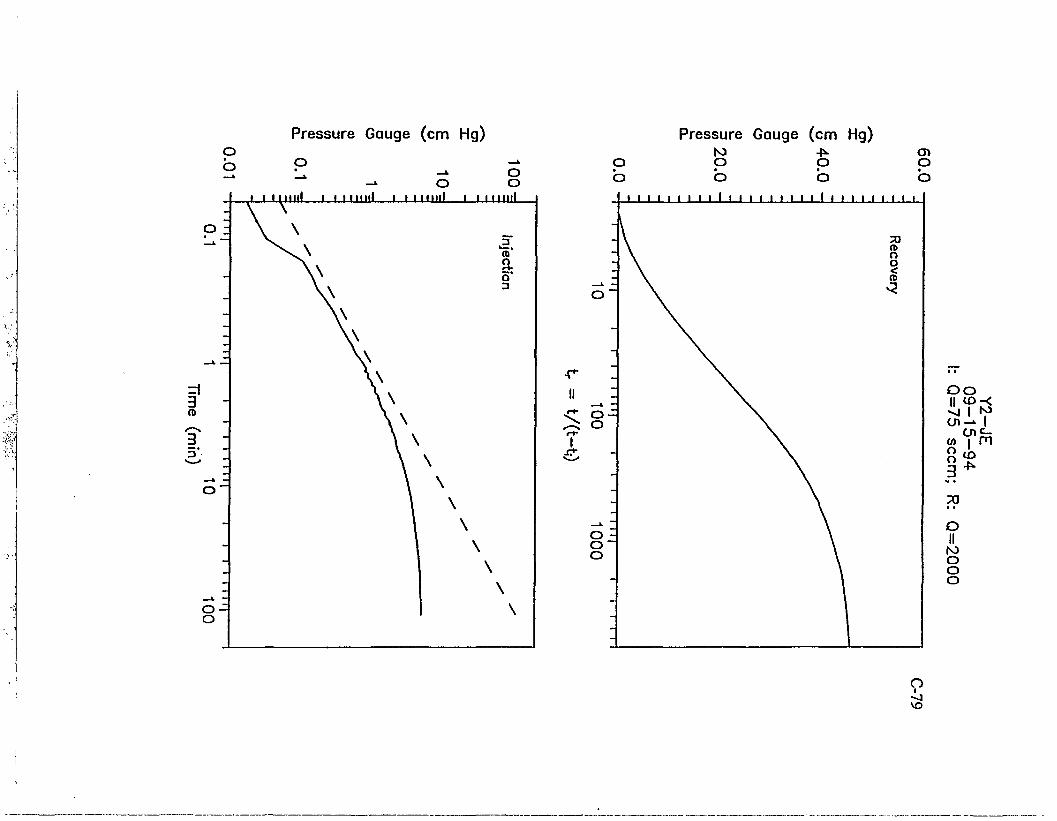
Pressure Gauge (cm Hg)
-* o o o
.1 i i MHII ' ' " " • | | ' ' " " " i ' ' " " " '
Pressure Gauge (cm Hg)
• r II
I
• t
O O II co -< •vJ I N> cn-» I w I m 3*
• • o II N3 O O O
O i
vo
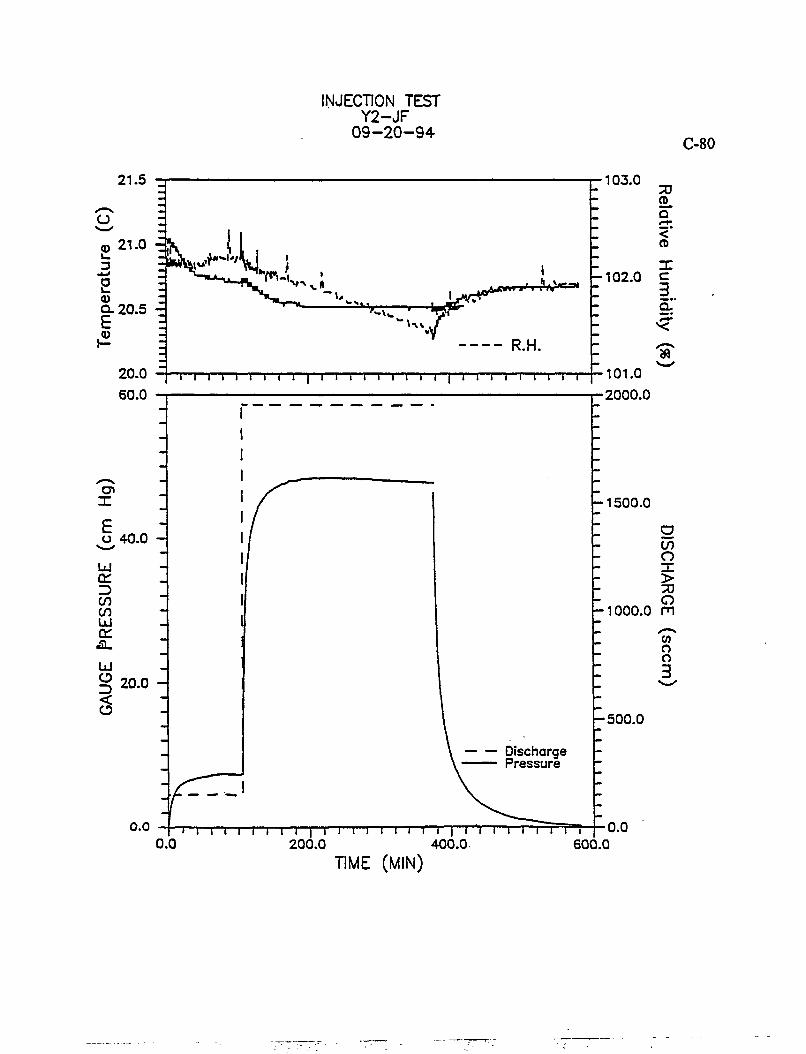
INJECTION TEST Y2-JF
0 9 - 2 0 - 9 4 C-80
21.5
01 X
o 40.0
LU C£L 3 CO CO UJ C£ £L
UJ § 20.0 <
v r r , frff*-*
•103.0 70 2L Q <* » X
102.0 c
ol'
' »
Discharge Pressure
0.0
•101.0 •2000.0
•1500.0
CO O X > O
•1000.0 m
CO o o 3
- 5 0 0 . 0
0.0 1 1 1 i 1 l I 1 l l l I l l l 1 ) 1' ) 1 1 1 1 1 1 1 1 1 1 I 0 . 0
200.0 400.0 600.0 TIME (MIN)

Pressure Gauge (cm Hg) Pressure Gauge (cm Hg)
3 a> /—\ 3. 3*
'-* _» o O o 1 I I I 111 I 1 • > ml \ i i m i l l i 1 1 1 l l l l l
-o z > \ "—*
njecti
o ^ 3
V — V z \
_* —
\ \ \
\ \ \ \
o ~ \ \
- \ \
_ \ - \
_ k - \ o -o
o o L I ro OlM I O O S -
I ^
3 • •
b II O O O
• 00
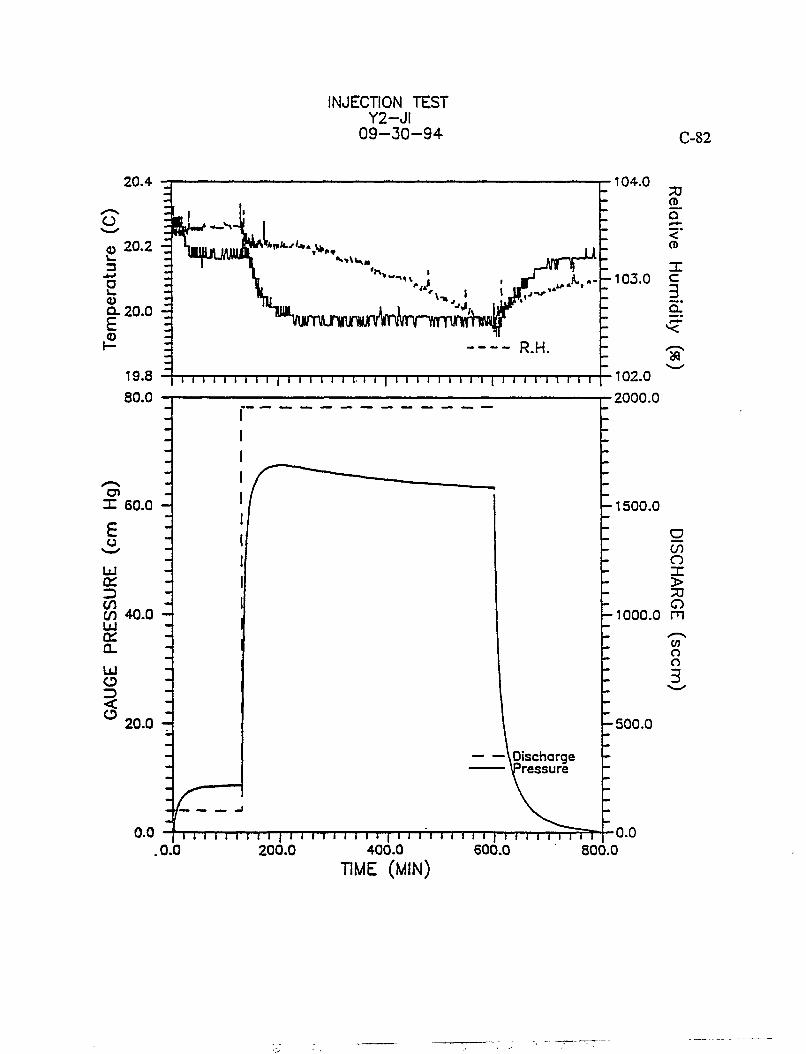
INJECTION TEST Y2-JI
09-30-94 C-82
20.4
R.H. 19.8 80.0
i i i i i i i i i | i i i i i i i- i i | i i i i i i i i i | i i i i i i i i i
104.0
<fi
X 60.0
E o
LU £T
GO 40.0 LU CC Q.
LU O Z> <
20.0 -
^Discharge Pressure
0.0 .0.0
i i i i i i i i i i i i i ) i i i i i | i i i i i i i i i | n i i i r p T r l ^ O - O
•102.0 •2000.0
-1500 .0
g CO o X > o
•1000.0 m
CO o o 3
- 5 0 0 . 0
200.0 400.0 TIME (MIN)
600.0 800.0
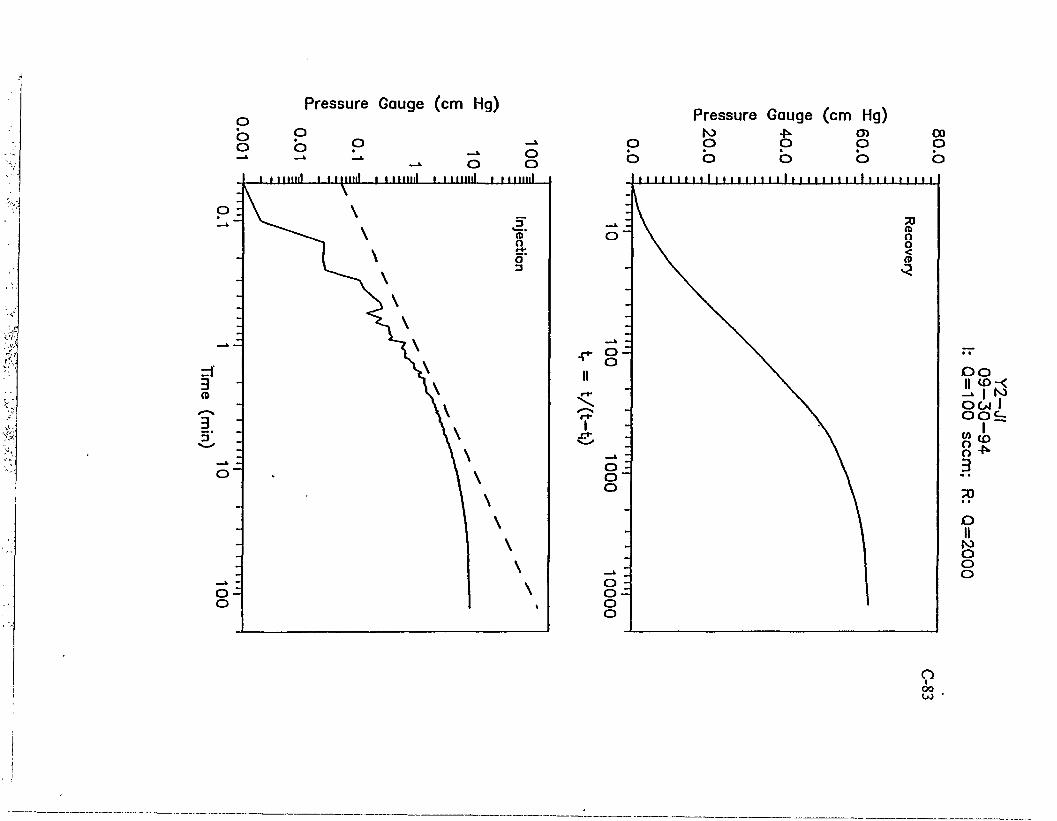
Pressure Gauge (cm Hg)
2 2 " - 5 -» o o
I 11 mill I I I mill I Mtlllll i i limit i niiml
Pressure Gauge (cm Hg) ro -t». ai co
o o o o o • • • • «
o o o o o I t 1 1 1 1 1 1 1 I I 1 1 1 1 1 1 1 1 I I 1 1 1 1 1 1 1 1 1 1 1 1 1 1 1 1
O O II co-< _» i ho 0 0 4 I 0 0 £ =
3 70 • • o II to o o o
o I oo
u> •

C-84
Graphs from Table B.8 Y2 - 3.0 m Data
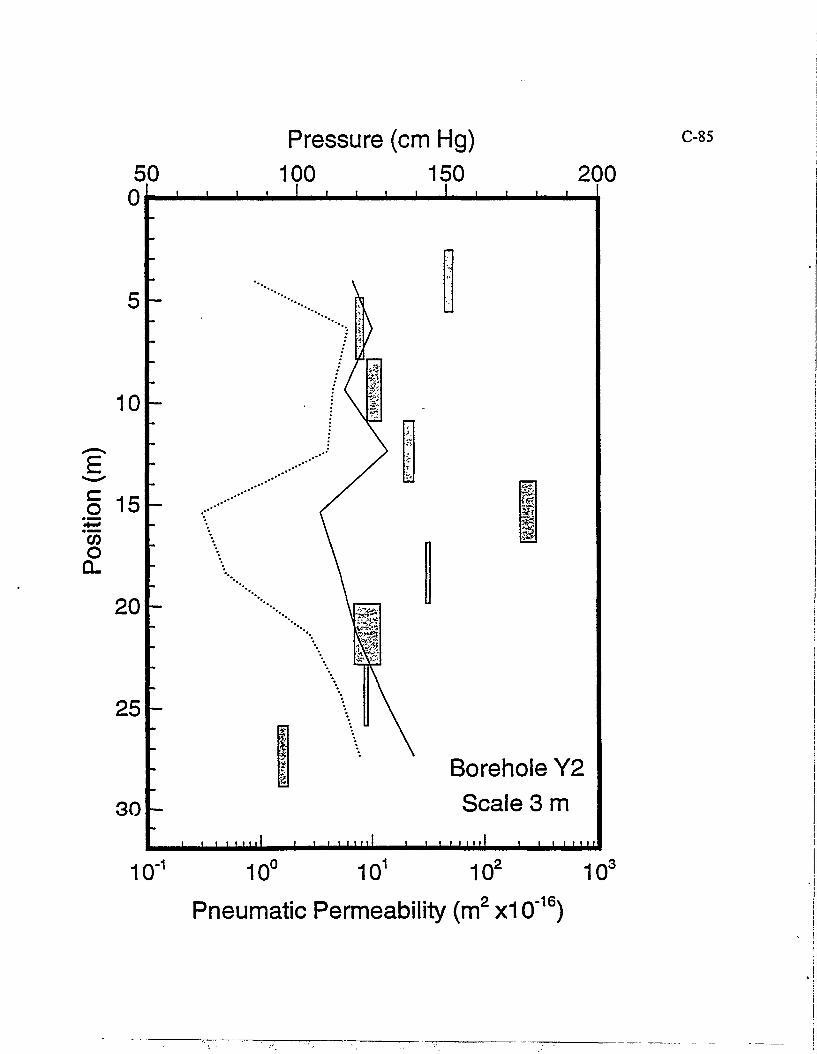
50 Pressure (cm Hg)
100 150 _i i i i_
200
fe Sir?
Borehole Y2 Scale 3 m
' • i 1 1 1 1 1 1 1 i i 1 1 1 1 1 1 1 i i 1 1 1 1 1 1 uu 10"1 10° 101 102 103
Pneumatic Permeability (m 2 x10"16)
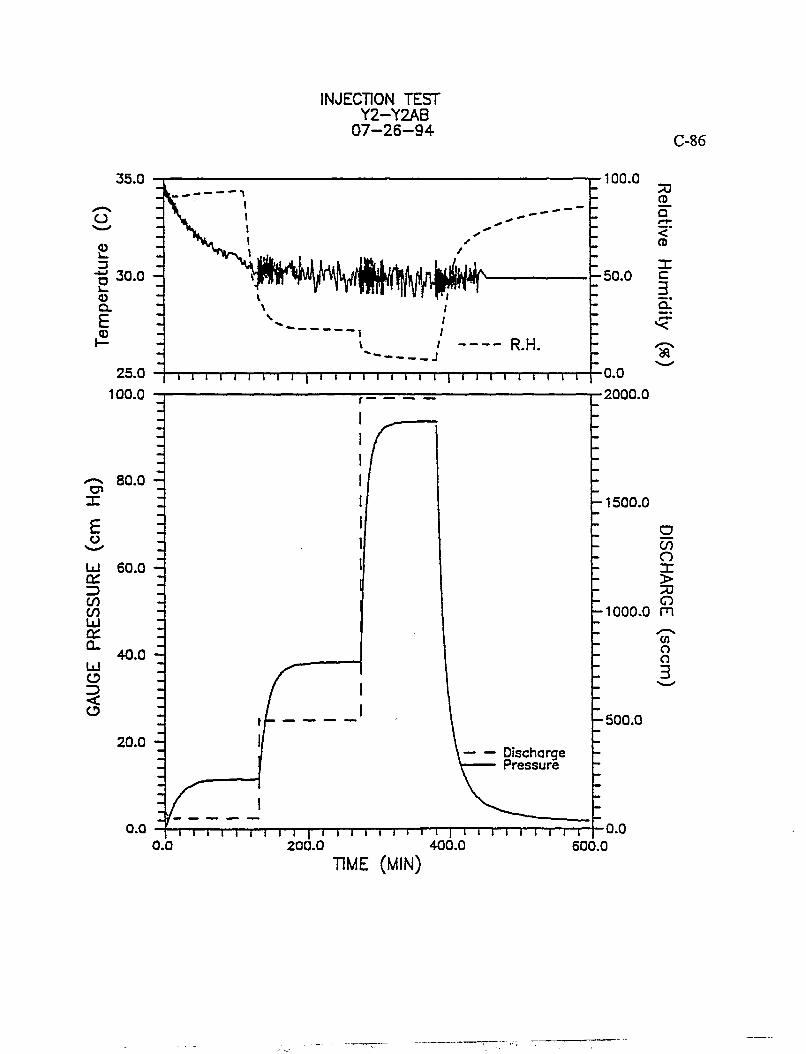
INJECTION TEST Y2-Y2AB
07-26-94 C-86
35.0
13 30.0 -
Q. £
25.0 100.0
X
£
UJ Q: CO CO UJ cr Q-
UJ
o <
80.0 -
60.0
40.0 -
20.0 -
0.0
R.H. - n i i i i i i i [ i i i i i r i i i i i i i i
100.0
- 5 0 . 0
70
a < CD
X C 3 CL.
»
Discharge Pressure
i i i I I l I l I I- l I l i i i • i i I i 0 . 0 2 0 0 . 0 4 0 0 . 0
I I I I I I I | 0-0 600.0
•0.0 •2000.0
-1500 .0
O CO O X > O
•1000.0 m
en o o 3
•500.0
TIME (MIN)
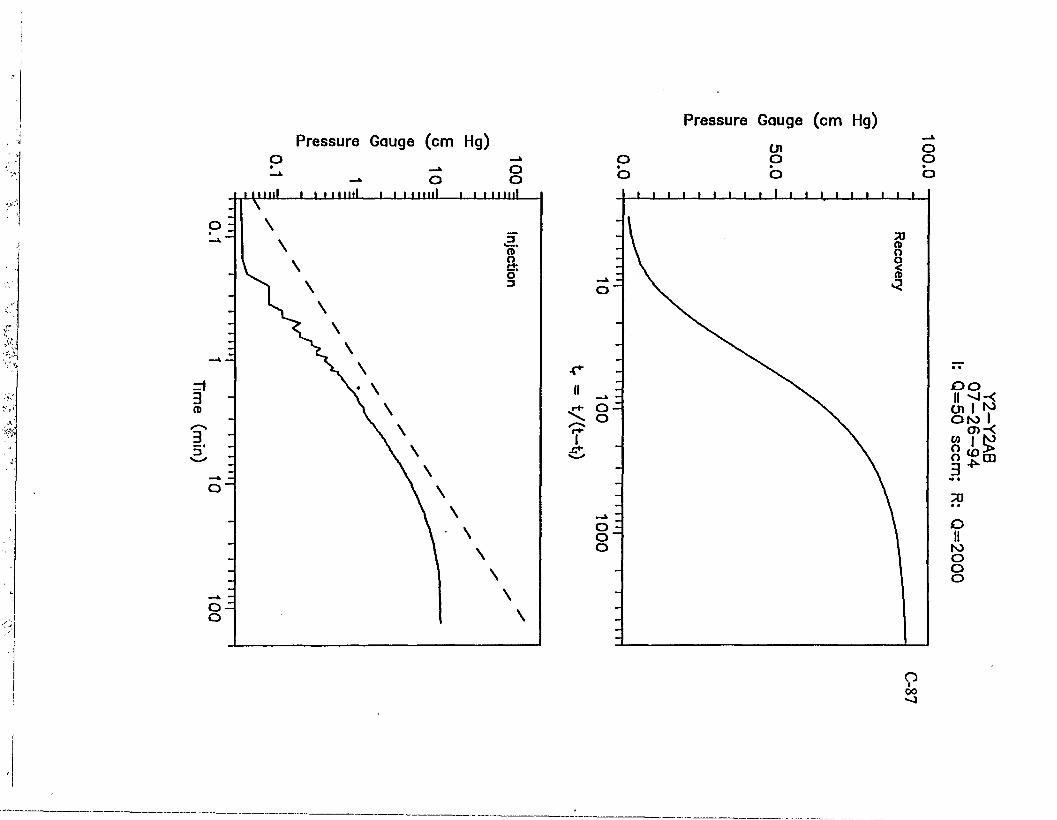
Pressure Gauge (cm Hg)
3 CD
3 #
3*
~* - * O o o
i 11 m l 1 il i i i f 11itl i i i m i l l
o l \ njection
_ k \ - <: \
- • =
\ N
\ \ \ \
^ \ \ t z \ \
o ~ \ \ \ \
\ \ _ \ \ - j \
001
1 II
I ! 1 \
\
Pressure Gauge (cm Hg)
o * o
en o o o
• r ii
I
o o II ^J-< Ol I M OtO I
a>-<
• • O II ro o o o
o 00
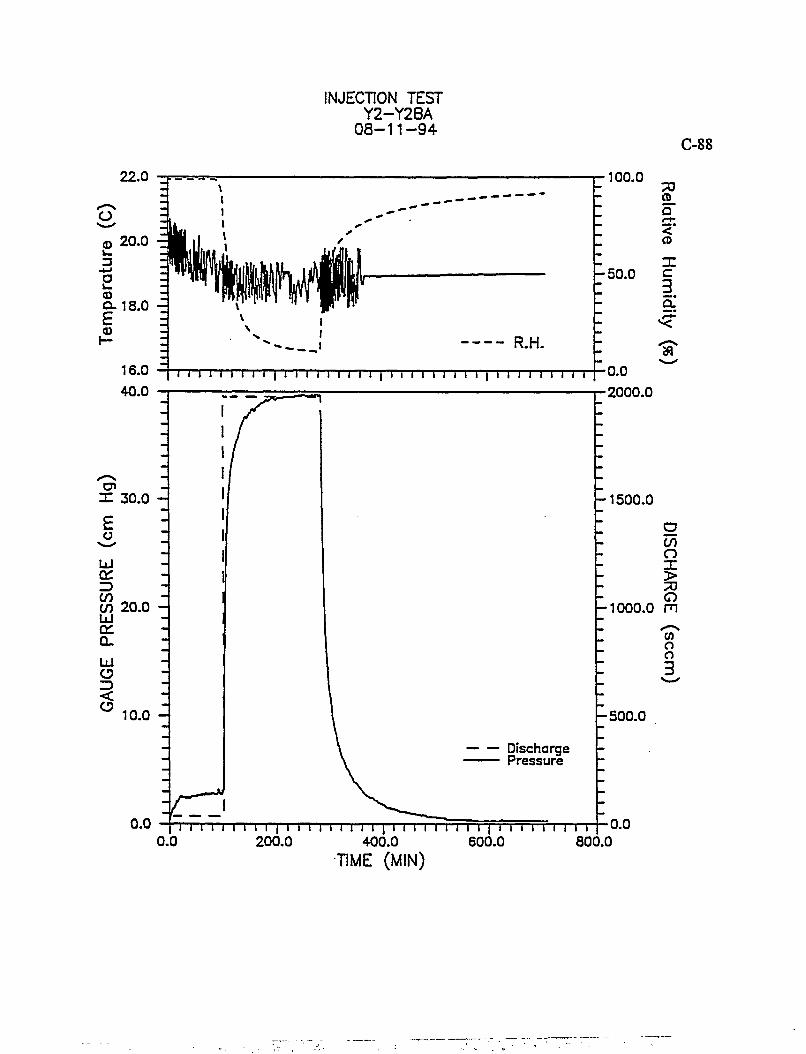
INJECTION TEST Y2-Y2BA
08-11-94 C-88
22.0
O
Lure
20.0
a V -0) CL18.0 £
f —
16.0 40.0
R.H.
I I I 1 I I I I I | I I I I I M I i | I 11 I I I I I I | I I I I I i I I I
100.0
r-50.0
*30
o n-<"
C 3
*3f
X 30.0
£ o
Ld on Z> CO 20.0 Ui 01 CL UJ O z> <
10.0 H
h 1500.0
Discharge Pressure
i i i i i i i i i | i i i i i i i i i | u i i i i i 1 I | i r i i i i 200.0 400.0
TIME (MIN) 600.0
T T T 800.0
•0.0 •2000.0
•1000.0
o CO o X >
m CO o o 3
h 500.0
0.0
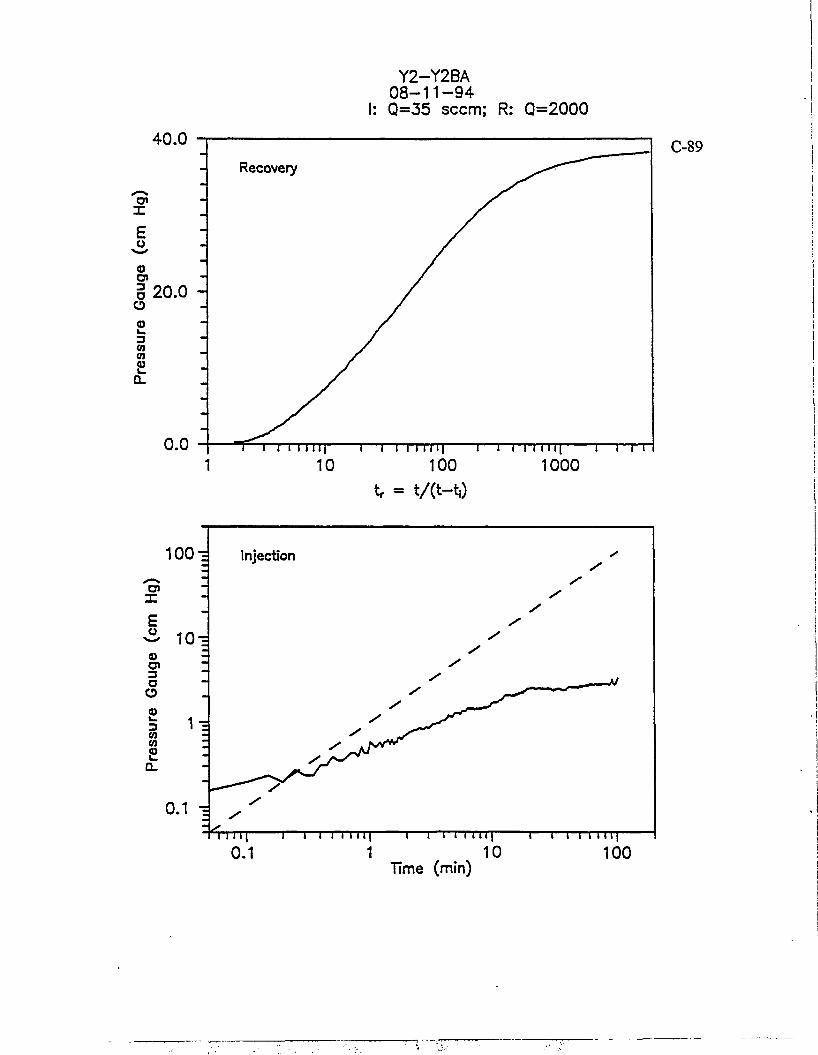
40.0
en X E o
(0
i 20.0 o 2 3 (0 01 0)
Y2-Y2BA 08-11-94 Q=35 seem; R: Q=2000
Recovery C-89
0.0 T I i i i i 1 1 | I I i i i i 1 1 | I I F T
100 tr = t/(t-t,)
1000
1 10 Time (min)
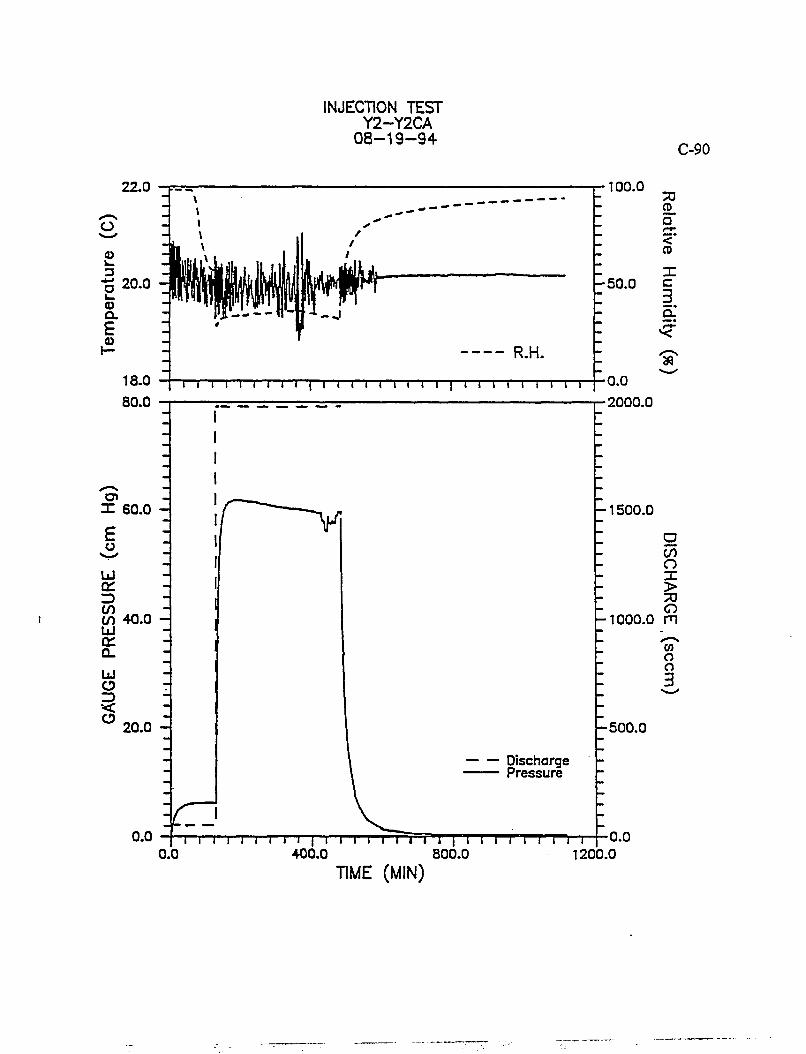
INJECTION TEST Y2-Y2CA
08-19-94 C-90
3
a. £
z^i.u — \
-i i \
h v /
i i i i i i i i
20.0 - —
* -j|-i-J -
R.H. -
-1 1 1 I 1 1 1 i i i i i i i i i i i i i i i i i i i i i
100.0
- 5 0 . 0
70 3L a r f <* CD X C 3 a.*
<fi
80.0
i i i i i i i i i" | i i i i r i i i i | i i i I I I I i i 0 . 0 4 0 0 . 0 8 0 0 . 0 1 2 0 0 . 0
TIME (MIN)
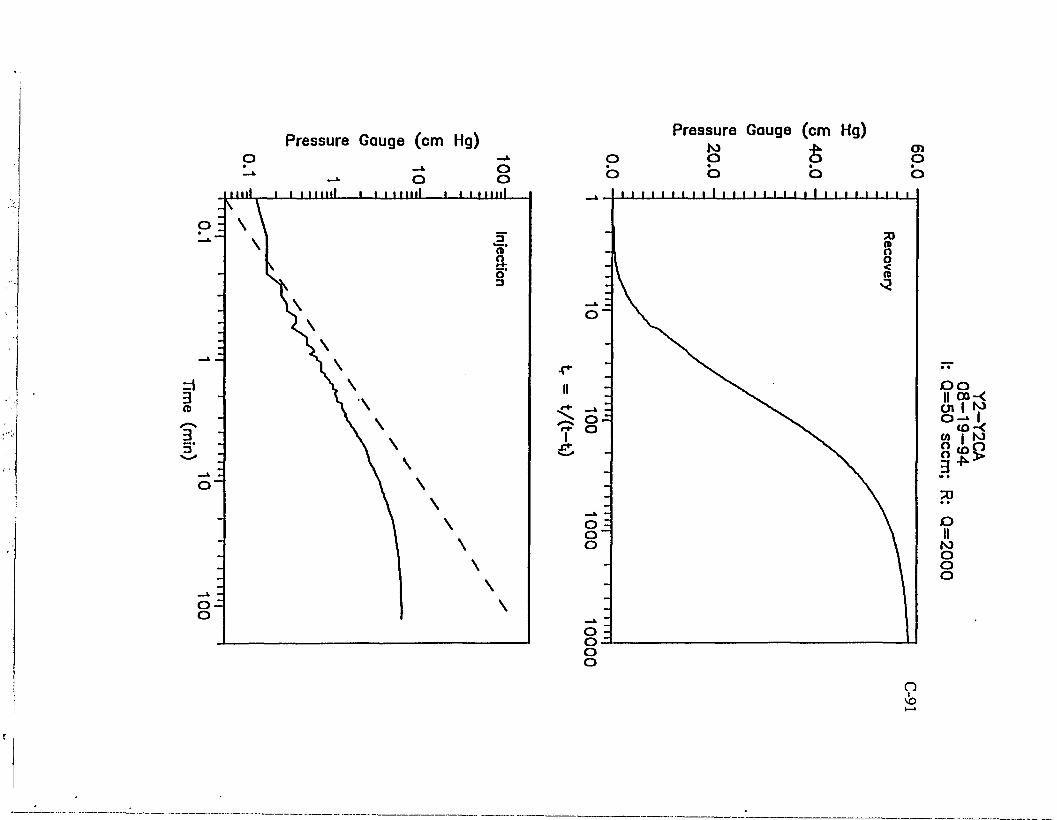
Pressure Gauge (cm Hg) -». o
-- o o i ini l . i i i mill i_i i mil l t i i mnl
Pressure Gauge (cm Hg)
o o 5 • • • * o o o o
I I I I I t I I t I I I I I I I I I I I I I I I I I I I I
en o
o o II 0 0 - <
Ol I M o - * I to-< M I N) 8<e2
• • o II to o o o
• VO
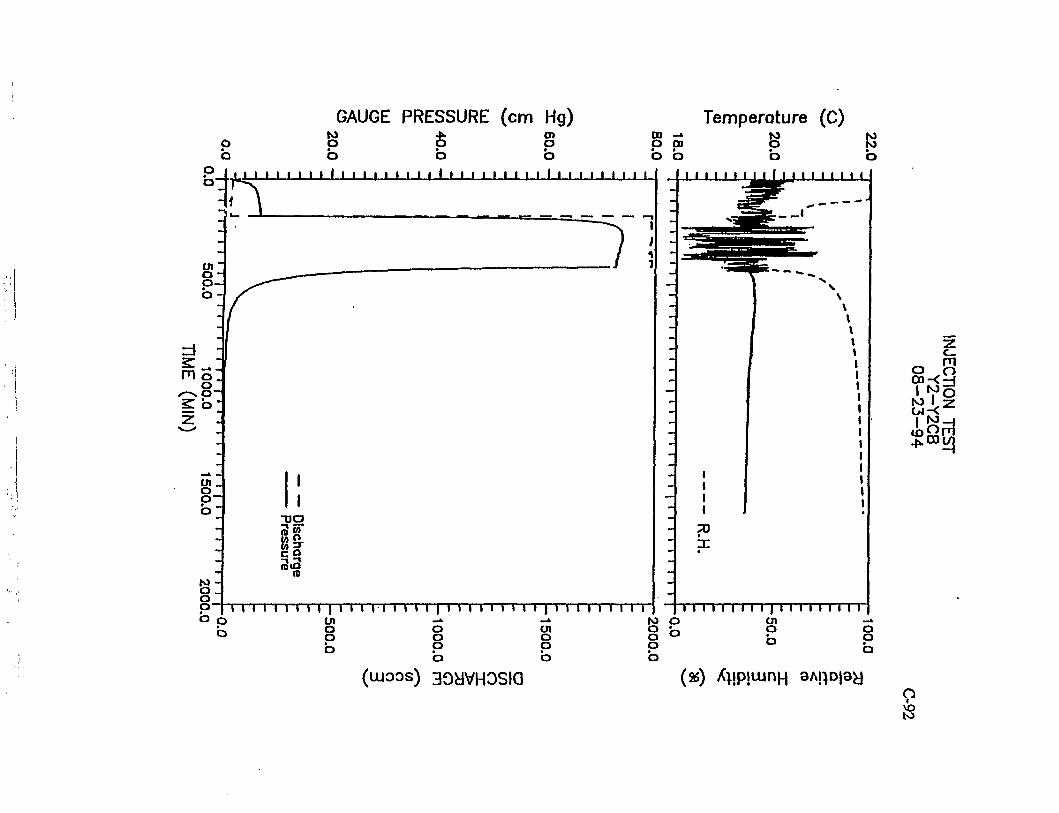
b
en 4 o o
o o b 6
GAUGE PRESSURE (cm Hg) £ S
• • • o o o
I I I I I I I I I I I I I 1-1 I I l.l-l I I I.I I I I.I I I I I I I I I
Temperature (C) to o
I I
(D
i i i i i i i i i | i i i i n i t i | i i i i i i i i i | i i i i i r n i o o I ai o o
1 M I I I I I I | I I I I I I I I I N> o cn S o P
o o b o o b
(UJOOS) 3oyVHOSIQ (%) AipjujnH 8AnD|sy
z o o
4x00 tq
9 vo lo
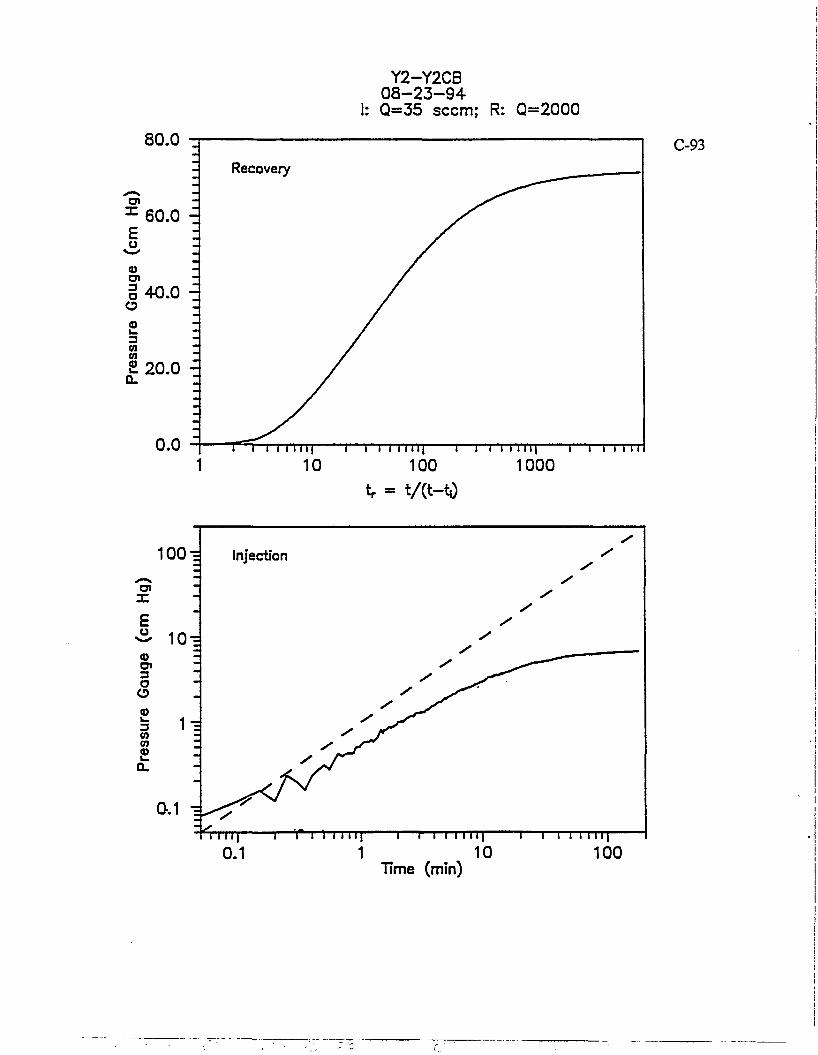
Y2-Y2CB 08-23-94
I: Q=35 seem; R: Q=2000
ou.u
11
11
11
1
Recovery
x 6 0 . 0 E o 0) O I
§40.0 o <a i _ 3 0) 0]
£20.0 0.
0.0
0.
0.0 r i i 1 1 1 u i i i 1 1 1 1 i i | i 1 1 1 11II 1 1 I 1 111 • 10 100 1000
C-93
tr - t/(t-t,)
1 10 Time (min)
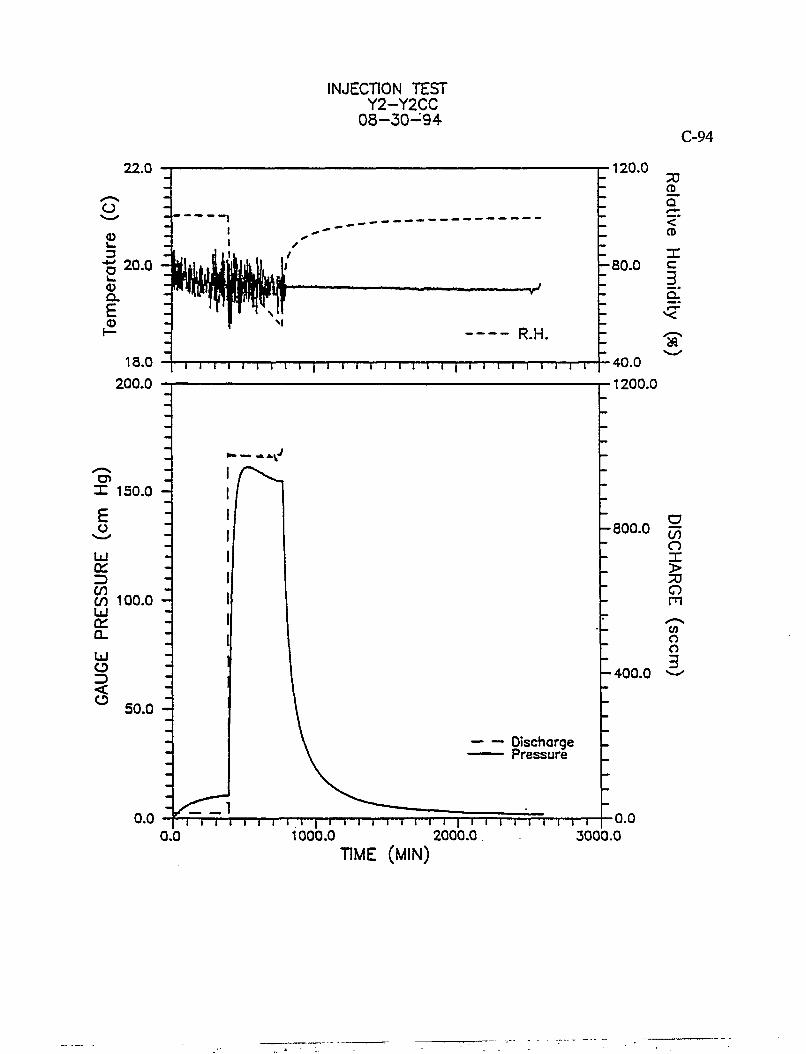
INJECTION TEST Y2-Y2CC
08-30-94 C-94
22.0
CD
3 20.0
Q.
E
18.0 200.0
•V
R.H.
T n i n n i ] i i i i i i i i i | i i i i i i i i r
120.0
- 8 0 . 0
70 C D . Q ^^ <* CD
X C
3. Q*
*
en X 150.0
O
LJ
$ 100.0 UJ 01 Q_ UJ O Z> <
50.0 -
0.0
* • — . » * t y
-800.0 r£
Discharge Pressure
•40.0 •1200.0
- 4 0 0 . 0
0.0 I l I l I I l I . l | i I l I | i I
1000.0 2000.0 TIME (MIN)
i i i i i r 3000.0
0.0
g en o x > 70 a m CO o o 3
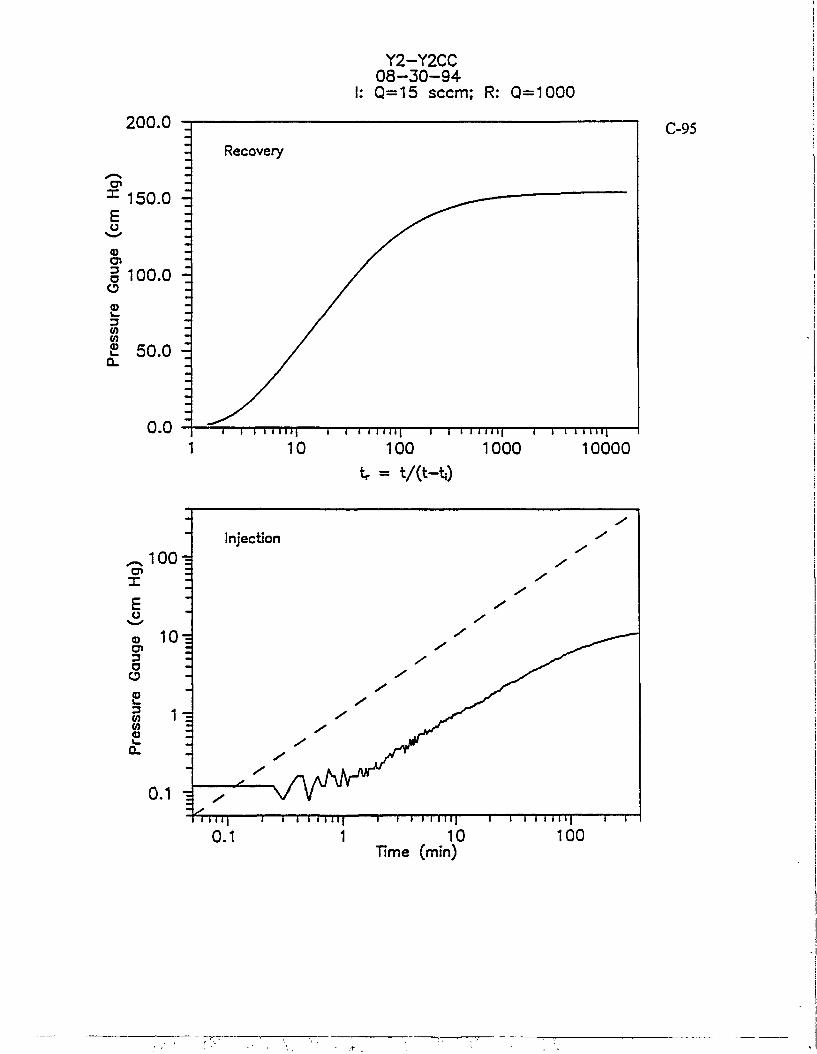
Y2-Y2CC 0 8 - 3 0 - 9 4 Q=15 seem; R: Q=1000
zuu.u Recovery
^150 .0 ^150 .0 E o <a o> g 100.0 o <D t -3 W ™
CO
£ 50.0 — Q_ ™
0.0 0.0 i i i i i ii11 i i i 11 i i i | i i n n i i | i i l i i n i | 10 100 1000
tr = t / ( t - t i ) 10000
1 10 Time (min)

C-96
Graphs from Table B.9 Y3 - 1.0 m Data
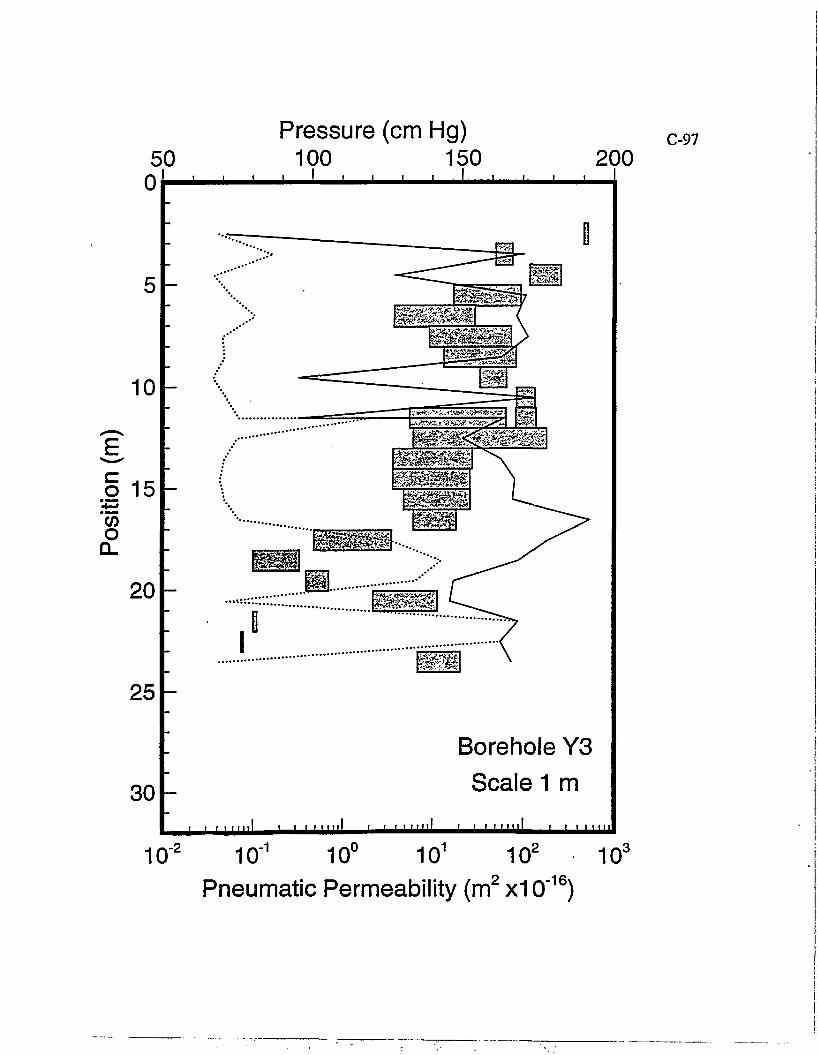
50 _i i i_
Pressure (cm Hg) 100 150
_i t i 200
20 -
Borehole Y3 Scale 1 m
^^^^^^^^^^^^^^^^^^^^^^J^^^^^^^j^^^^^^^^^^^^^^^^^^^L
10 -2 10 -1 10° 101 10* 10"= 16> Pneumatic Permeability (m x10 )
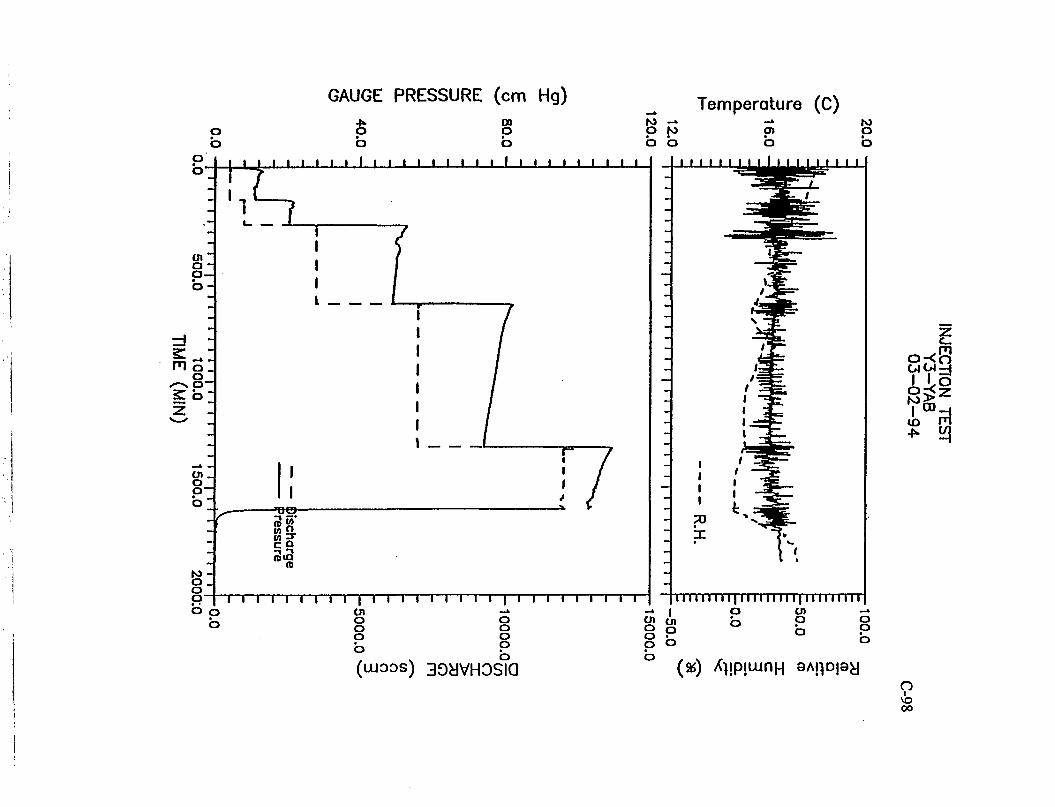
GAUGE PRESSURE (cm Hg) Temperature (C) o b
| U I I I S 6 o
I I t I I
oa p b
ro -» o to • • o o I I I I I t I I I I I I
01 a -o -• o -
o _ o CD-
en _ o o-
83 o o-b 6
I
I I I I I I
I TO X
ro o
J_J_L
1 i 1 1 1 i 1 \ 1 i i 1 1 1 1 1 1 i 1 1 1 » 1 1 1 1 1 1 I | i l l i i l l i l | l l l l l i l l l | i i l i i l l l l tn -» -» 1 o en -» o o 01 01 b ° 2 P o o p ° b P o b
o o o
(UJOOS) 3DdVH0SIQ
g b o (%) X^pjujnH 9AHD|ay
z o-<Fi
to rn
n • 00
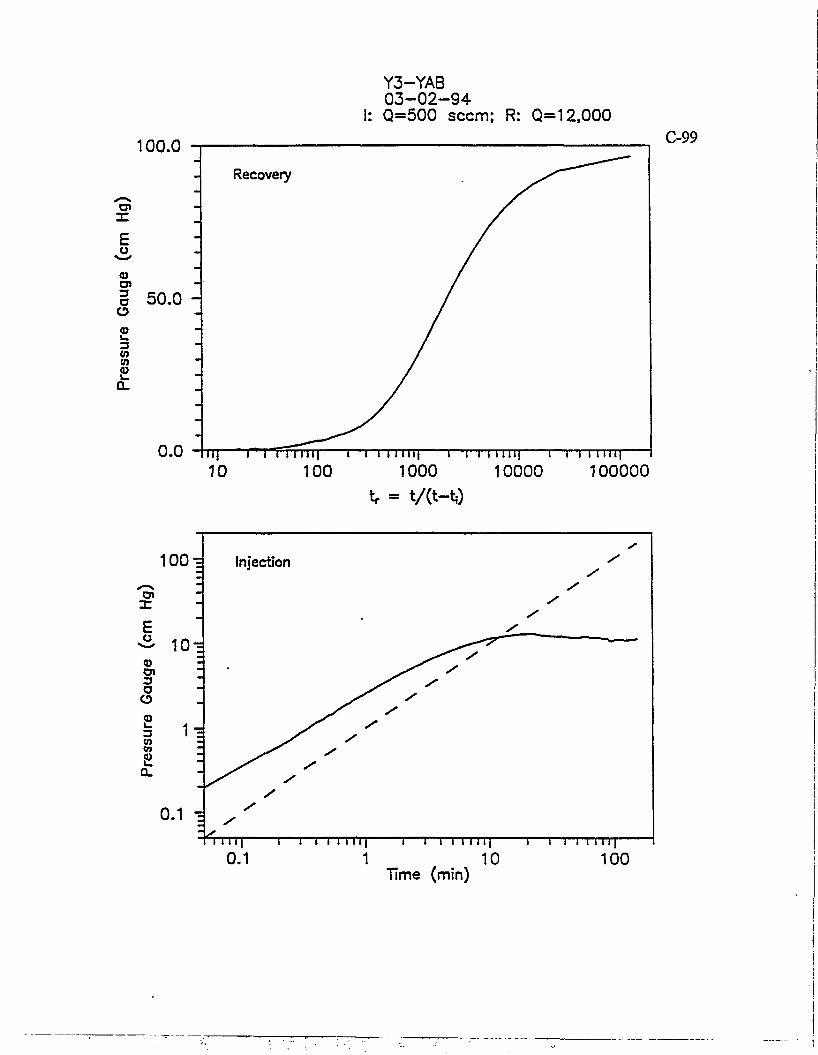
Y3-YAB 03-02 -94 Q=500 seem; R: Q=12,000
100.0 C-99
0 . 0 Iii| ' i"iTTT7ii| 1—i i i m i | 1—i i i mi) 1—i i i iu i | 10 100 1000 10000 100000
t, = t/(t-tO
100-=
X E o <D oi a O £ W to
10"=
0.1 1
1 10 Time (min)
1 0 0
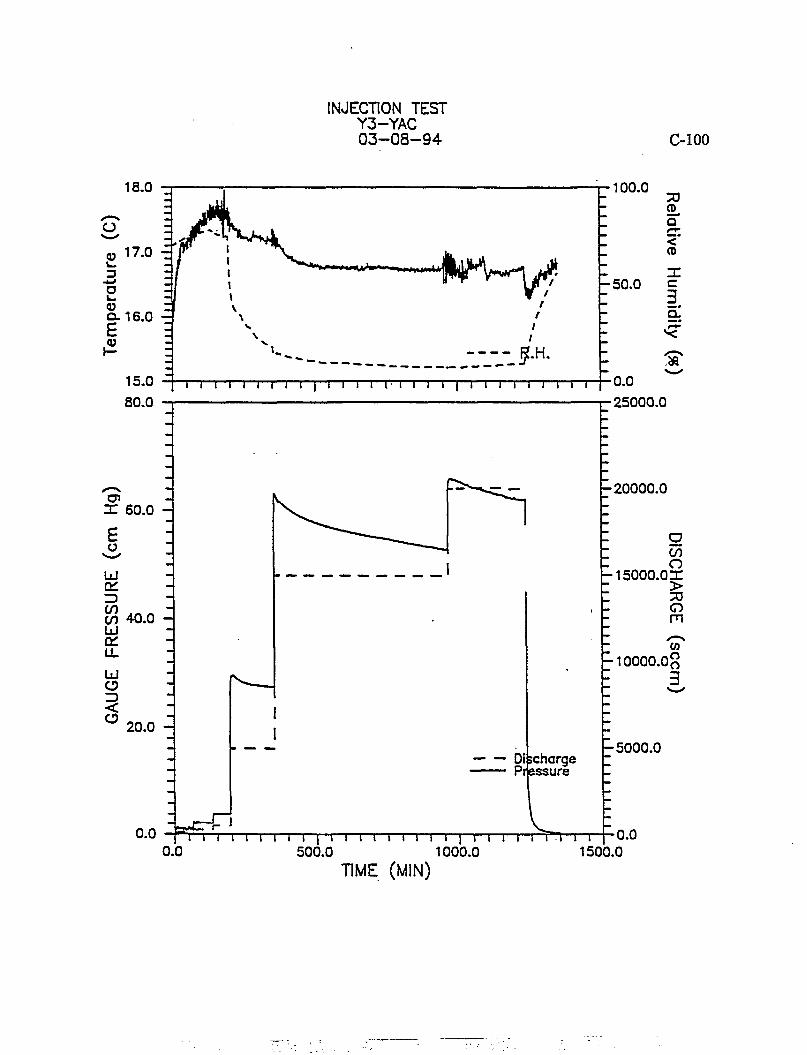
INJECTION TEST Y3-YAC 03-08-94 C-100
18.0 100.0
20.0 -
i i i i i I i i I i i i I i i I i i I i i i i t r i i i 0.0 500.0 1000.0 1500.0
TIME (MIN)
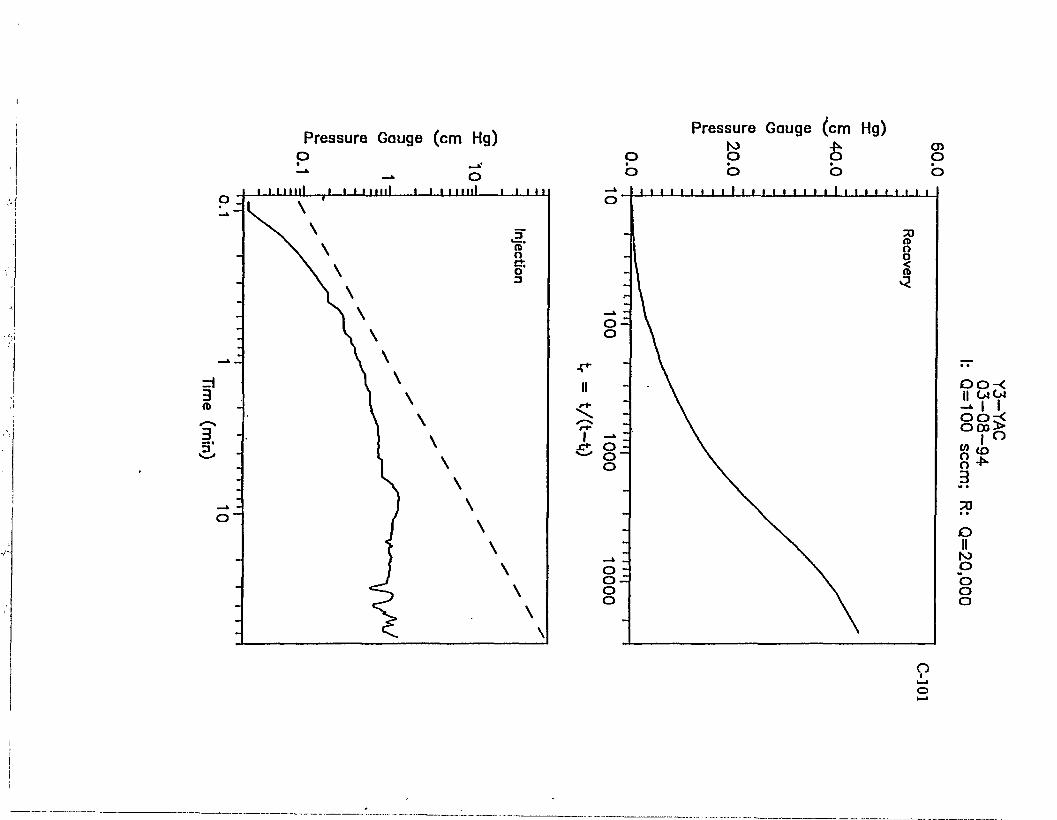
Pressure Gauge (cm Hg) o o
Pressure Gauge (cm Hg)
b o o ' ' ' i i ' ' i ' I t i i i i i i i i i t i i i
en o
oo-< II OJCJ
^ ' L O O r <
oa>>
3 70 • • O
II N> O b o o
o I
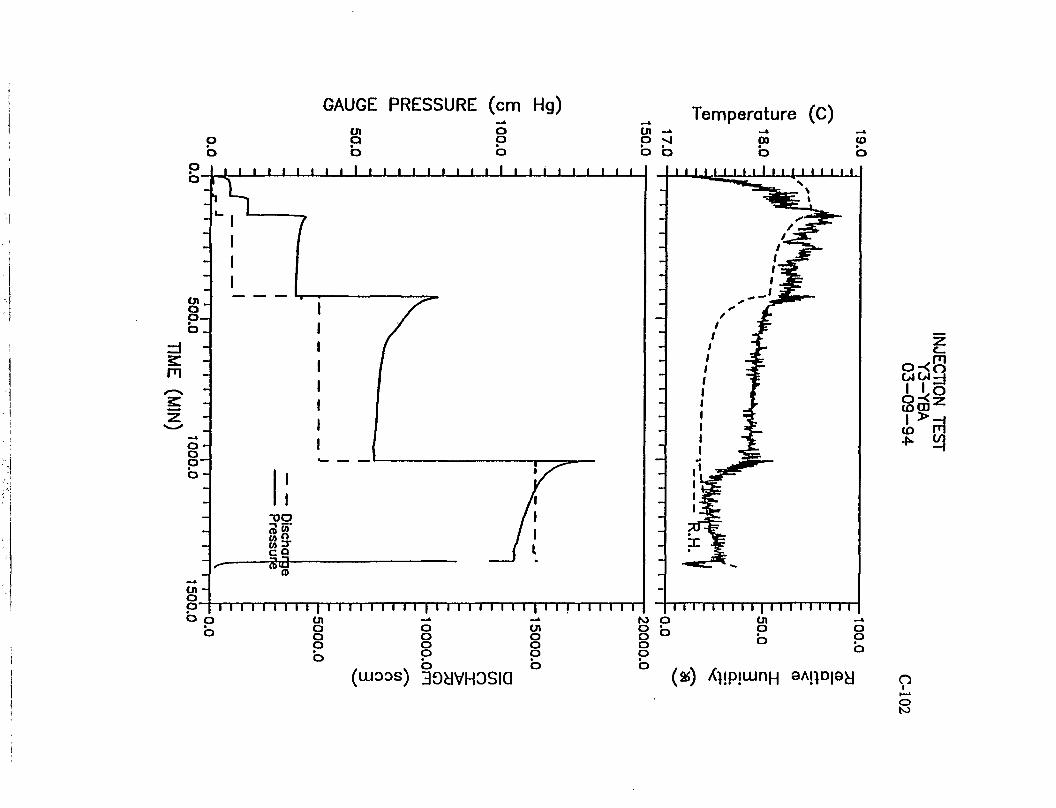
GAUGE PRESSURE (cm Hg) Temperature (C)
(UJODS) 30yVH3SIQ
o-<8
(as) AipitunH 8AnD|9y 0
o to
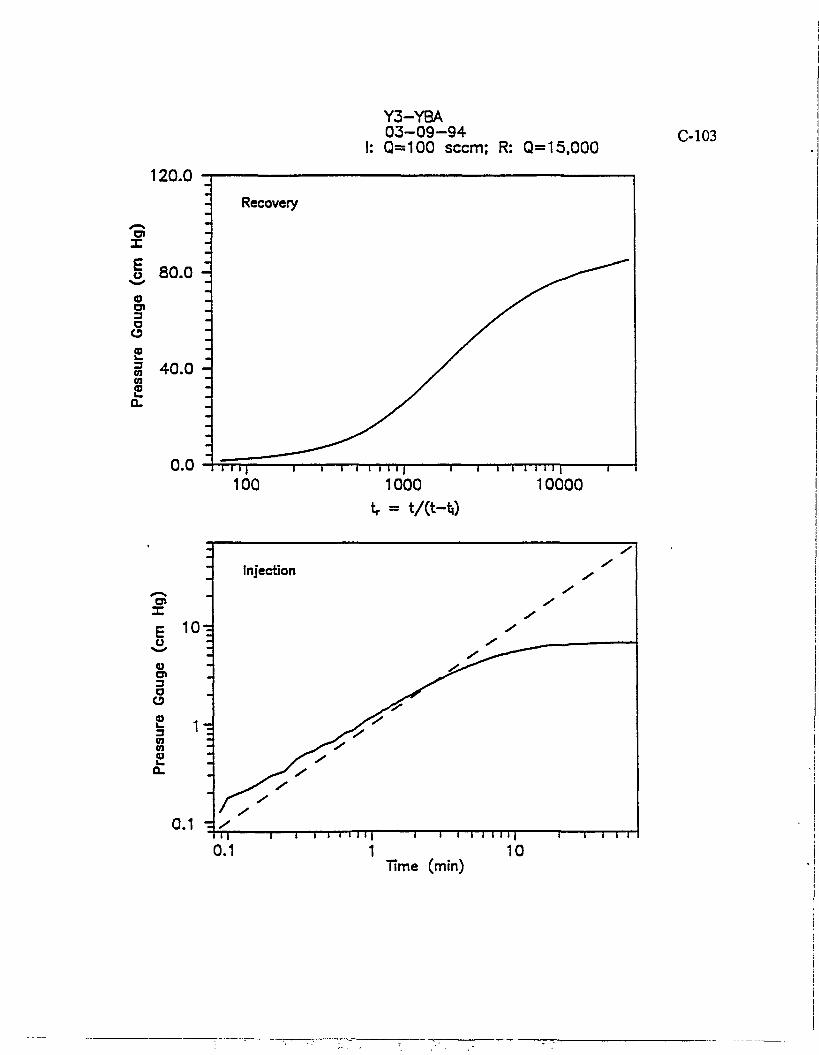
120.0
X E o 01 3 a
3 01 01
CL
80.0 -
40.0 -
Y3-YBA 03 -09 -94
I: Q=100 seem; R: Q=15,000
0.0 - r r r f f 100
T 1 I I I I (J 1 1 1 1 1 1 1 1 ] -
1000 10000 t, = t / ( t - t j )
C-103
X E o
3 a o
3 01 01 01
1 0 -
0.1 -1 10
Time (min)
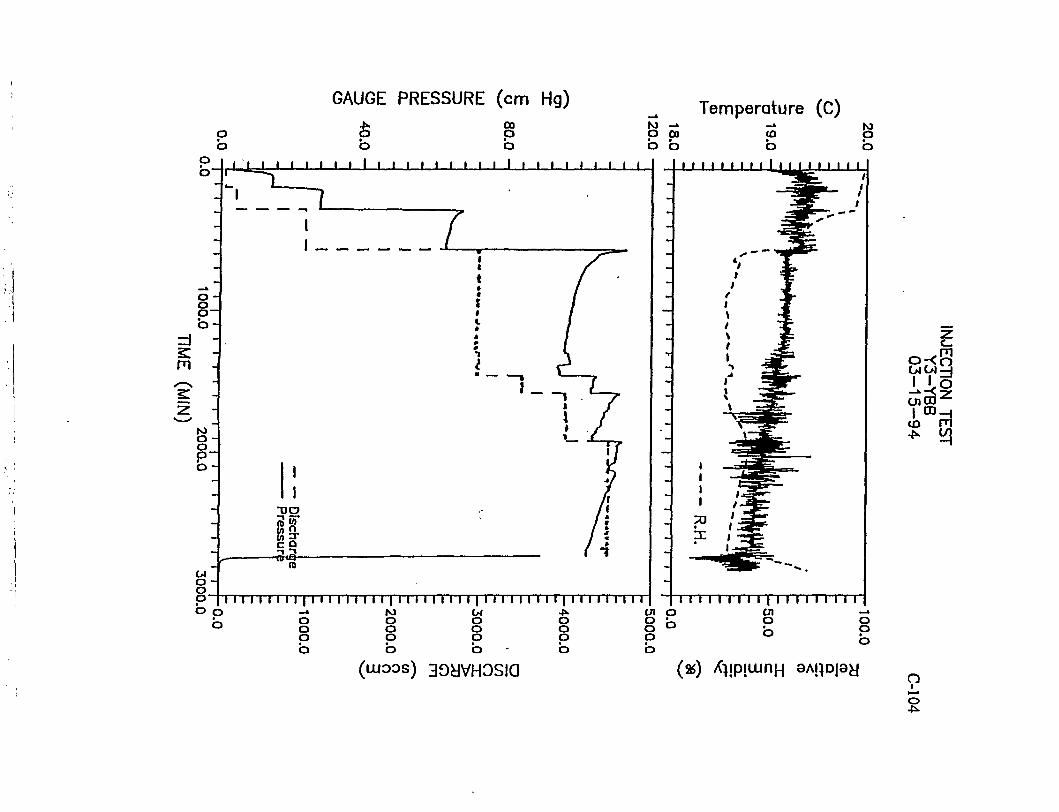
GAUGE PRESSURE (cm Hg)
o O"
o o I t _ l I I I I I I I I I I I I I
o H a o b
oo o •
o
I I I I I I I I I I I I I I I M I I I I I I
Temperature (C) O CD ID
b b O
71 I I „~I
M o O H
o -o o b p
b
iS» w Q. c 9
(0
I t t • 4 f »
1 _
i i n 11111111111111111111 ri n 11111111 -» io u o o o o o o o o o b b b -
r | i i i I T I i i i
s 11 I I I
I I I I I I 11 I I 11 I I I I I I I O o o
tn o 8 b o
en o o
o o
(UJOOS) 30yVH3SIQ ( * ) X^JpjUJnH 8AHD|8d
z sag
to Pi 4» <q
I—>
o
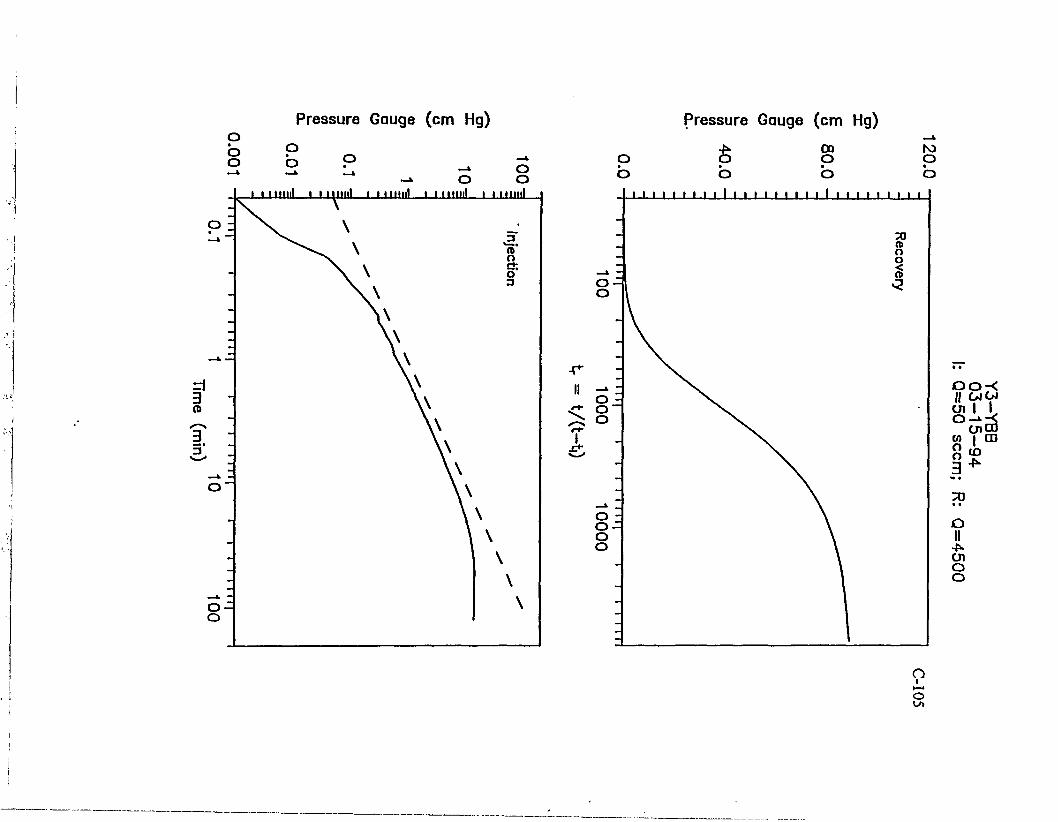
Pressure Gauge (cm Hg) Pressure Gauge (cm Hg)
-» o o o
I mini i i imiii i 11mni i i iiiini i i imiii
oo-< || OiOJ Ol 1 o-*-< cnco 0) | CD
8«° 3 * •• • 2J • • O II
-£• en O o
o I
o
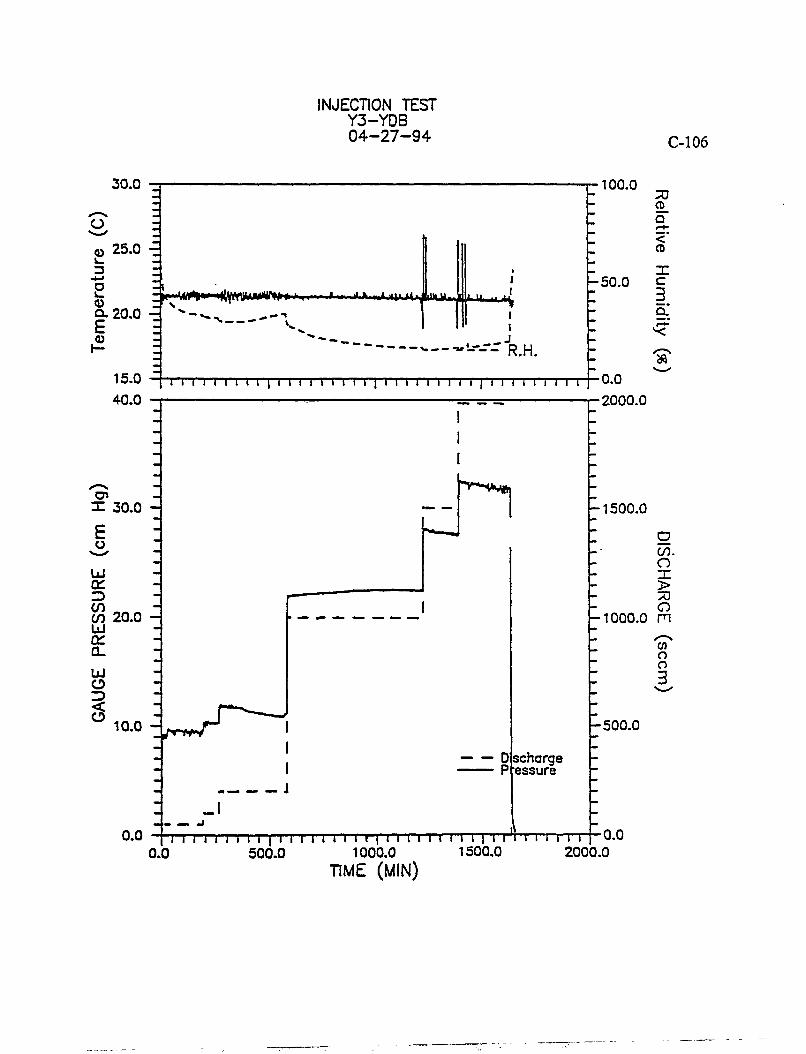
INJECTION TEST Y3-YDB 04-27-94
30.0
O
0) 25.0 -E
O
Q-20.0 -3 £
: » " ^ » " '(tywM*nm»»» >, J I * .^.nuo, Uuu>
' -> .— — V — - ' - - - - " R . H
15.0 | i i i i i i i i i | i i i i i i i i i | i i i i i i i I I | I i i I n I i i 40.0
•100.0
- 5 0 . 0
X 30.0
£ u
Id or Cfl 20.0 LLI
o_
o Z> 5 10.0 -
0.0
" ^ 4 » w i h
-1500 .0
_ «. _ J
Dscharge essure
•0.0 •2000.0
-1000 .0
-500 .0
I I I I I I ) I I I I I I I I i I I r | I I i i I i I I I l I I ' i i i i i i i 0.0 500.0 1000.0 1500.0 2000.0
TIME (MIN)
0.0
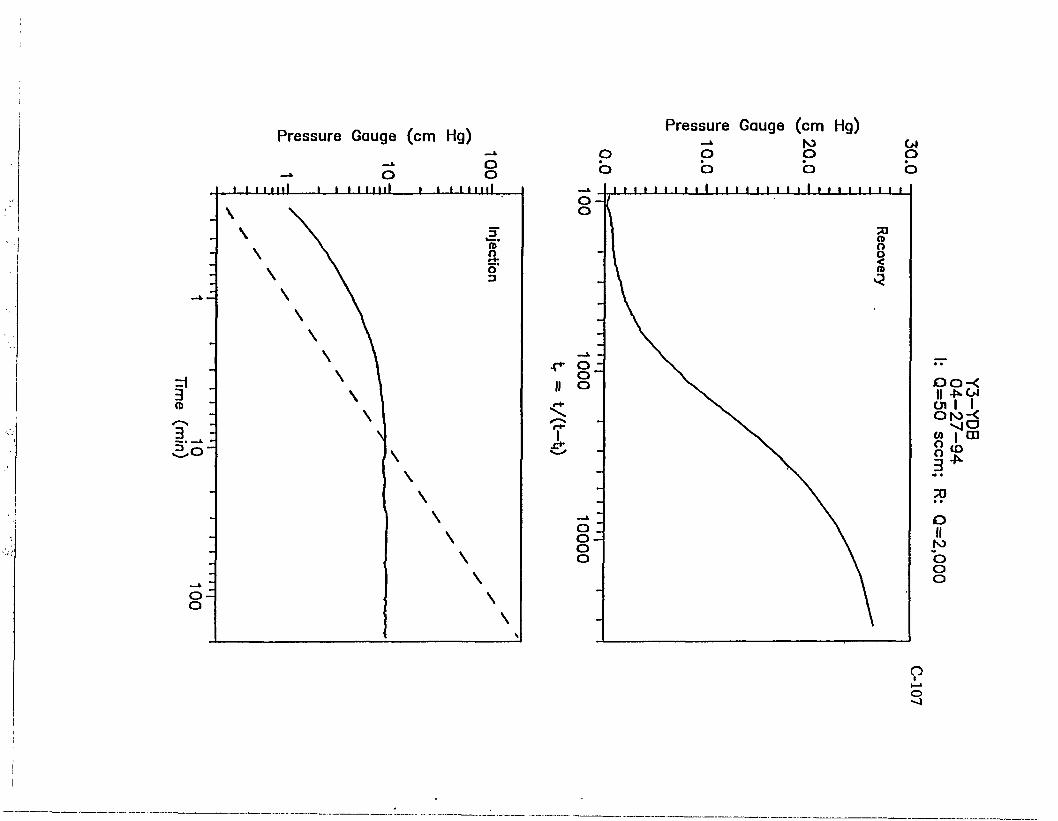
Pressure Gauge (cm Hg) Pressure Gauge (cm Hg) o o
o o
to o (A O
oo-< II t " Ol I I oto-< CA I CD
3 * TO
O II
fO O O O
o I
I—'
o
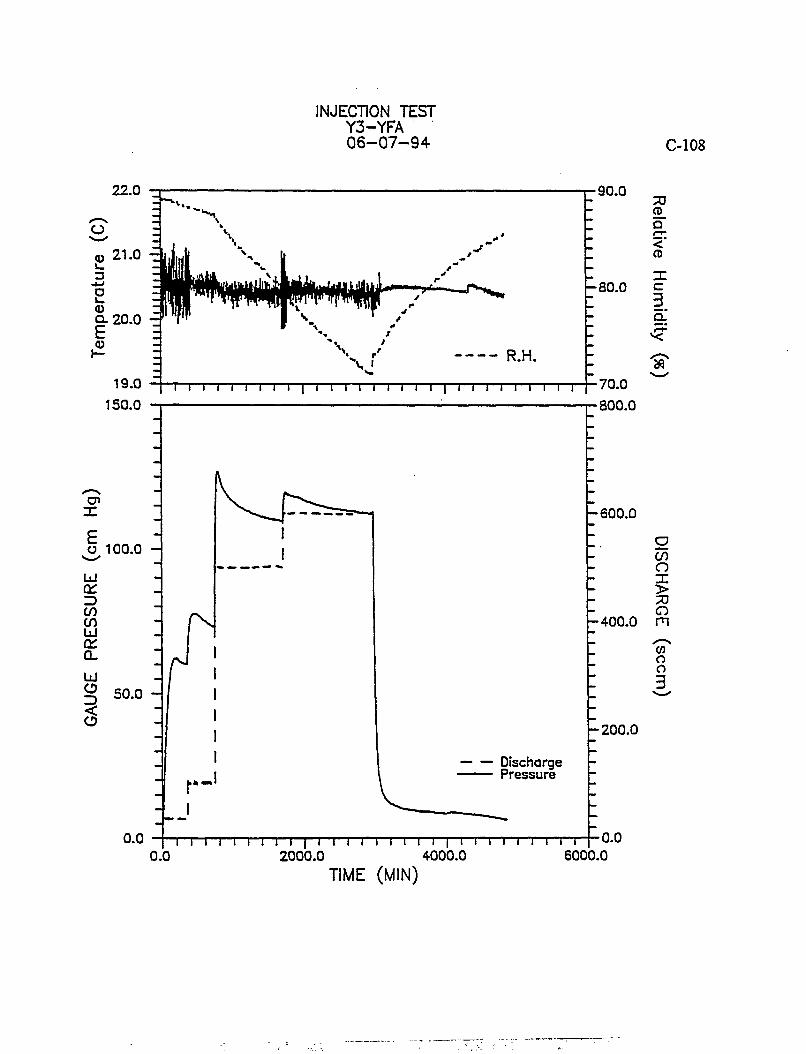
INJECTION TEST Y3-YFA 06-07-94 C-108
22.0
X
o 100.0
Ld C£ Z> C/5 CO UJ Cd Q_
UJ O Z3 <
50.0 -
•90.0
-ao.o
-600 .0
u • * « • » '
Discharge Pressure
0.0
•70.0 •800.0
73
Q <" Q X c 3 a."
<fi
- 400 .0
O CO O X > o rn CO o o 3
-200 .0
I I I I I I I I I | I I I i i i i i i | i i i i t i i i i 0.0 2000.0 4000.0 6000.0
0.0
TIME (MIN)
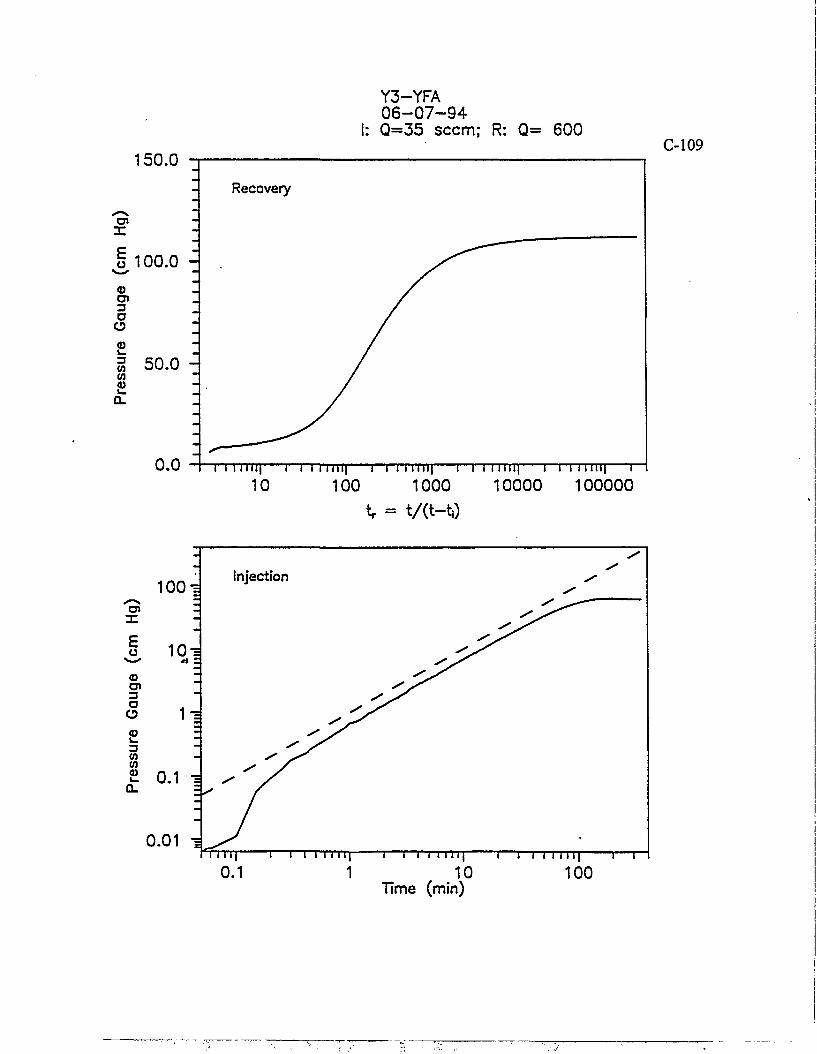
Y3-YFA 06-07-94
I: Q=35 seem; R: Q= 600
150.0 C-109
X
I 100.0 Ol ZJ o o <u l _ 3 CO CO <u
50.0 -
0.0 i i I w i i | 1 i 11 i u i | 1 i 11 i n i | 1 i i I I I I I I 1 i i i w u t r
10 100 1000 t, = t/(t-t,-)
10000 100000
T 1 I I I l l l | 1 1 1 I I l l l | 10 100
Time (min)
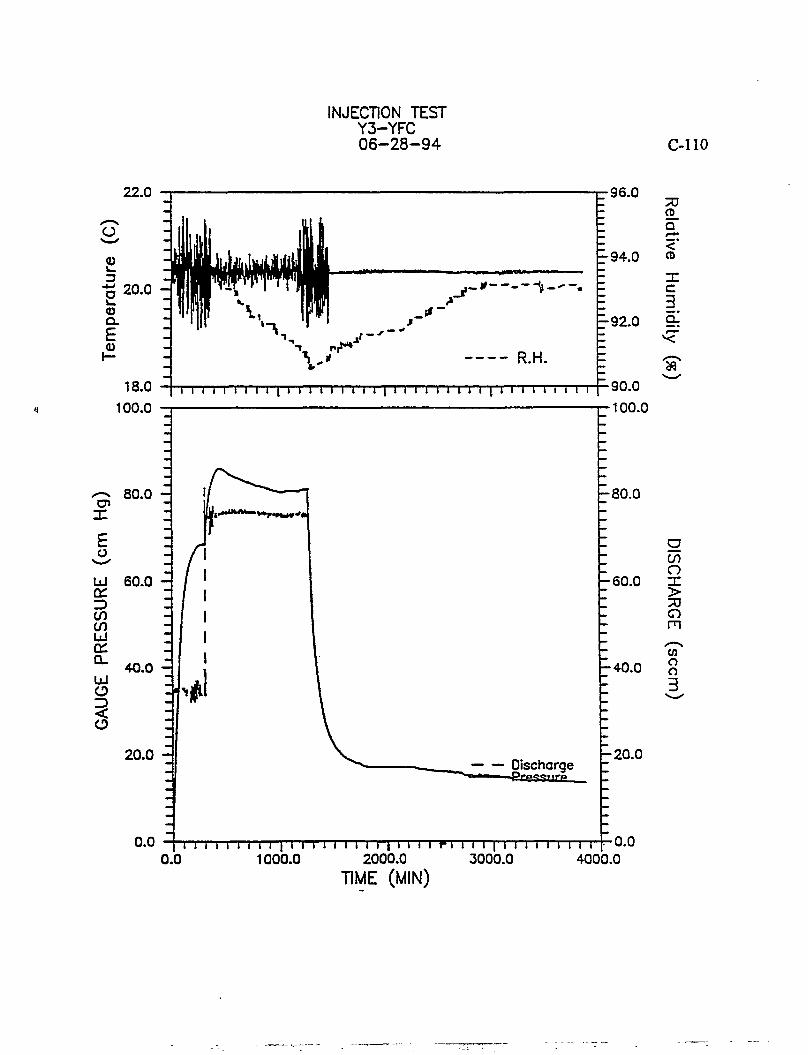
INJECTION TEST Y3-YFC 06-28-94 C-110
22.0
20.0 - I
Q. E
18.0 100.0
-
™ " \
m «* • *
y — R.H.
1111
1111
1111
1111
1
I 1 1 1 I 1 1 1 1 1 I 1 1 1 1 1 i 1 1 1 1 1 1 1 1 1 1 1 1 1 & 1 1 1 1 1 1 1 1
96.0
- 9 4 . 0
70 CD_
a < CD
C
3. 92.0 g
33
/"•^ 80.0 -X
£ o Ul 60.0 -tr Z> CO co UJ a: a. o Z> <
40.0 -
20.0 -
-*
- 6 0 . 0
=W
0.0
Discharge
90.0 100.0
•80.0
- 4 0 . 0
o CO
o > o m en o o 3
- 2 0 . 0
l i l I i i l I l | I l I l I I l l l J l l l l F l l l l | l l l l l l l l l 0.0 1000.0 2000.0 3000.0 4000.0
0.0
TIME (MIN)
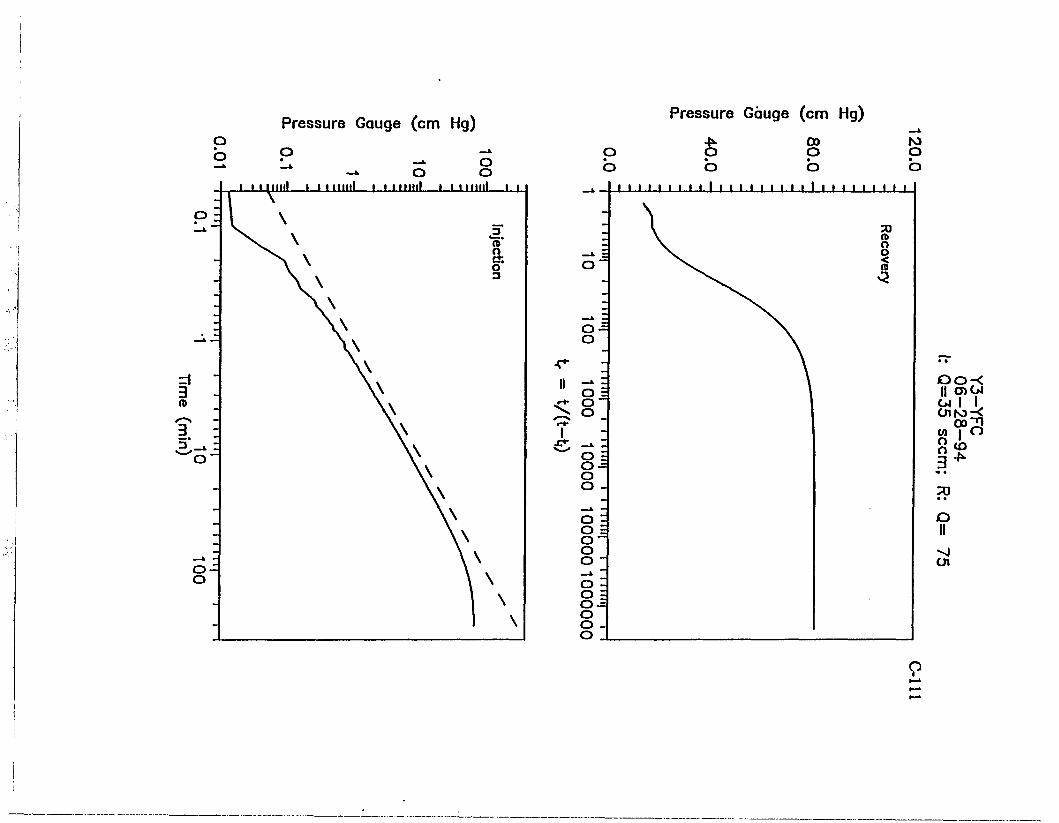
Pressure Gauge (cm Hg)
-». o o o
i i mini i i mini i i mini i i mini L_I_
Pressure Gauge (cm Hg)
CO
O o - < II OOJ w I I cnto:< w i o o ' o 3 *• • 70 • * O
o I
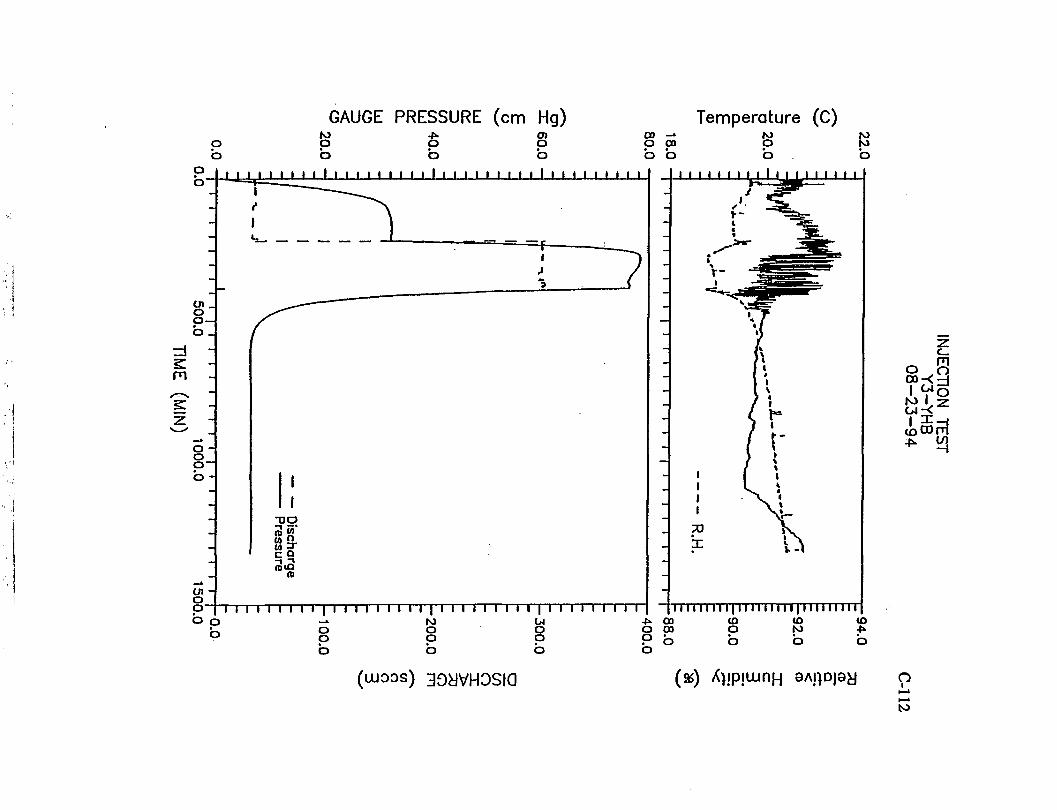
GAUGE PRESSURE (cm Hg) Temperature (C)
o S
to CD PI
* <3
(LUOOS) 30dVH3SIQ (%) X^ipjoinH 8AHD|9y o i
ts>
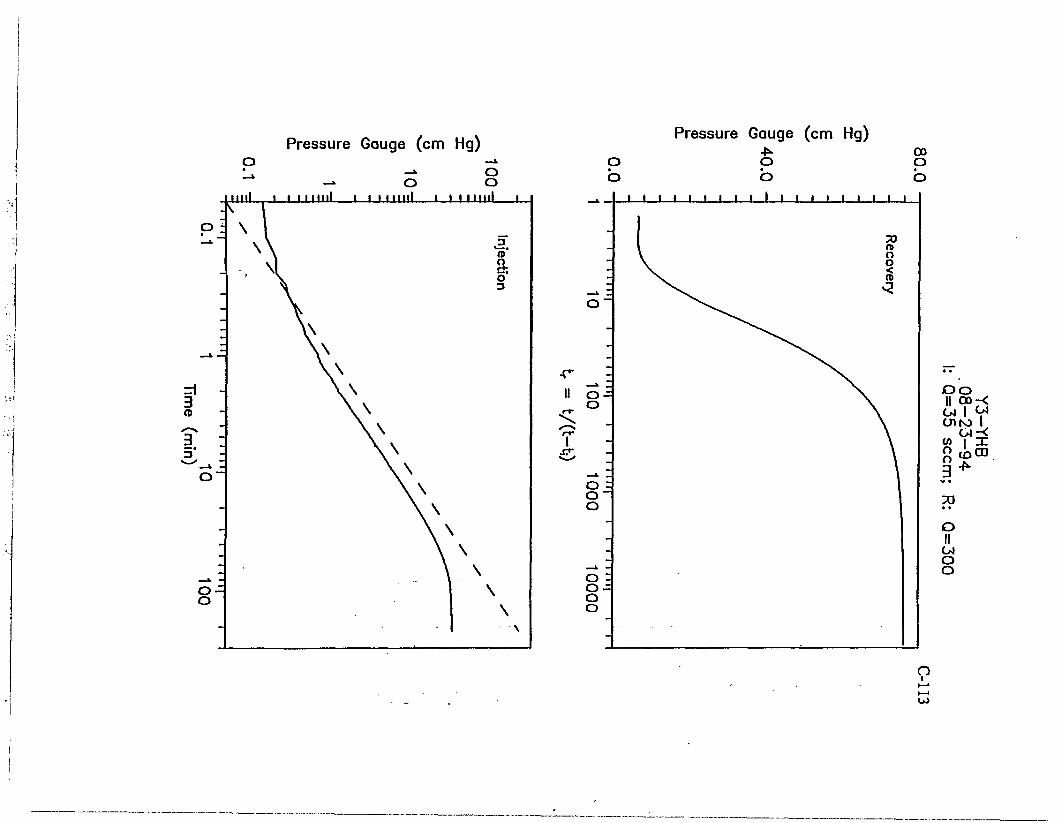
Pressure Gauge (cm Hg)
-* o -• o o
mill i i i mill i i i mill i_
Pressure Gauge (cm Hg)
o o
O 00 O
II O -
I ST
1 1 1 1 1 1 1 1 1 1 1 1 1 1 1 1 1 1 i
~-
Recovery
o ~
-
o -o
-
000
-
0000
1
III !
O O || 00-<
OIK) I </> 0*: £ icn 3 *
73 • • O II iA O O
o I
u>
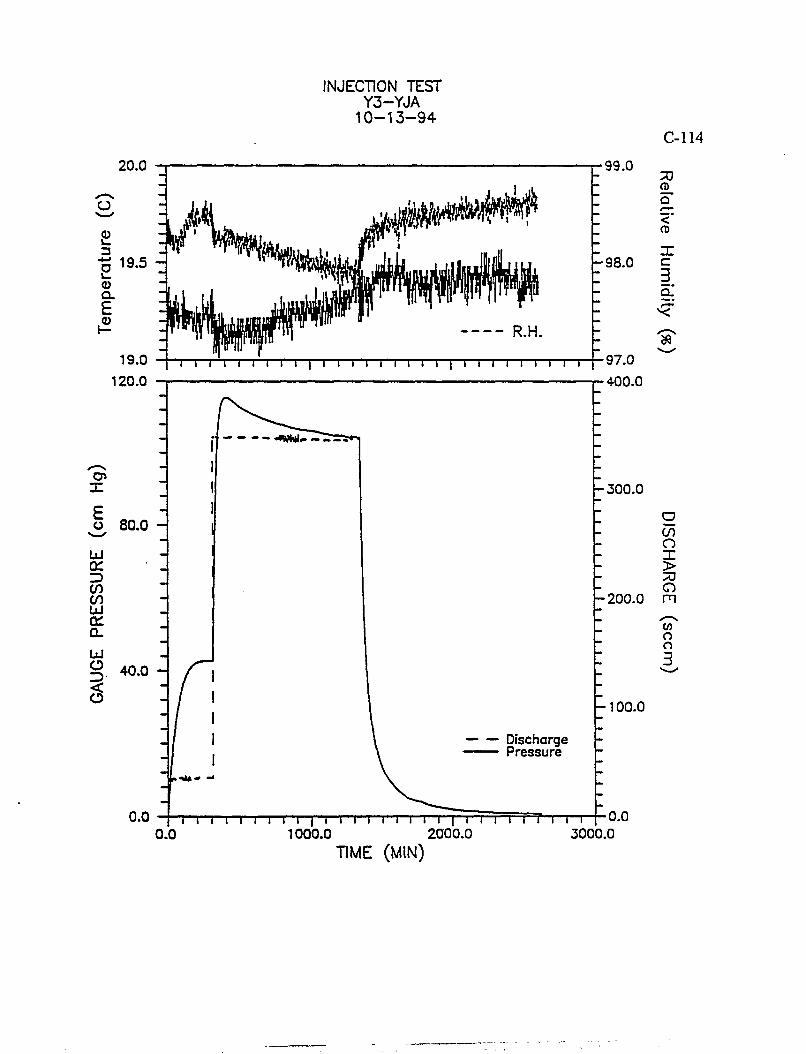
INJECTION TEST Y3-YJA
10-13-94
20.0 99.0
1000.0 2000.0 TIME (MIN)
3000.0
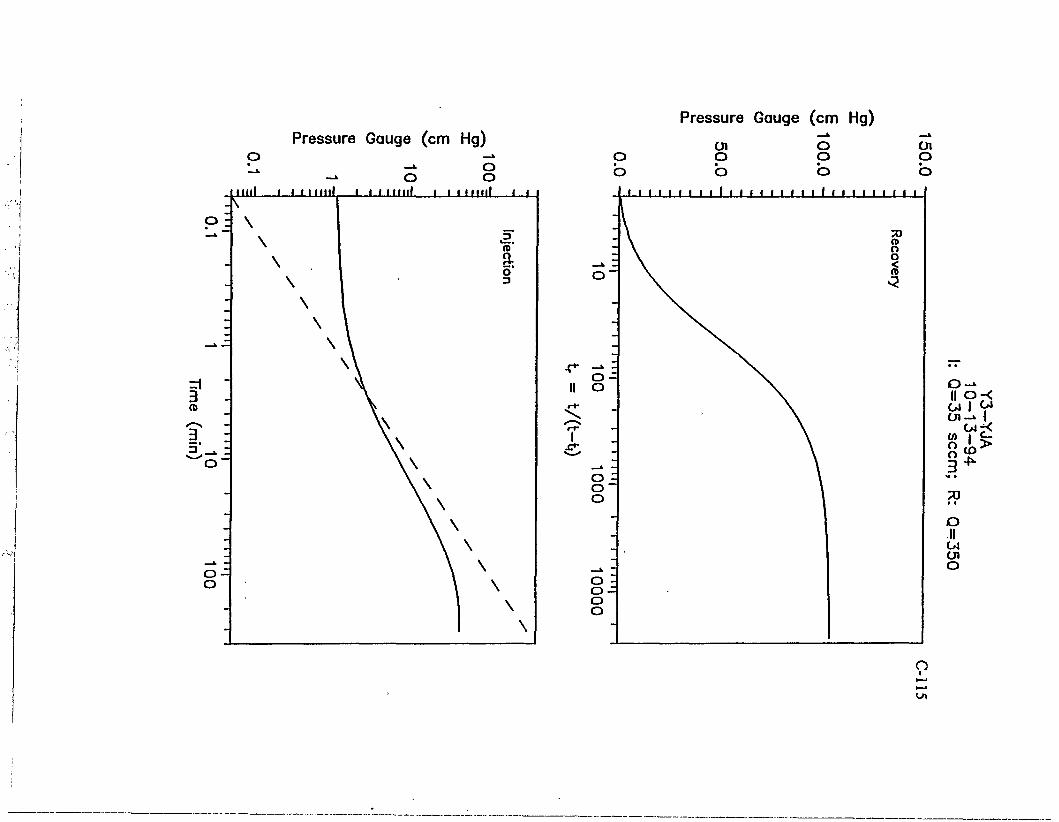
Pressure Gauge (cm Hg)
- • • o
-- o o UUl I I I l l l l l l , I » i ' n i n l I t
Pressure Gauge (cm Hg)
JCf.
a _ i
ll o-< G4 I y (n - * \
<>*7< <n 1 £-o o 3 -f»-
73 • • O II
04 cn o
o I
I—» •—•
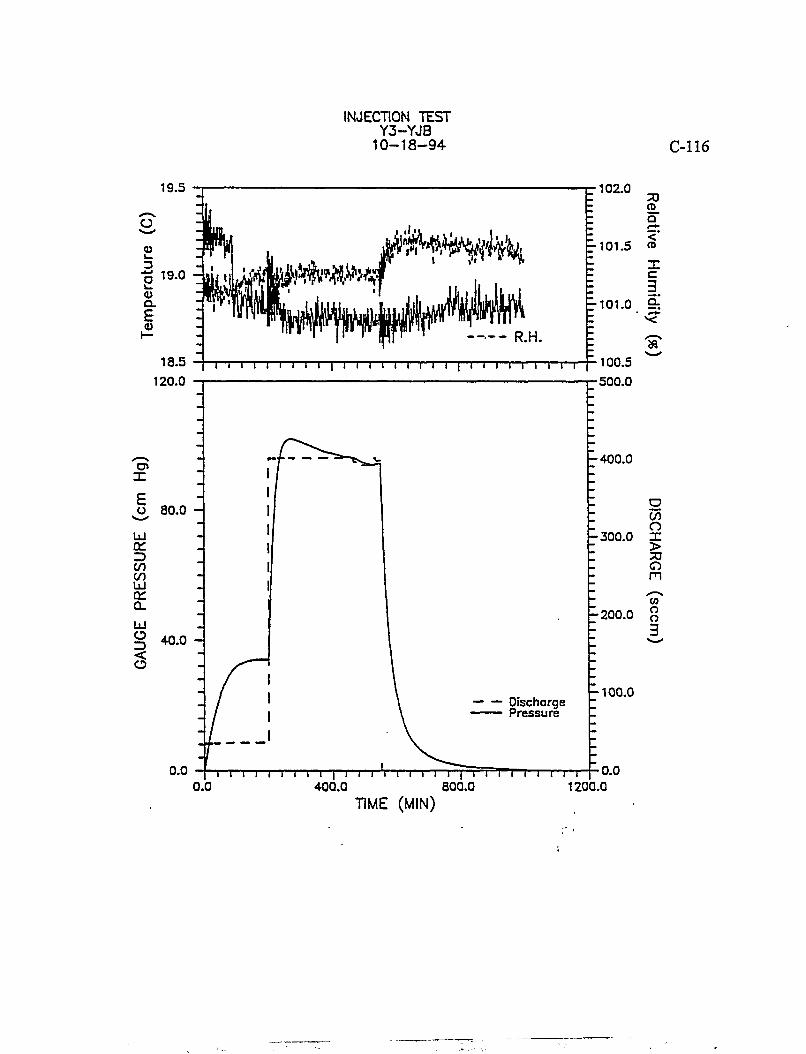
INJECTION TEST Y3-YJB
10-18-94
19.5 •102.0
-101 .5
•101.0
o>
o 80.0
Ld
(A
en rr o_
-400 .0
•100.5 •500.0
-300 .0
-200 .0
-100 .0 — — Discharge
Pressure
n I I I l I I | I I I i I i I I I | i i i i 400.0 800.0
TIME (MIN)
i I i r
1200.0 0.0
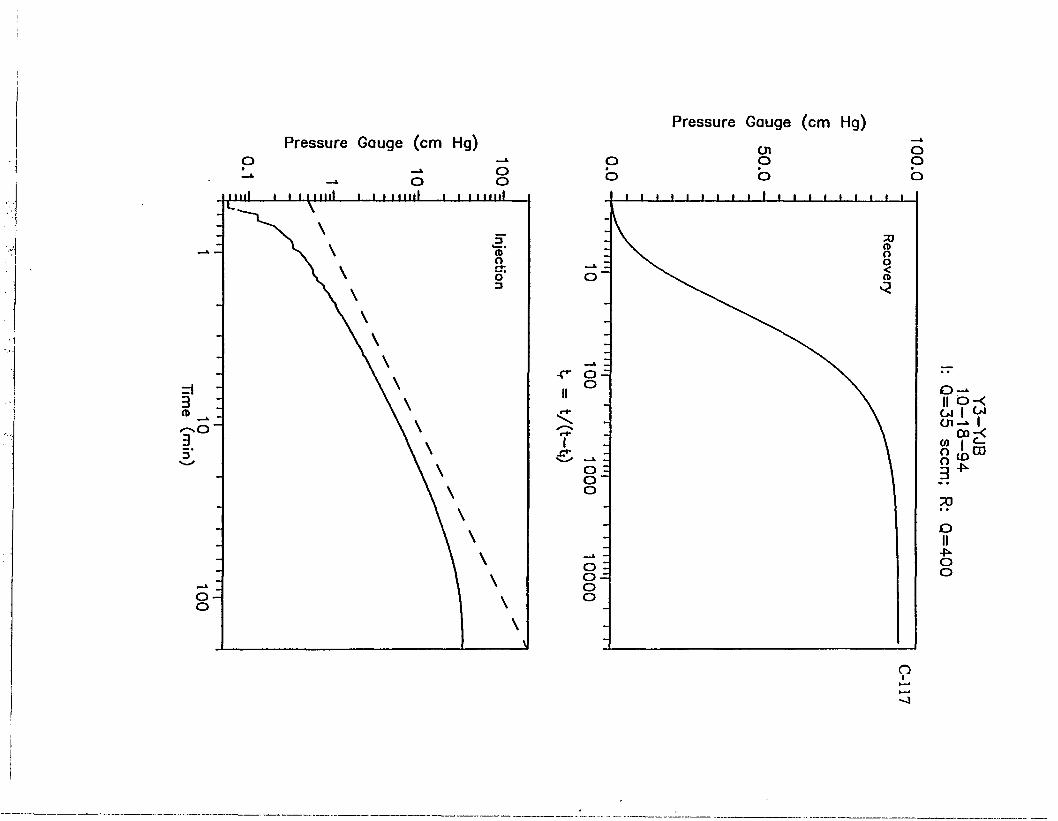
Pressure Gauge (cm Hg)
- * O -» o o
ma] i i i mill i i i mill i i i mill
Pressure Gauge (cm Hg)
11 ?^ O l - * I
co-< w I ™ o (£>
7? Ct II o o
o i
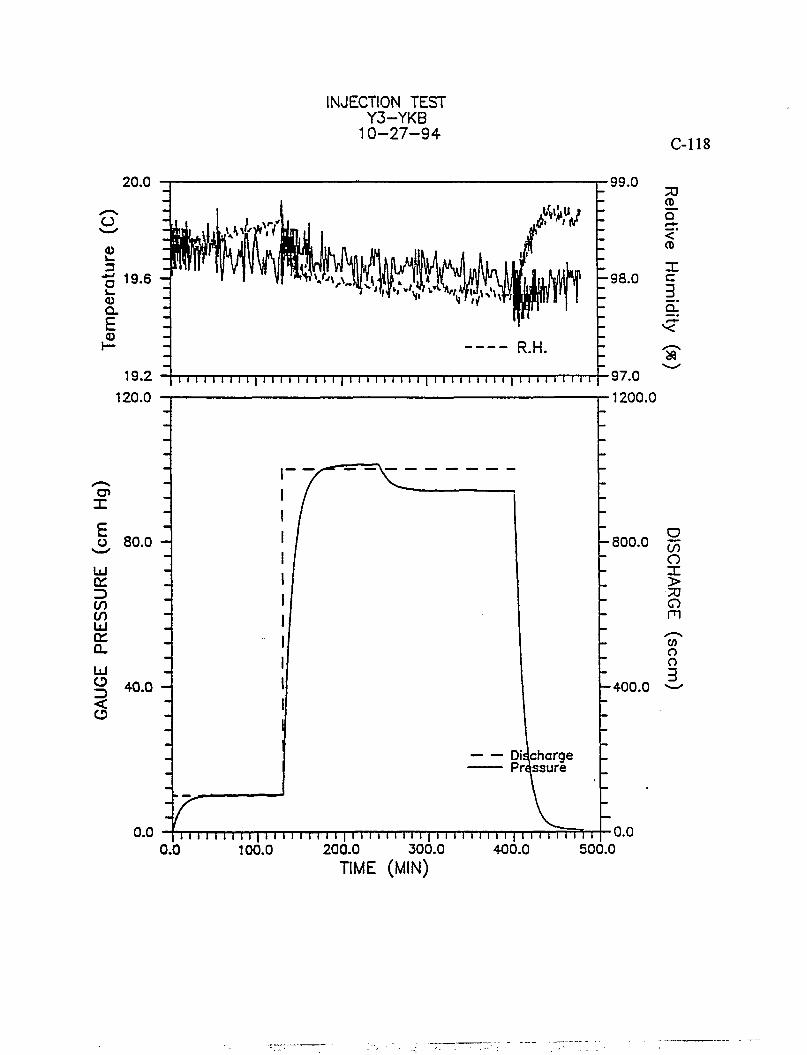
INJECTION TEST Y3-YKB
10-27-94 C-118
20.0
O
3 19.6 -
O. £
19.2 120.0
R.H. 1 1 i i i i 1 1 1 1 1 i i i i i i i i | i i i 1 1 1 1 1 1 | i i i i i 1 1 1 1 | i i i i i i i i i
•99.0
-98.0
73 a <" CD
X c 3 Q.*
»
X
^ 80.0
UJ 01
CO CO Ld Ql a. Id § 40.0 <
-800 .0
0.0 111 i i 111111 i i i i i r i i i | i i i i 11 11 11 i i i i 1111 i | i i 0.0 100.0 200.0 300.0 400.0
Discharge Pressure
•97.0 •1200.0
-400 .0
g CO o X > vO o m o o 3
•0.0 500.0
TIME (MIN)
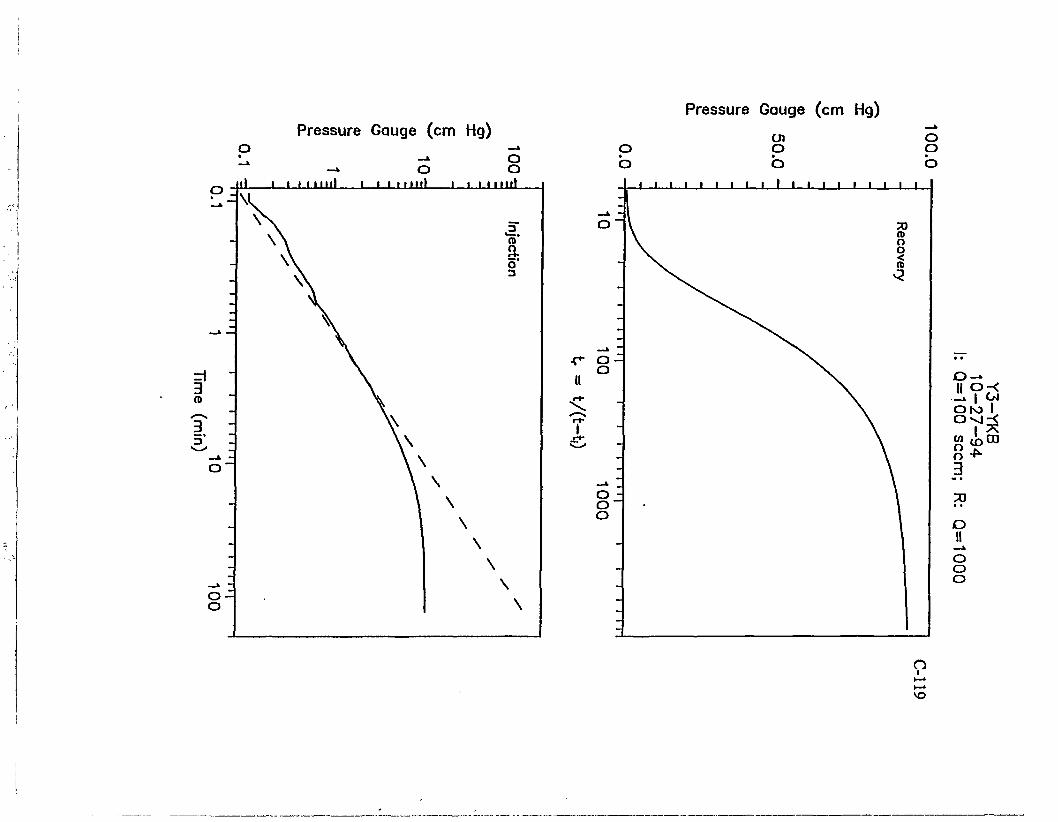
Pressure Gauge (cm Hg) o -*
-»• o o iJ I I M mi) i—i i mill i i i mill
Pressure Gauge (cm Hg)
3 (D
IT 3*
M * \l
II
I 1
\ N
\ V
\ \
Injection
—A — \
- V o ~
\ \ \ \
\ \ \ \
_ 1 \ - \ _ \
—* -o-o \
\
o * o
o o o
I?3 -YK
B
27-9
4
00
seem;
30 • • o II
_ k
000
>o

C-120
Graphs from Table B.IO Z2 -1.0 m Data
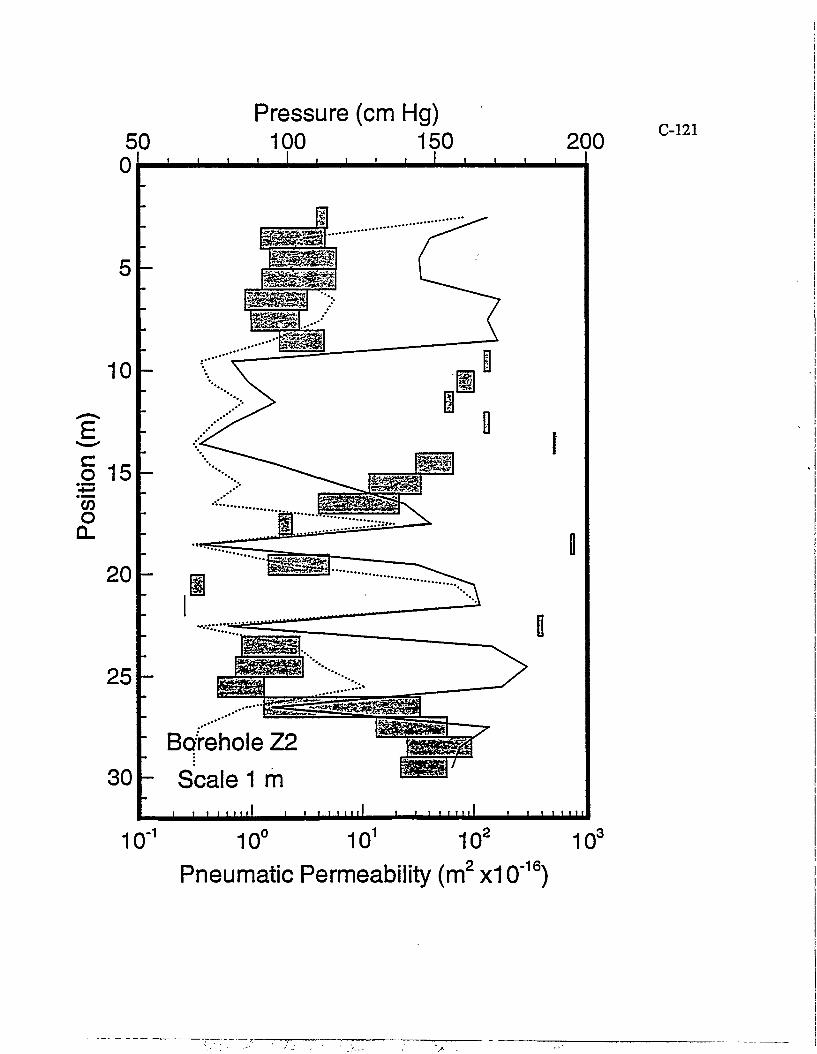
50 Pressure (cm Hg)
100 150 200 _i i i i_ 1
5 -
BqVehole Z2 Scale 1 m
• • • " " j * " i n i ' ' ' " ' • ' • • ' "
10"1 10° 101 102 103
Pneumatic Permeability (m 2 x10"16)
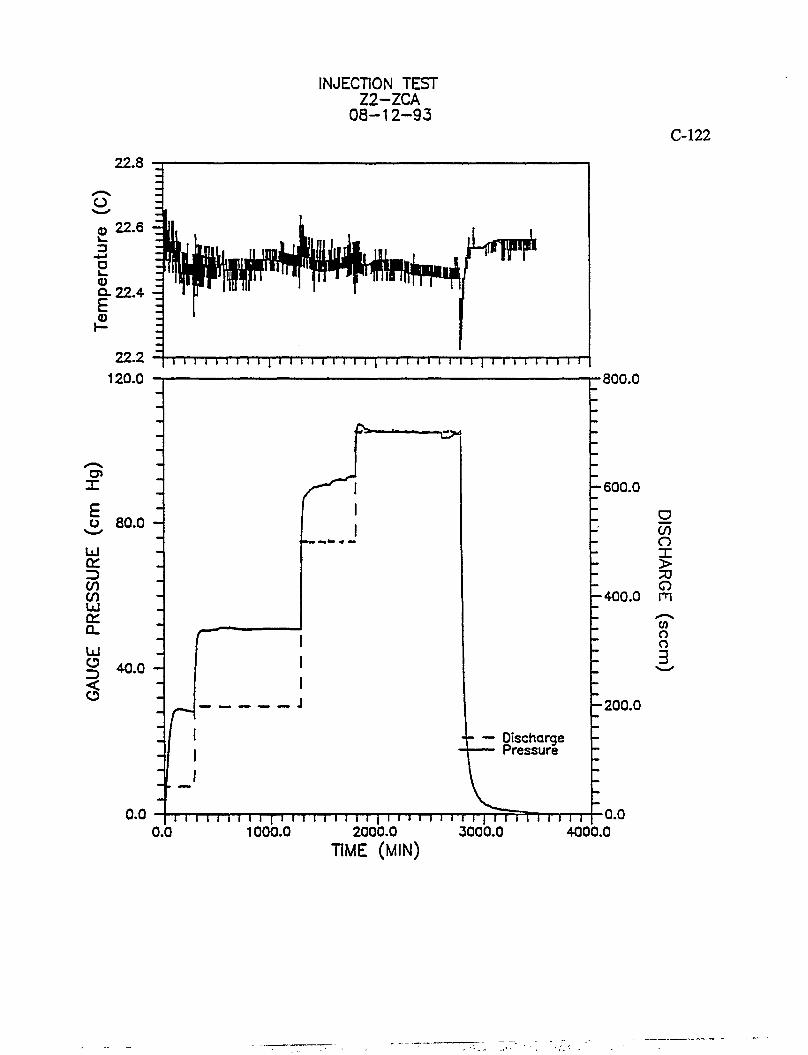
INJECTION TEST Z2-ZCA
08-12-93 C-122
22.8
X
o 80.0
rr CO CO bJ Q: Q. UJ O
5 40.0 -
£*-
Discharge Pressure
o.o 1 1 1 1 1 1 1 1 1 1 1 1 i i 1 1 1 1 1 1 1 1 1 I I 111 > i | T T m 11 T T
•800.0
-600.0 a CO o X > a
•400.0 m
CO o o 3
- 200 .0
•0.0 0.0 1000.0 2000.0 3000.0
TIME (MIN) 4000.0
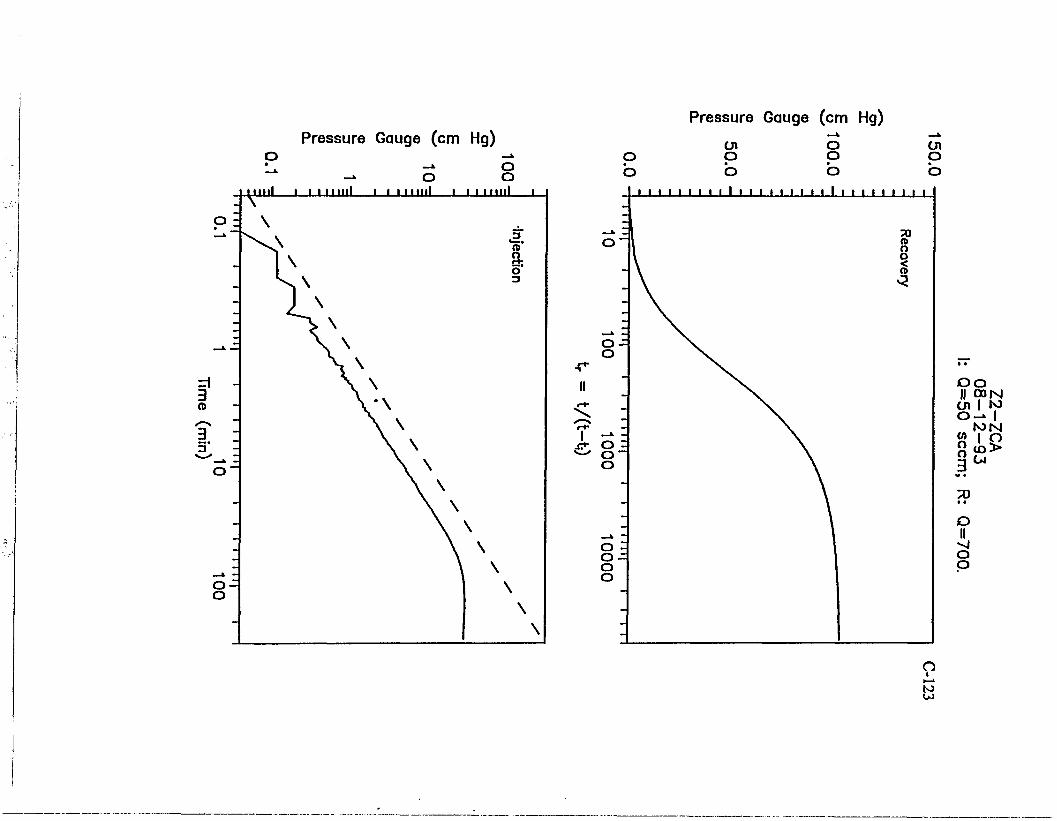
Pressure Gauge (cm Hg) Pressure Gauge (cm Hg)
O O II <»N
Ul K> o - l , N5N S? 1 o o « o > 3 U
70 • t
O II
->J o o
o I I — * to
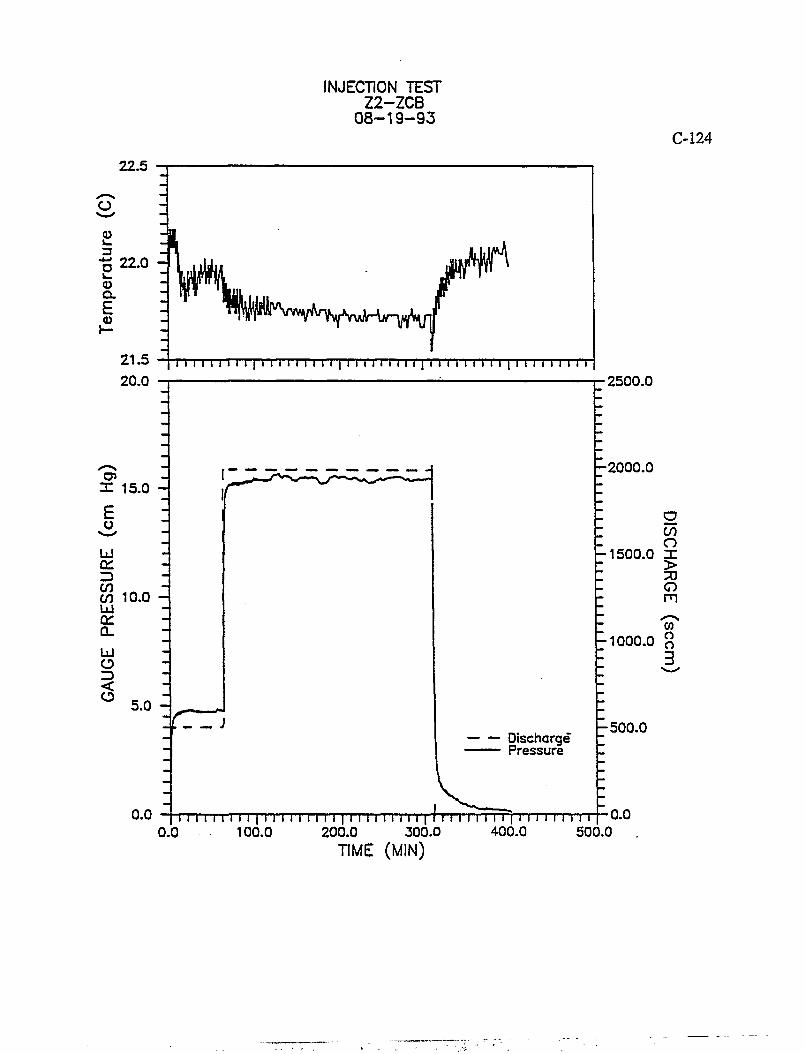
INJECTION TEST Z2-ZCB
08-19-93 C-124
22.5
O
<D 3
22.0 -
a. E
21.5 20.0
I I I I I I I I I | I I' I I I I I I l | I I I I I I I I I | I i I I I I I I I | ! I I I I I I I I
X 15.0
E o
QC
CO 10.0 UJ or a. UJ
o <
5.0 -
0.0
•2500.0
-2000 .0
O CO O
1500.0 X > O m
•1000.0 ^
Discharge Pressure
- 5 0 0 . 0
+ 1111 11111111111111111111111111f r111 11 111 i I I 111111 0.0 100.0 200.0 300.0 400.0 500.0
0.0
TIME (MIN)

Pressure Gouge (cm Hg) Pressure Gauge (cm Hg) p en p en b b b b
1 1 1 1 1 t i l l 1 1 1 1 1 1 1 1 1 1 1 1 1 1 1 1
o ~
Recovery
—» -o -o
O :
o~ o
-
o o || COM cn I to O-* I O l O N « to co
GJ
70 • • O II M O O O
O i
i—i to
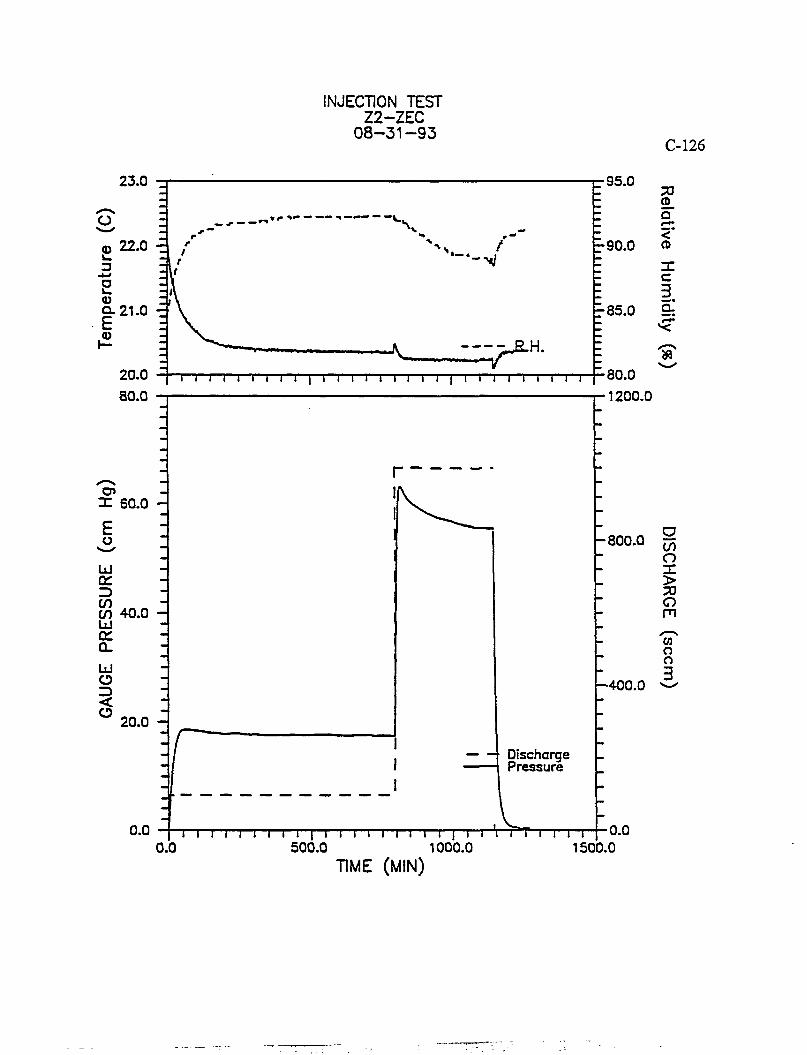
INJECTION TEST Z2-ZEC
08-31-93 C-126
23.0
20.0 80.0
" \ .
' W ' • - H /
A I^H-i i i i i i i i i I i i i i i i i i i I i i i i i i i i i
•95.0 70 2. o
•90.0 » X C 3.
r85.0 9:
M
X 60.0
£ o
Ld CC
CO 4 0 . 0 Ld 01 a. u o <
20.0 -
-800 .0 rx
Discharge Pressure
0.0 ( i i i i i i t i r~] i i i i i i i i i i i i i r t 0.0 500.0 1000.0
TIME (MIN)
•80.0 •1200.0
-400 .0
a CO o X > o m CO o o 3
•0.0 1500.0
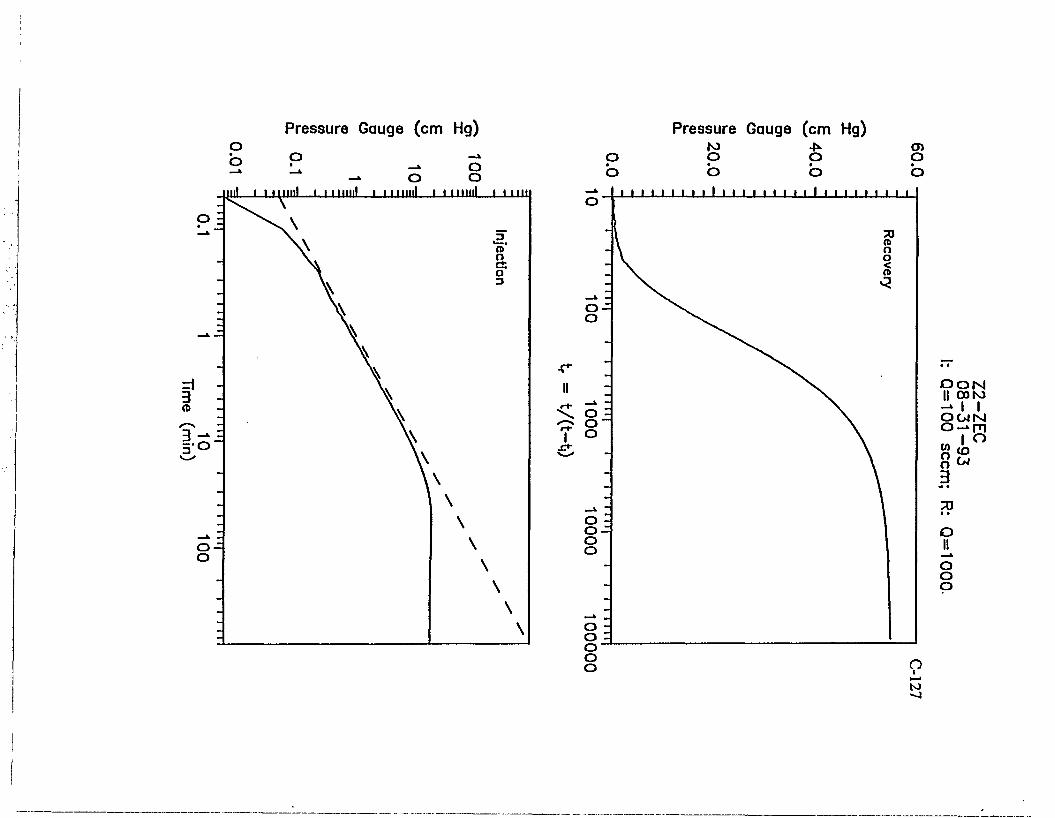
o o
Pressure Gauge (cm Hg)
-» o o i mini I.I mini i i mini i i mini i i mil
Pressure Gauge (cm Hg)
O O N II oo to -*• I I O W N o-*rn
I o o ^ 3 70 • • o II o o o
to
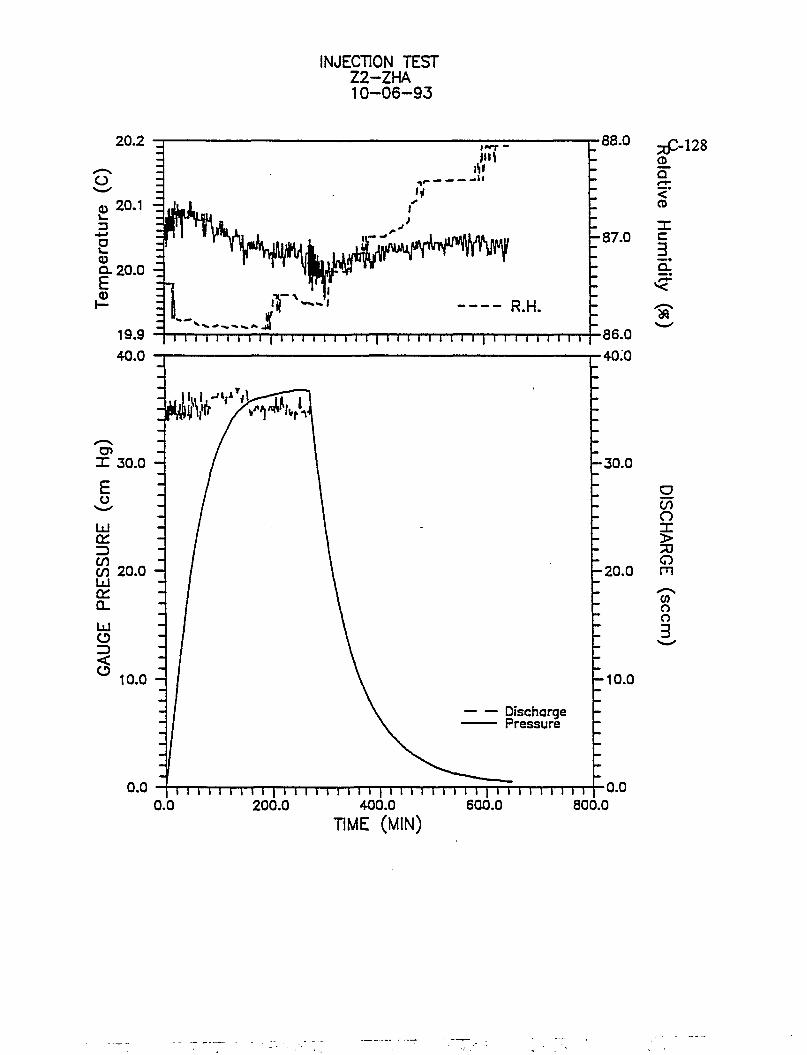
INJECTION TEST Z2-ZHA 10-06-93
20.2 -j 88.0
-10.0
0-0 [ I I I I I I I I l | I I I I M M I | I I l l l I I i I | I I l I M I I I 0.0 200.0 400.0 600.0
TIME (MIN) 800.0
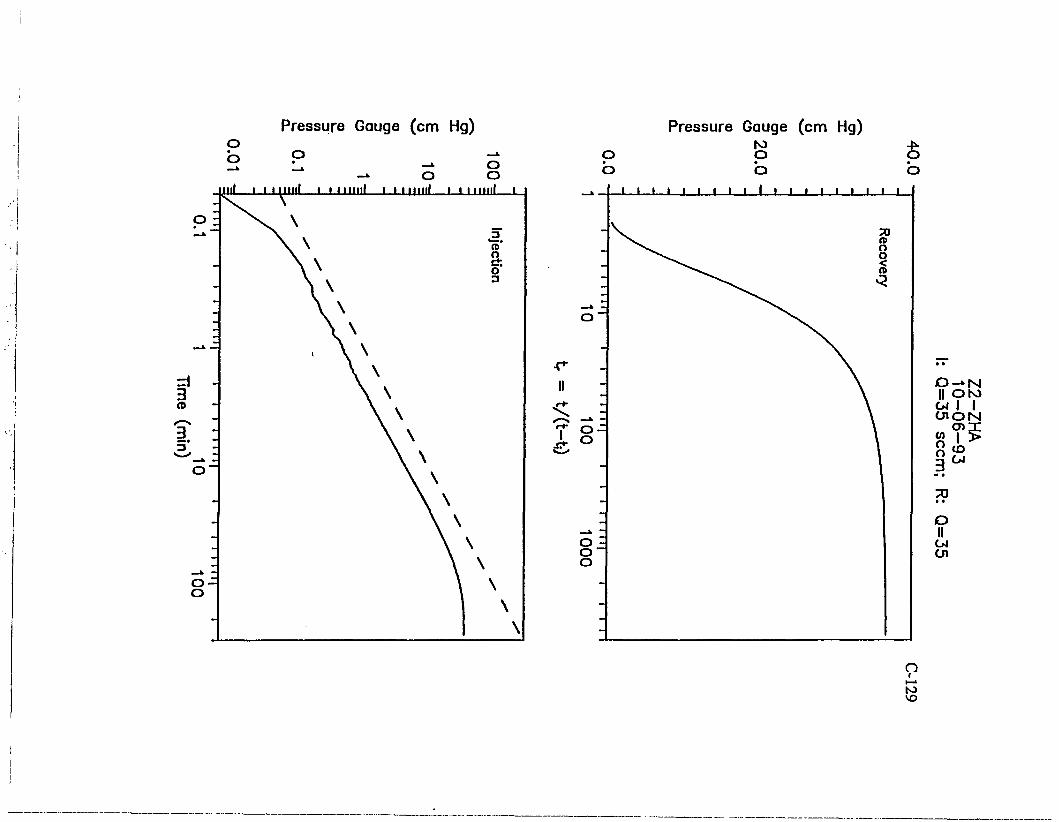
Pressure Gauge (cm Hg) Pressure Gauge (cm Hg) o o
o o
II
I
0 - * N || OK> OJ I I OION
O i l
8 15: o ID
73 • • O II
n 1
to
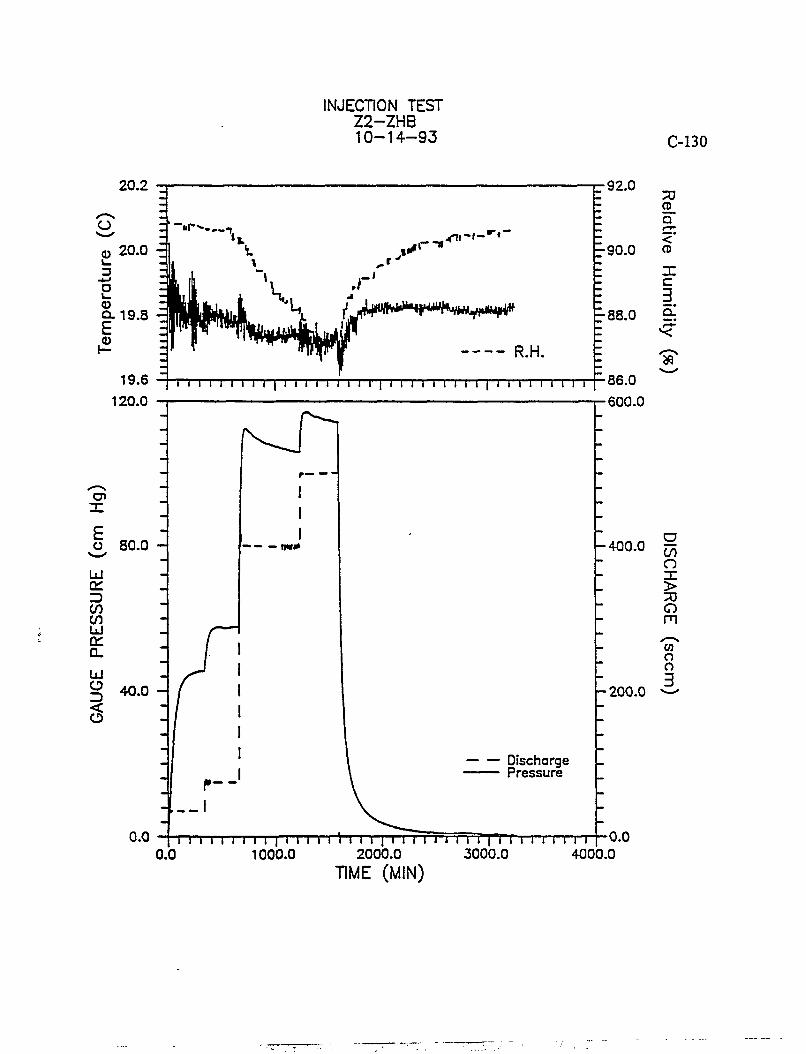
INJECTION TEST Z2-ZHB 10-14-93 C-130
20.2 •92.0 7Q
a
•90.0 <o X c 3.
=•88.0 9-!
»
O
E o
bJ or en en LU a. Ld o <
80.0 -
40.0 -
— — — n«* -400 .0 77
Discharge Pressure
0-0 1 1 I I l l I I I l | l I I l l i l l I | l i T l t t I l i | I I i I i I I i I | 0.0 0.0 1000.0 2000.0 3000.0 4000.0
•86.0 •600.0
en o X > o m w o o
-200 .0
TIME (MIN)

Pressure Gauge (cm Hg) Pressure Gauge (cm Hg)
01 o o • • o o
o o o
sr
1 1 1 1 1 1 1 1 1 1 1 1 1 1 1 1 1 1 1 1 1 1 1 1 1 1 1
—A
2
Recovery
O
-
O o
_ i
000
—X
0000
-
O —X N II ON3 CJ 1 1 Ol —» N
•i^rn seem;
-93
m
7Q • • o II Ol o o
n
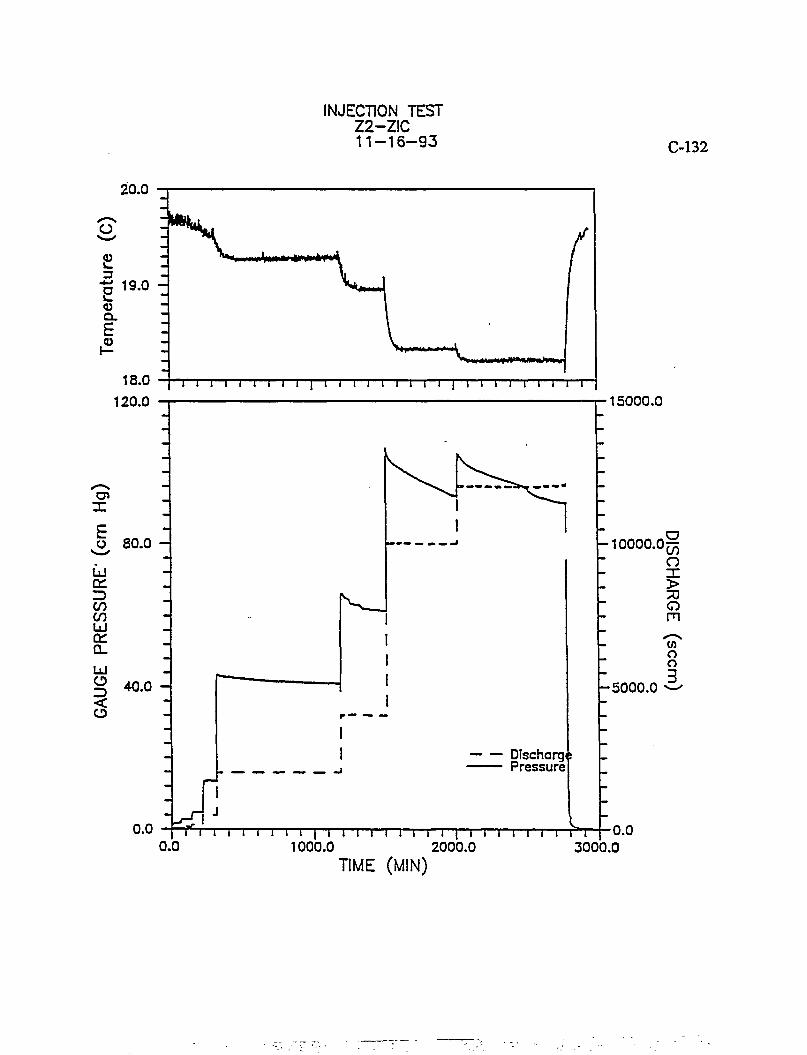
INJECTION TEST Z2-ZIC 11-16-93 C-132
20.0 :
"§ 19.0 -
Q.
£ l>MMfc» I " ill
• «»iilH|»WmW»)>»»w
•8.0 | i i i i i i i i i j i I i i i I i i i i i I k I I I I i I 120.0
X
^ 80.0
til rr Z> CO CO bJ or 0_ g 40.0 5
•15000.0
0.0
Discharg Pressure
•10000.0^ O X > TO o m
o o 3 -5000 .0
^» 0.0
~i i I i i i i i r~i i i i" i n i i r~T i i i i i i r~T 1000.0 2000.0
TIME (MIN)
•0.0 3000.0
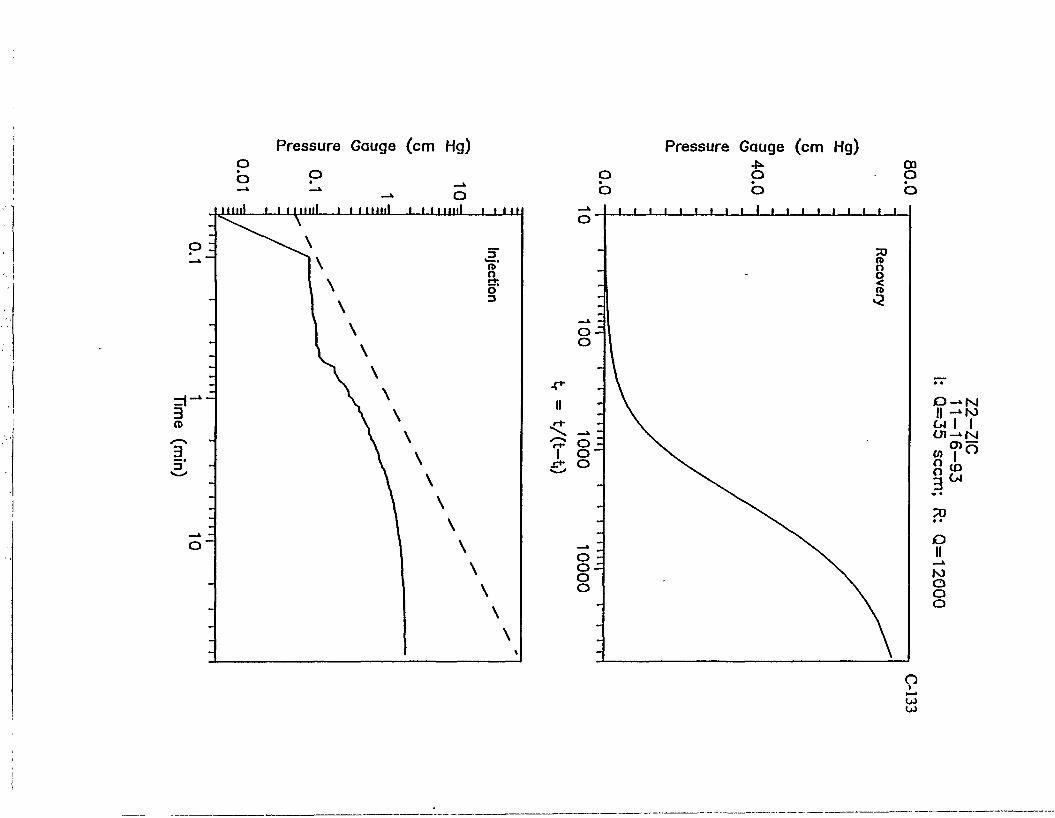
Pressure Gauge (cm Hg) p b
mil , i i mini i i i mill ' ' " " " I • ' '» '
3 at
IT 3*
Pressure Gauge (cm Hg)
o o
o p b
o I
to
0 - * N II - * M OJ I I
W I " CD
3) • • o II —* to o o o
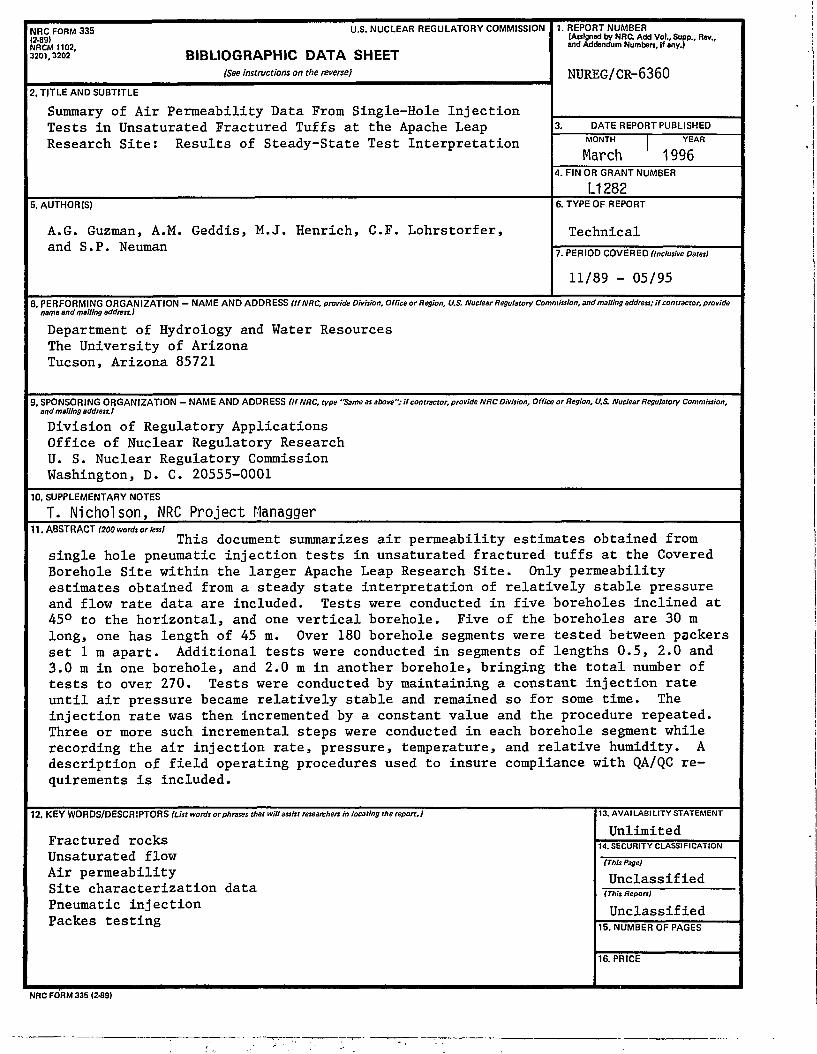
NRC FORM 335 U.S. NUCLEAR REGULATORY COMMISSION (2.89)
wn^rn' BIBLIOGRAPHIC DATA SHEET (See instructions on the reverse)
1. REPORT NUMBER (Anljned by NRC. Add Vol., Supp., Rev., and Addendum Numbers, if any.)
NUREG/CR-6360 2. TITLE AND SUBTITLE
Summary of Air Permeability Data From Single-Hole Injection Tests in Unsaturated Fractured Tuffs at the Apache Leap Research S i t e : Results of Steady-State Test In te rpre ta t ion
2. TITLE AND SUBTITLE
Summary of Air Permeability Data From Single-Hole Injection Tests in Unsaturated Fractured Tuffs at the Apache Leap Research S i t e : Results of Steady-State Test In te rpre ta t ion
3. DATE REPORT PUBLISHED
2. TITLE AND SUBTITLE
Summary of Air Permeability Data From Single-Hole Injection Tests in Unsaturated Fractured Tuffs at the Apache Leap Research S i t e : Results of Steady-State Test In te rpre ta t ion MONTH 1 YEAR
March 1996
2. TITLE AND SUBTITLE
Summary of Air Permeability Data From Single-Hole Injection Tests in Unsaturated Fractured Tuffs at the Apache Leap Research S i t e : Results of Steady-State Test In te rpre ta t ion
4. FIN OR GRANT NUMBER
L1282 5. AUTHOR(S)
A.G. Guzman, A.M. Geddis, M.J. Henrich, C.F. Lohrstorfer, and S.P. Neuman
6. TYPE OF REPORT
Technical
5. AUTHOR(S)
A.G. Guzman, A.M. Geddis, M.J. Henrich, C.F. Lohrstorfer, and S.P. Neuman 7. PERIOD COVERED (Inclusive Dates)
11/89 - 05/95 8, PERFORMING ORGANIZATION — NAME AND ADDRESS (If NRC, provide Division, Office or Region, U.S. Nuclear Regulatory Commission, and mailing address; if contractor, provide
name and mailing address.)
Department of Hydrology and Water Resources The University of Arizona Tucson, Arizona 85721
9, SPONSORING ORGANIZATION - NAME AND ADDRESS (If NRC. type "Same as above"; if contractor, provide NRC Division, Office or Region. U.S. Nuclear Regulatory Commission, and mailing address.1
Division of Regulatory Applications Office of Nuclear Regulatory Research U. S. Nuclear Regulatory Commission Washington, D. C. 20555-0001
10, SUPPLEMENTARY NOTES
T. Nicholson, NRC Project Managger 11. ABSTRACT (200 words or less)
This document summarizes a i r permeability estimates obtained from single hole pneumatic inject ion t e s t s in unsaturated fractured tuffs a t the Covered Borehole Si te within the larger Apache Leap Research S i t e . Only permeability estimates obtained from a steady s t a t e in te rpre ta t ion of r e l a t i ve ly s table pressure and flow ra te data are included. Tests were conducted in five boreholes inclined at 45° to the hor izonta l , and one v e r t i c a l borehole. Five of the boreholes are 30 m long, one has length of 45 m. Over 180 borehole segments were tested between packers set 1 m apar t . Additional t e s t s were conducted in segments of lengths 0 .5 , 2.0 and 3.0 m in one borehole, and 2.0 m in another borehole, bringing the t o t a l number of t e s t s to over 270. Tests were conducted by maintaining a constant in ject ion r a t e u n t i l a i r pressure became r e l a t ive ly s table and remained so for some time. The inject ion ra te was then incremented by a constant value and the procedure repeated. Three or more such incremental steps were conducted in each borehole segment while recording the a i r inject ion r a t e , pressure, temperature, and r e l a t i ve humidity. A descript ion of f ie ld operating procedures used to insure compliance with QA/QC r e quirements i s included.
12. K E Y WO R DS/D ESCR! PTO R S (List words or phrases that will assist researchers in locating the report. 1
Fractured rocks Unsaturated flow Air permeability Si te character izat ion data Pneumatic inject ion Packes tes t ing
13. AVAILABILITY STATEMENT
Unlimited 12. K E Y WO R DS/D ESCR! PTO R S (List words or phrases that will assist researchers in locating the report. 1
Fractured rocks Unsaturated flow Air permeability Si te character izat ion data Pneumatic inject ion Packes tes t ing
14. SECURITY CLASSIFICATION
12. K E Y WO R DS/D ESCR! PTO R S (List words or phrases that will assist researchers in locating the report. 1
Fractured rocks Unsaturated flow Air permeability Si te character izat ion data Pneumatic inject ion Packes tes t ing
(This Page!
Unclassified
12. K E Y WO R DS/D ESCR! PTO R S (List words or phrases that will assist researchers in locating the report. 1
Fractured rocks Unsaturated flow Air permeability Si te character izat ion data Pneumatic inject ion Packes tes t ing
(This Report!
Unclassified
12. K E Y WO R DS/D ESCR! PTO R S (List words or phrases that will assist researchers in locating the report. 1
Fractured rocks Unsaturated flow Air permeability Si te character izat ion data Pneumatic inject ion Packes tes t ing 15. NUMBER OF PAGES
16. PRICE
NRC FORM 335 (2-89)