Embed Size (px)
Citation preview
Summary of ecosystem services & biodiversity assessmentsInforming integrated actions plans
Objectives of assessments
• Highland aquatic resources and ecosystem services assessed in consultation with stakeholders at the five sites
• Indicators of ecosystem services and biodiversity values developed with stakeholders for participatory monitoring
• Provide scientific data to inform potential management options (integrated action plans) to promote conservation, sustain ecosystem services, resolve conflicts and ensure sustainable and wise‐use of highland aquatic resources at the 5 project sites
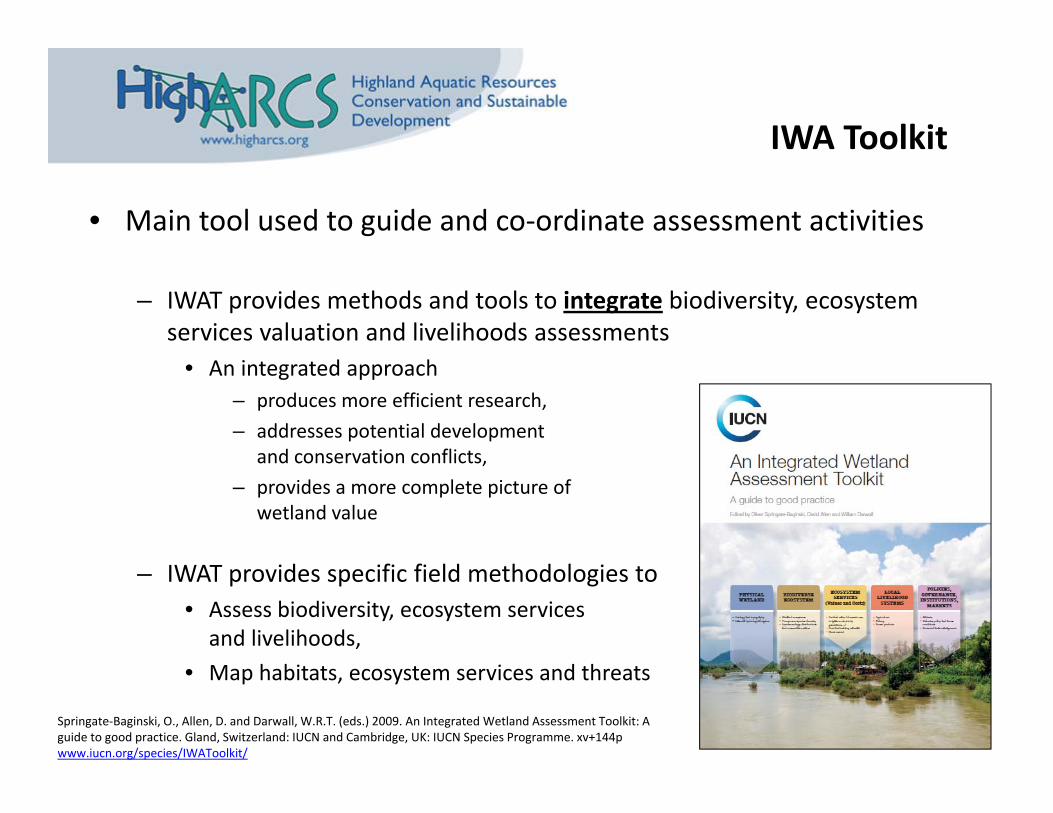
IWA Toolkit
• Main tool used to guide and co‐ordinate assessment activities
– IWAT provides methods and tools to integrate biodiversity, ecosystem services valuation and livelihoods assessments
• An integrated approach– produces more efficient research, – addresses potential development
and conservation conflicts, – provides a more complete picture of
wetland value
– IWAT provides specific field methodologies to • Assess biodiversity, ecosystem servicesand livelihoods,
• Map habitats, ecosystem services and threats
Springate‐Baginski, O., Allen, D. and Darwall, W.R.T. (eds.) 2009. An Integrated Wetland Assessment Toolkit: A guide to good practice. Gland, Switzerland: IUCN and Cambridge, UK: IUCN Species Programme. xv+144p www.iucn.org/species/IWAToolkit/
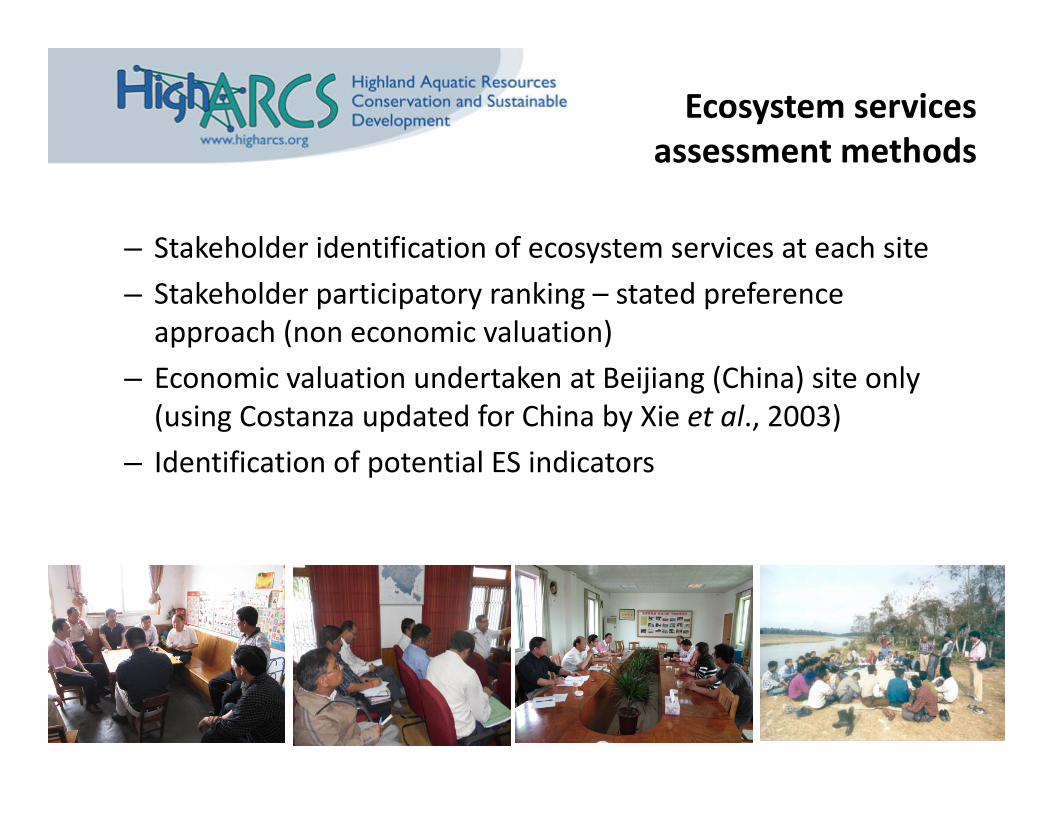
Ecosystem services assessment methods
– Stakeholder identification of ecosystem services at each site– Stakeholder participatory ranking – stated preference approach (non economic valuation)
– Economic valuation undertaken at Beijiang (China) site only (using Costanza updated for China by Xie et al., 2003)
– Identification of potential ES indicators

Ecosystem services results
Values between sites
• ES identified by all sites:– Daily water use– Subsistence fishing– Water purification– Tourism– Education
• High value (score 6+ by 4+ sites)– Daily water use– Water purification– Education
• Similar value between sites:– Water for livestock– Agricultural water supply– Hydropower– Spiritual– Aesthetic
Ecosystem services results
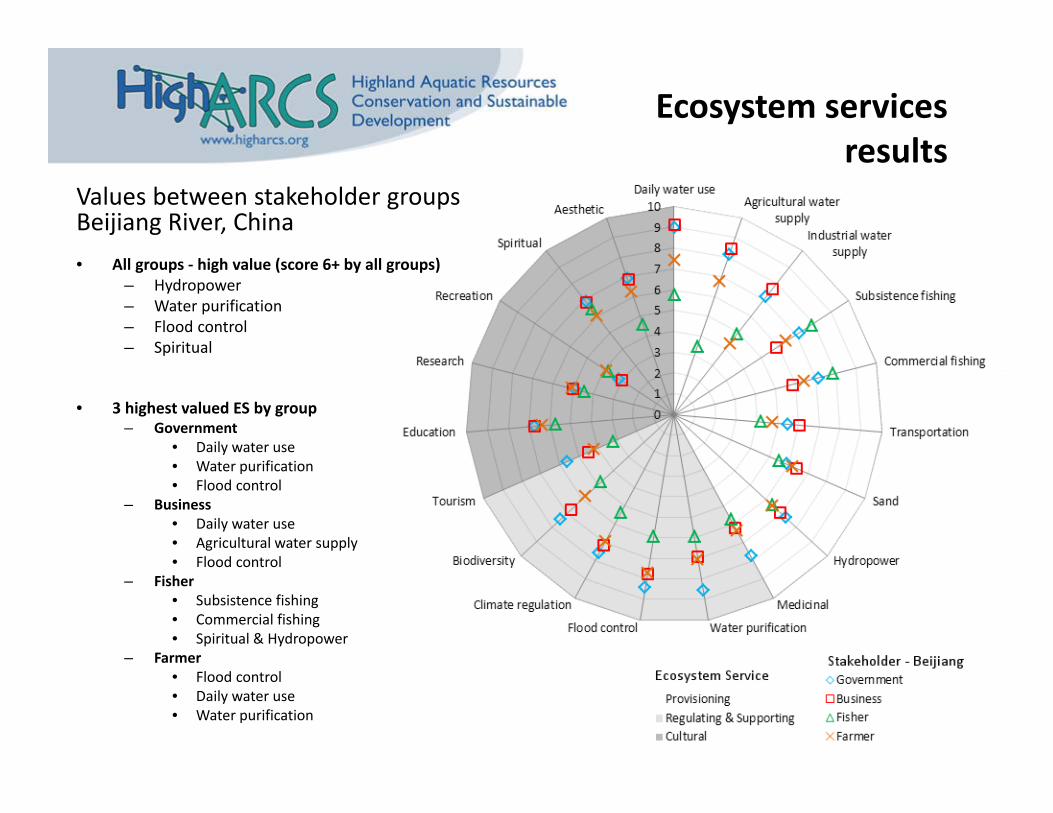
Values between stakeholder groupsBeijiang River, China• All groups ‐ high value (score 6+ by all groups)
– Hydropower– Water purification– Flood control– Spiritual
• 3 highest valued ES by group– Government
• Daily water use• Water purification• Flood control
– Business • Daily water use• Agricultural water supply• Flood control
– Fisher • Subsistence fishing• Commercial fishing• Spiritual & Hydropower
– Farmer• Flood control• Daily water use• Water purification
Ecosystem services results
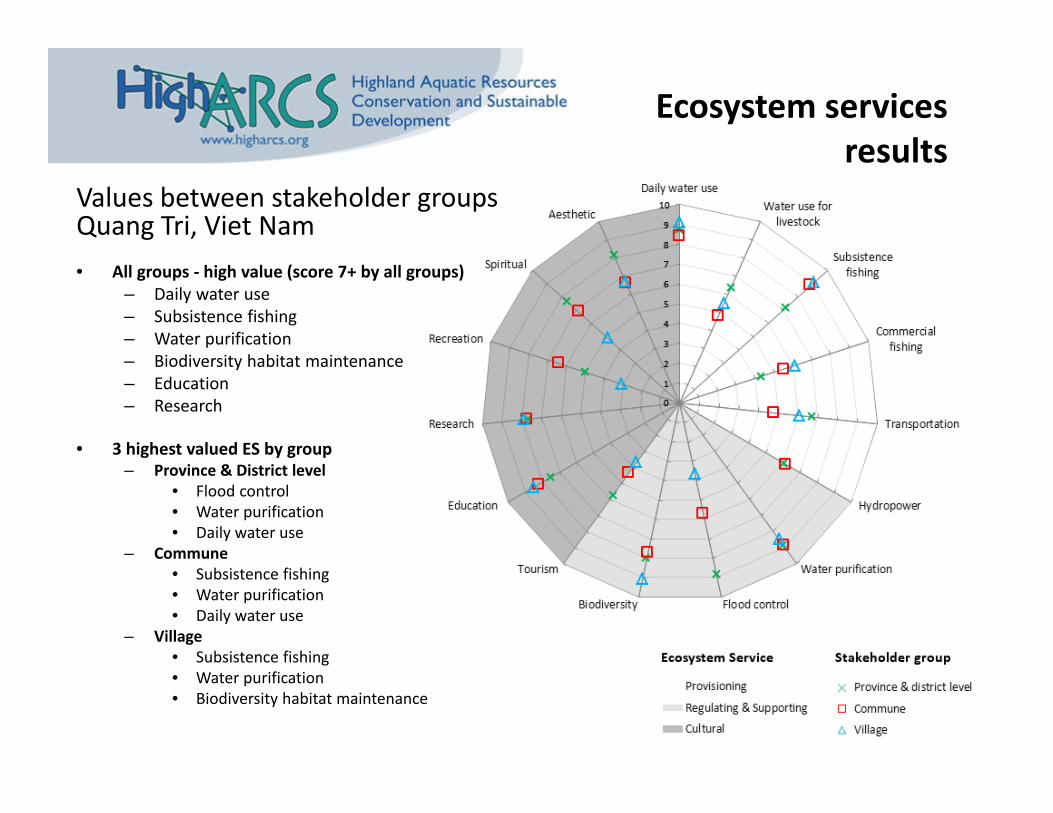
Values between stakeholder groupsQuang Tri, Viet Nam• All groups ‐ high value (score 7+ by all groups)
– Daily water use– Subsistence fishing– Water purification– Biodiversity habitat maintenance– Education– Research
• 3 highest valued ES by group– Province & District level
• Flood control• Water purification• Daily water use
– Commune• Subsistence fishing• Water purification• Daily water use
– Village• Subsistence fishing• Water purification• Biodiversity habitat maintenance
Ecosystem services results
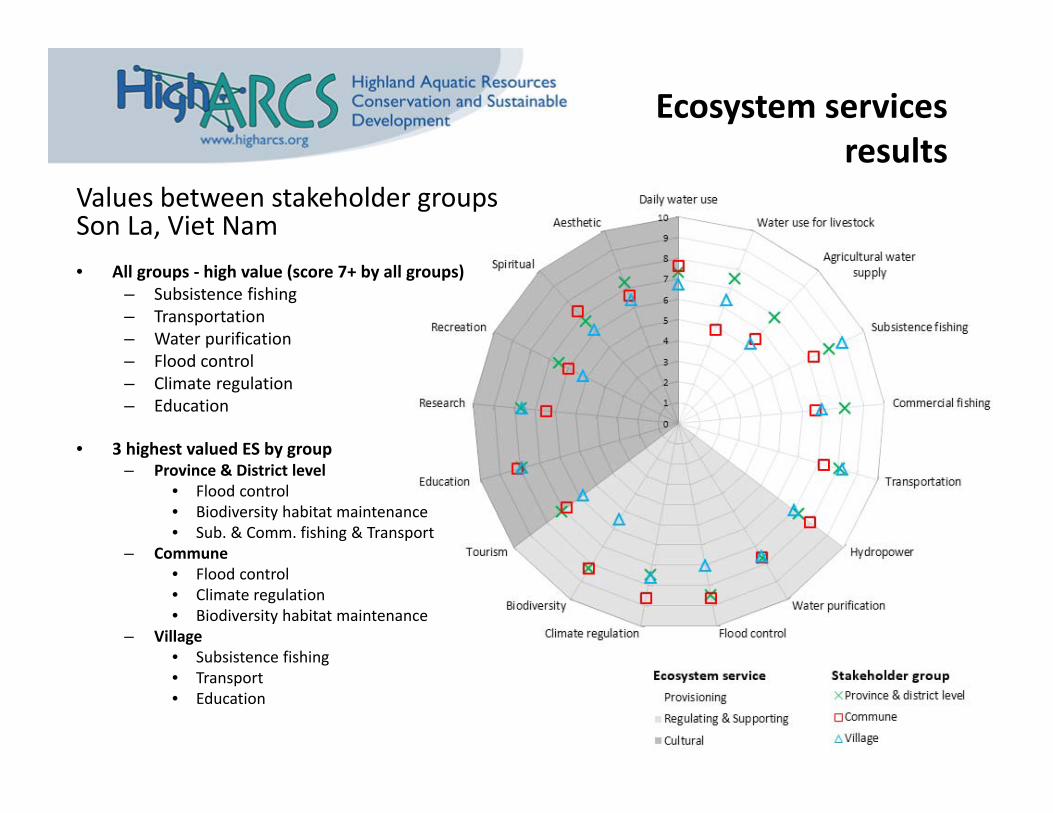
Values between stakeholder groupsSon La, Viet Nam• All groups ‐ high value (score 7+ by all groups)
– Subsistence fishing– Transportation– Water purification– Flood control– Climate regulation– Education
• 3 highest valued ES by group– Province & District level
• Flood control• Biodiversity habitat maintenance• Sub. & Comm. fishing & Transport
– Commune• Flood control• Climate regulation• Biodiversity habitat maintenance
– Village• Subsistence fishing• Transport• Education
Economic valuation
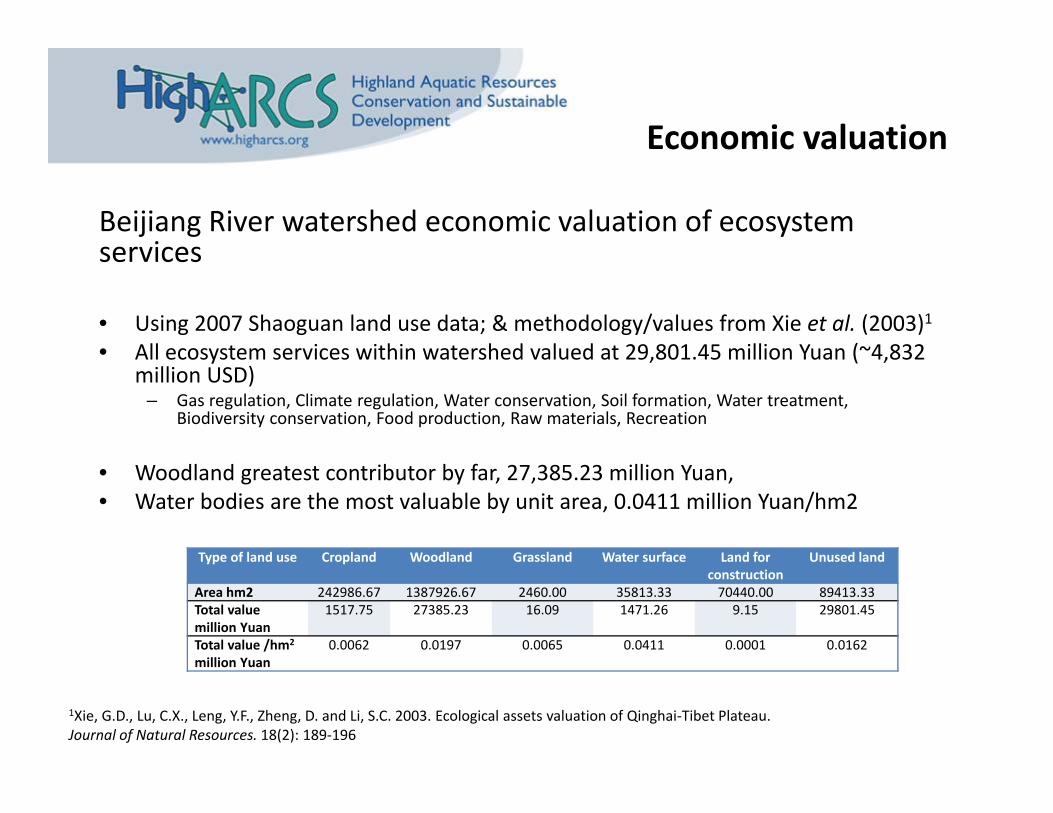
Beijiang River watershed economic valuation of ecosystem services
• Using 2007 Shaoguan land use data; & methodology/values from Xie et al. (2003)1• All ecosystem services within watershed valued at 29,801.45 million Yuan (~4,832
million USD) – Gas regulation, Climate regulation, Water conservation, Soil formation, Water treatment,
Biodiversity conservation, Food production, Raw materials, Recreation
• Woodland greatest contributor by far, 27,385.23 million Yuan, • Water bodies are the most valuable by unit area, 0.0411 million Yuan/hm2
Type of land use Cropland Woodland Grassland Water surface Land for construction
Unused land
Area hm2 242986.67 1387926.67 2460.00 35813.33 70440.00 89413.33Total valuemillion Yuan
1517.75 27385.23 16.09 1471.26 9.15 29801.45
Total value /hm2
million Yuan 0.0062 0.0197 0.0065 0.0411 0.0001 0.0162
1Xie, G.D., Lu, C.X., Leng, Y.F., Zheng, D. and Li, S.C. 2003. Ecological assets valuation of Qinghai‐Tibet Plateau. Journal of Natural Resources. 18(2): 189‐196
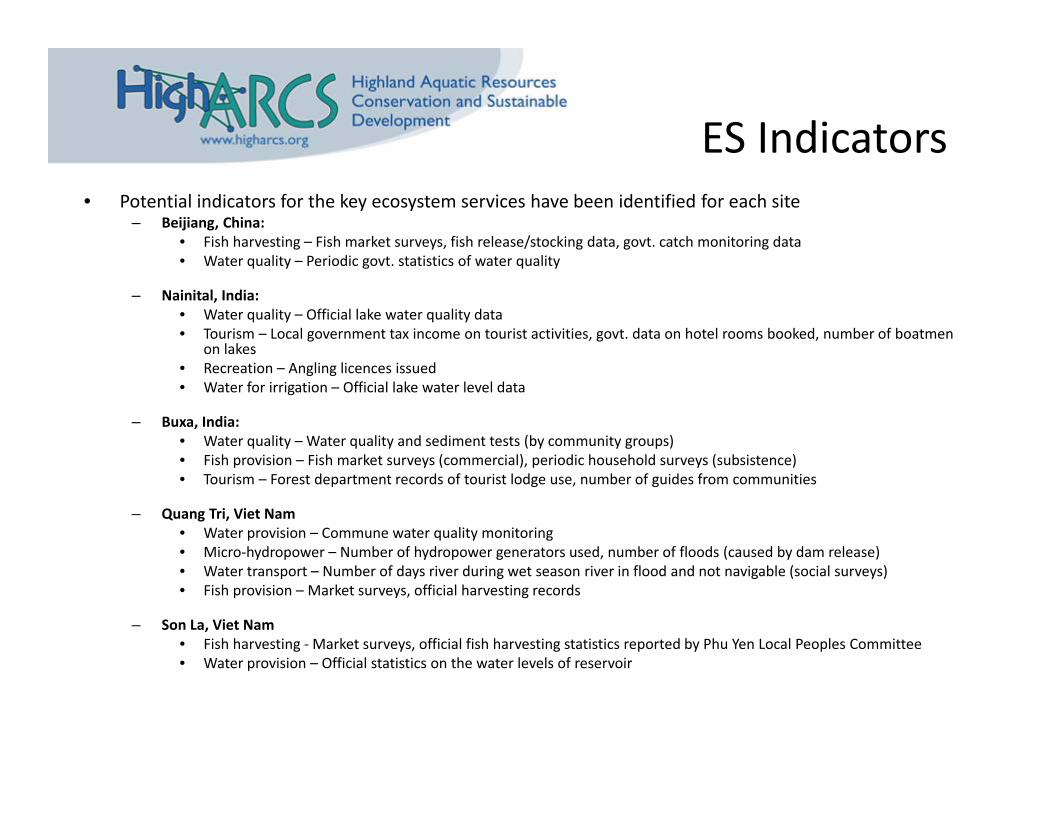
ES Indicators• Potential indicators for the key ecosystem services have been identified for each site
– Beijiang, China:• Fish harvesting – Fish market surveys, fish release/stocking data, govt. catch monitoring data• Water quality – Periodic govt. statistics of water quality
– Nainital, India:• Water quality – Official lake water quality data• Tourism – Local government tax income on tourist activities, govt. data on hotel rooms booked, number of boatmen
on lakes• Recreation – Angling licences issued• Water for irrigation – Official lake water level data
– Buxa, India:• Water quality – Water quality and sediment tests (by community groups)• Fish provision – Fish market surveys (commercial), periodic household surveys (subsistence)• Tourism – Forest department records of tourist lodge use, number of guides from communities
– Quang Tri, Viet Nam• Water provision – Commune water quality monitoring• Micro‐hydropower – Number of hydropower generators used, number of floods (caused by dam release)• Water transport – Number of days river during wet season river in flood and not navigable (social surveys)• Fish provision – Market surveys, official harvesting records
– Son La, Viet Nam• Fish harvesting ‐Market surveys, official fish harvesting statistics reported by Phu Yen Local Peoples Committee• Water provision – Official statistics on the water levels of reservoir
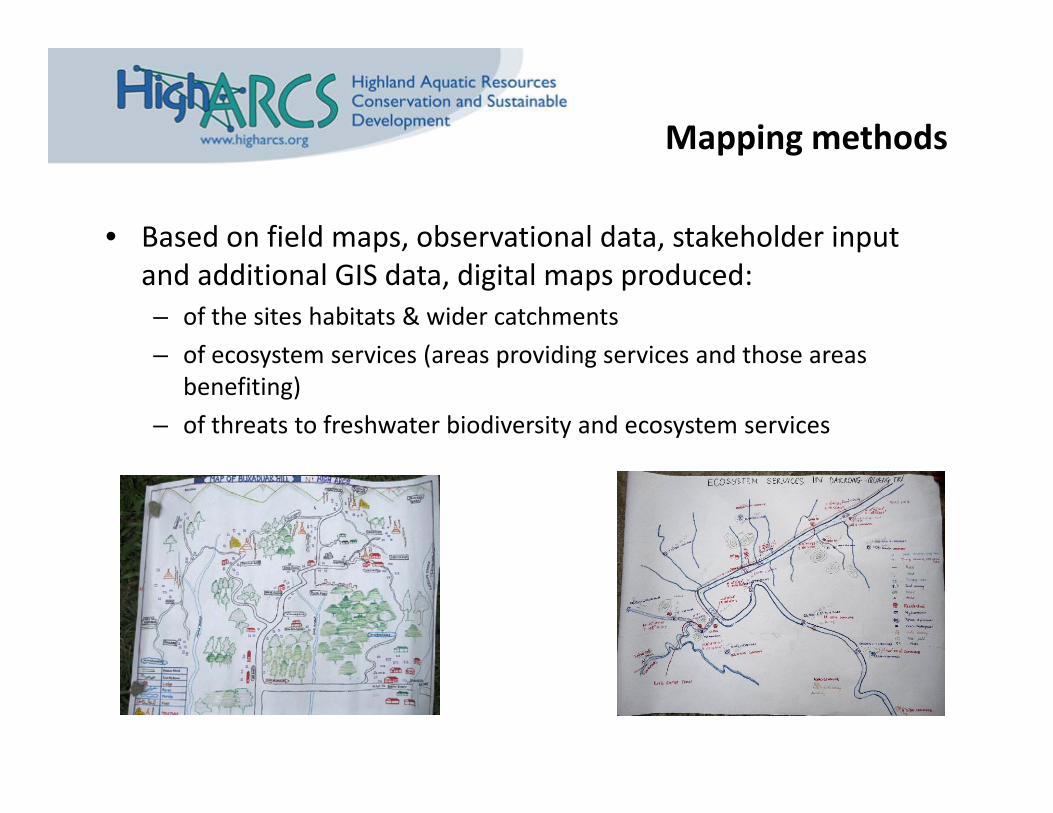
Mapping methods
• Based on field maps, observational data, stakeholder input and additional GIS data, digital maps produced:– of the sites habitats & wider catchments– of ecosystem services (areas providing services and those areas
benefiting)– of threats to freshwater biodiversity and ecosystem services
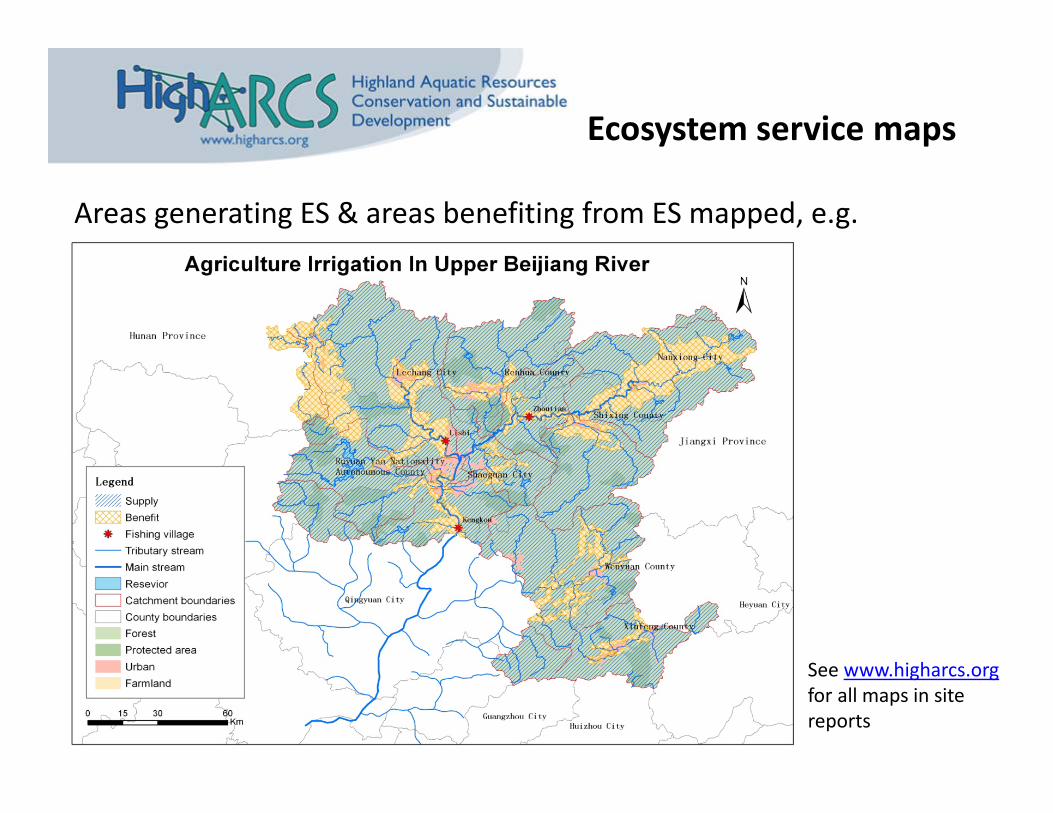
Areas generating ES & areas benefiting from ES mapped, e.g.
Ecosystem service maps
See www.higharcs.orgfor all maps in site reports
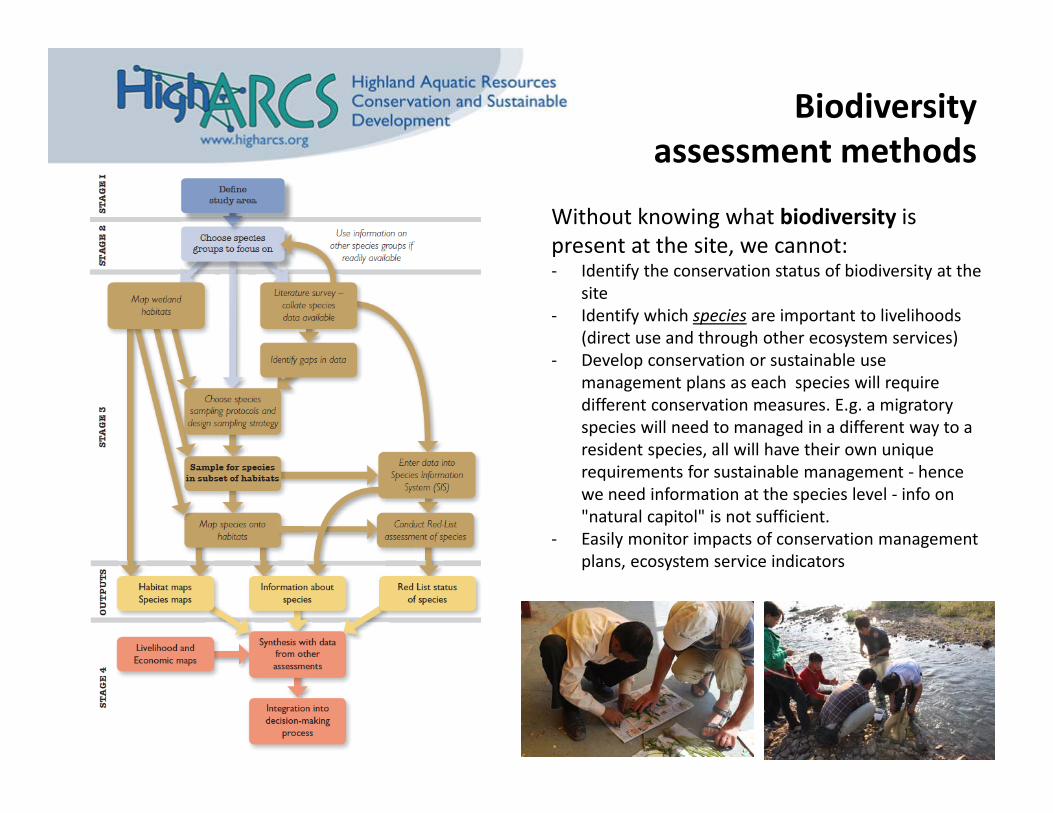
Biodiversity assessment methods
Without knowing what biodiversity is present at the site, we cannot:‐ Identify the conservation status of biodiversity at the
site‐ Identify which species are important to livelihoods
(direct use and through other ecosystem services)‐ Develop conservation or sustainable use
management plans as each species will require different conservation measures. E.g. a migratory species will need to managed in a different way to a resident species, all will have their own unique requirements for sustainable management ‐ hence we need information at the species level ‐ info on "natural capitol" is not sufficient.
‐ Easily monitor impacts of conservation management plans, ecosystem service indicators
Biodiversity results
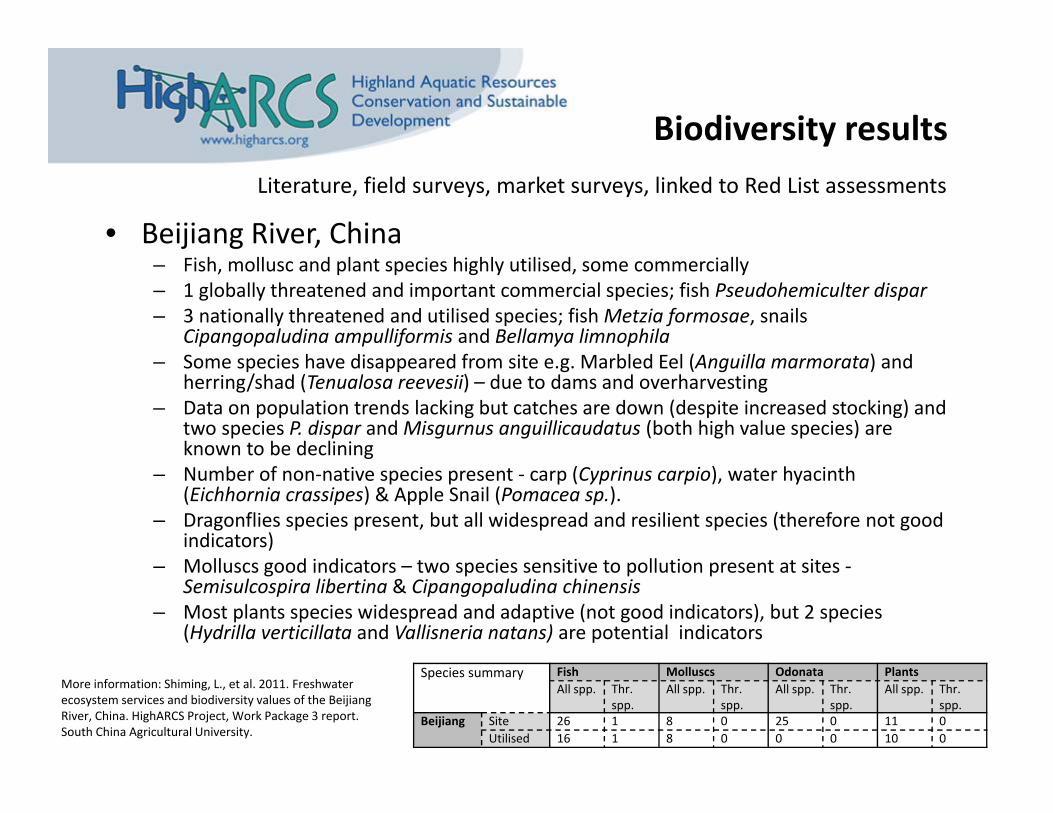
• Beijiang River, China – Fish, mollusc and plant species highly utilised, some commercially– 1 globally threatened and important commercial species; fish Pseudohemiculter dispar– 3 nationally threatened and utilised species; fish Metzia formosae, snails
Cipangopaludina ampulliformis and Bellamya limnophila– Some species have disappeared from site e.g. Marbled Eel (Anguilla marmorata) and
herring/shad (Tenualosa reevesii) – due to dams and overharvesting– Data on population trends lacking but catches are down (despite increased stocking) and
two species P. dispar and Misgurnus anguillicaudatus (both high value species) are known to be declining
– Number of non‐native species present ‐ carp (Cyprinus carpio), water hyacinth (Eichhornia crassipes) & Apple Snail (Pomacea sp.).
– Dragonflies species present, but all widespread and resilient species (therefore not good indicators)
– Molluscs good indicators – two species sensitive to pollution present at sites ‐Semisulcospira libertina & Cipangopaludina chinensis
– Most plants species widespread and adaptive (not good indicators), but 2 species (Hydrilla verticillata and Vallisneria natans) are potential indicators
Species summary Fish Molluscs Odonata PlantsAll spp. Thr.
spp.All spp. Thr.
spp.All spp. Thr.
spp.All spp. Thr.
spp.Beijiang Site 26 1 8 0 25 0 11 0
Utilised 16 1 8 0 0 0 10 0
Literature, field surveys, market surveys, linked to Red List assessments
More information: Shiming, L., et al. 2011. Freshwater ecosystem services and biodiversity values of the BeijiangRiver, China. HighARCS Project, Work Package 3 report. South China Agricultural University.

Biodiversity results
• Nainital, India– 2 globally threatened fish species both utilised Golden Mahseer (Tor putitora) and Snow
Trout (Schizothorax richardsonii)– Utilisation of fish banned in Nainital and highly regulated in Bhimtal and Naukuchiatal– Lakes are stocked with both native and non‐native species– Most molluscs species common and widespread species (some occurring in polluted
waters – not good indicators)– 2 molluscs species declining due to introduce mosquito fish (Gambusia affinis) eating
eggs– Cold water carps good indicator for key threat of eutrophication as sensitive to low
oxygen levels (there have been fish kills in the past). Bivalve species are also a potential indicator species as filter feeders their tissue samples could be used to identify pollutant levels.
Species summary Fish Molluscs PlantsAll spp. Thr.
spp.All spp. Thr.
spp.All spp. Thr.
spp.Nainital Site 42 2 9 0 14 0
Utilised 13 2 0 0 1 0
Literature, field surveys, market surveys, linked to Red List assessments
More information see: Pal, M. and Kundu, N. 2011. Freshwater ecosystem services and biodiversity values at Nainital, Uttrakhand. HighARCS Project Work Package 3 report. Centre For Environmental Management And Participatory Development, and Institute Of Environmental Studies And Wetland Management, Kolkata, India.
Biodiversity results
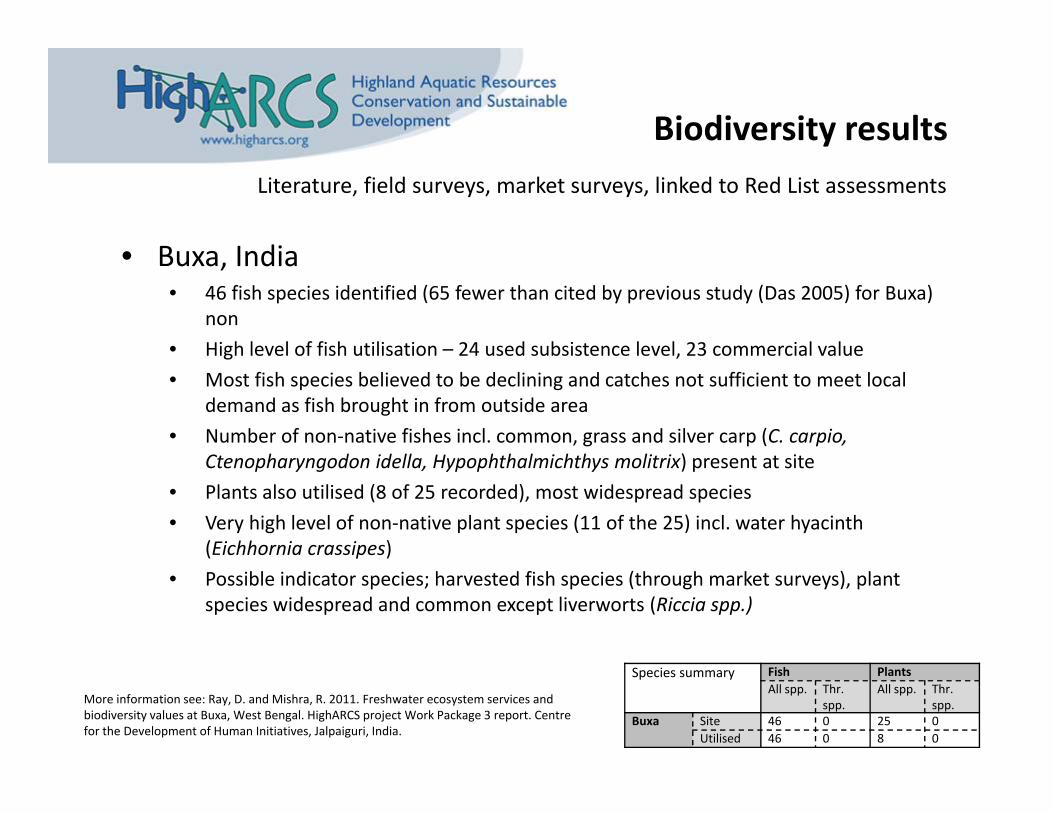
Species summary Fish PlantsAll spp. Thr.
spp.All spp. Thr.
spp.Buxa Site 46 0 25 0
Utilised 46 0 8 0
Literature, field surveys, market surveys, linked to Red List assessments
• Buxa, India• 46 fish species identified (65 fewer than cited by previous study (Das 2005) for Buxa)
non• High level of fish utilisation – 24 used subsistence level, 23 commercial value• Most fish species believed to be declining and catches not sufficient to meet local
demand as fish brought in from outside area• Number of non‐native fishes incl. common, grass and silver carp (C. carpio,
Ctenopharyngodon idella, Hypophthalmichthys molitrix) present at site• Plants also utilised (8 of 25 recorded), most widespread species• Very high level of non‐native plant species (11 of the 25) incl. water hyacinth
(Eichhornia crassipes)• Possible indicator species; harvested fish species (through market surveys), plant
species widespread and common except liverworts (Riccia spp.)
More information see: Ray, D. and Mishra, R. 2011. Freshwater ecosystem services and biodiversity values at Buxa, West Bengal. HighARCS project Work Package 3 report. Centre for the Development of Human Initiatives, Jalpaiguri, India.
Biodiversity results
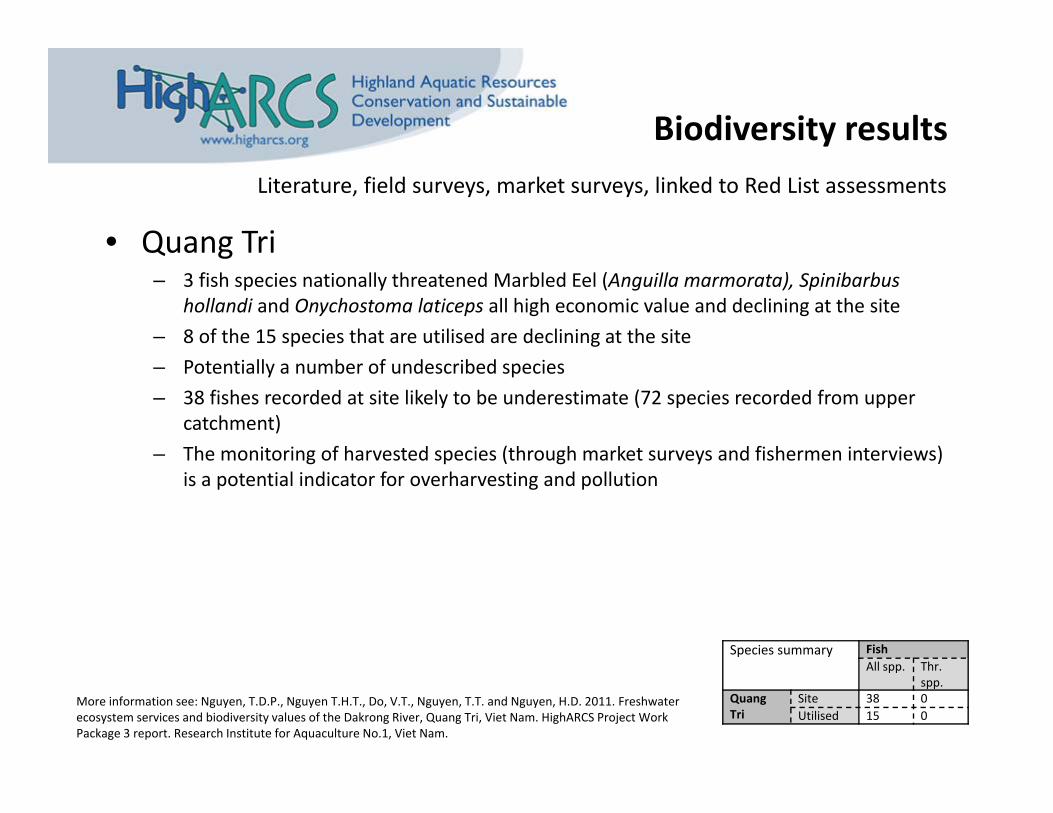
• Quang Tri– 3 fish species nationally threatened Marbled Eel (Anguilla marmorata), Spinibarbus
hollandi and Onychostoma laticeps all high economic value and declining at the site– 8 of the 15 species that are utilised are declining at the site– Potentially a number of undescribed species– 38 fishes recorded at site likely to be underestimate (72 species recorded from upper
catchment)– The monitoring of harvested species (through market surveys and fishermen interviews)
is a potential indicator for overharvesting and pollution
Species summary FishAll spp. Thr.
spp.QuangTri
Site 38 0Utilised 15 0
Literature, field surveys, market surveys, linked to Red List assessments
More information see: Nguyen, T.D.P., Nguyen T.H.T., Do, V.T., Nguyen, T.T. and Nguyen, H.D. 2011. Freshwater ecosystem services and biodiversity values of the Dakrong River, Quang Tri, Viet Nam. HighARCS Project Work Package 3 report. Research Institute for Aquaculture No.1, Viet Nam.
Biodiversity results
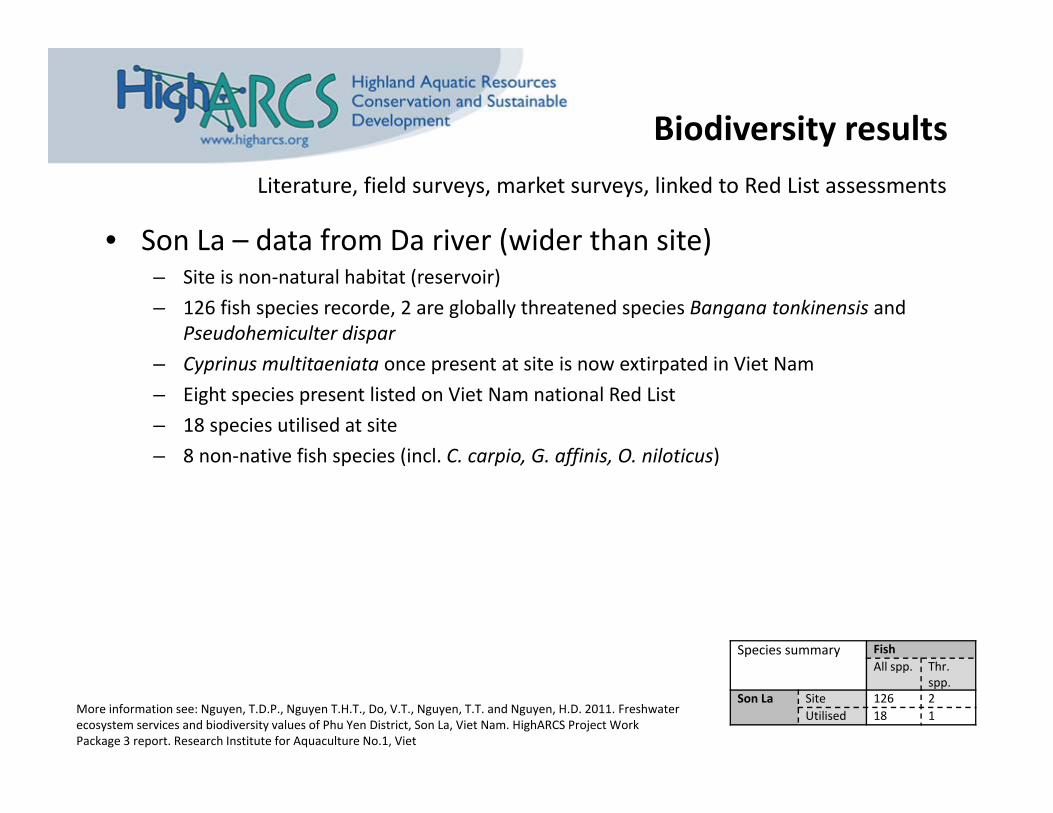
• Son La – data from Da river (wider than site)– Site is non‐natural habitat (reservoir)– 126 fish species recorde, 2 are globally threatened species Bangana tonkinensis and
Pseudohemiculter dispar– Cyprinus multitaeniata once present at site is now extirpated in Viet Nam– Eight species present listed on Viet Nam national Red List– 18 species utilised at site– 8 non‐native fish species (incl. C. carpio, G. affinis, O. niloticus)
Species summary FishAll spp. Thr.
spp.Son La Site 126 2
Utilised 18 1
Literature, field surveys, market surveys, linked to Red List assessments
More information see: Nguyen, T.D.P., Nguyen T.H.T., Do, V.T., Nguyen, T.T. and Nguyen, H.D. 2011. Freshwater ecosystem services and biodiversity values of Phu Yen District, Son La, Viet Nam. HighARCS Project Work Package 3 report. Research Institute for Aquaculture No.1, Viet

Species Red List assessments
• The IUCN Red List of Threatened Species™ is widely recognized as the most comprehensive, objective global approach for evaluating the conservation status (risk of global extinction) of plant and animal species.
• Species data collated through HighARCS project has contributed to IUCN Red List assessments
• Red List assessments for all species found at the HighARCSsites can be found at:www.iucnredlist.org
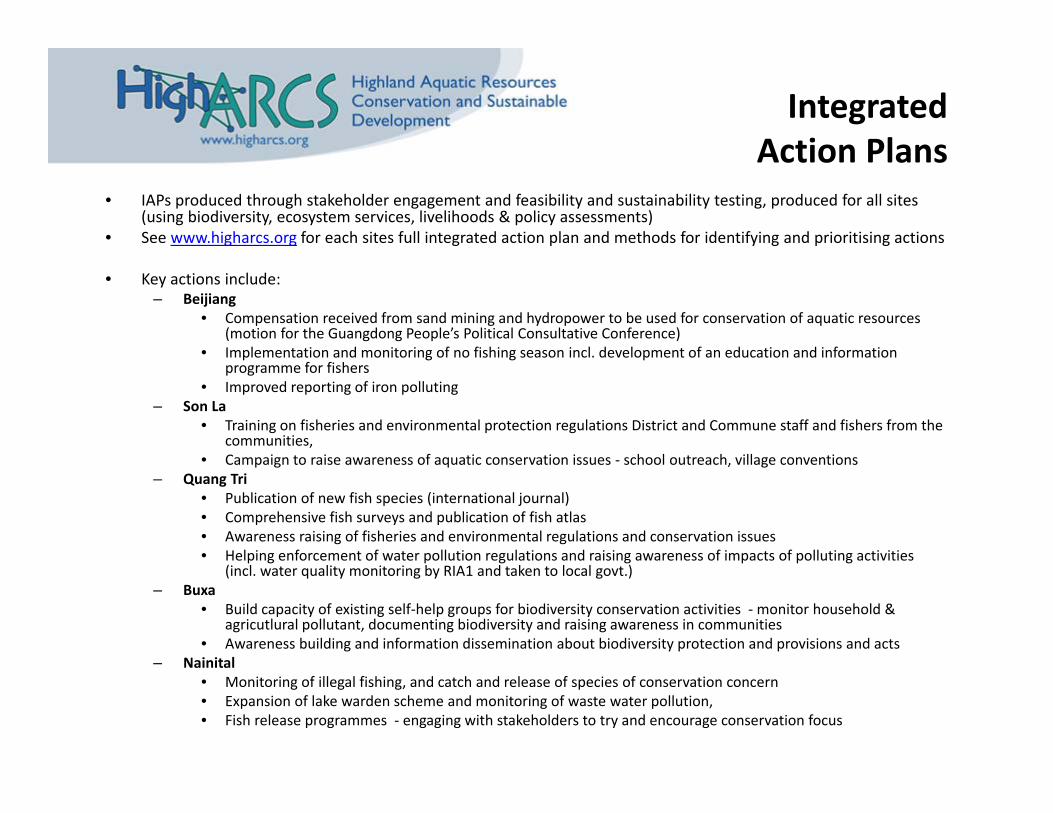
Integrated Action Plans
• IAPs produced through stakeholder engagement and feasibility and sustainability testing, produced for all sites (using biodiversity, ecosystem services, livelihoods & policy assessments)
• See www.higharcs.org for each sites full integrated action plan and methods for identifying and prioritising actions
• Key actions include:– Beijiang
• Compensation received from sand mining and hydropower to be used for conservation of aquatic resources (motion for the Guangdong People’s Political Consultative Conference)
• Implementation and monitoring of no fishing season incl. development of an education and information programme for fishers
• Improved reporting of iron polluting – Son La
• Training on fisheries and environmental protection regulations District and Commune staff and fishers from the communities,
• Campaign to raise awareness of aquatic conservation issues ‐ school outreach, village conventions– Quang Tri
• Publication of new fish species (international journal)• Comprehensive fish surveys and publication of fish atlas • Awareness raising of fisheries and environmental regulations and conservation issues• Helping enforcement of water pollution regulations and raising awareness of impacts of polluting activities
(incl. water quality monitoring by RIA1 and taken to local govt.) – Buxa
• Build capacity of existing self‐help groups for biodiversity conservation activities ‐monitor household & agricutlural pollutant, documenting biodiversity and raising awareness in communities
• Awareness building and information dissemination about biodiversity protection and provisions and acts – Nainital
• Monitoring of illegal fishing, and catch and release of species of conservation concern • Expansion of lake warden scheme and monitoring of waste water pollution,• Fish release programmes ‐ engaging with stakeholders to try and encourage conservation focus
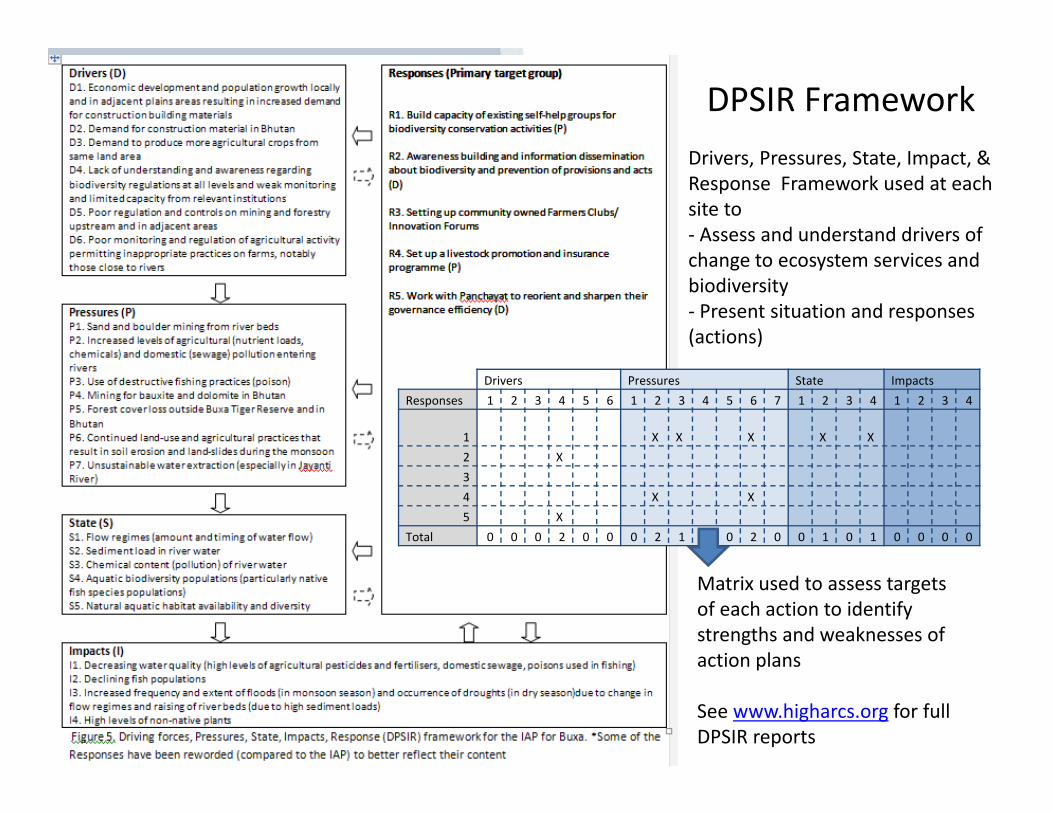
DPSIR Framework
Drivers Pressures State ImpactsResponses 1 2 3 4 5 6 1 2 3 4 5 6 7 1 2 3 4 1 2 3 4
1 X X X X X2 X34 X X5 X
Total 0 0 0 2 0 0 0 2 1 0 0 2 0 0 1 0 1 0 0 0 0
Drivers, Pressures, State, Impact, & Response Framework used at each site to‐ Assess and understand drivers of change to ecosystem services and biodiversity‐ Present situation and responses (actions)
Matrix used to assess targetsof each action to identify strengths and weaknesses ofaction plans
See www.higharcs.org for fullDPSIR reports