Embed Size (px)
Citation preview
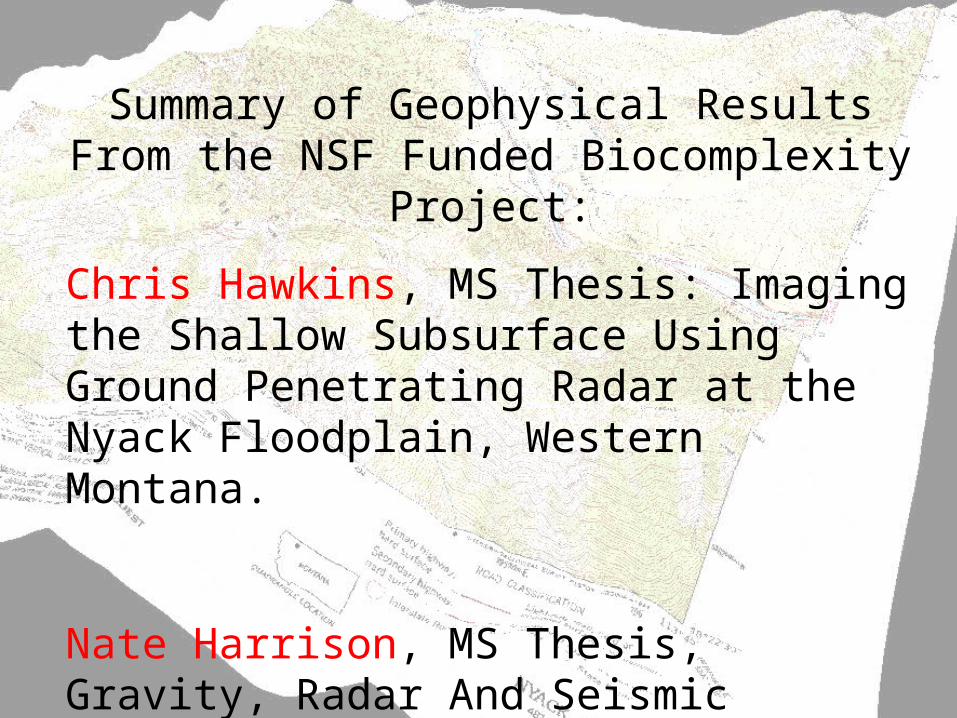
Summary of Geophysical Results From the NSF Funded Biocomplexity Project:
Chris Hawkins, MS Thesis: Imaging the Shallow Subsurface Using Ground Penetrating Radar at the Nyack Floodplain, Western Montana.
Nate Harrison, MS Thesis, Gravity, Radar And Seismic Investigations To Help Determine Geologic, Hydrologic, And Biologic Relations In The Nyack Valley, Northwestern Montana
12/5/2004:SDS
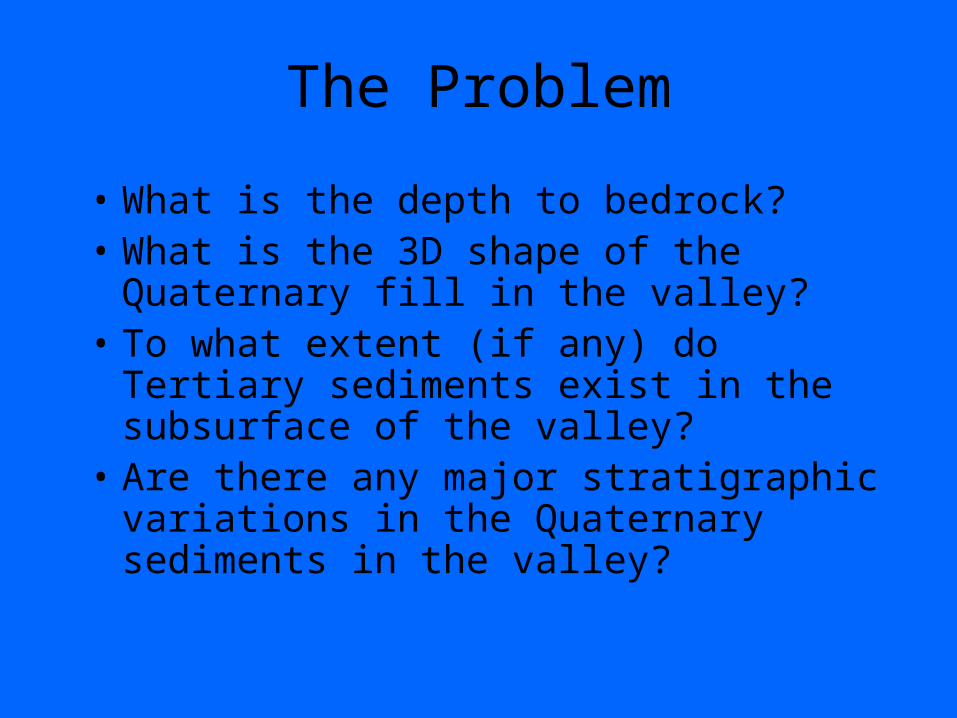
The Problem
• What is the depth to bedrock?• What is the 3D shape of the Quaternary fill
in the valley?• To what extent (if any) do Tertiary
sediments exist in the subsurface of the valley?
• Are there any major stratigraphic variations in the Quaternary sediments in the valley?
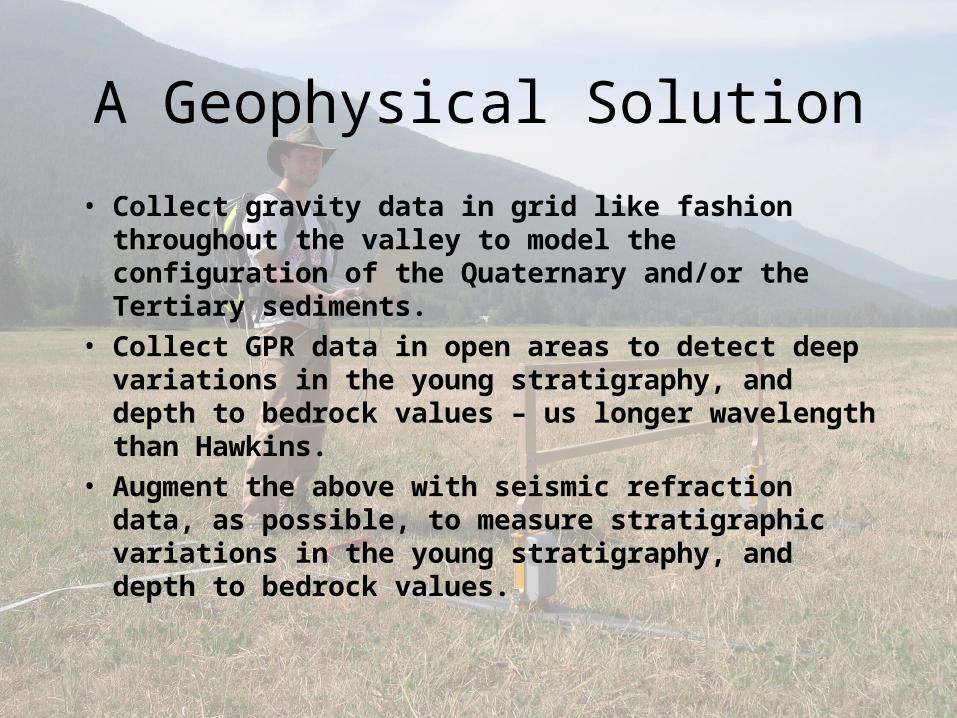
A Geophysical Solution
• Collect gravity data in grid like fashion throughout the valley to model the configuration of the Quaternary and/or the Tertiary sediments.
• Collect GPR data in open areas to detect deep variations in the young stratigraphy, and depth to bedrock values – us longer wavelength than Hawkins.
• Augment the above with seismic refraction data, as possible, to measure stratigraphic variations in the young stratigraphy, and depth to bedrock values.
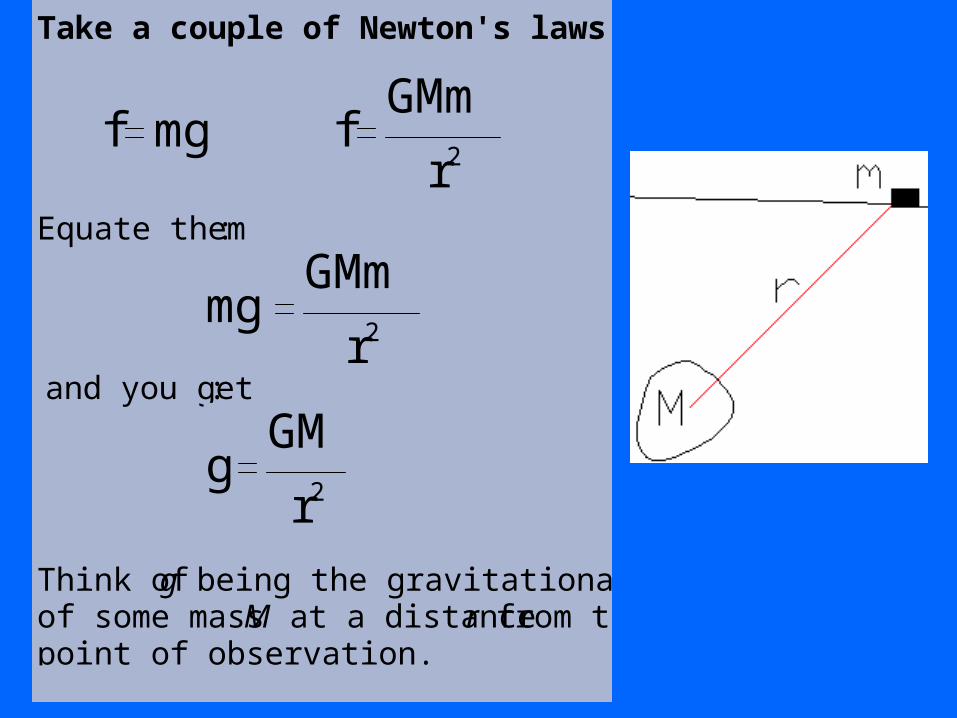
Take a couple of Newton's laws:
f mg fGMm
r2
Equate them:
mgGMm
r2
and you get:
gGM
r2
Think of g being the gravitational effect of some mass M at a distance r from the point of observation.
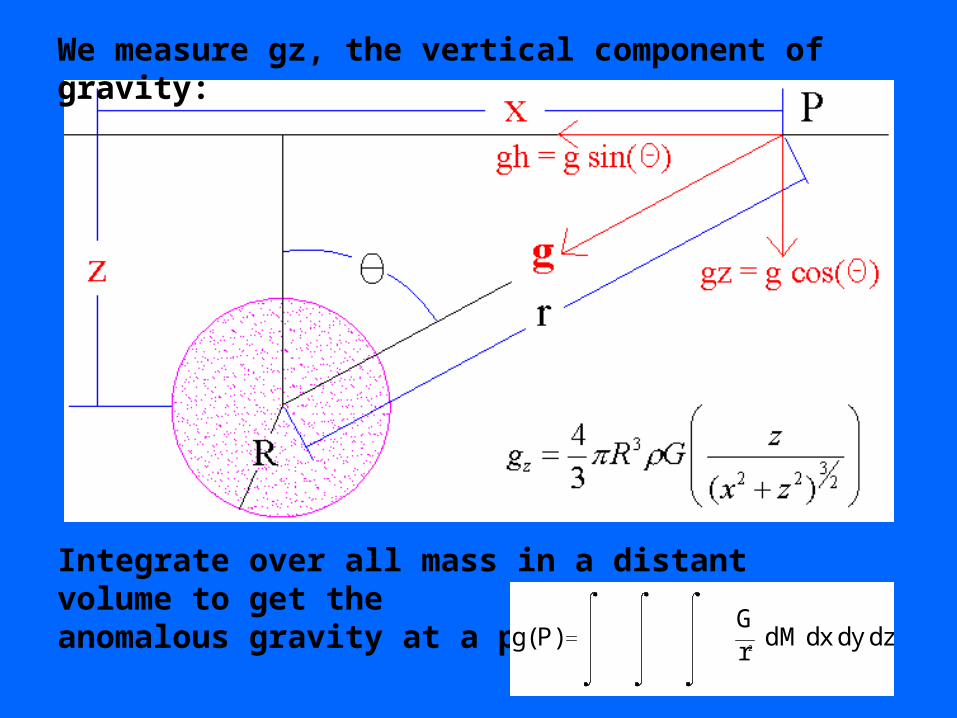
We measure gz, the vertical component of gravity:
Integrate over all mass in a distant volume to get theanomalous gravity at a point, P:
g P( ) zyxGr 2
dM d d d
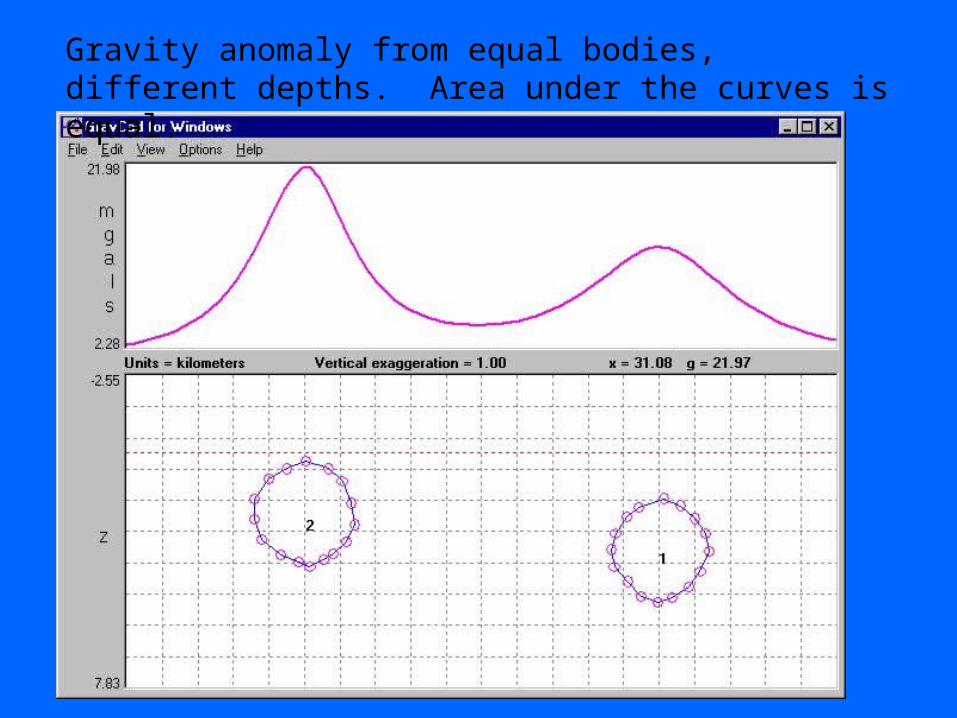
Gravity anomaly from equal bodies, different depths. Area under the curves is equal.
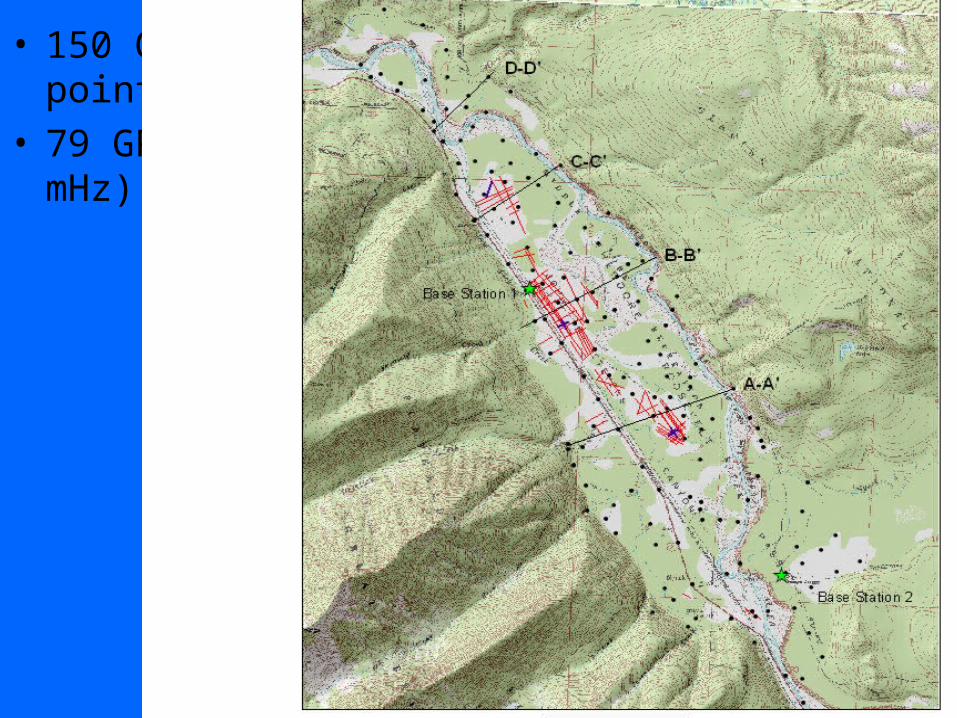
• 150 Gravity points.
• 79 GPR (50 mHz) lines
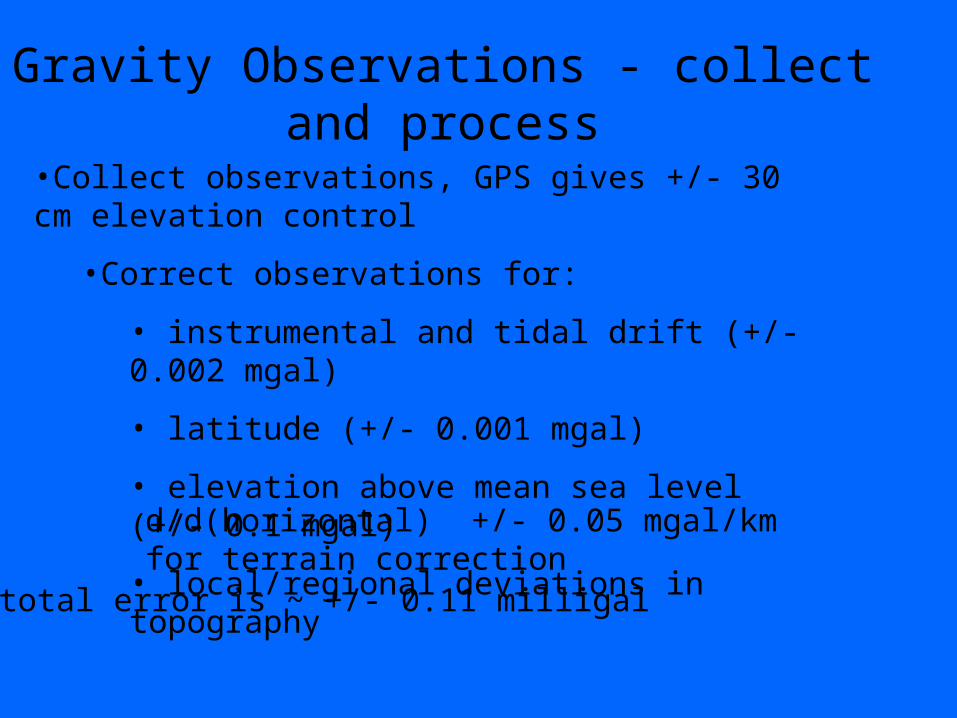
Gravity Observations - collect and process
•Collect observations, GPS gives +/- 30 cm elevation control
•Correct observations for:
• instrumental and tidal drift (+/- 0.002 mgal)
• latitude (+/- 0.001 mgal)
• elevation above mean sea level (+/- 0.1 mgal)
• local/regional deviations in topography
Thus total error is ~ +/- 0.11 milligal
d/d(horizontal) +/- 0.05 mgal/km for terrain correction
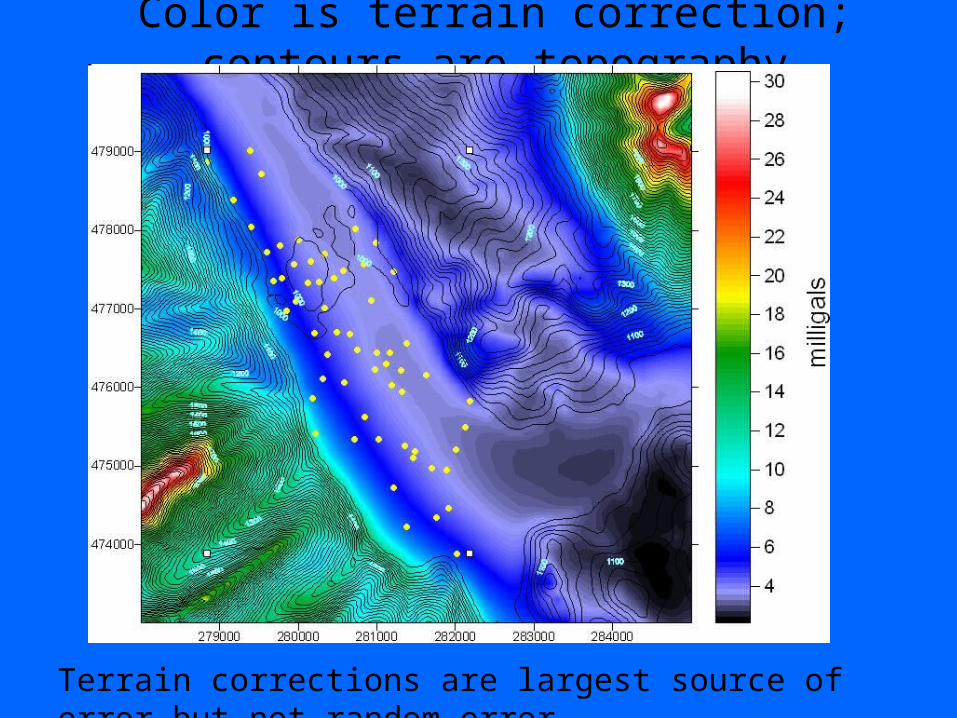
Color is terrain correction; contours are topography
Terrain corrections are largest source of error but not random error
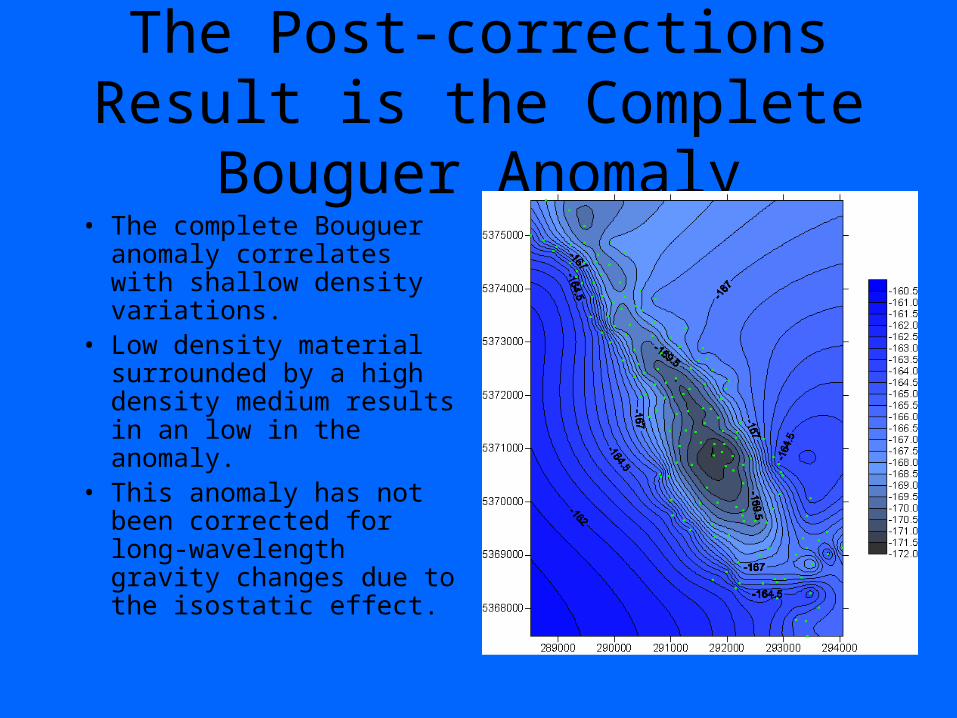
The Post-corrections Result is the Complete Bouguer Anomaly
• The complete Bouguer anomaly correlates with shallow density variations.
• Low density material surrounded by a high density medium results in an low in the anomaly.
• This anomaly has not been corrected for long-wavelength gravity changes due to the isostatic effect.
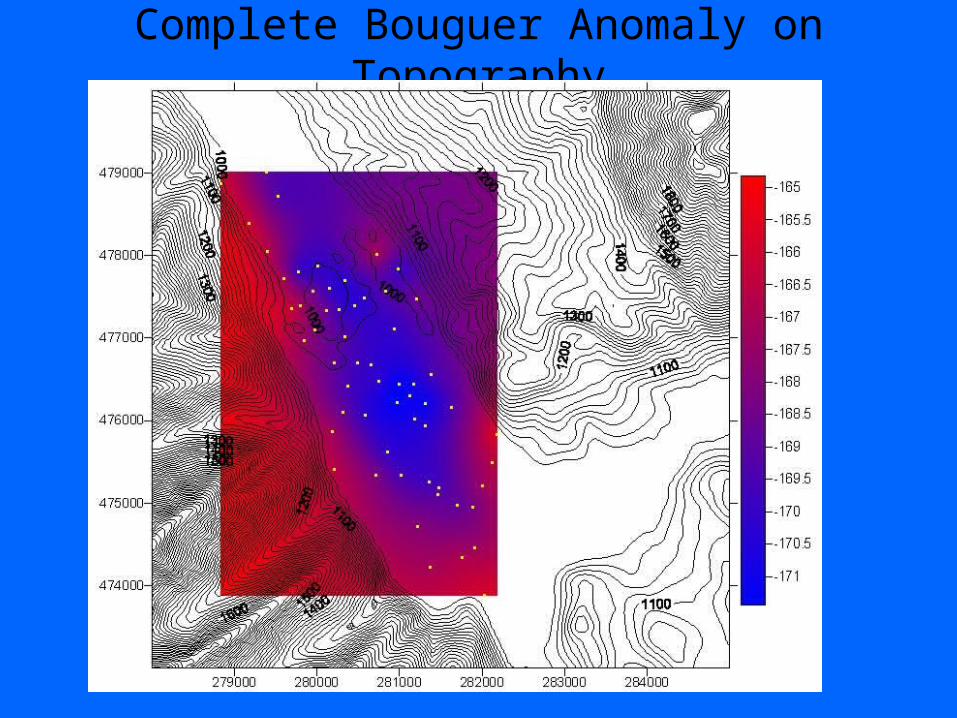
Complete Bouguer Anomaly on Topography
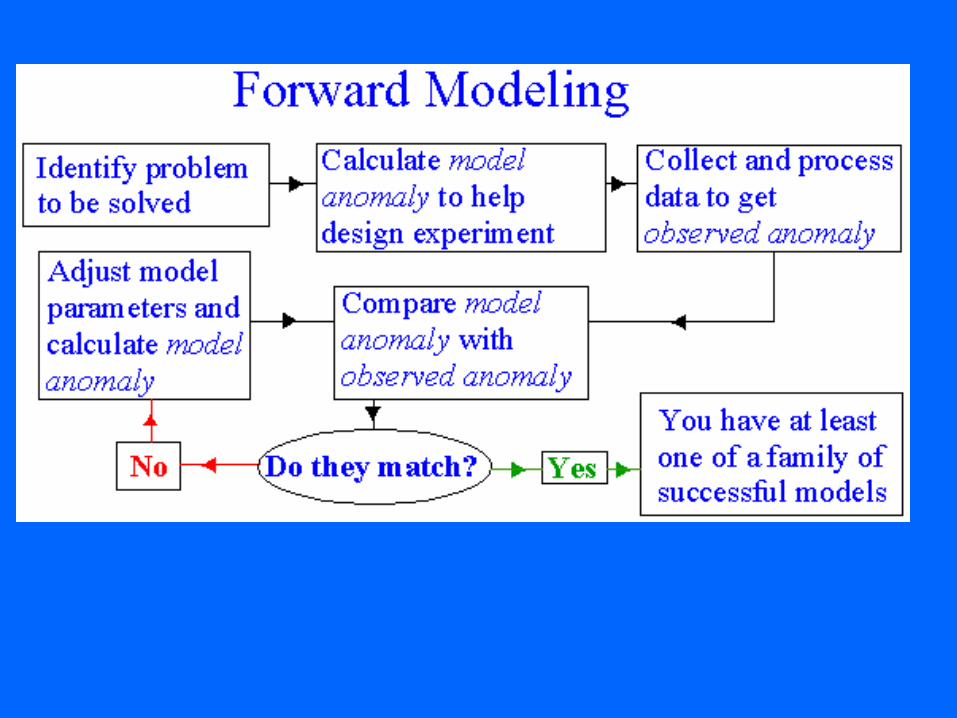
• Processing ends and interpretation begins
• A subjective step
• Probably the most important step in gravity methods
Observed Gravity - Regional Gravity = Residual Gravity
Knowns for the Nyack Valley:
• We are looking for the anomaly caused by the lower density valley fill. Thus at the bedrock contacts at the valley’s edge, the residual gravity must be near zero
• Bedrock density is around 2800 kg/m^3 (experience)
• Glaciation post dates faulting - valley is roughly U-shaped
• Model results must fit gradients and volume of anomaly values
Modeling the Crust-Mantle (Regional) Effects
• The crust-mantle effects are responsible for the large (or long-wavelength) variations in gravity.
• This is due to density variations in an uneven surface at the crust-mantle boundary.
• The regional anomaly was modeled with gravity points compiled by the National Geophysical Data Center (NGDC/NOAA)
• The NOAA points surround the Nyack Valley by about 36 kilometers.
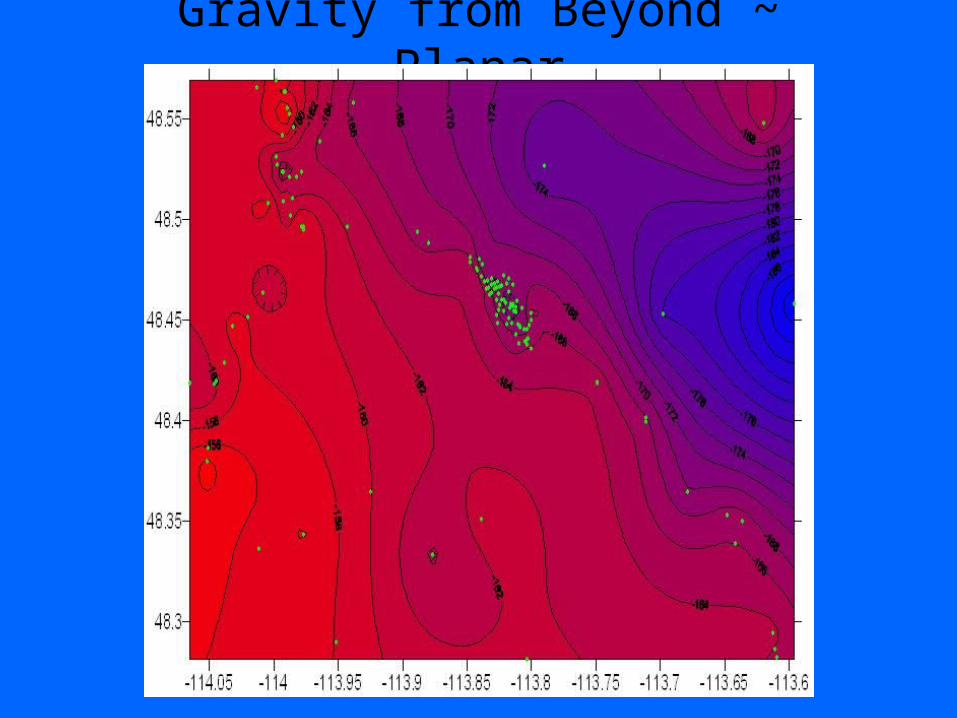
Gravity from Beyond ~ Planar
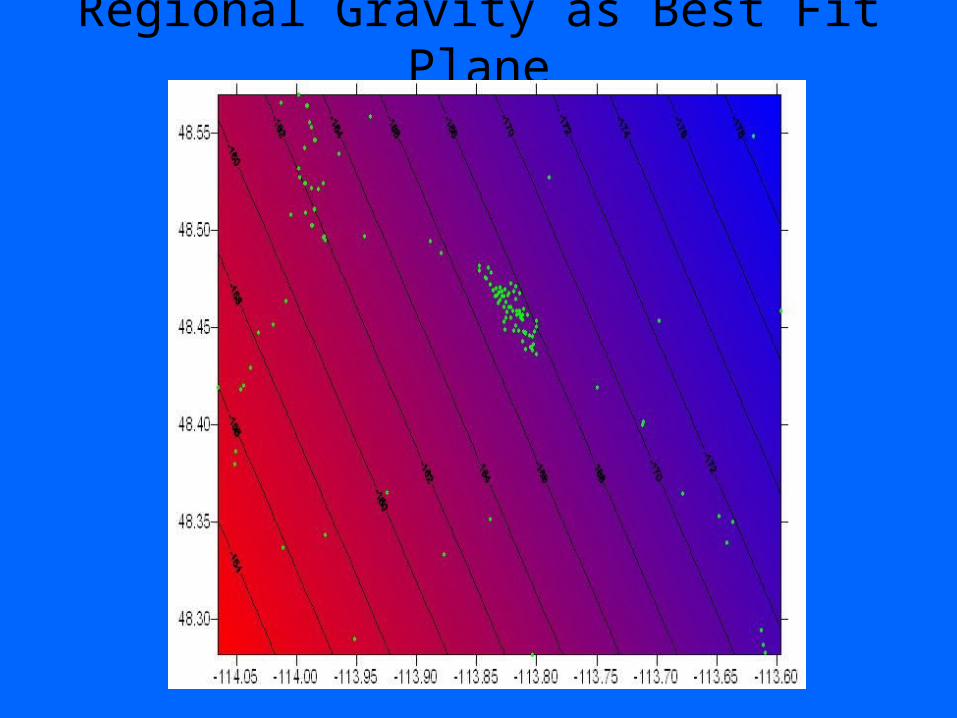
Regional Gravity as Best Fit Plane
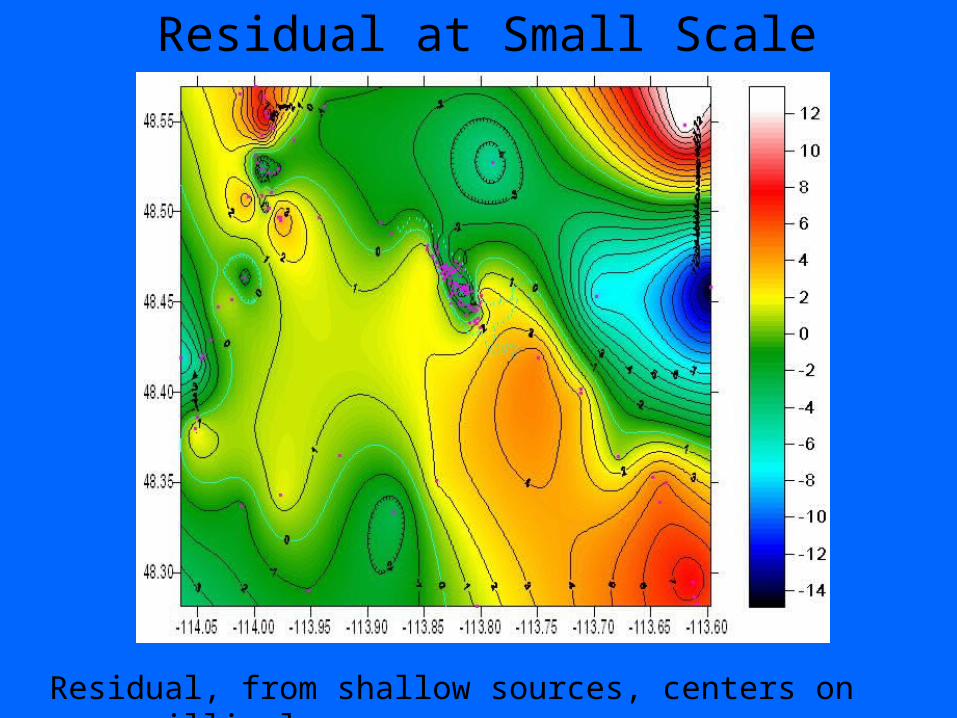
Residual at Small Scale
Residual, from shallow sources, centers on zero milligals.
Density Estimates (cont.)
• Previous work near the Nyack Valley– Precambrian basement rocks (Belt Supergroup) density
estimate of 2650 kg/m3.
– Tertiary rocks (Kishenehn formation) density estimate of 2350 kg/m3.
• 2D analysis of the residual gravity anomaly– Quaternary rocks density estimate of 1950 kg/m3.
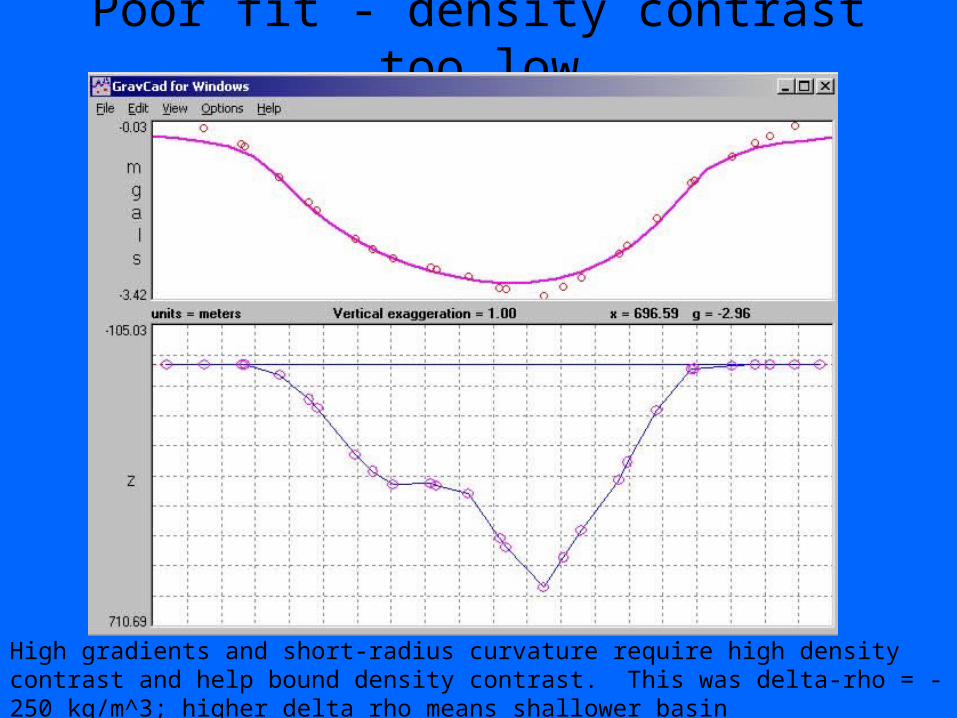
Poor fit - density contrast too low
High gradients and short-radius curvature require high density contrast and help bound density contrast. This was delta-rho = -250 kg/m^3; higher delta rho means shallower basin
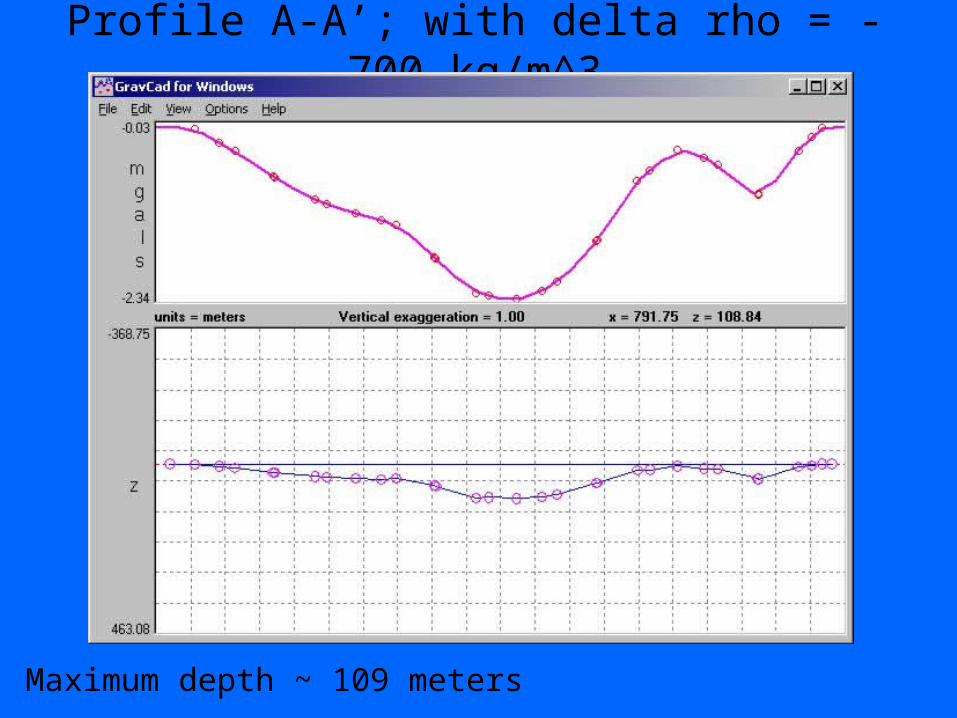
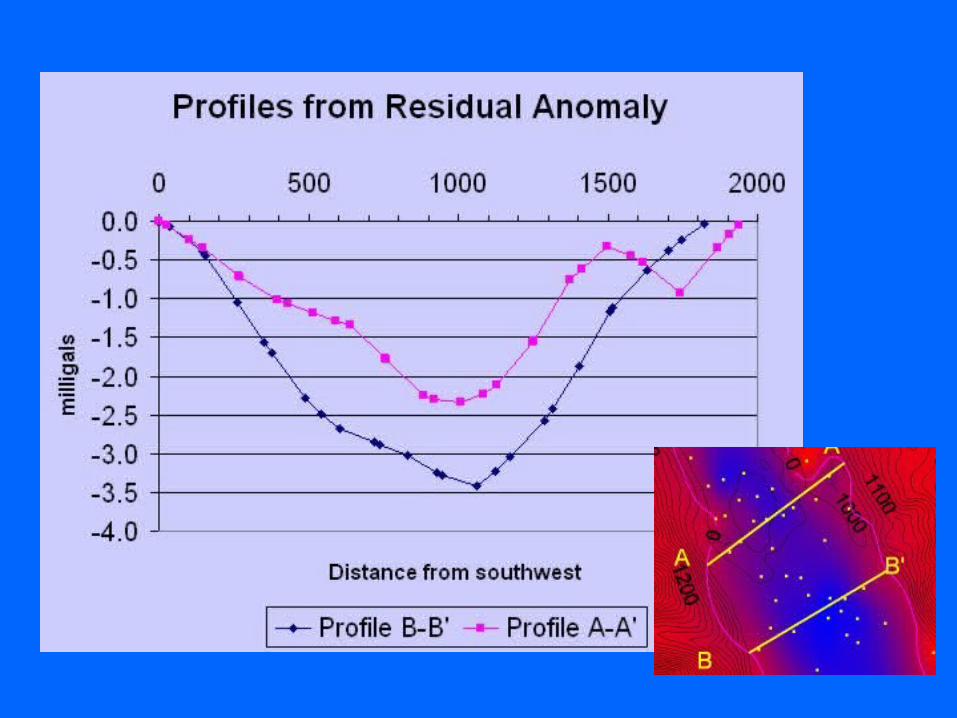
Profile A-A’; with delta rho = -700 kg/m^3
Maximum depth ~ 109 meters
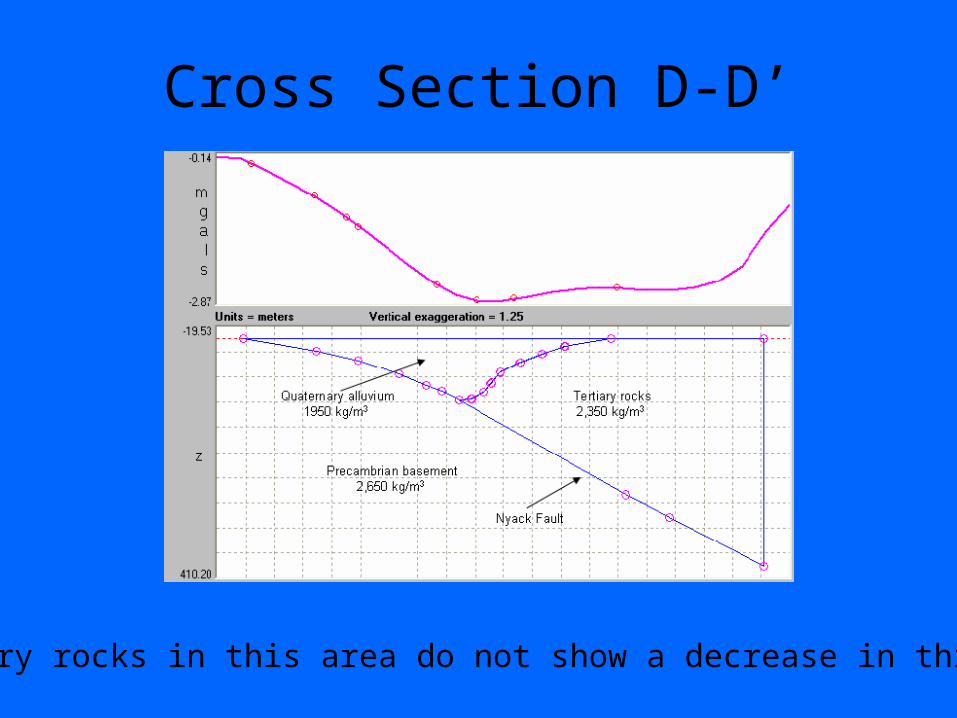
Cross Section D-D’
Tertiary rocks in this area do not show a decrease in thickness
Conclusions Drawn From 2D Models
• The density contrast between the Precambrian basement and Quaternary sediments is 700 kg/m3.
• Greatest depth to bedrock is 220 meters in cross section A-A’.
• Tertiary rocks increase in thickness to the north (B-B’ to D-D’) from 50 to 260 meters.
• The Nyack Fault (western contact between Kt and the Belt) increases in dip from 6º east (B-B’) to 28º east (C-C’).
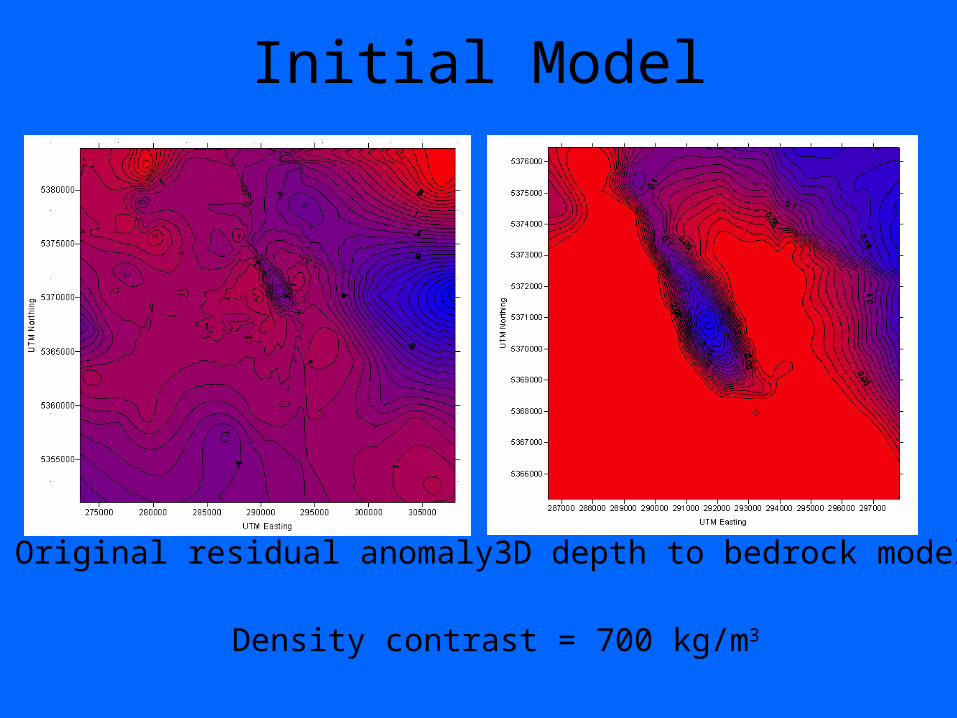
Initial Model
Original residual anomaly 3D depth to bedrock model
Density contrast = 700 kg/m3
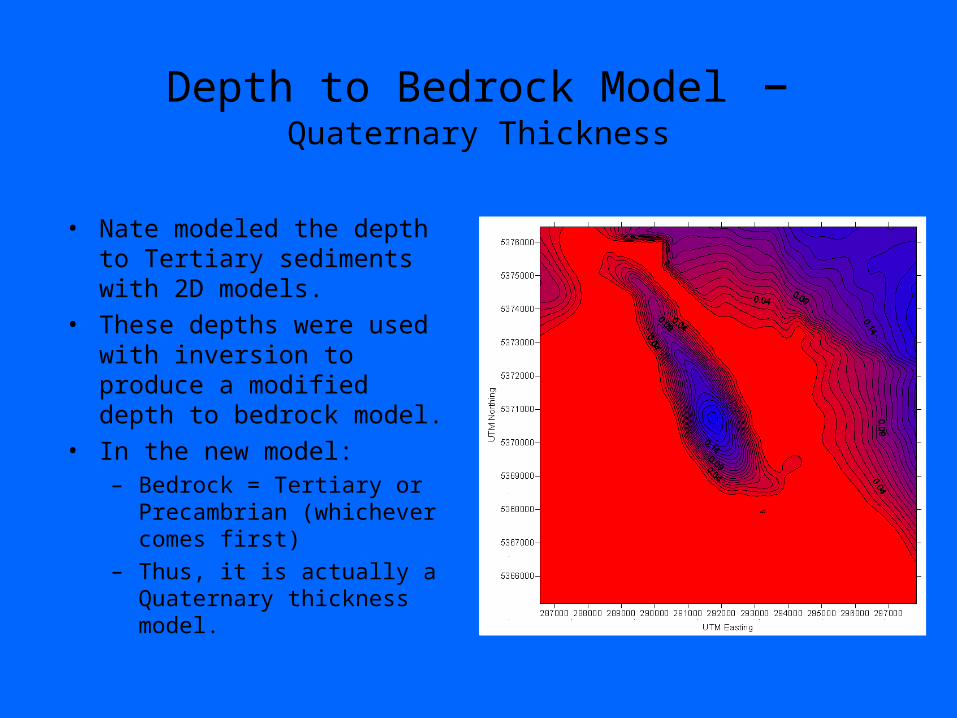
Depth to Bedrock Model – Quaternary Thickness
• Nate modeled the depth to Tertiary sediments with 2D models.
• These depths were used with inversion to produce a modified depth to bedrock model.
• In the new model:– Bedrock = Tertiary or
Precambrian (whichever comes first)
– Thus, it is actually a Quaternary thickness model.
• Nate’s 79 50 mHz GPR lines, undertaken to confirm depth to bedrock and determine intra-basin stratigraphy, added little useful information. The penetration is too shallow (<50m) to really help with the gravity inversion and we found no consistent stratigraphy. Although Nate did find a sporadic assortment of boulders at depths of 20-30 meters.
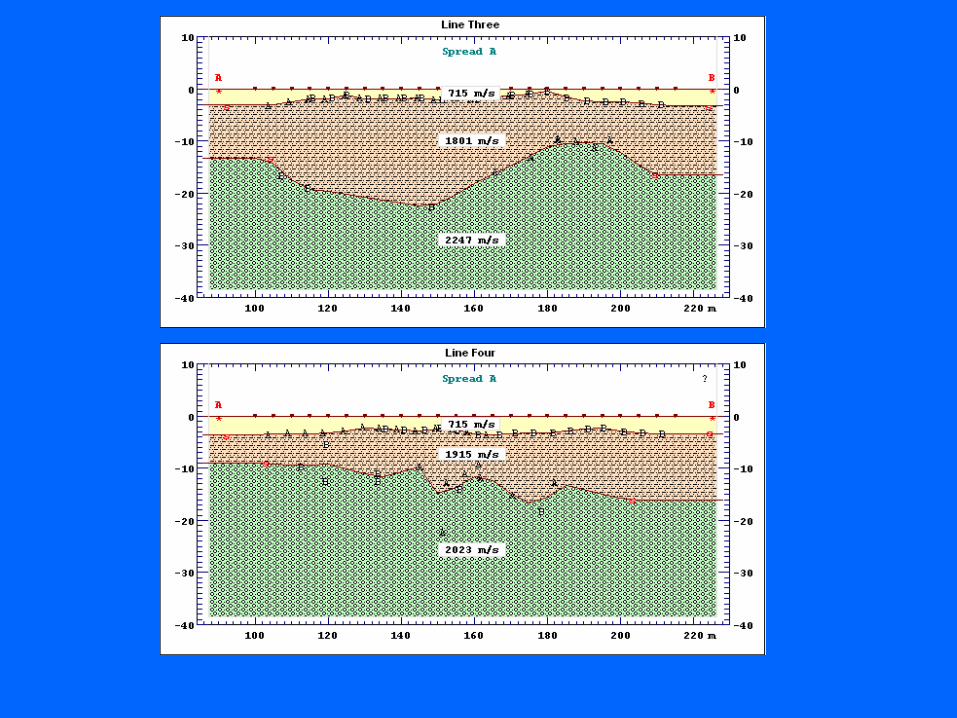
• Nate’s five seismic lines indicate that, in general, the upper few meters (1-4m) is loosely compacted sediment and soil (866 m/s) over more consolidated material, 1660 m/s. Below that at 23 +/- 10m there is a second velocity increase to 2,263 +/- 621 m/s. This increase in velocity may be from an increase in the grain size of fluvial units – Cain’s well HA-4 indicates such near one of the seismic lines.
• The depths to the third seismic layer are compatible to the depths at which Nate saw large boulders in his GPR surveys. This may be the top of glacial material.
Nate’s GPR & seismic data might show where the glacial deposits start
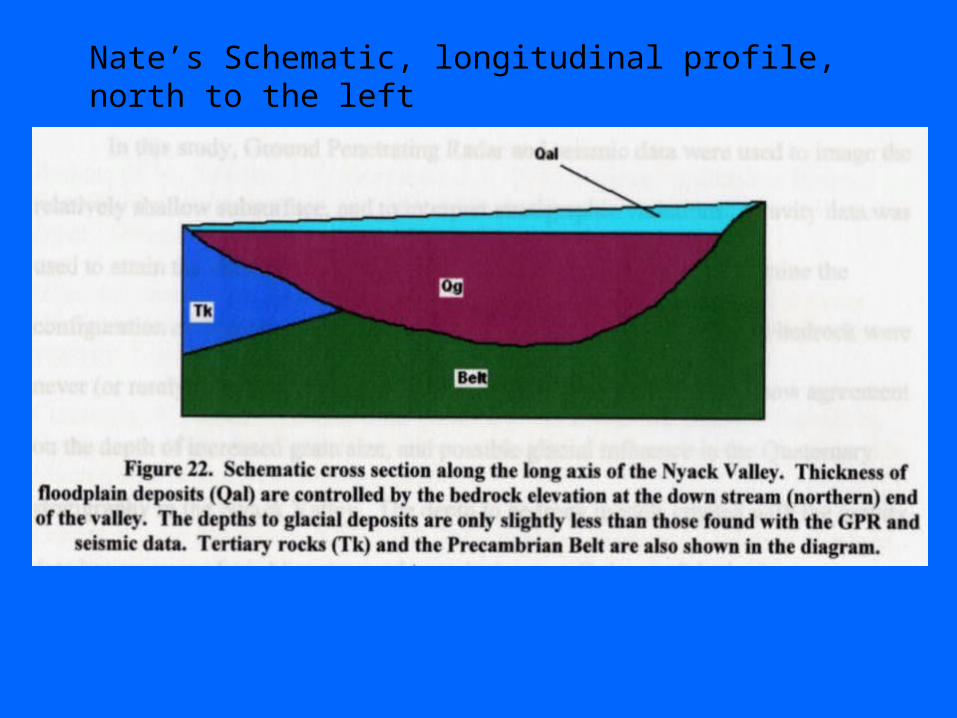
Nate’s Schematic, longitudinal profile, north to the left
Geologic Map
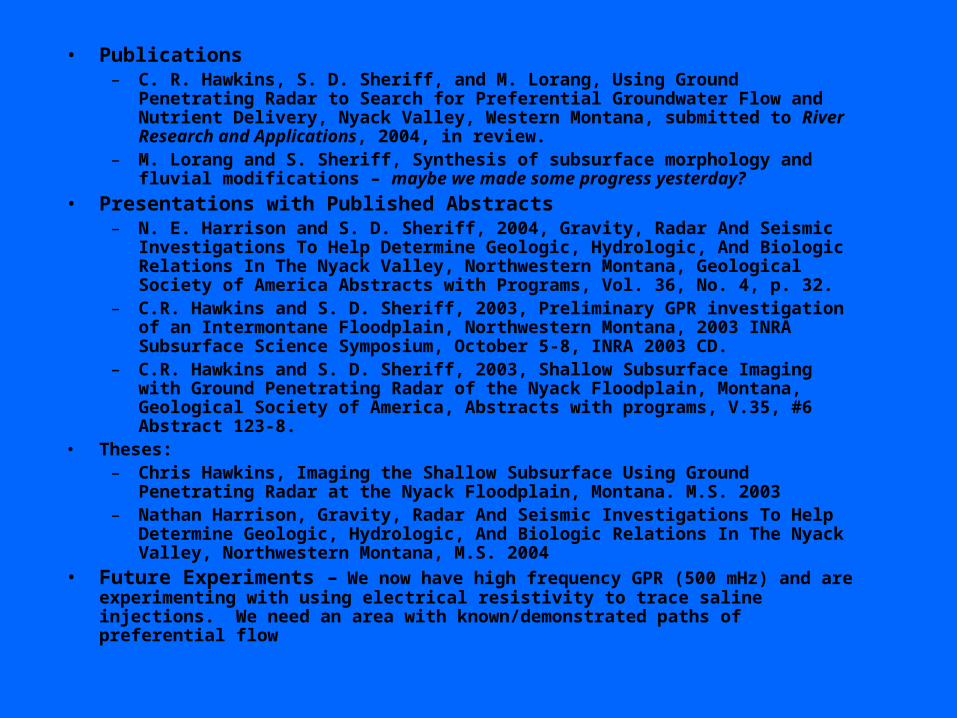
• Publications– C. R. Hawkins, S. D. Sheriff, and M. Lorang, Using Ground Penetrating Radar to Search
for Preferential Groundwater Flow and Nutrient Delivery, Nyack Valley, Western Montana, submitted to River Research and Applications, 2004, in review.
– M. Lorang and S. Sheriff, Synthesis of subsurface morphology and fluvial modifications – maybe we made some progress yesterday?
• Presentations with Published Abstracts– N. E. Harrison and S. D. Sheriff, 2004, Gravity, Radar And Seismic Investigations To
Help Determine Geologic, Hydrologic, And Biologic Relations In The Nyack Valley, Northwestern Montana, Geological Society of America Abstracts with Programs, Vol. 36, No. 4, p. 32.
– C.R. Hawkins and S. D. Sheriff, 2003, Preliminary GPR investigation of an Intermontane Floodplain, Northwestern Montana, 2003 INRA Subsurface Science Symposium, October 5-8, INRA 2003 CD.
– C.R. Hawkins and S. D. Sheriff, 2003, Shallow Subsurface Imaging with Ground Penetrating Radar of the Nyack Floodplain, Montana, Geological Society of America, Abstracts with programs, V.35, #6 Abstract 123-8.
• Theses:– Chris Hawkins, Imaging the Shallow Subsurface Using Ground Penetrating Radar at the
Nyack Floodplain, Montana. M.S. 2003 – Nathan Harrison, Gravity, Radar And Seismic Investigations To Help Determine
Geologic, Hydrologic, And Biologic Relations In The Nyack Valley, Northwestern Montana, M.S. 2004
• Future Experiments – We now have high frequency GPR (500 mHz) and are experimenting with using electrical resistivity to trace saline injections. We need an area with known/demonstrated paths of preferential flow