Embed Size (px)
Citation preview
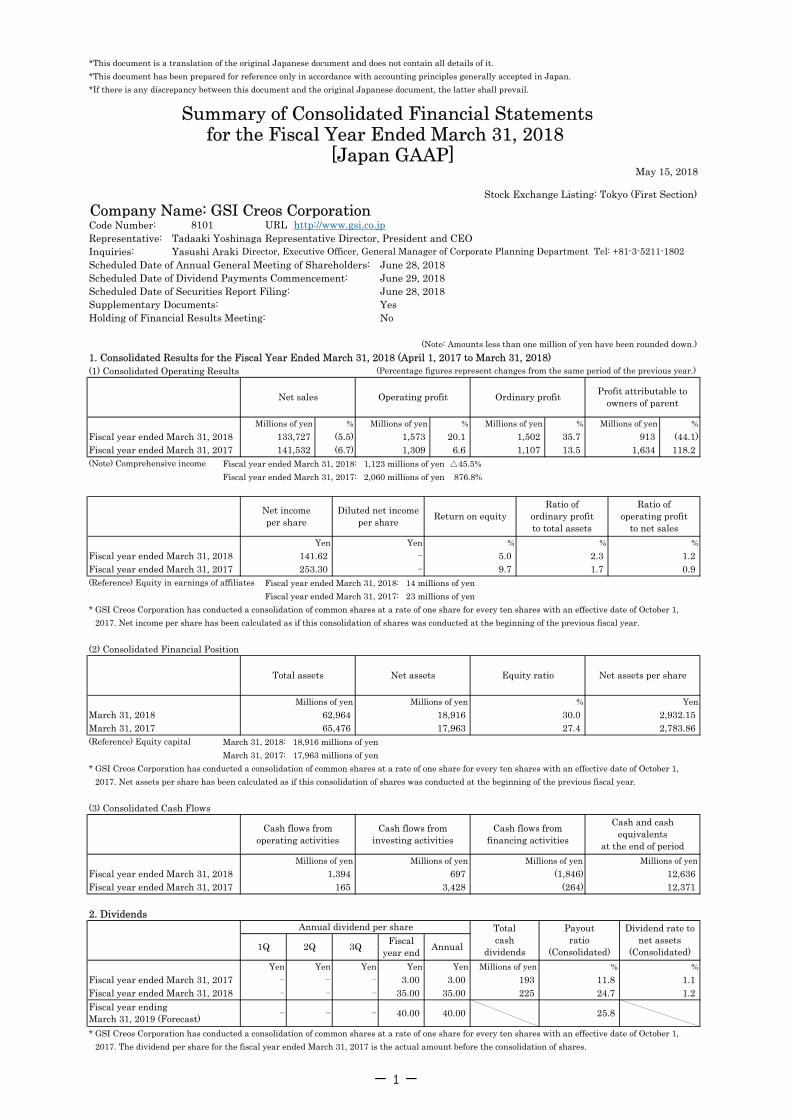
*This document is a translation of the original Japanese document and does not contain all details of it. *This document has been prepared for reference only in accordance with accounting principles generally accepted in Japan.*If there is any discrepancy between this document and the original Japanese document, the latter shall prevail.
May 15, 2018
Company Name: GSI Creos CorporationCode Number:Representative: Tadaaki Yoshinaga Representative Director, President and CEOInquiries: Yasushi ArakiScheduled Date of Annual General Meeting of Shareholders: June 28, 2018Scheduled Date of Dividend Payments Commencement: June 29, 2018Scheduled Date of Securities Report Filing: June 28, 2018Supplementary Documents: YesHolding of Financial Results Meeting: No
1. Consolidated Results for the Fiscal Year Ended March 31, 2018 (April 1, 2017 to March 31, 2018)(1) Consolidated Operating Results
Fiscal year ended March 31, 2018: 1,123 millions of yen △45.5% Fiscal year ended March 31, 2017: 2,060 millions of yen 876.8%
Fiscal year ended March 31, 2018: 14 millions of yen Fiscal year ended March 31, 2017: 23 millions of yen* GSI Creos Corporation has conducted a consolidation of common shares at a rate of one share for every ten shares with an effective date of October 1,
2017. Net income per share has been calculated as if this consolidation of shares was conducted at the beginning of the previous fiscal year.
(2) Consolidated Financial Position
March 31, 2018: 18,916 millions of yen March 31, 2017: 17,963 millions of yen
* GSI Creos Corporation has conducted a consolidation of common shares at a rate of one share for every ten shares with an effective date of October 1, 2017. Net assets per share has been calculated as if this consolidation of shares was conducted at the beginning of the previous fiscal year.
(3) Consolidated Cash Flows
2. Dividends
* GSI Creos Corporation has conducted a consolidation of common shares at a rate of one share for every ten shares with an effective date of October 1, 2017. The dividend per share for the fiscal year ended March 31, 2017 is the actual amount before the consolidation of shares.
1.1
8101 URL http://www.gsi.co.jp
(Note) Comprehensive income
(Reference) Equity capital
(Reference) Equity in earnings of affiliates
- - -
Yen
35.00
%Millions of yen
Cash flows fromoperating activities
1651,394
Millions of yen
30.027.4
3,428697
Millions of yen
Cash flows fromfinancing activities
17,96365,476
(1,846)
2,932.152,783.86
12,371(264)12,636
25.8
225 1.2
40.00 40.00
24.7-
-
3.00-
-
-
3.0035.00
193 11.8-
Millions of yen
Fiscal year ended March 31, 2017Fiscal year ended March 31, 2018
Dividend rate tonet assets
(Consolidated)
Payoutratio
(Consolidated)
Totalcash
dividends
Annual dividend per share
2Q 3Q Fiscalyear end Annual
Yen Yen Yen Yen
1Q
%
Cash flows frominvesting activities
Millions of yen
Yen
253.30141.62
Yen
Net assets per shareEquity ratioNet assetsTotal assets
March 31, 2018March 31, 2017
Cash and cashequivalents
at the end of period
0.91.2
%
1.72.3
%
%
1,3091,573
Millions of yen
6.620.1
%
(6.7)(5.5)
Summary of Consolidated Financial Statements
Profit attributable toowners of parentOrdinary profitOperating profitNet sales
141,532
Millions of yen18,916
%Millions of yen62,964
%
-
-
Fiscal year ended March 31, 2017Fiscal year ended March 31, 2018
Fiscal year ended March 31, 2017Fiscal year ended March 31, 2018 133,727
9.7
Millions of yen
1,1071,502
118.2
Fiscal year endingMarch 31, 2019 (Forecast)
Fiscal year ended March 31, 2017Fiscal year ended March 31, 2018
(44.1)
Net incomeper share
5.0
Yen
%
Ratio ofoperating profit
to net sales
Ratio ofordinary profitto total assets
Return on equityDiluted net incomeper share
Millions of yen
13.535.7
%
1,634913
Millions of yen
Director, Executive Officer, General Manager of Corporate Planning Department Tel: +81-3-5211-1802
(Note: Amounts less than one million of yen have been rounded down.)
for the Fiscal Year Ended March 31, 2018
Stock Exchange Listing: Tokyo (First Section)
[Japan GAAP]
(Percentage figures represent changes from the same period of the previous year.)
- 1 -
3. Forecast of Consolidated Results for the Fiscal Year Ending March 31, 2019 (April 1, 2018 to March 31, 2019)
(Note) Forecast for the second quarter (cumulative) is not available.
* Notes(1) Changes in Significant Subsidiaries During the Period (Changes in Specified Subsidiaries Associated with Changes in the Scope of Consolidation): No
(2) Changes in Accounting Policies and Estimates, and Retrospective Restatementⅰ Changes in accounting policies due to revisions of accounting standards and other regulations: Noⅱ Changes in accounting policies other than in (ⅰ): Noⅲ Changes in accounting estimates: Noⅳ Retrospective restatement: No
(3) Number of Shares Issued and Outstanding (Common Stock)ⅰ Number of shares issued and outstanding at the end of period (including treasury stock)
ⅱ Number of treasury stock at the end of period
ⅲ Average number of shares during the period
* GSI Creos Corporation has conducted a consolidation of common shares at a rate of one share for every ten shares with an effective date of October 1, 2017. Number of shares issued and outstanding (including treasury stock), number of treasury stock and average number of shares have beencalculated as if this consolidation of shares was conducted at the beginning of the previous fiscal year.
[Reference] Summary of Non-Consolidated ResultsNon-Consolidated Results for the Fiscal Year Ended March 31, 2018 (April 1, 2017 to March 31, 2018)(1) Non-Consolidated Operating Results
* GSI Creos Corporation has conducted a consolidation of common shares at a rate of one share for every ten shares with an effective date of October 1, 2017. Net income per share has been calculated as if this consolidation of shares was conducted at the beginning of the previous fiscal year.
(2) Non-Consolidated Financial Position
March 31, 2018: 12,864 millions of yen March 31, 2017: 12,420 millions of yen
* GSI Creos Corporation has conducted a consolidation of common shares at a rate of one share for every ten shares with an effective date of October 1, 2017. Net assets per share has been calculated as if this consolidation of shares was conducted at the beginning of the previous fiscal year.
* This financial report is out of scope of the audit procedure performed by a certified public accountant or audit corporation.* Cautionary statement with respect to forecasts of consolidated business results and special notesEarning forecasts presented in this report are based on information available and assumptions deemed reasonable at the time. Therefore, theydo not constitute a guarantee that they will be realized. Actual results could differ significantly from forecasts due to a variety of factors.
(Reference) Equity capital
March 31, 2018 13,593 shares March 31, 2017
Ordinary profit
%Millions of yen%
Year ended March 31, 2018 6,452,019 shares Year ended March 31, 2017 6,452,853 shares
Full fiscal year 155.01Yen
9.4%Millions of yen
Net incomeper share
6,464,971 shares
Profit attributableto ownersof parent
1,500Millions of yen
(2.8)%
130,000Millions of yen
Operating profitNet sales
1,500(4.7) 1,000
12,382 shares
(0.2)
March 31, 2018 6,464,971 shares March 31, 2017
Net sales Operating profit Ordinary profit Profit
Millions of yen % Millions of yen % Millions of yen % Millions of yen %
(10.3) 506 81.9Fiscal year ended March 31, 2018 71,112 (7.9) 359 (21.0) 643 (7.1) 425 (16.0)
Net incomeper share
Diluted net incomeper share
Fiscal year ended March 31, 2017 77,212 (8.2) 455 1.0 693
Yen65.89 -
Yen
Net assets per shareEquity ratioNet assetsTotal assets
Fiscal year ended March 31, 2017 78.43 -
(Percentage figures represent changes from the same period of the previous year.)
March 31, 2017 1,924.8828.512,42043,540
(Percentage figures represent changes from the same period of the previous year.)
Yen%Millions of yenMillions of yenMarch 31, 2018 1,994.0830.012,86442,826
Fiscal year ended March 31, 2018
- 2 -
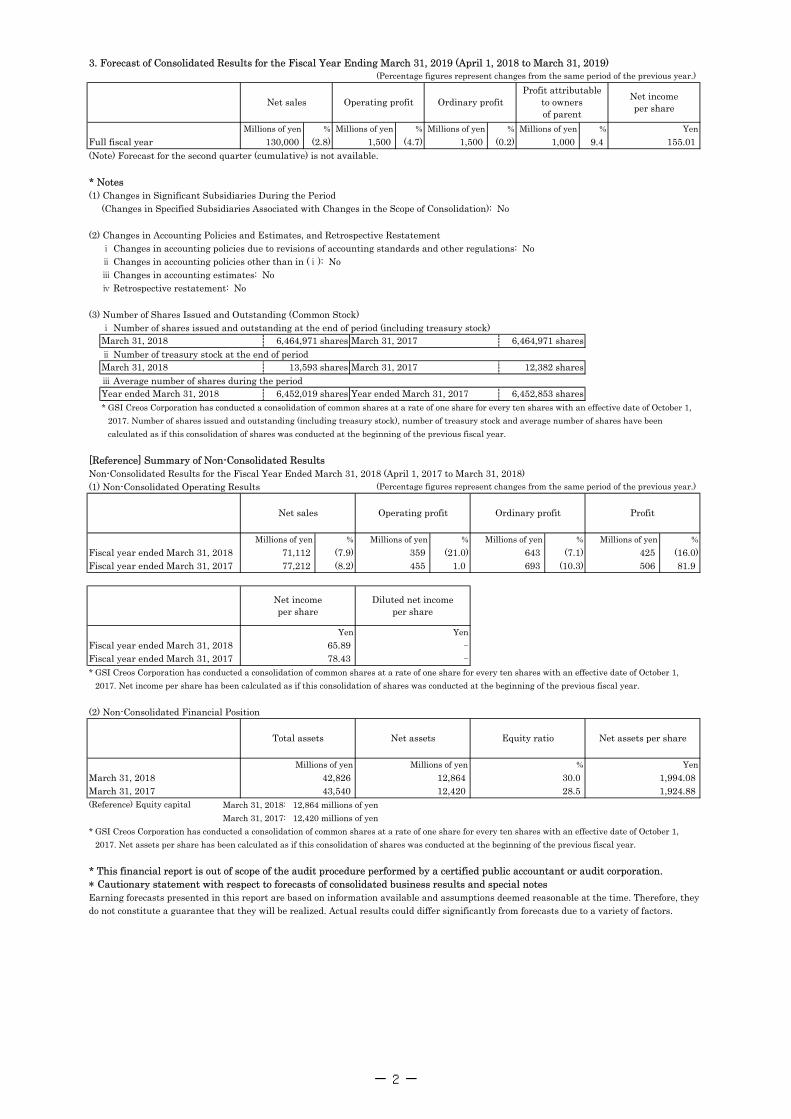
Consolidated Financial Statements(1)Consolidated Balance Sheets
(Millions of yen)Previous fiscal year
(March 31, 2017)Current fiscal year(March 31, 2018)
Assets Current assets Cash and deposits 12,371 12,636 Notes and accounts receivable-trade 32,421 30,154 Merchandise 8,173 8,138 Goods in transit 267 258 Deferred tax assets 361 358 Other 1,859 1,182 Allowance for doubtful accounts (1,146) (283) Total current assets 54,308 52,446 Non-current assets Property, plant and equipment Buildings and structures 3,509 3,763 Accumulated depreciation (2,288) (2,217) Buildings and structures, net 1,220 1,546 Machinery, equipment and vehicles 2,616 2,633 Accumulated depreciation (2,505) (2,445) Machinery, equipment and vehicles, net 110 188 Tools, furniture and fixtures 508 464 Accumulated depreciation (417) (384) Tools, furniture and fixtures, net 91 79 Land 2,758 2,554 Leased assets 96 97 Accumulated depreciation (42) (58) Leased assets, net 53 39 Construction in progress 3 ―
Total property, plant and equipment 4,237 4,407 Intangible assets Leased assets 673 562 Other 69 57 Total intangible assets 742 620 Investments and other assets Investment securities 3,892 3,416 Investments in capital 1,167 942 Long-term loans receivable 190 170 Deferred tax assets 45 15 Net defined benefit asset 344 379 Other 791 830 Allowance for doubtful accounts (241) (263) Total investments and other assets 6,189 5,490 Total non-current assets 11,168 10,518 Total assets 65,476 62,964
- 3 -
(Millions of yen)Previous fiscal year
(March 31, 2017)Current fiscal year(March 31, 2018)
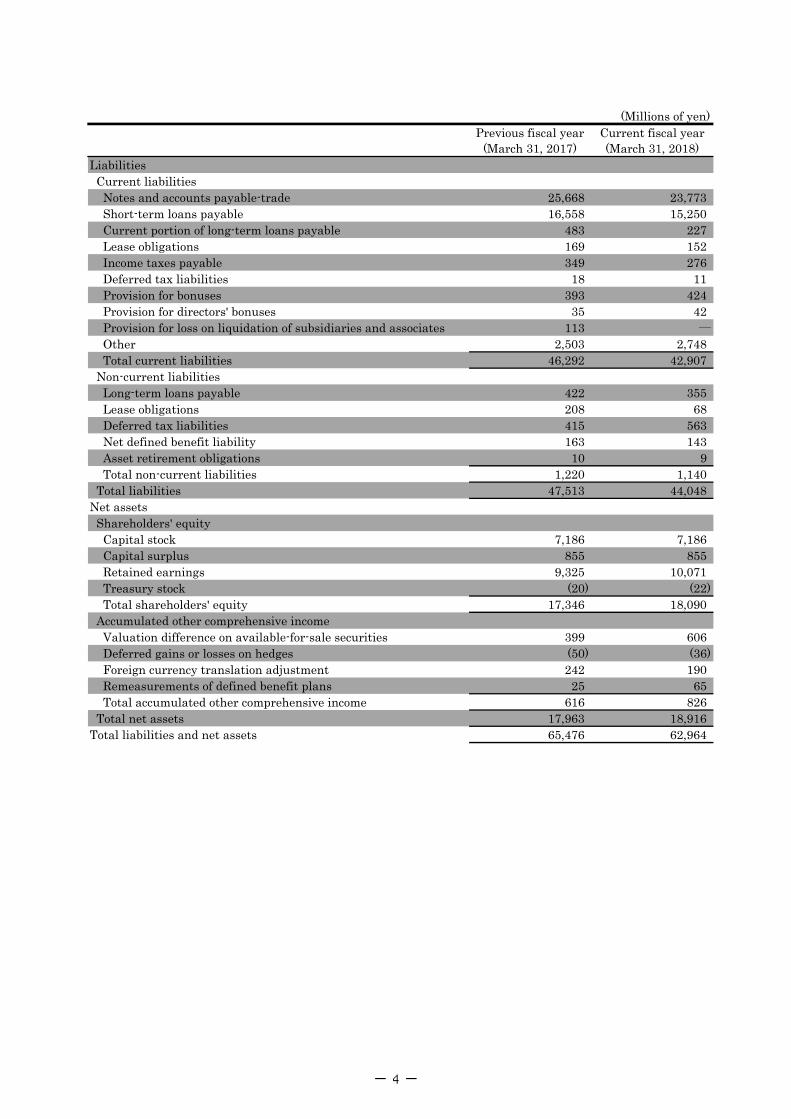
Liabilities Current liabilities Notes and accounts payable-trade 25,668 23,773 Short-term loans payable 16,558 15,250 Current portion of long-term loans payable 483 227 Lease obligations 169 152 Income taxes payable 349 276 Deferred tax liabilities 18 11 Provision for bonuses 393 424 Provision for directors' bonuses 35 42 Provision for loss on liquidation of subsidiaries and associates 113 ―
Other 2,503 2,748 Total current liabilities 46,292 42,907 Non-current liabilities Long-term loans payable 422 355 Lease obligations 208 68 Deferred tax liabilities 415 563 Net defined benefit liability 163 143 Asset retirement obligations 10 9 Total non-current liabilities 1,220 1,140 Total liabilities 47,513 44,048Net assets Shareholders' equity Capital stock 7,186 7,186 Capital surplus 855 855 Retained earnings 9,325 10,071 Treasury stock (20) (22) Total shareholders' equity 17,346 18,090 Accumulated other comprehensive income Valuation difference on available-for-sale securities 399 606 Deferred gains or losses on hedges (50) (36) Foreign currency translation adjustment 242 190 Remeasurements of defined benefit plans 25 65 Total accumulated other comprehensive income 616 826 Total net assets 17,963 18,916Total liabilities and net assets 65,476 62,964
- 4 -
(2)Consolidated Statements of Income and Consolidated Statements of Comprehensive Income
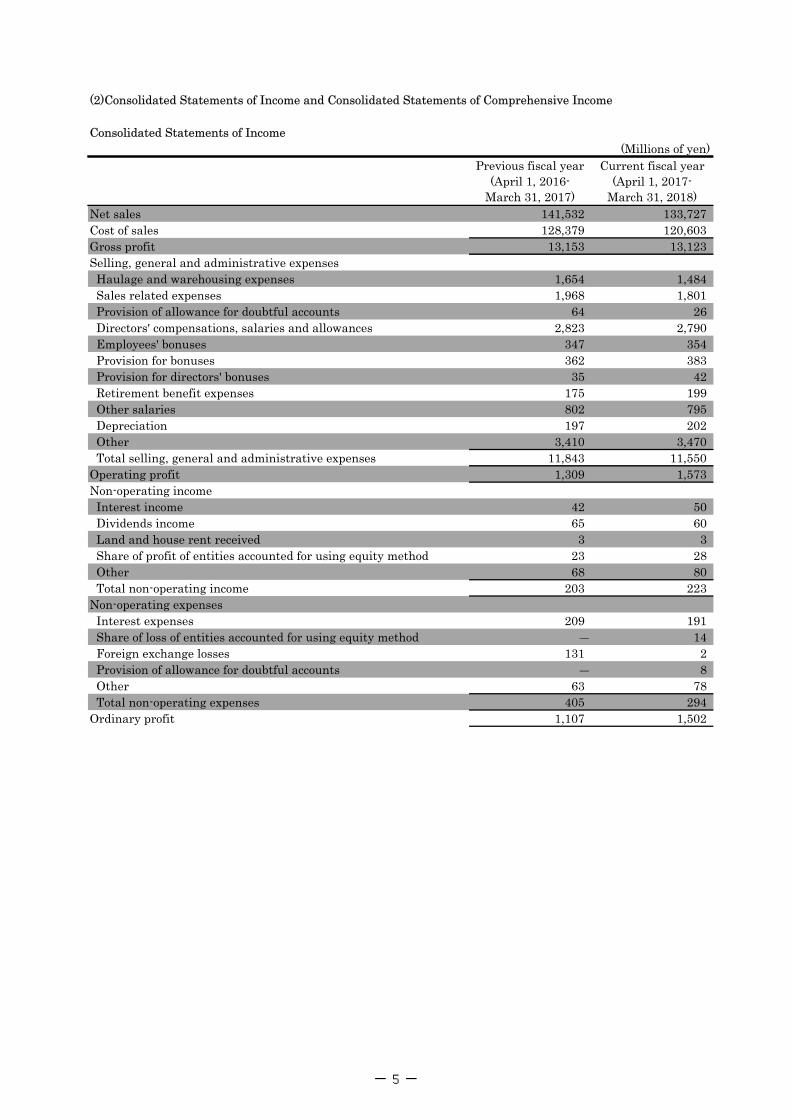
Consolidated Statements of Income(Millions of yen)
Previous fiscal year(April 1, 2016-
March 31, 2017)
Current fiscal year(April 1, 2017-
March 31, 2018)Net sales 141,532 133,727Cost of sales 128,379 120,603Gross profit 13,153 13,123Selling, general and administrative expenses Haulage and warehousing expenses 1,654 1,484 Sales related expenses 1,968 1,801 Provision of allowance for doubtful accounts 64 26 Directors' compensations, salaries and allowances 2,823 2,790 Employees' bonuses 347 354 Provision for bonuses 362 383 Provision for directors' bonuses 35 42 Retirement benefit expenses 175 199 Other salaries 802 795 Depreciation 197 202 Other 3,410 3,470 Total selling, general and administrative expenses 11,843 11,550Operating profit 1,309 1,573Non-operating income Interest income 42 50 Dividends income 65 60 Land and house rent received 3 3 Share of profit of entities accounted for using equity method 23 28 Other 68 80 Total non-operating income 203 223Non-operating expenses Interest expenses 209 191 Share of loss of entities accounted for using equity method ― 14 Foreign exchange losses 131 2 Provision of allowance for doubtful accounts ― 8 Other 63 78 Total non-operating expenses 405 294Ordinary profit 1,107 1,502
- 5 -
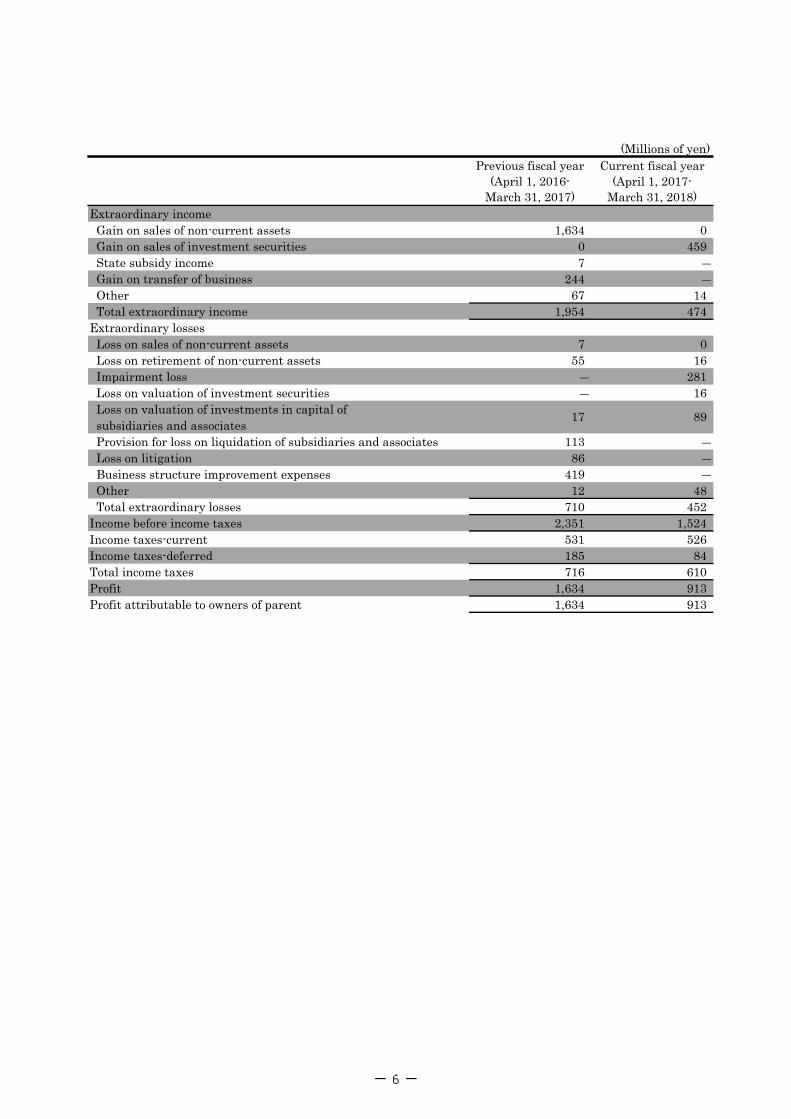
(Millions of yen)Previous fiscal year
(April 1, 2016-March 31, 2017)
Current fiscal year(April 1, 2017-
March 31, 2018)Extraordinary income Gain on sales of non-current assets 1,634 0 Gain on sales of investment securities 0 459 State subsidy income 7 ― Gain on transfer of business 244 ― Other 67 14 Total extraordinary income 1,954 474Extraordinary losses Loss on sales of non-current assets 7 0 Loss on retirement of non-current assets 55 16 Impairment loss ― 281 Loss on valuation of investment securities ― 16 Loss on valuation of investments in capital of subsidiaries and associates Provision for loss on liquidation of subsidiaries and associates 113 ― Loss on litigation 86 ― Business structure improvement expenses 419 ― Other 12 48 Total extraordinary losses 710 452Income before income taxes 2,351 1,524Income taxes-current 531 526Income taxes-deferred 185 84Total income taxes 716 610Profit 1,634 913Profit attributable to owners of parent 1,634 913
17 89
- 6 -
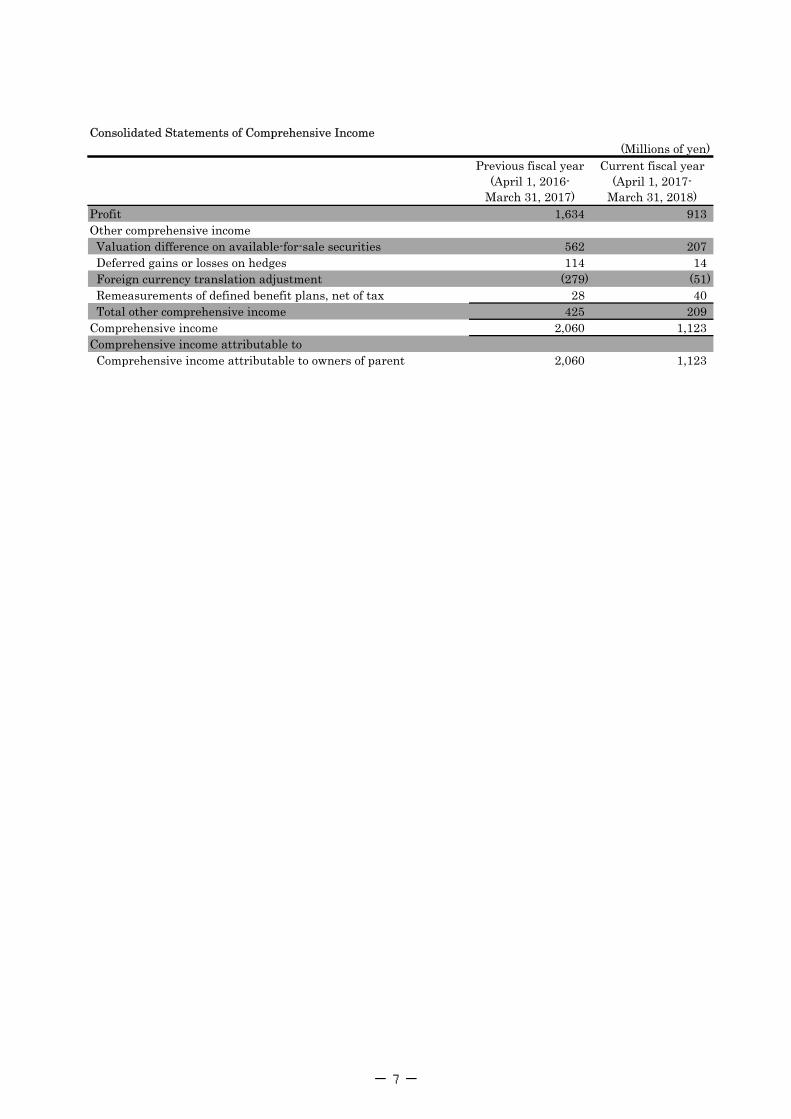
Consolidated Statements of Comprehensive Income(Millions of yen)
Previous fiscal year(April 1, 2016-
March 31, 2017)
Current fiscal year(April 1, 2017-
March 31, 2018)Profit 1,634 913Other comprehensive income Valuation difference on available-for-sale securities 562 207 Deferred gains or losses on hedges 114 14 Foreign currency translation adjustment (279) (51) Remeasurements of defined benefit plans, net of tax 28 40 Total other comprehensive income 425 209Comprehensive income 2,060 1,123Comprehensive income attributable to Comprehensive income attributable to owners of parent 2,060 1,123
- 7 -

(3)Consolidated Statements of Changes in Shareholders' Equity Previous fiscal year (April 1, 2016 - March 31, 2017)
(Millions of yen)
Capital stock Capitalsurplus
Retainedearnings
Treasurystock
Totalshareholders'
equity
Balance at the beginning of period 7,186 855 7,696 (20) 15,718
Changes of items during the period
Dividends of surplus (129) (129)
Profit attributable to owners of parent 1,634 1,634
Purchase of treasury stock (0) (0)
Change of scope of consolidation 123 123
Net changes of items other than shareholders' equity
Total changes of items during the period ― ― 1,628 (0) 1,628
Balance at the end of period 7,186 855 9,325 (20) 17,346
(Millions of yen)
Valuationdifference onavailable-for-sale securities
Deferred gainsor losses on
hedges
Foreigncurrency
translationadjustment
Remeasure-ments of
defined benefitplans
Totalaccumulated
othercomprehensive
income
Balance at the beginning of period (163) (164) 522 (2) 190 ― 15,908
Changes of items during the period
Dividends of surplus (129)
Profit attributable to owners of parent 1,634
Purchase of treasury stock (0)
Change of scope of consolidation 123
Net changes of items other than shareholders' equity 562 114 (279) 28 425 ― 425
Total changes of items during the period 562 114 (279) 28 425 ― 2,054
Balance at the end of period 399 (50) 242 25 616 ― 17,963
Total netassets
Shareholders' equity
Accumulated other comprehensive income
Non-controllinginterests
- 8 -
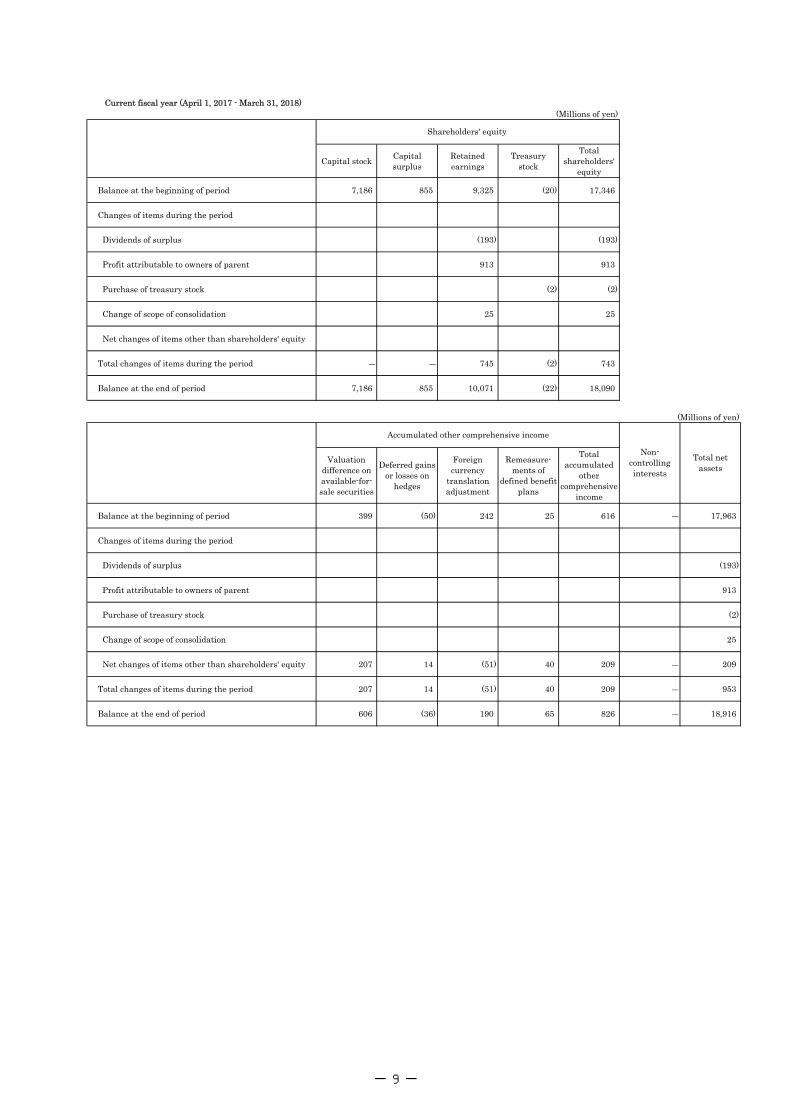
Current fiscal year (April 1, 2017 - March 31, 2018)(Millions of yen)
Capital stock Capitalsurplus
Retainedearnings
Treasurystock
Totalshareholders'
equity
Balance at the beginning of period 7,186 855 9,325 (20) 17,346
Changes of items during the period
Dividends of surplus (193) (193)
Profit attributable to owners of parent 913 913
Purchase of treasury stock (2) (2)
Change of scope of consolidation 25 25
Net changes of items other than shareholders' equity
Total changes of items during the period ― ― 745 (2) 743
Balance at the end of period 7,186 855 10,071 (22) 18,090
(Millions of yen)
Valuationdifference onavailable-for-sale securities
Deferred gainsor losses on
hedges
Foreigncurrency
translationadjustment
Remeasure-ments of
defined benefitplans
Totalaccumulated
othercomprehensive
income
Balance at the beginning of period 399 (50) 242 25 616 ― 17,963
Changes of items during the period
Dividends of surplus (193)
Profit attributable to owners of parent 913
Purchase of treasury stock (2)
Change of scope of consolidation 25
Net changes of items other than shareholders' equity 207 14 (51) 40 209 ― 209
Total changes of items during the period 207 14 (51) 40 209 ― 953
Balance at the end of period 606 (36) 190 65 826 ― 18,916
Total netassets
Shareholders' equity
Accumulated other comprehensive income
Non-controllinginterests
- 9 -
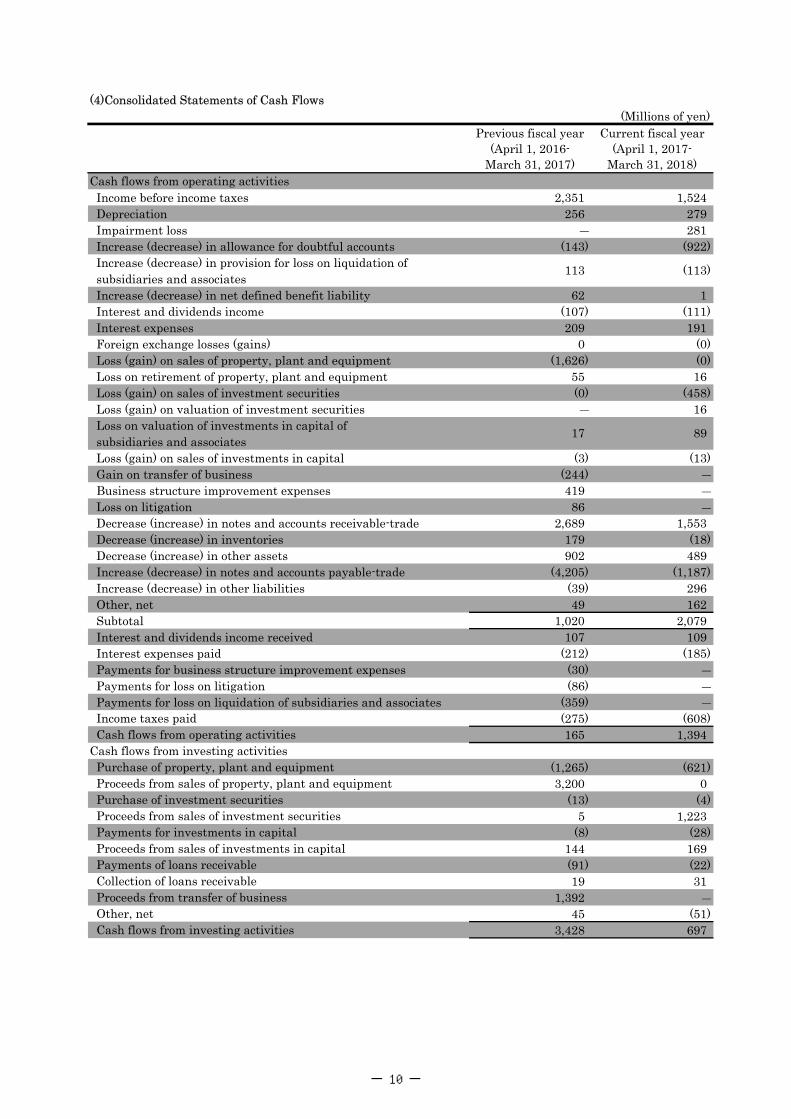
(4)Consolidated Statements of Cash Flows(Millions of yen)
Previous fiscal year(April 1, 2016-
March 31, 2017)
Current fiscal year(April 1, 2017-
March 31, 2018)Cash flows from operating activities Income before income taxes 2,351 1,524 Depreciation 256 279 Impairment loss ― 281 Increase (decrease) in allowance for doubtful accounts (143) (922) Increase (decrease) in provision for loss on liquidation of subsidiaries and associates Increase (decrease) in net defined benefit liability 62 1 Interest and dividends income (107) (111) Interest expenses 209 191 Foreign exchange losses (gains) 0 (0) Loss (gain) on sales of property, plant and equipment (1,626) (0) Loss on retirement of property, plant and equipment 55 16 Loss (gain) on sales of investment securities (0) (458) Loss (gain) on valuation of investment securities ― 16 Loss on valuation of investments in capital of subsidiaries and associates Loss (gain) on sales of investments in capital (3) (13) Gain on transfer of business (244) ― Business structure improvement expenses 419 ― Loss on litigation 86 ― Decrease (increase) in notes and accounts receivable-trade 2,689 1,553 Decrease (increase) in inventories 179 (18) Decrease (increase) in other assets 902 489 Increase (decrease) in notes and accounts payable-trade (4,205) (1,187) Increase (decrease) in other liabilities (39) 296 Other, net 49 162 Subtotal 1,020 2,079 Interest and dividends income received 107 109 Interest expenses paid (212) (185) Payments for business structure improvement expenses (30) ― Payments for loss on litigation (86) ― Payments for loss on liquidation of subsidiaries and associates (359) ― Income taxes paid (275) (608) Cash flows from operating activities 165 1,394Cash flows from investing activities Purchase of property, plant and equipment (1,265) (621) Proceeds from sales of property, plant and equipment 3,200 0 Purchase of investment securities (13) (4) Proceeds from sales of investment securities 5 1,223 Payments for investments in capital (8) (28) Proceeds from sales of investments in capital 144 169 Payments of loans receivable (91) (22) Collection of loans receivable 19 31 Proceeds from transfer of business 1,392 ― Other, net 45 (51) Cash flows from investing activities 3,428 697
113 (113)
17 89
- 10 -
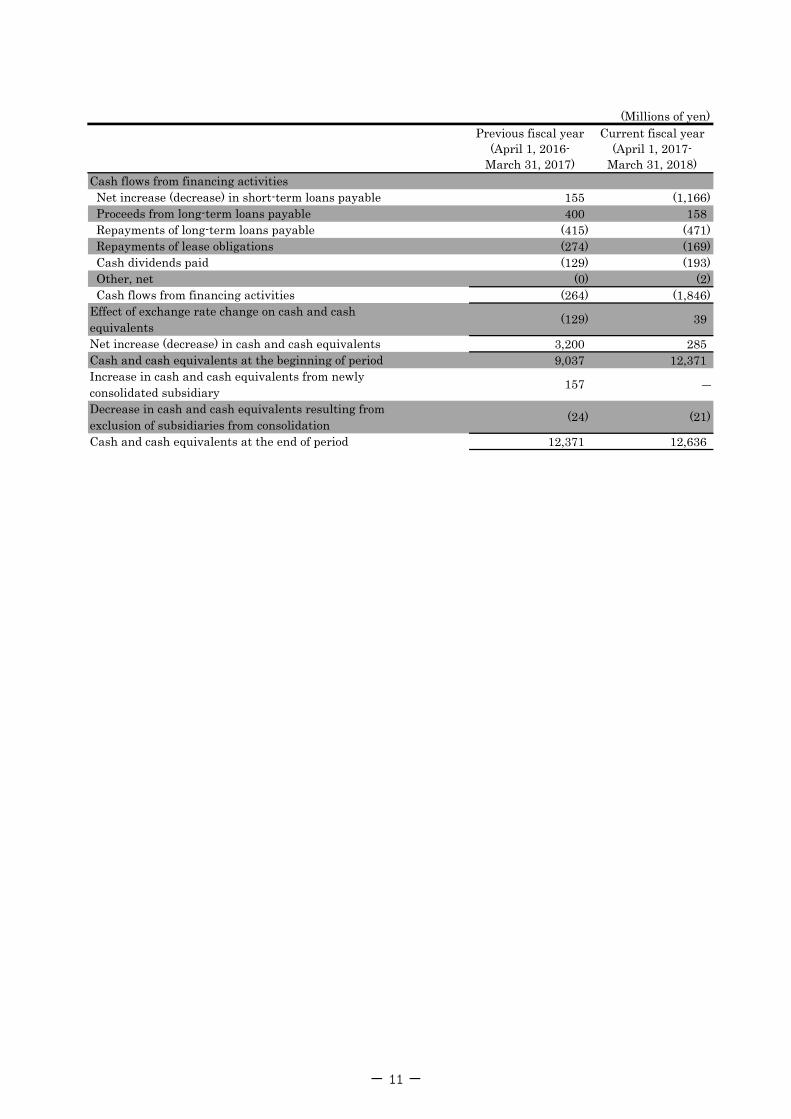
(Millions of yen)Previous fiscal year
(April 1, 2016-March 31, 2017)
Current fiscal year(April 1, 2017-
March 31, 2018)Cash flows from financing activities Net increase (decrease) in short-term loans payable 155 (1,166) Proceeds from long-term loans payable 400 158 Repayments of long-term loans payable (415) (471) Repayments of lease obligations (274) (169) Cash dividends paid (129) (193) Other, net (0) (2) Cash flows from financing activities (264) (1,846)Effect of exchange rate change on cash and cashequivalentsNet increase (decrease) in cash and cash equivalents 3,200 285Cash and cash equivalents at the beginning of period 9,037 12,371Increase in cash and cash equivalents from newlyconsolidated subsidiaryDecrease in cash and cash equivalents resulting fromexclusion of subsidiaries from consolidationCash and cash equivalents at the end of period 12,371 12,636
(24) (21)
157 ―
(129) 39
- 11 -


![Summary of Consolidated Financial Statements ... - lion.co.jp · Summary of Consolidated Financial Statements for the Year Ended . December 31, 2017 [Japanese Standard] February 9,](https://img.pdfslide.net/doc/110x75/5d2d8d7a88c993384b8c2c77/summary-of-consolidated-financial-statements-lioncojp-summary-of-consolidated.jpg)

![Summary of Consolidated Financial Statements for … of Consolidated Financial Statements for the Year Ended . December 31, 2017 [Japanese Standard] February 9, 2018 . Company name:](https://img.pdfslide.net/doc/110x75/5b08bae47f8b9af0438cb6d3/summary-of-consolidated-financial-statements-for-of-consolidated-financial-statements.jpg)
![SUMMARY OF FINANCIAL STATEMENTS [IFRS] (CONSOLIDATED) Financial Results … · SUMMARY OF FINANCIAL STATEMENTS [IFRS] (CONSOLIDATED) Financial Results for the Fiscal Year Ended March](https://img.pdfslide.net/doc/110x75/5e92676282566416065a9900/summary-of-financial-statements-ifrs-consolidated-financial-results-summary.jpg)