Embed Size (px)
Citation preview
Summative Assessment #2 for Statistical Sleuths
Table of Contents
Item Page Number(s) Summative Assessment #2 Instructions 2 Scoring Criteria for Summative Assessment #2 3 - 5 Short-Answer Question Rubric 6 Total Points Awarded for Summative Assessment #2 7 Summative Assessment #2 8 - 13
Statistical Sleuths © 2001, 2003 www.BeaconLearningCenter.com Rev. 08.01.03 1
Collecting Clues and Analyzing Answers Summative Assessment #2
Constructed Response Duration: 40-50 minutes Standard(s) Assessed: MA.E.1.3.1.8.2, MA.E.1.3.2.8.1, MA.E.1.3.2.8.3 Description of Assessment Activity: Given sets of collected data, students organize information in tables, and construct bar and circle graphs and box-and-whisker graphs to analyze the data. Students are asked to explain why data is often organized in different ways (bar, circle, and line graphs), and when the range, average, median, and mode can be used to interpret collected data. After organizing, displaying, and analyzing data, students draw conclusions that can be supported by the data in order to solve a problem. Teacher Directions: Prepare separate copies of Collecting Clues and Analyzing Answers (see Associated file below), which determine students’ comprehension of the process of data collection and analysis. Explain to students that this assignment will be scored for a grade. Student Directions: Mike, one of the data detectives in our unit, has been investigating the homework habits of his classmates in order to answer the following question: How can I make a good grade on my homework? The results of his investigation are presented on the following pages. Read each section carefully and follow the directions given. Help Mike analyze the clues he has collected so that he can find an answer to his perplexing problem! Scoring Method & Criteria: See the Scoring Criteria for Summative Assessment #2, Short-Answer Question Rubric and Total Points Awarded for Summative Assessment #2 to evaluate student work.
Statistical Sleuths © 2001, 2003 www.BeaconLearningCenter.com Rev. 08.01.03 2
Scoring Criteria for Summative Assessment #2
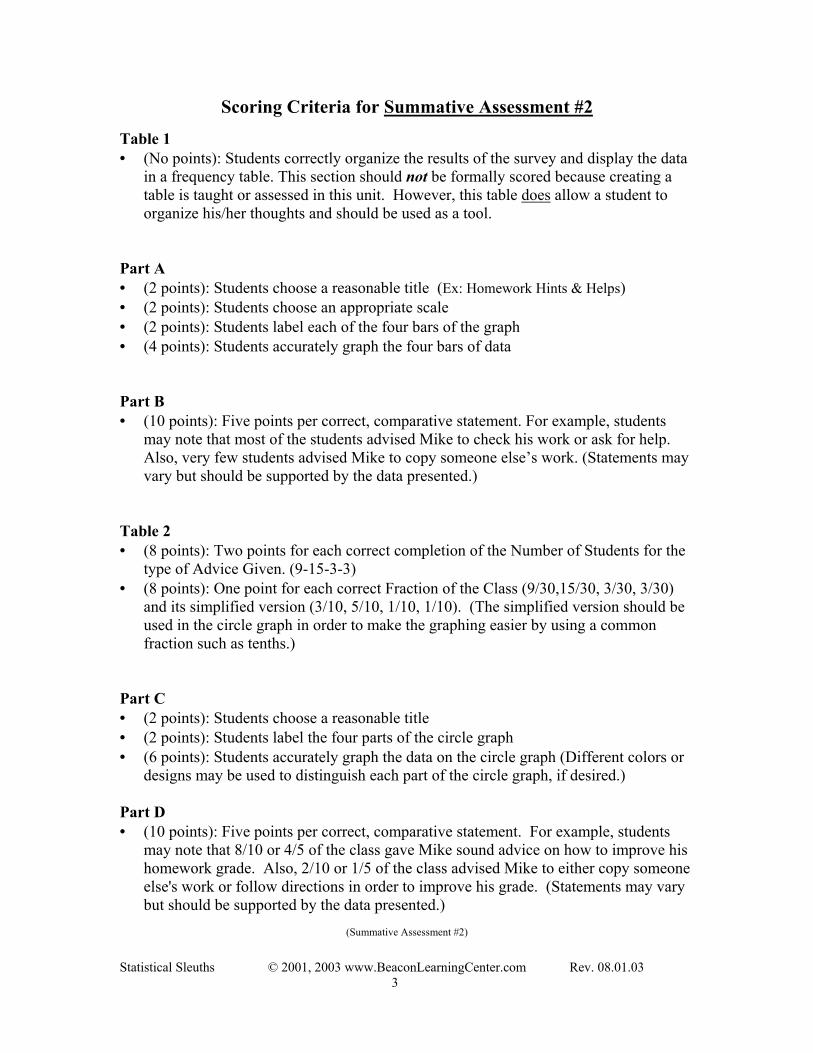
Table 1 • (No points): Students correctly organize the results of the survey and display the data
in a frequency table. This section should not be formally scored because creating a table is taught or assessed in this unit. However, this table does allow a student to organize his/her thoughts and should be used as a tool.
Part A • (2 points): Students choose a reasonable title (Ex: Homework Hints & Helps) • (2 points): Students choose an appropriate scale • (2 points): Students label each of the four bars of the graph • (4 points): Students accurately graph the four bars of data Part B • (10 points): Five points per correct, comparative statement. For example, students
may note that most of the students advised Mike to check his work or ask for help. Also, very few students advised Mike to copy someone else’s work. (Statements may vary but should be supported by the data presented.)
Table 2 • (8 points): Two points for each correct completion of the Number of Students for the
type of Advice Given. (9-15-3-3) • (8 points): One point for each correct Fraction of the Class (9/30,15/30, 3/30, 3/30)
and its simplified version (3/10, 5/10, 1/10, 1/10). (The simplified version should be used in the circle graph in order to make the graphing easier by using a common fraction such as tenths.)
Part C • (2 points): Students choose a reasonable title • (2 points): Students label the four parts of the circle graph • (6 points): Students accurately graph the data on the circle graph (Different colors or
designs may be used to distinguish each part of the circle graph, if desired.) Part D • (10 points): Five points per correct, comparative statement. For example, students
may note that 8/10 or 4/5 of the class gave Mike sound advice on how to improve his homework grade. Also, 2/10 or 1/5 of the class advised Mike to either copy someone else's work or follow directions in order to improve his grade. (Statements may vary but should be supported by the data presented.)
(Summative Assessment #2)
Statistical Sleuths © 2001, 2003 www.BeaconLearningCenter.com Rev. 08.01.03 3
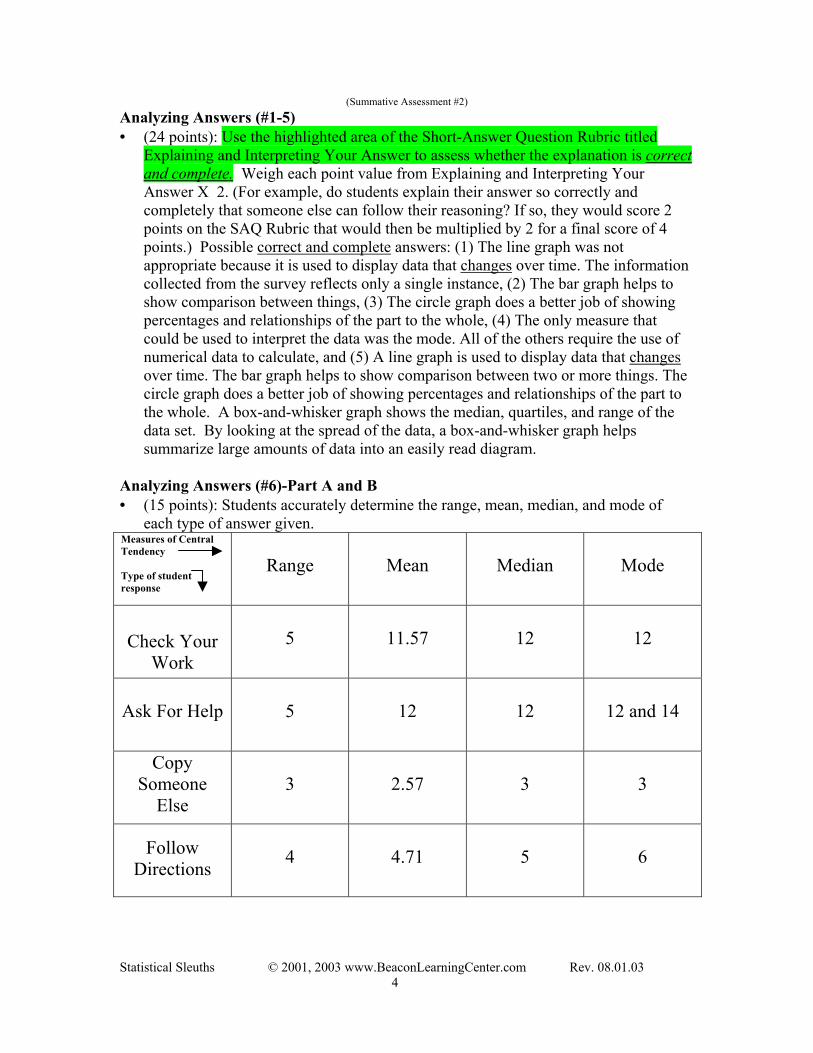
(Summative Assessment #2) Analyzing Answers (#1-5) • (24 points): Use the highlighted area of the Short-Answer Question Rubric titled
Explaining and Interpreting Your Answer to assess whether the explanation is correct and complete. Weigh each point value from Explaining and Interpreting Your Answer X 2. (For example, do students explain their answer so correctly and completely that someone else can follow their reasoning? If so, they would score 2 points on the SAQ Rubric that would then be multiplied by 2 for a final score of 4 points.) Possible correct and complete answers: (1) The line graph was not appropriate because it is used to display data that changes over time. The information collected from the survey reflects only a single instance, (2) The bar graph helps to show comparison between things, (3) The circle graph does a better job of showing percentages and relationships of the part to the whole, (4) The only measure that could be used to interpret the data was the mode. All of the others require the use of numerical data to calculate, and (5) A line graph is used to display data that changes over time. The bar graph helps to show comparison between two or more things. The circle graph does a better job of showing percentages and relationships of the part to the whole. A box-and-whisker graph shows the median, quartiles, and range of the data set. By looking at the spread of the data, a box-and-whisker graph helps summarize large amounts of data into an easily read diagram.
Analyzing Answers (#6)-Part A and B • (15 points): Students accurately determine the range, mean, median, and mode of
each type of answer given. Measures of Central Tendency Type of student response
Range
Mean
Median
Mode
Check Your Work
5
11.57
12
12
Ask For Help
5
12
12
12 and 14
Copy Someone
Else
3
2.57
3
3
Follow Directions
4
4.71
5
6
Statistical Sleuths © 2001, 2003 www.BeaconLearningCenter.com Rev. 08.01.03 4
Analyzing Answers (#6)-Part C (5 points) Use the Long-Answer Question Rubric to assess students' responses to the prompt: Based on the range and measures of central tendency identified above, decide which method a student should use to make good grades on their homework. (See Unit Plan associated file). Explain if it was the range, mean, median, or mode that led you to your decision. (A possible answer: By Asking for Help, a student could make good grades on homework. The highest number of responses for this type of Help was fourteen, which was also the mode for that category.
Statistical Sleuths © 2001, 2003 www.BeaconLearningCenter.com Rev. 08.01.03 5
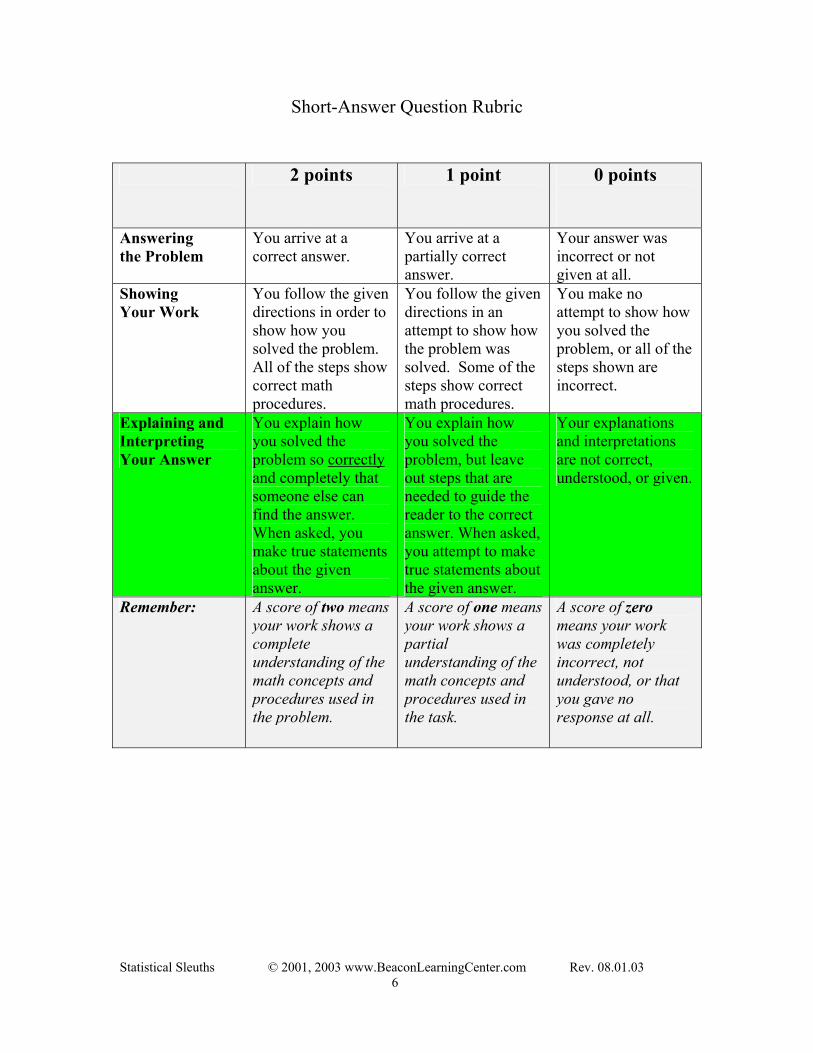
Short-Answer Question Rubric 2 points 1 point 0 points
Answering the Problem
You arrive at a correct answer.
You arrive at a partially correct answer.
Your answer was incorrect or not given at all.
Showing Your Work
You follow the given directions in order to show how you solved the problem. All of the steps show correct math procedures.
You follow the given directions in an attempt to show how the problem was solved. Some of the steps show correct math procedures.
You make no attempt to show how you solved the problem, or all of the steps shown are incorrect.
Explaining and Interpreting Your Answer
You explain how you solved the problem so correctly and completely that someone else can find the answer. When asked, you make true statements about the given answer.
You explain how you solved the problem, but leave out steps that are needed to guide the reader to the correct answer. When asked, you attempt to make true statements about the given answer.
Your explanations and interpretations are not correct, understood, or given.
Remember: A score of two means your work shows a complete understanding of the math concepts and procedures used in the problem.
A score of one means your work shows a partial understanding of the math concepts and procedures used in the task.
A score of zero means your work was completely incorrect, not understood, or that you gave no response at all.
Statistical Sleuths © 2001, 2003 www.BeaconLearningCenter.com Rev. 08.01.03 6
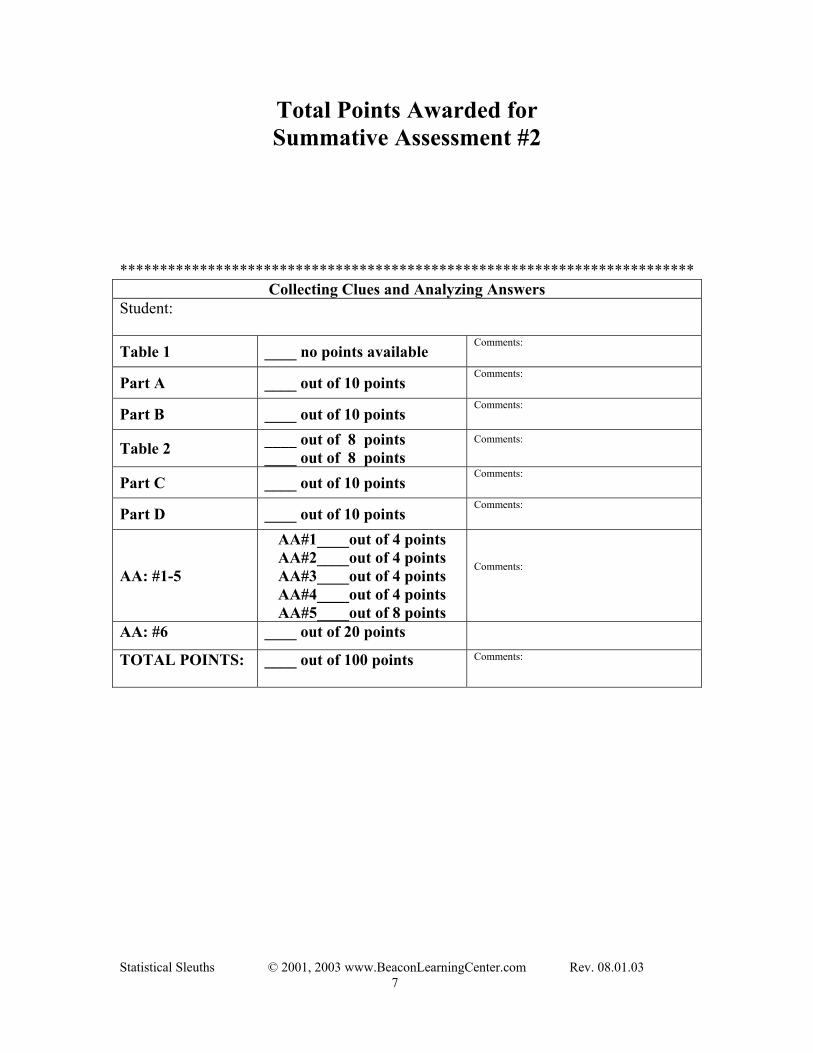
Total Points Awarded for Summative Assessment #2
************************************************************************
Collecting Clues and Analyzing Answers Student: Table 1 ____ no points available
Comments:
Part A ____ out of 10 points
Comments:
Part B ____ out of 10 points Comments:
Table 2 ____ out of 8 points ____ out of 8 points
Comments:
Part C ____ out of 10 points Comments:
Part D ____ out of 10 points Comments:
AA: #1-5
AA#1____out of 4 points AA#2____out of 4 points AA#3____out of 4 points AA#4____out of 4 points AA#5____out of 8 points
Comments:
AA: #6 ____ out of 20 points
TOTAL POINTS: ____ out of 100 points
Comments:
Statistical Sleuths © 2001, 2003 www.BeaconLearningCenter.com Rev. 08.01.03 7
Collecting Clues and Analyzing Answers Summative Assessment #2
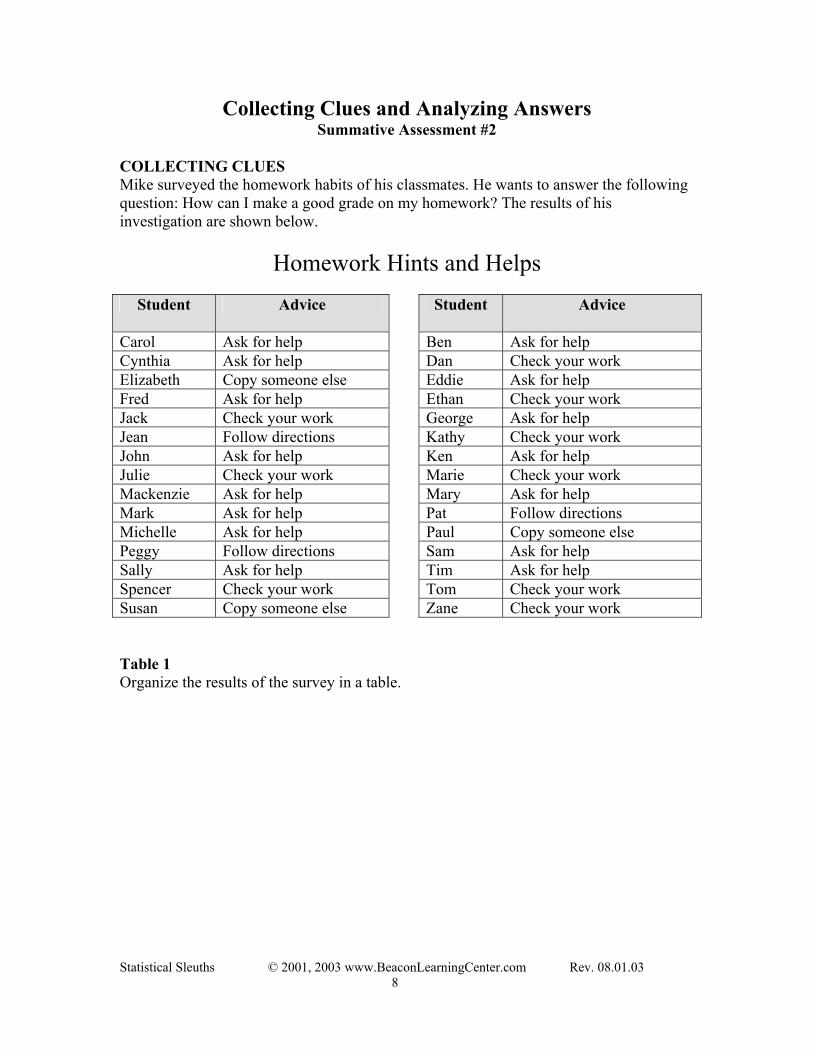
COLLECTING CLUES Mike surveyed the homework habits of his classmates. He wants to answer the following question: How can I make a good grade on my homework? The results of his investigation are shown below.
Homework Hints and Helps
Student Advice Student Advice
Carol Ask for help Ben Ask for help Cynthia Ask for help Dan Check your work Elizabeth Copy someone else Eddie Ask for help Fred Ask for help Ethan Check your work Jack Check your work George Ask for help Jean Follow directions Kathy Check your work John Ask for help Ken Ask for help Julie Check your work Marie Check your work Mackenzie Ask for help Mary Ask for help Mark Ask for help Pat Follow directions Michelle Ask for help Paul Copy someone else Peggy Follow directions Sam Ask for help Sally Ask for help Tim Ask for help Spencer Check your work Tom Check your work Susan Copy someone else
Zane Check your work
Table 1 Organize the results of the survey in a table.
Statistical Sleuths © 2001, 2003 www.BeaconLearningCenter.com Rev. 08.01.03 8
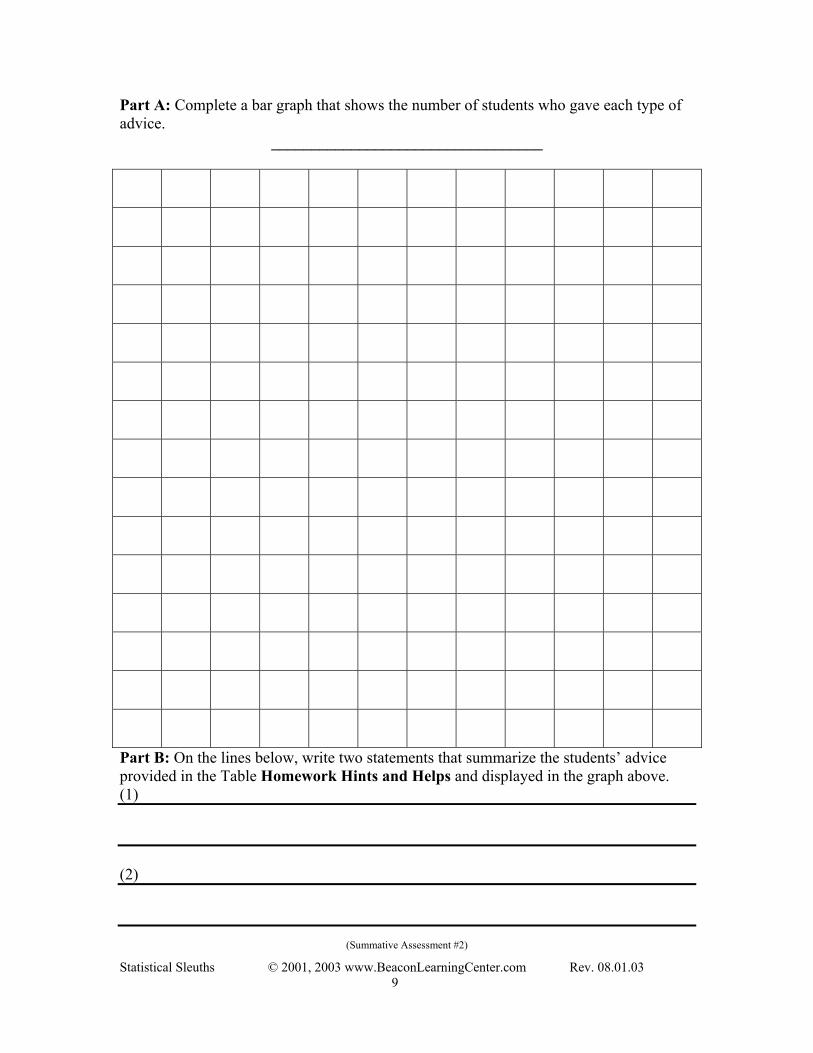
Part A: Complete a bar graph that shows the number of students who gave each type of advice.
__________________________________
Part B: On the lines below, write two statements that summarize the students’ advice provided in the Table Homework Hints and Helps and displayed in the graph above. (1) (2)
(Summative Assessment #2)
Statistical Sleuths © 2001, 2003 www.BeaconLearningCenter.com Rev. 08.01.03 9
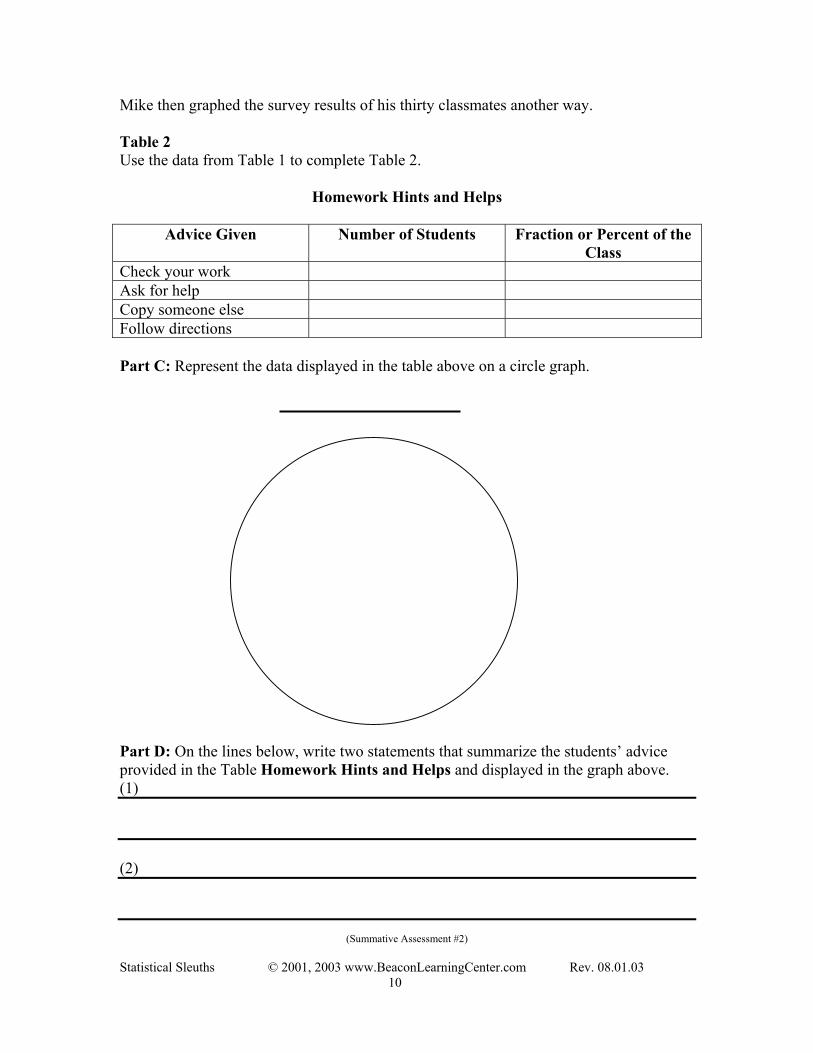
Mike then graphed the survey results of his thirty classmates another way. Table 2 Use the data from Table 1 to complete Table 2.
Homework Hints and Helps
Advice Given Number of Students Fraction or Percent of the Class
Check your work Ask for help Copy someone else Follow directions Part C: Represent the data displayed in the table above on a circle graph. Part D: On the lines below, write two statements that summarize the students’ advice provided in the Table Homework Hints and Helps and displayed in the graph above. (1) (2)
(Summative Assessment #2)
Statistical Sleuths © 2001, 2003 www.BeaconLearningCenter.com Rev. 08.01.03 10
ANALYZING ANSWERS (# 1 – 5) 1. The survey results were not displayed on a line graph. Why not? ________________________________________________________________ ________________________________________________________________ 2. What is the purpose of organizing the survey results in a bar graph? ________________________________________________________________ ________________________________________________________________ 3. Why did Mike choose to organize the results again in a circle graph? ________________________________________________________________ ________________________________________________________________ 4. Mike planned to use the measures of central tendency (mean, median, and mode) to
help him interpret the survey results. Which one(s) could he use with this data, and why?
_______________________________________________________________ _______________________________________________________________ 5. Explain how each of these data displays, circle, line, bar, and box-and-whisker
graphs, lead to a different interpretation of the same data.
______________________________________________________________________
THINK_______ SOLVE_______ EXPLAIN_____
(Summative Assessment #2)
______________________________________________________________________ ______________________________________________________________________ ______________________________________________________________________ ______________________________________________________________________ ______________________________________________________________________
(Summative Assessment #2)
Statistical Sleuths © 2001, 2003 www.BeaconLearningCenter.com Rev. 08.01.03 11
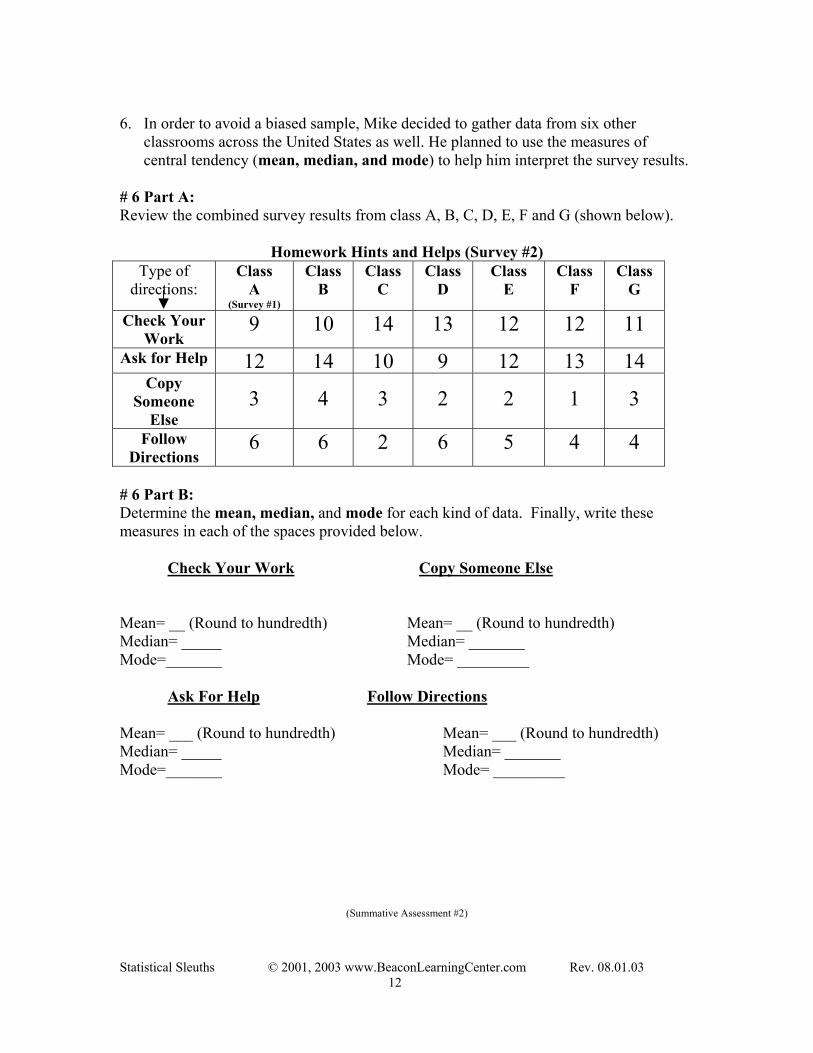
6. In order to avoid a biased sample, Mike decided to gather data from six other
classrooms across the United States as well. He planned to use the measures of central tendency (mean, median, and mode) to help him interpret the survey results.
# 6 Part A: Review the combined survey results from class A, B, C, D, E, F and G (shown below).
Homework Hints and Helps (Survey #2)
Type of directions:
Class A
(Survey #1)
Class B
Class C
Class D
Class E
Class F
Class G
Check Your Work
9 10 14 13 12 12 11 Ask for Help 12 14 10 9 12 13 14
Copy Someone
Else
3
4
3
2
2
1
3
Follow Directions
6 6 2 6 5 4 4 # 6 Part B: Determine the mean, median, and mode for each kind of data. Finally, write these measures in each of the spaces provided below. Check Your Work Copy Someone Else Mean= __ (Round to hundredth) Mean= __ (Round to hundredth) Median= _____ Median= _______ Mode=_______ Mode= _________
Ask For Help Follow Directions Mean= ___ (Round to hundredth) Mean= ___ (Round to hundredth) Median= _____ Median= _______ Mode=_______ Mode= _________
(Summative Assessment #2)
Statistical Sleuths © 2001, 2003 www.BeaconLearningCenter.com Rev. 08.01.03 12

#6 Part C: Based on the measures of central tendency identified above, decide which method a student should use to make good grades on their homework. Write the best Homework Hint based on the statistics. Explain if it was the mean, median, or mode that led you to your decision.
THINK_______ SOLVE_______ EXPLAIN_____
Statistical S
______________________________________________________________________ ______________________________________________________________________ ______________________________________________________________________ ______________________________________________________________________ ______________________________________________________________________ ______________________________________________________________________
(Summative Assessment #2)
leuths © 2001, 2003 www.BeaconLearningCenter.com Rev. 08.01.03 13