Embed Size (px)
Citation preview
Online Student Enrollment Trends:
Summer and Intersession
Summer 2003 – 2014 Intersession 2004 – 2015
Prepared by the Office of Planning, Assessment
And Institutional Research
April 2015
For permission to use, please send request to:
Sean Morton ([email protected])
Page 2 of 14
TABLE OF CONTENTS
Table of ContentsOverview 2
Overview ........................................................................................... 3
Summer Online Course Enrollments ................................................. 3
Summer Online Unduplicated Headcount ........................................ 4
Percentage of Summer Students Taking Online Courses ................. 5
Number of Summer Online Courses Offered .................................... 6
Summer Online Credit Hours ............................................................ 7
Intersession Online Course Enrollments ........................................... 9
Intersession Online Unduplicated Headcount .................................. 10
Percentage of Intersession Students Taking Online Courses ........... 11
Number of Intersession Online Courses Offered .............................. 12
Intersession Online Credit Hours ...................................................... 13
Page 3 of 14
OVERVIEW
Established in the summer of 2003, Frostburg State University’s online course initiative has experienced considerable growth over the last twelve years. In the following report, trends in online course enrollments, unduplicated student headcount, course section offerings, and student credit hours are analyzed for the time periods of summer 2003 to 2014 and Intersession 2004 to 2015.
SUMMER ONLINE COURSE ENROLLMENTS
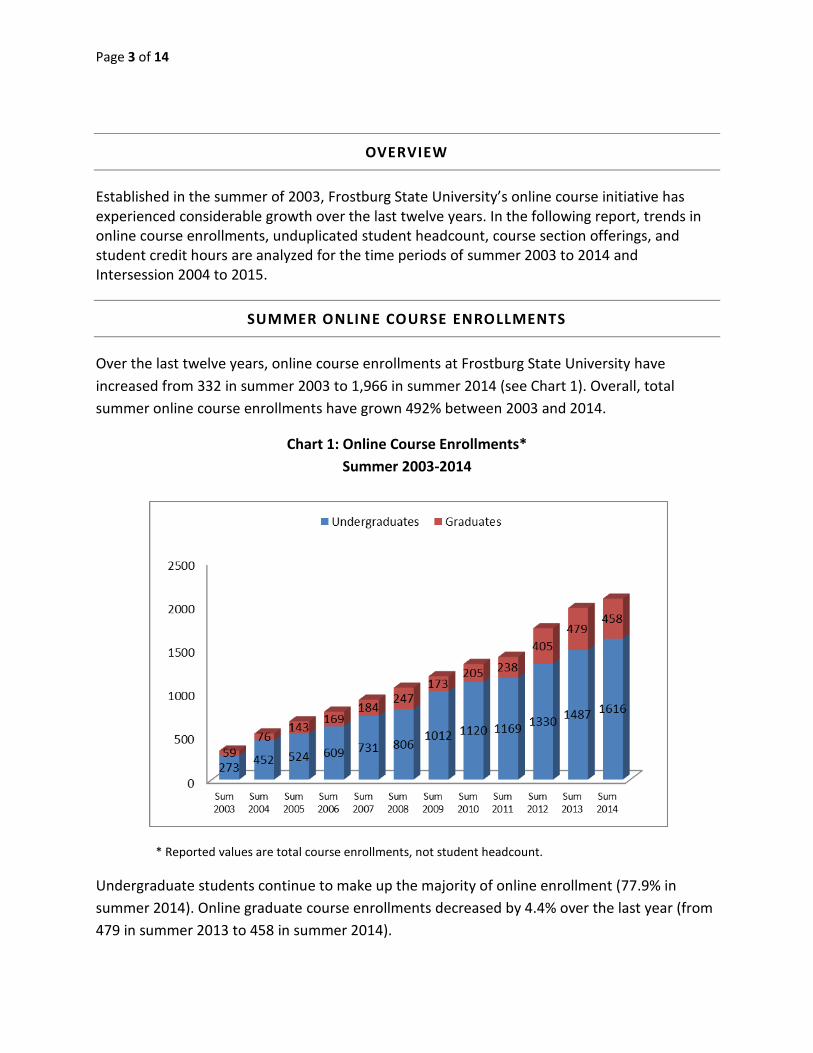
Over the last twelve years, online course enrollments at Frostburg State University have
increased from 332 in summer 2003 to 1,966 in summer 2014 (see Chart 1). Overall, total
summer online course enrollments have grown 492% between 2003 and 2014.
Chart 1: Online Course Enrollments*
Summer 2003-2014
* Reported values are total course enrollments, not student headcount.
Undergraduate students continue to make up the majority of online enrollment (77.9% in
summer 2014). Online graduate course enrollments decreased by 4.4% over the last year (from
479 in summer 2013 to 458 in summer 2014).
Page 4 of 14
SUMMER ONLINE UNDUPLICATED HEADCOUNT
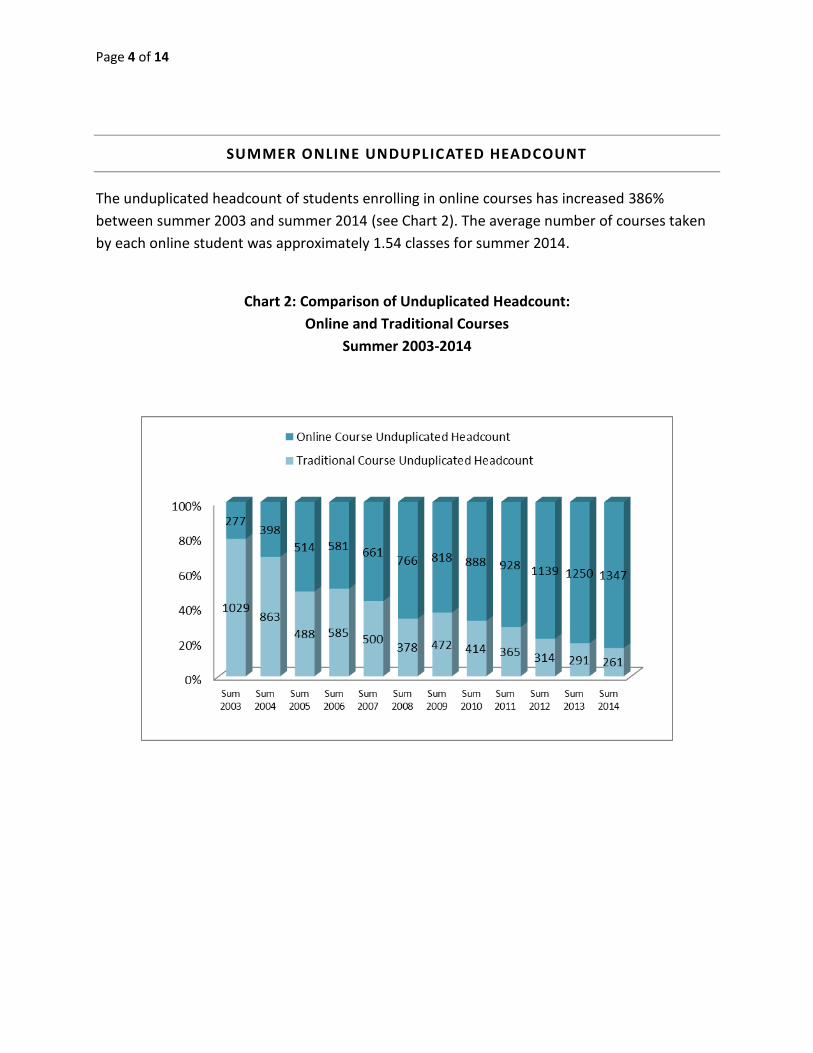
The unduplicated headcount of students enrolling in online courses has increased 386%
between summer 2003 and summer 2014 (see Chart 2). The average number of courses taken
by each online student was approximately 1.54 classes for summer 2014.
Chart 2: Comparison of Unduplicated Headcount:
Online and Traditional Courses
Summer 2003-2014
Page 5 of 14
PERCENTAGE OF SUMMER STUDENTS TAKING ONLINE COURSES
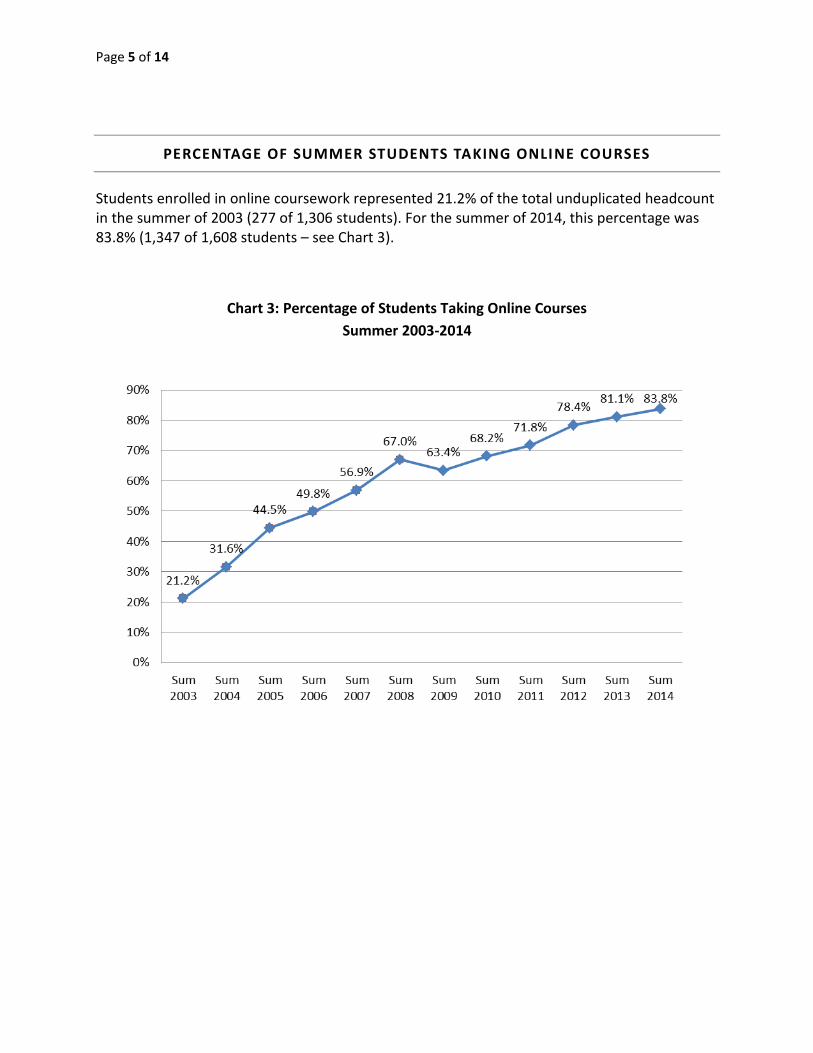
Students enrolled in online coursework represented 21.2% of the total unduplicated headcount in the summer of 2003 (277 of 1,306 students). For the summer of 2014, this percentage was 83.8% (1,347 of 1,608 students – see Chart 3).
Chart 3: Percentage of Students Taking Online Courses
Summer 2003-2014
Page 6 of 14
NUMBER OF SUMMER ONLINE COURSES OFFERED
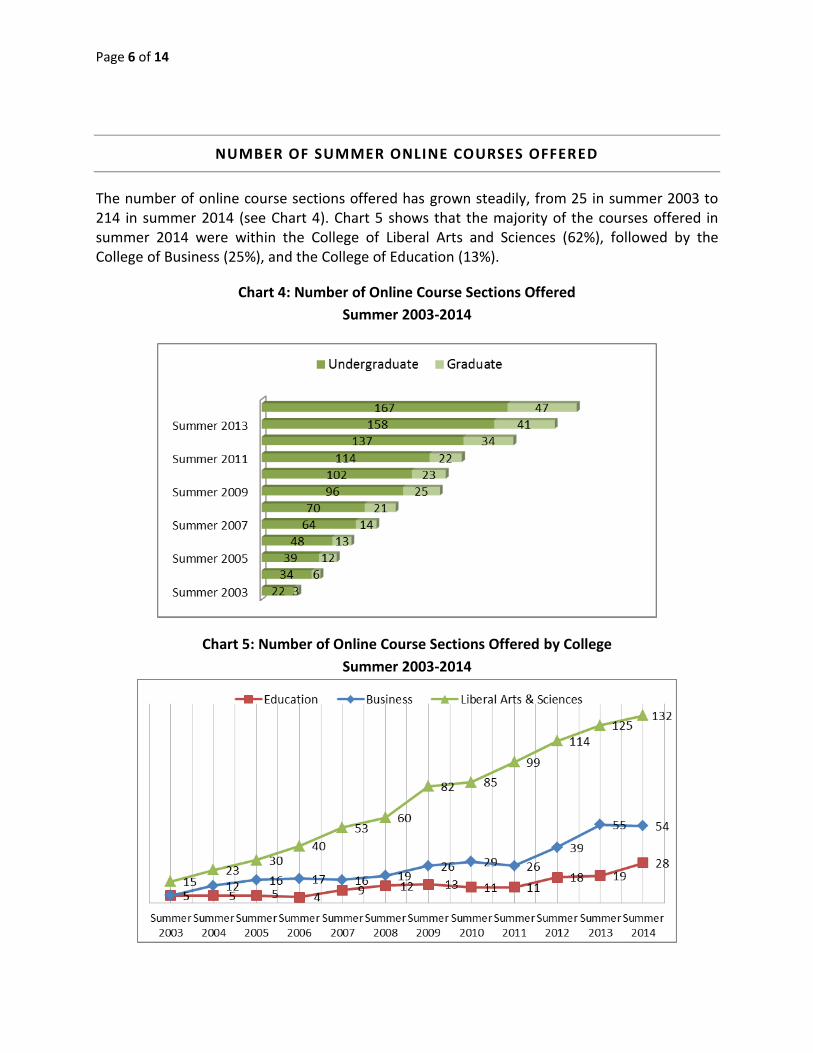
The number of online course sections offered has grown steadily, from 25 in summer 2003 to 214 in summer 2014 (see Chart 4). Chart 5 shows that the majority of the courses offered in summer 2014 were within the College of Liberal Arts and Sciences (62%), followed by the College of Business (25%), and the College of Education (13%).
Chart 4: Number of Online Course Sections Offered
Summer 2003-2014
Chart 5: Number of Online Course Sections Offered by College
Summer 2003-2014
Page 7 of 14
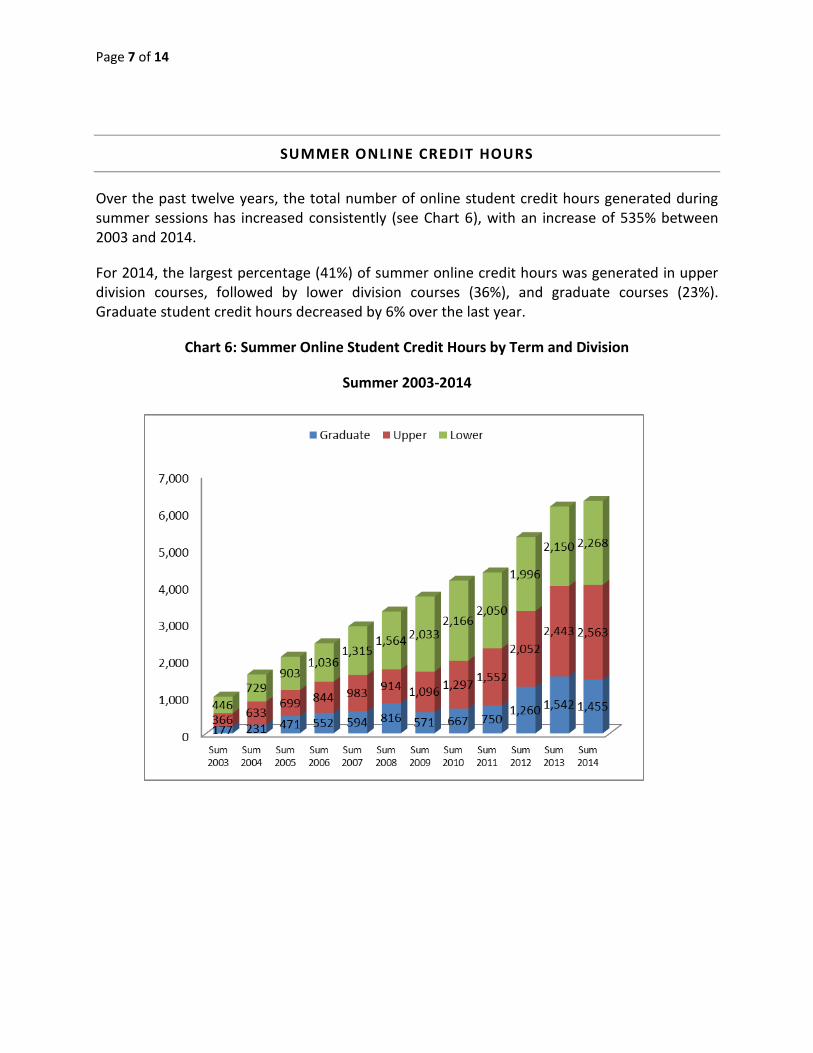
SUMMER ONLINE CREDIT HOURS
Over the past twelve years, the total number of online student credit hours generated during summer sessions has increased consistently (see Chart 6), with an increase of 535% between 2003 and 2014.
For 2014, the largest percentage (41%) of summer online credit hours was generated in upper division courses, followed by lower division courses (36%), and graduate courses (23%). Graduate student credit hours decreased by 6% over the last year.
Chart 6: Summer Online Student Credit Hours by Term and Division
Summer 2003-2014
Page 8 of 14
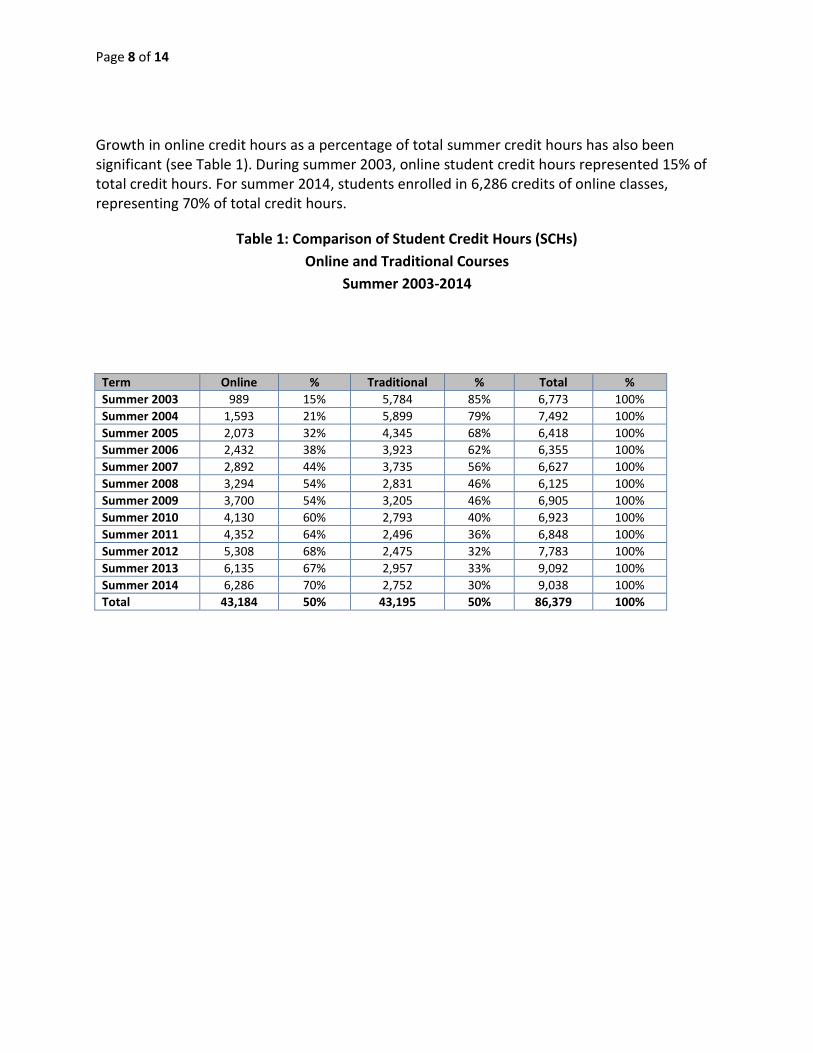
Growth in online credit hours as a percentage of total summer credit hours has also been significant (see Table 1). During summer 2003, online student credit hours represented 15% of total credit hours. For summer 2014, students enrolled in 6,286 credits of online classes, representing 70% of total credit hours.
Table 1: Comparison of Student Credit Hours (SCHs)
Online and Traditional Courses
Summer 2003-2014
Term Online % Traditional % Total %
Summer 2003 989 15% 5,784 85% 6,773 100%
Summer 2004 1,593 21% 5,899 79% 7,492 100%
Summer 2005 2,073 32% 4,345 68% 6,418 100%
Summer 2006 2,432 38% 3,923 62% 6,355 100%
Summer 2007 2,892 44% 3,735 56% 6,627 100%
Summer 2008 3,294 54% 2,831 46% 6,125 100%
Summer 2009 3,700 54% 3,205 46% 6,905 100%
Summer 2010 4,130 60% 2,793 40% 6,923 100%
Summer 2011 4,352 64% 2,496 36% 6,848 100%
Summer 2012 5,308 68% 2,475 32% 7,783 100%
Summer 2013 6,135 67% 2,957 33% 9,092 100%
Summer 2014 6,286 70% 2,752 30% 9,038 100%
Total 43,184 50% 43,195 50% 86,379 100%
Page 9 of 14
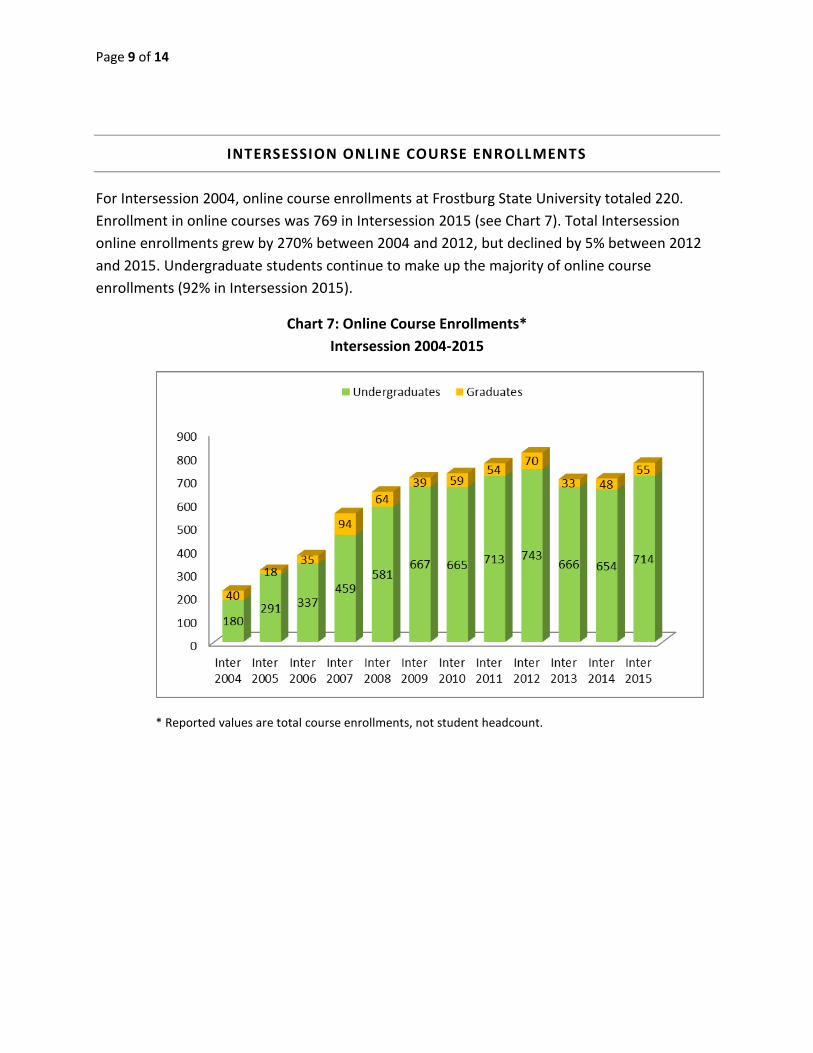
INTERSESSION ONLINE COURSE ENROLLMENTS
For Intersession 2004, online course enrollments at Frostburg State University totaled 220.
Enrollment in online courses was 769 in Intersession 2015 (see Chart 7). Total Intersession
online enrollments grew by 270% between 2004 and 2012, but declined by 5% between 2012
and 2015. Undergraduate students continue to make up the majority of online course
enrollments (92% in Intersession 2015).
Chart 7: Online Course Enrollments*
Intersession 2004-2015
* Reported values are total course enrollments, not student headcount.
Page 10 of 14
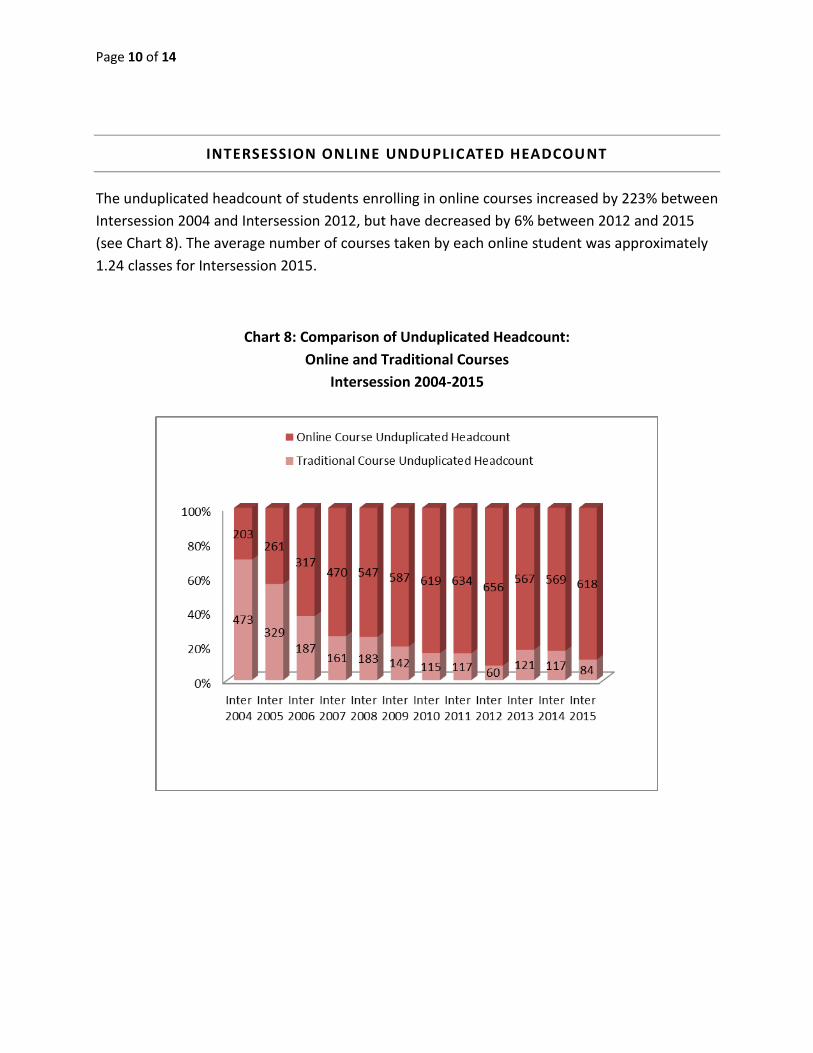
INTERSESSION ONLINE UNDUPLICATED HEADCOUNT
The unduplicated headcount of students enrolling in online courses increased by 223% between
Intersession 2004 and Intersession 2012, but have decreased by 6% between 2012 and 2015
(see Chart 8). The average number of courses taken by each online student was approximately
1.24 classes for Intersession 2015.
Chart 8: Comparison of Unduplicated Headcount:
Online and Traditional Courses
Intersession 2004-2015
Page 11 of 14
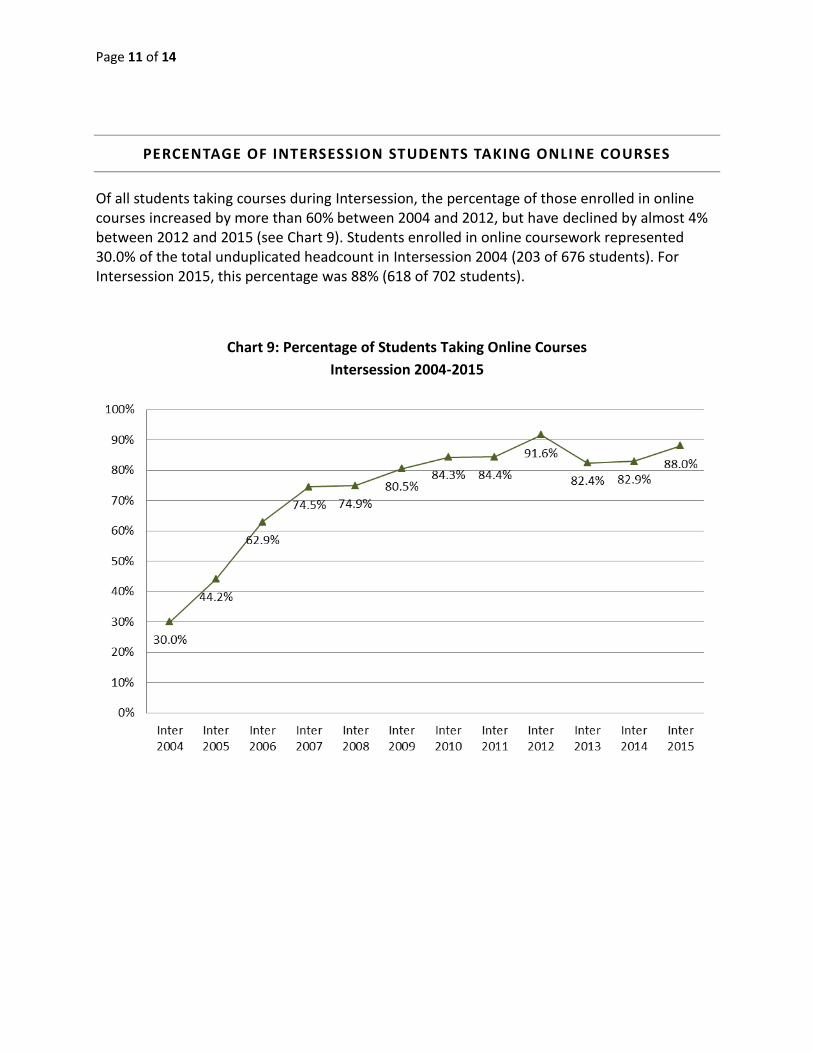
PERCENTAGE OF INTERSESSION STUDENTS TAKING ONLI NE COURSES
Of all students taking courses during Intersession, the percentage of those enrolled in online courses increased by more than 60% between 2004 and 2012, but have declined by almost 4% between 2012 and 2015 (see Chart 9). Students enrolled in online coursework represented 30.0% of the total unduplicated headcount in Intersession 2004 (203 of 676 students). For Intersession 2015, this percentage was 88% (618 of 702 students).
Chart 9: Percentage of Students Taking Online Courses
Intersession 2004-2015
Page 12 of 14
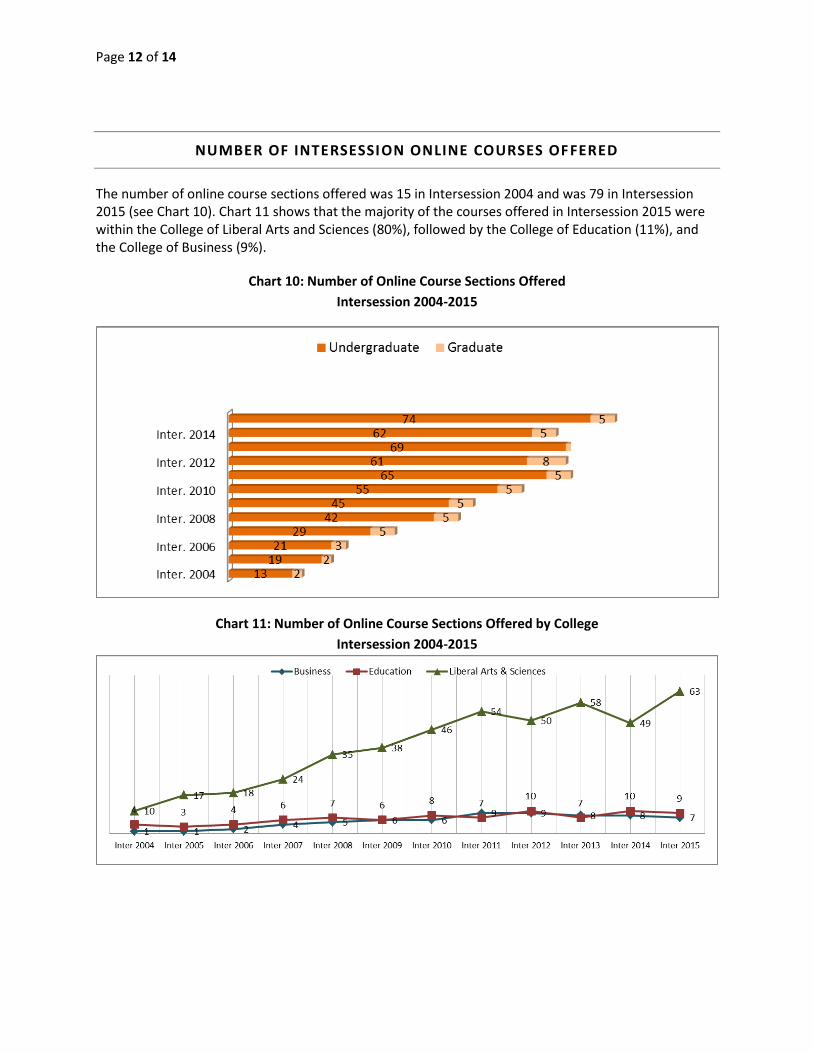
NUMBER OF INTERSESSION ONLINE COURSES OFFERED
The number of online course sections offered was 15 in Intersession 2004 and was 79 in Intersession 2015 (see Chart 10). Chart 11 shows that the majority of the courses offered in Intersession 2015 were within the College of Liberal Arts and Sciences (80%), followed by the College of Education (11%), and the College of Business (9%).
Chart 10: Number of Online Course Sections Offered
Intersession 2004-2015
Chart 11: Number of Online Course Sections Offered by College
Intersession 2004-2015
Page 13 of 14
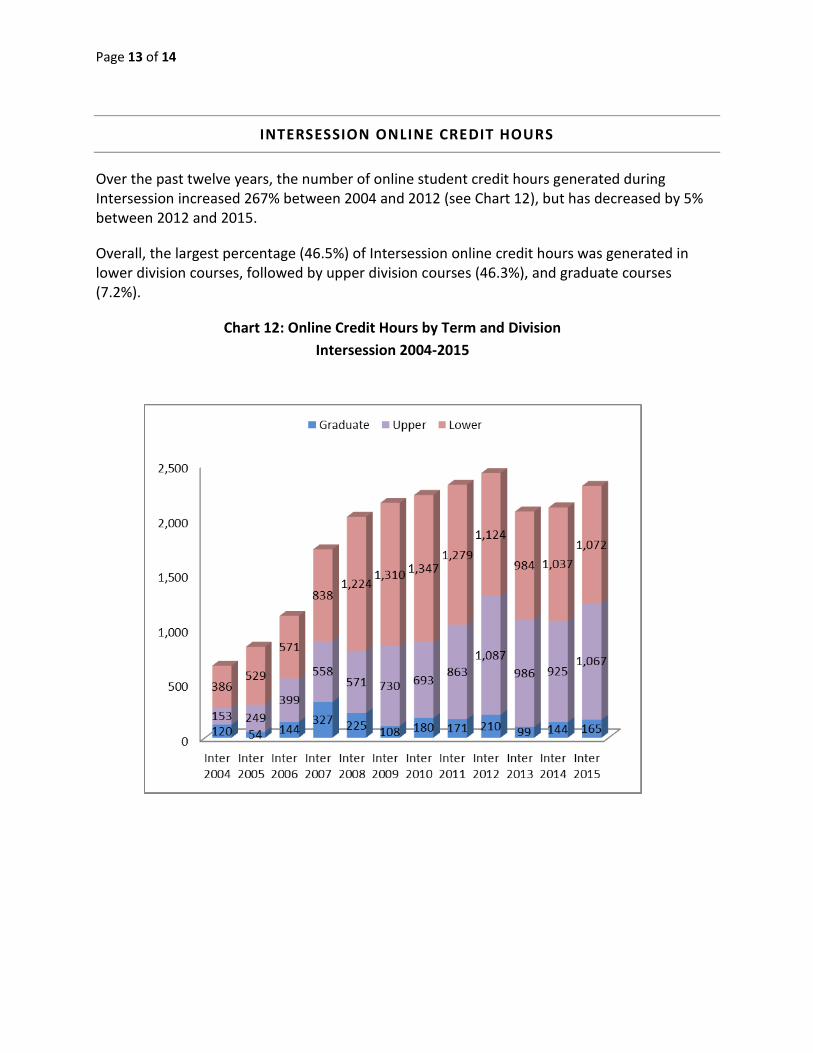
INTERSESSION ONLINE CREDIT HOURS
Over the past twelve years, the number of online student credit hours generated during Intersession increased 267% between 2004 and 2012 (see Chart 12), but has decreased by 5% between 2012 and 2015.
Overall, the largest percentage (46.5%) of Intersession online credit hours was generated in lower division courses, followed by upper division courses (46.3%), and graduate courses (7.2%).
Chart 12: Online Credit Hours by Term and Division
Intersession 2004-2015
Page 14 of 14
Growth in online credit hours as a percentage of total Intersession credit hours has also been significant (see Table 2). During Intersession 2004, online student credit hours represented 28% of total credit hours. For Intersession 2015, students enrolled in 2,304 credits of online classes, representing 84% of total credit hours.
Table 2: Comparison of Student Credit Hours (SCHs)
Online and Traditional Courses
Intersession 2004-2015
Term Online % Traditional % Total %
Inter. 2004 659 28% 1,717 72% 2,376 100%
Inter. 2005 805 39% 1,277 61% 2,082 100%
Inter. 2006 1,114 62% 679 38% 1,793 100%
Inter. 2007 1,723 76% 551 24% 2,274 100%
Inter. 2008 2,020 75% 680 25% 2,700 100%
Inter. 2009 2,148 79% 575 21% 2,723 100%
Inter. 2010 2,220 81% 516 19% 2,736 100%
Inter. 2011 2,313 83% 463 17% 2,776 100%
Inter. 2012 2,421 91% 244 9% 2,665 100%
Inter. 2013 2,069 77% 608 23% 2,677 100%
Inter. 2014 2,106 78% 592 22% 2,698 100%
Inter. 2015 2,304 84% 449 16% 2,753 100%
Total 21,902 72% 8,351 28% 30,253 100%
![Registration Newsletter REQUEST TO GRADUATE Intersession ... · Registration begins April 4, 2016 Registration Newsletter Intersession/Summer Session 2016 In 2016 5 : 2016 t 1 6 ]](https://img.pdfslide.net/doc/110x75/5f79f6b14d31371d4275013d/registration-newsletter-request-to-graduate-intersession-registration-begins.jpg)