Embed Size (px)
Citation preview
2014-2015 Graduation Survey DataSummer and Fall (2014) and Spring (2015)
Marshall University
Office of Assessment and Program Review
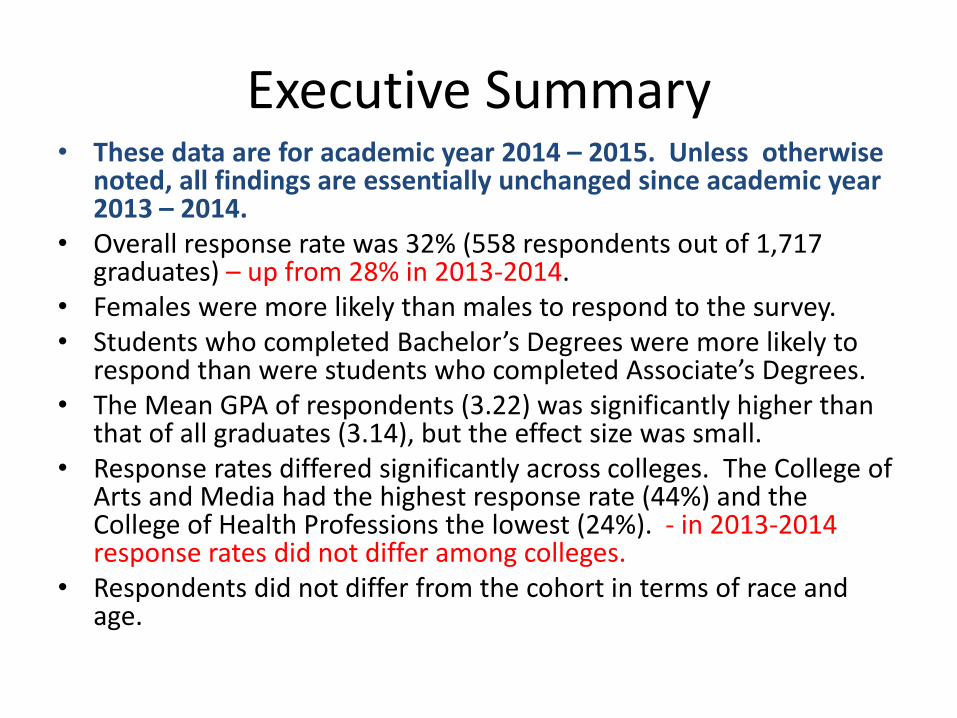
Executive Summary• These data are for academic year 2014 – 2015. Unless otherwise
noted, all findings are essentially unchanged since academic year 2013 – 2014.
• Overall response rate was 32% (558 respondents out of 1,717 graduates) – up from 28% in 2013-2014.
• Females were more likely than males to respond to the survey. • Students who completed Bachelor’s Degrees were more likely to
respond than were students who completed Associate’s Degrees. • The Mean GPA of respondents (3.22) was significantly higher than
that of all graduates (3.14), but the effect size was small. • Response rates differed significantly across colleges. The College of
Arts and Media had the highest response rate (44%) and the College of Health Professions the lowest (24%). - in 2013-2014 response rates did not differ among colleges.
• Respondents did not differ from the cohort in terms of race and age.
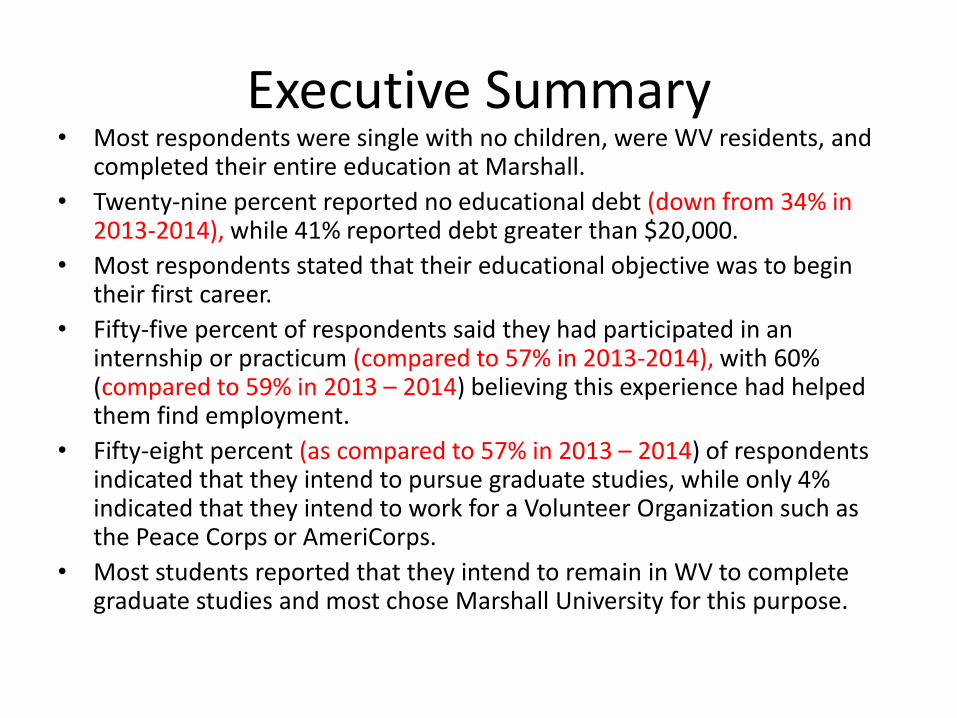
Executive Summary• Most respondents were single with no children, were WV residents, and
completed their entire education at Marshall.
• Twenty-nine percent reported no educational debt (down from 34% in 2013-2014), while 41% reported debt greater than $20,000.
• Most respondents stated that their educational objective was to begin their first career.
• Fifty-five percent of respondents said they had participated in an internship or practicum (compared to 57% in 2013-2014), with 60% (compared to 59% in 2013 – 2014) believing this experience had helped them find employment.
• Fifty-eight percent (as compared to 57% in 2013 – 2014) of respondents indicated that they intend to pursue graduate studies, while only 4% indicated that they intend to work for a Volunteer Organization such as the Peace Corps or AmeriCorps.
• Most students reported that they intend to remain in WV to complete graduate studies and most chose Marshall University for this purpose.
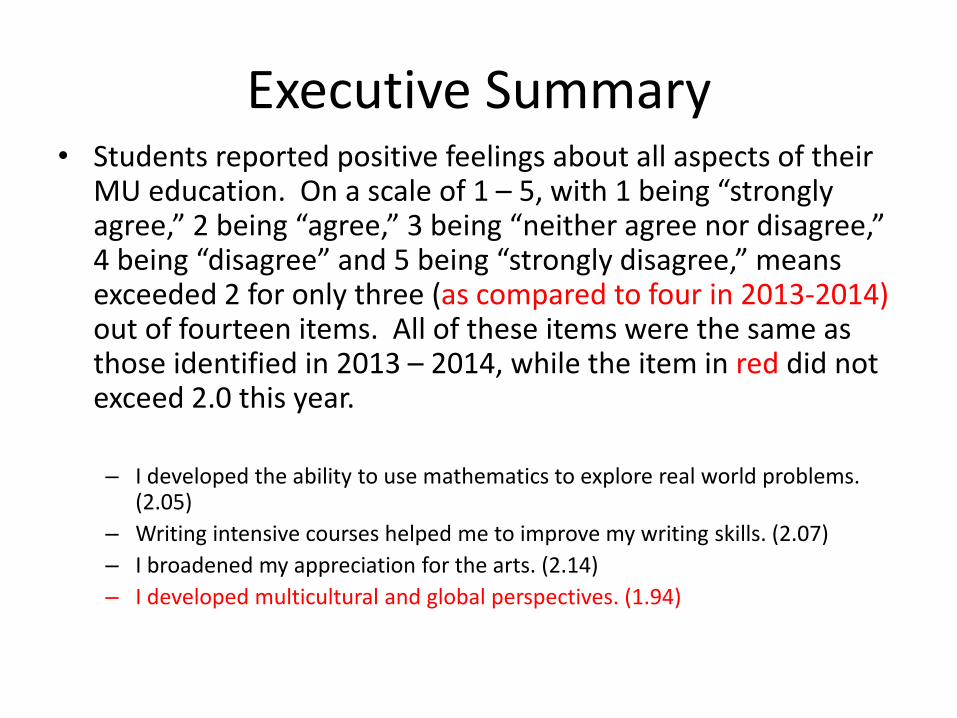
Executive Summary• Students reported positive feelings about all aspects of their
MU education. On a scale of 1 – 5, with 1 being “strongly agree,” 2 being “agree,” 3 being “neither agree nor disagree,” 4 being “disagree” and 5 being “strongly disagree,” means exceeded 2 for only three (as compared to four in 2013-2014) out of fourteen items. All of these items were the same as those identified in 2013 – 2014, while the item in red did not exceed 2.0 this year.
– I developed the ability to use mathematics to explore real world problems. (2.05)
– Writing intensive courses helped me to improve my writing skills. (2.07)
– I broadened my appreciation for the arts. (2.14)
– I developed multicultural and global perspectives. (1.94)
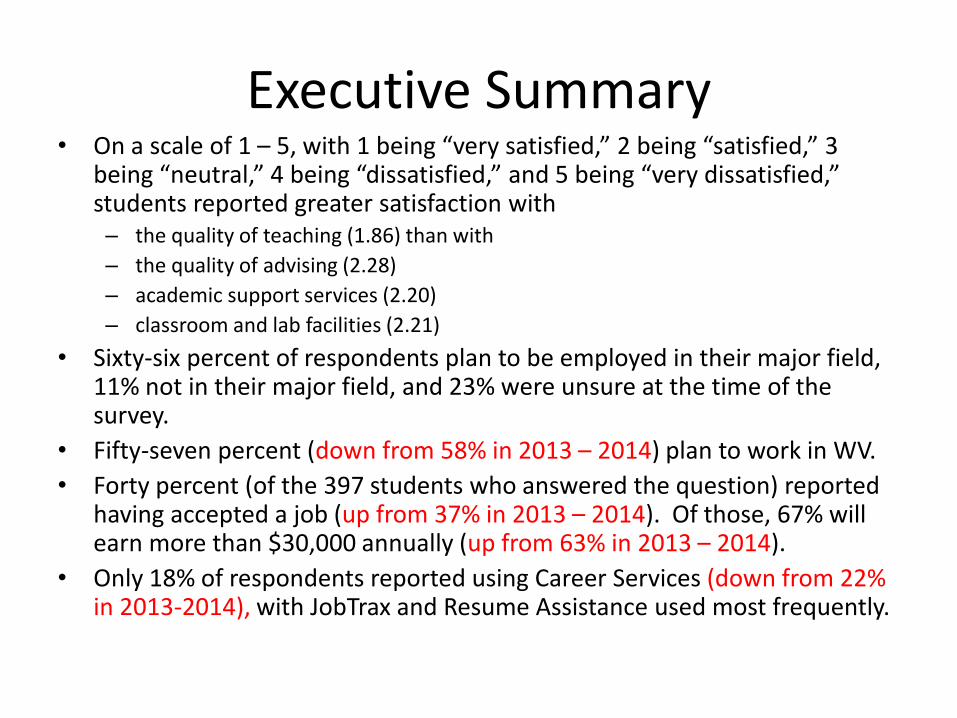
Executive Summary• On a scale of 1 – 5, with 1 being “very satisfied,” 2 being “satisfied,” 3
being “neutral,” 4 being “dissatisfied,” and 5 being “very dissatisfied,” students reported greater satisfaction with – the quality of teaching (1.86) than with
– the quality of advising (2.28)
– academic support services (2.20)
– classroom and lab facilities (2.21)
• Sixty-six percent of respondents plan to be employed in their major field, 11% not in their major field, and 23% were unsure at the time of the survey.
• Fifty-seven percent (down from 58% in 2013 – 2014) plan to work in WV.
• Forty percent (of the 397 students who answered the question) reported having accepted a job (up from 37% in 2013 – 2014). Of those, 67% will earn more than $30,000 annually (up from 63% in 2013 – 2014).
• Only 18% of respondents reported using Career Services (down from 22% in 2013-2014), with JobTrax and Resume Assistance used most frequently.
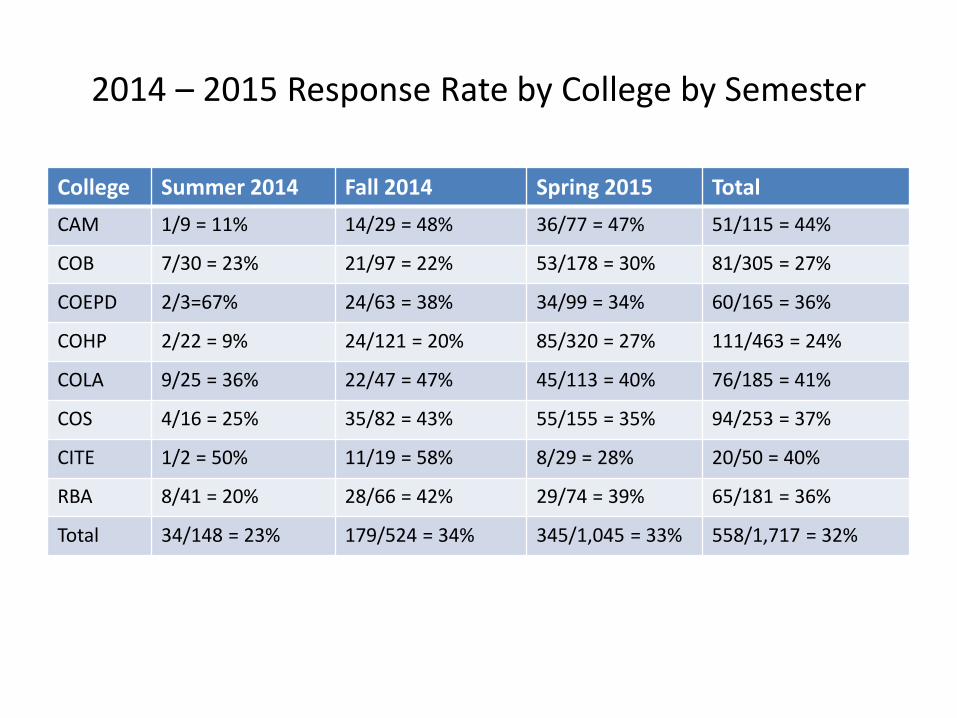
2014 – 2015 Response Rate by College by Semester
College Summer 2014 Fall 2014 Spring 2015 Total
CAM 1/9 = 11% 14/29 = 48% 36/77 = 47% 51/115 = 44%
COB 7/30 = 23% 21/97 = 22% 53/178 = 30% 81/305 = 27%
COEPD 2/3=67% 24/63 = 38% 34/99 = 34% 60/165 = 36%
COHP 2/22 = 9% 24/121 = 20% 85/320 = 27% 111/463 = 24%
COLA 9/25 = 36% 22/47 = 47% 45/113 = 40% 76/185 = 41%
COS 4/16 = 25% 35/82 = 43% 55/155 = 35% 94/253 = 37%
CITE 1/2 = 50% 11/19 = 58% 8/29 = 28% 20/50 = 40%
RBA 8/41 = 20% 28/66 = 42% 29/74 = 39% 65/181 = 36%
Total 34/148 = 23% 179/524 = 34% 345/1,045 = 33% 558/1,717 = 32%
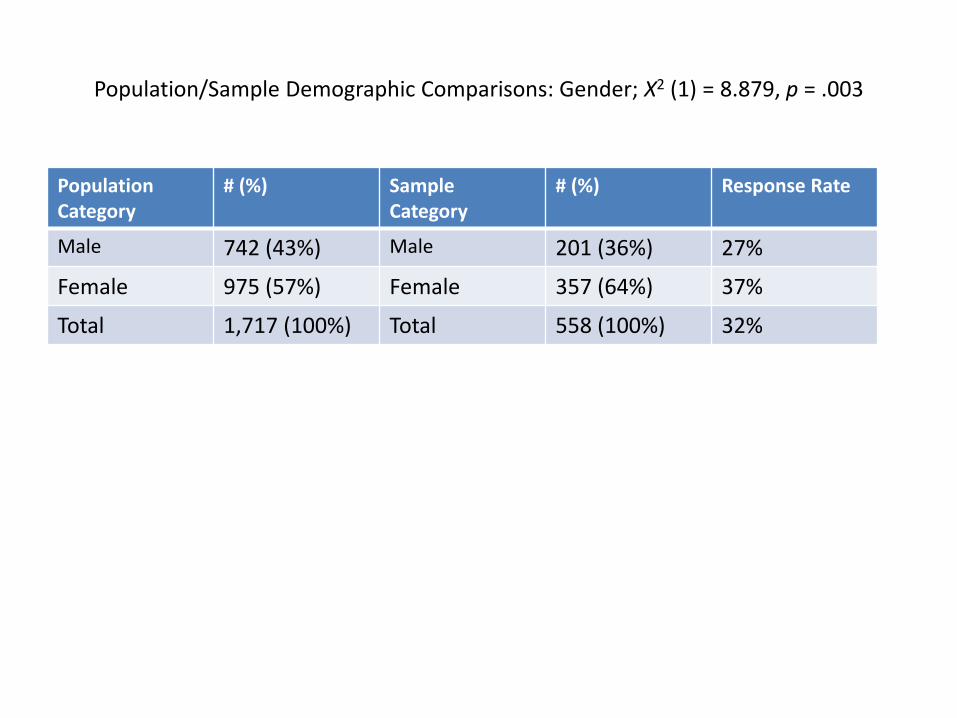
Population/Sample Demographic Comparisons: Gender; X2 (1) = 8.879, p = .003
Population Category
# (%) SampleCategory
# (%) Response Rate
Male 742 (43%) Male 201 (36%) 27%
Female 975 (57%) Female 357 (64%) 37%
Total 1,717 (100%) Total 558 (100%) 32%
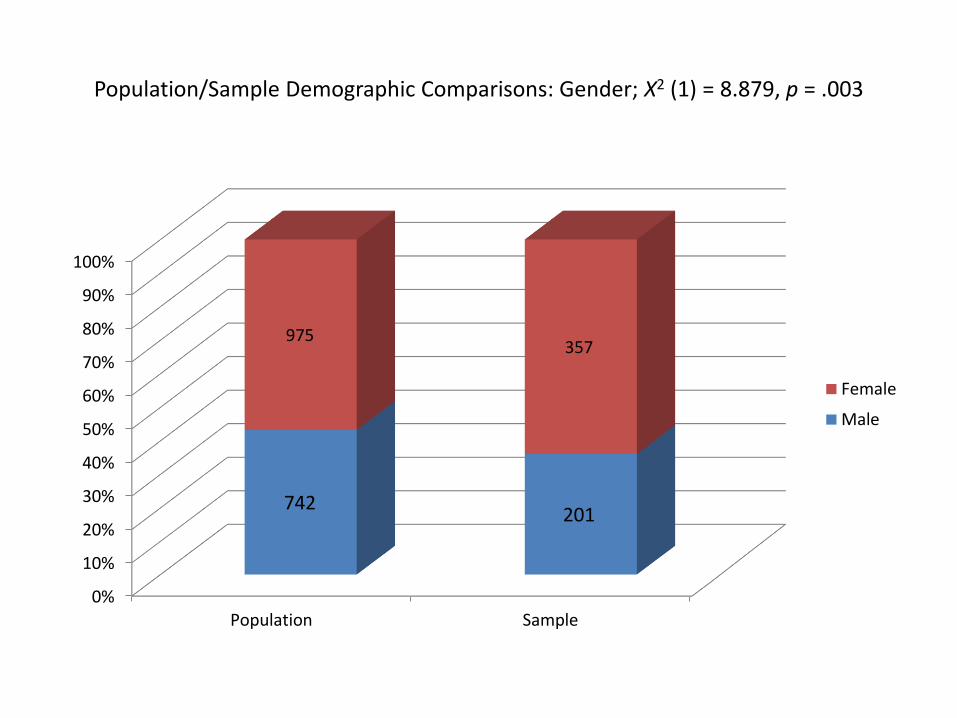
Population/Sample Demographic Comparisons: Gender; X2 (1) = 8.879, p = .003
0%
10%
20%
30%
40%
50%
60%
70%
80%
90%
100%
Population Sample
742201
975357
Female
Male
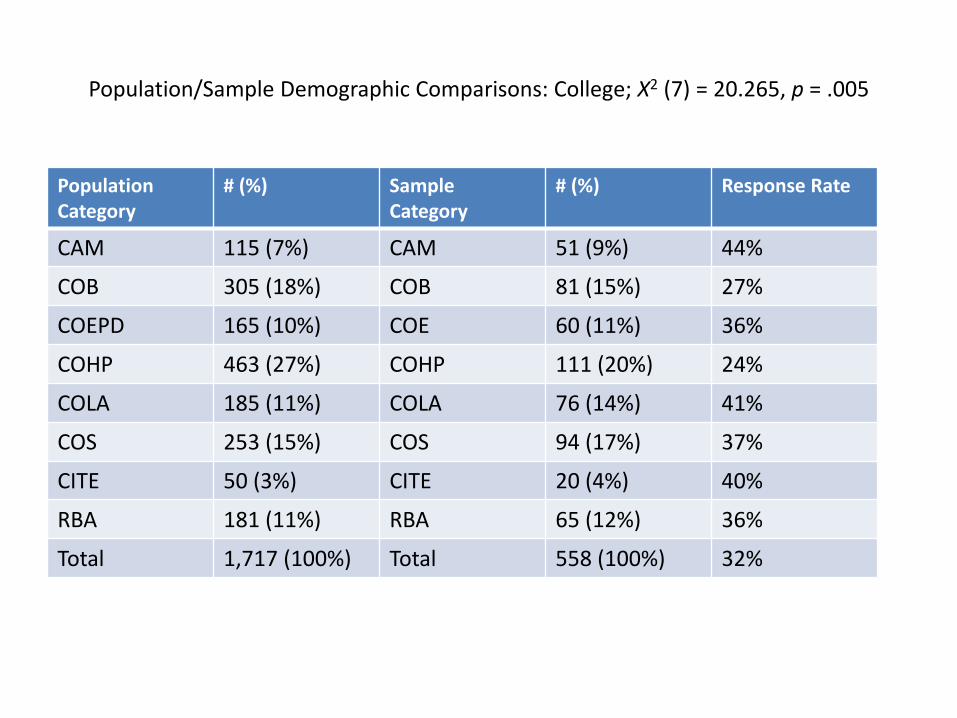
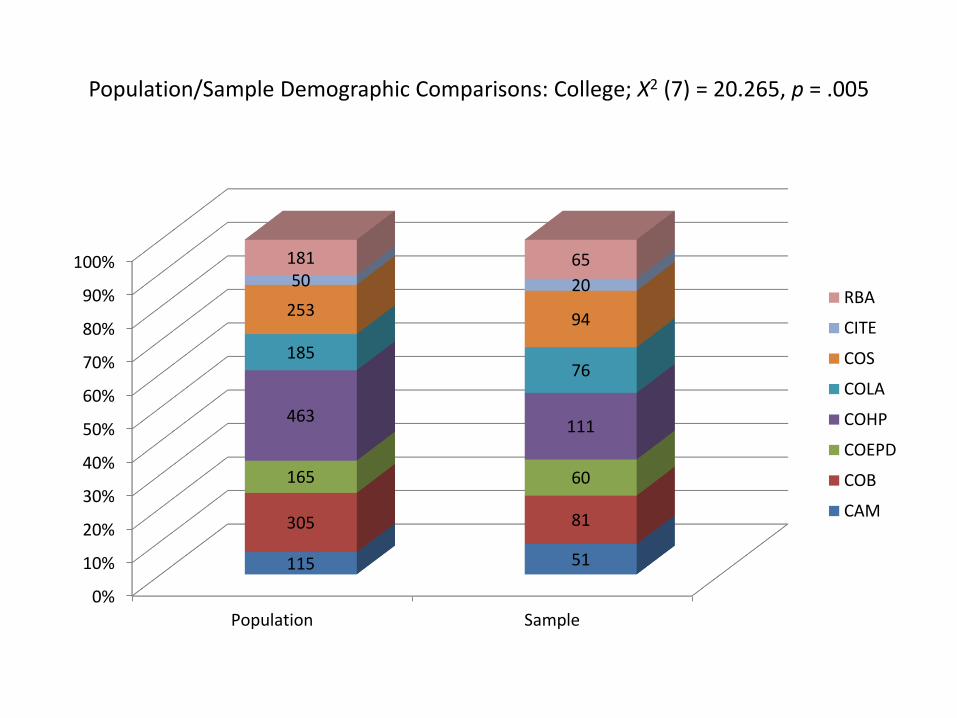
Population/Sample Demographic Comparisons: College; X2 (7) = 20.265, p = .005
Population Category
# (%) SampleCategory
# (%) Response Rate
CAM 115 (7%) CAM 51 (9%) 44%
COB 305 (18%) COB 81 (15%) 27%
COEPD 165 (10%) COE 60 (11%) 36%
COHP 463 (27%) COHP 111 (20%) 24%
COLA 185 (11%) COLA 76 (14%) 41%
COS 253 (15%) COS 94 (17%) 37%
CITE 50 (3%) CITE 20 (4%) 40%
RBA 181 (11%) RBA 65 (12%) 36%
Total 1,717 (100%) Total 558 (100%) 32%
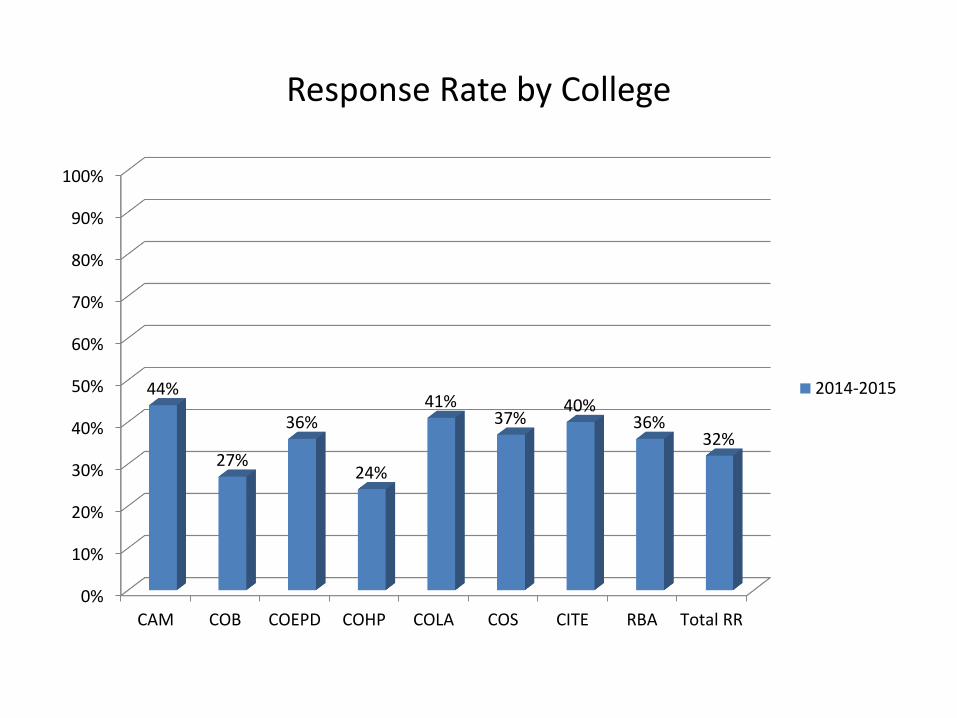
Response Rate by College
0%
10%
20%
30%
40%
50%
60%
70%
80%
90%
100%
CAM COB COEPD COHP COLA COS CITE RBA Total RR
44%
27%
36%
24%
41%37%
40%36%
32%
2014-2015
Population/Sample Demographic Comparisons: College; X2 (7) = 20.265, p = .005
0%
10%
20%
30%
40%
50%
60%
70%
80%
90%
100%
Population Sample
115 51
305 81
165 60
463111
18576
25394
50 20
181 65
RBA
CITE
COS
COLA
COHP
COEPD
COB
CAM
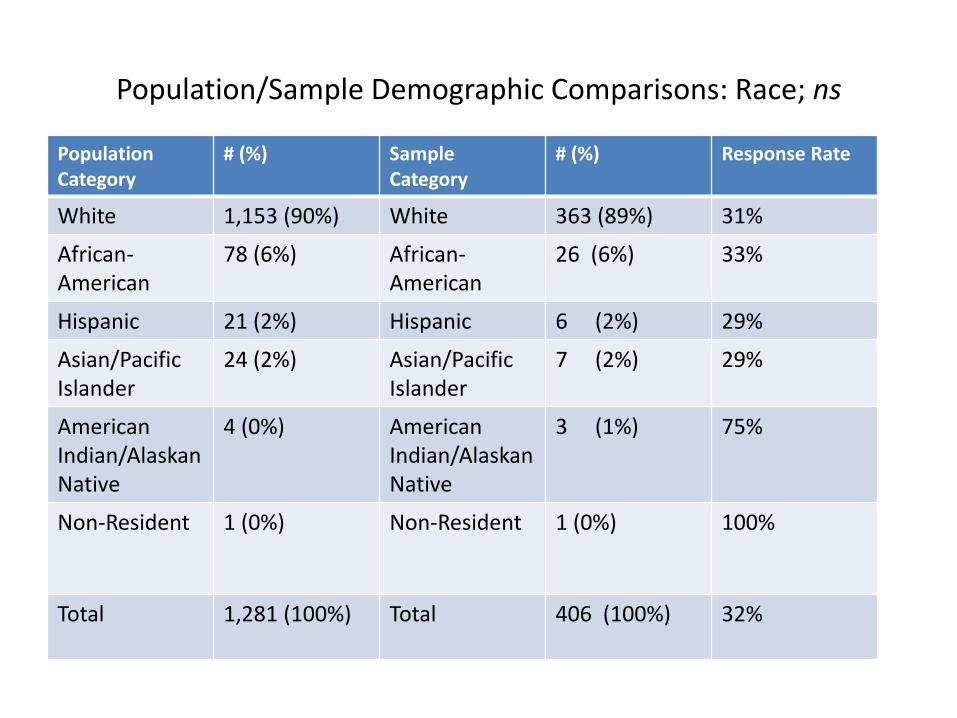
Population/Sample Demographic Comparisons: Race; ns
Population Category
# (%) SampleCategory
# (%) Response Rate
White 1,153 (90%) White 363 (89%) 31%
African-American
78 (6%) African-American
26 (6%) 33%
Hispanic 21 (2%) Hispanic 6 (2%) 29%
Asian/Pacific Islander
24 (2%) Asian/Pacific Islander
7 (2%) 29%
American Indian/Alaskan Native
4 (0%) American Indian/Alaskan Native
3 (1%) 75%
Non-Resident 1 (0%) Non-Resident 1 (0%) 100%
Total 1,281 (100%) Total 406 (100%) 32%

Population/Sample Demographic Comparisons: Race; ns
84%
86%
88%
90%
92%
94%
96%
98%
100%
Population Sample
1153 363
7826
216
247
43
1 1
Non-Resident
American Indian/Alaskan Native
Asian/Pacific Islander
Hispanic
African-American
White
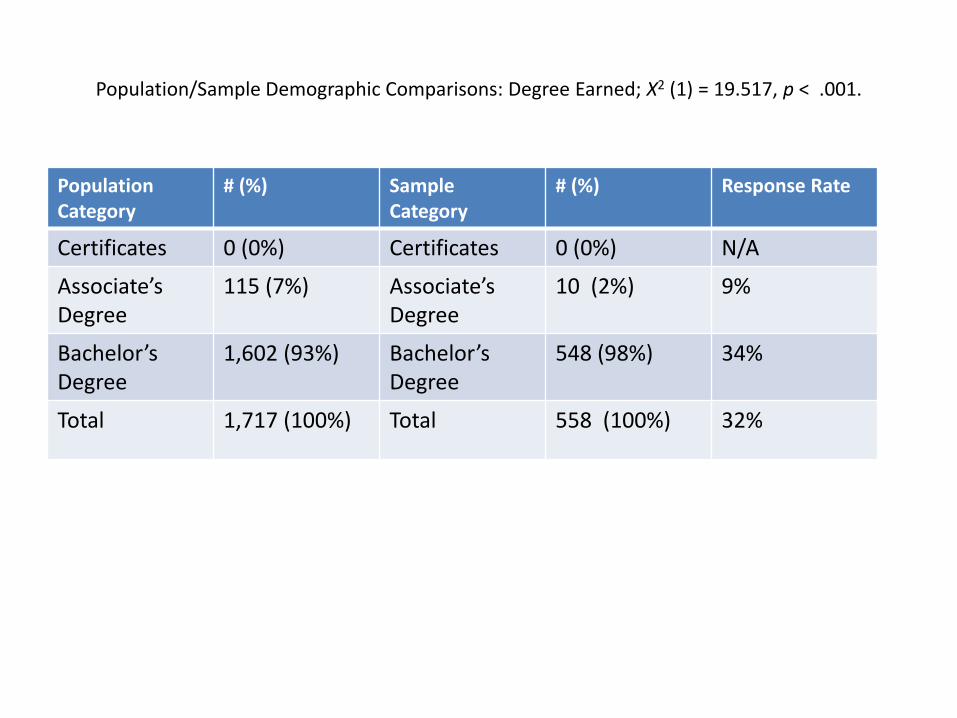
Population/Sample Demographic Comparisons: Degree Earned; X2 (1) = 19.517, p < .001.
Population Category
# (%) SampleCategory
# (%) Response Rate
Certificates 0 (0%) Certificates 0 (0%) N/A
Associate’s Degree
115 (7%) Associate’s Degree
10 (2%) 9%
Bachelor’s Degree
1,602 (93%) Bachelor’s Degree
548 (98%) 34%
Total 1,717 (100%) Total 558 (100%) 32%
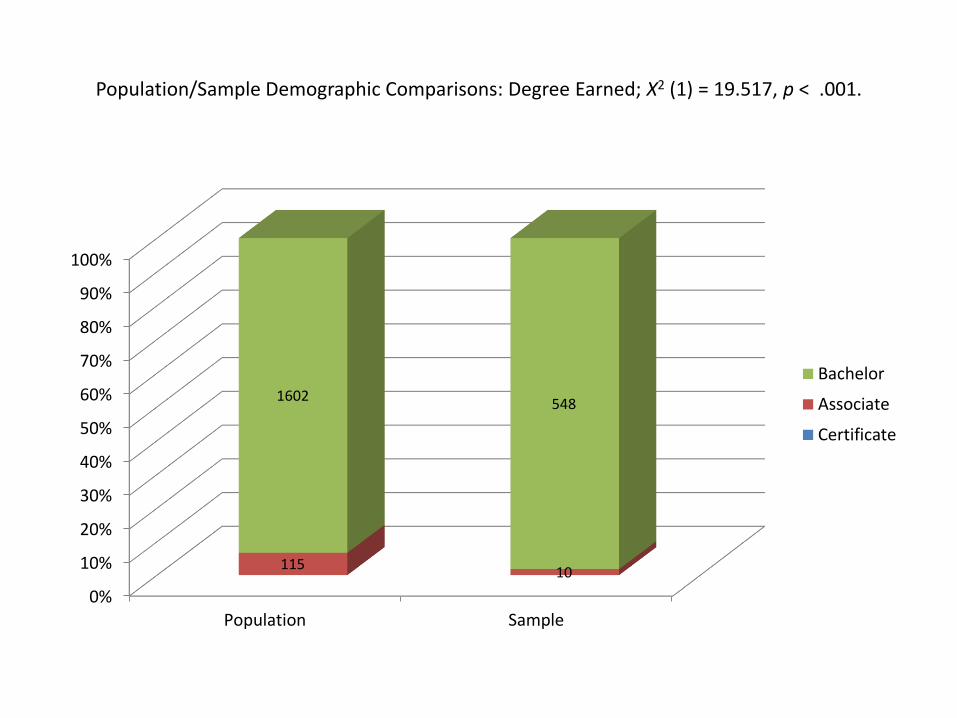
Population/Sample Demographic Comparisons: Degree Earned; X2 (1) = 19.517, p < .001.
0%
10%
20%
30%
40%
50%
60%
70%
80%
90%
100%
Population Sample
11510
1602548
Bachelor
Associate
Certificate
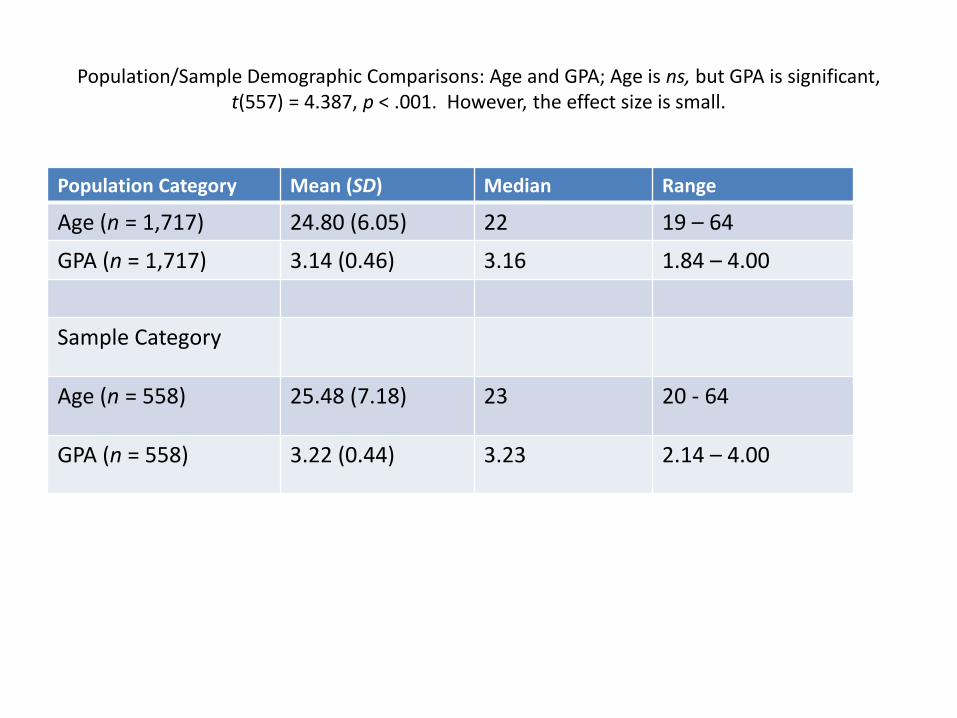
Population/Sample Demographic Comparisons: Age and GPA; Age is ns, but GPA is significant, t(557) = 4.387, p < .001. However, the effect size is small.
Population Category Mean (SD) Median Range
Age (n = 1,717) 24.80 (6.05) 22 19 – 64
GPA (n = 1,717) 3.14 (0.46) 3.16 1.84 – 4.00
Sample Category
Age (n = 558) 25.48 (7.18) 23 20 - 64
GPA (n = 558) 3.22 (0.44) 3.23 2.14 – 4.00
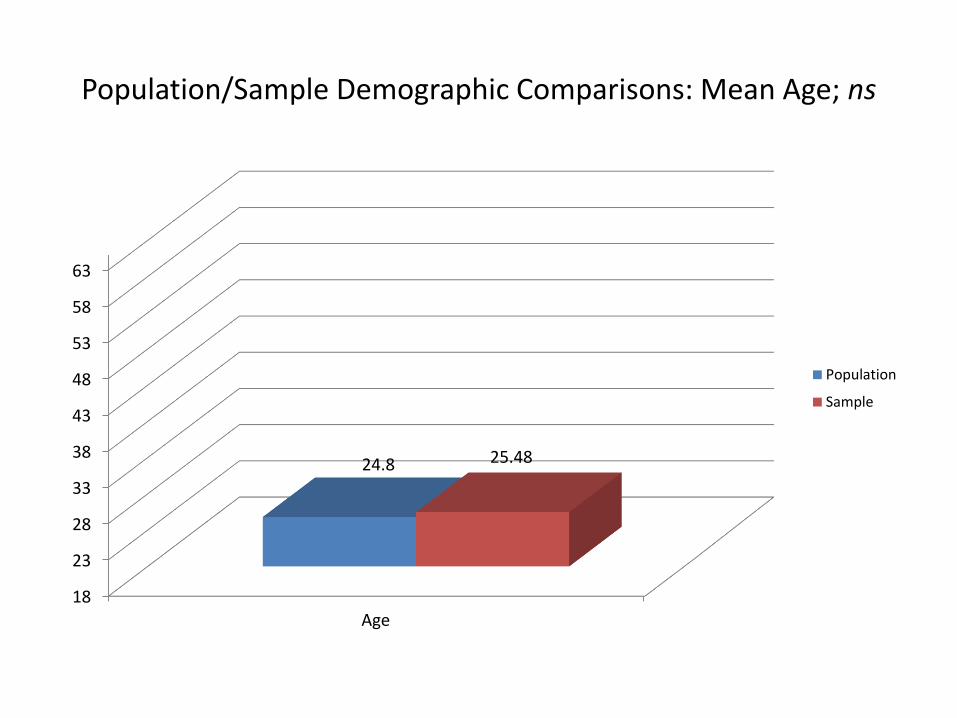
Population/Sample Demographic Comparisons: Mean Age; ns
18
23
28
33
38
43
48
53
58
63
Age
24.8 25.48
Population
Sample
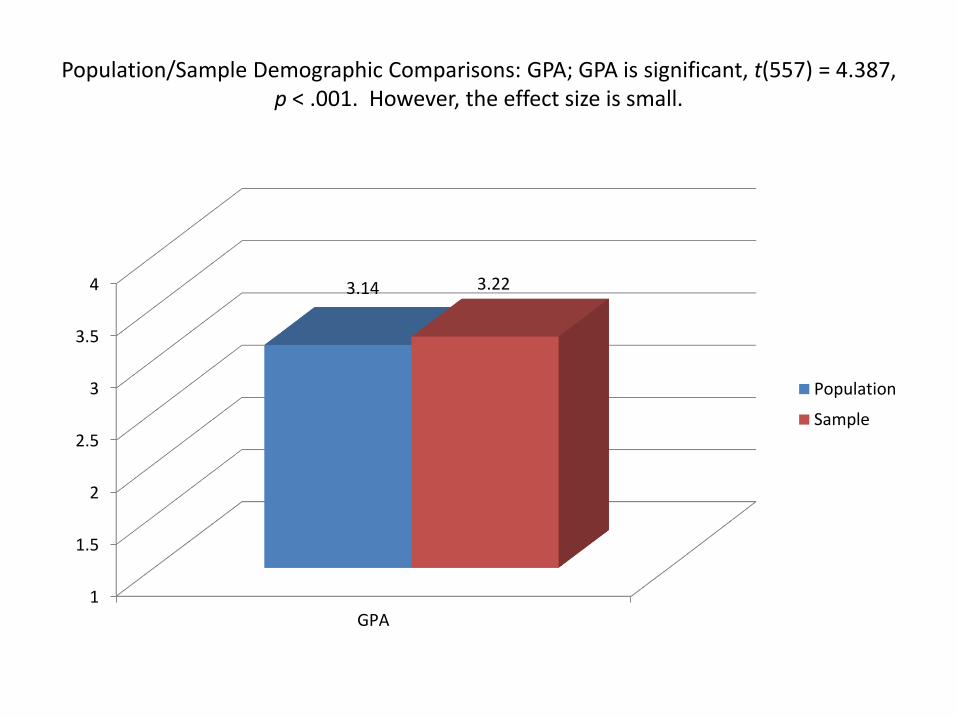
Population/Sample Demographic Comparisons: GPA; GPA is significant, t(557) = 4.387, p < .001. However, the effect size is small.
1
1.5
2
2.5
3
3.5
4
GPA
3.14 3.22
Population
Sample
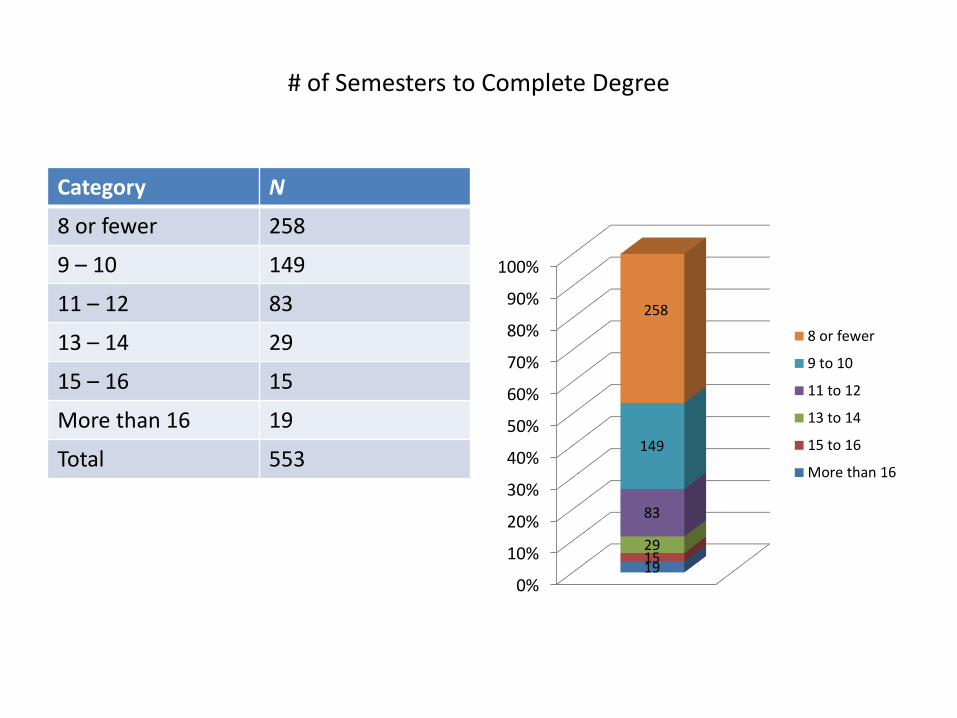
# of Semesters to Complete Degree
Category N
8 or fewer 258
9 – 10 149
11 – 12 83
13 – 14 29
15 – 16 15
More than 16 19
Total 553
0%
10%
20%
30%
40%
50%
60%
70%
80%
90%
100%
191529
83
149
258
8 or fewer
9 to 10
11 to 12
13 to 14
15 to 16
More than 16
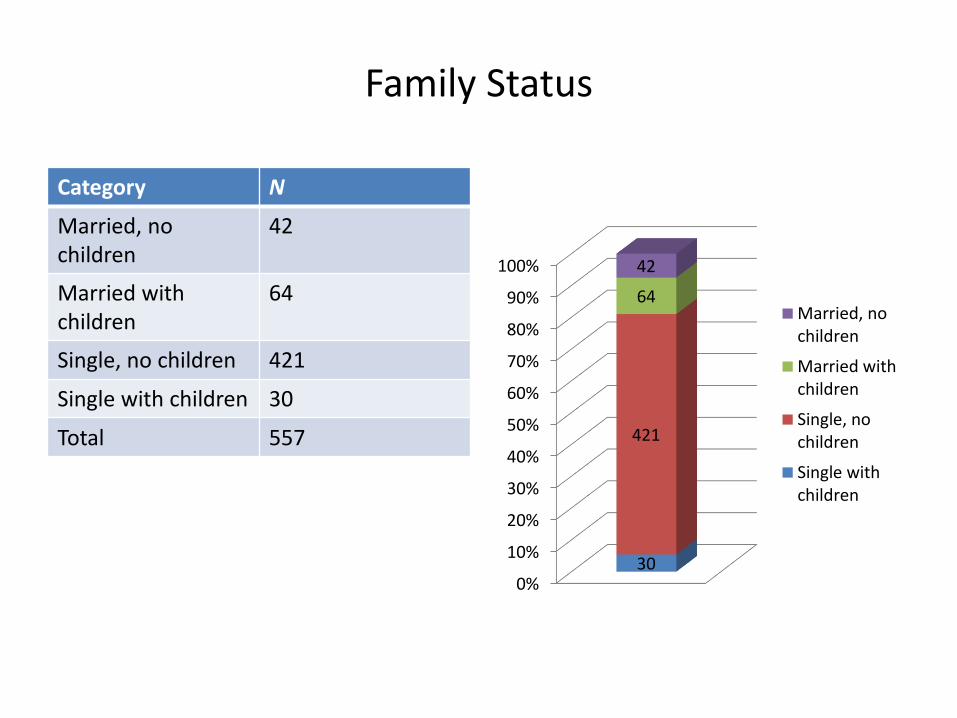
Family Status
Category N
Married, no children
42
Married with children
64
Single, no children 421
Single with children 30
Total 557
0%
10%
20%
30%
40%
50%
60%
70%
80%
90%
100%
30
421
64
42
Married, nochildren
Married withchildren
Single, nochildren
Single withchildren
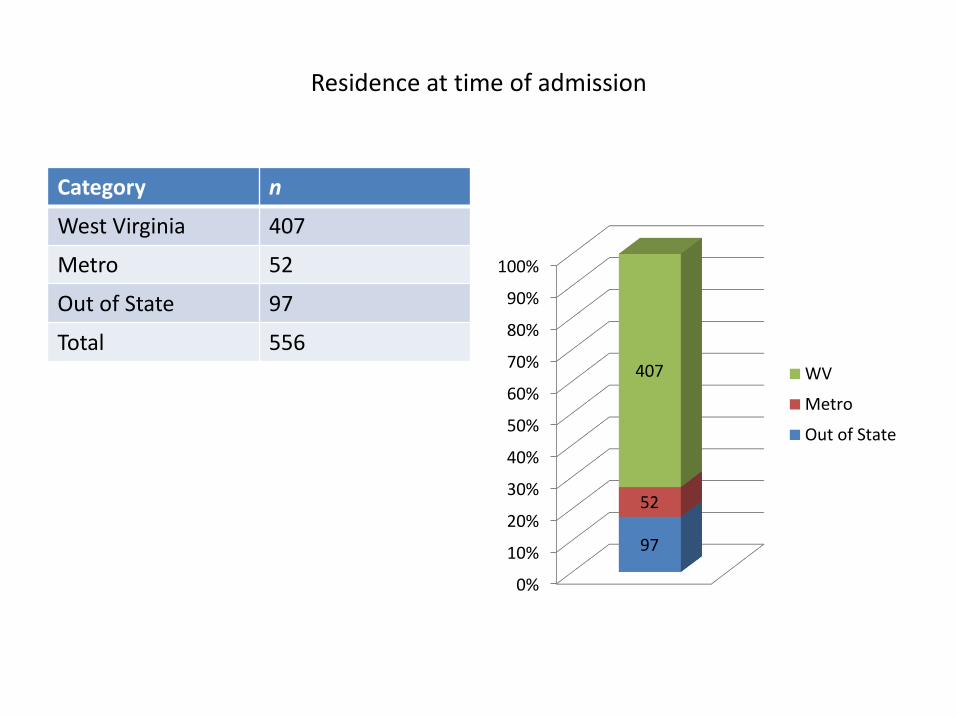
Residence at time of admission
Category n
West Virginia 407
Metro 52
Out of State 97
Total 556
0%
10%
20%
30%
40%
50%
60%
70%
80%
90%
100%
97
52
407 WV
Metro
Out of State
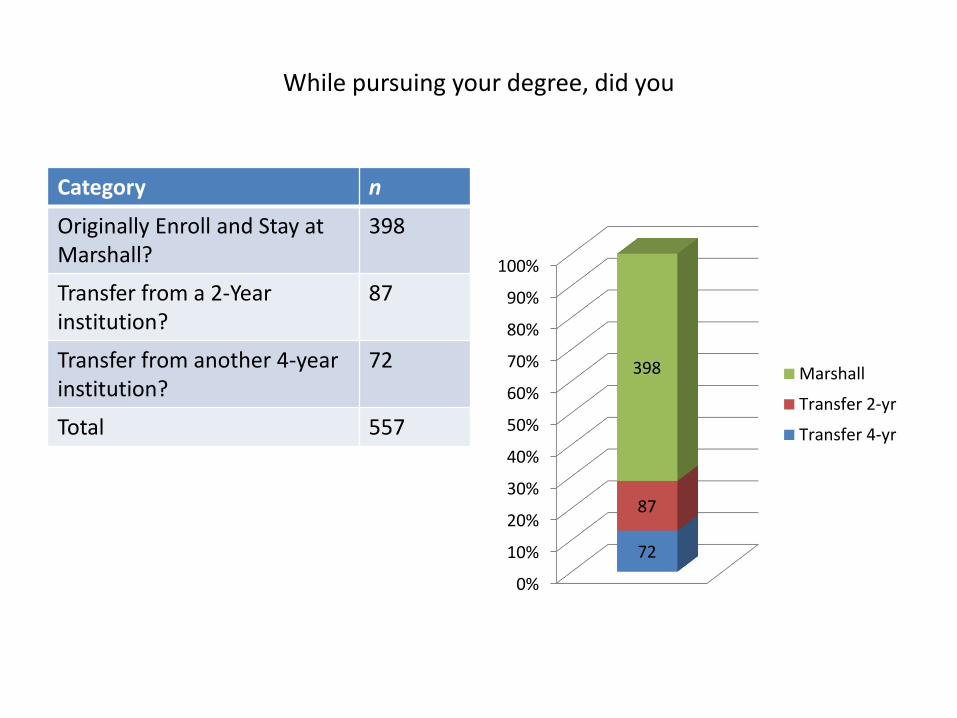
While pursuing your degree, did you
Category n
Originally Enroll and Stay at Marshall?
398
Transfer from a 2-Year institution?
87
Transfer from another 4-year institution?
72
Total 557
0%
10%
20%
30%
40%
50%
60%
70%
80%
90%
100%
72
87
398 Marshall
Transfer 2-yr
Transfer 4-yr
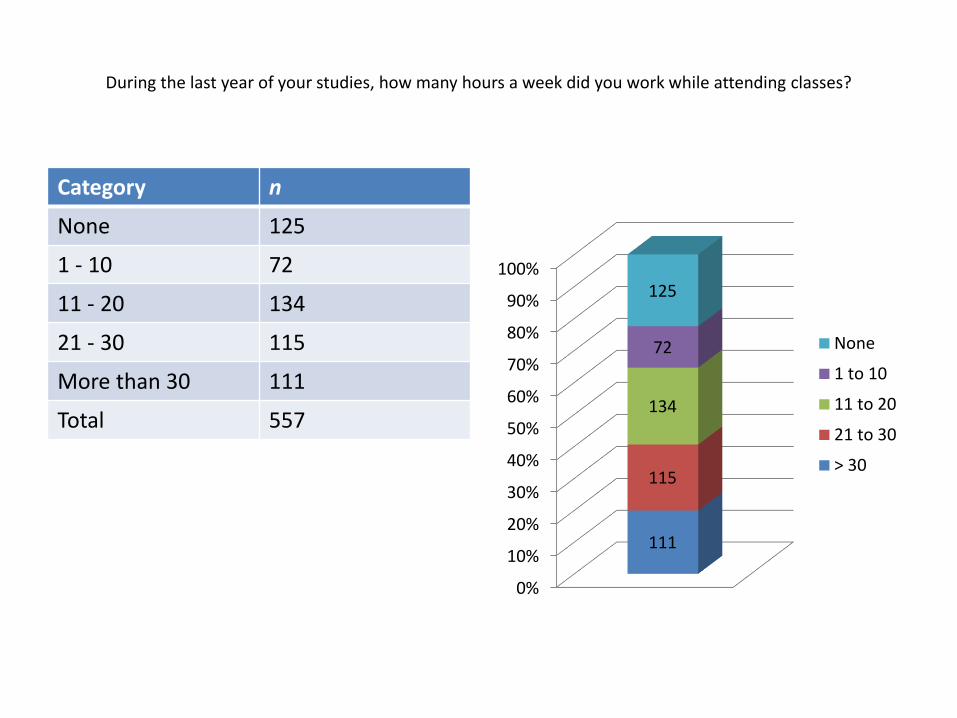
During the last year of your studies, how many hours a week did you work while attending classes?
Category n
None 125
1 - 10 72
11 - 20 134
21 - 30 115
More than 30 111
Total 557
0%
10%
20%
30%
40%
50%
60%
70%
80%
90%
100%
111
115
134
72
125
None
1 to 10
11 to 20
21 to 30
> 30
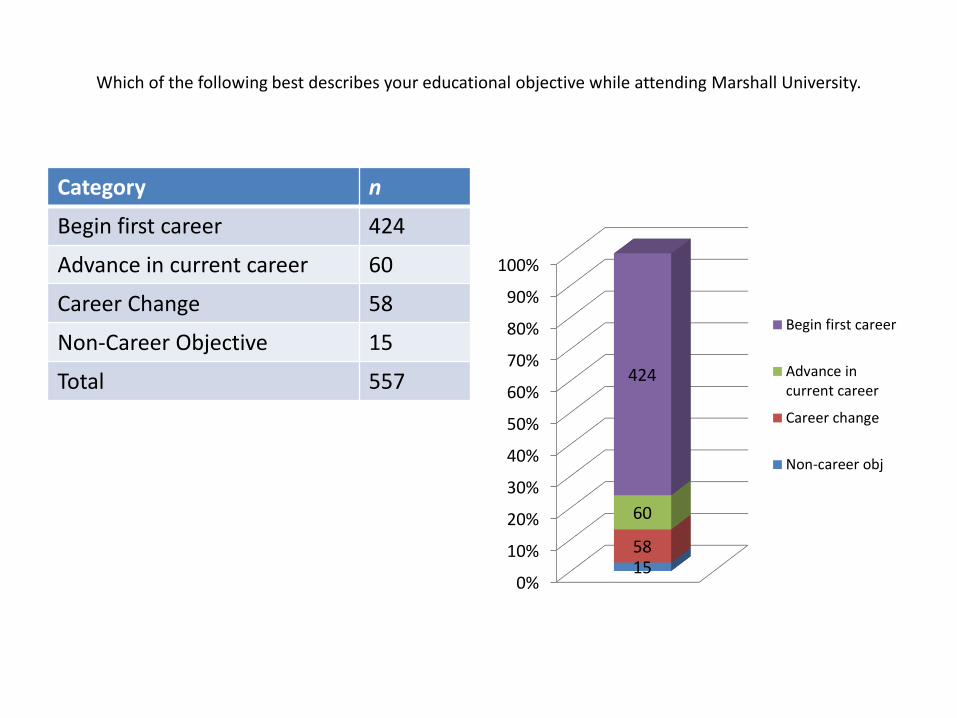
Which of the following best describes your educational objective while attending Marshall University.
Category n
Begin first career 424
Advance in current career 60
Career Change 58
Non-Career Objective 15
Total 557
0%
10%
20%
30%
40%
50%
60%
70%
80%
90%
100%
1558
60
424
Begin first career
Advance incurrent career
Career change
Non-career obj
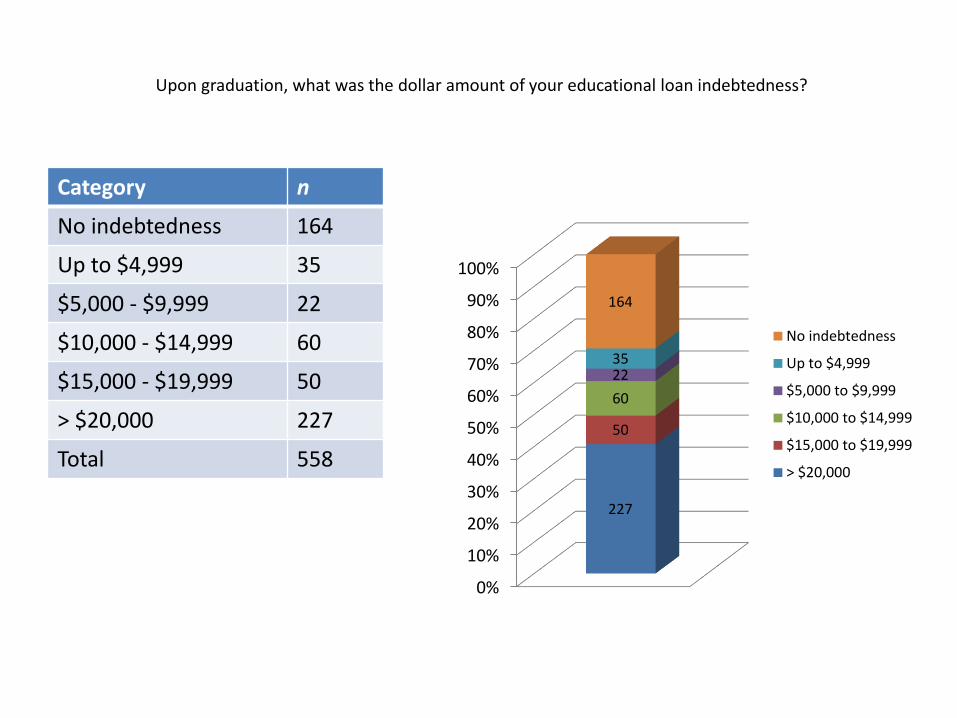
Upon graduation, what was the dollar amount of your educational loan indebtedness?
Category n
No indebtedness 164
Up to $4,999 35
$5,000 - $9,999 22
$10,000 - $14,999 60
$15,000 - $19,999 50
> $20,000 227
Total 558
0%
10%
20%
30%
40%
50%
60%
70%
80%
90%
100%
227
50
60
2235
164
No indebtedness
Up to $4,999
$5,000 to $9,999
$10,000 to $14,999
$15,000 to $19,999
> $20,000
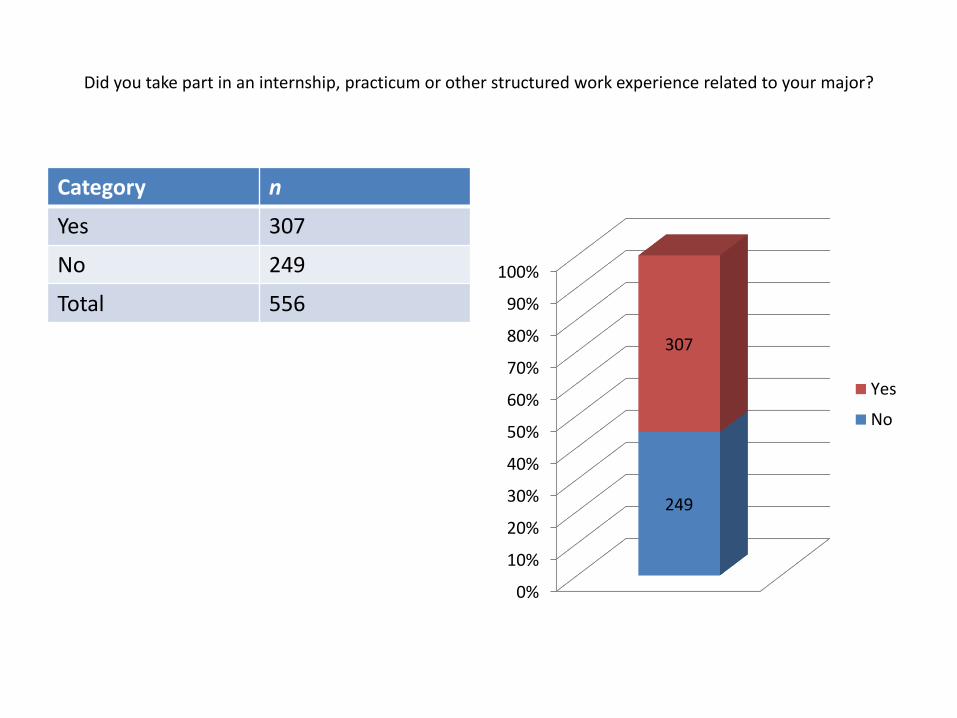
Did you take part in an internship, practicum or other structured work experience related to your major?
Category n
Yes 307
No 249
Total 556
0%
10%
20%
30%
40%
50%
60%
70%
80%
90%
100%
249
307
Yes
No
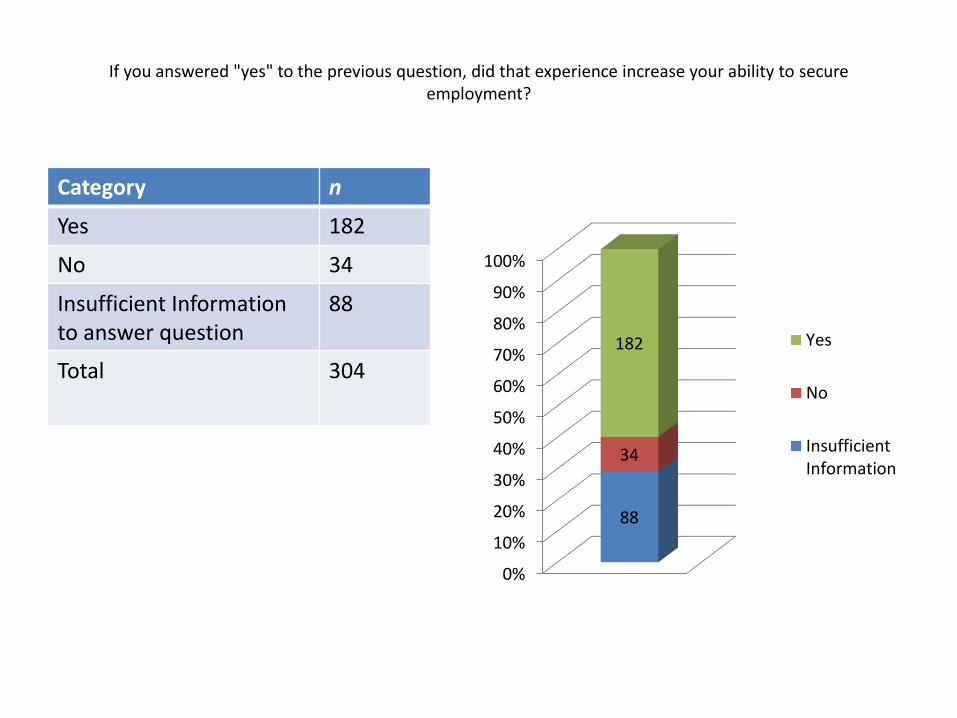
If you answered "yes" to the previous question, did that experience increase your ability to secureemployment?
Category n
Yes 182
No 34
Insufficient Information to answer question
88
Total 304
0%
10%
20%
30%
40%
50%
60%
70%
80%
90%
100%
88
34
182 Yes
No
InsufficientInformation
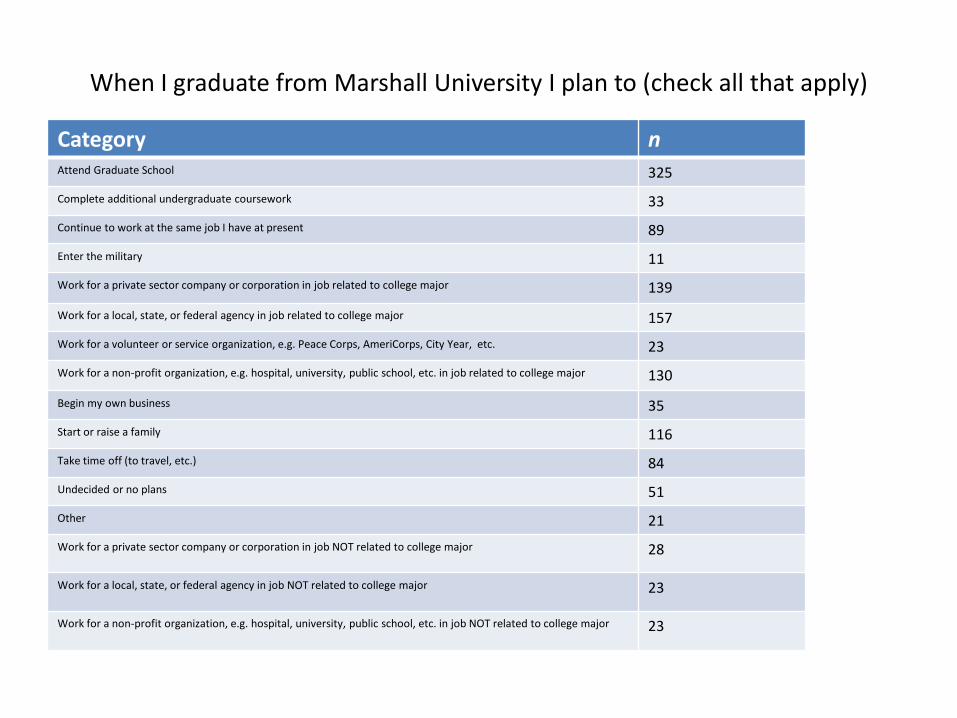
When I graduate from Marshall University I plan to (check all that apply)
Category nAttend Graduate School 325
Complete additional undergraduate coursework 33
Continue to work at the same job I have at present 89
Enter the military 11
Work for a private sector company or corporation in job related to college major 139
Work for a local, state, or federal agency in job related to college major 157
Work for a volunteer or service organization, e.g. Peace Corps, AmeriCorps, City Year, etc. 23
Work for a non-profit organization, e.g. hospital, university, public school, etc. in job related to college major 130
Begin my own business 35
Start or raise a family 116
Take time off (to travel, etc.) 84
Undecided or no plans 51
Other 21
Work for a private sector company or corporation in job NOT related to college major 28
Work for a local, state, or federal agency in job NOT related to college major 23
Work for a non-profit organization, e.g. hospital, university, public school, etc. in job NOT related to college major 23
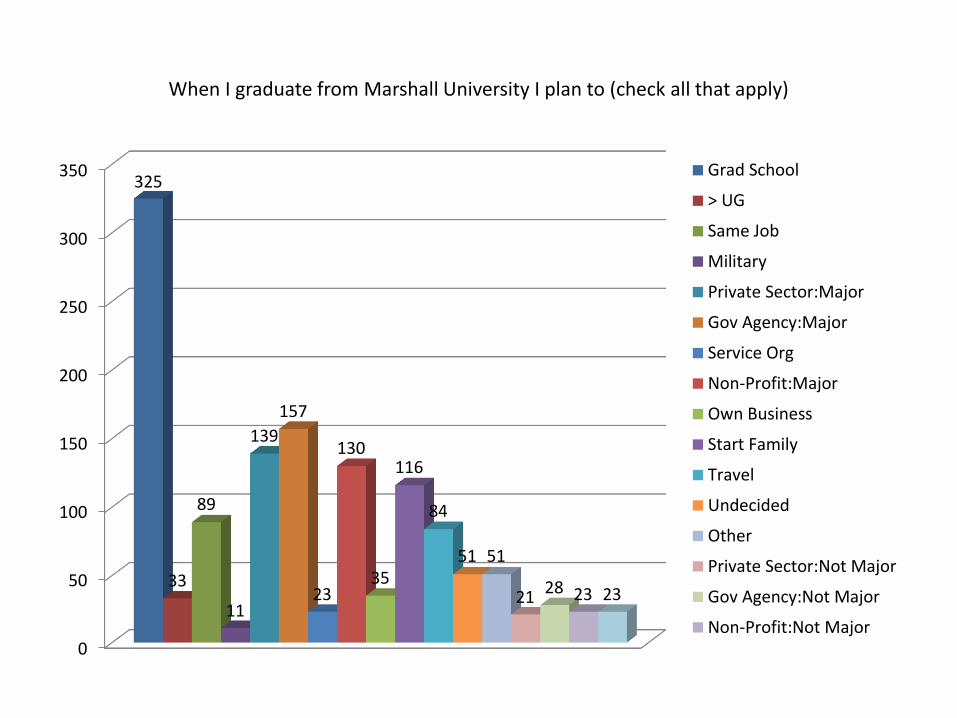
When I graduate from Marshall University I plan to (check all that apply)
0
50
100
150
200
250
300
350325
33
89
11
139
157
23
130
35
116
84
51 51
2128 23 23
Grad School
> UG
Same Job
Military
Private Sector:Major
Gov Agency:Major
Service Org
Non-Profit:Major
Own Business
Start Family
Travel
Undecided
Other
Private Sector:Not Major
Gov Agency:Not Major
Non-Profit:Not Major
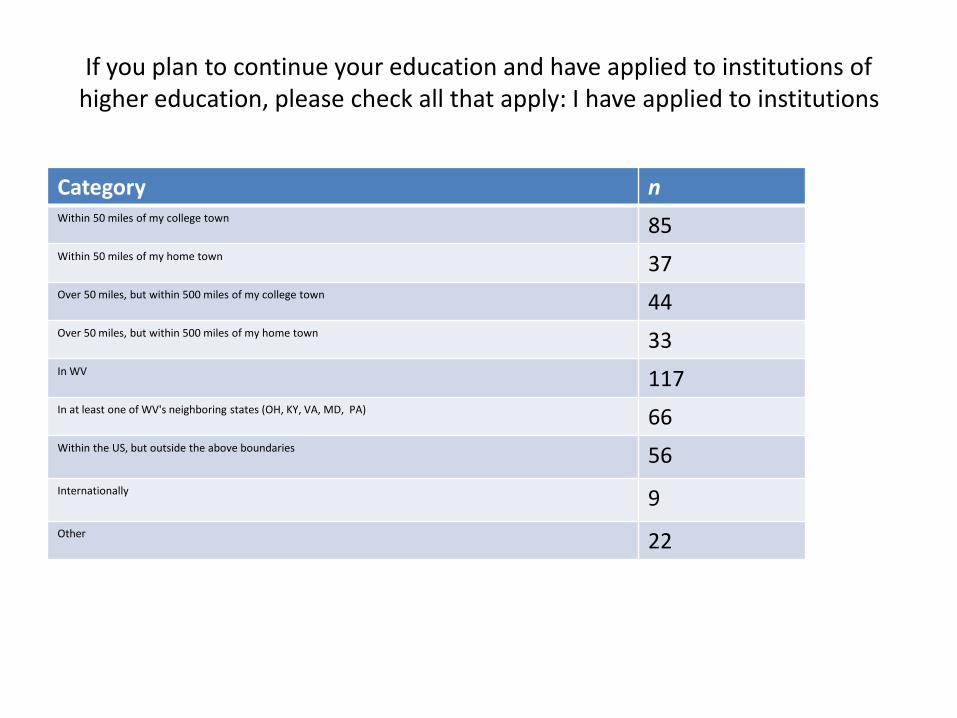
If you plan to continue your education and have applied to institutions of higher education, please check all that apply: I have applied to institutions
Category nWithin 50 miles of my college town 85Within 50 miles of my home town 37Over 50 miles, but within 500 miles of my college town 44Over 50 miles, but within 500 miles of my home town 33In WV 117In at least one of WV's neighboring states (OH, KY, VA, MD, PA) 66Within the US, but outside the above boundaries 56
Internationally 9
Other 22

If you plan to continue your education and have applied to institutions of higher education, please check all that apply: I have applied to institutions
0
20
40
60
80
100
120
85
37
44
33
117
66
56
9
22
W/I 50 mi of HT
W/I 50 mi of CT
> 50 mi, but W/I 500 mi of HT
> 50 mi, but W/I 500 mi of CT
In WV
In surrounding state
Not in surrounding state
Internationally
Other
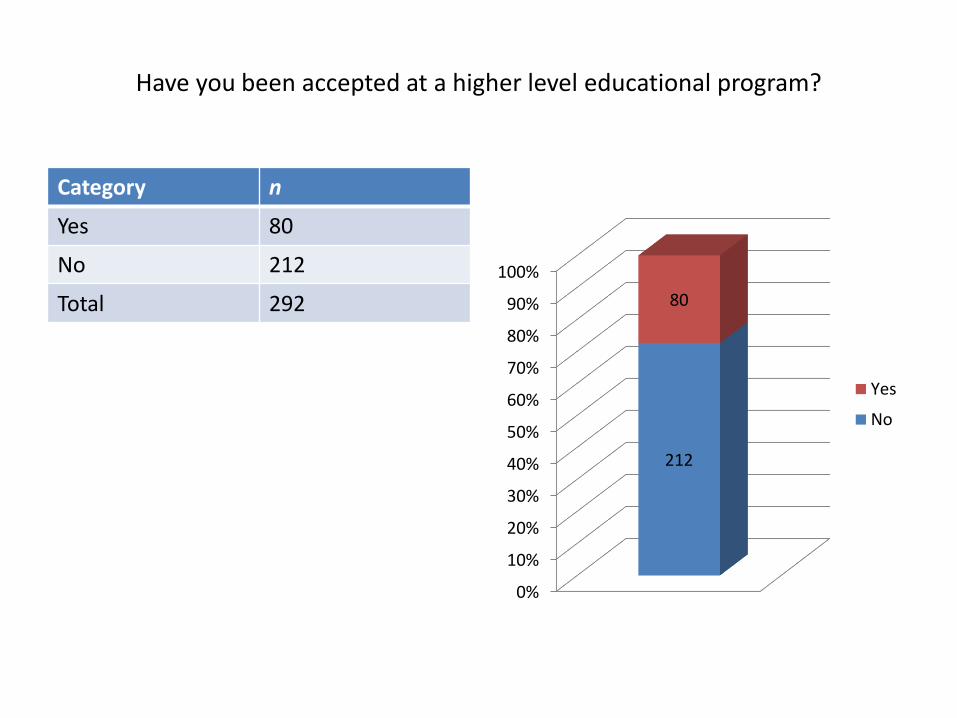
Have you been accepted at a higher level educational program?
Category n
Yes 80
No 212
Total 292
0%
10%
20%
30%
40%
50%
60%
70%
80%
90%
100%
212
80
Yes
No
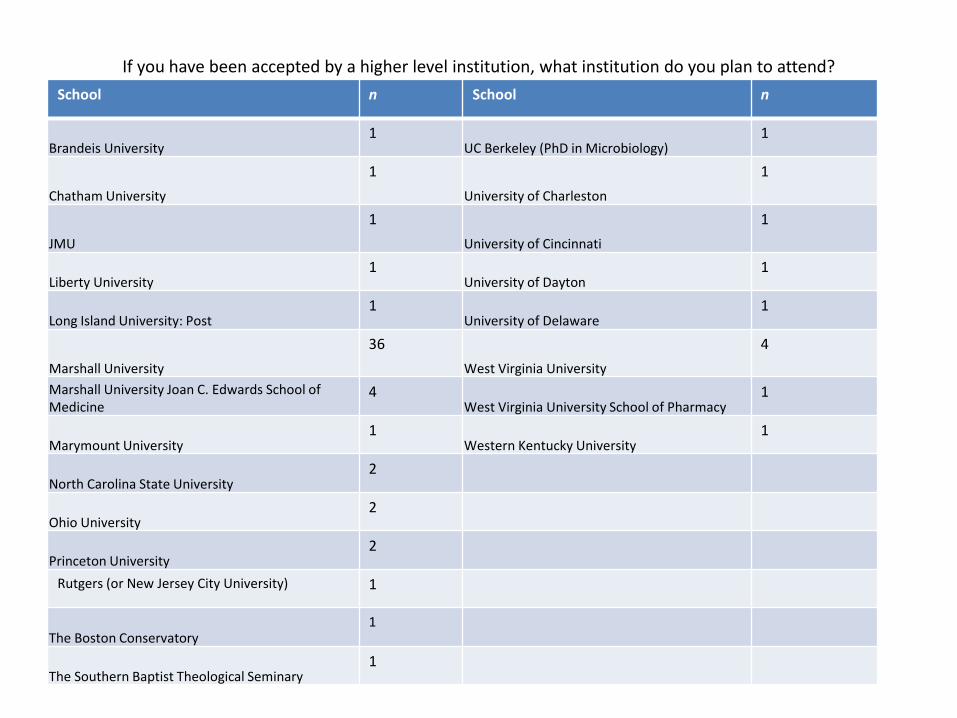
If you have been accepted by a higher level institution, what institution do you plan to attend?
School n School n
Brandeis University1
UC Berkeley (PhD in Microbiology)1
Chatham University
1
University of Charleston
1
JMU
1
University of Cincinnati
1
Liberty University1
University of Dayton1
Long Island University: Post1
University of Delaware1
Marshall University
36
West Virginia University
4
Marshall University Joan C. Edwards School of Medicine
4West Virginia University School of Pharmacy
1
Marymount University1
Western Kentucky University1
North Carolina State University2
Ohio University2
Princeton University2
Rutgers (or New Jersey City University) 1
The Boston Conservatory1
The Southern Baptist Theological Seminary1
• The following tables and graphs give mean responses according to the following scale:
•1 = Strongly Agree
•2 = Agree
•3 = Neither Agree nor Disagree
•4 = Disagree
•5 = Strongly Disagree
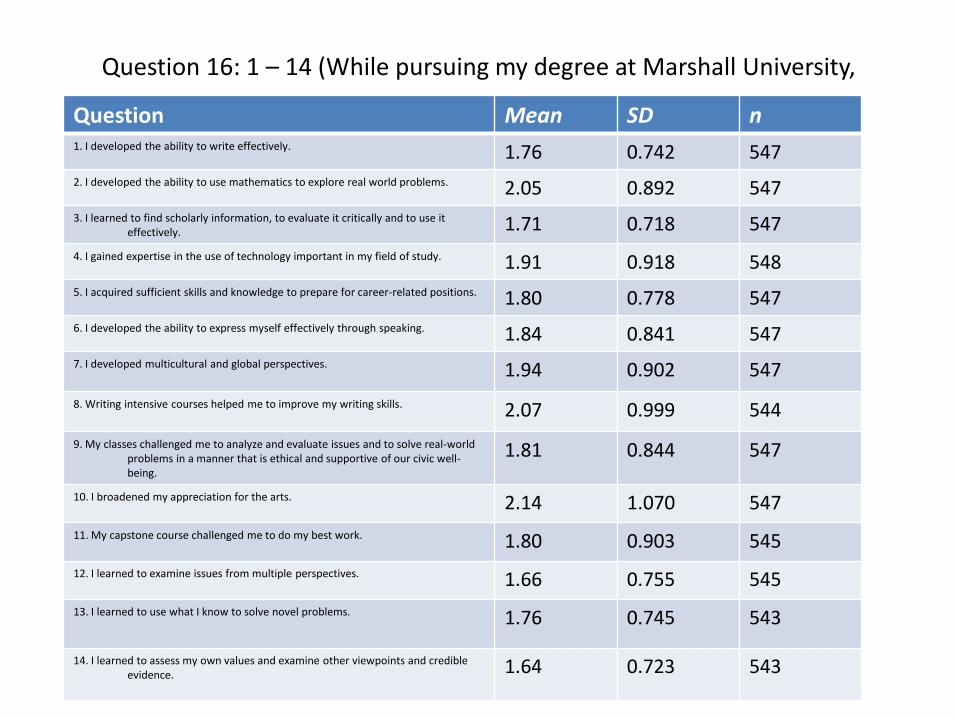
Question 16: 1 – 14 (While pursuing my degree at Marshall University,
Question Mean SD n1. I developed the ability to write effectively. 1.76 0.742 547
2. I developed the ability to use mathematics to explore real world problems. 2.05 0.892 547
3. I learned to find scholarly information, to evaluate it critically and to use it effectively. 1.71 0.718 547
4. I gained expertise in the use of technology important in my field of study. 1.91 0.918 548
5. I acquired sufficient skills and knowledge to prepare for career-related positions. 1.80 0.778 547
6. I developed the ability to express myself effectively through speaking. 1.84 0.841 547
7. I developed multicultural and global perspectives. 1.94 0.902 547
8. Writing intensive courses helped me to improve my writing skills. 2.07 0.999 544
9. My classes challenged me to analyze and evaluate issues and to solve real-world problems in a manner that is ethical and supportive of our civic well-being.
1.81 0.844 547
10. I broadened my appreciation for the arts. 2.14 1.070 547
11. My capstone course challenged me to do my best work. 1.80 0.903 545
12. I learned to examine issues from multiple perspectives. 1.66 0.755 545
13. I learned to use what I know to solve novel problems. 1.76 0.745 543
14. I learned to assess my own values and examine other viewpoints and credible evidence. 1.64 0.723 543
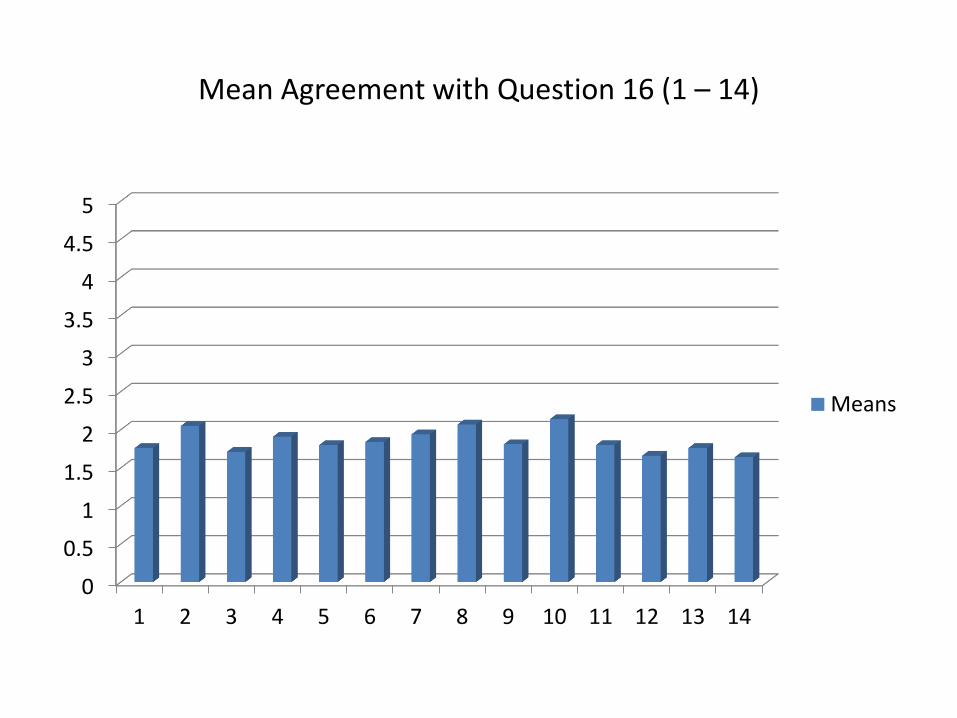
Mean Agreement with Question 16 (1 – 14)
0
0.5
1
1.5
2
2.5
3
3.5
4
4.5
5
1 2 3 4 5 6 7 8 9 10 11 12 13 14
Means
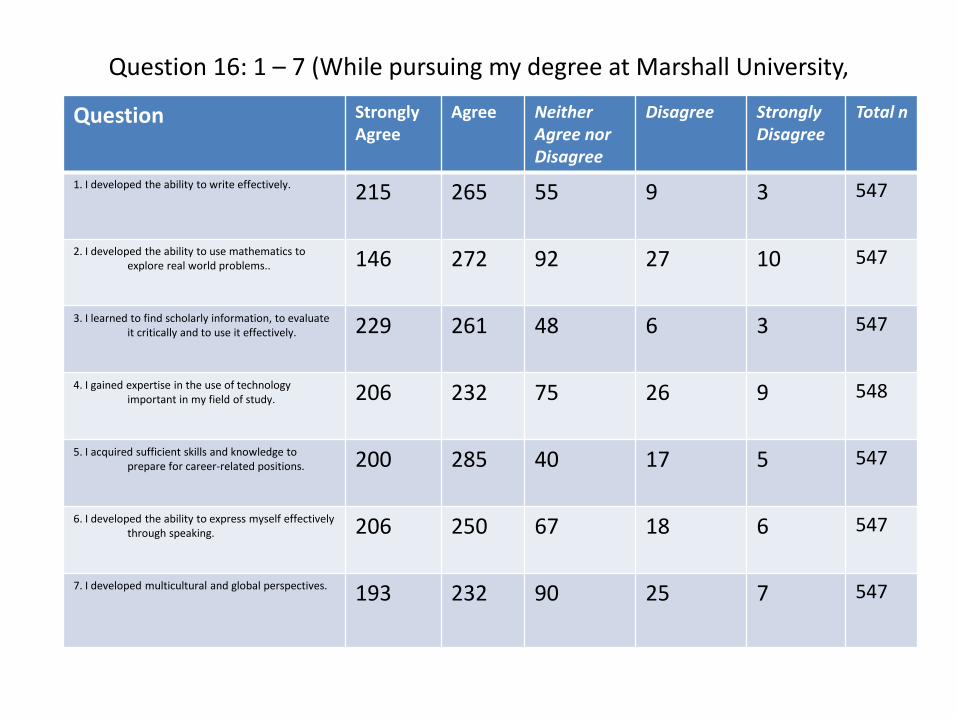
Question 16: 1 – 7 (While pursuing my degree at Marshall University,
Question StronglyAgree
Agree NeitherAgree nor Disagree
Disagree Strongly Disagree
Total n
1. I developed the ability to write effectively. 215 265 55 9 3 547
2. I developed the ability to use mathematics to explore real world problems.. 146 272 92 27 10 547
3. I learned to find scholarly information, to evaluate it critically and to use it effectively. 229 261 48 6 3 547
4. I gained expertise in the use of technology important in my field of study. 206 232 75 26 9 548
5. I acquired sufficient skills and knowledge to prepare for career-related positions. 200 285 40 17 5 547
6. I developed the ability to express myself effectively through speaking. 206 250 67 18 6 547
7. I developed multicultural and global perspectives. 193 232 90 25 7 547
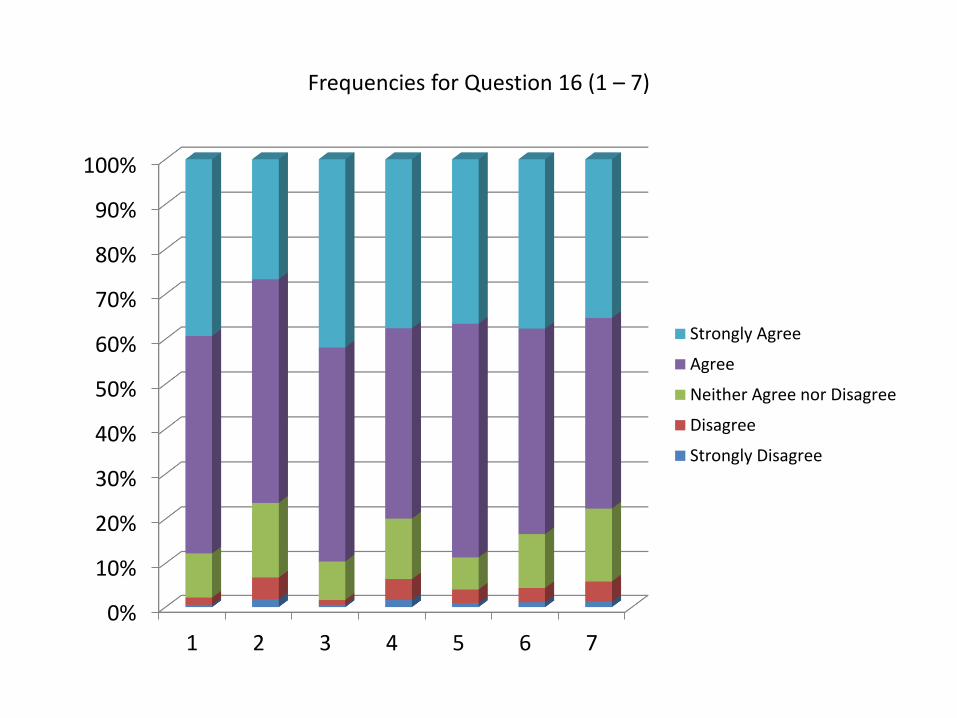
Frequencies for Question 16 (1 – 7)
0%
10%
20%
30%
40%
50%
60%
70%
80%
90%
100%
1 2 3 4 5 6 7
Strongly Agree
Agree
Neither Agree nor Disagree
Disagree
Strongly Disagree
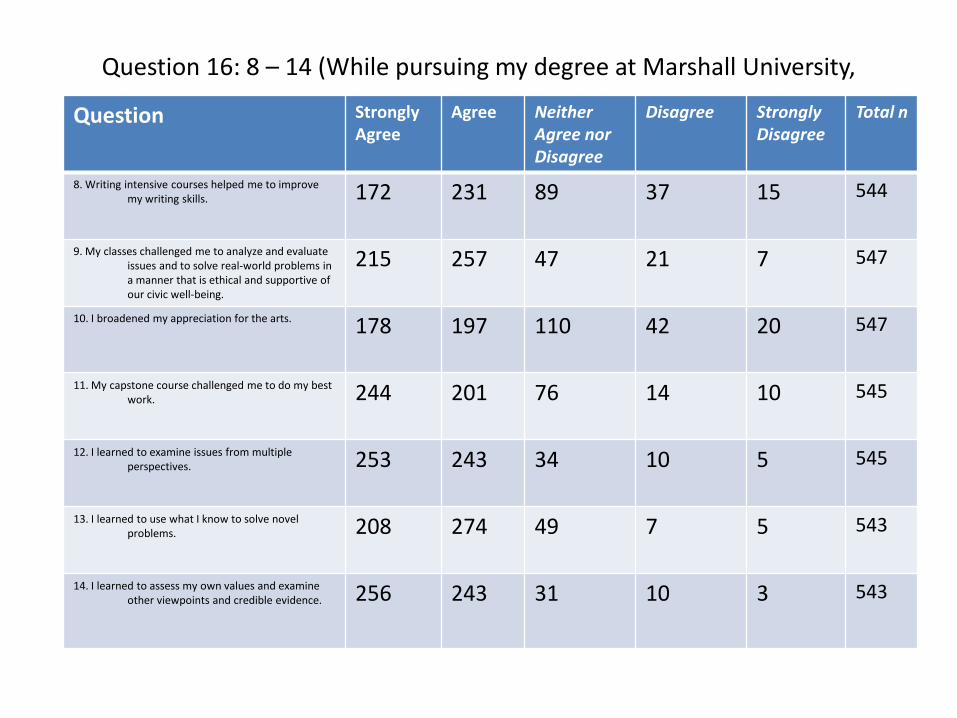
Question 16: 8 – 14 (While pursuing my degree at Marshall University,
Question StronglyAgree
Agree NeitherAgree nor Disagree
Disagree Strongly Disagree
Total n
8. Writing intensive courses helped me to improve my writing skills. 172 231 89 37 15 544
9. My classes challenged me to analyze and evaluate issues and to solve real-world problems in a manner that is ethical and supportive of our civic well-being.
215 257 47 21 7 547
10. I broadened my appreciation for the arts. 178 197 110 42 20 547
11. My capstone course challenged me to do my best work. 244 201 76 14 10 545
12. I learned to examine issues from multiple perspectives. 253 243 34 10 5 545
13. I learned to use what I know to solve novel problems. 208 274 49 7 5 543
14. I learned to assess my own values and examine other viewpoints and credible evidence. 256 243 31 10 3 543
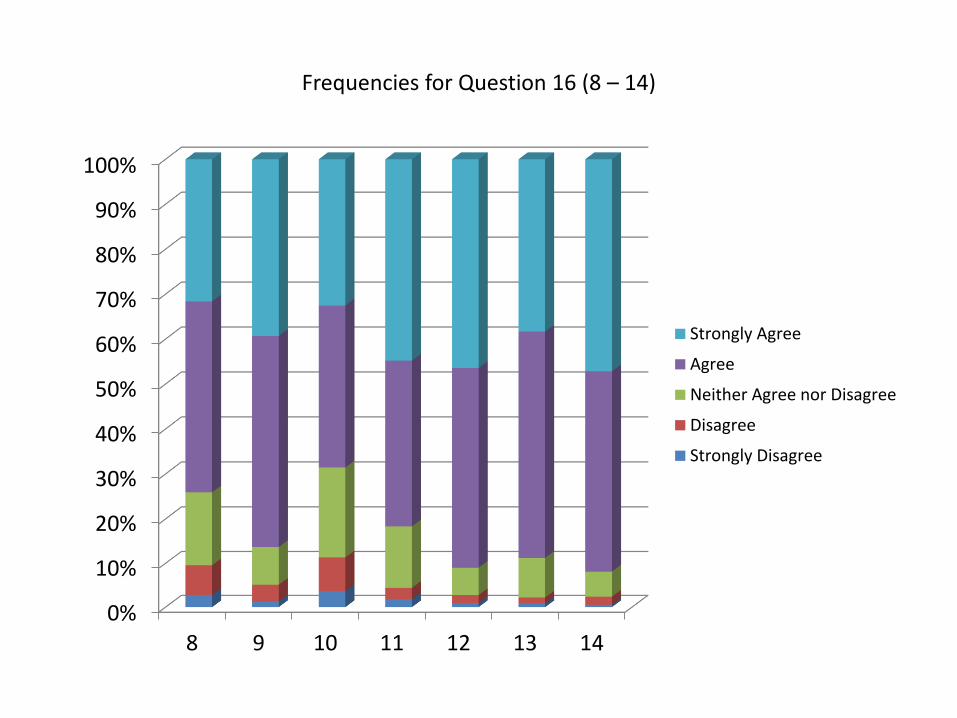
Frequencies for Question 16 (8 – 14)
0%
10%
20%
30%
40%
50%
60%
70%
80%
90%
100%
8 9 10 11 12 13 14
Strongly Agree
Agree
Neither Agree nor Disagree
Disagree
Strongly Disagree
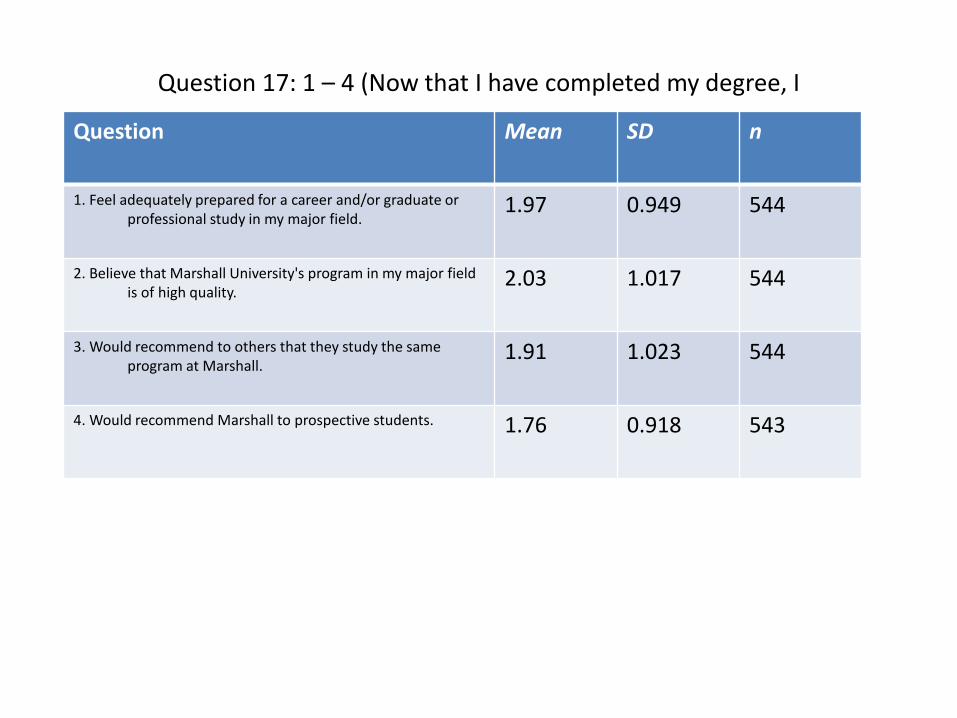
Question 17: 1 – 4 (Now that I have completed my degree, I
Question Mean SD n
1. Feel adequately prepared for a career and/or graduate or professional study in my major field.
1.97 0.949 544
2. Believe that Marshall University's program in my major field is of high quality.
2.03 1.017 544
3. Would recommend to others that they study the same program at Marshall.
1.91 1.023 544
4. Would recommend Marshall to prospective students. 1.76 0.918 543
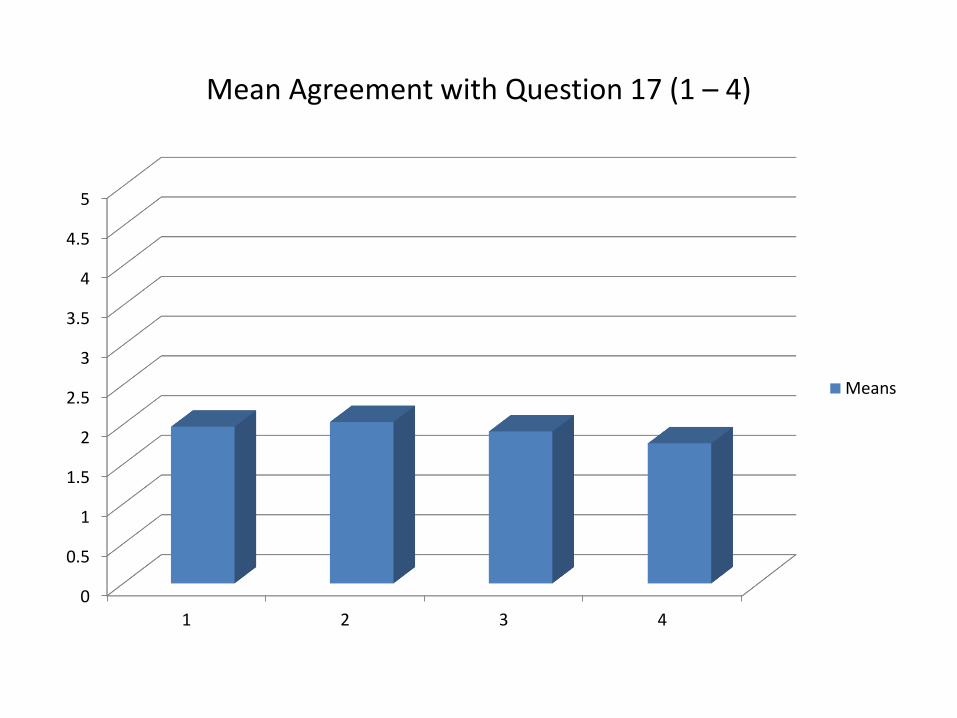
Mean Agreement with Question 17 (1 – 4)
0
0.5
1
1.5
2
2.5
3
3.5
4
4.5
5
1 2 3 4
Means
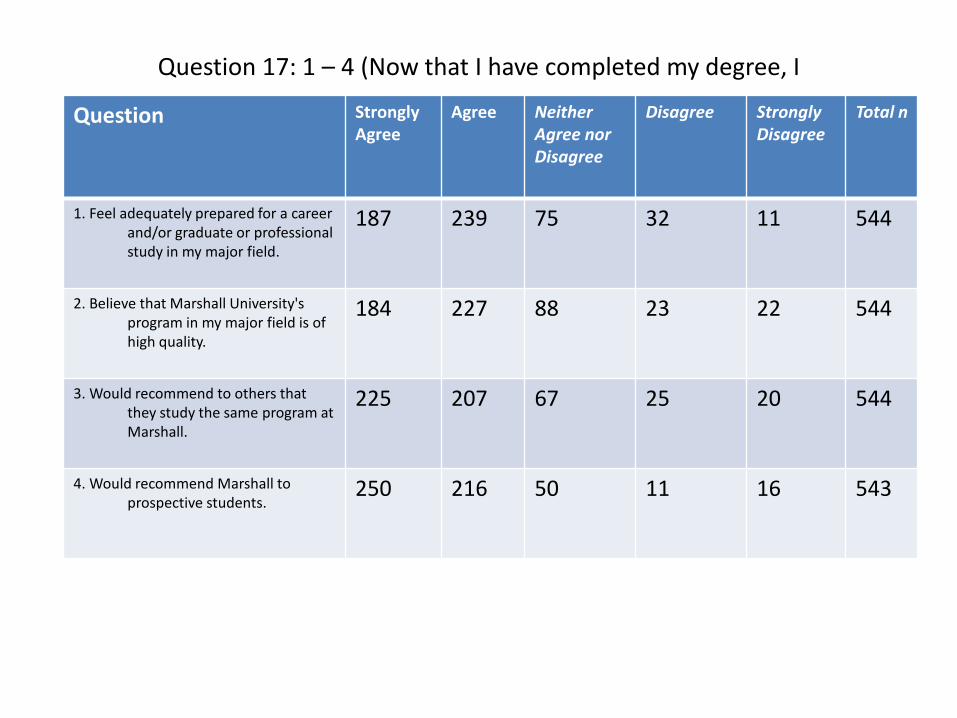
Question 17: 1 – 4 (Now that I have completed my degree, I
Question StronglyAgree
Agree NeitherAgree nor Disagree
Disagree Strongly Disagree
Total n
1. Feel adequately prepared for a career and/or graduate or professional study in my major field.
187 239 75 32 11 544
2. Believe that Marshall University's program in my major field is of high quality.
184 227 88 23 22 544
3. Would recommend to others that they study the same program at Marshall.
225 207 67 25 20 544
4. Would recommend Marshall to prospective students.
250 216 50 11 16 543
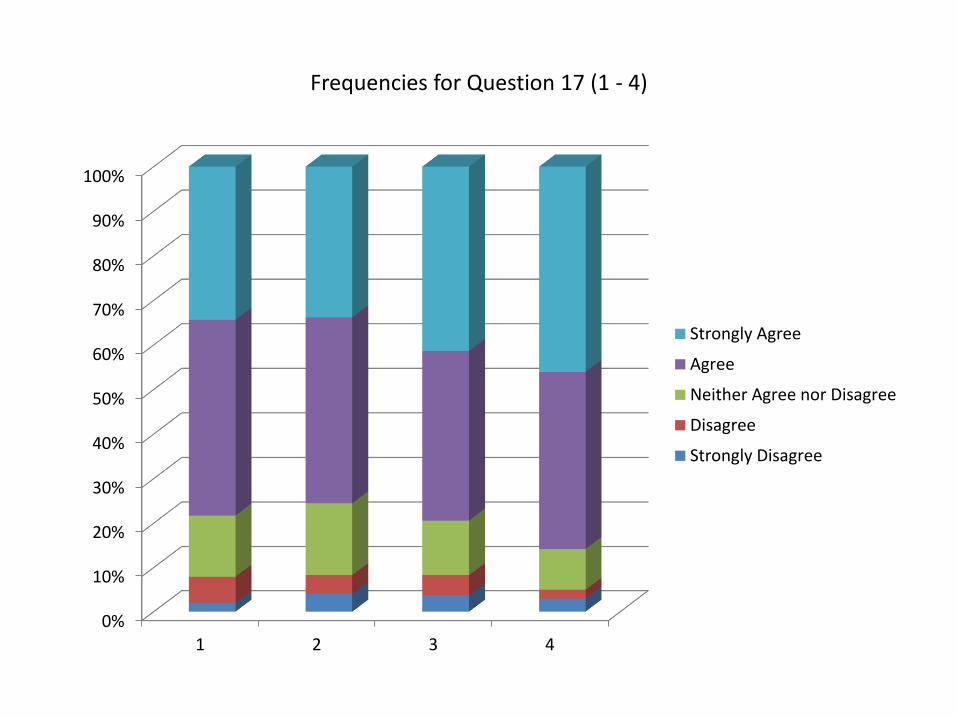
Frequencies for Question 17 (1 - 4)
0%
10%
20%
30%
40%
50%
60%
70%
80%
90%
100%
1 2 3 4
Strongly Agree
Agree
Neither Agree nor Disagree
Disagree
Strongly Disagree
• The following tables and graphs give mean responses according to the following scale:
•1 = Very Satisfied
•2 = Satisfied
•3 = Neutral
•4 = Dissatisfied
•5 = Very Dissatisfied
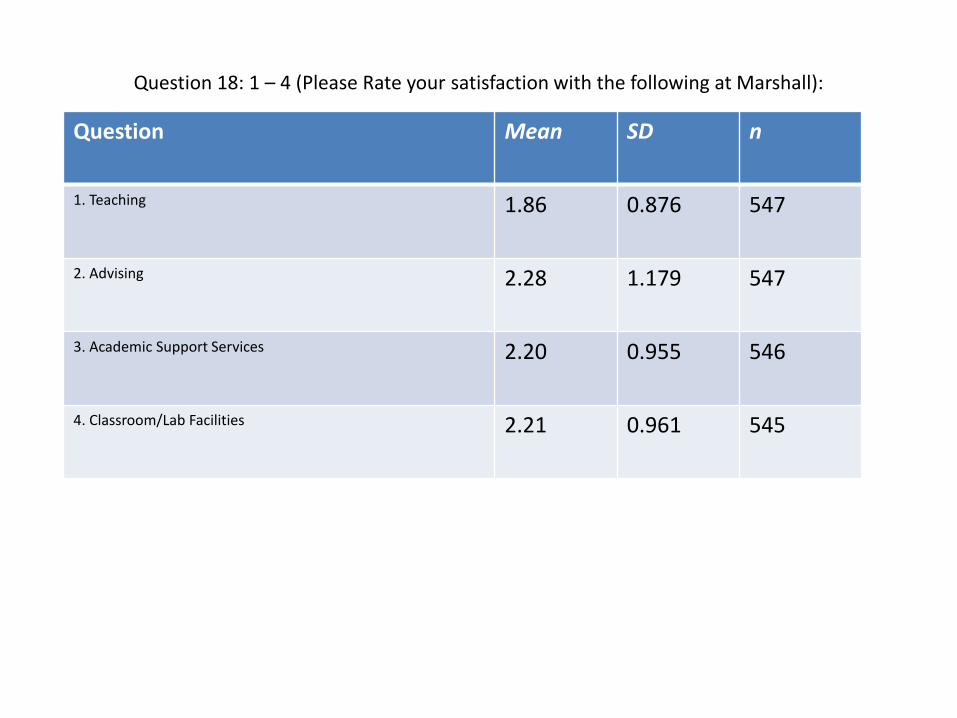
Question 18: 1 – 4 (Please Rate your satisfaction with the following at Marshall):
Question Mean SD n
1. Teaching 1.86 0.876 547
2. Advising 2.28 1.179 547
3. Academic Support Services 2.20 0.955 546
4. Classroom/Lab Facilities 2.21 0.961 545
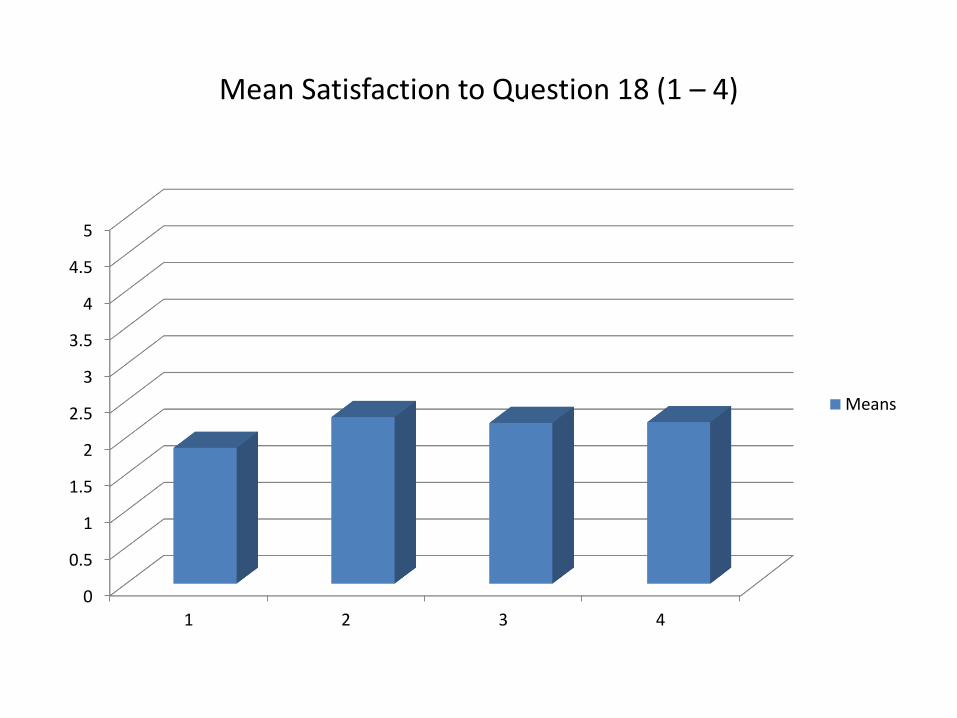
Mean Satisfaction to Question 18 (1 – 4)
0
0.5
1
1.5
2
2.5
3
3.5
4
4.5
5
1 2 3 4
Means
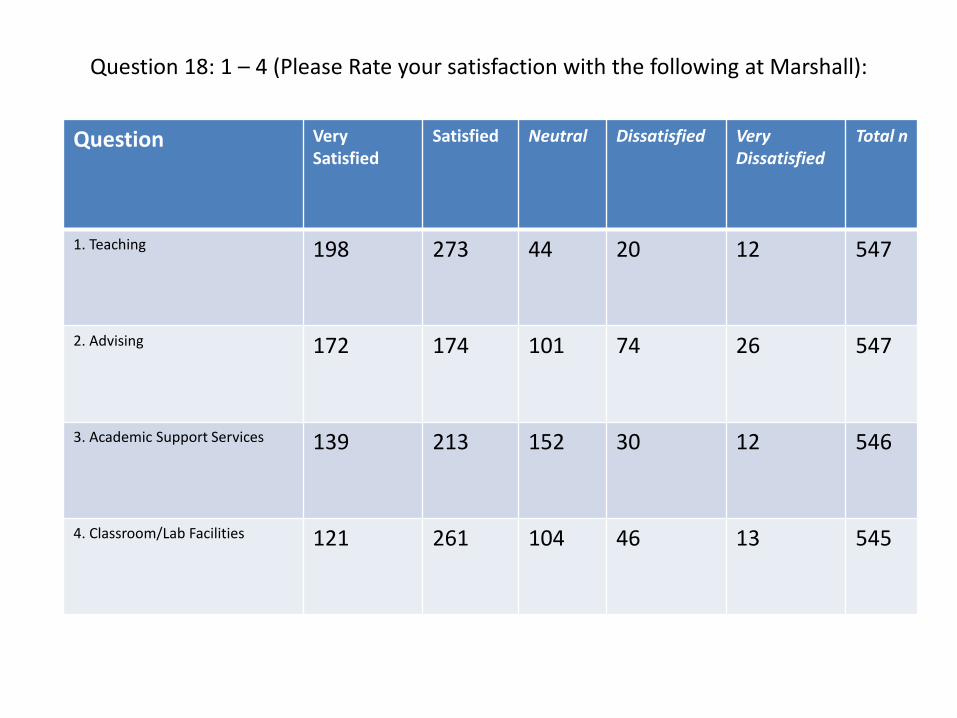
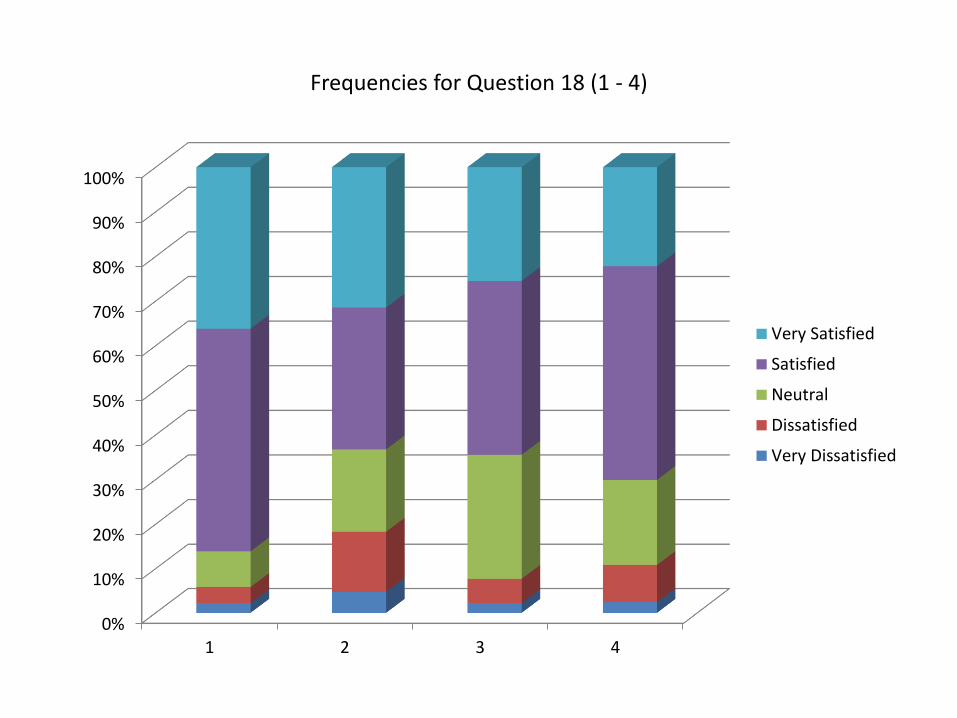
Question 18: 1 – 4 (Please Rate your satisfaction with the following at Marshall):
Question VerySatisfied
Satisfied Neutral Dissatisfied Very Dissatisfied
Total n
1. Teaching 198 273 44 20 12 547
2. Advising 172 174 101 74 26 547
3. Academic Support Services 139 213 152 30 12 546
4. Classroom/Lab Facilities 121 261 104 46 13 545
Frequencies for Question 18 (1 - 4)
0%
10%
20%
30%
40%
50%
60%
70%
80%
90%
100%
1 2 3 4
Very Satisfied
Satisfied
Neutral
Dissatisfied
Very Dissatisfied
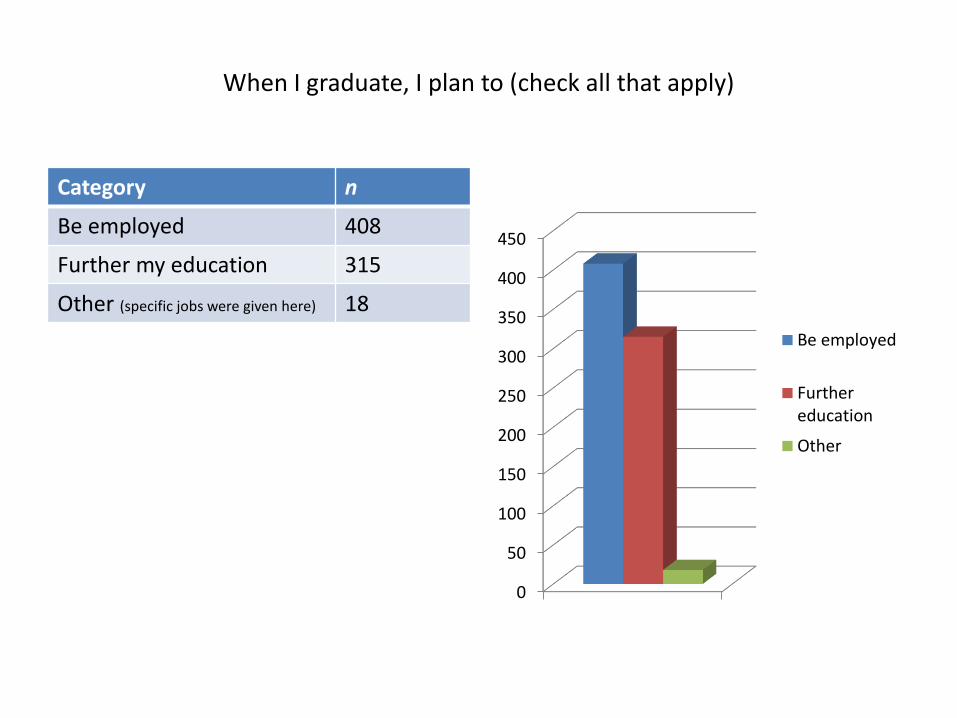
When I graduate, I plan to (check all that apply)
Category n
Be employed 408
Further my education 315
Other (specific jobs were given here) 18
0
50
100
150
200
250
300
350
400
450
Be employed
Furthereducation
Other

If you plan to be employed after graduation, will your job be in the career path you have chosen?
Category n
Yes 277
No 33
Don’t Know Yet 96
Total 406
0%
10%
20%
30%
40%
50%
60%
70%
80%
90%
100%
96
33
277Yes
No
Don't know yet
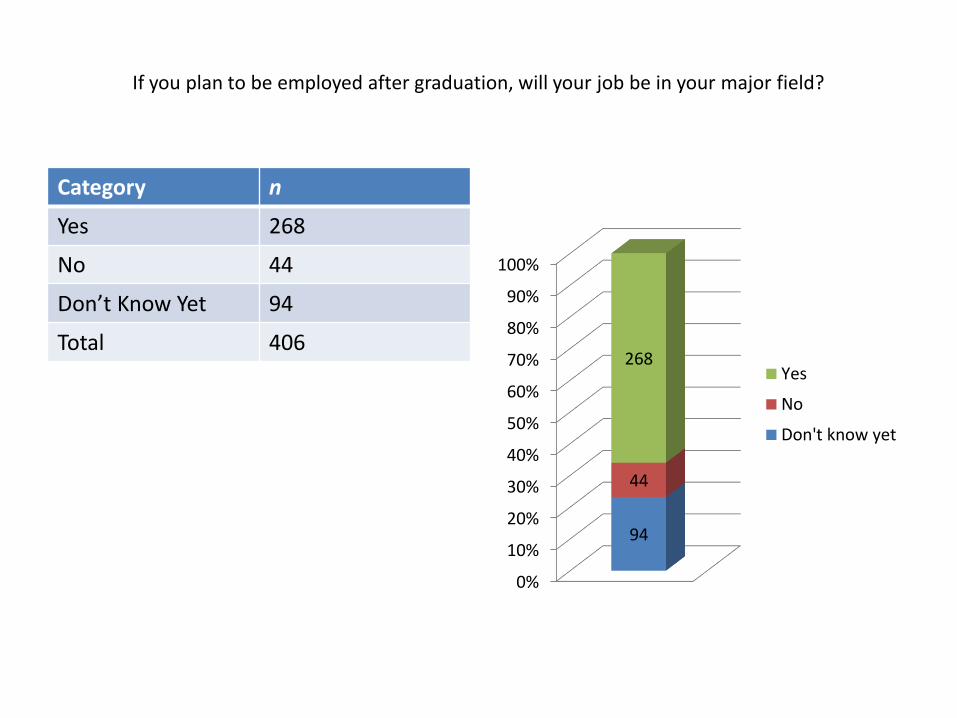
If you plan to be employed after graduation, will your job be in your major field?
Category n
Yes 268
No 44
Don’t Know Yet 94
Total 406
0%
10%
20%
30%
40%
50%
60%
70%
80%
90%
100%
94
44
268Yes
No
Don't know yet
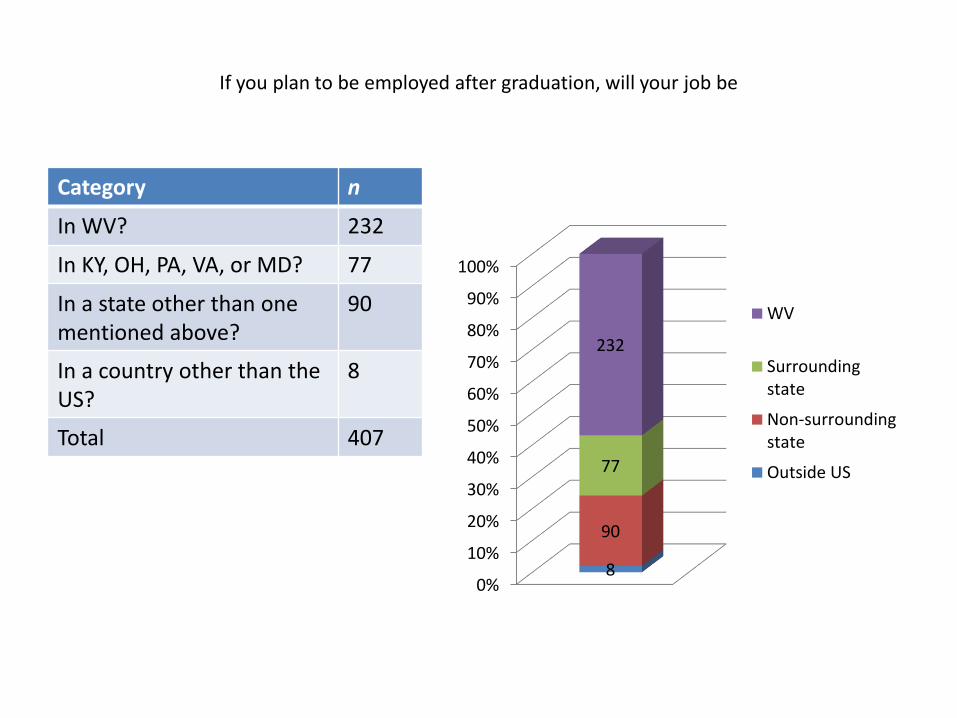
If you plan to be employed after graduation, will your job be
Category n
In WV? 232
In KY, OH, PA, VA, or MD? 77
In a state other than one mentioned above?
90
In a country other than the US?
8
Total 407
0%
10%
20%
30%
40%
50%
60%
70%
80%
90%
100%
8
90
77
232
WV
Surroundingstate
Non-surroundingstate
Outside US
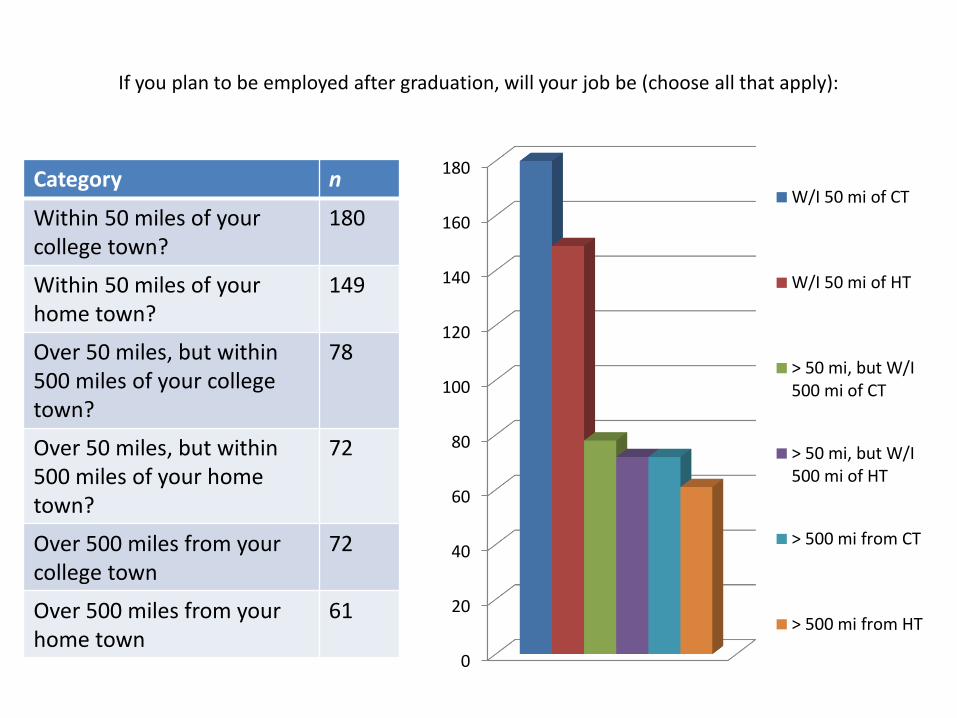
If you plan to be employed after graduation, will your job be (choose all that apply):
Category n
Within 50 miles of your college town?
180
Within 50 miles of your home town?
149
Over 50 miles, but within 500 miles of your college town?
78
Over 50 miles, but within 500 miles of your home town?
72
Over 500 miles from your college town
72
Over 500 miles from your home town
61
0
20
40
60
80
100
120
140
160
180
W/I 50 mi of CT
W/I 50 mi of HT
> 50 mi, but W/I500 mi of CT
> 50 mi, but W/I500 mi of HT
> 500 mi from CT
> 500 mi from HT
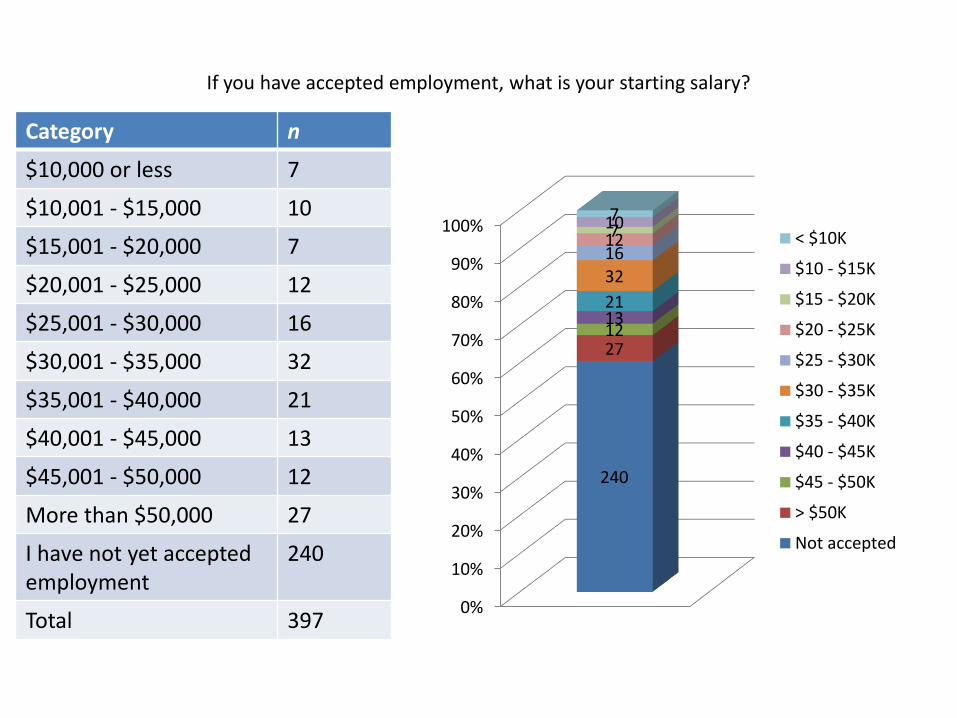
If you have accepted employment, what is your starting salary?
Category n
$10,000 or less 7
$10,001 - $15,000 10
$15,001 - $20,000 7
$20,001 - $25,000 12
$25,001 - $30,000 16
$30,001 - $35,000 32
$35,001 - $40,000 21
$40,001 - $45,000 13
$45,001 - $50,000 12
More than $50,000 27
I have not yet accepted employment
240
Total 3970%
10%
20%
30%
40%
50%
60%
70%
80%
90%
100%
240
27121321
3216127107
< $10K
$10 - $15K
$15 - $20K
$20 - $25K
$25 - $30K
$30 - $35K
$35 - $40K
$40 - $45K
$45 - $50K
> $50K
Not accepted
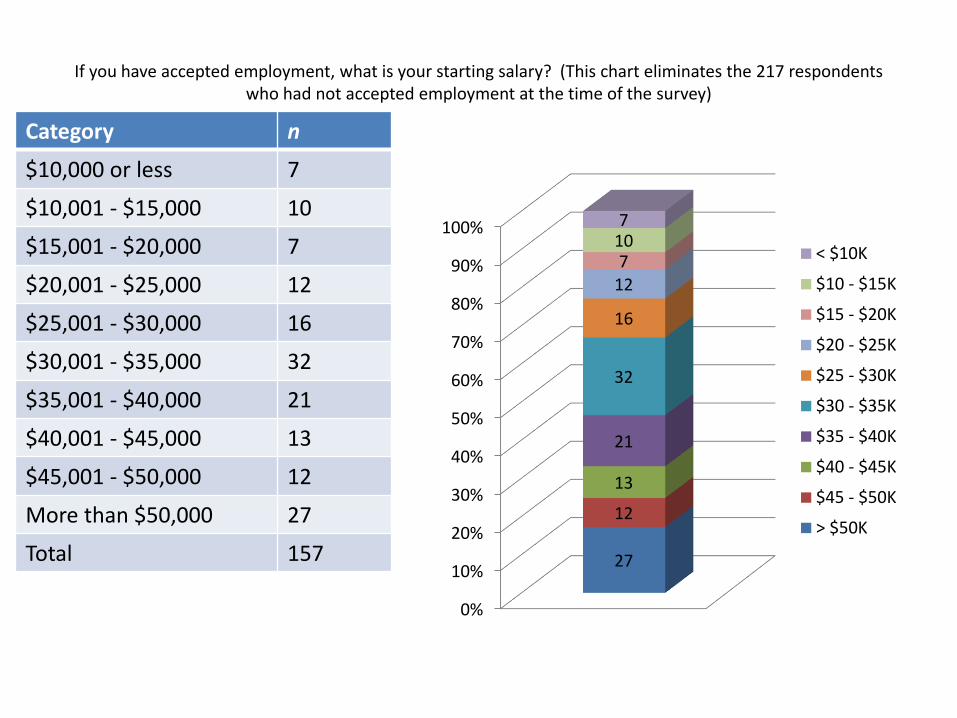
If you have accepted employment, what is your starting salary? (This chart eliminates the 217 respondents who had not accepted employment at the time of the survey)
Category n
$10,000 or less 7
$10,001 - $15,000 10
$15,001 - $20,000 7
$20,001 - $25,000 12
$25,001 - $30,000 16
$30,001 - $35,000 32
$35,001 - $40,000 21
$40,001 - $45,000 13
$45,001 - $50,000 12
More than $50,000 27
Total 157
0%
10%
20%
30%
40%
50%
60%
70%
80%
90%
100%
27
12
13
21
32
16
127
107
< $10K
$10 - $15K
$15 - $20K
$20 - $25K
$25 - $30K
$30 - $35K
$35 - $40K
$40 - $45K
$45 - $50K
> $50K
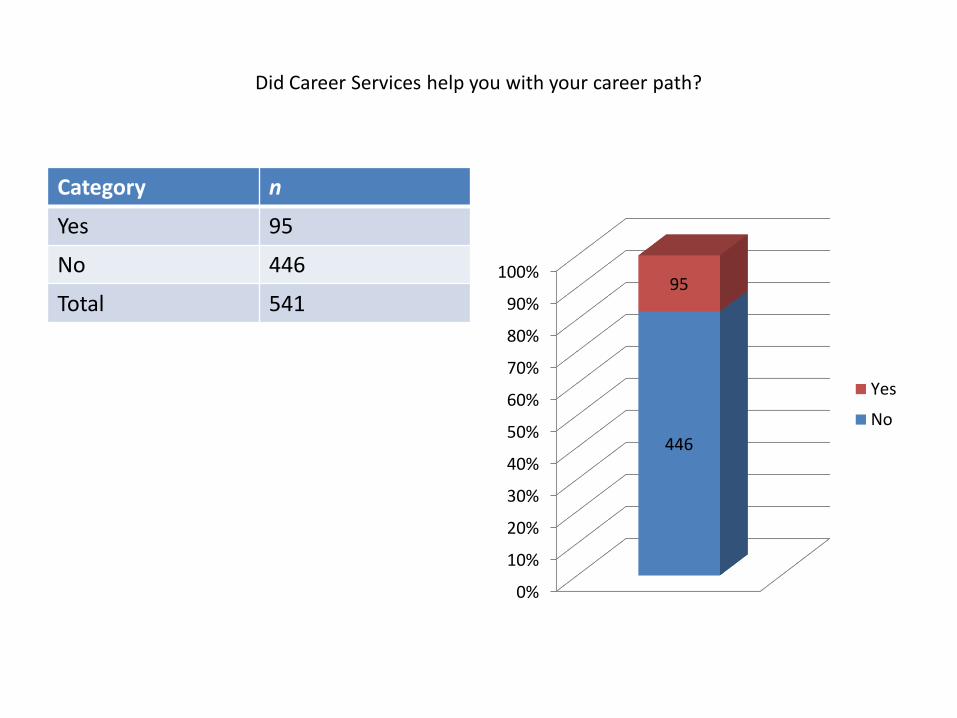
Did Career Services help you with your career path?
Category n
Yes 95
No 446
Total 541
0%
10%
20%
30%
40%
50%
60%
70%
80%
90%
100%
446
95
Yes
No
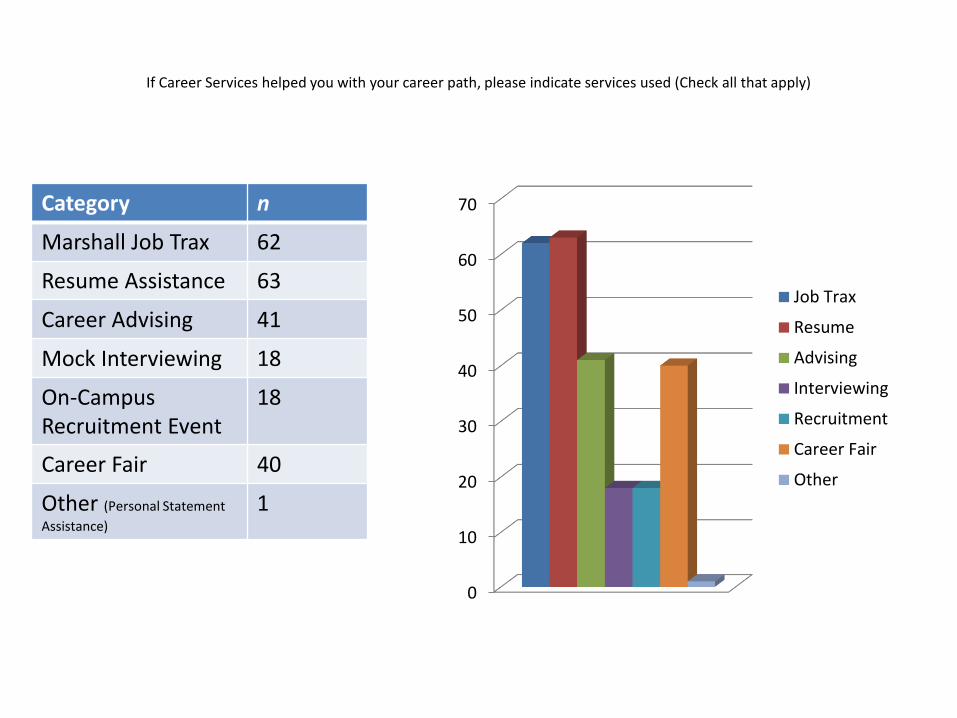
If Career Services helped you with your career path, please indicate services used (Check all that apply)
Category n
Marshall Job Trax 62
Resume Assistance 63
Career Advising 41
Mock Interviewing 18
On-Campus Recruitment Event
18
Career Fair 40
Other (Personal Statement
Assistance)
1
0
10
20
30
40
50
60
70
Job Trax
Resume
Advising
Interviewing
Recruitment
Career Fair
Other