Embed Size (px)
Citation preview
Copyright 2010 by the Association for Research in Vision and Ophthalmology, Inc., all rights reserved.For permission to reproduce any abstract, contact the ARVO Office at [email protected]. Commercial Relationships are noted at the end of each abstract by “None” or with codes.
Sunday, May 2, 8:30 AM - 10:15 AM Hall B/C Poster Session Program Number/Board # Range: 211 - 261 / A479 - A529 110. Retinal Imaging in Glaucoma Organizing Section: GL
211 - A479 Normalization of Time Domain Optical Coherence Tomography (TD-OCT) Retinal Nerve Fiber Layer (RNFL) Thickness Measurements at Variable Scan Locations to a Virtual Universal Center Location Using Three-Dimensional (3D) Spectral Domain (SD-) OCT Data
J. Kim1,2, H. Ishikawa1,2, J. Xu1, G. Wollstein1, R.A. Bilonick1,3, L. Kagemann1,2, J.S. Schuman1,2. 1UPMC Eye Center, Eye & Ear Institute, Ophthalmology and Visual Science Research Center, Dept. Ophthalmology, U. Pittsburgh School of Medicine, Pittsburgh, PA; 2Dept. Bioengineering, Swanson School of Engineering, U. Pittsburgh, Pittsburgh, PA; 3Dept. Biostatistics, U. Pittsburgh Graduate School of Public Health,, Pittsburgh, PA.
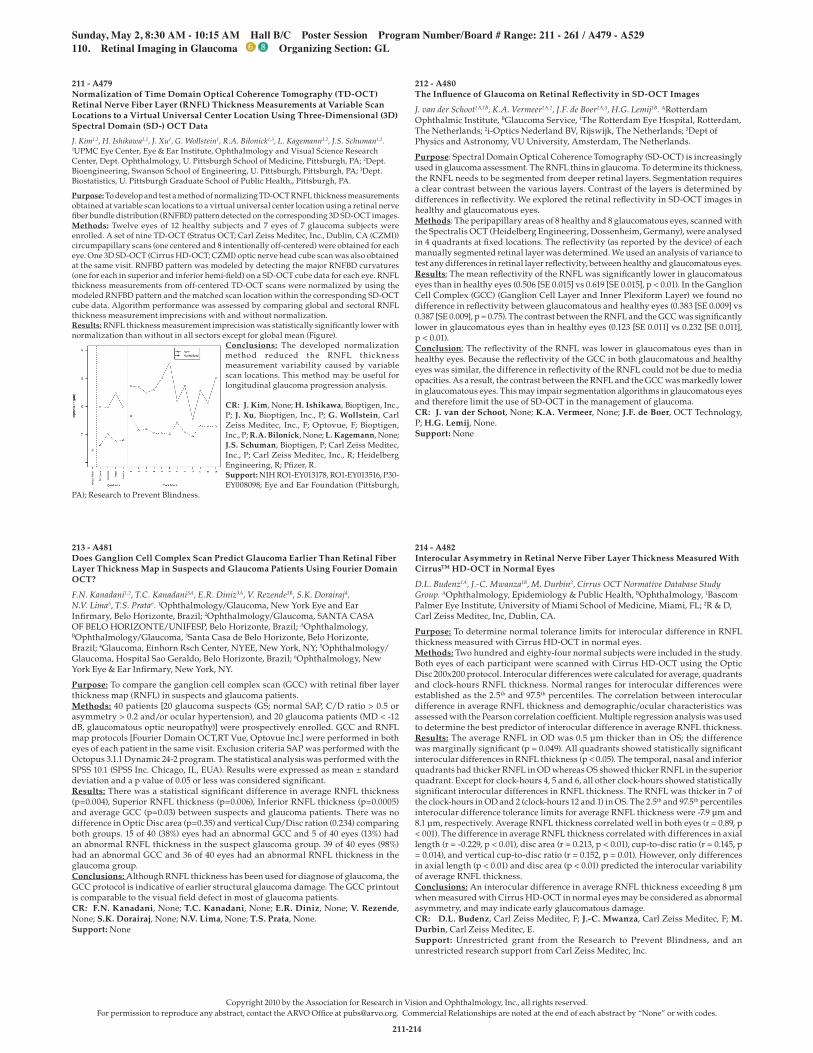
Purpose: To develop and test a method of normalizing TD-OCT RNFL thickness measurements obtained at variable scan locations to a virtual universal center location using a retinal nerve fiber bundle distribution (RNFBD) pattern detected on the corresponding 3D SD-OCT images.Methods: Twelve eyes of 12 healthy subjects and 7 eyes of 7 glaucoma subjects were enrolled. A set of nine TD-OCT (Stratus OCT; Carl Zeiss Meditec, Inc., Dublin, CA (CZMI)) circumpapillary scans (one centered and 8 intentionally off-centered) were obtained for each eye. One 3D SD-OCT (Cirrus HD-OCT; CZMI) optic nerve head cube scan was also obtained at the same visit. RNFBD pattern was modeled by detecting the major RNFBD curvatures (one for each in superior and inferior hemi-field) on a SD-OCT cube data for each eye. RNFL thickness measurements from off-centered TD-OCT scans were normalized by using the modeled RNFBD pattern and the matched scan location within the corresponding SD-OCT cube data. Algorithm performance was assessed by comparing global and sectoral RNFL thickness measurement imprecisions with and without normalization.Results: RNFL thickness measurement imprecision was statistically significantly lower with normalization than without in all sectors except for global mean (Figure).
Conclusions: The developed normalization method reduced the RNFL thickness measurement variability caused by variable scan locations. This method may be useful for longitudinal glaucoma progression analysis.
CR: J. Kim, None; H. Ishikawa, Bioptigen, Inc., P; J. Xu, Bioptigen, Inc., P; G. Wollstein, Carl Zeiss Meditec, Inc., F; Optovue, F; Bioptigen, Inc., P; R.A. Bilonick, None; L. Kagemann, None; J.S. Schuman, Bioptigen, P; Carl Zeiss Meditec, Inc., P; Carl Zeiss Meditec, Inc., R; Heidelberg Engineering, R; Pfizer, R. Support: NIH RO1-EY013178, RO1-EY013516, P30-EY008098; Eye and Ear Foundation (Pittsburgh,
PA); Research to Prevent Blindness.
212 - A480 The Influence of Glaucoma on Retinal Reflectivity in SD-OCT Images
J. van der Schoot1A,1B, K.A. Vermeer1A,2, J.F. de Boer1A,3, H.G. Lemij1B. ARotterdam Ophthalmic Institute, BGlaucoma Service, 1The Rotterdam Eye Hospital, Rotterdam, The Netherlands; 2i-Optics Nederland BV, Rijswijk, The Netherlands; 3Dept of Physics and Astronomy, VU University, Amsterdam, The Netherlands.
Purpose: Spectral Domain Optical Coherence Tomography (SD-OCT) is increasingly used in glaucoma assessment. The RNFL thins in glaucoma. To determine its thickness, the RNFL needs to be segmented from deeper retinal layers. Segmentation requires a clear contrast between the various layers. Contrast of the layers is determined by differences in reflectivity. We explored the retinal reflectivity in SD-OCT images in healthy and glaucomatous eyes.Methods: The peripapillary areas of 8 healthy and 8 glaucomatous eyes, scanned with the Spectralis OCT (Heidelberg Engineering, Dossenheim, Germany), were analysed in 4 quadrants at fixed locations. The reflectivity (as reported by the device) of each manually segmented retinal layer was determined. We used an analysis of variance to test any differences in retinal layer reflectivity, between healthy and glaucomatous eyes.Results: The mean reflectivity of the RNFL was significantly lower in glaucomatous eyes than in healthy eyes (0.506 [SE 0.015] vs 0.619 [SE 0.015], p < 0.01). In the Ganglion Cell Complex (GCC) (Ganglion Cell Layer and Inner Plexiform Layer) we found no difference in reflectivity between glaucomatous and healthy eyes (0.383 [SE 0.009] vs 0.387 [SE 0.009], p = 0.75). The contrast between the RNFL and the GCC was significantly lower in glaucomatous eyes than in healthy eyes (0.123 [SE 0.011] vs 0.232 [SE 0.011], p < 0.01).Conclusion: The reflectivity of the RNFL was lower in glaucomatous eyes than in healthy eyes. Because the reflectivity of the GCC in both glaucomatous and healthy eyes was similar, the difference in reflectivity of the RNFL could not be due to media opacities. As a result, the contrast between the RNFL and the GCC was markedly lower in glaucomatous eyes. This may impair segmentation algorithms in glaucomatous eyes and therefore limit the use of SD-OCT in the management of glaucoma. CR: J. van der Schoot, None; K.A. Vermeer, None; J.F. de Boer, OCT Technology, P; H.G. Lemij, None. Support: None
213 - A481 Does Ganglion Cell Complex Scan Predict Glaucoma Earlier Than Retinal Fiber Layer Thickness Map in Suspects and Glaucoma Patients Using Fourier Domain OCT?
F.N. Kanadani1,2, T.C. Kanadani3A, E.R. Diniz3A, V. Rezende3B, S.K. Dorairaj4, N.V. Lima5, T.S. Prata6. 1Ophthalmology/Glaucoma, New York Eye and Ear Infirmary, Belo Horizonte, Brazil; 2Ophthalmology/Glaucoma, SANTA CASA OF BELO HORIZONTE/UNIFESP, Belo Horizonte, Brazil; AOphthalmology, BOphthalmology/Glaucoma, 3Santa Casa de Belo Horizonte, Belo Horizonte, Brazil; 4Glaucoma, Einhorn Rsch Center, NYEE, New York, NY; 5Ophthalmology/Glaucoma, Hospital Sao Geraldo, Belo Horizonte, Brazil; 6Ophthalmology, New York Eye & Ear Infirmary, New York, NY.
Purpose: To compare the ganglion cell complex scan (GCC) with retinal fiber layer thickness map (RNFL) in suspects and glaucoma patients.Methods: 40 patients [20 glaucoma suspects (GS; normal SAP, C/D ratio > 0.5 or asymmetry > 0.2 and/or ocular hypertension), and 20 glaucoma patients (MD < -12 dB, glaucomatous optic neuropathy)] were prospectively enrolled. GCC and RNFL map protocols [Fourier Domain OCT,RT Vue, Optovue Inc.] were performed in both eyes of each patient in the same visit. Exclusion criteria SAP was performed with the Octopus 3.1.1 Dynamic 24-2 program. The statistical analysis was performed with the SPSS 10.1 (SPSS Inc. Chicago, IL, EUA). Results were expressed as mean ± standard deviation and a p value of 0.05 or less was considered significant.Results: There was a statistical significant difference in average RNFL thickness (p=0.004), Superior RNFL thickness (p=0.006), Inferior RNFL thickness (p=0.0005) and average GCC (p=0.03) between suspects and glaucoma patients. There was no difference in Optic Disc area (p=0.35) and vertical Cup/Disc ration (0.234) comparing both groups. 15 of 40 (38%) eyes had an abnormal GCC and 5 of 40 eyes (13%) had an abnormal RNFL thickness in the suspect glaucoma group. 39 of 40 eyes (98%) had an abnormal GCC and 36 of 40 eyes had an abnormal RNFL thickness in the glaucoma group.Conclusions: Although RNFL thickness has been used for diagnose of glaucoma, the GCC protocol is indicative of earlier structural glaucoma damage. The GCC printout is comparable to the visual field defect in most of glaucoma patients. CR: F.N. Kanadani, None; T.C. Kanadani, None; E.R. Diniz, None; V. Rezende, None; S.K. Dorairaj, None; N.V. Lima, None; T.S. Prata, None. Support: None
214 - A482 Interocular Asymmetry in Retinal Nerve Fiber Layer Thickness Measured With CirrusTM HD-OCT in Normal Eyes
D.L. Budenz1A, J.-C. Mwanza1B, M. Durbin2, Cirrus OCT Normative Database Study Group. AOphthalmology, Epidemiology & Public Health, BOphthalmology, 1Bascom Palmer Eye Institute, University of Miami School of Medicine, Miami, FL; 2R & D, Carl Zeiss Meditec, Inc, Dublin, CA.
Purpose: To determine normal tolerance limits for interocular difference in RNFL thickness measured with Cirrus HD-OCT in normal eyes.Methods: Two hundred and eighty-four normal subjects were included in the study. Both eyes of each participant were scanned with Cirrus HD-OCT using the Optic Disc 200x200 protocol. Interocular differences were calculated for average, quadrants and clock-hours RNFL thickness. Normal ranges for interocular differences were established as the 2.5th and 97.5th percentiles. The correlation between interocular difference in average RNFL thickness and demographic/ocular characteristics was assessed with the Pearson correlation coefficient. Multiple regression analysis was used to determine the best predictor of interocular difference in average RNFL thickness.Results: The average RNFL in OD was 0.5 µm thicker than in OS; the difference was marginally significant (p = 0.049). All quadrants showed statistically significant interocular differences in RNFL thickness (p < 0.05). The temporal, nasal and inferior quadrants had thicker RNFL in OD whereas OS showed thicker RNFL in the superior quadrant. Except for clock-hours 4, 5 and 6, all other clock-hours showed statistically significant interocular differences in RNFL thickness. The RNFL was thicker in 7 of the clock-hours in OD and 2 (clock-hours 12 and 1) in OS. The 2.5th and 97.5th percentiles interocular difference tolerance limits for average RNFL thickness were -7.9 µm and 8.1 µm, respectively. Average RNFL thickness correlated well in both eyes (r = 0.89, p < 001). The difference in average RNFL thickness correlated with differences in axial length (r = -0.229, p < 0.01), disc area (r = 0.213, p < 0.01), cup-to-disc ratio (r = 0.145, p = 0.014), and vertical cup-to-disc ratio (r = 0.152, p = 0.01). However, only differences in axial length (p < 0.01) and disc area (p < 0.01) predicted the interocular variability of average RNFL thickness.Conclusions: An interocular difference in average RNFL thickness exceeding 8 µm when measured with Cirrus HD-OCT in normal eyes may be considered as abnormal asymmetry, and may indicate early glaucomatous damage. CR: D.L. Budenz, Carl Zeiss Meditec, F; J.-C. Mwanza, Carl Zeiss Meditec, F; M. Durbin, Carl Zeiss Meditec, E. Support: Unrestricted grant from the Research to Prevent Blindness, and an unrestricted research support from Carl Zeiss Meditec, Inc.
211-214

Copyright 2010 by the Association for Research in Vision and Ophthalmology, Inc., all rights reserved.For permission to reproduce any abstract, contact the ARVO Office at [email protected]. Commercial Relationships are noted at the end of each abstract by “None” or with codes.
Sunday, May 2, 8:30 AM - 10:15 AM Hall B/C Poster Session Program Number/Board # Range: 211 - 261 / A479 - A529 110. Retinal Imaging in Glaucoma Organizing Section: GL
Monday, May 4, 8:30 AM - 10:15 AM Hall B/C Poster Session Program Number/Board # Range: 1382 - 1406 / B121 - B145 219. Functional Retinal Imaging Organizing Section: MOI
215 - A483 3-D Optic Disc Morphometry and Retinal Nerve Fibre Layer Thickness With Spectral-Domain OCT in Ocular Hypertensives and Preperimetric Glaucomas
C.Y. Mardin, R. Lämmer, D. Baleanu, A. Juenemann, R. Tornow, F. Horn. Ophthalmology, University Erlangen-Nurnberg, Erlangen, Germany.
Purpose: To investigate the relationship between RNFL thickness measurements and disc morphology in corresponding eyes obtained with laser-scanning-tomography (LST) and spectral-domain-OCT (sd) in ocular hypertensives (OHT) and preperimetric glaucomas (pPOAG).Methods: The study included 586 eyes of 295 patients and controls. 115 controls (N), 149 OHT, 132 pPOAG and 174 advanced glaucoma (POAG) patients were recruited from the Erlangen Glaucoma Registry.Methods: Controls and patients underwent a standard ophthalmic examination including slit-lamp inspection, funduscopy, gonioscopy, perimetry and papillometry. In addition, a 24-hour intraocular pressure phasing (applanation tonometry) was performed in all patients. Optic disk evaluations were based on 15° color photographs and disc appearance (rim notching, vertical elongation of cup, RNFL loss) determined the diagnostic groups. The participants were scanned with the HRT I, II , III device and a commercially available sd-OCT (Spectralis HRA+OCT; both Heidelberg Engineering, Germany). 25 consecutive circular B-scans (3.4 mm diameter, 768 A-scans) centered at the optic disc were automatically averaged. HRT III’s rim area and volume (ra/rv), retinal thickness (r/t) and the GPS score were chosen to describe the 3-D disc morphology. Parametric and non-parametric tests were applied as appropriate for comparison between groups.Results: There was no significant difference in disc area between the four diagnostic groups (N 2.3 ± 0.7mm², OHT 2.3 ± 0.5mm², pPOAG 2.5 ± 0.6mm², POAG 2.4 ± 0.5mm²). Mean RFNL thickness with sd-OCT was in N 96.2±8.7µm, OHT 92.9±11.6µm (p=0.007), pPOAG 81.6±12.9µm (p=0.0001) and in POAG 63.56±14.5µm (p<0.0001). There was no significant difference for HRT’s ra, rv, rt or gps-classification between N (1.5±0.3mm², 0.4±0.2mm³, 0.3±0.07mm, 0.4±0.3) and OHT (1.5±0.4mm², 0.4±0.2mm³, 0.3±0.06mm, 0.4±0.3). PPOAG discs showed significantly different values (1.4±0.4mm² (p=0.05); 0.3±0.2mm³, 0.2±0.07mm, 0.6±0.3 (p<0.0001). Mean RNFL loss of -16% in pPOAG was correlated to a -7% loss of ra and -25% of rv respectively. OHT discs with a healthy appearance showed a mean RNFL loss of 4%. Conclusions: OHT eyes tend to show a RNFL loss, although disc appearance and stereometric parameters of the disc seem to be unchanged to normals. Glaucoma discs without perimetric defects already show a significant loss of RNFL and rim volume in correlation to disc appearance on photographs. These findings may support early glaucoma detection. CR: C.Y. Mardin, None; R. Lämmer, None; D. Baleanu, None; A. Juenemann, None; R. Tornow, None; F. Horn, None. Support: DFG/ SFB539 CT: www.clinicaltrials.gov, NCT00494923
216 - A484 Sensitivity and Specificity of Thickness Measurements of Macular Ganglion Cell Layer and Ganglion Cell Complex Using Spectral-Domain OCT for Diagnosis of Preperimetric or Early Glaucoma
A. Tomidokoro1, M. Hangai2, N. Yoshimura2, M. Araie1, 3D OCT Study Group. 1Ophthalmology, Univ of Tokyo School of Medicine, Tokyo, Japan; 2Ophthalmology & Visual Sciences, Kyoto Univ Graduate School of Medicine, Kyoto, Japan.
Purpose: To evaluate sensitivity (Sn) and specificity (Sp) of thickness measurements of ganglion cell layer (GCL) and ganglion cell complex (GCC, from the internal limiting membrane to the outer border of inner plexiform layer) in the macular area using a spectral-domain optical coherence tomography (SD-OCT; 3D OCT-1000, Topcon, Inc.) for diagnosis of preperimetric or early glaucoma.Methods: In 41 eyes with early glaucoma (EG, mean deviation of HFA 24-2 SITA-s > -5 dB ), 18 with preperimetric glaucoma (PG, apparent retinal nerve fiber layer defects but no significant change on HFA 24-2 SITA-s), and 42 normal eyes, retinal imaging was performed with the SD-OCT with a vertical raster scan protocol in a 6 x 6 mm squared macular area, and thickness of GCL and GCC was determined with an automated segmentation algorithm of the retinal layers in 5 x 5 mm squared area centered on the automatically detected foveal center. The 1st-percentile value in each parameter in other 100 normal eyes was applied as a cutoff value for the diagnosis. If mean thickness was less than the cutoff value in at least one grid, the eye was diagnosed as glaucoma.Results: When using the total average thickness in the 5 x 5 mm area, Sn of EG was 53.7%, Sn of PG 11.1%, and Sp 100% for the GCL thickness; and those were 61.0%, 5.6%, and 100% for the GCC thickness measurement. When the area divided into smaller grids, Sn increased, while Sp decreased. The best performance was obtained when dividing into 8 x 8 grids (each grid was a 0.63x 0.63 mm square), with which Sn of EG was 92.7%, Sn of PG 90.7%, and Sp 91.5% for the GCL thickness; and those were 94.4%, 94.3%, and 84.5% for the GCC thickness.Conclusions: Sn and Sp of GCL measurement for diagnosing EG and PG were comparable to those of GCC measurement. The best performance was obtained when using 0.6 x 0.6 mm grids in the macular area. CR: A. Tomidokoro, Topcon, C; M. Hangai, Topcon, NIDEK, C; N. Yoshimura, Topcon, NIDEK, C; M. Araie, Topcon, C. Support: None
217 - A485 Diagnostic Classification of Rnfl Measurement in Normal Myopic Subjects: A Comparison Between Time-Domain and Spectral-Domain OCT
K. Qiu1, M. Zhang1, X. Lu1, K. Leung2, G. Wang1, L. Sun1, C.-P. Pang1,2, S. Lam1,2. 1JSIEC, Shantou, China; 2Ophthalmology and Visual Sciences, The Chinese University of Hong Kong, Hong Kong, China.
Purpose: To evaluate and compare the diagnostic classification of retinal nerve fiber layer (RNFL) measurement between time-domain and spectral-domain optical coherence tomography (OCT) in healthy myopic subjects.Methods: A total of 98 eyes from 98 healthy myopia subjects were included. The parapapillary RNFL was imaged sequentially by Stratus OCT and Cirrus HD OCT (Carl Zeiss Meditec, Dublin, CA) within the same visit. Only images with signal strength of at least 7 were included in the analysis. Diagnostic classification (within normal limits, borderline, or outside normal limits) derived from the 2 OCT instruments were compared with the likelihood ratio chi-square test. Results: The mean age, axial length, and spherical equivalent were 23± 4.1 years (range, 18-40), 25.54 ±1.31 mm (range, 22.52-28.12), and -4.91± -3.14 D (range, -1 to -12.75), respectively. The respective visual field mean deviation and pattern standard deviation were -2.13 ±1.12 dB and 1.49±0.98 dB. With reference to average RNFL thickness, 96.0% (94/98 eyes) were classified as normal and 4.1% (4/98) as borderline by the Cirrus HD-OCT whereas while all eyes were classified as within normal limits by the Stratus OCT. With reference to sectorial RNFL measurements, the Cirrus HD-OCT identified a significantly higher proportion of eyes as outside normal limits / borderline for at least one clock-hour (Stratus OCT: 14.28% / 35.7%; Cirrus HD-OCT: 21.42% / 52.1%; all with p<0.01). 1 o’clock and 4 o’clock were the most frequent clock hour classified as abnormal (borderline or outside normal limits) by the Cirrus HD-OCT and the Stratus OCT, respectively.Conclusions: Nasal RNFL measurement was commonly classified as abnormal by Stratus OCT, and more often by Cirrus HD-OCT in myopic eyes. Caution should be exercised in interpreting RNFL measurement in myopic individuals. CR: K. Qiu, None; M. Zhang, None; X. Lu, None; K. Leung, None; G. Wang, None; L. Sun, None; C.-P. Pang, None; S. Lam, None. Support: None
218 - A486 Diagnostic Accuracy of Macular Inner Retinal and Peripapillary Retinal Nerve Fiber Layer Measurements by RTVue Spectral Domain OCT in Early Glaucoma
G. Jonnadula1, S. Senthil1, U.K. Addepalli2A, H.L. Rao1,3, C.S. Garudadri2B. 1Glaucoma, L.V.Prasad Eye Institute, Hyderabad, India; AOptometry, BGlaucoma, 2LV Prasad Eye Institute, Hyderabad, India; 3Hamilton Glaucoma Center, UCSD, La Jolla, CA.
Purpose: To compare the diagnostic ability of macular inner retinal and peripapillary retinal nerve fiber layer (RNFL) measurements by RTVue spectral domain optical coherence tomography (SDOCT) in early glaucoma.Methods: In a cross-sectional, observational study, 64 eyes of 64 normal subjects and 59 eyes of 41 early glaucoma patients underwent macular and RNFL imaging with RTVue. Normal subjects had normal and reliable standard automated perimetry (SAP) results and a normal ocular examination. Glaucomatous eyes had a repeatable abnormal SAP result that satisfied at least two of the Anderson’s criteria and the mean deviation was better than or equal to - 6 dB. The areas under the receiver operating characteristic curves (AUCs) and the sensitivities at a fixed specificity of 95%, of the macular and RNFL parameters were compared.Results: The AUCs for the macular inner retinal parameters ranged from 0.587 for the macular inner retinal superior minus inferior thickness average to 0.896 for the ganglion cell complex - focal loss volume (GCC-FLV). The AUCs for the RNFL
parameters ranged from 0.520 for the temporal quadrant thickness to 0.784 for the inferior quadrant RNFL thickness. The AUC of the best macular parameter (GCC-FLV) was significantly greater (p=0.01) than the best RNFL parameter (inferior quadrant thickness, figure). Sensitivity at a fixed specificity of 95% was 57.8% for GCC-FLV and was 18.8% for the inferior quadrant RNFL thickness.Conclusion: Macular parameters with SDOCT have a better diagnostic accuracy to detect early glaucoma compared to the RNFL parameters.
CR: G. Jonnadula, None; S. Senthil, None; U.K. Addepalli, None; H.L. Rao, None; C.S. Garudadri, Optovue, Inc., F. Support: Hyderabad Eye Research Foundation
215-218

Copyright 2010 by the Association for Research in Vision and Ophthalmology, Inc., all rights reserved.For permission to reproduce any abstract, contact the ARVO Office at [email protected]. Commercial Relationships are noted at the end of each abstract by “None” or with codes.
Sunday, May 2, 8:30 AM - 10:15 AM Hall B/C Poster Session Program Number/Board # Range: 211 - 261 / A479 - A529 110. Retinal Imaging in Glaucoma Organizing Section: GL
219 - A487 Automated Retinal and NFL Segmentation in OCT Volume Scans by Pixel Classification
K.A. Vermeer1A,2, J. van der Schoot1A,1B, J.F. De Boer1A,3, H.G. Lemij1B. ARotterdam Ophthalmic Institute, BGlaucoma Service, 1Rotterdam Eye Hospital, Rotterdam, The Netherlands; 2i-Optics Nederland BV, Rijswijk, The Netherlands; 3Dept. of Physics and Astronomy, VU University, Amsterdam, The Netherlands.
Purpose: To develop and evaluate an automated method for segmentation of the retina and the retinal nerve fiber layer (RNFL) in OCT volume scans.Methods: Volumetric scans of 10 normal and 8 glaucomatous subjects were acquired with a Spectralis OCT (Heidelberg Engineering) (20°x20° centered at the optic disk, 193 B-scans). Two B-scans of each healthy subject and one B-scan of each glaucomatous subject were manually segmented into four areas, defining three interfaces: vitreous/RNFL, RNFL/GCL and RPE/choroid.Each pixel along each A-line was augmented by simple averaged data from neighboring pixels on that same A-line, producing a feature vector for each pixel in the volumetric scan. The manually segmented scans of the healthy subjects were used to train a second degree polynomial support vector machine. The resulting classifier was then applied to the full volumetric scans and the results were regularized by a level set segmentation. Local accuracy was estimated by the root mean square of the differences between manually and automatically determined interfaces. For the data from healthy subjects, cross-validation was used.Results: Examples of the RNFL thickness of a (left) healthy and a (right) glaucomatous eye are shown below.
For the healthy subjects, the estimated RMS errors of the interfaces were 3.3 µm (vitreous/RNFL), 4.2 µm (RNFL/GCL), 12.8 µm (RPE/choroid), excluding errors due to artifacts near the optic disk or at the boundaries of the scans. For glaucomatous eyes, the errors were 4.6 µm, 5.6 µm and 13.2 µm respectively.Worst performance was encountered in eyes with almost indiscernible contrast between NFL and GCL reflectivity.Conclusions: The proposed method provides accurate interface localization for the vitreous/NFL and RPE/choroid interfaces. The NFL/GCL interface sometimes locks to other structures, yielding somewhat less accurate results. The resulting thickness maps match the expected morphological structure of the retina and the RNFL. CR: K.A. Vermeer, None; J. van der Schoot, None; J.F. De Boer, OCT technology, P; H.G. Lemij, None. Support: None
220 - A488 Quantitative Measurements of Retinal Nerve Fiber Layer (RNFL) Thickness Decay Along the Retinal Nerve Fiber Bundle Path (RNFBP) With Three-Dimensional (3D) Spectral Domain Optical Coherence Tomography (SD-OCT)
J. Xu1, H. Ishikawa1,2, R.A. Bilonick1,3, G. Wollstein1, M.L. Gabriele1,2, Y. Ling1,3, J.S. Kim1,2, L.S. Folio1,2, L. Kagemann1,2, J.S. Schuman1,2. 1UPMC Eye Center, Eye & Ear Institute, Ophthalmology & Visual Science Research Center, Dept. of Ophthalmology, Univ. of Pittsburgh School of Medicine, Pittsburgh, PA; 2Dept. of Bioengineering, Swanson School of Engineering, Univ. of Pittsburgh, Pittsburgh, PA; 3Dept. of Biostatistics, Graduate School of Public Health, Univ. of Pittsburgh, Pittsburgh, PA.
Purpose: Previously we reported the RNFL thickness decay along straight radial lines without taking the natural curvature of the RNFBP. The purpose of this study was to revisit the RNFL thickness decay measurements along the individual RNFBP pattern on 3D SD-OCT images.Methods: Forty-six eyes of 46 healthy subjects were scanned with 3D SD-OCT (Cirrus HD-OCT; Carl Zeiss Meditec, Inc., Dublin, CA; ONH Cube 200x200 scan protocol). Two major RNFBPs (superior and inferior) were manually traced as two parabolic curves passing the disc center on two-dimensional RNFL thickness maps generated from 3D SD-OCT images. RNFBPs in the remaining area were automatically generated by interpolating the major RNFBP curve in either superior or inferior hemi-field assuming the horizontal meridian was a straight line. RNFL thickness was then re-sampled along RNFBPs at 1 degree interval (total 360 RNFBPs).Results: NFL thickness data showed consistent characteristics across all subjects: a plateau of high NFL thickness was seen near the disc margin in inferior quadrant, while NFL thickness decayed without a plateau in the superior, temporal and nasal quadrants, just
like the previously reported results sampled along the straight radial lines (Figure). Linear model was used to fit the decay. In the pair-wise comparison, RNFL decay slopes were statistically significantly different to each others in 4 quadrants except for nasal comparing with superior quadrants.Conclusions: RNFL decay characteristics were confirmed with the new model along the individual RNFBP. This method may permit advanced research about spatial progression of glaucomatous damage. CR: J. Xu, Bioptigen, Inc., P; H. Ishikawa, Bioptigen, Inc., P; R.A. Bilonick, None; G. Wollstein, Carl Zeiss Meditec, Inc., F; Optovue, F; Bioptigen, Inc.,
P; M.L. Gabriele, None; Y. Ling, None; J.S. Kim, None; L.S. Folio, None; L. Kagemann, None; J.S. Schuman, Bioptigen, Inc., P; Carl Zeiss Meditec, Inc., P; Carl Zeiss Meditec, Inc., R; Heidelberg Engineering, Inc., R; Pfizer, R. Support: NIH R01-EY013178-9, P30-EY008098; Eye and Ear Foundation (Pittsburgh, PA); Research to Prevent Blindness.
221 - A489 Automated Segmentation of Multiple Intraretinal Boundaries in 3D Spectral-Domain Optical Coherence Tomography
M. Hangai1, A. Tomidokoro2, M. Araie2, N. Yoshimura1, 3D OCT Study Group. 1Ophthalmology and Visual Sciences, Kyoto Univ Graduate School of Medicine, Kyoto, Japan; 2Ophthalmology, Univ of Tokyo School of Medicine, Tokyo, Japan.
Purpose: To automate segmentation of multiple intraretinal boundaries in 3-dimensional (3D) spectral-domain optical coherence tomography (SD-OCT) images and to assess the reproducibility of measurements of single intraretinal layers, (e.g., the ganglion cell layer (GCL)), and 2-3 combined layers, including the GCL, in normal and glaucomatous eyes.Methods: We used data of 3 vertical 3D scans over the macula of 43 normal eyes of 26 subjects and 59 glaucomatous eyes of 46 patients. OCT-1000 (Topcon) was used to obtain 512 A-scans over 128 frames. An automated segmentation algorithm based on a customized edge detector and edge refinery was developed. It can segment ≤9 intraretinal boundaries (Table 1). Two experts visually inspected 128 B-scans per eye to assess significant boundary-detection failures as per previously reported criteria (Invest Ophthalmol Vis Sci. 2005;46: 2012-2017). Intraclass correlation coefficients (ICC) and coefficients of variation (CV) were calculated to assess the thickness-measurement repeatability.Results: For each 3D scan, the mean number of B-scans deemed to have significant detection failures by either of the experts was 0.07-0.29 for the 8 boundaries but 57.9 for the external limiting membrane (ELM) in normal eyes. The ICCs and CVs were excellent in single GCL layers, combined layers including the GCL, the inner nuclear layer, and the combined outer plexiform and outer nuclear layers in both normal and glaucomatous eyes (Table 1).
Conclusions: The automated segmentation algorithm was reliable in 8 boundaries but none in the ELM. Automated segmentation of multiple intraretinal layers enabled reliable measurement of the thickness of the GCL layer and of combined layers including GCL.
CR: M. Hangai, TOPCON, NIDEK, C; A. Tomidokoro, TOPCON, C; M. Araie, TOPCON, C; N. Yoshimura, TOPCON, NIDEK, C. Support: a Grant-in-Aid for Scientific Research (20592038) from the Japan Society for the Promotion of Science (JSPS).
222 - A490 Glaucoma Detection With the Stratus and Cirrus OCT in a Population Based Sample
S. Andersson, D. Bizios, A. Heijl, B.M. Bengtsson. Dept of Clinical Sciences, Ophthalmology, UMAS, Lund University, Malmoe, Sweden.
Purpose: Predictive values are important when selecting a screening method. Positive predictive values (PPVs) depend strongly on disease prevalence. Therefore studies including a sample of clinical glaucoma patients would yield falsely high PPVs. A population based sample would yield a more valid prevalence and thereby also a more valid PPV. Our aim is to describe the diagnostic performance of time domain Stratus and spectral domain Cirrus OCT in a population based sample.Methods: Out of 4718 persons over 50 years old, a random sample of 307 individuals was invited. The 170 individuals that responded underwent a comprehensive ophthalmic examination. Of the 138 individuals that were finally included, one eye per individual was analysed. Retinal nerve fiber layer thickness (RNFLT) was measured with the Fast RNFLT protocol of Stratus OCT (Carl Zeiss Meditec, Dublin, CA, USA) and the glaucoma analysis package of Cirrus OCT (Carl Zeiss Meditec, Dublin, CA, USA). Specificity, sensitivity and PPVs for mean RNFLT, quadrants and the clock hour sectors, as well as AROCs for the two latter RNFLT parameters, were calculated using the significance limits p< 5% and p< 1% as cut-off for positive findings.Results: Nine glaucoma patients were identified (prevalence of 6.5%). Mean age was 72 (range: 61-83) and 64 years (range: 48-81) for glaucoma and healthy individuals respectively. Specificity, sensitivity and PPVs for mean RNFLT, quadrants and the clock hour sectors with the corresponding AROCs can be seen in the table.
Conclusions: Both Stratus and Cirrus OCT performed well. For all parameters and both cut-off levels, p<5% and p<1%, Stratus OCT yielded better specificity and positive predictive values, both desirable properties of a method to be used for screening. However, the higher sensitivity of Cirrus OCT is preferable in clinical settings where priority is given to early detection of glaucoma.
CR: S. Andersson, None; D. Bizios, None; A. Heijl, Carl Zeiss Meditec, F; Carl Zeiss Meditec, C; B.M. Bengtsson, Carl Zeiss Meditec, F; Carl Zeiss Meditec, C. Support: The Järnhardt foundation, Sweden. Crown princess Margareta’s foundation for visually impaired, Sweden. The foundation for visually impaired in former Malmöhus län, Sweden.
219-222
Copyright 2010 by the Association for Research in Vision and Ophthalmology, Inc., all rights reserved.For permission to reproduce any abstract, contact the ARVO Office at [email protected]. Commercial Relationships are noted at the end of each abstract by “None” or with codes.
Sunday, May 2, 8:30 AM - 10:15 AM Hall B/C Poster Session Program Number/Board # Range: 211 - 261 / A479 - A529 110. Retinal Imaging in Glaucoma Organizing Section: GL
Monday, May 4, 8:30 AM - 10:15 AM Hall B/C Poster Session Program Number/Board # Range: 1382 - 1406 / B121 - B145 219. Functional Retinal Imaging Organizing Section: MOI
223 - A491 Effect of Refractive Power on the Measurement of Peripapillary Retinal Nerve Fiber Layer Thickness in Cirrus Optical Coherence Tomography
E. Lee, N. Kim, C. Kim, S. Byeon, S. Kim, S. Hong, G. Seong. Ophthalmology & Visual Sciences, Yonsei Univ College of Medicine, Seoul, Republic of Korea.
Purpose: To evaluate the effect of refractive power on the measurement of peripapillary retinal nerve fiber layer (RNFL) thickness by Cirrus Fourier-domain optical coherence tomography (OCT).Methods: This prospective study involved 15 eyes of 15 healthy participants. Optical coherence tomography scans to measure peripapillary RNFL thickness were repeated in each eye with different refractive condition by wearing soft contact lens of plano, minus (-2, -4, and -6) and plus diopters (+2, +4, +6 and +8). OCT scan was also performed without wearing soft contact lens to evaluate lens effect alone. Change in RNFL thickness measurements with contact lens of different diopters were analyzed by repeated measure analysis of covariance (RMANOVA). Mean average and quadrant RNFL thicknesses with and without plano contact lens were compared by paired t-test.Results: In average RNFL and quadrant map, RNFL thicknesses significantly increased with scans with soft contact lens of higher plus diopters while decreased with soft contact lens of more minus diopters (RMANOVA, all, p < 0.05). Measurement of peripapillary RNFL thicknesses was not different between scans performed with and without wearing plano contact lens.Conclusions: In Cirrus OCT scan, peripapillary RNFL thickness measurement is affected by refractive power of soft contact lens. It is recommended that special attention should be given when measuring RNFL thickness using OCT in patients with soft contact lens or longitudinal follow up of the patient who previous had surgery that changed refractive power of the patient (i.e. LASIK, cataract surgery, etc). CR: E. Lee, None; N. Kim, None; C. Kim, None; S. Byeon, None; S. Kim, None; S. Hong, None; G. Seong, None. Support: None
224 - A492 Ability of CirrusTM HD-OCT Optic Disc Measurements to Discriminate Between Normal and Glaucomatous Eyes
J.-C. Mwanza1, J.D. Oakley2, D.R. Anderson1, D.L. Budenz1. 1Ophthalmology, Bascom Palmer Eye Institute, Miami, FL; 2Carl Zeiss Meditec, Inc., Dublin, CA.
Purpose: To determine the ability of measurements of optic disc parameters with Cirrus HD-OCT to discriminate between normal and glaucomatous eyes.Methods: Seventy-three glaucomatous patients and 146 age-matched normal subjects were included in the study. For each participant, one randomly selected eye was scanned using the Optic Disc Cube 200x200 protocol. The parameters that were measured were the disc area, rim area, cup-to-disc area ratio (CDR), vertical cup-to-disc ratio (VCDR), horizontal cup-to disc ratio (HCDR), vertical rim thickness (VRT), horizontal rim thickness (HRT), and cup volume. Measurements were automatically generated by a Carl Zeiss Meditec ONH analysis algorithm developed for Cirrus HD-OCT (version 5.0). Receiver operating characteristics (ROC) curves were used to describe the ability to discriminate between normal and glaucomatous eyes and between glaucoma subgroups. The diagnostic performance of each parameter was assessed by reporting the area under receiver operating characteristics (AUC).Results: VRT (AUC = 0.963), rim area (0.962), VCDR (0.951), CDR (0.930) and HRT (0.901) showed excellent ability to discriminate normal from glaucomatous eyes, regardless of disease stage. Except for disc area (0.60), all other parameters also had excellent ability to differentiate normal eyes from eyes with moderate to advanced glaucoma (range: 0.92-1.0). VRT (0.914) and rim area (0.912) showed the highest ability to discriminate healthy eyes from eyes with early glaucoma, followed by VCDR, CDR, HRT, cup volume, and HCDR (range: 0.821-0.89). VCDR (0.801) outperformed other parameters for separating eyes with early glaucoma and those with moderate glaucoma. None of the parameters showed a good ability to differentiate moderate from advanced glaucoma (range: 0.497-0.686). The AUCs of all parameters, except for disc area, decreased gradually from discriminating between normal eyes and eyes with moderate to severe glaucoma, normal eyes and all glaucomatous eyes, discriminating between normal from eyes with mild glaucoma, eyes with mild from eyes with moderate glaucoma and eyes with moderate glaucoma from those with severe glaucoma.Conclusions: Optic disc parameters measured with Cirrus HD-OCT showed good to excellent ability to discriminate between normal and glaucomatous eyes irrespective of disease stage, normal from moderate to severe glaucoma, and normal from early glaucoma. CR: J.-C. Mwanza, Carl Zeiss Meditec, F; J.D. Oakley, Carl Zeiss Meditec, E; D.R. Anderson, Carl Zeiss Meditec, F; D.L. Budenz, Carl Zeiss Meditec, F. Support: NIH Grant P30 EY014801; Research to Prevent Blindness; Unrestricted Grant from Carl Zeiss Meditec, Inc.
225 - A493 Logistic Regression Analysis for Glaucoma Diagnosis Using Spectral Domain Optical Coherence Tomography
A. Ferreras1,2, A.B. Pajarin3, L.E. Pablo1,2, P. Calvo1, B. Monsalve4, P. Fogagnolo5, M. Figus6. 1Ophthalmology, Miguel Servet University Hospital, Zaragoza, Spain; 2Instituto Aragones de Ciencias de la Salud, Zaragoza, Spain; 3Family Medicine, Centro de Salud Universitas, Zaragoza, Spain; 4Ophthalmology, Hospital General Universitario Gregorio Marañon, Madrid, Spain; 5Fondazione GB Bietti-IRCCS, Canegrate Milan, Italy; 6Ophthalmology, Department of Neuroscience, University of Pisa, Pisa, Italy.
Purpose: To design and evaluate the diagnostic ability of a linear discriminant function (LDF) based on the peripapillary retinal nerve fiber layer (RNFL) thickness obtained using spectral domain optical coherence tomography (OCT) for discriminating between healthy eyes and eyes with glaucomatous visual field loss.Methods: Eighty-eight healthy subjects and 65 patients with open-angle glaucoma were consecutive and prospectively selected. All of them underwent imaging with the Optic Disc Cube 200 x 200 scan protocol of Cirrus HD OCT (Carl Zeiss Meditec, Dublin, Ca). Only one eye was randomly chosen. Left eye data were converted to a right eye format. The LDF was calculated according to the stepwise logistic regression results of the mean RNFL thickness at the 12 clock-hour positions and in the four quadrants. The receiver operating characteristic (ROC) curves were plotted for the parameters included in the software of the OCT, and compared with the LDF. Differences between the areas under the ROC curves were tested using the Hanley-McNeil method.Results: The obtained learning classifier was: LDF = 16.267 - (0.082 x inferior quadrant) - (0.068 x superior quadrant). The areas under the ROC curve were 0.954 for the LDF, 0.938 for the inferior quadrant thickness, and 0.931 for the average thickness. There were no significant differences between these values.Conclusions: Compared with the OCT-provided parameters, the LDF had the highest sensitivity at 95% fixed specificity to discriminate between normal and glaucomatous eyes. Learning classifiers may help to increase diagnostic ability of OCT. CR: A. Ferreras, None; A.B. Pajarin, None; L.E. Pablo, None; P. Calvo, None; B. Monsalve, None; P. Fogagnolo, None; M. Figus, None. Support: Supported in part by the Instituto de Salud Carlos III grant PI080976
226 - A494 Retinal Ganglion Cells and Ganglion-Cell-Layer Imaging in Thy 1-CFP Mice by HRA and Speckle-Noise-Reduced Spectral-Domain Optical Coherence Tomography
N. Nakano1A, H.O. Ikeda1B, M. Hangai1B, N. Yoshimura1B. AOphthalmology and Visual sciences, BOphthalmology and Visual Sciences, 1Kyoto University, Kyoto, Japan.
Purpose: To visualize and assess changes in the retinal ganglion cells (RGCs) and ganglion cell layer (GCL) of eyes with acute retinal ganglion cell damage in Thy 1-CFP mice by using a custom-made system combining eye-tracking function (Heidelberg Engineering) with HRA (445 nm, 448 nm) and speckle-noise-reduced spectral-domain optical coherence tomography (SD-OCT).Methods: N-methyl-D-aspartate (NMDA) (20 nmol/2 µl) was injected into the vitreous of the eye in Thy 1-CFP mice (n = 4). HRA and OCT examinations were performed simultaneously 4 and 7 days after the injection. The same volume of phosphate-buffered saline (PBS) was injected intravitreally into animals of different groups. RGCs were visualized by scanning with 445-nm laser diodes. The number of RGCs was counted within 6 squares of area 100 × 100 µm at a distance of approximately 200 µm from the optic nerve head and the results were averaged. Visualization of GCL and RNFL on SD-OCT scans was enhanced by reducing speckle noise, which was done by averaging 50 B-scans at each identical location of interest. In SD-OCT, 12 radial scans through the optic disc and circle scans around the optic disc were acquired, and the ganglion cell layer complex (GCC: RNFL+GCL+IPL) thickness was manually measured. The number of RGCs and the thickness of the GCC were compared between groups.Results: Before NMDA injection, the mean number of RGCs was 39.8 (2.0) µm and the mean GCC thickness was 69.0 (3.2) µm. Four and seven days after the NMDA injection, the mean number of RGCs dramatically decreased to 8.7 (1.4) and 7.3 (1.5), respectively, but the mean GCC thickness gradually decreased to 54.8 (2.2) µm and 47.5 (3.8) µm, respectively.Conclusions: Simultaneous visualization and follow-up of damage in the RGCs and GCL were possible with HRA and speckle-noise-reduced SD-OCT with an eye-tracking system. CR: N. Nakano, None; H.O. Ikeda, None; M. Hangai, TOPCON,NIDEK, C; N. Yoshimura, TOPCON,NIDEK, C. Support: Grant-in-Aid for Scientific Research (20592038) from the Japan Society for the Promotion of Science (JSPS)
223-226

Copyright 2010 by the Association for Research in Vision and Ophthalmology, Inc., all rights reserved.For permission to reproduce any abstract, contact the ARVO Office at [email protected]. Commercial Relationships are noted at the end of each abstract by “None” or with codes.
Sunday, May 2, 8:30 AM - 10:15 AM Hall B/C Poster Session Program Number/Board # Range: 211 - 261 / A479 - A529 110. Retinal Imaging in Glaucoma Organizing Section: GL
230 - A498 Spectralis SD-OCT and Cirrus SD-OCT: RNFL Thickness Measurement Agreement and Diagnostic Performance in Glaucoma
L. Beltran-Agullo, M. Roca-Obis, E. Ayala-Fuentes, A. Morilla-Grasa, A. Antón-López. Ophthalmology, Institut Catala de la Retina, Barcelona, Spain.
Purpose: To evaluate the agreement between retinal nerve fiber layer thickness (RNFL) measurements and diagnostic ability for glaucoma detection of two different spectral domain optical coherence tomography (SD-OCT) devices in normal and glaucomatous eyes.Methods: Cross-sectional study with prospective sampling. One eye of 16 healthy subjects, 14 glaucoma suspects and 15 glaucoma patients have been enrolled. Participants were scanned in 2 sessions (within 3 months) by trained operators using the Cirrus SD-OCT (Carl Zeiss Meditec, Dublin, CA) and Spectralis SD-OCT (Heidelberg Engineering, Heidelberg, Germany). The RNFL thickness was measured with Cirrus 200x200 Optic Disc Cube mode and Spectralis RNFL algorithm. Global and sectoral RNFL thickness were compared using paired t tests. Pearson correlation analysis and Bland-Altman plots of RNFL measurements and Kappa coefficient of normative classification were used to evaluate the agreement between the 2 OCT devices.The sensitivity and specificity of both OCTs were also calculated.Results: Mean age was 57.78±10,49 years, 58.22±9.31 years and 60.29±24.24 years for the healthy, glaucoma suspects and glaucoma subjects respectively (p=0.90). The RNFL thickness measured by Spectralis OCT was significantly greater than that measured by Cirrus OCT (healthy and suspects, p<0.001; glaucoma, p=0.033). For Cirrus OCT, the average RNFL thickness was 94.31±7.59µm, 87.29±9.49µm and 69.87±9.89µm for the healthy, suspect and glaucoma groups respectively. For Spectralis OCT, the corresponding measurements were 102.60±9.63µm, 92.43±10.68µm and 73.31±10.91µm. Average RNFL thickness measured by Spectralis OCT and Cirrus OCT was highly correlated (r=0.95; p<0.001). There was good agreement between the normative classification of the 2 devices (k=0.60; p<0.001). Spectralis OCT demonstrated higher specificity (93.8% vs. 72.7%) than Cirrus OCT but lower sensitivity (93.3% vs 100%).Conclusions: Preliminary results suggest there are significant differences in RNFL thickness between Spectralis OCT and Cirrus OCT despite a good correlation of RNFL thickness measurements. Spectralis OCT offers a high sensitivity and specificity. CR: L. Beltran-Agullo, None; M. Roca-Obis, None; E. Ayala-Fuentes, None; A. Morilla-Grasa, None; A. Antón-López, Carl Zeiss, C. Support: None
229 - A497 Comparison of Nerve Fiber Layer Thickness in the Japanese Population Using the OCT 3000
H. Yamada1, E. Yamada2, K. Maekawa2, C. Nakanishi2, N. Yanagihara2, H. Yamada2. 1Ophthalmology, Kansai Medical University, Hirakata, Japan; 2Ophthalmology, Yamada Eye Clinic, Sakai, Japan.
Purpose Neuro fiber layer thickness (NFLT) is an important factor in evaluating the progression of glaucoma. However, normalized NFLT data for the Japanese population are not available. In this study, we surveyed the NFLT from non-glaucomatous (NG) and glaucomatous patients in order to clarify the characteristics of NFLT among the Japanese population.Material and Methods We retrospectively reviewed the clinical records of patients who received OCT 3000 Fast NFL measurements in the Yamada Eye Clinic from Jan 2006 to Dec 2008. The patients had primary open angle glaucoma (POAG), normal tension glaucoma (NTG), primary angle closure (PAC), and no glaucoma. Patients with ocular diseases which may affect NFLT (including high myopia and retinal degeneration) were excluded. We only included data which measured > 5 signal intensity and represented an accurate scanning shape. Statistical analysis included all the data (circular 256 points/eye) in each of the groups obtained using repeated measures ANOVA and Fisher’s PLSD were used as post hoc tests. To simplify the analysis, 8 points (temporal (T), temporal upper (TU), upper (U), nasal upper (NU), nasal (N), nasal lower (NL), lower (L), temporal lower (TL)) were selected.Results The data for a total of 1202 NG eyes (745 patients), 85 NTG eyes (43 patients), 69 POAG eyes (53 patients), and 52 PAC eyes (34 patients) were retrieved. The demographics of the groups were as follows: (average age, age range), NG (55, 3-93), NTG (63, 34-84), POAG (63, 32-82), and PAC (67, 56-78). The NFLT of NTG and POAG eyes was statistically smaller than that of NG eyes (p<0.01) in all selected points except T. The NFLT of PAC eyes was smaller than that of NG in T, TU, and TL (p<0.03), but larger in U, NU, N, and L (pP<0.03). The NFLT of PAC eyes was larger than that of NTG and POAG eyes in most points (p<0.01) except T, TU, and TL.Conclusion The NFLT of NTG and POAG eyes was generally smaller than that of NG and PAC eyes. This suggests that OCT is helpful in detecting NFL thinning in major glaucoma patients in a less invasive manner. The pattern of NFLT differed even in NG and PAC eyes and showed that PAC characteristics is differ not only in axial length, but also in NFLT. CR: H. Yamada, None; E. Yamada, None; K. Maekawa, None; C. Nakanishi, None; N. Yanagihara, None; H. Yamada, None. Support: None
228 - A496 Reproducibility of Nerve Fiber Layer Thickness Measurements in Patients With Glaucoma and Healthy Controls Using Spectral OCT
M.N. Menke1,2, M. Toeteberg-Harms2, P.B. Knecht2,3, V. Sturm2, J. Funk2. 1Department of Ophthalmology, University of Bern, Bern, Switzerland; 2Department of Ophthalmology, University of Zurich, Zurich, Switzerland; 3Department of Ophthalmology, Kantonsspital Luzern, Luzern, Switzerland.
Purpose: To assess the reproducibility of Spectral-Domain-OCT (SD-OCT) retinal nerve fiber layer thickness (RNFL) thickness measurements in healthy volunteers and patients with glaucoma and to compare these results to conventional Time-Domain-OCT (TD-OCT).Methods: Fifty eyes of 25 healthy controls and 22 eyes of 11 patients with primary open angle glaucoma (POWG) were included. SD-OCT and TD-OCT circle scans were centered on the optic disc. In each eye OCT scans were performed 3 times by 2 independent observers. RNFL thickness was measured in 4 quadrants around the optic disc. In addition, the overall mean RNFL thickness was assessed. Intraclass correlation coefficients (ICC) and coefficients of variation (COV) were calculated. Inter-observer and inter-OCT reproducibility was visualized by using Bland-Altman analysis.Results: Intra-observer reproducibility for TD- OCT was good with an ICCmean RNFL
thickness of 0.939 in controls and 0.98 in glaucomatous eyes. For SD-OCT, intra-observer reproducibility was higher with an ICC of 0.989 for controls and 0.997 for glaucomatous eyes. COVs for TD-OCT ranged from 2.9% to 7.7% in controls and from 6.0% to 13.3% in glaucoma patients. COVs for SD-OCT ranged from 0.3% to 1% in controls and from 0.9% to 2.3% in glaucomatous eyes. COVs were influenced by various factors. In the glaucoma group COVs were significantly higher (p<0.0001) compared to controls. COVs increased by a mean of 5.1% when TD-OCT was used instead of SD-OCT (p<0.0001). In controls, TD-OCT showed a significant tendency to measure higher RNFL values in the inferior quadrant compared to SD-OCT (mean difference + 4.7 µm, p<0.0001). In the glaucoma group, SD-OCT showed a significant tendency to measure higher RNFL values in mean RNFL thickness, and the superior (mean difference +8.2 µm, p<0.0001), temporal (mean difference +7 µm, p<0.0001), and inferior quadrant (mean difference +3.5 µm, p=0.017) compared to TD-OCT.Conclusions: SD-OCT RNFL thickness measurements in healthy volunteers and glaucoma patients showed good intra- and inter-observer reproducibility. Especially in glaucomatous eyes, reproducibility was superior to TD-OCT. CR: M.N. Menke, None; M. Toeteberg-Harms, None; P.B. Knecht, None; V. Sturm, None; J. Funk, None. Support: None
227-230
227 - A495 Sensitivity and Specificity of Machine Learning Classifiers and Spectral Domain OCT for the Diagnosis of Glaucoma
V.P. Costa1, V.G. Vidotti1, G.M. Resende1, F.R. Silva1, F. Cremasco1, M. Dias2, E. Gomi2. 1Ophthalmology, University of Campinas, Sao Paulo, Brazil; 2Engineering, University of São Paulo, Sao Paulo, Brazil.
Purpose: To investigate the sensitivity and specificity of machine learning classifiers and Spectral Domain OCT (SD-OCT) for the diagnosis of glaucoma.Methods: Sixty six glaucoma patients (POAG) and 43 healthy individuals were recruited at the Glaucoma Service of the University of Campinas, Brazil. Inclusion criteria for glaucoma patients were: POAG, IOP > 21mmHg, best-corrected visual acuity of 20/40 or better, spherical equivalent within 5.0 D, ≥ 40 years of age, 2 consecutive abnormal and reliable visual fields. Inclusion criteria for healthy individuals were : IOP < 21 mmHg, best-corrected visual acuity of 20/40 or better, spherical equivalent within 5.0 D, ≥ 40 years of age, 2 consecutive and reliable normal visual fields, open angle on gonioscopy. All patients underwent a complete ophthalmologic examination, achromatic standard automated perimetry (SAP Humphrey 24-2 SITA, Carl Zeiss Meditec, Inc, Dublin, California) and RNFL imaging with SD-OCT (Cirrus HD-OCT; Carl Zeiss Meditec Inc., Dublin, California). SD-OCT images were obtained with undilated pupils by the same observer (VGV), who was masked for the diagnosis. ROC curves were obtained for all SD-OCT parameters. Subsequently, the following machine learning classifiers were tested: BAG (Bagging), NB (Naive-Bayes), MLP (Multiple Layer Program), and CTR (Decision Trees) algorithms. Areas under the ROC curves (aROCs) obtained for each parameter and each machine learning classifier were compared.Results: The mean age was 48.5 ± 9.1 years for healthy individuals and 61.1 ± 10.3 years for glaucoma patients (p<0.001). There was no significant difference between the control and glaucoma groups regarding intraocular pressure (IOP) (13.6 ± 2.8 mmHg and 13.8 ± 2.7 mmHg, respectively) (p=0.42), but glaucoma patients were using a mean number of 2.2 ± 1.1 medications to lower IOP. MD values were -6.2 ± 6.1 dB for glaucoma patients and -1.5 ± 1.5 dB for healthy individuals (p<0.001). SD-OCT parameters with the greater aROCs were: average thickness (0.810 - CI 0.717-0.883), inferior quadrant (0.801- CI 0.708-0.876), 7 o clock position (0.815 - CI 0.723-0,887) and 11 o clock position (0.852 - CI 0.765-0.916). aROCs with machine learning classifiers varied from 0.585 (CTR) to 0.829 (BAG). aROC obtained with BAG was not significantly different from the aROC obtained with the best SD-OCT parameter (p= 0.61).Conclusions: : In this series, machine learning classifiers did not improve the sensitivity and specificity of SD-OCT for the diagnosis of glaucoma. CR: V.P. Costa, None; V.G. Vidotti, None; G.M. Resende, None; F.R. Silva, None; F. Cremasco, None; M. Dias, None; E. Gomi, None. Support: FAPESP 07/51281-9
Copyright 2010 by the Association for Research in Vision and Ophthalmology, Inc., all rights reserved.For permission to reproduce any abstract, contact the ARVO Office at [email protected]. Commercial Relationships are noted at the end of each abstract by “None” or with codes.
Sunday, May 2, 8:30 AM - 10:15 AM Hall B/C Poster Session Program Number/Board # Range: 211 - 261 / A479 - A529 110. Retinal Imaging in Glaucoma Organizing Section: GL
Monday, May 4, 8:30 AM - 10:15 AM Hall B/C Poster Session Program Number/Board # Range: 1382 - 1406 / B121 - B145 219. Functional Retinal Imaging Organizing Section: MOI
234 - A502 Comparison of Influence of Cataract and Small Pupil on Retinal Nerve Fiber Layer Thickness Measurements Between Time Domain and Spectral Domain Optical Coherence Tomography
C. Cheng, L.W. Yip, M.G. Natividad, V. Yong, B. Lim, H. Wong. Ophthalmology, Tan Tock Seng Hospital, Singapore, Singapore.
Purpose: To investigate the effect of cataract and small pupil on retinal nerve fiber layer (RNFL) thickness measurements using spectral domain optical coherence tomography (SD-OCT) and compare the measurements with time domain optical coherence tomography (TD-OCT).Methods: 25 eyes from 25 normal subjects undergoing cataract surgery were analysed. RNFL thickness was measured three times before and after dilation in a single sitting, pre-operatively and one-month after surgery, using TD-OCT (Stratus Fast RNFL 3.4 acquisition protocol) and SD-OCT (Cirrus 200x200 Optic Disc Scan).Results: Mean RNFL thickness measured by TD-OCT was thicker compared to SD-OCT and the difference was significant (p<0.001). Pupil dilatation caused RNFL measurements to increase in both modalities but the mean differences were not significant (p>0.05). Removal of cataract caused significant increase in RNFL measurements in both modalities (p< 0.02). Reproducibility for both machines showed marked improvement with pupil dilatation and further improvement after removal of cataract. The intraclass correlation coefficient (ICC) at 95% confidence interval (CI) for pre-operative undilated, dilated, and post-operative dilated global measurements were 0.69, 0.87, and 0.95 for TD-OCT, and 0.74, 0.90, 0.91 for SD-OCT respectively. This pattern was reflected in the quadrants except in the nasal quadrant for TD-OCT, which remained poor (< 0.75).Conclusions: Cataracts, not pupil size, appear to have significant influence on RNFL measurement in both modalities. The effect on each modality does not seem to be different except in the nasal quadrant. Reproducibility of both modalities is good with dilated pupil and clear media but in the presence of cataract and small pupil, reproducibility is better with the SD-OCT. RNFL thickness measurements are generally higher in TD-OCT than with SD-OCT and cannot be directly compared. CR: C. Cheng, None; L.W. Yip, None; M.G. Natividad, None; V. Yong, None; B. Lim, None; H. Wong, None. Support: None
233 - A501 Evaluation of OCT GPA in Eyes With Stable and Progressive Glaucomatous Eyes
T.-W. Kim1, E. Lee2, M. Kim3, K. Park4, D. Kim4. 1Ophthalmology, Seoul National University Bundang Hospital, Seoul National University College of Medicine, Seongnam, Republic of Korea; 2Ophthalmology, Seoul National University Bundang Hospital, Seongnam, Republic of Korea; 3Ophthalmology, Kong Eye Center, Seoul, Republic of Korea; 4Ophthalmology, Seoul National University College of Medicine, Seoul, Republic of Korea.
Purpose: To evaluate optical coherence tomography (OCT) retinal nerve fiber layer (RNFL) thickness measurement for glaucoma progression analysis (GPA) in eyes with stable and progressive glaucomatous eyes.Methods: Eighty two eyes from 82 glaucoma patients with localized RNFL defect who were followed up at least 36 months and had received at least 4 red-free photography and Stratus OCT were included. Patients were divided into 3 groups based on the serial red-free photography findings; stable glaucoma group (group 1), patients who showed episodic progression (group 2), and patients who showed continuous progression (group 3). The rate of deterioration for global average, quadrant and clock hour RNFL thicknesses was compared between the groups.Results: Group 3 showed significantly faster rate of OCT RNFL thickness deterioration than group 1 for the clock hour sectors (-4.27 microm/year vs -1.31 microm/year, P=0.004) and quadrants (-2.73 microm/year vs -0.92 microm/year, P=0.019) where progressive change was defined by red-free photography. For global average thickness, the rate of deterioration was not significantly different between groups.Conclusions: OCT GPA appears to be useful to detect progressive RNFL loss in eyes with glaucoma. CR: T.-W. Kim, None; E. Lee, None; M. Kim, None; K. Park, None; D. Kim, None. Support: Seoul National University Bundang Hospital Research Fund
232 - A500 Comparison of Macular Retinal Ganglion Cell Plus Inner Plexiform Layer Measurement of 16 Sectors Surrounding the Fovea Obtained With HR-OCT in Healthy Subjects and Glaucoma Patients
H. Resch1, C. Resch-Wolfslehner1, B. Brela1, U. Schmidt-Erfurth1, R. Schubert2, C. Vass1. 1Ophthalmology and Optometry, Medical University of Vienna, Vienna, Austria; 2Institute for Biomedical Image Analysis (IBIA), University for Health Sciences, Medical Informatics and Technology (UMIT), Eduard-Wallnöfer-Zentrum 1, A-6060 Hall, Austria.
Purpose: Fast scanning high resolution optical coherence tomography (HR-OCT) enables quantitative analysis of histological retinal layers. Aim of the present study was to measure maximum macular thickness of retinal ganglion cell plus inner plexiform layers (RGIPL) in healthy subjects and glaucoma patients in order to assess the diagnostic value.Methods: Macular HR-OCT scans (Cirrus, Carl Zeiss Meditec) were obtained in 68 subjects (44 healthy subjects and 24 glaucoma patients) using raster scanning of a 20x20 field at a resolution of 512x128x1024 voxels. The scans were analysed using a software algorithm for automated segmentation and quantification in retinal layers. The macular area scans were dissected into one central area and 4 concentric rings with an incremental radius of 500 µm and further subdivided into 16 sectors each. For each of the 16 axis orientations in respect to the fovea the concentric ring segment with the maximum thickness of the RGIPL (RGIPLmax) has been determined. For each axis orientation RGIPLmax has been compared between age-matched healthy subjects (mean 54.1 ± 13.1 years) and glaucoma patients (60.5 ± 13.0 years) using ANOVA and ROC.Results: The MD was 0.0 ± 1.3 in healthy subjects and -7.1 ± 6.6 for glaucoma patients. For all 16 sectors around the fovea the RGIPLmax was statistically significantly thinner in glaucoma patients compared to healthy volunteers. (p < 0.001). Furthermore we calculated the ROC-Area and could show that the separation effect had its peak temporal of the fovea, at sector 1 and 16, which are above and below the temporal raphe of the retinal nerve fiber layer. ROC area was 0.902 for mRGIPL, 0.900 for the sector 1 and 0.964 for sector 16. The ROC areas for the other sectors around the fovea indicated also fair to good diagnostic separation but in a slightly less distinctive manner (minimum ROC 0.778).Conclusions: We were able to demonstrate significant differences between glaucoma patients and healthy volunteers for the RGIPLmax of the macula. More importantly, we present high ROC values for these parameters indicating a good diagnostic separation. This type of analysis is a promising approach for the use of RGIPL thickness data provided by automatic segmentation of the macular retinal layers and might offer an additional tool for diagnosis of glaucoma. CR: H. Resch, None; C. Resch-Wolfslehner, None; B. Brela, None; U. Schmidt-Erfurth, None; R. Schubert, None; C. Vass, None. Support: None
231 - A499 Reproducibility of Peripapillary Retinal Nerve Fiber Thickness Measurement With Spectral Domain OCT(Spectralis) in Glaucomatous Eyes
M. Kim1,2, G. An1, K. Park2,3, D. Kim2,3, T.-W. Kim2,4. 1Ophthalmology, Kong Eye Clinic, Seoul, Republic of Korea; 2Ophthalmology, Seoul National University College of Medicine, Seoul, Republic of Korea; 3Ophthalmology, Seoul National University Hospital, Seoul, Republic of Korea; 4Ophthalmology, Seoul National University Bundang Hospital, Seongnam-si, Gyeonggi-do,, Republic of Korea.
Purpose: To determine the reproducibility of Spectralis optical coherence tomography (OCT) peripapillary retinal nerve fiber layer (RNFL) measurements in eyes with the spectrum of glaucomatous visual field loss.Methods: One eye from 63 stable glaucoma patients with a range of severity was imaged with spectral domain OCT (Spectralis; Heidelberg Engineering, Heidelberg, Germany) 6 times on 2 separate visits within 1 week (3 times on each visit) to determine intravisit and intervisit variability. Patients were divided into 3 groups according to the visual field mean deviation (MD) value; early (MD >-6, n=25), moderate (-12<MD≤-6, n=19) and advanced (MD≤-12, n=19) glaucoma groups. Intraclass correlation coefficient (ICC), coefficient of variation (CV) and test-retest variability was determined and compared between the groups.Results: The ICC for average RNFL measurement were 0.99, 0.97 and 0.99 in early, moderate and advanced glaucoma groups and the CV ranged from 1.4 to 4.0 %. For average RNFL thickness, the intravisit test-retest variabilities were 2.51 [confidence interval (CI), 1.96-3.49], 3.43 (CI, 2.59-5.07) and 4.04 (CI, 3.05-5.97) µm and the intervisit variabilities were 2.63 (CI, 2.05-3.66), 4.87 (CI, 3.68-7.20) and 4.16 (CI, 3.14-6.15) µm in early, moderate and advanced glaucoma groups, respectively.Conclusions: The reproducibility of spectralis OCT for RNFL thickness is excellent in all glaucomatous eyes with different severity of visual field loss. CR: M. Kim, None; G. An, None; K. Park, None; D. Kim, None; T.-W. Kim, None. Support: None
231-234

Copyright 2010 by the Association for Research in Vision and Ophthalmology, Inc., all rights reserved.For permission to reproduce any abstract, contact the ARVO Office at [email protected]. Commercial Relationships are noted at the end of each abstract by “None” or with codes.
Sunday, May 2, 8:30 AM - 10:15 AM Hall B/C Poster Session Program Number/Board # Range: 211 - 261 / A479 - A529 110. Retinal Imaging in Glaucoma Organizing Section: GL
238 - A506 Ganglion Cell Complex Analysis With Fourier-Domain OCT: Reproducibility and Diagnostic Accuracy in Glaucoma
M. Michelessi1, F. Oddone2, M. Centofanti2,1, L. Tanga2, S. Lotito1, G. Roberti1, L. Tranchina1, G. Manni1,2. 1University of Tor Vergata, Rome, Italy; 2G.B.Bietti Eye Foundation - IRCCS -, Rome, Italy.
Purpose: To evaluate the reproducibility of Ganglion Cell Complex(GCC)measurements with Fourier-Domain OCT and to determine the diagnostic accuracy of GCC analysis in distinguish between healthy and glaucomatous eyes.Methods: 60 eyes from 60 normal subjects and 63 eyes from 63 glaucoma patients attending our institute, were enrolled. All patients underwent a full eye examination, standard achromatic perimetry (SAP)and were imaged with Fourier-Domain OCT. Ganglion Cell Complex thickness was measured using the GCC scan protocol three times on the same days. SITA 24-2 visual field loss (PSD and MD p<5% and Glaucoma Hemifield Test outside normal limits) on two consecutive visual fields was used as reference test to define glaucoma patients. Reproducibility was assessed by Intraclasss Correlation Coefficient(ICC), Coefficient of Variation(COV) and test-retest variability. Area under receiving operating characteristics(AROC) curve were calculated for each GCC scan index, as measure of diagnostic accuracy. Sensitivity at 90% fixed specificity was also evaluated.Results: The ICC ranged from 0.977(FLV) to 0.991(GLV). Average GCC thickness, Superior GGC thickness and Inferior GCC thickness showed a COV of 1.8%, 2.0% and 1.9% respectively. Test retest variability ranged from 4.4 to 4.9 µm. The area under the ROC curve for FLV%, GLV%, Average GCC thickness, Superior GGC thickness and Inferior GCC thickness were 0.874, 0.850, 0.855, 0.844, 0.858 respectively. At a fixed specificity of 90%, FLV%(a pattern parameter) had the highest sensitivity (72.2%, cut-off point: 1.666)Conclusions: Macular Ganglion Cell Complex analysis provided by Fourier Domain OCT showed a good reproducibility for each of his index and a good diagnostic performance in the diagnosis of glaucoma. FLV% pattern parameter was the best discriminating parameter. CR: M. Michelessi, None; F. Oddone, None; M. Centofanti, None; L. Tanga, None; S. Lotito, None; G. Roberti, None; L. Tranchina, None; G. Manni, None. Support: None
237 - A505 Comparing the Ganglion Cell Complex and Retinal Nerve Fiber Layer Measurements by Fourier Domain Optical Coherence Tomography to Detect Glaucoma in High Myopia
J. Kim1, N. Kim1, E. Lee1, S. Kim1, S. Byeon1, G. Seong1, S. Kang2, S. Hong1, C. Kim1. 1Ophthalmology, Yonsei University, Seoul, Republic of Korea; 2Ophthalmology, Asan Medical Center, Seoul, Republic of Korea.
Purpose: To compare the diagnostic ability to detect glaucomatous changes between the macular ganglion cell complex (GCC) and peripapillary retinal nerve fiber layer (RNFL) thickness in highly myopic patients using Fourier-Domain optical coherence tomography (OCT).Methods: Participants, consecutively enrolled from January 2009 to June 2009, underwent Stratus OCT (fast RNFL scan, Carl Zeiss Meditec, Dublin, CA) and RTVue OCT (ONH scan and GCC scan, Optovue Inc, Fremont, CA) during the same visit. Axial length was measured using partial laser interferometry, and noncycloplegic refraction was measured using an autorefractor and then further refined subjectively. The relationship between demographic variables and OCT parameters was evaluated using multiple linear regression analysis in normal controls. Area under the receiver operator characteristic (AUROC) curves were generated to assess the ability of each parameter to detect glaucomatous changes.Results: Seventy-three normal controls and 77 glaucoma patients were included. Participants were categorized as 105 non-high myopes (Spherical equivalent [SE] >-6.0 diopters) and 45 high myopes (SE ≤ -6.0 diopters). The GCC thickness showed a strong correlation with RNFL thickness using both Stratus and RTVue OCT (correlation coefficient = 0.741 and 0.763, p < 0.001 and p < 0.001, respectively) in all participants. The axial length showed a significant relationship with average RNFL thickness using both Stratus and RTVue OCT (p = 0.050 and 0.040, respectively), but was not associated with the average GCC thickness (p = 0.836). Although the difference did not reach statistical significance, the ability to detect glaucomatous changes in the highly myopic group by examining the average GCC thickness (AUROC, GCC; 0.933) was higher than when examining RNFL thickness from either type of OCT (AUROC, Stratus RNFL; 0.857, RTVue RNFL; 0.857).Conclusions: The ability to diagnose glaucoma with macular GCC thickness was comparable to that with peripapillary RNFL thickness in high-myopia patients. As macular GCC thickness is less affected by axial length than peripapillary RNFL thickness, macular GCC thickness measurements may be a good alternative or a complimentary measurement to RNFL thickness assessment in the clinical evaluation of glaucoma in patients with high myopia. CR: J. Kim, None; N. Kim, None; E. Lee, None; S. Kim, None; S. Byeon, None; G. Seong, None; S. Kang, None; S. Hong, None; C. Kim, None. Support: None
236 - A504 Is There a Correlation Between Cirrus OCT RNFL and the Frequency of an APD on Clinical Examination
J. Cotliar, A. Shrivastava. Ophthalmology, Montefiore Medical Center, Bronx, NY.
Purpose: To determine at what degree of asymmetry in retinal nerve fiber layer thickness (RNFL), by Cirrus OCT, would one expect to detect a relative afferent pupillary defect (RAPD) in glaucoma or glaucoma suspect patients.Methods: This is a retrospective study of 69 patients carrying the diagnosis of glaucoma (both primary and secondary), or glaucoma suspect (glaucomatous cupping or ocular hypertensive), in a tertiary referral glaucoma practice in the Bronx, NY, examined between the dates of 08/2009 to 11/2009. Each patient was examined by standard techniques by one attending physician, including pupil exam in dim light, slit lamp examination, and dilated fundoscopic examination. The presence or absence of an RAPD was noted for each patient. Neutral density filter examination and gradation of RAPDs was not performed. Cirrus OCT RNFL analysis was ordered for all patients included in the study based upon suspicion or confirmation of a glaucomatous process. A chart review was performed on patients meeting the above criterion, and subjects were divided into two groups based upon the presence or absence of an RAPD. Subjects with OCT signal strength less than 6/10 in either eye were excluded from the study. Data recorded included patient demographic information, signal strength, average thickness of RNFL, quadrant and extent of RNFL thinning if any, presence or absence of RAPD. To determine the degree of asymmetry of retinal nerve fiber layer thickness, the “% difference” was calculated by comparing the difference in thickness between the two eyes, divided by the thickness of the larger value. Statistical analysis was performed to determine the degree of asymmetry which would predict the clinical detection of an RAPD.Results : Of the original 69 patients who met inclusion criteria, 8 patients were excluded based upon poor signal strength. Of the 61 subjects remaining, 4 patients were noted to have an RAPD on initial examination. The mean “% difference” in the group without an RAPD was 5.305 and SD= 4.19. The mean “% difference” in the RAPD group was 30.60% (SD= 0.051). These groups were found to be statistically significant at a level of p< 0.01. The maximum “% difference” within the group without a clinically detectable RAPD was 20%. Within the RAPD group, the minimum “% difference” was noted to be 23.4%.Conclusions: This preliminary data suggests that an RAPD is generally not clincially apparent until there is a significant retinal nerve fiber layer thickness asymmetry of approximately 20% using our calculation of “% difference” from Cirrus OCT analysis. CR: J. Cotliar, None; A. Shrivastava, None. Support: None
235-238
235 - A503 The Effect of Signal Strength in the Measurement of Ganglion Cell Complex and Nerve Fiber Layer in Fourier-Domain Optical Coherence Tomography
X. Zhang1, O. Tan2, D. Huang3. 1Ophthalmology, Doheny Eye Institute/USC, Los Angeles, CA; 2Ophthalmology, Univ Southern CA & Doheny Eye Inst, Los Angeles, CA; 3Ophthalmology, University of Southern CA, Los Angeles, CA.
Purpose: The thickness of peripapillary retinal nerve fiber layer (NFL) and macular ganglion cell complex (GCC) is measured by Fourier domain optical coherence tomography (FD-OCT) for glaucoma diagnosis. The purpose of this study is to determine the effect of OCT signal strength on these measurementsMethods: The study analyzed data from participants enrolled at the Doheny site of the longitudinal Advanced Imaging for Glaucoma Study (www.AIGStudy.net). An FD-OCT system (RTVue) was used to map GCC and NFL thickness 3 times on each study visit. The overall average GCC or NFL thickness from each OCT scan was analyzed. Each measurement was associated with a signal strength index (SSI) on a scale from 0 to 100 (higher is better) generated automatically by the device. Signal levels are stratified into 20 bins by SSI intervals of 5. Within each visit, measurements of the same SSI bin were used to calculate the intravisit standard deviation (SD) for that SSI level. Repeatability from different visits and eyes were combined by pooled SD. Within each visit, thickness measurements with the largest SSI difference were selected and the thickness difference calculated. The effect of SSI on measured NFL and GCC thickness were then assessed using linear regression.Results: The analysis included 65 eyes (33 participants) from normal group; 47 eyes (36 participants) from glaucoma suspect or pre-perimetric glaucomatous (GSPPG) group; and 88 eyes (57 participants) from perimetric glaucoma (PG) group. Each eye was measured on 1 to 6 visits (average 3.2). Repeatability was generally better for images with higher SSI. For GCC, the repeatability is significantly better for data with SSI > 45 (SD 1.44 vs. 2.39 micron, p<0.01). For NFL, 35 appeared to be the best cutpoint but no significant difference in repeatability was observed. Measurements with SSI above the chosen cutpoints were then analyzed to assess the effect of SSI on NFL and GCC measurments. The effects were consistent among three groups. For GCC, each unit SSI increase increased measured thickness by 0.05 micron (p =0.043). For NFL, the slope was 0.11 per unit SSI.Conclusions: Adequate signal strength is important for accurate and repeatable FD-OCT measurements used in glaucoma diagnosis. For the RTVue instrument, we recommend SSI > 45 for GCC measurements and SSI > 35 for NFL measurements. To track glaucoma by detecting changes in GCC and NFL thickness over time, the effect of varying signal strength at different visit could be compensated using a regression model. CR: X. Zhang, None; O. Tan, Dr. Tan receives patent royalty and grant support from Optovue, Inc., F; D. Huang, Dr. Huang receives patent royalty, stock option, travel support and grant support from Optovue, Inc, F. Support: NIH R01 EY013516

Copyright 2010 by the Association for Research in Vision and Ophthalmology, Inc., all rights reserved.For permission to reproduce any abstract, contact the ARVO Office at [email protected]. Commercial Relationships are noted at the end of each abstract by “None” or with codes.
Sunday, May 2, 8:30 AM - 10:15 AM Hall B/C Poster Session Program Number/Board # Range: 211 - 261 / A479 - A529 110. Retinal Imaging in Glaucoma Organizing Section: GL
Monday, May 4, 8:30 AM - 10:15 AM Hall B/C Poster Session Program Number/Board # Range: 1382 - 1406 / B121 - B145 219. Functional Retinal Imaging Organizing Section: MOI
242 - A510 Reproducibility of Retinal Nerve Fiber Thickness Measurements Using Spectral-Domain Optical Coherence Tomography in Glaucoma Patients
B. Monsalve1, A. Ferreras2, A.B. Pajarin2, L.E. Pablo2, J.L. Urcelay1. 1Ophthalmology, Gregorio Marañon Univ Hospital, Madrid, Spain; 2Ophthalmology, Miguel Servet Univ Hospital, Zaragoza, Spain.
Purpose: To evaluate the reproducibility of retinal nerve fiber layer (RNFL) parameters acquired with optical coherence tomography (OCT) in eyes with perimetric glaucoma.Methods: Ninety-five consecutive glaucoma patients were prospectively selected. All of them had intraocular pressure higher than 21 mmHg and abnormal standard automated perimetry. Only one eye was randomly included in the study. Each eye was scanned with spectral domain OCT (Spectralis; Heidelberg Engineering, Heidelberg, Germany) three times on the same day. The same operator performed all scans with the same device, and all images were acquired using the Spectralis eye-tracking system. Intraclass correlation coefficient (ICC), coefficient of variation (COV), and test-retest variability were calculated for the peripapillary RNFL parameters.Results: Mean age was 62.4±7.1 years and mean deviation of standard automated perimetry was -5.0 ±5.7 dB. The ICC was higher than 0.94 for all parameters. The COV ranged from 2.5% (global RNFL) to 6.5% (temporal quadrant). Test-retest variability was lower than 10 µm for all variables. The global RNFL had the highest ICC (0.992) and the lowest test-retest variability (3.8 µm).Conclusions: The reproducibility of Spectralis OCT for peripapillary RNFL thickness was sufficiently good to be useful for improving early diagnosis and monitoring progression in glaucoma patients. CR: B. Monsalve, None; A. Ferreras, None; A.B. Pajarin, None; L.E. Pablo, None; J.L. Urcelay, None. Support: Supported in part by the Instituto de Salud Carlos III grant PI080976.
241 - A509 Influence of Typical Scan Score on Diagnostic Performance of Scanning Laser Polarimetry and Optical Coherence Tomography
L.M. Hoesl, R.P. Tornow, W.A. Schrems, F.K. Horn, C.Y. Mardin, F.E. Kruse, R. Laemmer. Department of Ophthalmology, University Eye Hospital Erlangen, Erlangen, Germany.
Purpose: To investigate the impact of typical scan score (TSS) on discriminating glaucoma patients and healthy controls.Methods: Fifty-five glaucoma patients and 40 healthy controls were recruited from the Erlangen Glaucoma Registry for this study. Standard static white on white perimetry, 24-h IOP profile, stereographic optic disc slides, scanning laser polarimetry GDx VCC (Carl Zeiss Meditec, Inc., Dublin, CA) and optical coherence tomography (Spectralis HRA+OCT, Heidelberg Engineering, Germany) were performed in all patients and controls. For the controls only scans with TSS=100 were accepted. The glaucoma patients were divided into three subgroups according to their TSS (TSS=100; 99 ≥ TSS ≥ 80, TSS < 80). Receiver operating characteristic (ROC) curves were constructed for mean RNFL values, sector data and for the NFI. Sensitivity was estimated at ≥ 90% and ≥ 80% of specificity to compare the discriminating ability of each imaging modality.Results: For discrimination between healthy and glaucomatous eyes in GDx VCC the NFI demonstrated the largest area under the ROC curve (AUROC ± SE, Sensitivity at 90% Specificity; 0.996 ± 0.005;100%) for very typical scans (TSS of scans of both normals and perimetric glaucomas were TSS=100), followed by the inferotemporal sector (0.993 ± 0.007;100%) and the TSNIT average (0.985 ± 0.012;95%). In Spectralis-OCT the nasosuperior, inferotemporal sector, superior quarter showed the largest AUROC (1.000 ± 0.000;100%) followed by the TSNIT average (0.996 ± 0.005,100%). For atypical scans (TSS of glaucomatous scans were TSS < 80), in GDx VCC the NFI demonstrated the largest AUROC (0.954 ± 0.024;85%) followed by the supernasal sector (0.880 ± 0.050;65%) and the TSNIT average (0.645 ± 0.084;40%). In Spectralis-OCT the TSNIT average showed the largest AUROC (0.965 ± 0.033;95%) followed by the inferotemporal sector (0.955 ± 0.032,85%).Conclusions: Low TSS is associated with a decrease in diagnostic accuracy for discriminating healthy and glaucomatous eyes in both GDx VCC and much less in Spectralis-OCT. Diagnostic accuracy of Spectralis-OCT was superior to GDx VCC for low TSS. CR: L.M. Hoesl, None; R.P. Tornow, None; W.A. Schrems, None; F.K. Horn, None; C.Y. Mardin, None; F.E. Kruse, None; R. Laemmer, None. Support: None
240 - A508 Comparison of Spectral Domain Retinal Nerve Fiber Layer Thickness and Agreement with Time Domain Optical Coherence Tomography
L. Seibold, N. Mandava, M.Y. Kahook. Ophthalmology, University of Colorado, Denver, CO.
Purpose: To compare the retinal nerve fiber layer thickness (RNFL) measurements between three different spectral domain optical coherence tomography (OCT) instruments (Spectralis - Heidelberg Engineering, Heidelberg, Germany; Cirrus - Carl Zeiss Meditec, Dublin, CA; Optovue - Optovue, Inc., Fremont, CA) and time domain OCT measurements (Stratus - Carl Zeiss Meditec, Dublin, CA).Methods: 80 normal eyes (40 patients) were scanned for RNFL thickness measurements using each of the four OCT instruments by a single experienced operator on the same day. All eyes underwent a baseline examination with visual field testing to rule out evidence of glaucoma or other ocular disease. Student paired t testing, Pearson’s correlation coefficient, and Bland-Altman graphs were used for statistical analysis.Results: Average RNFL thickness determined by each of the 3 spectral domain OCT machines had a high correlation with measurements by Stratus (r = 0.78 Spectralis, r = 0.90 Cirrus, r = 0.92 Optovue), although each was significantly different than Stratus. The average RNFL thickness (mean ± standard deviation) was 110.64 µm ± 13.0 for Stratus, 106.79 µm ± 14.55 for Spectralis, 99.38 µm ± 11.71 for Cirrus, and 112.95 µm ± 13.48 for Optovue. The mean differences between each spectral domain instruments and Stratus were 3.85 µm ± 9.31 (p<0.01) for Spectralis, 11.25 µm ± 5.57 (p<0.01) for Cirrus, and -2.31 µm ± 5.26 (p<0.01) for Optovue. There were also significant (p≤0.01) differences in quadrant RNFL thickness from each spectral domain instrument and Stratus (Spectralis: temporal -3.34 µm, inferior 6.91 µm, nasal 10.69 µm; Cirrus: temporal 10.48 µm, inferior 11.47 µm, nasal 13.49 µm, superior 9.54 µm; Optovue: temporal -13.25 µm, inferior -4.23 µm).Conclusions: There is excellent correlation between time domain OCT and each of the three spectral domain OCT instruments. However significant differences in RNFL measurements do occur between each instrument. This study confirms previous reports that Cirrus produces RNFL measurements thinner than Stratus. New findings in this study include that RNFL thickness is significantly higher when using Optovue and significantly lower with Spectralis when compared to Stratus OCT. Clinicians should be aware of the relationship between Stratus RNFL measurements and each of the new spectral domain OCT measurements in the normal population. CR: L. Seibold, None; N. Mandava, None; M.Y. Kahook, None. Support: None
239 - A507 Comparison of Fourier Domain Optical Coherence Tomography (FD-OCT) Measurements in Subjects With and Without Pupil Dilation
E.M. Hoffmann, A. Schulze, J. Lamparter, N. Pfeiffer. Ophthalmology, University of Mainz, Mainz, Germany.
Purpose: Good quality images of scanning laser instruments are essential for reliable diagnosis and management of glaucoma. In daily routine, patients sometimes have dilated pupils, but sometimes not. Fourier Domain Optical Coherence Tomography is a new technology for high resolution imaging of the optic nerve head and the retinal nerve fiber layer (RNFL). The aim of this study was to evaluate possible differences in optic disc topographic and RNFL measurements when measuring eyes with and without pupil dilation. Methods: 100 eyes of 100 early glaucoma patients and 50 eyes of 50 healthy age matched subjects were included. Early glaucoma was defined as an abnormal visual field with a mean deviation [MD] of ≤ 9 dB and/or pattern standard deviation [PSD] ≤ 8% and/or corrected loss variance [CLV] of ≤ 64 dB². Healthy subjects had at least one normal reliable result on standard automated perimetry (SAP). Optic disc topographic measurements and RNFL measurements were performed consecutively on one day (first undilated following by dilation). Differences in optic disc topographic parameter and RNFL values between dilated and non-dilated eyes were analysed using a paired t-test. Results: The mean pupil diameter without dilation was 3,8 +- xx mm and with dilation 7,7+- xx mm. Measurements with dilation were easier and faster. The signal strengh index (quality index) was equal between both groups. Normal subjects showed no significant change in optic disc topographic and RNFL measurements after dilation. We found that glaucoma patients had a significant higher thickness of RNFL average (p<0.001) and of RNFL in the superior hemisphere (p<0.005) after dilation. All other disc and RNFL parameter did not show a significant difference between dilated and undilated eyes. Conclusions: FD-OCT imaging with dilated pupils was easier and faster. After dilation no significant difference in optic disc measurements was found in glaucoma and healthy subjects. Dilated glaucoma eyes showed a thicker RNFL compared to undilated eyes. Further studys will investigate the influence of glaucoma stage, age or lence opacity on the measurements of optic disc and RNFL with Fourier-domain OCT. CR: E.M. Hoffmann, Optovue Inc., F; A. Schulze, None; J. Lamparter, None; N. Pfeiffer, None. Support: None
239-242

Copyright 2010 by the Association for Research in Vision and Ophthalmology, Inc., all rights reserved.For permission to reproduce any abstract, contact the ARVO Office at [email protected]. Commercial Relationships are noted at the end of each abstract by “None” or with codes.
Sunday, May 2, 8:30 AM - 10:15 AM Hall B/C Poster Session Program Number/Board # Range: 211 - 261 / A479 - A529 110. Retinal Imaging in Glaucoma Organizing Section: GL
246 - A514 Reproducibility of Measurement During Middle Days Interval of Macular Retinal Nerve Fiber Layer Thickness Using Spectral-Domain Optical Coherent Tomography (SD-OCT)
M. Takamatsu, Y. Kiuchi, T. Sone. Dept of Ophthalmology and Visual Science, Hiroshima University, Hiroshima, Japan.
Purpose: To evaluate the reproducibility of measurement of macular retinal nerve fiber layer thickness over time using spectral domain optical coherence tomography (SD-OCT), we compared earlier and later findings. Participants: In 24 eyes of fourteen participants, macular retinal nerve fiber thickness was serially measured using RTVue-100® (Optovue, Inc., Fremont, CA, USA) with GCC program at Hiroshima University Hospital two or more times at intervals ranging from one month to two years. Patients were excluded if they had a history of episodes of IOP elevation exceeding 3mmHg or 20%, reflection error larger than +3.00D or -6.00D, or other retinochoroidal disease such changeable central macular structure or history of intraocular operations other than cataract surgeries.Methods:We compared earlier and later findings. The results include measurements of various macular retinal fiber layers such as ganglion cell complex layer thickness (GCCT), outer retinal nerve fiber layer thickness (ORNFLT) and retinal nerve fiber layer thickness (RNFLT) and the reproducibility of those measurements was evaluated.Results: The average age of participants was 57.8±19.2 yo. and the average MD of eyes was -10.97±10.48dB. The eyes measured had been diagnosed as normal, as having giant disc or glaucoma. At the first measurement ORNFLT (average 164.67±16.69µm), RNFLT (average 241.39±21.76µm) and GCCT (average 76.71±14.90µm). Correlation of earlier and later findings for GCCT at the superior half was r2=0.87 (p<0.0001) and that at the inferior half was r2=0.95 (p<0.0001) and that of the average of the superior and inferior halves was r2=0.95 (p<0.0001). Correlation of earlier and later findings for ORNFLT at the superior half was r2=0.38(p=0.0014) and that at the inferior half was r2=0.44 (p=0.0008) and that of the average of the superior and inferior halves was r2=0.52 (p=0.0001). Correlation of earlier and later findings for RNFLT at the superior half was r2=0.44 (p=0.0004) and that at the inferior half was r2=0.54 (p<0.0001) and that of the average of the superior and inferior halves was r2=0.48 (p=0.0002).Conclusion: On serial measurements of macular nerve fiber layer thickness using SD-OCT, the earlier and later findings of the GCC layer and outer part and full retina showed good correlation, indicating good reproducibility. CR: M. Takamatsu, None; Y. Kiuchi, None; T. Sone, None. Support: None CT: www.umin.ac.jp/ctr/index/htm, UMIN000002841
245 - A513 Comparison of Time Domain and Spectral Domain Optical Coherence Tomography in Retinal Nerve Fiber Layer Thickness Measurements
S. Bhartiya, M. Kumar, V. Kumar, S. Khanduja, S.K. Mishra, T. Dada. Glaucoma Services, Dr R P Centre for Ophthalmic Sciences, AIIMS, New Delhi, India.
Purpose: To compare retinal nerve fiber layer (RNFL) measurements by two optical coherence tomography (OCT) systems: the Stratus time domain OCT and the Cirrus spectral domain OCT (both by Carl Zeiss Meditec, Dublin, CA).Methods: 40 patients of primary open angle glaucoma and 40 healthy controls were enrolled in this observational cross-sectional study. Participants were imaged by a single trained operator using the Stratus OCT (fast RNFL scan mode) and Cirrus HD-OCT (optic disc cube mode) at the same visit. The order of the machines was randomized and the RNFL thicknesses measured by the two instruments were compared. A randomly selected eye of each of the participants was used for statistical analysis.. Reliability was assessed by the Intra-class correlation coefficient (ICC) and the Bland Altman plot for the limits of agreement for the overall mean RNFL thickness as well as for each quadrant.Results: The mean temporal, superior, nasal and inferior RNFL thickness as measured by the two machines are described in Table 1.ICC for the temporal, superior, nasal and inferior quadrant RNFL thickness measurements were 0.82, 0.85, 0.64 and 0.92 respectively. Bland Altman plots showed the limits of agreement (95%CI) for average
RNFL to be -24.68 to 15.50 in the control group. In patients of glaucoma, Bland-Altman plots showed the limits of agreement (95%CI) for average RNFL to be -18.38 to 23.58.Conclusions: There were clinically significant differences in the RNFL thickness measurements as determined by Stratus OCT and Cirrus HD-OCT. These two machines may not be used interchangeably during longitudinal follow-up of glaucoma patients and normal individuals.
CR: S. Bhartiya, None; M. Kumar, None; V. Kumar, None; S. Khanduja, None; S.K. Mishra, None; T. Dada, None. Support: None
244 - A512 Sensitivity and Specificity of Spectral-Domain Optical Coherence Tomography
S. Kawai1, S. Shimizu2, K. Shinoda2, Y. Suzuki2, A. Mizota3. 1Opthalmology, Teikyo-university, Itabasi, Japan; 2Opthalmology, Teikyo-University, Itabasi, Japan; 3Ophthalmology, Teikyo University, Itabashi-ku, Japan.
Purpose: To evaluate the sensitivity and specificity of spectral-domain optical coherence tomography (SD-OCT) to detect localized retinal nerve fiber layer (RNFL) defects in eyes with primary open-angle glaucoma.Methods: Forty-eight patients with open-angle glaucoma who were examined in the glaucoma clinic of Teikyo University School of Medicine Hospital from July 2008 to September 2009 were studied. All patients had RNFL defects which was clearly visible on fundus photographs and were examined with the Optic Disc Cube 200X200 program of the Cirrus high-definition OCT (Cirrus OCT). In addition, fundus photography and standard automated perimetry (SAP) were performed within three-months of the Cirrus OCT examination. The exclusion criteria were; best-corrected visual acuity <0.8, spherical equivalent refractive error > ± 6.0 D, and other diseases known to affect the RNFL thickness or visual field. One eye was randomly chosen when both eyes were eligible. The fundus photographs were used to classify eyes into those with a RNFL defect ≤30 degrees and those with a RNFL defect >30 degrees. When a 30 degree or more abnormality was detected at ≤5% level at the corresponding position of the “clock hours” by the Disc Cube program, the RNFL defect was considered to have been detected by Cirrus OCT.Results: In the 48 eyes, 32/37 (86.5%) hemi-retinas with a RNFL defect ≤30 degrees and 32/32 (100%) hemi-retinas with a >30 degree defect were judged abnormal by Cirrus OCT. Seven of 27 (25.9%) hemi-retinas without a RNFL defect were judged abnormal by Cirrus OCT. Sixty-four of 75 (85.3%) and four of 21 (19.0%) hemi-retinas with a RNFL defect or a SAP abnormality and with neither a RNFL defect or a SAP abnormality were judged abnormal by Cirrus OCT. Based on these results, Cirrus OCT had a sensitivity of 92.8% and a specificity of 74.1% when the RNFL defect was considered to be the standard.Conclusions: The high sensitivity and specificity of the Cirrus OCT to detect RNFL defects especially large defects indicate that SD-OCT can be used for the diagnosis glaucoma. CR: S. Kawai, None; S. Shimizu, None; K. Shinoda, None; Y. Suzuki, None; A. Mizota, None. Support: None
243 - A511 Retinal Nerve Fiber Layer Measurements in Myopic Eyes as Measured by Time Domain and Spectral Domain Optical Coherence Tomography
J. Choi, J. Lee, Y.-D. Kim, J. Choi. Glaucoma and Cataract Services, HanGil Eye Hospital, Incheon, Republic of Korea.
Purpose: To assess the peripapillary retinal nerve fiber layer (RNFL) thickness in non-glaucomatous young Korean subjects with myopia as measured by time domain (TD) and spectral domain (SD) optical coherence tomography (OCT), and to evaluate the relationship between RNFL measurements and ocular biometric variables including the optic disc measurements by confocal scanning laser ophthalmoscopy (CSLO) and the degree of myopia.Methods: This prospective study included 115 eyes of 64 healthy subjects, which were grouped into two groups: 64 low-to-moderate myopia (-0D < spherical equivalent (SE) < 6.0D) and 51 high myopia (SE ≥ -6.0D). RNFL thickness was measured using the TD OCT (Stratus OCT) and the SD OCT (Spectral OCT/SLO). Optic disc variables were measured using the CSLO (HRT III), and axial length using the laser interferometer (IOL Master). Global and sectoral RNFL thickness was compared between the groups for both OCTs. Associations between RNFL thickness and ocular variables were sought by linear regression.Results: RNFL measurements in myopes were well correlated between TD and SD OCT for all global and sectoral areas. Both OCTs revealed that global and sectoral RNFL thickness was significantly lower in high myopes than in low-to-moderate myopes (p<0.05) except for temporal sectors in which RNFL thickness is higher in high myopes than in low-to-moderate myopes. SD OCT showed better performance in discriminating normal eyes as “normal” based on normative database. The axial length and SE were significantly associated with global RNFL thickness measured by both OCTs (p<0.01). Optic disc area measured by CSLO had no associations with RNFL thickness measured by both OCTs.Conclusions: As demonstrated by TD and SD OCTs, high myopic eyes had a different RNFL thickness distribution when compared with low-to-moderate myopic eyes. Axial and refractive myopia seemed to affect the RNFL thickness measured by both OCTs in healthy myopic eyes, while optic disc area measured by CSLO did not. CR: J. Choi, None; J. Lee, None; Y.-D. Kim, None; J. Choi, None. Support: None
243-246

Copyright 2010 by the Association for Research in Vision and Ophthalmology, Inc., all rights reserved.For permission to reproduce any abstract, contact the ARVO Office at [email protected]. Commercial Relationships are noted at the end of each abstract by “None” or with codes.
Sunday, May 2, 8:30 AM - 10:15 AM Hall B/C Poster Session Program Number/Board # Range: 211 - 261 / A479 - A529 110. Retinal Imaging in Glaucoma Organizing Section: GL
Monday, May 4, 8:30 AM - 10:15 AM Hall B/C Poster Session Program Number/Board # Range: 1382 - 1406 / B121 - B145 219. Functional Retinal Imaging Organizing Section: MOI
250 - A518 Influence of Pupil Dilation on the Measurement of Retinal Nerve Fiber Layer Thickness by Cirrus HD-OCT
A.F. Silva1,2, I.C. Queiroz2, L.A.S. Melo, Jr.1, I.M. Tavares1. 1Ophthalmology, Federal University of Sao Paulo, Sao Paulo, Brazil; 2Ophthalmology, Hospital do Servidor Publico Estadual, Sao Paulo, Brazil.
Purpose: To evaluate the effect of pupillary dilation on retinal nerve fiber layer (RNFL) thickness measurements using spectral-domain optical coherence tomography (OCT).Methods: In this cross-sectional study, both eyes of 16 healthy individuals were scanned before and after pupillary dilation with 1% tropicamide by a trained operator, using Cirrus HD-OCT (Cirrus HD-OCT; Carl Zeiss Meditec, Inc., Dublin, CA). Each eye was imaged five times using Cirrus optic disc cube protocol (software version 3.0.0.64) before and after mydriasis. RNFL thickness measurements before and after dilation were compared.Results: Thirty-two eyes of 16 subjects (5 males, 11 females) were enrolled. Mean age was 30.13 +/- 9.11 years. There was no clinically significant difference in RNFL thickness measurements before and after pupil dilation. A statistically significant difference at the nasal sector was shown, but with no clinical relevance. No significant correlation between pupil change and the RNFL thickness measurements was demonstrated before and after mydriasis.Conclusions: Cirrus HD-OCT RNFL thickness measurements in healthy subjects were not influenced by pupil dilation.
CR: A.F. Silva, None; I.C. Queiroz, None; L.A.S. Melo, Jr., None; I.M. Tavares, None. Support: CAPES PRODOC
249 - A517 RNFL Thickness and Central Angle of RNFL Thinning Measures Obtained From Cirrus HD-OCT: Their Correlation and Their Ability to Detect Glaucoma
M.N. Panganiban1, D.E. Castro1,2, Y. Lee3, C. Mattox1. 1Ophthalmology, New England Eye Center, Tufts Medical Center, Boston, MA; 2Vision Institute, Federal University of Sao Paulo, Sao Paulo, Brazil; 3Biostatistics Research Center, Institute for Clinical Research and Health Policy Studies, Tufts Medical Center, Boston, MA.
Purpose: To determine the correlation, and compare glaucoma diagnostic abilities of the peripapillary retinal nerve fiber layer (RNFL) thickness measurements and the central angle measurements of RNFL thinning obtained using the Cirrus HD-OCT device (Carl Zeiss Meditec, Dublin, CA).Methods: A retrospective, cross-sectional study was performed on 191 eyes from 97 glaucoma subjects (57 eyes with mild glaucoma, 40 eyes with moderate glaucoma, and 60 with severe glaucoma), 128 eyes from 65 glaucoma suspects, and 58 eyes from 30 healthy subjects. Patient group assignment was based on Hodapp-Anderson-Parrish Visual Field criteria. RNFL thickness measurements were obtained from the RNFL Thickness Analyses of the Optic Disc Cube 200x200 scans. Using the Deviation from Normal Maps, the arc segments were plotted where the “red areas” (RNFL thickness <1% of normative data) intersected the Calculation Circle. Central angles were then calculated using a geometric formula and recorded in degrees. Area-under-receiver operator curves (AUC) were calculated for three RNFL thickness measures (average thickness, superior quadrant and inferior quadrant), and three central angle measurements (superior, inferior, and superior + inferior quadrants) using SAS 9.2. Two-tailed, Pearson’s correlation coefficients for the RNFL thickness and central angle measurements were also calculated using SPSS 16.0.Results: There is a significant inverse relationship between RNFL thickness measurements and central angle measurements of RNFL thinning. Pearson’s coefficients obtained are as follows: Average RNFL thickness and Superior+Inferior Central Angle (r=-0.735, p<0.01), Superior Quadrant (r=-0.713, p<0.01) and Inferior Quadrant (r=-0.747, p<0.01). RNFL thickness measurements were good parameters for all glaucoma stages, generating AUCs greater than 0.8. Central angle measurements of RNFL thinning were less sensitive, with AUCs ranging from 0.52 to 0.93.Conclusions: RNFL thickness measurements and central angle measurements of RNFL thinning were found to be highly correlated. However, RNFL thickness measurements have a higher sensitivity in glaucoma detection compared to central angle measurements of RNFL thinning. CR: M.N. Panganiban, None; D.E. Castro, None; Y. Lee, None; C. Mattox, Alcon, Inc., R. Support: RPB Challenge Grant to the New England Eye Center/Department of Ophthalmology, TUSM; Departmental Grant from Massachusetts Lions; Restoring Sight International, Inc. International Fellow Grant
248 - A516 Comparison of Optic Disc Parameters Measured by RTVue-100 FDOCT versus HRT-II
N.K. Mesiwala, M. Pekmezci, J.-Y. Huang, T. Porco, S.C. Lin. Ophthalmology, University of California San Francisco, San Francisco, CA.
Purpose: To compare optic disc measurements between the new fourier-domain optical coherence tomography (FDOCT, RTVue-100) and the confocal scanning laser ophthalmoscopy (HRT-II) in clinical practice.Methods: Nonrandomized comparative study including all patients seen from August 2008 to August 2009 with good quality RTVue-100 and HRT-II images within six months of each other. The rim of the optic disc was drawn automatically by RTVue-100 and manually by a single experienced observer for HRT-II. Optic disc measurements from both imaging devices were compared using Bland-Altman plots and student t-test to assess agreement.Results: 363 patients were included (mean age 64.7 +/-13.3). Bland-Altman plots indicate significant differences between the RTVue-100 and HRT-II for all optic nerve parameters. The HRT values were consistently larger than RTVue-100 values for optic disc area and rim area. The RTVue-100 values were larger in cup area, cup-to-disc area ratio, and vertical and horizontal cup-to-disc ratio. Student t-test showed p<0.001 for averages of all measurements between the two devices (Table 1).Conclusions: We conclude the disk parameters from these two imaging devices are not interchangeable. The mean RTVue-100 measurements of disc area and rim area were smaller than HRT values suggesting overall, the automated software underestimates the disc margin contours relative to HRT-II. Differences in parameters may be due
to differences in scanning technology and deriving set points for defining the cup. Another possibility is that manual drawing of the disc margin in HRT-II overestimates the true margin, resulting in greater disc and rim areas. Clinically, the underestimation of RTVue-100 relative to HRT-II may result in larger estimates of cup area and cup-to-disc ratios, and thus, greater likelihood of classification as abnormal.
CR: N.K. Mesiwala, None; M. Pekmezci, None; J.-Y. Huang, None; T. Porco, None; S.C. Lin, None. Support: None
247 - A515 Evaluation of Retinal Nerve Fiber Layer Thickness Measurements for Glaucoma Detection: Time Domain vs Spectral Domain Optical Coherence Tomography
E. Benatti1, F. Verga1, S. Bochicchio1, F. Bertuzzi1, G. Esempio1, E. Rulli2, S. Miglior1. 1Ophthalmology, Policlinico di Monza, University Milano-Bicocca, Monza (MI), Italy; 2Biostatistics, Istituto Mario Negri, Milano, Italy.
Purpose: To compare diagnostic ability in glaucoma detection between retinal nerve fiber layer (RNFL) thickness measurements obtained by spectral domain optical coherence tomography (OCT) and time domain OCT. Patients and Methods: 105 eyes of 105 patients (36 Normal, 33 Ocular Hypertensive and 36 Glaucomatous) underwent a complete examination, standard automated perimetry, TD-OCT (Stratus OCT;Carl Zeiss Meditec) and FD-OCT (RTVue;Optovue Inc.). Areas under the receiver operating characteristic curves (AUROCs) and sensitivity values at a fixed specificity of 95% were calculated and compared for RNFL parameters obtained by both instruments. We also evaluated the diagnostic ability in glaucoma detection of the “ganglion cell complex “ parameter (GCC) available on SD-OCT. Agreement between RNFL measurements was evaluated by means of Bland-Altman plots. Results: The average (AUC, 0.94 SD-OCT and 0.92 Stratus OCT), superior (AUC, 0.90 and 0.90, respectively), and inferior (AUC, 0.92 and 0.87, respectively) RNFL thicknesses showed the best AUROCs with no significant difference between the two OCT devices (P>0.05). FD-OCT showed higher sensitivity at 95% specificity (64% to 81%) than TD-OCT (61% to 69%). The FD-OCT parameter GCC thickness showed AUROCs 0.93 to 0.95 and sensitivities at 95% specificity 75% to 81%. Average, Superior, Inferior, Nasal and Temporal RNFL thicknesses measurements were significantly higher in FD-OCT than in TD-OCT measurements in the Bland-Altman plots (P<0.001). Conclusions: While FD-OCT and TD-OCT have comparable diagnostic performance in glaucoma detection, Fourier domain technology seems to be a better diagnostic tool in a clinical setting, because it is user-friendly, repeatable and in most of patients examination does not require pupil dilatation. GCC thickness measurements show excellent diagnostic validity and may be a promising parameter in the clinical assessment of glaucoma. RNFL thickness measurements obtained from the two OCT technologies may not be used interchangeably. CR: E. Benatti, None; F. Verga, None; S. Bochicchio, None; F. Bertuzzi, None; G. Esempio, None; E. Rulli, None; S. Miglior, Zeiss, Heidelberg, Optovue, C. Support: None
247-250
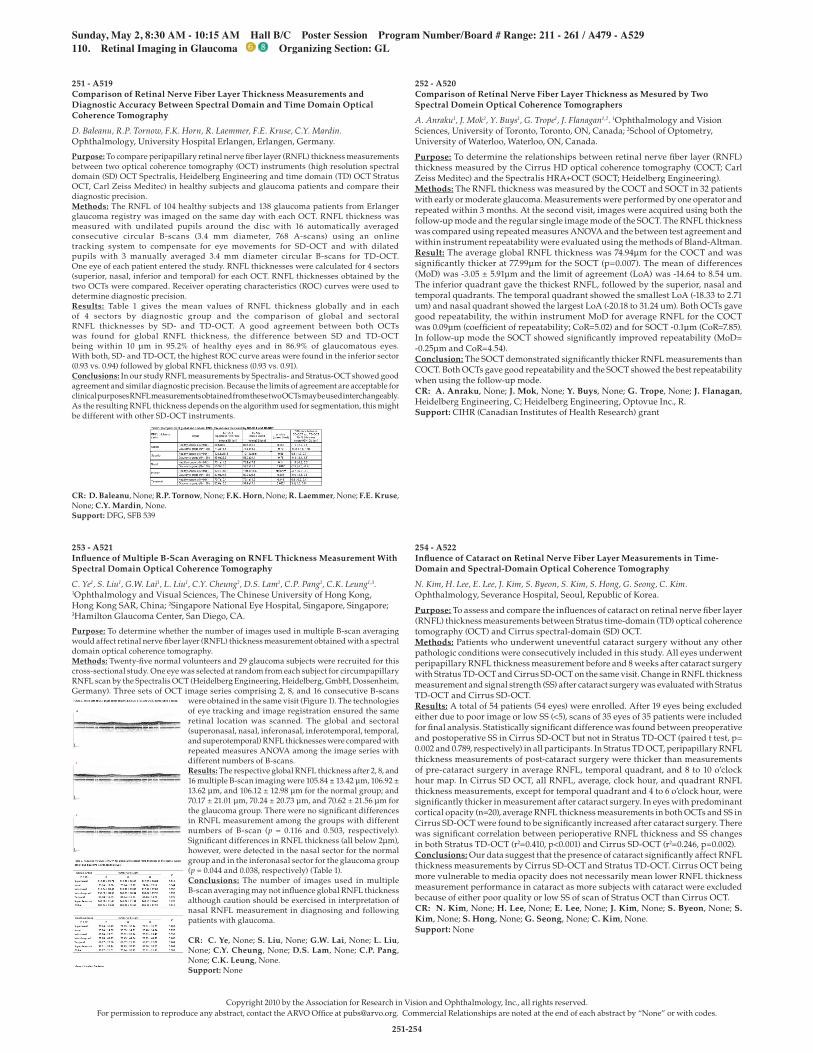
Copyright 2010 by the Association for Research in Vision and Ophthalmology, Inc., all rights reserved.For permission to reproduce any abstract, contact the ARVO Office at [email protected]. Commercial Relationships are noted at the end of each abstract by “None” or with codes.
Sunday, May 2, 8:30 AM - 10:15 AM Hall B/C Poster Session Program Number/Board # Range: 211 - 261 / A479 - A529 110. Retinal Imaging in Glaucoma Organizing Section: GL
254 - A522 Influence of Cataract on Retinal Nerve Fiber Layer Measurements in Time-Domain and Spectral-Domain Optical Coherence Tomography
N. Kim, H. Lee, E. Lee, J. Kim, S. Byeon, S. Kim, S. Hong, G. Seong, C. Kim. Ophthalmology, Severance Hospital, Seoul, Republic of Korea.
Purpose: To assess and compare the influences of cataract on retinal nerve fiber layer (RNFL) thickness measurements between Stratus time-domain (TD) optical coherence tomography (OCT) and Cirrus spectral-domain (SD) OCT.Methods: Patients who underwent uneventful cataract surgery without any other pathologic conditions were consecutively included in this study. All eyes underwent peripapillary RNFL thickness measurement before and 8 weeks after cataract surgery with Stratus TD-OCT and Cirrus SD-OCT on the same visit. Change in RNFL thickness measurement and signal strength (SS) after cataract surgery was evaluated with Stratus TD-OCT and Cirrus SD-OCT.Results: A total of 54 patients (54 eyes) were enrolled. After 19 eyes being excluded either due to poor image or low SS (<5), scans of 35 eyes of 35 patients were included for final analysis. Statistically significant difference was found between preoperative and postoperative SS in Cirrus SD-OCT but not in Stratus TD-OCT (paired t test, p= 0.002 and 0.789, respectively) in all participants. In Stratus TD OCT, peripapillary RNFL thickness measurements of post-cataract surgery were thicker than measurements of pre-cataract surgery in average RNFL, temporal quadrant, and 8 to 10 o’clock hour map. In Cirrus SD OCT, all RNFL, average, clock hour, and quadrant RNFL thickness measurements, except for temporal quadrant and 4 to 6 o’clock hour, were significantly thicker in measurement after cataract surgery. In eyes with predominant cortical opacity (n=20), average RNFL thickness measurements in both OCTs and SS in Cirrus SD-OCT were found to be significantly increased after cataract surgery. There was significant correlation between perioperative RNFL thickness and SS changes in both Stratus TD-OCT (r2=0.410, p<0.001) and Cirrus SD-OCT (r2=0.246, p=0.002).Conclusions: Our data suggest that the presence of cataract significantly affect RNFL thickness measurements by Cirrus SD-OCT and Stratus TD-OCT. Cirrus OCT being more vulnerable to media opacity does not necessarily mean lower RNFL thickness measurement performance in cataract as more subjects with cataract were excluded because of either poor quality or low SS of scan of Stratus OCT than Cirrus OCT. CR: N. Kim, None; H. Lee, None; E. Lee, None; J. Kim, None; S. Byeon, None; S. Kim, None; S. Hong, None; G. Seong, None; C. Kim, None. Support: None
253 - A521 Influence of Multiple B-Scan Averaging on RNFL Thickness Measurement With Spectral Domain Optical Coherence Tomography
C. Ye1, S. Liu1, G.W. Lai1, L. Liu1, C.Y. Cheung2, D.S. Lam1, C.P. Pang1, C.K. Leung1,3. 1Ophthalmology and Visual Sciences, The Chinese University of Hong Kong, Hong Kong SAR, China; 2Singapore National Eye Hospital, Singapore, Singapore; 3Hamilton Glaucoma Center, San Diego, CA.
Purpose: To determine whether the number of images used in multiple B-scan averaging would affect retinal nerve fiber layer (RNFL) thickness measurement obtained with a spectral domain optical coherence tomography.Methods: Twenty-five normal volunteers and 29 glaucoma subjects were recruited for this cross-sectional study. One eye was selected at random from each subject for circumpapillary RNFL scan by the Spectralis OCT (Heidelberg Engineering, Heidelberg, GmbH, Dossenheim, Germany). Three sets of OCT image series comprising 2, 8, and 16 consecutive B-scans
were obtained in the same visit (Figure 1). The technologies of eye tracking and image registration ensured the same retinal location was scanned. The global and sectoral (superonasal, nasal, inferonasal, inferotemporal, temporal, and superotemporal) RNFL thicknesses were compared with repeated measures ANOVA among the image series with different numbers of B-scans.Results: The respective global RNFL thickness after 2, 8, and 16 multiple B-scan imaging were 105.84 ± 13.42 µm, 106.92 ± 13.62 µm, and 106.12 ± 12.98 µm for the normal group; and 70.17 ± 21.01 µm, 70.24 ± 20.73 µm, and 70.62 ± 21.56 µm for the glaucoma group. There were no significant differences in RNFL measurement among the groups with different numbers of B-scan (p = 0.116 and 0.503, respectively). Significant differences in RNFL thickness (all below 2µm), however, were detected in the nasal sector for the normal group and in the inferonasal sector for the glaucoma group (p = 0.044 and 0.038, respectively) (Table 1).Conclusions: The number of images used in multiple B-scan averaging may not influence global RNFL thickness although caution should be exercised in interpretation of nasal RNFL measurement in diagnosing and following patients with glaucoma.
CR: C. Ye, None; S. Liu, None; G.W. Lai, None; L. Liu, None; C.Y. Cheung, None; D.S. Lam, None; C.P. Pang, None; C.K. Leung, None. Support: None
252 - A520 Comparison of Retinal Nerve Fiber Layer Thickness as Mesured by Two Spectral Domein Optical Coherence Tomographers
A. Anraku1, J. Mok2, Y. Buys1, G. Trope1, J. Flanagan1,2. 1Ophthalmology and Vision Sciences, University of Toronto, Toronto, ON, Canada; 2School of Optometry, University of Waterloo, Waterloo, ON, Canada.
Purpose: To determine the relationships between retinal nerve fiber layer (RNFL) thickness measured by the Cirrus HD optical coherence tomography (COCT; Carl Zeiss Meditec) and the Spectralis HRA+OCT (SOCT; Heidelberg Engineering).Methods: The RNFL thickness was measured by the COCT and SOCT in 32 patients with early or moderate glaucoma. Measurements were performed by one operator and repeated within 3 months. At the second visit, images were acquired using both the follow-up mode and the regular single image mode of the SOCT. The RNFL thickness was compared using repeated measures ANOVA and the between test agreement and within instrument repeatability were evaluated using the methods of Bland-Altman.Result: The average global RNFL thickness was 74.94µm for the COCT and was significantly thicker at 77.99µm for the SOCT (p=0.007). The mean of differences (MoD) was -3.05 ± 5.91µm and the limit of agreement (LoA) was -14.64 to 8.54 um. The inferior quadrant gave the thickest RNFL, followed by the superior, nasal and temporal quadrants. The temporal quadrant showed the smallest LoA (-18.33 to 2.71 um) and nasal quadrant showed the largest LoA (-20.18 to 31.24 um). Both OCTs gave good repeatability, the within instrument MoD for average RNFL for the COCT was 0.09µm (coefficient of repeatability; CoR=5.02) and for SOCT -0.1µm (CoR=7.85). In follow-up mode the SOCT showed significantly improved repeatability (MoD= -0.25µm and CoR=4.54).Conclusion: The SOCT demonstrated significantly thicker RNFL measurements than COCT. Both OCTs gave good repeatability and the SOCT showed the best repeatability when using the follow-up mode. CR: A. Anraku, None; J. Mok, None; Y. Buys, None; G. Trope, None; J. Flanagan, Heidelberg Engineering, C; Heidelberg Engineering, Optovue Inc., R. Support: CIHR (Canadian Institutes of Health Research) grant
251 - A519 Comparison of Retinal Nerve Fiber Layer Thickness Measurements and Diagnostic Accuracy Between Spectral Domain and Time Domain Optical Coherence Tomography
D. Baleanu, R.P. Tornow, F.K. Horn, R. Laemmer, F.E. Kruse, C.Y. Mardin. Ophthalmology, University Hospital Erlangen, Erlangen, Germany.
Purpose: To compare peripapillary retinal nerve fiber layer (RNFL) thickness measurements between two optical coherence tomography (OCT) instruments (high resolution spectral domain (SD) OCT Spectralis, Heidelberg Engineering and time domain (TD) OCT Stratus OCT, Carl Zeiss Meditec) in healthy subjects and glaucoma patients and compare their diagnostic precision.Methods: The RNFL of 104 healthy subjects and 138 glaucoma patients from Erlanger glaucoma registry was imaged on the same day with each OCT. RNFL thickness was measured with undilated pupils around the disc with 16 automatically averaged consecutive circular B-scans (3.4 mm diameter, 768 A-scans) using an online tracking system to compensate for eye movements for SD-OCT and with dilated pupils with 3 manually averaged 3.4 mm diameter circular B-scans for TD-OCT. One eye of each patient entered the study. RNFL thicknesses were calculated for 4 sectors (superior, nasal, inferior and temporal) for each OCT. RNFL thicknesses obtained by the two OCTs were compared. Receiver operating characteristics (ROC) curves were used to determine diagnostic precision.Results: Table 1 gives the mean values of RNFL thickness globally and in each of 4 sectors by diagnostic group and the comparison of global and sectoral RNFL thicknesses by SD- and TD-OCT. A good agreement between both OCTs was found for global RNFL thickness, the difference between SD and TD-OCT being within 10 µm in 95.2% of healthy eyes and in 86.9% of glaucomatous eyes. With both, SD- and TD-OCT, the highest ROC curve areas were found in the inferior sector (0.93 vs. 0.94) followed by global RNFL thickness (0.93 vs. 0.91).Conclusions: In our study RNFL measurements by Spectralis- and Stratus-OCT showed good agreement and similar diagnostic precision. Because the limits of agreement are acceptable for clinical purposes RNFL measurements obtained from these two OCTs may be used interchangeably. As the resulting RNFL thickness depends on the algorithm used for segmentation, this might be different with other SD-OCT instruments.
CR: D. Baleanu, None; R.P. Tornow, None; F.K. Horn, None; R. Laemmer, None; F.E. Kruse, None; C.Y. Mardin, None. Support: DFG, SFB 539
251-254
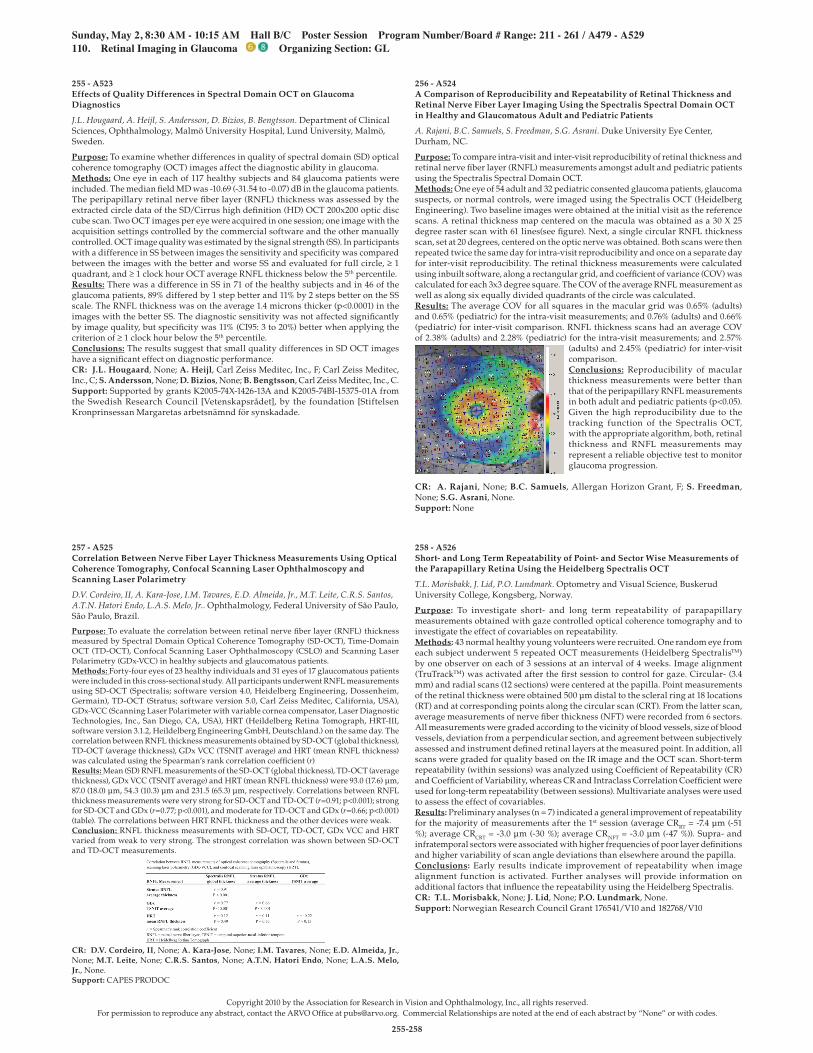
Copyright 2010 by the Association for Research in Vision and Ophthalmology, Inc., all rights reserved.For permission to reproduce any abstract, contact the ARVO Office at [email protected]. Commercial Relationships are noted at the end of each abstract by “None” or with codes.
Sunday, May 2, 8:30 AM - 10:15 AM Hall B/C Poster Session Program Number/Board # Range: 211 - 261 / A479 - A529 110. Retinal Imaging in Glaucoma Organizing Section: GL
Monday, May 4, 8:30 AM - 10:15 AM Hall B/C Poster Session Program Number/Board # Range: 1382 - 1406 / B121 - B145 219. Functional Retinal Imaging Organizing Section: MOI
258 - A526 Short- and Long Term Repeatability of Point- and Sector Wise Measurements of the Parapapillary Retina Using the Heidelberg Spectralis OCT
T.L. Morisbakk, J. Lid, P.O. Lundmark. Optometry and Visual Science, Buskerud University College, Kongsberg, Norway.
Purpose: To investigate short- and long term repeatability of parapapillary measurements obtained with gaze controlled optical coherence tomography and to investigate the effect of covariables on repeatability.Methods: 43 normal healthy young volunteers were recruited. One random eye from each subject underwent 5 repeated OCT measurements (Heidelberg SpectralisTM) by one observer on each of 3 sessions at an interval of 4 weeks. Image alignment (TruTrackTM) was activated after the first session to control for gaze. Circular- (3.4 mm) and radial scans (12 sections) were centered at the papilla. Point measurements of the retinal thickness were obtained 500 µm distal to the scleral ring at 18 locations (RT) and at corresponding points along the circular scan (CRT). From the latter scan, average measurements of nerve fiber thickness (NFT) were recorded from 6 sectors. All measurements were graded according to the vicinity of blood vessels, size of blood vessels, deviation from a perpendicular section, and agreement between subjectively assessed and instrument defined retinal layers at the measured point. In addition, all scans were graded for quality based on the IR image and the OCT scan. Short-term repeatability (within sessions) was analyzed using Coefficient of Repeatability (CR) and Coefficient of Variability, whereas CR and Intraclass Correlation Coefficient were used for long-term repeatability (between sessions). Multivariate analyses were used to assess the effect of covariables.Results: Preliminary analyses (n = 7) indicated a general improvement of repeatability for the majority of measurements after the 1st session (average CRRT = -7.4 µm (-51 %); average CRCRT = -3.0 µm (-30 %); average CRNFT = -3.0 µm (-47 %)). Supra- and infratemporal sectors were associated with higher frequencies of poor layer definitions and higher variability of scan angle deviations than elsewhere around the papilla.Conclusions: Early results indicate improvement of repeatability when image alignment function is activated. Further analyses will provide information on additional factors that influence the repeatability using the Heidelberg Spectralis. CR: T.L. Morisbakk, None; J. Lid, None; P.O. Lundmark, None. Support: Norwegian Research Council Grant 176541/V10 and 182768/V10
257 - A525 Correlation Between Nerve Fiber Layer Thickness Measurements Using Optical Coherence Tomography, Confocal Scanning Laser Ophthalmoscopy and Scanning Laser Polarimetry
D.V. Cordeiro, II, A. Kara-Jose, I.M. Tavares, E.D. Almeida, Jr., M.T. Leite, C.R.S. Santos, A.T.N. Hatori Endo, L.A.S. Melo, Jr.. Ophthalmology, Federal University of São Paulo, São Paulo, Brazil.
Purpose: To evaluate the correlation between retinal nerve fiber layer (RNFL) thickness measured by Spectral Domain Optical Coherence Tomography (SD-OCT), Time-Domain OCT (TD-OCT), Confocal Scanning Laser Ophthalmoscopy (CSLO) and Scanning Laser Polarimetry (GDx-VCC) in healthy subjects and glaucomatous patients.Methods: Forty-four eyes of 23 healthy individuals and 31 eyes of 17 glaucomatous patients were included in this cross-sectional study. All participants underwent RNFL measurements using SD-OCT (Spectralis; software version 4.0, Heidelberg Engineering, Dossenheim, Germain), TD-OCT (Stratus; software version 5.0, Carl Zeiss Meditec, California, USA), GDx-VCC (Scanning Laser Polarimeter with variable cornea compensator, Laser Diagnostic Technologies, Inc., San Diego, CA, USA), HRT (Heildelberg Retina Tomograph, HRT-III, software version 3.1.2, Heildelberg Engineering GmbH, Deutschland.) on the same day. The correlation between RNFL thickness measurements obtained by SD-OCT (global thickness), TD-OCT (average thickness), GDx VCC (TSNIT average) and HRT (mean RNFL thickness) was calculated using the Spearman’s rank correlation coefficient (r)Results: Mean (SD) RNFL measurements of the SD-OCT (global thickness), TD-OCT (average thickness), GDx VCC (TSNIT average) and HRT (mean RNFL thickness) were 93.0 (17.6) µm, 87.0 (18.0) µm, 54.3 (10.3) µm and 231.5 (65.3) µm, respectively. Correlations between RNFL thickness measurements were very strong for SD-OCT and TD-OCT (r=0.91; p<0.001); strong for SD-OCT and GDx (r=0.77; p<0.001), and moderate for TD-OCT and GDx (r=0.66; p<0.001) (table). The correlations between HRT RNFL thickness and the other devices were weak.Conclusion: RNFL thickness measurements with SD-OCT, TD-OCT, GDx VCC and HRT varied from weak to very strong. The strongest correlation was shown between SD-OCT and TD-OCT measurements.
CR: D.V. Cordeiro, II, None; A. Kara-Jose, None; I.M. Tavares, None; E.D. Almeida, Jr., None; M.T. Leite, None; C.R.S. Santos, None; A.T.N. Hatori Endo, None; L.A.S. Melo, Jr., None. Support: CAPES PRODOC
256 - A524 A Comparison of Reproducibility and Repeatability of Retinal Thickness and Retinal Nerve Fiber Layer Imaging Using the Spectralis Spectral Domain OCT in Healthy and Glaucomatous Adult and Pediatric Patients
A. Rajani, B.C. Samuels, S. Freedman, S.G. Asrani. Duke University Eye Center, Durham, NC.
Purpose: To compare intra-visit and inter-visit reproducibility of retinal thickness and retinal nerve fiber layer (RNFL) measurements amongst adult and pediatric patients using the Spectralis Spectral Domain OCT.Methods: One eye of 54 adult and 32 pediatric consented glaucoma patients, glaucoma suspects, or normal controls, were imaged using the Spectralis OCT (Heidelberg Engineering). Two baseline images were obtained at the initial visit as the reference scans. A retinal thickness map centered on the macula was obtained as a 30 X 25 degree raster scan with 61 lines(see figure). Next, a single circular RNFL thickness scan, set at 20 degrees, centered on the optic nerve was obtained. Both scans were then repeated twice the same day for intra-visit reproducibility and once on a separate day for inter-visit reproducibility. The retinal thickness measurements were calculated using inbuilt software, along a rectangular grid, and coefficient of variance (COV) was calculated for each 3x3 degree square. The COV of the average RNFL measurement as well as along six equally divided quadrants of the circle was calculated.Results: The average COV for all squares in the macular grid was 0.65% (adults) and 0.65% (pediatric) for the intra-visit measurements; and 0.76% (adults) and 0.66% (pediatric) for inter-visit comparison. RNFL thickness scans had an average COV of 2.38% (adults) and 2.28% (pediatric) for the intra-visit measurements; and 2.57%
(adults) and 2.45% (pediatric) for inter-visit comparison.Conclusions: Reproducibility of macular thickness measurements were better than that of the peripapillary RNFL measurements in both adult and pediatric patients (p<0.05). Given the high reproducibility due to the tracking function of the Spectralis OCT, with the appropriate algorithm, both, retinal thickness and RNFL measurements may represent a reliable objective test to monitor glaucoma progression.
CR: A. Rajani, None; B.C. Samuels, Allergan Horizon Grant, F; S. Freedman, None; S.G. Asrani, None. Support: None
255 - A523 Effects of Quality Differences in Spectral Domain OCT on Glaucoma Diagnostics
J.L. Hougaard, A. Heijl, S. Andersson, D. Bizios, B. Bengtsson. Department of Clinical Sciences, Ophthalmology, Malmö University Hospital, Lund University, Malmö, Sweden.
Purpose: To examine whether differences in quality of spectral domain (SD) optical coherence tomography (OCT) images affect the diagnostic ability in glaucoma.Methods: One eye in each of 117 healthy subjects and 84 glaucoma patients were included. The median field MD was -10.69 (-31.54 to -0.07) dB in the glaucoma patients. The peripapillary retinal nerve fiber layer (RNFL) thickness was assessed by the extracted circle data of the SD/Cirrus high definition (HD) OCT 200x200 optic disc cube scan. Two OCT images per eye were acquired in one session; one image with the acquisition settings controlled by the commercial software and the other manually controlled. OCT image quality was estimated by the signal strength (SS). In participants with a difference in SS between images the sensitivity and specificity was compared between the images with the better and worse SS and evaluated for full circle, ≥ 1 quadrant, and ≥ 1 clock hour OCT average RNFL thickness below the 5th percentile.Results: There was a difference in SS in 71 of the healthy subjects and in 46 of the glaucoma patients, 89% differed by 1 step better and 11% by 2 steps better on the SS scale. The RNFL thickness was on the average 1.4 microns thicker (p<0.0001) in the images with the better SS. The diagnostic sensitivity was not affected significantly by image quality, but specificity was 11% (CI95: 3 to 20%) better when applying the criterion of ≥ 1 clock hour below the 5th percentile.Conclusions: The results suggest that small quality differences in SD OCT images have a significant effect on diagnostic performance. CR: J.L. Hougaard, None; A. Heijl, Carl Zeiss Meditec, Inc., F; Carl Zeiss Meditec, Inc., C; S. Andersson, None; D. Bizios, None; B. Bengtsson, Carl Zeiss Meditec, Inc., C. Support: Supported by grants K2005-74X-1426-13A and K2005-74BI-15375-01A from the Swedish Research Council [Vetenskapsrådet], by the foundation [Stiftelsen Kronprinsessan Margaretas arbetsnämnd för synskadade.
255-258

Copyright 2010 by the Association for Research in Vision and Ophthalmology, Inc., all rights reserved.For permission to reproduce any abstract, contact the ARVO Office at [email protected]. Commercial Relationships are noted at the end of each abstract by “None” or with codes.
Sunday, May 2, 8:30 AM - 10:15 AM Hall B/C Poster Session Program Number/Board # Range: 211 - 261 / A479 - A529 110. Retinal Imaging in Glaucoma Organizing Section: GL
261 - A529 Comparison of Spectral Domain Optical Coherence Tomography in the Measurement of Peripapillary Retinal Nerve Fiber Layer Thickness
P. Calvo1A,2, A. Ferreras1A,2, L. Gil-Arribas1A,2, A. Pajarin3, L.E. Pablo1A,2, M.I. Fuertes1A, J.M. Larrosa1A,2, B. Abadia1. AOphthalmology, 1Miguel Servet University Hospital, Zaragoza, Spain; 2Instituto Aragonés de Ciencias de la Salud, Zaragoza, Spain; 3Family Medicine, Centro de Salud Universitas, Zaragoza, Spain.
Purpose: To determine the relationship between peripapillary retinal nerve fiber layer (RNFL) thickness measured by 2 different spectral domain optical coherence tomography (OCT) systems.Methods: Forty-nine eyes of 49 glaucoma patients were imaged using Cirrus HD OCT (Carl Zeiss Meditec, Dublin, Ca) and Spectralis OCT (Heidelberg Engineering, Heidelberg, Germany) at the same visit. Participants had intraocular pressure higher than 21 mmHg and abnormal standard automated perimetry. Student paired t test, Pearson’s correlation coefficient, and Bland-Altman analysis of RNFL thickness measurements were calculated between the equivalent parameters of both devices.Results: Mean age was 64.5±7.1 years and mean deviation of standard automated perimetry was -5.0±5.7 dB. For average thickness there was a highly significant linear relationship between the values obtained from both instruments (r=0.899, p<0.001). The strongest correlations were observed between the inferior (0.935, p>0.001) and superior (0.922, p<0.001) quadrant thicknesses. RNFL thickness at nasal and temporal quadrants were significant different by paired t testing (p=0.002 and p<0.001, respectively). The Bland-Altman plot did not reveal a significant difference between measurements of Cirrus and Spectralis OCT.Conclusions: There were significant differences in RNFL measurements at horizontal axis (nasal and temporal quadrants) as determined by Cirrus OCT and Spectralis OCT, despite an excellent correlation of all RNFL thickness measurements. CR: P. Calvo, None; A. Ferreras, None; L. Gil-Arribas, None; A. Pajarin, None; L.E. Pablo, None; M.I. Fuertes, None; J.M. Larrosa, None; B. Abadia, None. Support: Supported in part by the Instituto de Salud Carlos III grant PI080976
260 - A528 Analysis of Peripapillary Nerve Fiber Layer Thickness (Assessed by SOCT) With Automated Classification and Correction for Individual Optic Disk Locations
F.K. Horn1, C.Y. Mardin1, D. Baleanu1, R. Laemmer1, N. Bellios1, A.M. Juenemann1, R.P. Tornow1, W. Adler2. 1Ophthalmology, Univ of Erlangen Nurnberg, Erlangen, Germany; 2Institut für Medizininformatik, Biometrie und Epidemiologie, University Erlangen, Germany.
Purpose: To study the diagnostic value of retinal nerve fiber layer ring profiles measured peripapillary with spectral domain optical coherence tomography (SOCT) under consideration of the position of the optic disk in relation to fixation.Methods: Thickness values of the retinal nerve fiber layer were determined in 768 locations around the optic disk using high resolution SOCT (Spectralis, Heidelberg Engineering). In all calculations the measured position of the optic disk in relation to the fixation was taken into account by an individual correction of the TSNIT-graph considering the fovea-disk-angle. Different sizes of sectors were used for training of two different state-of-the-art machine learning algorithms (random forest [1], support vector machine [2]): all 768 thickness measurements, quadrants, 32 sectors, and 6 nerve fiber bundle related areas. Classification performance was estimated by subject-based 10-fold cross-validation [3]. Patients and subjects: 337 eyes from 232 patients with different stages of open angle glaucoma were included. 433 eyes from 269 healthy subjects served as control cohort. Controls and two patient groups (preperimetric and perimetric glaucomas) were compared using ROC-curves (one eye/patient).Results: Mean angle between the fovea and the center of the optic disc versus the horizon as measured by the present SOCT was 5.9±3.7°. ROC-curves for single peripapillary sectors indicate an increase of the validity when the position of the optic disk during SOCT-measurement was taken into account. Comparing controls and glaucoma patients, the best separation could be achieved if analysis was performed with a machine learning classifier using all data of the TSNIT-graph. Both automated algorithms of this study yielded similar performance. At a fixed specificity (97%) automated classification was able to uncover 91% of the present perimetric glaucoma patients, compared to 80% achieved by total mean thickness (comparison of areas under ROC-curves: p<0.05). In preperimetic glaucoma patients, however, none of the present methods performed better than the total mean thickness of the nerve fiber layer.Conclusions: Consideration of the optic disk location during image acquisition as well as automatic classification is helpful in glaucoma detection by SOCT measurements. References: [1] Breiman, 2001, [2] Vapnik, 2000, [3] Brenning, 2008. CR: F.K. Horn, None; C.Y. Mardin, None; D. Baleanu, None; R. Laemmer, None; N. Bellios, None; A.M. Juenemann, None; R.P. Tornow, None; W. Adler, None. Support: Deutsche Forschungsgemeinschaft, Bonn, Germany (SFB 539) CT: www.clinicaltrials.gov, NCT 00494923
259-261
259 - A527 Comparison of Peripapillary Retinal Nerve Fiber Layer Thickness Measured by Cirrus and Stratus Optical Coherence Tomography
L. Gil-Arribas1, A. Ferreras1, P. Calvo1, A.B. Pajarin2, L.E. Pablo1, V. Polo1. 1Miguel Servet University Hospital, Zaragoza, Spain; 2Health Care Center Universitas, Zaragoza, Spain.
Purpose: To study the agreement between peripapillary retinal nerve fiber layer (RNFL) thickness measured by time domain (Stratus) and spectral domain (Cirrus) optical coherence tomography (OCT) in open-angle glaucoma patients.Methods: A total of 56 glaucoma subjects were analyzed. Only one eye was randomly included in the study. All of them had intraocular pressure higher than 21 mmHg and abnormal standard automated perimetry. Peripapillary RNFL thickness was measured with Stratus (Fast RNFL thickness 3.46 mm scan protocol) and Cirrus (Optic Disc Cube 200 x 200 scan protocol) on the same visit. Left eye data were converted to a right eye format. Student paired t tests and Pearson’s correlation coefficients of the RNFL thickness measurements were calculated between both devices.Results: Mean age was 63.5±7.8 years and mean deviation of standard automated perimetry was -5.4±5.5 dB. All RNFL parameters showed significant correlations between both instruments, except for the average thickness (p=0.580). The strongest correlations were observed for inferior quadrant thickness (0.920, p>0.001), RNFL thickness at the 7 o clock position (0.906, p<0.001), and RNFL thickness at 10 o clock position (0.897, p<0.001). Mean RNFL thicknesses at 2 o clock position, 3 o clock position and nasal quadrant were significant different (paired t test, p<0.001) when comparing Stratus and Cirrus measurements.Conclusions: In general, there was a good agreement between Stratus and Cirrus OCT data in glaucoma patients. Nevertheless, there are differences that must be taken into account in clinical practice. CR: L. Gil-Arribas, None; A. Ferreras, None; P. Calvo, None; A.B. Pajarin, None; L.E. Pablo, None; V. Polo, None. Support: Supported in part by the Instituto de Salud Carlos III grant PI080976.