Embed Size (px)
Citation preview

Sunday, September 30

NOTES—

9/20/2012
1
Cardiology in the World of Accountable Care
Patrick T. O’Gara, MDBrigham and Women’s Hospital
Harvard Medical School
No Disclosures
Current Climate
Pressure to Lower Costs
• Current cost trend unsustainable
Healthcare Reform
• Patient Protection and Affordable Care Act
• Potential for major legislation In Massachusetts
• Accountable Care Organizations
• Bundled payments
Incentives and Penalties forPerformance
Risk Sharing • Increased medical expense risk borne by providers• Providers incentivized to keep populations healthy
Incentives for Collective Accountability
• Meaningful Use, decreased payments for readmissions, hospital acquired Infection, core measure compliance
Adapted from slide prepared by Center for Applied Research (CFAR)
Changing Landscape of Payment
Procedure Payment to provider
Episode of care
Payment to organization
Providers Facility Ancillaries
care organization
Post-discharge care

9/20/2012
2
Overview of ACO: Key Differences Between Accountable Care and Capitation
Accountable Care, Managed Care Different in Concept, Implication
Key Differences Between Capitation/Shared Savings
Patient Choice Payment Structure Value Capture
Patient joins HMO, coverage limited
Fixed PMPM payment
Provider retains all excess value
Capitation
Patients assigned to ACO are free to choose providers and sites of care
Pioneer ACO shifts to PMPM in Year 3, FFS in
Yrs 1&2
Pioneer ACO shares savings
with payer (CMS)
Key Differences between Pioneer
ACO and Capitation
Source: Advisory Board ‘Playbook for Accountable Care’, modified
to narrow subset of participating
providers
regardless of care volume
created by lowering
population cost
Invisible assignment, patient free to choose,
change providers at will
Fee for service payments plus
additional bonuses
Provider shares value from population
management successw/ payer
Shared Savings
Overview of ACO: What is an ACO? Population Management at the Heart of Shared Savings
The Medicare Shared Savings Program (MSSP or Original ACO) and Pioneer ACO models are payment models that incorporate utilization risk and require providers to engage in population management:
Shared Savings Payment
Cycle (Adapted for
Pioneer ACO)
1Assignment
Patients attributed to ACO based on terms of contracts
2
BillingProviders bill normally, receive standard fee-for-
service payments in Years 1&2. Population-based payments in Yr 3
ACO)
3
ComparisonThe targeted performance benchmark (total cost of care estimated for assigned population) is based on trending baseline expenditures using an expenditure growth rate
of a ‘matched’ national patient cohort
4Bonus/Losses
If total expenses are greater/less than targeted (dependent on quality scores), portion of
savings/losses shared by ACO
5Distribution
ACO responsible for dividing bonus payments among stakeholders
Source: Advisory Board ‘Playbook for Accountable Care’, modified
Overview of Pioneer ACO: Patient Alignment Eligibility
• Medicare FFS beneficiaries eligible for prospective alignment under Pioneer ACO are those who:
Have 12 months of Part A and Part B coverage during 3rd
alignment year (alignment year = the year before each f )
- -
performance year)Have no months of coverage under a private Medicare planHave no months of coverage in which Medicare was secondary payerAre resident in the U.S.Have at least 1 claim for a qualifying E&M service during alignment period

9/20/2012
3
Overview of Population Health Management
• Why we are doing this
• What population management means
• Who we are talking about
• Which strategies we are employing to be successful
• How you can contribute
Why we are doing this – rising costs can not be sustained
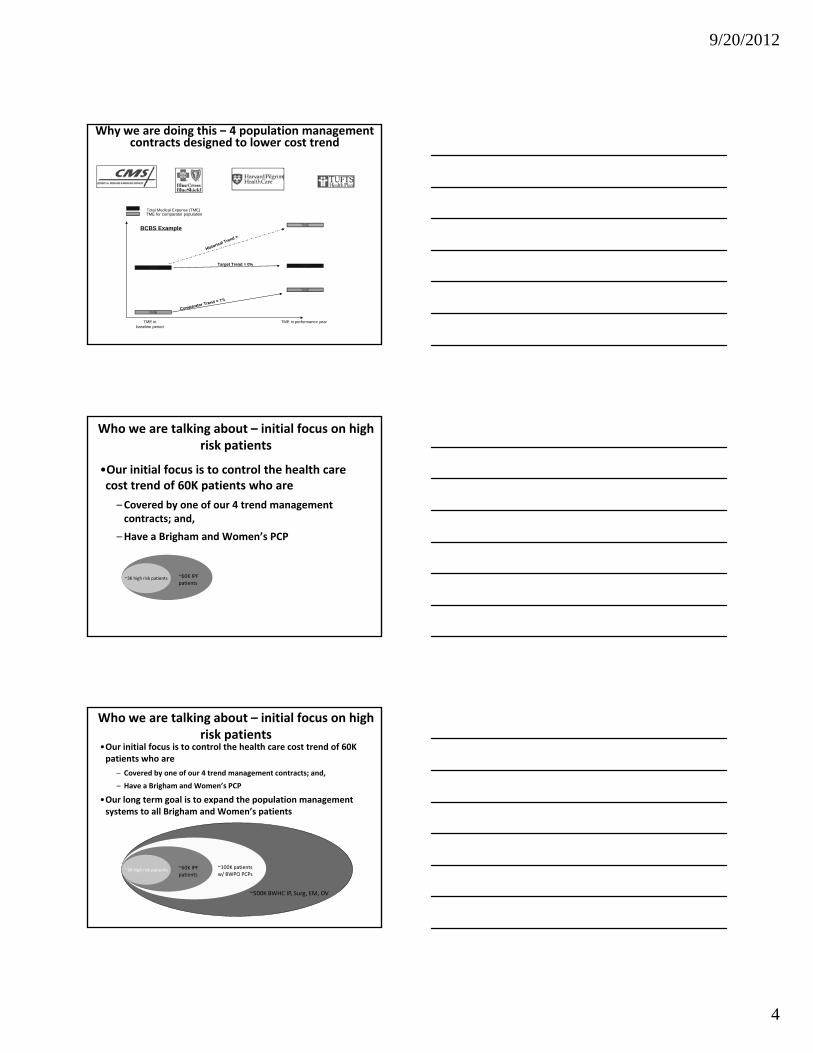
Why we are doing this – 4 population management contracts designed to lower cost
trend
9/20/2012
4
Why we are doing this – 4 population management contracts designed to lower cost trend
Total Medical Expense (TME)
TME
TME for comparator population
BCBS Example
TME in baseline period
TME
TME
TME
TME
TME in performance year
Target Trend = 0%
•Our initial focus is to control the health care cost trend of 60K patients who are
–Covered by one of our 4 trend management contracts; and,
Who we are talking about – initial focus on high risk patients
–Have a Brigham and Women’s PCP
~60K IPF patients
~3K high risk patients
•Our initial focus is to control the health care cost trend of 60K patients who are
– Covered by one of our 4 trend management contracts; and,
– Have a Brigham and Women’s PCP
•Our long term goal is to expand the population management systems to all Brigham and Women’s patients
Who we are talking about – initial focus on high risk patients
~100K patients w/ BWPO PCPs
~60K IPF patients
~3K high risk patients
~500K BWHC IP, Surg, EM, OV
9/20/2012
5
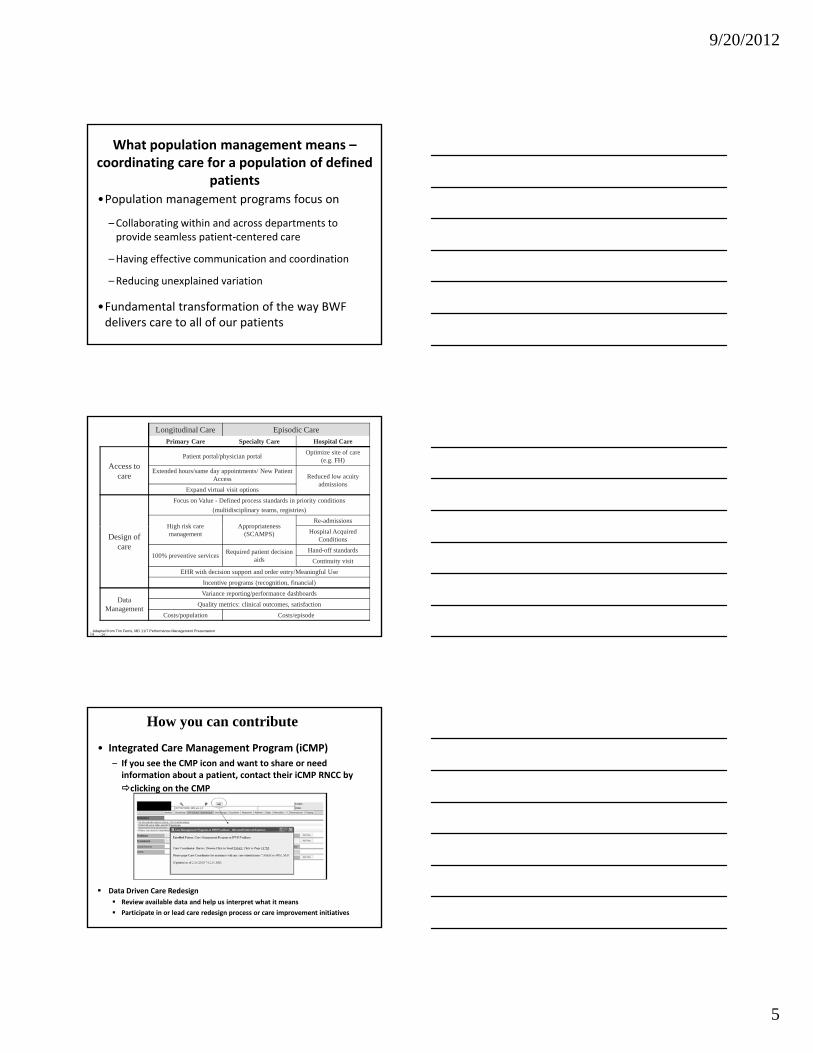
What population management means –coordinating care for a population of defined
patients•Population management programs focus on
–Collaborating within and across departments to id l ti t t dprovide seamless patient‐centered care
–Having effective communication and coordination
–Reducing unexplained variation
•Fundamental transformation of the way BWF delivers care to all of our patients
Longitudinal Care Episodic CarePrimary Care Specialty Care Hospital Care
Access to care
Patient portal/physician portal Optimize site of care (e.g. FH)
Extended hours/same day appointments/ New Patient Access Reduced low acuity
admissionsExpand virtual visit options
Focus on Value - Defined process standards in priority conditions(multidisciplinary teams, registries)
High risk care AppropriatenessRe-admissions
14 - 14 -
Design of care
High risk care management
Appropriateness (SCAMPS) Hospital Acquired
Conditions
100% preventive services Required patient decision aids
Hand-off standards
Continuity visit
EHR with decision support and order entry/Meaningful Use
Incentive programs (recognition, financial)
Data Management
Variance reporting/performance dashboards
Quality metrics: clinical outcomes, satisfaction
Costs/population Costs/episode
Adapted from Tim Ferris, MD 11/7 Performance Management Presentation
• Integrated Care Management Program (iCMP)– If you see the CMP icon and want to share or need information about a patient, contact their iCMP RNCC by clicking on the CMP
How you can contribute
Data Driven Care Redesign Review available data and help us interpret what it means
Participate in or lead care redesign process or care improvement initiatives

9/20/2012
6
Preparing for the FutureIndividually…Identify opportunities for:Costs savings StandardizationIncreased efficiency
Locally…Ensuring:The right patient in the right settingOptimal patient flowFocus on improved disease managementFocus on outcomes
Nationally…Create:Clinical pathwaysGuidelines for practice
Value Framework
Health Outcomes + Quality + Experience
C tValue =
Cost

1
Making Sense Of The Lipid “Subparticles”:
Non-HDL-C, Apo B, LDL-P, LDL size and Lp(a)
Vera Bittner, MD, MSPH, FACCProfessor of Medicine
Section Head, Preventive CardiologyDivision of Cardiovascular Disease
University of Alabama at Birmingham
Fourth Annual Contemporary Multi-Disciplinary Cardiovascular Medicine
September 28-30
Disclosures Current Research Grants:
– Sanofi: ODYSSEY
– GSK: STABILITY
– NIH/Abbott: AIM HIGH
– Roche: dal-Outcomes 1+2, ALECARDIO
– Amgen: School of Public Health Contract
Past Research Grants:– Atherogenics: ARISE
– Merck: Merck-112
– Pfizer: TNT, ILLUMINATE
Speakers’ Bureaus: None
Consultant: Pfizer, Amarin, Kowa, Liposcience
Stock Ownership: None
DSMB: Columbia University
Non-HDL-C and Apo-B

2
Two Ways of Capturing All Potentially Atherogenic Particles
Non-HDL-C = Total-C – HDL-C
VLDL VLDLR IDL LDL - Particles
Apolipoprotein B
Non-HDL-C and Apo-B Are Highly Correlated On And Off Therapy ACCESS Study (54 week, compares different statins)
N= 3,916; all had LDL>130 mg/dL, TG <400 mg/dL
Baseline: r = 0.914; On Treatment: r = 0.938
Ballantyne et al. AJC 2001;88:265–269
On Statins at Week 54
Can We Identify People With Non-HDL-C / Apo B Discordance?
Type I (mg/dl)
Type IIamg/dl)
Type IIb(mg/dl)
Type III (mg/dl)
Type IV (mg/dl)
Type V (mg/dl)
Predominant Particle CM LDL LDL + VLDL Remnant VLDL
VLDL + CM
Non-HDL-C 173 212 236 312 187 295
Apo B 48 136 153 104 118 96
Apo B/Non-HDL-CCorrelation 0.54 0.94 0.92 0.72 0.74 0.13
Data from Sniderman et al. Clin Sci 2008;114:149-155
ApoB/Non-HDL-C Correlation for normolipidemia: 0.92;Lipid values are means for this population

3
Non-HDL-C and Apo-B for Risk Prediction
Non-HDL-C and CHD Mortality
Patient level meta-analysis of 61 studies
Studies with HDL-C available included 1,496,000 py of F/U
IHD deaths: 3,020
HR (95% CI)
Prospective Studies Collaboration. Lancet 2007; 370: 1829–39
Apo B and CHD: Meta-Analysis6,320 CHD cases from 19 studies
Summary RR 1.99 (1.65-2.39) comparing top third vs. bottom third
Thompson / Danesh. J Int Med 2006;259: 481–492

4
Non-HDL-C and Apo-B Are Comparable Risk Predictors in Persons Without CVD N=91,307 (4499
cases), 22 studies
Regression stratified by sex and trial group
Adj. for age, SBP, smoking, DM, BMI
Analyses of non–HDL-C adj. for HDL-C, log TG
Analyses of apo B adj. for apo AI, log TG
Haz
ard
Rat
io
Non-HDL-C
HDL-C
Apo-B
Apo-A1
Emerging RF Collaboration. JAMA 2009;302:1993-2000
Non-HDL-C Vs. Apo-B: Which Is The Better Predictor?
Studies are heterogeneous– Apo-B is better
– Non-HDL-C is better
– Equivalent prognostic value
– Neither measure adds anything
Relative prognostic value depends on– Study design
– Patient characteristics
– Covariates
– Outcomes assessed
– Time frame of risk prediction
We need to understand better when Apo-B might provide additional prognostication
Non-HDL-C and Apo-B as Treatment Targets

5
What Are Current Treatment Goals?
Stein, Sniderman, Laskarzewski. AJC 2005;96:36K-43KBrunzell et al. Diabetes Care 2008;31:811-822
Risk Category(10 year risk)
LDL-C(mg/dL)
Non-HDL-C (mg/dL; if TG 200-500
mg/dL)
Apo B(mg/dL)
>20% <100(optional <70)
<130(optional <100)
<90(optional <80)
10-20% (>2 RF) < 130(optional <100)
<160(optional <130)
<105 or <110 (optional <90)
<10% (2+ RF) <130 <160 <105 or <110
0-1 RF <160 <190 <120 or <130
Optional goals favored by ADA/ACC Consensus Statement on Lipoprotein Management in Patients with Cardiometabolic Risk
Change in Non-HDL-C With Therapy and CHD Risk
Meta-analysis of 30 trials– 14 statin trials, 7 fibrate trials, 6 niacin trials, 1
resin trial, 1 diet trial, 1 ileal bypass trial
Study level data (not patient level)
Mean F/U 4.5 years
CHD event = nonfatal MI or CHD death– Angina and revascularization not included
1:1 relationship between mean % change in non-HDL-C and % decrease in CHD events
Robinson J et al. JACC 2009;53:316–22
Statins: Effect on Non-HDL-C and Apo B
11 statin trials
17,035 subjects
% change with therapy
Population %ileachieved
LDL-C Non-HDL-C Apo-BConcentration Achieved
99 mg/dL 127 mg/dL 102 mg/dL
%ile Achieved 21 29 55Sniderman A. J Clin Lipidol2008;2:36–42
6
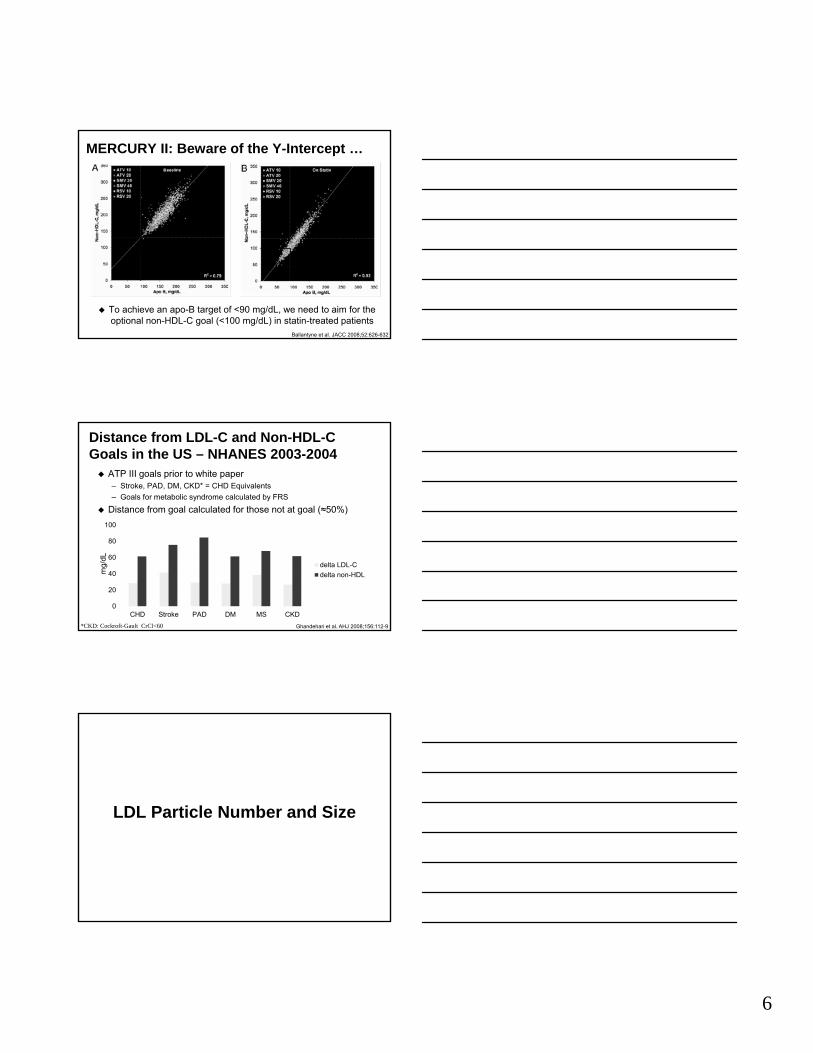
MERCURY II: Beware of the Y-Intercept …
To achieve an apo-B target of <90 mg/dL, we need to aim for the optional non-HDL-C goal (<100 mg/dL) in statin-treated patients
16 weeks of Rx
Ballantyne et al. JACC 2008;52:626-632
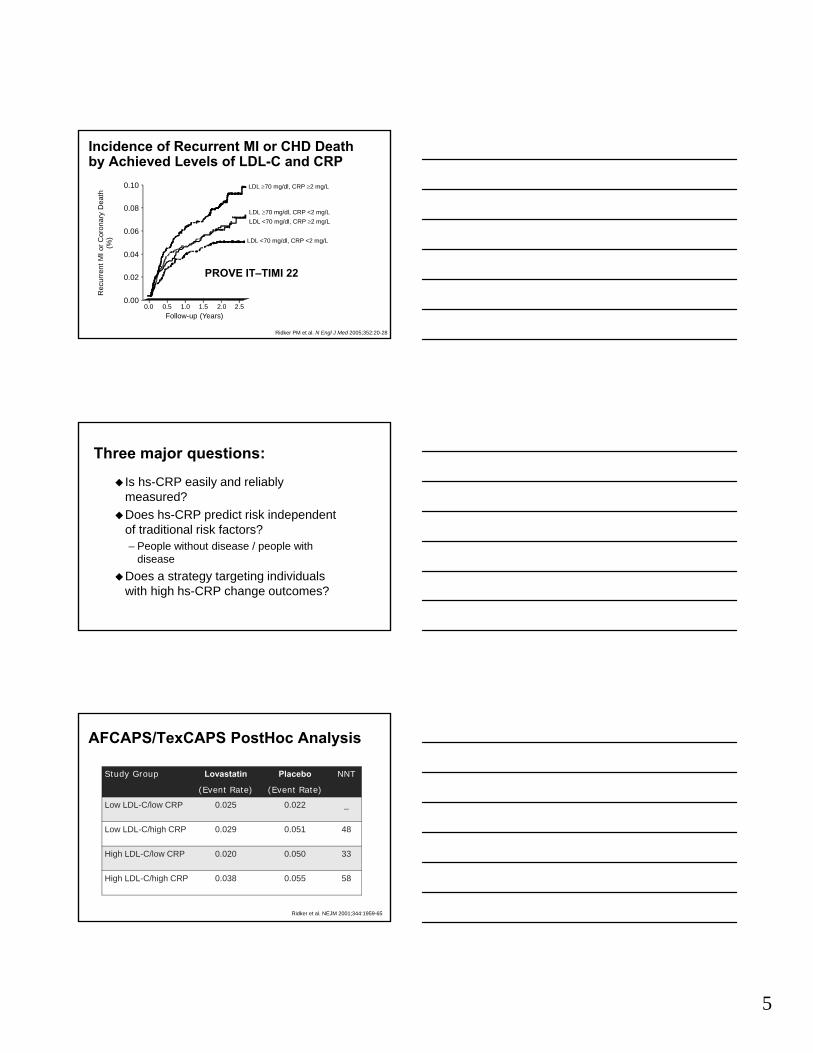
Distance from LDL-C and Non-HDL-C Goals in the US – NHANES 2003-2004
0
20
40
60
80
100
CHD Stroke PAD DM MS CKD
delta LDL-C
delta non-HDL
ATP III goals prior to white paper– Stroke, PAD, DM, CKD* = CHD Equivalents
– Goals for metabolic syndrome calculated by FRS
Distance from goal calculated for those not at goal (≈50%)
*CKD: Cockroft-Gault CrCl<60
mg/
dL
Ghandehari et al. AHJ 2008;156:112-9
LDL Particle Number and Size

7
LDL-Particles Are Heterogeneous22-29 nm in size, 1 Apo-B per particleSize of the predominant LDL particles
determines the classification– Small: 22-25.5 nm– Intermediate: 25.6-26.5 nm– Large: 26.6-28.5 nm
Two Major Subclass Patterns:– Pattern A: >25.5 nm– Pattern B: ≤25.5 nm– Some authors define a third “AB”, “C” or
“intermediate” pattern
Sacks and Campos. JCEM 2003;88:4525-4532
LDL Fractionation Is Not StandardizedMultiple clinical (GGE, VAP, NMR) and
bench methods - no gold standard
Few comparative studies, highly variable analysis methods
Correlations for size from 0.67-0.92
Concordance in identifying LDL patterns 7-94%
Comparability of methods appears to vary by type of patient population
Chung et al. Atherosclerosis 2009;205:342–348
Large LDL Are AtherogenicLarge LDL relates to atherosclerosis in non-
human primates– Rudel LL et al.. JLR 1986;27:465-474
Patients with FH have large LDL– Patsch et al. JLR 1982;23:1196–205
Normolipidemic men with CHD have large LDL– Campos et al. ATVB 1995;15:1043–8
CARE Study: large, not small LDL predicted risk in patients with MI– Campos et. Al. JAMA 2001;286:1468–74.

8
Small Dense LDL Are AtherogenicLess cholesterol per particle than larger LDL
Proposed atherogenic characteristics:– Long residence time in plasma
– ↑ Oxidizability
– ↑ Arterial proteoglycan binding
– ↑ Permeability through the endothelial barrier
Often present in patients with CHD
Often present in DM, low HDL-C / high TG, insulin resistance / metabolic syndrome
Sacks and Campos. JCEM 2003;88:4525-4532
LDL-Particles and CV riskMany studies show that
– Small LDL particle size correlates with risk
– LDL Pattern B correlates with risk
– LDL particle number correlates with risk
BUT
Size and number are interrelated which is the real correlate of risk?
Small, Dense LDL and IHD Risk in MenProspective Results From the Quebec Cardiovascular Study
LowHigh
01234567
Large SmallLDL particle size
6.2
2.1
1.0 1.0
Ris
k of
IHD
Circulation 1997;95:69-75
Apo-B as continuous variable single best predictor in multivariate model
LDL size as a continuous variable not significant after Apo-B adjustment

9
MESA: LDL and IMT N=5538, multi-
ethnic
Detailed particle analysis by NMR
Cross-sectional correlation with IMT
Inverse correlation between large and small LDL-P (r = -0.63)
Correlates of small LDL-P– LDL-C: r = 0.4
– LDL-size: r = -0.91
Correlates of large LDL-P– LDL-C: r = 0.27
– LDL-size: r = 0.87
Unadjusted analysis of LDL (per SD) vs IMT (m):– Total LDL-P: + 40.2 (p<0.001)
– Small LDL-P: + 31.7 (p<0.001)
– Large LDL-P: + 4.9 (p=NS)
Mora et al. Atherosclerosis 2007;192:211–217
920
950
980
1010
1040
Q1 Q2 Q3 Q4 Q5
Large LDL-P Quintiles
Ptrend = 0.94 Ptrend <0.001
Adj. for age, sex Adj. for age,sex, small LDL-P
IMT
(m
icro
ns)
MESA: Large + Small LDL-P Correlate With IMT
Mora et al. Atherosclerosis 2007;192:211–217
Mutually Adjusted
∆ IMT (m) per SD in LDL-P
Small: +39.1
Large: +42.9
VA-HIT: LDL-P and CHD Events
OR 95% CI p OR 95% CI p
Univariate
Total LDL-P 1.2 1.05-1.37 0.0006 1.28 1.12-1.47 0.0003
Small LDL-P 1.11 0.98-1.27 NS 1.17 1.02-1.34 0.03
Large LDL-P 1.08 0.95-1.23 NS 1.06 0.93-1.22 NS
Multivariate
Small LDL-P 1.44 1.20-1.73 <0.0001 1.41 1.14-1.73 0.001
Large LDL-P 1.31 1.09-1.57 0.003 1.34 1.11-1.62 0.002
Otvos et al. Circulation 2006;113:1556-63
Baseline On Trial
OR per SD of LDL-PCo-variates: treatment group, age, HTN, smoking, BMI, and DM.

10
Conclusions
There is lipoprotein-related risk beyond LDL-C
Assess this risk by estimating the number of atherogenic particles– Non-HDL-C
– Apo B
– LDL-P
None of the 3 clearly superior to the others for risk prediction; may be complementary
All 3 need to be validated as treatment targets
Lipoprotein (a)
Lp(a) Structure
Homologous to Protease Region of Plasminogen
Homologous to Kringle 5 of Plasminogen
LDL Particle
10 Different Types of PlasminogenKringle 4-like Repeats
2 to >40 Copies of Kringle 4 Type 2 Domain (varies by apo(a) Isoform)
Disulfide Bond
Apo B 100

11
Lp(a) Population Distribution
Genetically determined
Skewed distribution
Marked ethnic variation in Lp(a) concentration and (a) isoforms
50 mg/dL = 80th %ile(in Whites)
Concentration: Median(mg/dL)
IQ Range (mg/dL)
Non-Hispanic Whites
12 5-32
Chinese 11 4-22
Japanese 13 5-26
Hispanics 19 8-43
Blacks 39 19-69
Nordestgaard BG et al. EHJ Oct 21, 2010: doi:10.1093/eurheartj/ehq386
Lp(a) – Measurement (NHLBI) It is essential that Lp(a) assays used in clinical and
epidemiologic studies be validated for their ability to provide accurate values independently of the size of apo(a) in the samples.
The expression of Lp(a) values in terms of total Lp(a) mass (mg/dL) should be abandoned as this reflects protein component of Lp(a) and not its lipid and carbohydrate content.
To correctly reflect the number of Lp(a) particles and to compare data from different studies, the values should be expressed in terms of nmol/L of Lp(a).
Marcovina SM, et al. Clin Chem 2003;49:1785-1796
Emerging RF Collaboration N= 126,634 in 36
prospective studies
1.3 million py F/U
9336 incident CHD events
1903 ischemic strokes
8114 non-vascular deaths
Adj. for age, sex, SBP, smoking, DM, BMI and TC
JAMA 2009;302:412-423
Nonfatal MI and CHD Death Ischemic Stroke Nonvascular Death
Per SD: RR 1.13 (1.09-1.18) Per SD: RR 1.10 (1.02-1.18)
SD = 3.5 fold higher level

12
Lp(a) Risk Modulated by LDL-C RxFATS Posthoc Analysis
Black Bars: ≤10% LDL-C Reduction; Gray Bars: >10% LDL-C Reduction
Maher et al. JAMA 1995;274:1771-1774
Current GuidelinesATP III: Consider more aggressive LDL-C target in
individuals with high Lp(a)– ATP III Guidelines 2001
NHLBI: screen individuals at intermediate risk; no specific treatment recommendations– Clin Chem 2003;49:1785-1796
USPSTF: Insufficient data– Annals IM 2009;151:474-482 and 496-507
EAS: screen intermediate and high risk patients and treat those with high levels (Niacin, possibly apheresis)– European Heart Journal (2011) 32, 1769–1818

9/20/2012
1
Approach to the Patient with a Family History of
Premature CVD
Patrick T. O’Gara, MDBrigham and Women’s Hospital
Harvard Medical School
No Disclosures
Prevention• Primordial
Prevent the development of risk factors
• PrimaryPrevent 1st occurrence of clinical event in persons at risk
• SecondaryPrevent recurrent events in patients with manifest disease
Ideal CV Health
Health Behaviors Health Factors• Non-smoking ● TC < 200• BMI < 25 BP < 120/80• BMI < 25 ● BP < 120/80• Physical activity ● FBS < 100• Diet

9/20/2012
2
Attributes of Ideal CV Health• Smoking never/quit > 12 mos 73• BMI < 25 kg/m2 33• Physical act > 150 min/week 45 • Healthy diet 4 5 comp’nts < 0 5
Prevalence (%)
• Healthy diet 4-5 comp nts < 0.5• T Chol < 200 mg/dL 45• BP < 120/80 42• FBS < 100 mg/dL 58
Prevalence of Ideal CV Health in US Populations ~ 5%
Lifetime Risk of CV DeathMen, Age 55
Berry JD et al. NEJM 2012; 366:321-9
Lifetime Risk of CV DeathWomen, Age 55
Berry JD et al. NEJM 2012; 366:321-9

9/20/2012
3
Prevalence of Conventional Risk Factors in Patients with Coronary Heart Disease (N = 87,869)
19.4 %
8.9 %
4 Risk Factors(< 1 %)
No Risk Factors
3 Risk FactorsSmokingHTNCholesterolDM
43.0 %
27.8 %
1 Risk Factor
2 Risk Factors 62.4 %
Khot U et al, JAMA 2003;290:898-904
Lipoprotein(a)
Homocysteine
IL-6
TC
LDLC
sICAM-1
Risk Factors for Future Cardiovascular Events: WHS
8
0 1.0 2.0 4.0 6.0
SAA
Apo B
TC: HDLC
hs-CRP
hs-CRP + TC: HDLC
Relative Risk of Future Cardiovascular Events
Ridker et al, N Engl J Med 2000;342:836-43
25.0
30.0
Moving Toward an hs-CRP Modified Framingham Risk Score
ngha
m R
isk
ngha
m R
isk
9
0.0
5.0
10.0
15.0
20.0
10-20 5-10 <5 <0.50.5-1.0
1.0-3.03.0-10.0
>10.0
Calculated Framingham 10Calculated Framingham 10--Year RiskYear Risk
Ridker PM, Wilson PWF, Grundy SM. Circulation 2004;109:2818-2925
CR
P M
odifi
ed F
ram
inC
RP
Mod
ified
Fra
min

9/20/2012
4
Age-adjusted prevalence (%) of CAC ≥100 by FH of premature CHD category and increasing number of risk factors.
Nasir K et al. Circulation 2004;110:2150-2156
Prevalence (%) of age-, gender-, and race-adjusted CAC ≥75th percentile according to FamHx of premature CHD among ethnic groups in individuals classified as low-to-intermediate risk
by FRS.
Nasir K et al. Circulation 2007;116:619-626
Lifetime Risk of CV Death for Men at 55
Bachmann J M et al. Circulation 2012;125:3092-3098

9/20/2012
5
Lifetime Risk of CV Death for Men at 45
Bachmann J M et al. Circulation 2012;125:3092-3098
Figure 1
Y Chromosome Haplogroups
Lancet 2012; 379:915-22
Figure 2
Haplogroup IDifferential Expression
Lancet 2012; 379:915-22

9/20/2012
6
Reynolds Risk CalculatorGenderAgeDo you currently smoke? Systolic Blood Pressure (SBP) mm/HgTotal Cholesterol mg/DL (or) mmol/LHDL Cholesterol mg/DL (or) mmol/L High Sensitivity C-Reactive Protein (hsCRP) mg/LDid your Mother or Father have a heart attack
before age 60 ?YesNo

1
CRP: When and Why?
Vera Bittner, MD, MSPH, FACCProfessor of Medicine
Section Head, Preventive CardiologyDivision of Cardiovascular Disease
University of Alabama at Birmingham
Fourth Annual Contemporary Multi-Disciplinary Cardiovascular Medicine
September 28-30
Disclosures related to this presentation:
I was part of the “NLA Expert Panel” that I will cite later in the talk.
Mora S, Ridker PM. AJC 2006;97(2A) (www.AJConline.org)
CRP-triggered oxidation of LDL cholesterol
CRP-induced PAI-1 expression stabilizes PAI-1 mRNA
CRP attenuates NO production, decreases eNOS
expression
CRP-induced production of cell adhesion molecules MCP-1, ET-1
CRP-mediated LDL uptake by macrophages
CRP localization in atherosclerotic but not normal intima
CRP-induced complement activation
CRP-dependent monocyte recruitment into arterial
wall
CRP-induced production of tissue factor in monocytes
CRP-based blunting of endothelial vasoreactivity
Is CRP a Risk Marker or a Risk Factor?

2
Three major questions:
Is hs-CRP easily and reliably measured?
Does it predict risk independent of traditional risk factors?– People without disease / people with
diseaseDoes a strategy targeting individuals
with high hs-CRP change outcomes?
Measurement: Classification Accuracy is Similar for CRP and Total Cholesterol
N=113 with multiple TC and CRP measurements
CRP and cholesterol divided into 4 ranges
Agreement between measurements assessed
Ockene et al. Clin Chem 2001;47:444-450
Patient Characteristics / Conditions Associated With ↑ or ↓ hs-CRP
Pearson et al. CDC/AHA guidelines. Circulation 2003;107:499-511

3
Three major questions:
Is hs-CRP easily and reliably measured?
Does hs-CRP predict risk independent of traditional risk factors?– People without disease / people with
diseaseDoes a strategy targeting individuals
with high hs-CRP change outcomes?
< 1.0
1.0-3.0
> 3.0
0
5
10
15
20
25
10+ 5-9 2-4 0-1
11
5.53.1
1
21
11
3.31.8
22
14
5.7
2.5
hs-CRP(mg/L)
Framingham 10-Year Risk (%)
Ridker PM et al. N Engl J Med 2002;347:1557-1565
Women’s Health Study: CRP Adds Prognostic Information To The FRS
F/U: 8 years; Outcome: CV events
ERFC: CRP Predicts Incident CHD
Adj. for age, sex, study, SBP, smoking, DM, BMI, log TG, non-HDL-C, HDL-C, alcoholAdj. for age, sex, study
The Emerging Risk Factors Collaboration. Lancet 2009;374 (published online Dec 2009)

4
ERFC: CRP vs Traditional RF
Risk per SD usual value for ln CRP, SBP, TC, non-HDL-C (mutually adjusted)
The Emerging Risk Factors Collaboration. Lancet 2010;374 (Web Appendix)
CRP Change with Treatment and Progression of CAD by IVUS
REVERSAL StudyN=502RCT of 40 mg prava
vs 80 mg atorva
Nissen et al NEJM 2005;352:29-38
REVERSAL: Joint Effects of LDL-C and CRP change on Atheroma Volume
-4
-2
0
2
4
6
8
LDL-C & CRP>median
LDL-C <median,CRP>median
LDL-C>median,CRP<median
LDL-C & CRP<median
Total Atheroma Volume
Nissen et al NEJM 2005;352:29-38
5
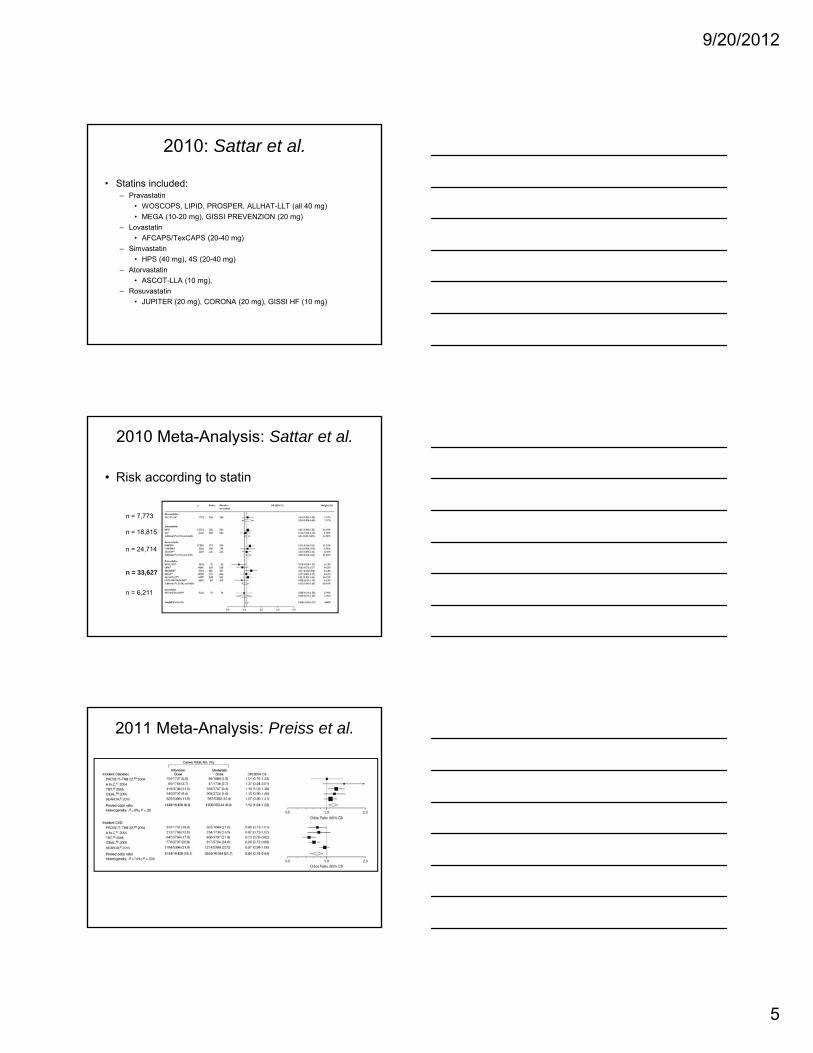
Ridker PM et al. N Engl J Med 2005;352:20-28
Incidence of Recurrent MI or CHD Death by Achieved Levels of LDL-C and CRP
Rec
urre
nt M
I or C
oron
ary
Dea
th(%
)
Follow-up (Years)0.0 0.5 1.0 1.5 2.0 2.5
LDL 70 mg/dl, CRP 2 mg/L
LDL 70 mg/dl, CRP <2 mg/LLDL <70 mg/dl, CRP 2 mg/L
LDL <70 mg/dl, CRP <2 mg/L
0.00
0.02
0.04
0.06
0.08
0.10
PROVE IT–TIMI 22
Three major questions:
Is hs-CRP easily and reliably measured?
Does hs-CRP predict risk independent of traditional risk factors?– People without disease / people with
diseaseDoes a strategy targeting individuals
with high hs-CRP change outcomes?
AFCAPS/TexCAPS PostHoc Analysis
Study Group Lovastatin
(Event Rate)
Placebo
(Event Rate)
NNT
Low LDL-C/low CRP 0.025 0.022 _
Low LDL-C/high CRP 0.029 0.051 48
High LDL-C/low CRP 0.020 0.050 33
High LDL-C/high CRP 0.038 0.055 58
Ridker et al. NEJM 2001;344:1959-65

6
Jupiter Trial Design
Rosuvastatin (N = 8901)
Placebo (N = 8901)4-week Run-in
• No History of CAD• Men > 55 • Women > 65 • LDL-C < 130 mg/dL• CRP > 2 mg/L
• Primary EP: First CVD Event
• MI • Stroke• Unstable Angina • CVD • Death• CABG/PTCA
End of Study Visit
Biannual Follow-up Visits
Safety Visit
Randomization Visit
Screening Visit
CRPLFT
HbA1c
LipidsCRP
HbA1c
LipidsCRPLFTs
LipidsCRP
Ridker PM. N Engl J Med. 2003;108:2292-7.
Endpoints
Primary End Point: First Major Cardiovascular Event
No. at Risk
Rosuvastatin 8901 8631 8412 6540 3893 1958 1353 983 538 157
Placebo 8901 8621 8353 6508 3872 1963 1333 955 531 174
Cu
mu
lati
ve I
nci
den
ce
0.08
0.06
0.04
0.02
0.000 1 2 3 4
Years
Placebo
Rosuvastatin
p < 0.00001
Ridker PM et al. N Engl J Med. 2008;359:2195-207.
HR 0.56, 95% CI 0.46-0.69P < 0.00001
- 44 %
Jupiter Subgroups (1o EP)
0.25 0.5 1.0 2.0 4.0
Rosuvastatin Superior Rosuvastatin Inferior
Women
Age > 70
Framingham Risk < 10 %
Black, Hispanic, Other
LDLC < 100 mg/dL
No Hypertension
All Participants
N HR (95%CI)
6,801 0.54 (0.37-0.80)
5,695 0.61 (0.46-0.82)
8,882 0.56 (0.38-0.83)
5,117 0.63 (0.41-0.98)
6,269 0.66 (0.47-0.92)
7,586 0.62 (0.44-0.87)
17,802 0.56 (0.46-0.69)
BMI < 25 mg/m2 4,073 0.59 (0.40-0.87)
No metabolic Syndrome 10,296 0.49 (0.37-0.65)
Elevated hsCRP Only 6,375 0.63 (0.44-0.92)
Understudied Subgroups
“Low Risk” Subgroups

7
ACCF/AHA 2010: Measurement of hs-CRP
JACC 2010;56;2182-2199

8
NLA Recommendations
Initial Clinical AssessmentOn Treatment Management
Decisions
Journal of Clinical Lipidology 2011;5:338–367

9/18/2012
1
HDL: Should We AIM‐High or Not?or Not?
Robert A. Vogel, M.D., F.A.C.C.
Clinical Professor of Medicine
University of Colorado
Disclosures: None
Castelli WP, et al, JAMA 1986;256:2835
Framingham Heart Study: 4-Year CHD Risk in Men 50-70 Years Old by LDL-C and HDL-C
2
2.5
3
HDL-CRis
k
0
0.5
1
1.5
2
100 160 220
25456585
LDL-C
Rel
ativ
e C
HD
R
Barter P et al, NEJM 2007;356:1301
Cardiovascular Events in the TNT Trial by LDL and HDL Cholesterol
8%
10%
12%
E
0%
2%
4%
6%
LDL <70 LDL 70‐100 LDL >100
HDL <38HDL 38‐42HDL 43‐47HDL 48‐54HDL >54
Major CVE

9/18/2012
2
0 8
0.9
1
1.1
Voight BF et al, Lancet 2012
Genes Associated with Increased HDL‐C and Risk of MI in 20 Studies (N=116,303)
MI
Per 1mmol ↑HDL‐C
0.4
0.5
0.6
0.7
0.8
LIPG 396Ser 14 Common SNPs
Predicted
ObservedHR for
Endothelial lipase
Mackey RH et al, J Am Coll Cardiol 2012
MESA Study: Correlation of CHD Risk with HDL Particle Concentration (N=5598, 45‐84 yrs)
0.6
0.8
1
RF Corrected
0
0.2
0.4
HDL Cholesterol
HDL Particle Conc
LDL/HDL Particle Conc Correction
Virani SS et al (ACC 3/11)
Discrimination of Lipid + Other Parameters for Carotid Plaque in 1005 Retired NFL
Players
Rat
io 1.5
2
2.5P =NS P <0.05
P = NS
Odd
s R
0
0.5
1
LDL‐C
Non‐HDL‐C
LDL‐P
HDL‐C
HDL‐P CR
P
PLAC2
P = NS

9/18/2012
3
ApoA-I Milano: mean HDL-C = 17 mg/dl, CHD risk = 0%
Nissen SE et al, JAMA 2003;290:2292
Effect of 5 Weekly Infusions of ApoA-I Milano on IVUS Plaque Volume in 47 ACS Subjects
‐4%
‐2%
0%
‐6%Placebo Low Dose High Dose
Antiatherogenic Properties of HDL• Reverse cholesterol transport
• Prolongs half-life of prostacyclin (PGI2)
• Protects LDL-C from oxidation (some HDL)( )
• Decreases endothelial expression of cell adhesion molecules in response to cytokines (some HDL)
• Antithrombotic (some HDL)
Xia et al. J Biol Chem. 1999;274:33143-33147. Pirich, et al. Thromb Res 1997;88:41-49.

9/18/2012
4
Lifestyle Means for Increasing Lifestyle Means for Increasing HDLHDL--CC
Metaanalysis of 42 Trials• Alcohol (5-15%)
• Exercise (5-10%, 2 drinks per day = 10 miles jogged/week
• Weight loss (0.35mg/dl per ↓1kg)
Rimm EB, BMJ 1999;319:1523
• Tobacco cessation (4 mg/dl)
• MUFA
• Stopping androgen and progesterone
Metaanalysis of CHD Mortality in Fibrate Trials
HHS
VAHIT
BIP
DIASDIAS
LEADER
FIELD
Total
0.2 0.5 1 2 3Hazard Ratio
0.96
ACCORD Trial in High‐Risk Subjects with Type 2 Diabetes Mellitus
IntensiveGlycemicControl
5128
Lipid BP
Placebo Fibrate Intensive Standard
1383 1374 11931178Control
StandardGlycemicControl
5123
237123622753 2765
13911370 11781184
10,251
47335518

9/18/2012
5
ACCORD Trial in High‐Risk Subjects with Type 2 Diabetes Mellitus: Fenofibrate vs. Placebo
Comparison of ACCORD subgroup results with those from prior fibrate studies
Trial(Drug)
Primary Endpoint: Entire Cohort (P‐value)
Lipid Subgroup Criterion
Primary Endpoint: Subgroup
HHS (Gemfibrozil)‐34% (0.02)
TG > 200 mg/dlLDL‐C/HDL‐C > 5.0
‐71%5.0
BIP (Bezafibrate) ‐7.3% (0.24)
TG > 200 mg/dl‐39.5%
FIELD(Fenofibrate) ‐11% (0.16)
TG > 204 mg/dlHDL‐C < 42 mg/dl ‐27%
ACCORD(Fenofibrate) ‐8% (0.32)
TG > 204 mg/dlHDL‐C < 34 mg/dl ‐31%
Brown BG, et al. NEJM 2001;345:1583
HDL Atherosclerosis Treatment Study (HATS):Effect of Simvastatin + Niacin in 160 Subjects with Low
HDL
81012
Placebo
Simva/NiacinP<0.03
‐20246
HDL‐C %DS CVE's
Simva/Niacin
P<0.01
Δ Δ(mg/dl) (Death, MI, CVA, Revasc)
P<0.001

9/18/2012
6
NEJM 2011;365:2255
AIM‐HIGH Study: Niacin 1.5‐2.0g in 3414 Subjects with CHD and LDL‐C 40‐80 mg/dl
10%
15%
20%
25%
-20%
-15%
-10%
-5%
0%
5%
LDL-C HDL-C TG MACE
HDL and Reverse Cholesterol Transport
Nascent HDL HDL3 HDL2a HDL2b
A-I PL C A-I C PLCE A-II
LCAT LCAT A-I C PL
CE CE CE
A-I C PLCE CE CECE CE CE
LCAT
TG
Liver
Intestine
Extrahepatic
TissueABCA1
ABCG1
CETP
B/E Particle UptakeSR-B1
Liver
Chylo VLDL VLDL
LDLCE
TG
ILLUMINATE Study: Torcetrapib + Atorva vs. Atorva in 15,067 Subjects with CHD
(18 months of planned 5‐year study)
40%
60%
80%
ffect
‐40%
‐20%
0%
20%
40%
LDL HDL SBP CVE Death
Treatm
ent E
f

9/18/2012
7
Bhatt DL et al, AHA 11/10
DEFINE Trial: Anacetrapib (100mg) vs. Placebo in 1625 Subjects (55% prior CHD) over 76 Weeks
ange
(%) BUT: Dal‐Outcomes trial was
(‐) and showed no correlation between HDL‐C and CV risk
Rel
ativ
e C
h
P = 0.4 P = 0.048
Ballantyne CM et al, Circulation 1999;99:736
Effect of Statin Therapy on Coronary Events Depending upon Initial HDL‐C Level
25%
30%
35%
Statin
Pl b
0%
5%
10%
15%
20%
4S WOSCOPS AFCAPS
Placebo
HDL>51 HDL<39
HDL>42 HDL<42
HDL>39 HDL<35
CVE
Investigational HDL Agents
• ApoA-1 Milano• ApoA-1-mimetic peptides• Trimeric ApoA-1• HDL delipidation• Other CETP inhibitors• L-4F, D-4F peptides (4-Φala peptides)• Phospholipid mimetics

NOTES—

9/20/2012
1
Statins and Making Sense of the New FDA Labeling
Patrick T. O’Gara, MDBrigham and Women’s Hospital
Harvard Medical School
No Disclosures
• FDA announced safety label change for statin medications raising concerns for:
• Cognitive impairmentg p• Increase blood sugar and hemoglobin
A1c (HbA1c)*
• Drug interactions (lovastatin specific)
*Does not include pravastatin
http://www.fda.gov/Drugs/DrugSafety/ucm293101.htm 2
OVERALL SURVIVAL
atie
n ts
aliv
e
100
95Simvastatin
30%Placebo
4S: Total Mortality/Overall Survival 4S: Total Mortality/Overall Survival
ents
aliv
e
Adapted from Scandinavian Simvastatin Survival Study Group Lancet1994;344:1383-1389.
%of
pa 90
85
00 1 2 3 4 5 6
Years since randomization
30%risk reduction
P=0.0003
More people quit the placebo
than the statin
% p
atie

9/20/2012
2
Statins Reduce All-Cause Death: Meta-Analysis of 14 Trials
Cause of death
3.4 0.81
0.910.950 93
Vascular causes:
StrokeOther vascular
Any non CHD vascular
0.60.61 2 1 3
0.70.6
4.4
Events (%)Treatment
(n = 45,054)Control
(n = 45,002) Treatment better
Controlbetter
CHD
Cholesterol Treatment Trialists’ Collaboration
0.93
Any vascular
Any non-CHD vascular 1.2
4.7
2.40.20.11.13.8
8.5 9.7
4.01.20.10.32.4
5.7
1.3
Nonvascular causes:Cancer
Respiratory
0.83
1.010.820.890.870.95
0.88
TraumaOther/unknown
Any nonvascular
Any death
1.51.00.5
CTT Collaborators. Lancet. 2005;366:1267-1278.
Relative risk
All-Cause Death or Major CV Events in All Randomized Subjects
%
PravastatinPravastatin 40mg40mg(26.3%)(26.3%)
3030
2525
2020
00 33 1818 2121 2424 2727 303066 99 1212 1515
% with
Event
Months of Follow-up
AtorvastatinAtorvastatin 80mg80mg(22.4%)(22.4%)
16% RR16% RR(P = 0.005)(P = 0.005)
1515
1010
55
00
Cannon CP et al. NEJM 2004Cannon CP et al. NEJM 2004
2008: JUPITER
• Largest primary prevention trial to date– n = 17,802 men & women – Inclusion criteria
• no evidence CVDDM• no DM
• LDL <130 mg/dL• hs-CRP ≥2.0 mg/L
– Rosuvastatin 20 mg daily vs. placebo– Dx DM: physician report
Ridker, P.M. et al. N. Engl. J. Med. 359, 2195–2207 (2008). 6
9/20/2012
3
JUPITERPrimary Trial Endpoint : MI, Stroke, UA/Revascularization, CV Death
Placebo 251 / 8901HR 0.56, 95% CI 0.46-0.69
P < 0.00001
- 44 %0.06
0.08
ence
Ridker et al NEJM 2008
Rosuvastatin 142 / 8901
0 1 2 3 40.00
0.02
0.04
Cum
ulat
ive
Inci
de
Follow-up (years)
Incident Diabetes in Jupiter
Ridker PM et al. Lancet 2012
Incident Diabetes in Jupiter
Ridker PM et al. Lancet 2012

9/20/2012
4
JUPITER: Outcomes
Ridker PM et al Lancet 2012
2008: JUPITER
• Increase in physician-reported new-onset diabetes by 26% over median of 1.9y– Rosuvastatin, n = 270 (3.0%)– Placebo n = 216 (2 4%)Placebo, n = 216 (2.4%)– OR 1.26 (95% CI 1.04-1.51)
11
2010 Meta-Analysis: Sattar et al.
• Statins associated with 9% increase in DM (95% CI 2-17%; I2 =11%)
Sattar, N. et al. Lancet 375, 735–742 (2010). 12
9/20/2012
5
2010: Sattar et al.
• Statins included:– Pravastatin
• WOSCOPS, LIPID, PROSPER, ALLHAT-LLT (all 40 mg)• MEGA (10-20 mg), GISSI PREVENZION (20 mg)
– Lovastatin• AFCAPS/TexCAPS (20-40 mg)
– Simvastatin• HPS (40 mg), 4S (20-40 mg)
– Atorvastatin• ASCOT-LLA (10 mg),
– Rosuvastatin• JUPITER (20 mg), CORONA (20 mg), GISSI HF (10 mg)
13
2010 Meta-Analysis: Sattar et al.
• Risk according to statin
n = 7,773
Sattar, N. et al. Lancet 375, 735–742 (2010). 14
n = 18,815
n = 24,714
n = 33,627
n = 6,211
2011 Meta-Analysis: Preiss et al.
Preiss, D. et al. JAMA 305, 2556–2564 (2011). 15

9/20/2012
6
2011: Preiss et al.
• Risks vs. benefits of intensive-dose therapy (compared with moderate-dose)– NNH
• DM = 498– NNT
• All CV events = 155• CV death = 1087• Non-fatal MI = 578• Non-fatal stroke = 1538• Revascularizations = 171
16
2011: Waters et al.
• Risk of new-onset DM increases with risk factors• Patients with metabolic syndrome most at risk for DM
while on statin
Waters, D.D. et al. J. Am. Coll. Cardiol. 57, 1535–1545 (2011). 17
Benefits of Statins
• Primary prevention– Reduction in total mortality, 12-17%– Reduction in CVD morbidity
• Coronary events 30%• Coronary events, ~30%• Strokes, ~20%• Revascularizations, ~33%
– Emphasis on high-risk patients
Minder, C.M. et al. Arch. Intern. Med. 171, 1593–1594 (2011).National Cholesterol Education Program (NCEP) Expert Panel on Detection, Evaluation, and Treatment of High Blood Cholesterol in Adults (Adult Treatment Panel III) Circulation 106, 3143–3421 (2002).
18

9/20/2012
7
Take Home Message
• Statins are associated with new-onset DM, but are not a proven cause of DM
B fit f t ti ti t t i h• Benefits of statins continue to outweigh risks in properly selected, high-risk primary and secondary prevention populations
19

NOTES—

9/18/2012
1
What’s New in Hypertension:JNC‐8
Robert A. Vogel, M.D., F.A.C.C.li i l f f di iClinical Professor of MedicineUniversity of ColoradoDenver, Colorado, USA
Disclosures: None
How Should BP be Measured?
• Office, home, or ABPM?• What does BP variability mean?• Importance of SBP vs. DBP
Mansoor et al. J Hum Hypertens 1996;10:87
White‐Coat Hypertensive Response with Age

9/18/2012
2
240
200
160
Ambulatory BP in a 78 y.o. man
190/90re (m
mHg)
120
80
40
012:00 15:00 18:00 21:00 24:00 03:00 6:00 0 9:00
12:00TIME
150/80 No dipping
105/60
190/90
Bloo
d Pressu
SBP DBP
Dolan E,et al. HYPERTENSION 2005;46:156
Adjusted 5‐ year Risk of CV Death in 5292 Patients by Clinic and Ambulatory SBP
Rothwell, PM et al. Lancet 2011; 377:1681
The Relation Between Visit‐to‐Visit Variability in Systolic Blood Pressure and Risk of Subsequent Stroke in the UK‐TIA Trial

9/18/2012
3
Mortality Risk with Systolic Pressure at Fixed Diastolic Pressure
180/68
Staessen et al; Lancet, 2000
180/92
What are the BP Goals?
• Most patients: <140/90 (JNC 7, VA‐DoD)
• Diabetes: <130/80 (JNC 7)
<140/80 (VA DoD)<140/80 (VA‐DoD)
• CKD: <130/80 (JNC 7) <140/90 (VA‐DoD)
• CVD: <130/80 (AHA)
Vasan RS et al, NEJM 2001;345:1291
10‐Year CVEs in 6859 Framingham Heart Study Subjects Initially Free of HTN and CVD
130‐140 mmHg <120‐130 mmHg <120 mmHg

9/18/2012
4
Outcome Tight control (<130mmHg)
Usual control (130‐140 mmHg)
Uncontrolled (>140mmHg)
Death MI or stroke 12 7% 12 6% 19 8%
INVEST: Blood Pressure Control in 6400 Subjects with Type 2 Diabetes Mellitus
Death, MI, or stroke (primary end point)
12.7% 12.6% 19.8%
All‐cause mortality* 11.0% 10.2% 15.4%
Cooper‐DeHoff RM et al. JAMA 2010; 304:61‐68.
* Extended follow‐up: risk of all‐cause mortality was slightly higher in the tight‐control group vs. the usual‐control group (22.8% vs. 21.8%; adjusted HR 1.15; 95% CI 1.01‐1.32).
Systolic Blood Pressure (mmHg)
Incide
nce of Primary
Outcome (%
)
Diastolic Blood Pressure (mmHg)
Incide
nce of Primary
Outcome (%
)
Messerli F: Lower is better for the brain, kidney, and retina but not for the heart
Denardo SJ, et al. Am J Med 2010; 123:719
Death, MI or Stroke in 22, 576 Treated Hypertensives with CHD, age > 50 (INVEST Trial)

9/18/2012
5
How Should HTN be Treated?
JNC 7: Treatment Overview
Messerli F et al, JACC
Metaanalysis Antihypertensive Tx
‐6
‐4
‐2
0HCTZ ACE‐I ARB BB CCB
mHg)
‐16
‐14
‐12
‐10
‐8
6
SBP
DBP
Chan
ge BP (m
m
9/18/2012
6
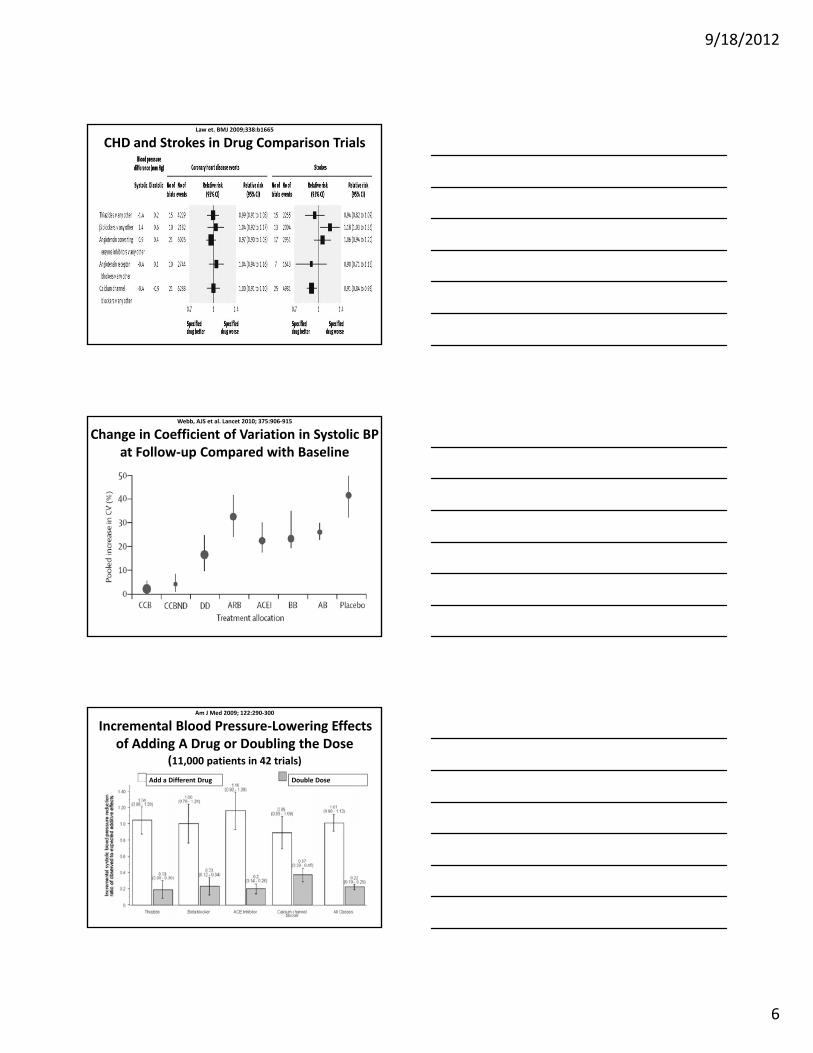
Law et. BMJ 2009;338:b1665
CHD and Strokes in Drug Comparison Trials
Webb, AJS et al. Lancet 2010; 375:906‐915
Change in Coefficient of Variation in Systolic BP at Follow‐up Compared with Baseline
Am J Med 2009; 122:290‐300
Incremental Blood Pressure‐Lowering Effects of Adding A Drug or Doubling the Dose
(11,000 patients in 42 trials) Add a Different Drug Double Dose

9/18/2012
7
NICE /BHS HTN Guidelines
SBP
Step 1: 140‐160 ACE /ARB (<55y); CCB or Diur (>55y)
St 2 >160 ACE/ARB+CCB CCB+DiStep 2: >160 ACE/ARB+CCB or CCB+Diur
Step 3: ACE/ARB+CCB+Diur
Step 4: add: α‐B, BB, hydral, clon, minox
w/u: HTN, NSAIDS, OSA, renovasc

NOTES—

1
Physical Activity in the Primary Prevention of CVD
Vera Bittner, MD, MSPH, FACCProfessor of Medicine
Section Head, Preventive CardiologyDivision of Cardiovascular Disease
University of Alabama at Birmingham
Fourth Annual Contemporary Multi-Disciplinary Cardiovascular Medicine
September 28-30
Disclosures related to this presentation: None
Outline
Physical activity and inactivity in the US
Observational data linking PA to CVD
Change in PA / Fitness and Outcomes
What can physicians / health care providers do?

2
Eating alone will not keep a man well; he must also take exercise….
And it is necessary, … to proportion exercise to bulk of food, to the constitution of the patient, to the age of the individual, to the season of the year, to the changes in the winds, (and) to the situation of the region in which the patient resides, ...
Hippocrates, 400 B.C.
Definitions Physical activity: A behavior that is any bodily movement
produced by the contraction of skeletal muscles that substantially increases energy expenditure.– Measurement difficult– Generally ascertained by self-report in large prospective studies
Physical inactivity: A behavioral state of not achieving, on a regular basis, a certain minimal common standard of physical activity.
Physical fitness: An attained set of attributes (i.e., cardiorespiratory endurance; flexibility; body composition; skeletal muscle endurance strength) that relates to the ability to perform physical activity.– Can be precisely measured– Strong inherited / familial component (30-50% of the variation in
cardiorespiratory fitness levels among untrained sedentary individuals can be explained by genetic and shared lifestyle factors)
Intensity of PA
Moderate PA (3-5.9 METS)
Brisk walking (≥3 mph)
Water aerobics
Bicycling (<10 mph)
Tennis (doubles)
Ballroom dancing
General gardening
Vigorous PA (≥6 METS)
Race-walking, jogging, or running
Swimming laps
Tennis (singles)
Aerobic dancing
Bicycling (≥10 mph)
Jumping rope
Heavy gardening
Hiking uphill or with heavy backpack
www.health.gove/paguidelines

3
Are We Meeting PA Goals?2007 Prevalence
"Healthy People 2010" objectives
– Moderate PA at least 5 days a week for 30 min a day
OR
– Vigorous PA at least 3 days a week for 20 min a day
http://apps.nccd.cdc.gov/PASurveillance/StateSumV.asp?Year=2007[3/11/2012 5:45:38 PM]
Prevalence of Physical Inactivity 2008
CDC website, accessed 3/11/2012
Benefits of PA
Focus on
Mortality
CHD / CVD
www.health.gov/paguidelines
4
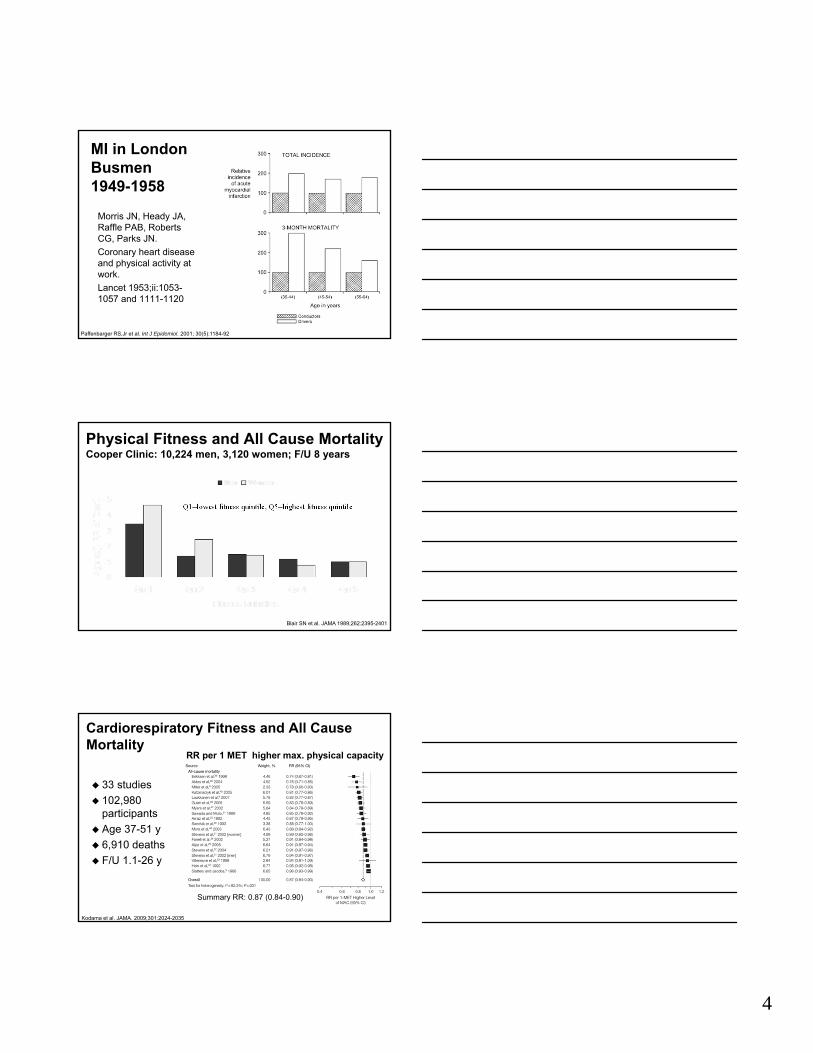
MI in London Busmen 1949-1958
Morris JN, Heady JA, Raffle PAB, Roberts CG, Parks JN.
Coronary heart disease and physical activity at work.
Lancet 1953;ii:1053-1057 and 1111-1120
Paffenbarger RS,Jr et al. Int J Epidemiol. 2001; 30(5):1184-92
Physical Fitness and All Cause MortalityCooper Clinic: 10,224 men, 3,120 women; F/U 8 years
Blair SN et al. JAMA 1989;262:2395-2401
Q1=lowest fitness quintile, Q5=highest fitness quintile
Cardiorespiratory Fitness and All Cause Mortality
33 studies
102,980 participants
Age 37-51 y
6,910 deaths
F/U 1.1-26 y
Kodama et al. JAMA. 2009;301:2024-2035
Summary RR: 0.87 (0.84-0.90)
RR per 1 MET higher max. physical capacity

5
ObeseNormal Weight
Fit vs. Fat: CVD Mortality in the Nurses’ Health Study
Ris
k fo
r D
eath
Hu FB et al. N Engl J Med 2004;351:2694-2703 Slide modified from www.lipids.online.org
1.9
2.5
4.7
1.5
2.1
4.3
1.0
1.6
2.9
Physical Activity(hours/week)
<1.0 1.0–3.4 3.5
Overweight
Walking and CV Events
Hazard Ratio0.69 (0.61-0.77)
Hamer Br J Sports Med 2008;42:238–243
Men
Women
Walking and All Cause Mortality
Hamer Br J Sports Med 2008;42:238–243
Hazard Ratio0.68 (0.59-0.78)
Men
Women

6
Unfit–Fit Fit–FitUnfit–Unfit
Changes in Physical Fitness and CVD Mortality: Aerobic Center Longitudinal Study
Blair SN et al. JAMA 1995;273:1093-1098 (adapted from www.lipidsonline)
Mo
rta
lity
Ra
te
87 deaths in 9,777 men
4.9 years between exams
Fitness at Two Exams
65.0
31.4
14.2
* Lifestyle: achieve/maintain ≥7% reduction of initial body weight via diet + moderate-intensity physical activity (≥150 minutes/week)
DPP: Benefit of Diet & Exercise or Metformin on Diabetes Prevention
DPP Research Group. NEJM 2002;346:393-403
Year
N = 3234 with IFG and IGTwithout diabetes
0
0
10
20
30
40
1 2 3 4
Placebo
Metformin
Lifestyle*Cumulativeincidence of
diabetes(%)
31%
58%
P(vs. placebo)
<0.001
<0.001
Weight DecreaseLoss in Risk0.2 lbs4.6 lbs - 31%12.3 lbs - 58%
Look AHEAD4 Year Results
Weight
Fitness
Look AHEAD Research Group. Arch Intern Med. 2010;170:1566-1575
NIDDK RCT in Type II DM 16 clinical centers N = 5,145
– 1st pt randomized: 8/01– Recruitment complete: 4/04
Compares– Intensive Lifestyle
Intervention (ILI)– Diabetes Support and
Education (DSE) 1o EP: CV Morb & Mort Planned F/U of 13.5 y to
12/31/14

7
2008 PA Guidelines Some PA is better than none
Substantial Health Benefits:– ≥ 150 min (2.5 hrs) a week of moderate-
intensity PA or – ≥ 75 min/week of vigorous-intensity PA or– equivalent combination of moderate and
vigorous aerobic PA– Should be performed in bouts of ≥10 min– Should be spread throughout the week.
Additional Health Benefits:– Increase aerobic PA to 300 min (5 hrs) a
week of moderate-intensity– or 150 min/week of vigorous-intensity
aerobic physical activity– or equivalent combination of moderate-
and vigorous-intensity PA.
Muscle-Strengthening Activities– Moderate or high intensity– Involve all major muscle groups– 2 or more days a week.
What can health care providers do?
National Physical Activity Plan, 2010
Images from Google, downloaded 3/11/2012

9/18/2012
1
Resistant HypertensionRobert A. Vogel, M.D., F.A.C.C.Clinical Professor of Medicine
University of ColoradoDenver, Colorado, USA
Disclosures: None
Definition of Resistant Hypertension
• Blood pressure above goal on:Blood pressure above goal on:• Optimal dose of >3 anti-HTN
drugs of different classes,• Including >1 diuretic
What are the BP Goals?• Most patients: <140/90 (JNC 7, VA-DoD)• Diabetes: <130/80 (JNC 7)
<140/80 (VA DoD)<140/80 (VA-DoD)• CKD: <130/80 (JNC 7)
<140/90 (VA-DoD)• CVD: <130/80 (AHA)

9/18/2012
2
Messerli F et al, JACC (in press)
Metaanalysis of BP Reductions Achieved by Classes of Drug
6
‐4
‐2
0HCTZ ACE‐I ARB BB CCB
mH
g)
‐16
‐14
‐12
‐10
‐8
‐6
SBP
DBP
Cha
nge
BP
(mm
Mean decrease = 12/8
Efficacy of Antihypertensive Therapy
Staessen et al; Lancet, 2000
9/18/2012
3
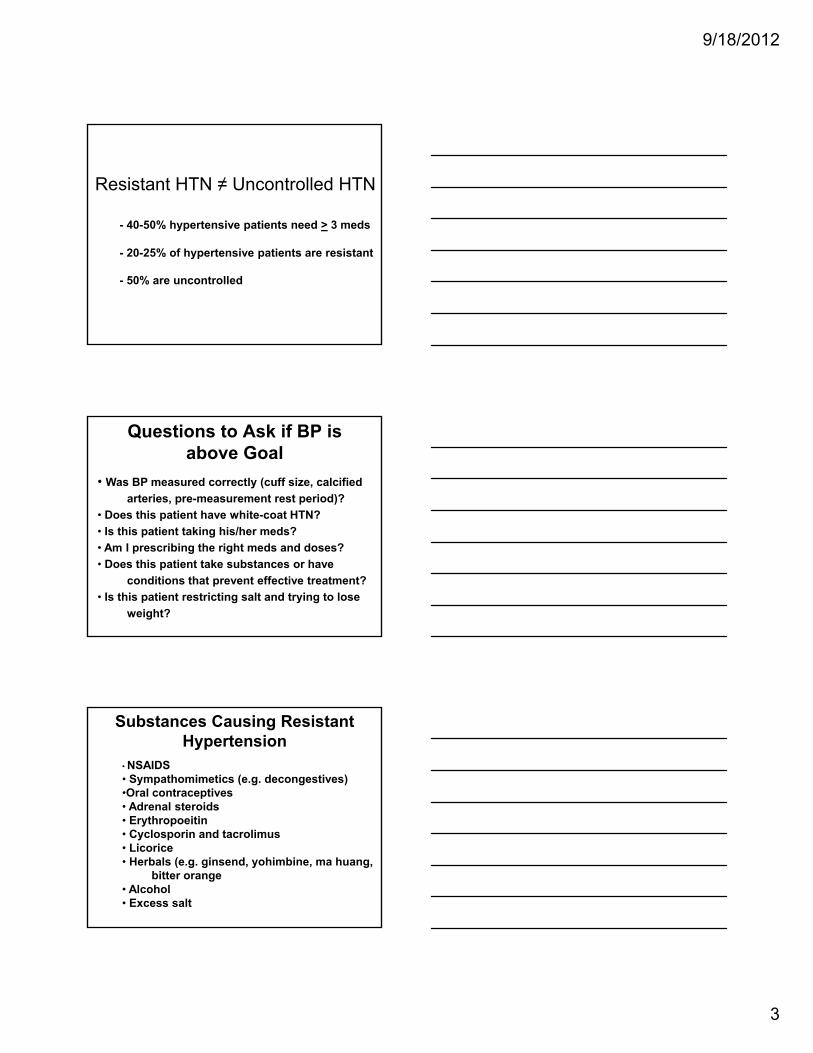
Resistant HTN ≠ Uncontrolled HTN
- 40-50% hypertensive patients need > 3 meds
- 20-25% of hypertensive patients are resistant
- 50% are uncontrolled
Questions to Ask if BP is above Goal
• Was BP measured correctly (cuff size, calcified arteries, pre-measurement rest period)?
• Does this patient have white-coat HTN?• Is this patient taking his/her meds?• Am I prescribing the right meds and doses?• Does this patient take substances or have
conditions that prevent effective treatment?• Is this patient restricting salt and trying to lose
weight?
Substances Causing Resistant Hypertension
• NSAIDS• Sympathomimetics (e.g. decongestives)•Oral contraceptives• Adrenal steroids
E th iti• Erythropoeitin• Cyclosporin and tacrolimus• Licorice• Herbals (e.g. ginsend, yohimbine, ma huang,
bitter orange• Alcohol• Excess salt

9/18/2012
4
Conditions Causing Resistant Hypertension
• Older age• Obesity• DM• OSAOSA• CKD• Renal artery stenosis• Cushing’s syndrome• Primary aldosteronism• Pheochromocytoma• Aortic coarctation
NICE /BHS HTN Guidelines
SBP
Step 1: 140‐160 ACE /ARB (<55y); CCB or Diur (>55y)
St 2 >160 ACE/ARB+CCB CCB+DiStep 2: >160 ACE/ARB+CCB or CCB+Diur
Step 3: ACE/ARB+CCB+Diur
Step 4: add: α‐B, BB, hydral, clon, minox
w/u: HTN, NSAIDS, OSA, renovasc
Third Drug Must be a Diuretic!!!• Expanded blood volume underlies most resistant HTN
• Start with hydrochlorothiazide 25mg
• Change to clorthalidone 25mg (MSBP↓ 5/8 mmHg)*
• Add amiloride 2.5mg (BP↓ 31/15 mmHg, monitor K+)
• Change to a loop diuretic (furosemide→torsemide)
(furosemide BP↓32/11 c/w standard regimen)
• Add spironolactone 12.5-50mg (BP↓ 25/12 mmHg c/w
standard regimen including diuretic)
Calhoun DA et al. Circulation 2008;51:1403 *c/w HCTZ 50mg **HCTZ 25mg

9/18/2012
5
Final Drugs to be Added in Resistant Hypertension
(pt on ACE/ARB + CCB + Diuretic)
• β-Blocker: carvedilol, labetolol, nibevolol• Hydralazine (reflex sympathetic
stimulation)• Clonidine (withdrawal HTN)• α-Blocker (e.g. prazosin, doxazosin
(↑CHF in ALLHAT))• Minoxidil (fluid retention)
Grobbee et al, Br Med J 1986;293:27
Metaanalysis of the Effect of Salt Restriction on Blood Pressure
Appel et al, NEJM 1997
DASH Trial: Effect of Diet on Blood Pressure
Decrease = 7/4 mmHg

9/18/2012
6
Stevens VJ et al, Ann Intern Med 2001;134:1
Weight Loss and BP in 1191 Overweight (110-165% Ideal) Subjects with High Normal BP
Sustained weight loss (4.4kg) = 8/6 mmHg
Renal Artery Denervation
Resistant Hypertension: Diagnosis, Evaluation, and Treatment: A scientific statement from the American Heart Association Professional
AHA Scientific Statement
Circulation 2008 Jun 24;117(25):e510-26.
Education Committee of the Council for High Blood Pressure Research
Calhoun DA, Jones D, Textor S, Goff DC, Murphy TP, Toto RD, White A, Cushman WC, White W, Sica D, Ferdinand K, Giles TD, Falkner B, Carey RM

1
Calcium and Vitamin D Supplements: Friend or Foe to the
HeartVera Bittner, MD, MSPH
Professor of Medicine
Section Head, Preventive Cardiology
University of Alabama at Birmingham
Fourth Annual Contemporary Multi-Disciplinary Cardiovascular Medicine
September 28-30
Disclosures related to this presentation: None
Vitamin D and Calcium Metabolism, Reference Intakes,
Definition of Deficiency

2
Vitamin DStructure
Hollick MF. NEJM 2007;357:266-81and Ann Epidemiol 2009;19:73–78
Vit D3- In milk and OJ
- UV irradiation of 7-dehydrocholesterol from lanolin
Vit D2- Most supplements
- UV irradiation of ergosterol from yeast
Metabolism
25(OH)D = 25-hydroxyvitamin D
1,25(OH)2D = 1,25 dihydroxyvitamin D
LPS = lipopolysaccharide
PTH = parathyroid hormone
TLR = toll like receptor
VDR = vitamin D receptor
Hollick MF. NEJM 2007;357:266-81and Ann Epidemiol 2009;19:73–78
Dietary Reference Intakes for Vit D and Calcium
IOM Report Brief 2010http://www.iom.edu/Reports/2010/Dietary-Reference-Intakes-for-Calcium-and-Vitamin-D/Report-Brief.aspx

3
How Much Dietary* Vit D Do We Get?Data from NHANES 1988-1994
Females
Males
Yetley E Am J Clin Nutr 2008; 88(suppl):558S-64S*Includes supplements; general MVI use in NHANES 99-00:NH White 40% > NH Blacks 23% > Mex Am 20%
Determination of Vitamin D Status 25(OH)D is the major circulating form of Vit D
Half life: 2–3 weeks
25(OH)D = Σ Vit D intake and Vit D produced from sun exposure
25(OH)D is the only Vit D metabolite that is used to determine whether a patient is Vit D deficient, sufficient or intoxicated (no need to differentiate between D2 and D3)
Hollick MF. NEJM 2007;357:266-81 and Ann Epidemiol 2009;19:73–78
How is “Normal” Defined?
Observational data: serum PTH values begin to increase with 25(OH)D concentrations <29.8 ng/ml
Supplementation studies show little decrease in PTH after 25(OH)D is above 20 ng/ml
Holick MF. J ClinEndocrinol Metab 2005;90:210

4
Why Not Measure 1,25(OH)2 Vit D? Short half-life (4-6 hours)
Concentration 1000-fold lower than 25(OH) Vitamin D
Vit D deficiency lower ionized calcium increased PTH 1,25 hydroxylase in kidney is UPREGULATED in Vit D deficiency 1,25(OH)2 measurement may mask Vit D deficiency
Only useful in diagnosing inherited and acquired disorders of Vit D metabolism
Hollick MF. NEJM 2007;357:266-81 and Ann Epidemiol 2009;19:73–78
Prevalence and Common Causes of Low Vit D
Prevalence Estimates of Vit D Deficiency or Insufficiency
1 billion people worldwide
40-100% of elderly US men and women living in the community
>50% of women taking medications for osteoporosis
40-50% adolescents
32% healthy students, attendings, residents in a Boston hospital
70-80% of pregnant women and their infants
93% of ED patients with muscle and bone pain
…
Hollick MF. NEJM 2007;357:266-81
5
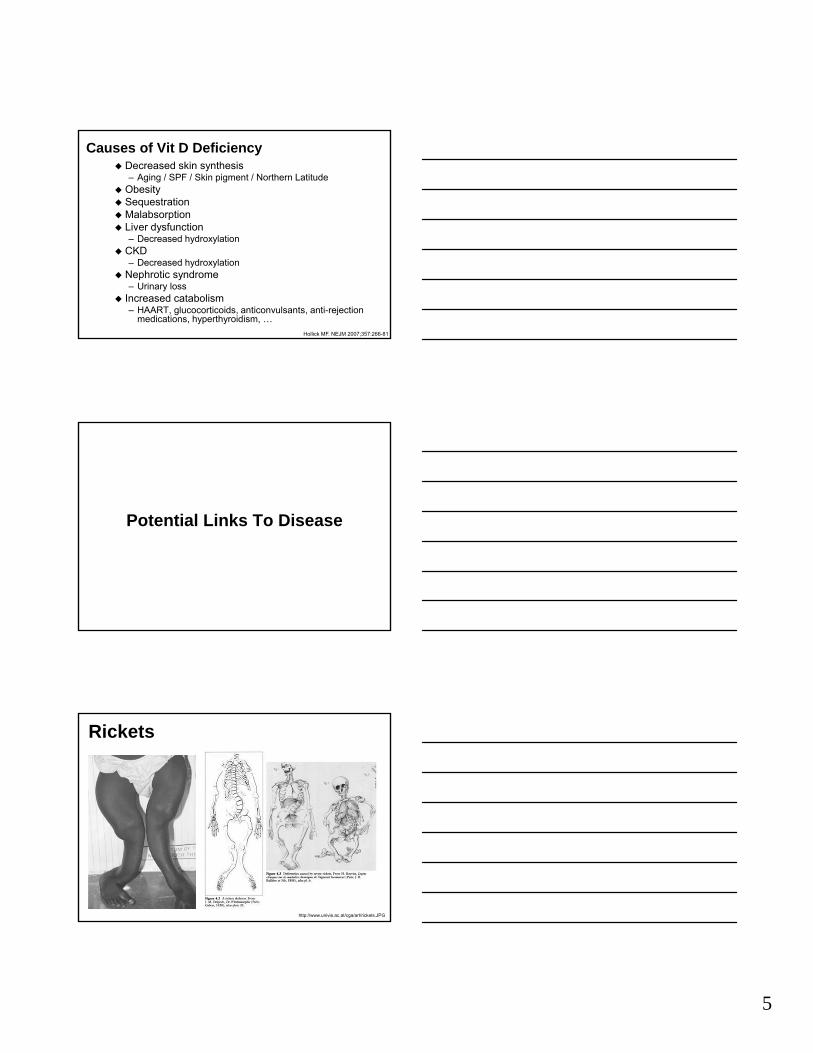
Causes of Vit D Deficiency Decreased skin synthesis
– Aging / SPF / Skin pigment / Northern Latitude Obesity Sequestration Malabsorption Liver dysfunction
– Decreased hydroxylation CKD
– Decreased hydroxylation Nephrotic syndrome
– Urinary loss Increased catabolism
– HAART, glucocorticoids, anticonvulsants, anti-rejection medications, hyperthyroidism, …
Hollick MF. NEJM 2007;357:266-81
Potential Links To Disease
Rickets
http://www.univie.ac.at/cga/art/rickets.JPG

6
Reported Musculoskeletal Benefits of Vit DWHI Ca plus D RCT
– Reduced hip fracture HR 0.71 (0.52-0.97)– BUT: Increased kidney stones HR 1.17 (1.02-0.97)
Swiss Trial of Institutionalized Elderly– Improved muscle strength with supplementation in
122 elderly women (p<0.01)– 49% reduction in falls (p<0.01)
Vit D and Statin Myalgia– Resolution of myalgia in 35/38 vitamin D deficient
patients who received supplements– No control group
Jackson et al. NEJM 2006;354:669-83Bischoff H et al. J Bone Miner Res 2003;18:343–351Ahmed et al. Translational Research 2009;153:11-16
TNT: No Relationship Between Vitamin D and Myalgia
Posthoc Substudy of TNT Trial
N=1,509 CHD patients
Atorva 10 mg vs. Atorva 80 mg daily
Vit D levels at baseline
Median F/U 4.9 years
Bittner V et al. ACC Poster presentation 3/2010, Atlanta, GA
Normal Vit D
Deficient Vit D
P-value
Incidence of myalgia (n,%)
95 (12.2%)
61 (8.3%)
NS
Discontinuation due to myalgia(n,%)
9(1.1%)
10(1.3%)
NS
Baseline Vitamin D and Myalgia
Low 25(OH) Vitamin D has been Linked to Many Non-Skeletal Diseases …
CVD and total mortality
Hypertension
Obesity
Diabetes mellitus
Metabolic syndrome
Multiple sclerosis
Breast, colon, prostate cancer
Immune disorders (Crohn’s, RA, …)
Hollick MF. NEJM 2007;357:266-81

7
Potential Mechanisms: Vit D and CVD Inhibition of vascular smooth muscle
cell proliferation
Suppression of vascular calcification
Downregulation of proinflammatory cytokines
Up-regulation of anti-inflammatory cytokines
Negative endocrine regulator of the renin-angiotensin system
Hollick MF. NEJM 2007;357:266-81
Potential Mechanisms Linking Calcium to CVD
Wang et al Am J Cardiovasc Drugs 2012; doi: 10.2165
Effect on HTN, DM, CACProspective Observational Data

8
Vit D Levels Predict Incident HTN 613 men from the Health Professionals’ Follow-Up Study
1198 women from the Nurses’ Health Study
F/U 4-8 years
Forman et al Hypertension 2007;49:1063-1069
Measured 25(OH)D in ng/ml≥30 15-29 <15
Men
Person-Years 865 1295 122
# of cases 22 33 6
RR (95% CI) 1.0 1.12 (0.51-2.48) 6.13 (1.0-37.8)
Women
Person-Years 2207 2317 335
# of cases 58 60 11
RR (95% CI) 1.0 0.85 (0.53-1.34) 2.67 (1.05-6.79)
Model adjusted for age, BMI, physical activity, race, menopausal status
Vit D, Calcium and Incident DM Nurses Health Study
N = 83,779 women without DM
F/U 20 y – n = 4,843 with incident DM
Multivariate adjusted risks by quartile
Highest vs. lowest Vit D intake (suppl)– Adj. RR 0.87 (0.75–1.00)
Highest vs. lowest calcium intake– Adj. RR 0.82 (0.72–0.92)
<600 mg / <400 IU vs >1200 mg / >800 IU– Adj. RR 0.67 (0.49–0.9)
Pittas et al. Diabetes Care 2006;29:650–656
Vit D Predicts Incident CAC Multi-Ethnic Study of Athero (MESA)
– N = 1,370 (46% men), no CVD
– Mean age: 64 y; F/U 3 years
CAC data:– 53% had CAC at baseline
– 21% developed de novo CAC
25(OH) Vit D concentration:– mean 21.4±11.3 ng/ml
– 27% had level <15 ng/ml
No relation to prevalent CAC
Incident CAC per 10 ng/ml change:– RR (adj.) 1.23 (1.00-1.52), p = 0.049
deBoer et al. JASN 2009;20:1805-812
9
Effects on CV Events and Mortality
Prospective Observational Data
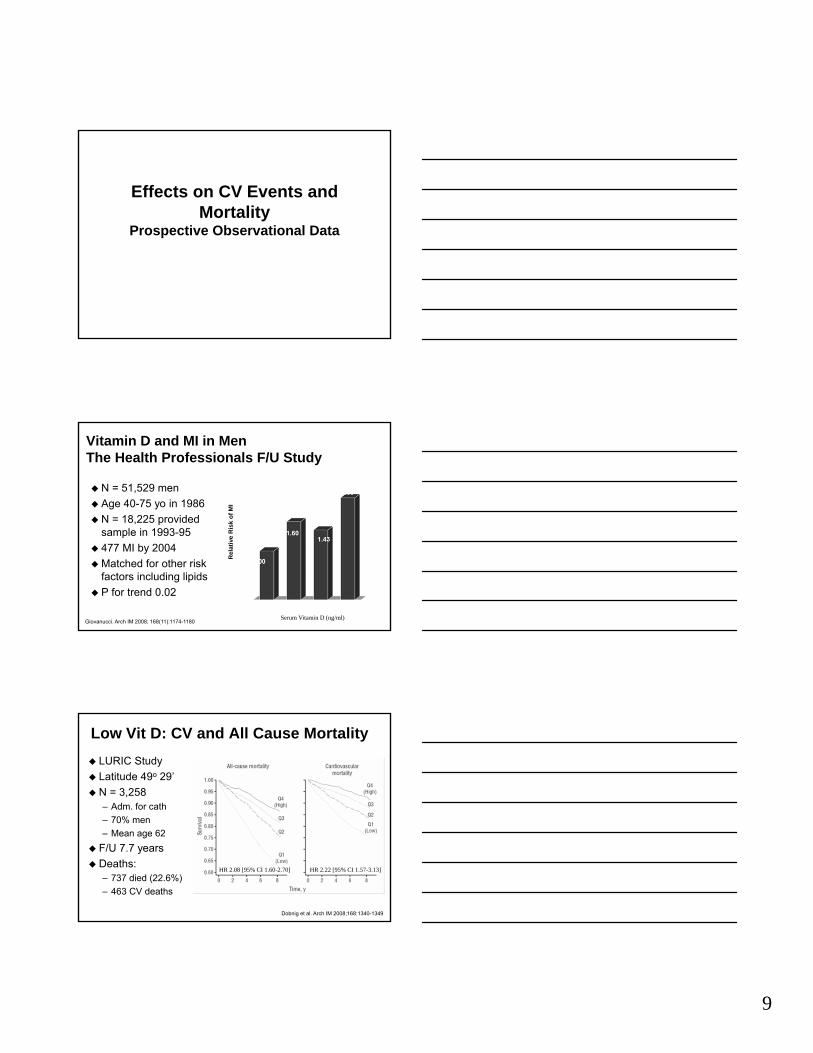
Vitamin D and MI in MenThe Health Professionals F/U Study
N = 51,529 men
Age 40-75 yo in 1986
N = 18,225 provided sample in 1993-95
477 MI by 2004
Matched for other risk factors including lipids
P for trend 0.02
Rel
ativ
e R
isk
of M
I
Serum Vitamin D (ng/ml)Giovanucci. Arch IM 2008; 168(11):1174-1180
Low Vit D: CV and All Cause Mortality LURIC Study
Latitude 49o 29’
N = 3,258– Adm. for cath
– 70% men
– Mean age 62
F/U 7.7 years
Deaths:– 737 died (22.6%)
– 463 CV deaths
Dobnig et al. Arch IM 2008;168:1340-1349
HR 2.08 [95% CI 1.60-2.70] HR 2.22 [95% CI 1.57-3.13]

10
Low Vit D: Increased Mortality NHANES 1988-94
Median F/U 8.7 y
N=13,331
1,806 deaths– CVD 777 (43%)
– Cancer 424 (23%)
Melamed et al. Arch IM 2008;168:1629-1637
Mortality Q4 (>32.1 ng/ml) Q1 (<17.8 ng/ml)All Cause* 1 1.26 (1.08-1.46)
CVD 1 1.20 (0.87-1.64)
Cancer 1 0.91 (0.63-1.31)
Infectious Disease 1 0.84 (0.38-1.86)
TNT: No Relationship Between Vit D and CV Outcomes
Posthoc Substudy
N=1,509 CHD patients
Atorva 10 mg vs. Atorva 80 mg daily
Vit D levels at baseline• Deficient <15 ng/ml
• Insufficient 15-<30 ng/ml
Median F/U 4.9 years
Bittner V et al. AHJ 2012;164:387-93
Dietary CaIntake and CV Risk
Meta-analysis of Prospective Cohort Studies
Wang et al Am J Cardiovasc Drugs 2012; doi: 10.2165
CAD
Stroke

11
How You Get Your Calcium May MatterHeidelberg EPIC Cohort European Prospective
Investigation into Cancer and Nutrition
N = 23,980 Age 35-64 y Free of major CVD events Average F/U 11 years Multivariate Cox regression
models (HR and 95% CI)Supplements
Dairy Calcium
Li et alHeart 2012;98:920-925
Clinical Trials
Meta-Analysis: Vit D Supplementation and Total Mortality
18 RCT; 4,777 deaths; F/U 5.7 years
Autier et al. Arch IM 2007;167:1730-1737

12
WHI RCT: No Decrease in CV Events N = 36,282 PMP
women
Age 50-79 years
Randomized to – Ca 500 mg + D3 200 IU
taken BID
– vs. Placebo BID
F/U 7 years– Poor adherence: 60%
took ≥80% of tabs at end of trial
Some favorable intermediate endpoints– 2.6% lower LDL-C
– 0.3% lower waist and weight (less weight gain)
– BUT: 0.4% higher BP
MI or CHD death– HR 1.04 (95% CI 0.92-1.18)
Stroke– HR 0.95 (95% CI 0.82-1.10)
Hsia et al. Circulation 2007; 115:846-854
Meta-Analysis: Ca Supplementation andCV Events 5 trials with patient level
data, 11 with trial level data– Estimates for CV outcomes
similar
Age >40 y, duration >1 y
Type and dose of Casupplement variable, no Vit D
Median F/U 3.6-4 years
No trials designed specifically for CV endpoints
Bolland et al. BMJ 2010;341:c3691
Why the Discrepancy Between Observational and Interventional Data? Confounding by
healthier lifestyles
Publication bias against negative studies
Over-reliance on 2o rather than 1o prevention
Etiologic period not captured
Insufficient length of intervention and F/U
Inappropriate supplement doses
Unsuitable cohorts for testing the hypothesis
Importance of genotypic differences
Alice H. Lichtenstein, MD
J Lipid Res 2009;50:S429-433

13
My Conclusions Vitamin D deficiency is common Vitamin D intake and calcium intake tend to be
below recommended levels There are many good reasons to treat vitamin D
deficiency or recommend higher calcium intake
BUT
It is unclear whether systematic treatment of vitamin D deficiency will prevent atherosclerosis, cardiovascular events and improve mortality
More studies are needed on the cardiovascular and mortality effects of calcium supplementation opposed to dietary calcium intake
“Hope springs eternal that a single or combination nutrient supplement will be identified to dramatically reduce CVD risk and will require no more dietary restraint or physical exertion than the quick sideward twist of the wrist (open container) and front hand bend (insert pill in mouth).”
Alice H. Lichtenstein, MDJ Lipid Res 2009;50:S429-433

9/18/2012
1
Predicting CVD Risk: Biomarkers vs. Imaging
Robert A Vogel M DRobert A. Vogel, M.D. Clinical Professor of Medicine
University of Colorado
Disclosures: NFL Consultant
Benjamin EJ et al, JACC 2010
ACCF/AHA Guideline for Assessment of Cardiovascular Risk in Asymptomatic Adults
Class I Class llA Class IIB
Risk Score ECG (HTN & DM) Hgb-A1C
F il Hi t Mi lb (HTN & DM) Mi lb ( th )Family History Microalb (HTN & DM) Microalb (others)
CRP (>50/60, LDL<130) CRP (int risk)
CAC (10-20% risk) CAC (6-10% risk)
CIMT (int risk) LpPLA2
ABI (int risk)
Ridker PM et al, N Engl J Med 2002;347:1557
Framingham Estimate vs. Actual CHD Risk in the Women’s Health Study
nts
FRS includes: age, gender, SBP, TC, HDL, DM, smoking
CH
D E
ve
Framingham Estimate of 10-Year Risk
FRS excludes:family historyethnic bkgdobesityinsulin sensregional risk

9/18/2012
2
Leber A et al, Am Heart J 2008;155:154: Ballantyne CM et al. Circulation. 2004;109:837 ; Roman MJ et al, Circulation2004;110:III-798; Folsom AR et al, Arch Intern Med 2008;168:1333; Ridker PM et al, NEJM 2002;347:1557
Discrimination Value of Non-Framingham Risk Factors in Healthy Subjects: Dichotomous Analysis
4
5
6
7
D E
vent
s
Very good
0
1
2
3
4
Lp PLA2
CIMT CRP Fm History
Carotid Plaque
CAC >75%
HR
for C
HD
Good
Poor
Reynolds Risk Index: Which adds more: Family History of CHD or CRP?
55 yo maleRis
k
55 yo male nonsmoker TC 210, HDL 45, SBP 140 7% 11% 8% 14%10
-Yr C
HD
Ridker PM et al, Am J Cardiol 2010;106:204
JUPITER Trial: Decrease in CVE with Rosuvastatin vs. Placebo According to Baseline CRP
0 60.70.80.9
1
suva vs. Pbo
ed
↓60% ↓38% ↓39%
00.10.20.30.40.50.6
CRP <2 CRP 2.0-3.6 CRP 3.6-6.3 CRP >6.3
Relative Risk Ro
s
Unteste

9/18/2012
3
Blankstein R et al, JACC 2011;58:364
MESA Study: CAC Score and CIMT vs. CHD Events in 5627 Asymptomatic Subjects with LDL-C <130
000
Pt Y
ears
CAC Score CIMT
CH
D E
vent
s / 1
Arad Y et al, J Am Coll Cardiol 2005;46:158
St. Francis Heart Study: CHD Events in 4,613 Asymptomatic Subjects 50-70 Years Old by
CAC and Framingham Risk
25%30%35%40%
Agatston Score10
0%5%
10%15%20%25%
<10% 10-20% >20%
01--75>75
CH
D E
vent
s /
Year
s
Framingham 10-Year CHD Risk
Intermediate Risk
12:1 discrimination
Nasir K et al, J Am Coll Cardiol
Ethnic Differences in the 10-Year Prognostic Value of CAC for Death in
14,812 Subjects Referred for Screening
50
600-1011-100101-400
CAC Score
e
an
ic
n
0
10
20
30
40
CAC >100 White AA Hispanic Asian
401-1000>1000
(% Subjects) Relative Risk of Death by CAC Score
Whi
teA
A
His
paAs
ian

9/18/2012
4
Raggi P et al, ATVB 2004;24:1272
MI-free Survival in 495 Subjects on Statins by 2-Year CAC Progression
<15% change
>15% change
Roman MJ et al, Circulation 2004;110:III-798, O’Leary DH et al, NEJM 1999;340:14
CIMT and Carotid Plaque for Assessing CVD Risk in 5858 Subjects >65 Years Old
R fo
r CVD
Adju
sted
HR
Fowkes FG et al, JAMA 2008;300:197
CV Mortality and ABI: Metaanalysis of 16 Studies with 480,00 Person‐year Follow‐up
8
4
CV Mortality vs. ABI
2
1
.5
<0.6 0.6‐.7 0.7‐.8 0.8‐.9 0.9‐1 1‐1.1 1.1‐1.2 1.2‐1.3 1.3‐1.4 >1.4
NEW ABNORMAL RANGE

9/18/2012
5
Gender: MaleFemale
Diabetes: YesNo
Subgroups # Studies Risk RR (95% CI) p
Meta-analysis of Proteinuria and CV Risk in 26 Studies (169,949 Subjects)
Level of Micro*Albumin: Macro**
Adjust: Age, SexMultiple
•30-300 mg/d•>300 Mg/d
Risk Ratio (95% CI)Verdon PV et al, PLoS Med 2008;5:e207
Studies Evaluating Association of Lp-PLA2 with Incident CHD
HR 1 78 tertile 3 vsGeneral populationBallantyne
RR 1.18 per 1 SD ↑WOSCOPS subgroup 580 cases, 1160 controls
Packard et al
Findings*SubjectsStudy
HR 1.23 per 1 SD ↑General population97 cases, 837 controls
Koenig et al
HR 1.97 4th vs 1st quartile
General population418 cases, 1820 controls
Oei et al
HR 1.78 tertile 3 vs. tertile 1
General population608 cases, 740 controls
Ballantyne et al
*Adjusted relative risk (RR) or hazard ratio (HR)
Packard CJ et al. N Engl J Med. 2000;343:1148-55.Ballantyne CM et al. Circulation. 2004;109:837-42.
Koenig W et al. Circulation. 2004;110:1903-8.Oei H-HS et al. Circulation. 2005;111:570-5.
Virani SS et al (ACC 3/11)
Discrimination of Lipid + Other Parameters for Carotid Plaque in 1005 Retired NFL Players
Rat
io 1.5
2
2.5P =NS P <0.05
P = NS
Odd
s R
0
0.5
1
LDL‐C
Non‐HDL‐C
LDL‐P
HDL‐C
HDL‐P CR
P
PLAC2
P = NS

9/18/2012
6
Screening of 55 Former NFL Players
• Age: 53 years
• LDL‐C >160 mg/dl: 5%
• SBP >160 mmHg: 15%
• CAC: >400: 15% >1000: 7%• CAC: >400: 15%, >1000: 7%
• Carotid plaque: 7%
• Dilated aorta: 4%
• Lung mass: 9%
Boone J
Circulating Micro‐RNAs and Risk of MIJ Am Coll Cardiol. 2012;60(4):290‐299. doi:10.1016/j.jacc.2012.03.056
Figure Legend:
FRS + Fm Hx
Low Risk Interm Risk High Risk
1o Prevention Risk Assessment:Summary
Low Risk Interm Risk High RiskCAC ScoreABI (Smoker) ABI (DM)Carotid US

Updates on CVD Prevention Guidelines in Women Laxmi Mehta, MD


1
Cardiac Rehab in 2012
Vera Bittner, MD, MSPH, FACCProfessor of Medicine
Section Head, Preventive CardiologyDivision of Cardiovascular Disease
University of Alabama at Birmingham
Fourth Annual Contemporary Multi-Disciplinary Cardiovascular Medicine
September 28-30
Disclosures related to this presentation: None
Cardiac Rehab:Definition, Components,
Indications

2
“The term cardiac rehabilitation refers to coordinated, multifaceted interventions designed to optimize a cardiac patient’s physical, psychological, and social functioning, in addition to stabilizing, slowing, or even reversing the progression of the underlying atherosclerotic processes, thereby reducing morbidity and mortality.”
Balady et al. Circulation 2000;102:1069 –1073
What Is Cardiac Rehabilitation?
AHA/AACVPR Scientific Statement 2007: Core Components of CR
Patient assessment and treatment plan
Nutritional Counseling and Weight Management
Blood Pressure Management
Lipid Management
Diabetes Management
Tobacco Cessation
Psychosocial Management
Physical Activity Counseling Exercise Training
Balady et al. Circulation 2007;115:2675-2682
Referral to CR is a Class I Recommendation in AHA/ACC Guidelines
STEMI Guideline
CABG Guideline
PCI Guideline
Secondary Prevention Guideline
Women and CVD Guideline
UA/NSTEMI Guideline
…

3
CMS has expanded CR Eligibility*Before 2006Eligible
S/P MI
S/P CABG
Stable Angina
Not Eligible
S/P PTCA
Heart Failure
S/P Cardiac Tx
Since 2006Eligible
S/P MI / ACS
S/P CABG
S/P PCI
Stable Angina
S/P Valve Surgery
S/P Cardiac Tx
Not Eligible
Heart Failure*As defined by CMS
Outcome Domains in CRAACVPR Consensus Statement 2004
Behavioral– Physical activity, diet habits, smoking, stress
management techniques
Clinical– Functional capacity, lipid levels, blood pressure,
hemoglobin A1C, BMI, depression screen
Health– Morbidity and mortality– “Patient centered”: health status, health-related QOL
Service– Utilization rates, costs, patient and staff satisfaction
Sanderson et al. JCRP 2004;24:68-79
Cardiac Rehab: Morbidity and Mortality

4
Cochrane Review of RCTsMeta-analysis of RCT’s with >6 m F/U
– Before 1990: 40% / 1990’s: 43% / Since 2000: 17% N = 8,940 patients in 48 trials
– Age range 48-71 years (median 55 years)– 20% women, few minorities– Patients generally “low risk”
Taylor et al. Am J Med. 2004;116:682– 692
OR 95% CI P-valueTotal mortality 0.80 0.68 – 0.93 0.005
Cardiac mortality 0.74 0.61 – 0.96 0.002
Non-fatal MI 0.79 0.59 – 1.09 0.15
CABG 0.87 0.65 – 1.06 0.3
PCI 0.81 0.49 – 1.34 0.4
Cochrane Review of RCTs: Update 2011Meta-analysis of RCT’s with >6 m F/U N = 10,794 patients in 47 trials
– Age range 46-84 years; generally “low risk”– 20% women, few minorities– Considerable loss to F/U or drop out (33/47 studies had
>80% F/U) F/U time is important:
Heran BS et al. Cochrane Library 2011, Issue 8
RR6-12 m
95% CI RR>12 m
95% CI
Total mortality 0.82 0.67 – 1.01 0.87 0.75 – 0.99
CV mortality 0.93 0.71 – 1.21 0.74 0.63 – 0.87
Hospital Admission
0.69 0.51 – 0.93 0.69 0.87 – 1.11
CR Prevents MIMeta-analysis of 63 Secondary Prevention RCT’s Results comparable in different settings
– Group vs individual– Comprehensive CR– Exercise only– Risk factor counseling / education without exercise
Clark et al. Ann Int Med 2005;143:659-672
OR 95% CI
Total mortality 0.85 0.77 – 0.94
Myocardial infarction 0.83 0.74 – 0.94

5
Are Prior Clinical Trial Data Applicable? Different demographics
– Older, women, minorities
Different acute MI treatment– Revascularization / lytics
More NSTEMI than STEMI
Different “secondary prevention” medications– ASA, Plavix, BB, ACE-I, statin
Shorter time from event to enrollment
Worse LV function
More co-morbidities– DM, obesity, CKD, arthritis, ….
CR Outcomes: Observational Data
Trials not ethical– Few subgroups with “equipoise” (e.g. HF ACTION)
Observational data = real life data
Can be continuously monitored
BUT
Data subject to bias and confounding
Methods to overcome these:– Propensity matching
– Multivariable regression modeling
– Use of instrumental variables
CR Use and Mortality N = 601,099 Medicare Beneficiaries
Propensity matched mortality analysis (70,040 matched pairs)
F/U for mortality 1-5 years
12% participated
24 ± 12.4 sessions
Use vs Non-use:
5 y RRR -34%
More vs less:
5 y RRR -19%
Suaya JA et al. JACC 2009;54:25–33

6
Dose Matters Sample of Medicare
Claims Data 2000-2005
All patients who attended at least 1 CR session– Mean age 74, 64% men,
95% white
– 61% post CABG, 21% post MI, 15% stable angina
Outcomes: Death; MI– Analyses adjusted for
demographics and co-morbidities
Hammill et al. Circ 2010;121:63-70
Mortality
1-11
12-23
36+
Mortality by Propensity to Participate in CRData from Olmsted County
-78%
-72%-67% -63%
Population attributable risk = proportion of deaths attributable to non-participation in CRQuartile 1- 0.29 / Quartile 2 - 0.28 / Quartile 3 - 0.17 / Quartile 4 - 0.17
Witt et al. JACC 2004;44:988-996
CR and the Decline in CHD Mortality: USA 1980 - 2000
US Adults age 25-84 years 341,745 fewer CHD deaths in 2000 than in 1980
– >50% decline in age-adjusted death rates for men and women
47% of decrease attributed to treatments, 44% to decline in risk factors
Estimated Impact of CR:– 4,650 fewer deaths after MI in 2000 (participation rate 21%)– 1,655 fewer deaths after CABG or PCI in 2000 (participation
rate 32%)– Risk reduction comparable to post-event ASA, BB, ACE-I,
statin, warfarin– Risk reduction comparable to acute thrombolysis and
revascularization
Ford ES et al. NEJM 2007;356:2388-98

7
CR UtilizationReferral Enrollment Adherence
Low Referral Rates in GWTG Hospitals 72,817 CR-eligible patients discharged between 1/00 and 9/07
Overall referral rate: 56%
Wide variation between hospitals -<20% referral rate in >1/3 hospitals
CR utilization is much lower than other 2o prevention measures
Referral Rates by Hospital
Brown TM et al. JACC 2009;54:515-521
Low Enrollment in Medicare Patients N=267,427 Medicare patients
– S/P MI or CABG 1997– Survived ≥30 days post D/C
Negative predictors of CR:– Older age– Women– Nonwhites– Co-morbidities (incl. HF,
previous stroke, DM, cancer)
Positive predictors of CR:– CABG– Higher household income– Higher level of education– Shorter distance to the
nearest CR facility 9-fold variation among States
– Idaho 6.6% Nebraska 53.5%– Average 18.7%Suaya et al. Circulation 2007;116 – www.americanheart.org
Overall CR use– S/P MI: 13.9% / S/P CABG: 31%
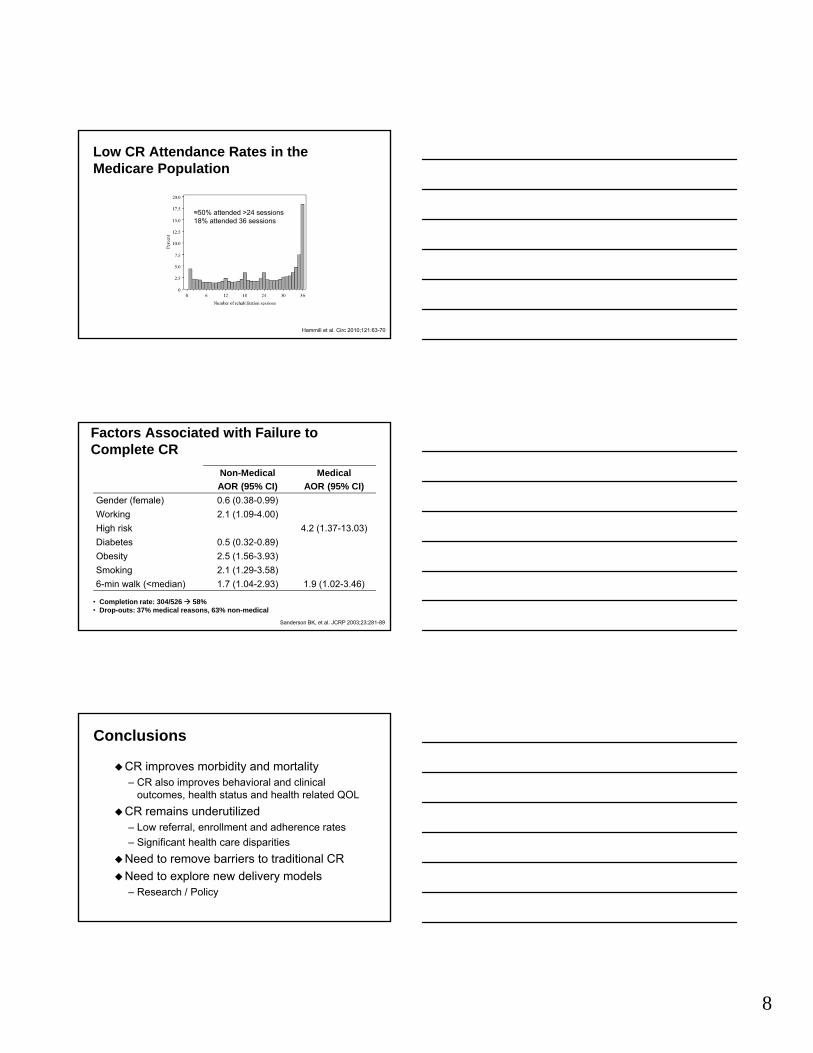
8
Low CR Attendance Rates in the Medicare Population
≈50% attended >24 sessions18% attended 36 sessions
Hammill et al. Circ 2010;121:63-70
Factors Associated with Failure to Complete CR
Non-MedicalAOR (95% CI)
MedicalAOR (95% CI)
Gender (female) 0.6 (0.38-0.99)
Working 2.1 (1.09-4.00)
High risk 4.2 (1.37-13.03)
Diabetes 0.5 (0.32-0.89)
Obesity 2.5 (1.56-3.93)
Smoking 2.1 (1.29-3.58)
6-min walk (<median) 1.7 (1.04-2.93) 1.9 (1.02-3.46)
Sanderson BK, et al. JCRP 2003;23:281-89
• Completion rate: 304/526 58%• Drop-outs: 37% medical reasons, 63% non-medical
Conclusions
CR improves morbidity and mortality– CR also improves behavioral and clinical
outcomes, health status and health related QOL
CR remains underutilized– Low referral, enrollment and adherence rates
– Significant health care disparities
Need to remove barriers to traditional CR
Need to explore new delivery models– Research / Policy

9
Circulation 2011;124:2951-60
Circulation2012;125:1321-1329

NOTES—